Delineation and Comparison of Urban Heat Islands in Tamilnadu
72
V.Dhivya Lakshmi (BTG-12-006) P.R.Selva Akshaya (BTG-12-029) S.Vignesh (BTG-12-037) D.Vishnu Ram (BTG-12-040) PROJECT GUIDE: Dr. Balaji Kannan, Asst.Prof (RS & GIS) DELINEATION AND COMPARISON OF URBAN HEAT ISLANDS IN TAMILNADU
-
Upload
vignesh-sekaran -
Category
Engineering
-
view
193 -
download
3
Transcript of Delineation and Comparison of Urban Heat Islands in Tamilnadu

V.Dhivya Lakshmi (BTG-12-006)P.R.Selva Akshaya (BTG-12-029)
S.Vignesh (BTG-12-037)D.Vishnu Ram (BTG-12-040)
PROJECT GUIDE: Dr. Balaji Kannan, Asst.Prof (RS & GIS)
DELINEATION AND COMPARISON OF URBAN HEAT ISLANDS IN
TAMILNADU

DELINEATION AND COMPARISON OF URBAN HEAT ISLANDS IN TAMILNADU
• Introduction – Urban Heat Islands & It’s Effects
• Project Objective
• Project Description
• Selection of a relevant & suitable satellite and timeline
• Project Process Chart
• Data Acquisition
• Methodology
• Results & Discussion
• Conclusion and Recommendations.


INTRODUCTION URBAN HEAT ISLANDS & IT’S EFFECTS
• An urban heat island is a city or metropolitan area that is significantly warmer than its surrounded rural areas due to human activities.
• Whereas, the term heat island refers to any area, populated or not, which is consistently hotter than the surrounding area.

INCREASED TEMPERATURE IN URBAN AREA
SOURCE - OKE, T.R. 1997. URBAN CLIMATES AND GLOBAL ENVIRONMENTAL CHANGE

SOURCE - OKE, T.R. 1997. URBAN CLIMATES AND GLOBAL ENVIRONMENTAL CHANGE

PROJECT OBJECTIVE
• Conversion of thermal band data of LANDSAT 5 & 8 (Satellites) into Temperature contours in order to isolate and compare the Urban Heat Islands (UHI) of Tamil Nadu over a decade (i.e., 2005 & 2015) and over the different seasons of an year (2014
• Identification of the factors responsible for UHI formation with reference to Land use
• Intensity of the UHI formed
• Suggestion of Mitigation Measures

PROJECT DESCRIPTION
• The thermal band data for Tamil Nadu covered by 11 tiles constituting the paths 142,143,144 and rows 51,52,53,54 are obtained from USGS (United States Geological Survey) website. These 11 tiles are to be integrated into a single image by mosaicing (Mosaicking) it using ArcGIS 10.1. These data acquired from satellite Landsat 5&8 stores the reflectance value as Digital Number (DN) in each pixel of the image. The DN images are to be converted into Top of Atmosphere radiance, which in turn is converted into Land Surface Temperature. Temperature contours are drawn for the obtained Land surface temperatures, the contours are classified for isolation of UHI.

• Selection of a relevant and suitable satellite and Timeline for delineation of UHI
Satellite Landsat 1 Landsat 2 Landsat 3 Landsat 4 Landsat 5 Landsat 6 Landsat 7 Landsat 8
Duration
2 years, 11 months and 15 days
2 years, 10 months and 17 days
5 years and 26 days
11 years, 4 months and 28 days
29 years, 3 months and 4 days 0 days
16 years, 1 month and 4 days
2 years, 3 months and 8 days
2015 jan landsat 6 Landsat 7 Landsat 82014 failed to reach orbit Landsat 7 Landsat 82013 5-Jun failed to reach orbit Landsat 7 11-Feb->13-Apr2012 Landsat 5 failed to reach orbit Landsat 72011 Landsat 5 failed to reach orbit Landsat 72010 Landsat 5 failed to reach orbit Landsat 72009 Landsat 5 failed to reach orbit Landsat 72008 Landsat 5 failed to reach orbit Landsat 72007 Landsat 5 failed to reach orbit Landsat 72006 Landsat 5 failed to reach orbit Landsat 72005 Landsat 5 failed to reach orbit Landsat 72004 Landsat 5 failed to reach orbit Landsat 72003 Landsat 5 failed to reach orbit Landsat 72002 Landsat 5 failed to reach orbit Landsat 72001 Landsat 5 failed to reach orbit Landsat 72000 Landsat 5 failed to reach orbit Landsat 71999 Landsat 5 failed to reach orbit 15-Apr-> 12-Aug1998 Landsat 5 failed to reach orbit1997 Landsat 5 failed to reach orbit1996 Landsat 5 failed to reach orbit1995 Landsat 5 failed to reach orbit1994 Landsat 5 landsat 61993 14-Dec Landsat 5 5-Oct1992 Landsat 4 Landsat 51991 Landsat 4 Landsat 51990 Landsat 4 Landsat 51989 Landsat 4 Landsat 51988 Landsat 4 Landsat 51987 Landsat 4 Landsat 51986 Landsat 4 Landsat 51985 Landsat 4 Landsat 51984 Landsat 4 1-Mar1983 31-Mar Landsat 41982 25-Feb Landsat 3 16-Jul1981 Landsat 2 Landsat 31980 Landsat 2 Landsat 31979 Landsat 2 Landsat 31978 6-Jan Landsat 2 5-Mar1977 Landsat 1 Landsat 21976 Landsat 1 Landsat 21975 Landsat 1 22-Jan1974 Landsat 11973 Landsat 11972 23-Jul
Path no.Row no. 51 52 53 54 51 52 53 54 51 52 53 54
SEP 7 5 5 5 5
SEP 14 5 5 5
SEP 16 5 5 5 5
JAN 19 8 8 8
JAN 26 8 8 8
JAN 28 8 8 8 8
APR 16 8 8 8
APR 18 8 8 8 8
APR 25 8 8 8 8
JUL 21 8 8 8
JUL 23 8 8 8 8
JUL 30 8 8 8 8
OCT 2 8 8 8 8
OCT 9 8 8 8 8
OCT 27 8 8 8 8
JAN 22 8 8 8 8
JAN 29 8 8 8
JAN 31 8 8 8 8
144 143 142
2014
2015
2005
SET Satellite Month Date Year
1
2
3
4
5
6
LAN
DSAT
5LA
NDS
AT 8
Data Selection

PROJECT PROCESS CHART
DATA AQUISITION
• The thermal band data for Tamil Nadu covered by 11 tiles constituting the paths 142,143,144 and rows 51,52,53,54 are obtained from USGS (United States Geological Survey) website
MOSAICING
• These 11 tiles were integrated into a single image by mosaicing (Mosaicking) it using ArcGIS 10.1
DN to TAR• The Digital Number images were converted into Top of Atmosphere Radiance
TAR TO SURFACE
TEMP
• TAR was converted into Land Surface Temperature
CONTOUR MAKING
• Temperature contours were drawn for the obtained Land surface Temperature values
UHI ISOLATION
• UHIs were isolated using the contours
CAUSES & REMEDIATIO
N
• The causes for the formation of UHIs were identified

DATA ACQUISITIONDATA COLLECTION – FROM WEBSITES
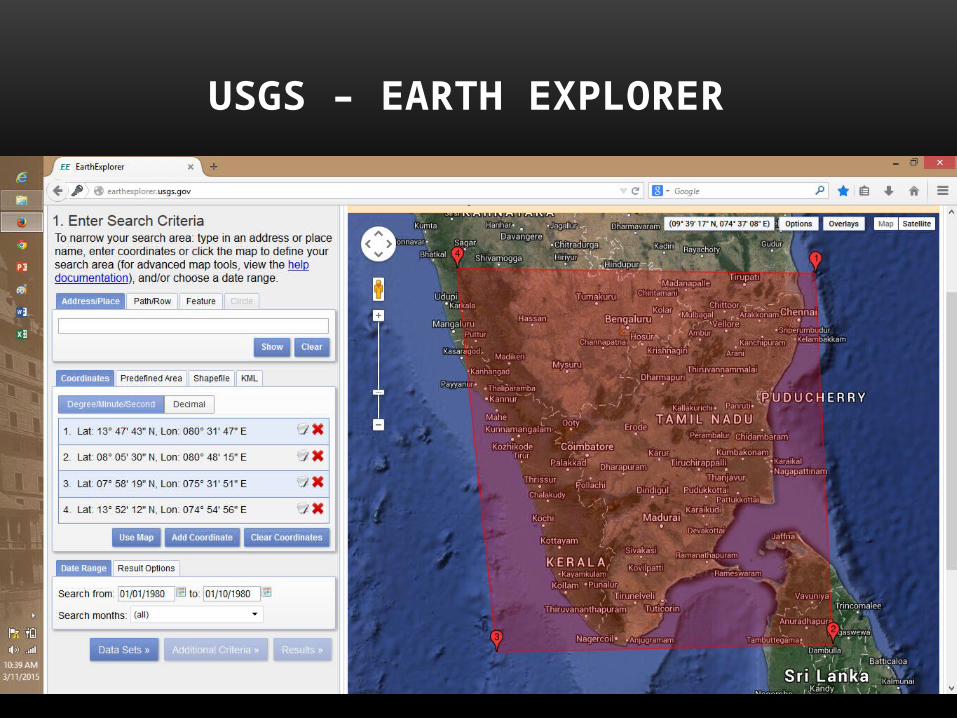
USGS – EARTH EXPLORER

TAMIL NADU

TILES TO BE CONCENTRATED FOR TAMIL NADU

TILES TO BE CONCENTRATED FOR TAMIL NADU

3 PATHS & 4 ROWS(I.E.) 4 ROWS , 3 COLUMNS

FILE NAME DESCRIPTION
• LE71430522000325SGS01• LE7 143 052 2000 325 SGS01
• The file name , most significant feature gives information like, the image was taken from LANDSAT 7 satellite, it belongs to the row 143 & path 52 and the date of acquisition was 20th November 2000 and the ground station is SGS01, located near china.
LANDSAT 7 ‘S SATTELLITE DATA
PATH NUMBER
ROW NUMBER
SATTELLITE IMAGE ACQUISITION DATE
DAY OF THE YEAR
GROUND STATION
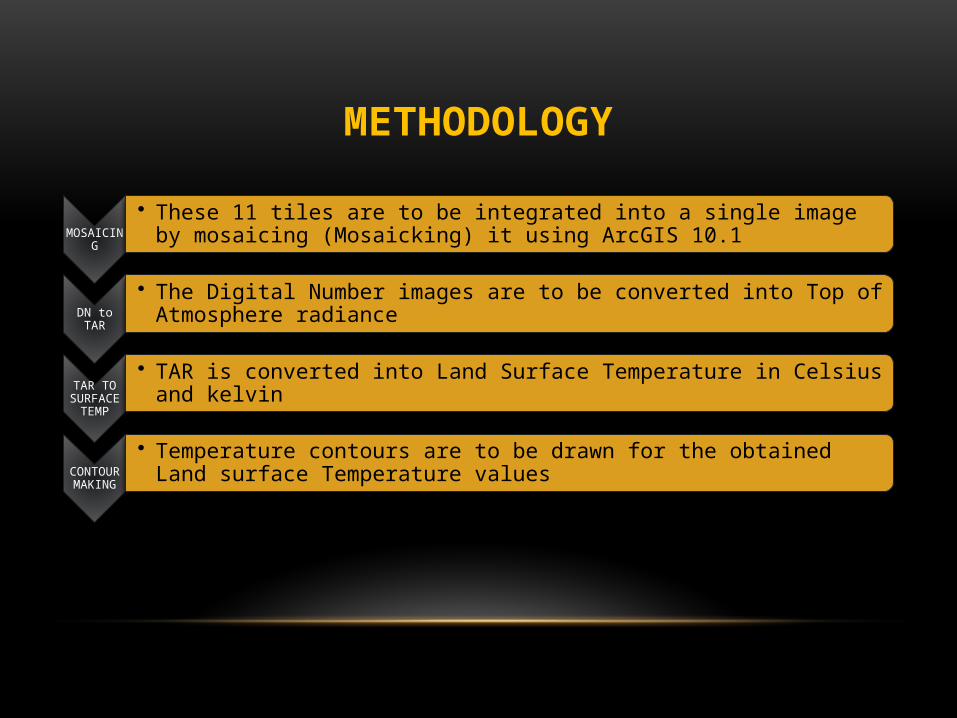
METHODOLOGY
MOSAICING
• These 11 tiles are to be integrated into a single image by mosaicing (Mosaicking) it using ArcGIS 10.1
DN to TAR• The Digital Number images are to be converted into Top of Atmosphere radiance
TAR TO SURFACE
TEMP
• TAR is converted into Land Surface Temperature in Celsius and kelvin
CONTOUR MAKING
• Temperature contours are to be drawn for the obtained Land surface Temperature values

MOSAICED DATASET
LANDSAT 8-B10 JULY 2014LANDSAT 5-SEP 2005
LANDSAT 8-B11 JULY 2014
Similarly, We mosaicked datasets of :
LANDSAT 8-BAND10 & BAND11 JAN 2014LANDSAT 8-BAND10 & BAND11 APR 2014LANDSAT 8-BAND10 & BAND11 OCT 2014LANDSAT 8-BAND10 & BAND11 JAN 2015

DIGITAL NUMBER TO TOP ATMOSPHERIC RADIANCE
• Digital Numbers ranging from 0-255 (in case of landsat-5) Or 0-65535 (in case of landsat-8) are converted into Absolute Radiance(Top of Atmosphere Radiance) (W/m2)
i. Gain & Bias Method
ii. Spectral Radiance Scaling Method

DIGITAL NUMBER

The formulae to convert DN to radiance 1. Gain & Bias Method• CV R1 =gain * DN + bias
2. Spectral Radiance Scaling Method • CVRI =((LMAXλ -LMIN λ)/(QCALMAX-QCALMIN))*(QCAL-QCALMIN)+LMIN λ
• We found Second method more accurate than the first one, thus we followed the second one,
CVR1 is the cell value as radiance QCAL = digital number LMINλ = spectral radiance scales to QCALMIN
LMAXλ = spectral radiance scales to QCALMAX QCALMIN = the minimum quantized calibrated pixel value QCALMAX = the maximum quantized calibrated pixel value

TOP ATMOSPHERIC RADIANCE IS CONVERTED INTO LAND SURFACE TEMPERATURE
T• T Temperature in degree Kelvin
• CVR1 is cell value as radiance
• ε is Emissivity (taking atmospheric emissivity as 0.95)
• K1 & K2 Values are taken from meta data file(USGS)
Kelvin Image will be converted into Celsius image (K-273),οC
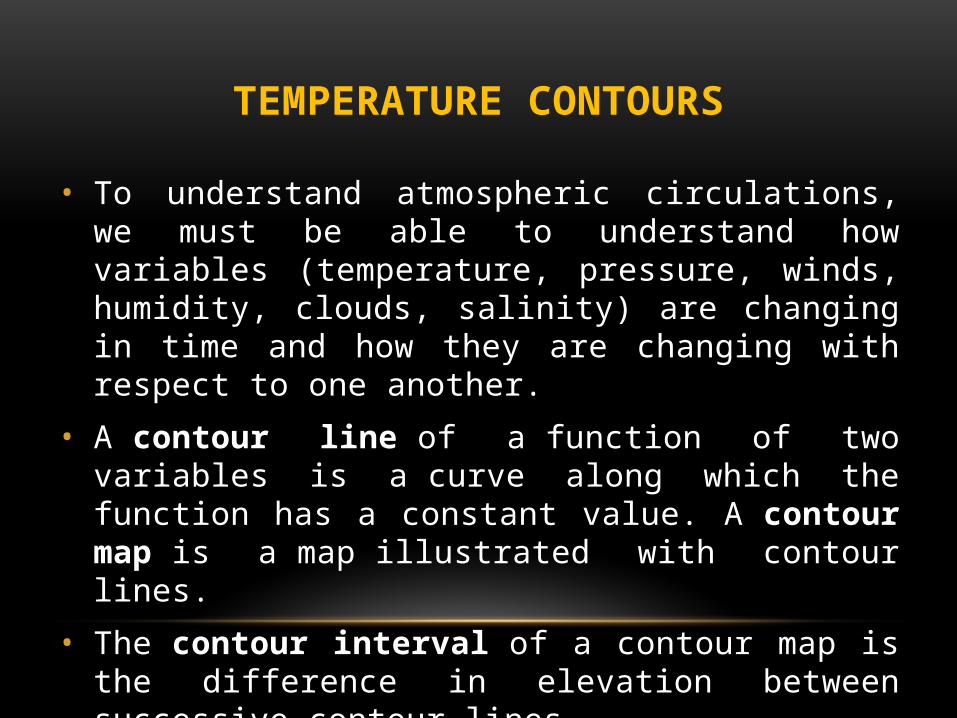
TEMPERATURE CONTOURS
• To understand atmospheric circulations, we must be able to understand how variables (temperature, pressure, winds, humidity, clouds, salinity) are changing in time and how they are changing with respect to one another.
• A contour line of a function of two variables is a curve along which the function has a constant value. A contour map is a map illustrated with contour lines.
• The contour interval of a contour map is the difference in elevation between successive contour lines.
• We took 10˚C interval contour for the study.

Mosaic Radiation kelvin Celcius Positive ContourSEPTEMBER 2005 DATA

MOSAIC RADIATION KELVIN CELCIUS POSITIVE CONTOUR
OCTOBER 2014 DATA ( BAND10)
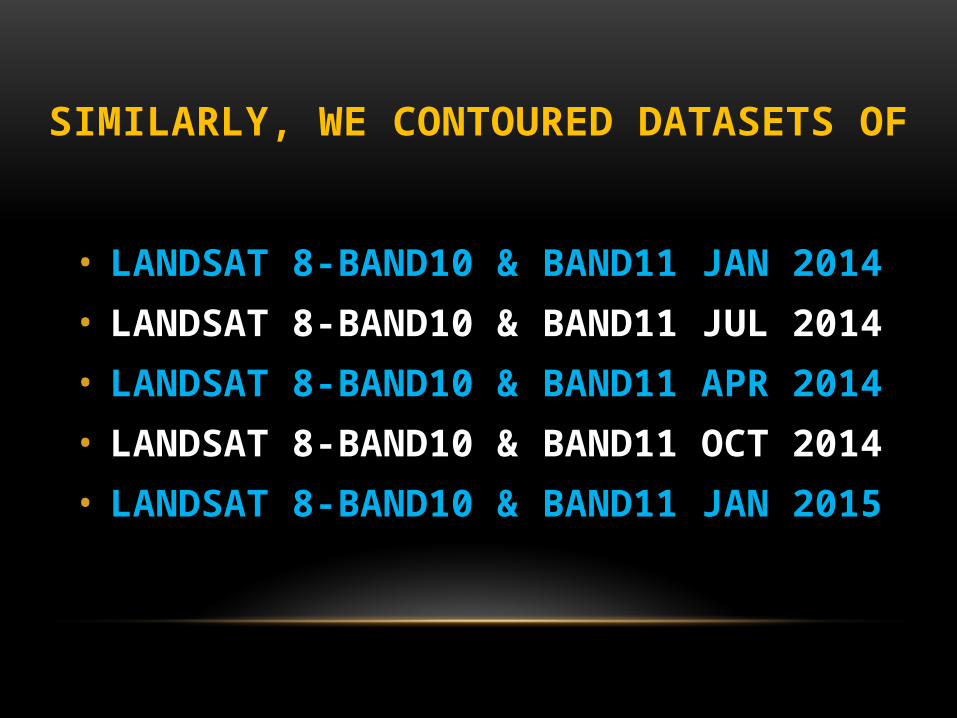
SIMILARLY, WE CONTOURED DATASETS OF
• LANDSAT 8-BAND10 & BAND11 JAN 2014• LANDSAT 8-BAND10 & BAND11 JUL 2014• LANDSAT 8-BAND10 & BAND11 APR 2014• LANDSAT 8-BAND10 & BAND11 OCT 2014• LANDSAT 8-BAND10 & BAND11 JAN 2015

2014 JAN

2014 APR

2014 JULY

2015 JAN

RESULTS & FINDINGS

COMPUTATION OF ZONAL STATISTICS-Jan 2015
1
Demog
raphic
Correla
tion

1
Demog
raphic
Correla
tion
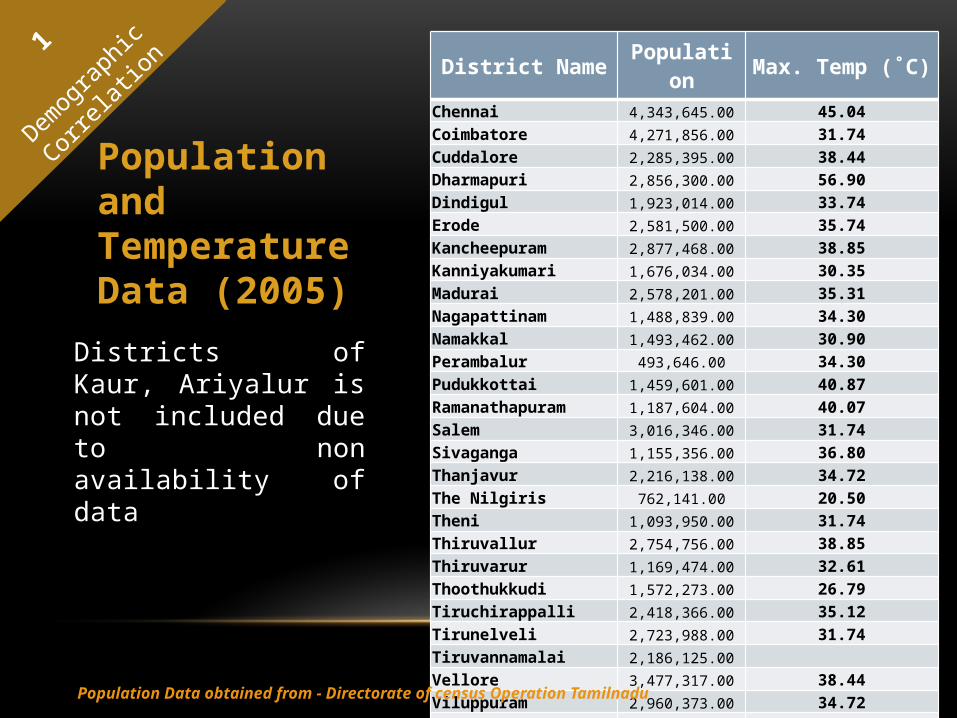
District Name Population Max. Temp (˚C)
Chennai 4,343,645.00 45.04Coimbatore 4,271,856.00 31.74Cuddalore 2,285,395.00 38.44Dharmapuri 2,856,300.00 56.90Dindigul 1,923,014.00 33.74Erode 2,581,500.00 35.74Kancheepuram 2,877,468.00 38.85Kanniyakumari 1,676,034.00 30.35Madurai 2,578,201.00 35.31Nagapattinam 1,488,839.00 34.30Namakkal 1,493,462.00 30.90Perambalur 493,646.00 34.30Pudukkottai 1,459,601.00 40.87Ramanathapuram 1,187,604.00 40.07Salem 3,016,346.00 31.74Sivaganga 1,155,356.00 36.80Thanjavur 2,216,138.00 34.72The Nilgiris 762,141.00 20.50Theni 1,093,950.00 31.74Thiruvallur 2,754,756.00 38.85Thiruvarur 1,169,474.00 32.61Thoothukkudi 1,572,273.00 26.79Tiruchirappalli 2,418,366.00 35.12Tirunelveli 2,723,988.00 31.74Tiruvannamalai 2,186,125.00Vellore 3,477,317.00 38.44Viluppuram 2,960,373.00 34.72Virudhunagar 1,751,301.00 38.44
Population Data obtained from - Directorate of census Operation Tamilnadu
Population and Temperature Data (2005)
Districts of Kaur, Ariyalur is not included due to non availability of data
1
Demog
raphic
Correla
tion

TEMPERATURE & POPULATION OF 2005
Chenn
ai
Cudda
lore
Dindigu
l
Kanch
eepu
ram
Madura
i
Namak
kal
Puduk
kotta
iSale
m
Thanja
vur
Theni
Thiruv
arur
Tiruch
irapp
alli
Tirupp
ur
Vellore
Virudh
unag
ar0.00
10.00
20.00
30.00
40.00
50.00
60.00
0.00
500,000.00
1,000,000.00
1,500,000.00
2,000,000.00
2,500,000.00
3,000,000.00
3,500,000.00
4,000,000.00
4,500,000.00
5,000,000.00
Districts
Tem
pera
ture
Popu
latio
n
1
Demog
raphic
Correla
tion
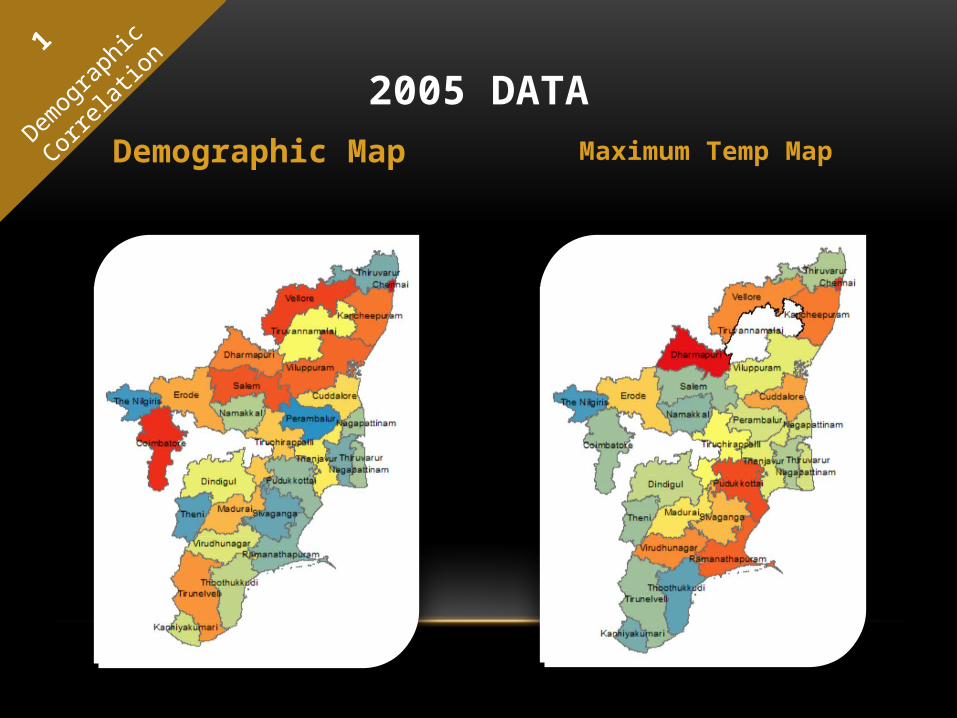
2005 DATADemographic Map Maximum Temp Map
1
Demog
raphic
Correla
tion

Population and Temperature Data (2015)
Districts of Kaur, Ariyalur is not included due to non availability of data
District Name Population Max. Temp
(˚C)Chennai 4,681,087.00 36.35Coimbatore 3,472,578.00 40.64Cuddalore 2,600,880.00 38.22Dharmapuri 3386631.00 40.37Dindigul 2,161,367.00 41.27Erode 2,259,608.00 39.40Kancheepuram 3,990,897.00 42.08Kanniyakumari 1,863,174.00 40.72Madurai 3,041,038.00 43.24Nagapattinam 1,614,069.00 32.42Namakkal 1,721,179.00 43.80Perambalur 564,511.00 38.68Pudukkottai 1,618,725.00 37.14Ramanathapuram 1,337,560.00 38.42Salem 3,480,008.00 45.81Sivaganga 1,341,250.00 38.63Thanjavur 2,402,781.00 37.29The Nilgiris 735,071.00 39.97Theni 1,243,684.00 41.64Thiruvallur 3,725,697.00 39.11Thiruvarur 1,268,094.00 31.29Thoothukkudi 1,738,376.00 39.70Tiruchirappalli 2,713,858.00 53.93Tirunelveli 3,072,880.00 42.04Tiruppur 2,471,222.00 40.28Tiruvannamalai 2,468,965.00 39.11Vellore 3,928,106.00 39.53Viluppuram 3,463,284.00 38.96Virudhunagar 1,943,309.00 43.02
Population Data obtained from - Directorate of census Operation Tamilnadu
1
Demog
raphic
Correla
tion

2015 DATADemographic Map Max. Temp Map
1
Demog
raphic
Correla
tion

TEMPERATURE & POPULATION OF 2015
Chenn
ai
Cudda
lore
Dindigu
l
Kanch
eepu
ram
Madura
i
Namak
kal
Puduk
kotta
iSale
m
Thanja
vur
Theni
Thiruv
arur
Tiruch
irapp
alli
Tirupp
ur
Vellore
Virudh
unag
ar0.00
10.00
20.00
30.00
40.00
50.00
60.00
0.00
500,000.00
1,000,000.00
1,500,000.00
2,000,000.00
2,500,000.00
3,000,000.00
3,500,000.00
4,000,000.00
4,500,000.00
5,000,000.00
Temperature Population
Districts
Tem
pera
ture
Popu
latio
n
1
Demog
raphic
Correla
tion

RESULTS AND DISCUSSION:
• The correlations are very less, which are indicative that the Population rise influences the temperature at a very lesser rate.
• There may be two Reasons for this Result
1) The data obtained from the satellite may contain little variations
2) The influence of other factors like Land use/Land cover , Reduced spacing of buildings etc.., could have dominated over the population rise factor.
• The factor of Landuse and Landcover is to be used as a factor for further studies.
1
Demog
raphic
Correla
tion

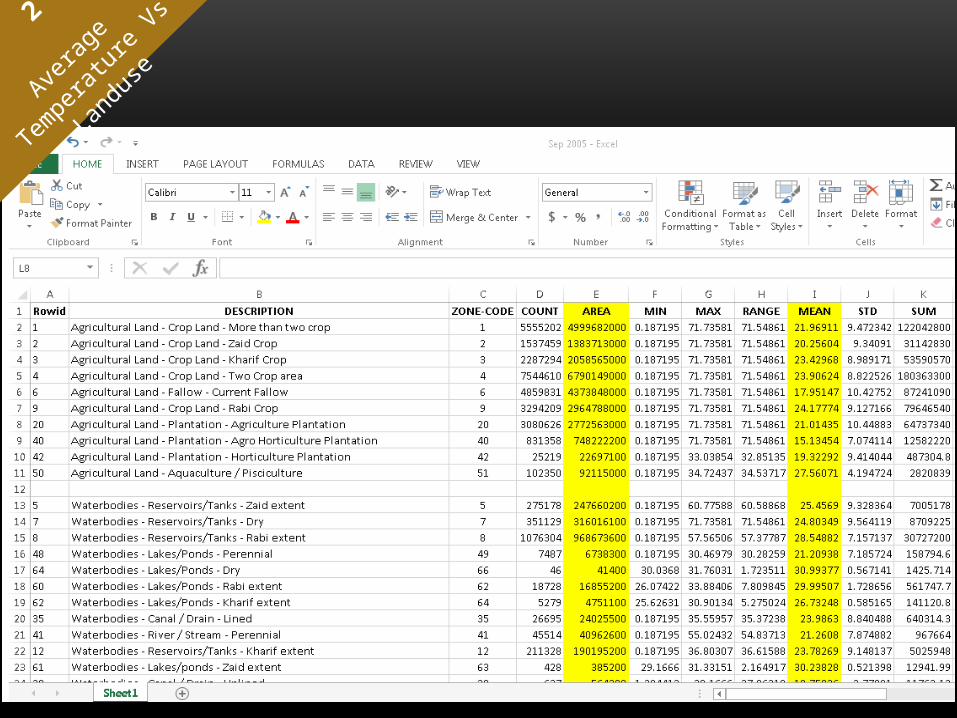
ZONAL STATISTICS TABLE-LANDUSE2
Averag
e
Tempe
rature
Vs Lan
duse
2
Averag
e
Tempe
rature
Vs Lan
duse
Contd.,
• Similarly , the Zonal Statistics was computed using the Land use for
2005 September
2014 January
2014 April
2014 July
2014 October , and
2015 January.
2
Averag
e
Tempe
rature
Vs Lan
duse

AVERAGE TEMPERATURE DATA OF TAMIL NADU BASED ON LAND USE
Year 2005 2014 JAN 2014 APR 2014 JULY 2014 OCT 2015
Agricultural Land 21.47228 20.00418 30.439847 16.72242 20.52887 23.13809
Waterbodies 22.29618 19.33708 30.004355 16.32722 16.57789 26.12562
Forest 16.35451 18.91619 27.22696091 14.7095 18.34383 20.90721
Wastelands 23.86727 19.04837 29.14875273 17.42403 21.86814 29.09692
Built Up (Urban) 25.92222 18.84035 32.731394 12.40358 16.6293 23.03187
Built Up - Mining / Industrial area 23.6232 22.02785 31.03650667 11.68106 15.14985 20.88321
Wetlands 25.38803 20.08572 33.6979825 11.64225 12.64309 23.83304
2
Averag
e
Tempe
rature
Vs Lan
duse

Agricultural Land Waterbodies Forest Wastelands Built Up (Urban) Built Up - Mining / Industrial area
Wetlands0
5
10
15
20
25
30
2005 -AVERAGE TEMPERATURE PLOT OF LANDUSE PARAMETERS
LANDUSE
TEM
PERA
TURE
(°c)
INFERENCE:• In 2005 September, on comparing the average temperatures of various land use parameters, it was found that
the forest region, agricultural land and water bodies has significantly lower temperatures compared to the urban lands resulting from mining, industrial processes and built-up areas.
• Thus, built-up urban and industrial/ mining areas contributes to higher temperature, which contributes to the formation of urban heat islands.
2
Averag
e
Tempe
rature
Vs Lan
duse

Agricultural Land Waterbodies Forest Wastelands Built Up (Urban) Built Up - Mining / Industrial area
Wetlands17
18
19
20
21
22
23
2014 JAN- AVERAGE TEMPERATURE PLOT OF LANDUSE PARAM-ETERS
LANDUSE
TEM
PERA
TURE
(˚C)
INFERENCE:• It was observed that there is an increased temperature of 20°C in agricultural areas during January
2014 due to the prevalence of dry season and subsequently the agricultural activities are reduced and land gets heated .
• It is clear that temperature difference & UHI formation can be easily found in winter season.
2
Averag
e
Tempe
rature
Vs Lan
duse
Agricultural Land Waterbodies Forest Wastelands Built Up (Urban) Built Up - Mining / Industrial area
Wetlands0
5
10
15
20
25
30
35
40
2014 APR-AVERAGE TEMPERATURE PLOT OF LANDUSE PARAM-ETERS
LANDUSE
TEM
PERA
TURE
(°c)
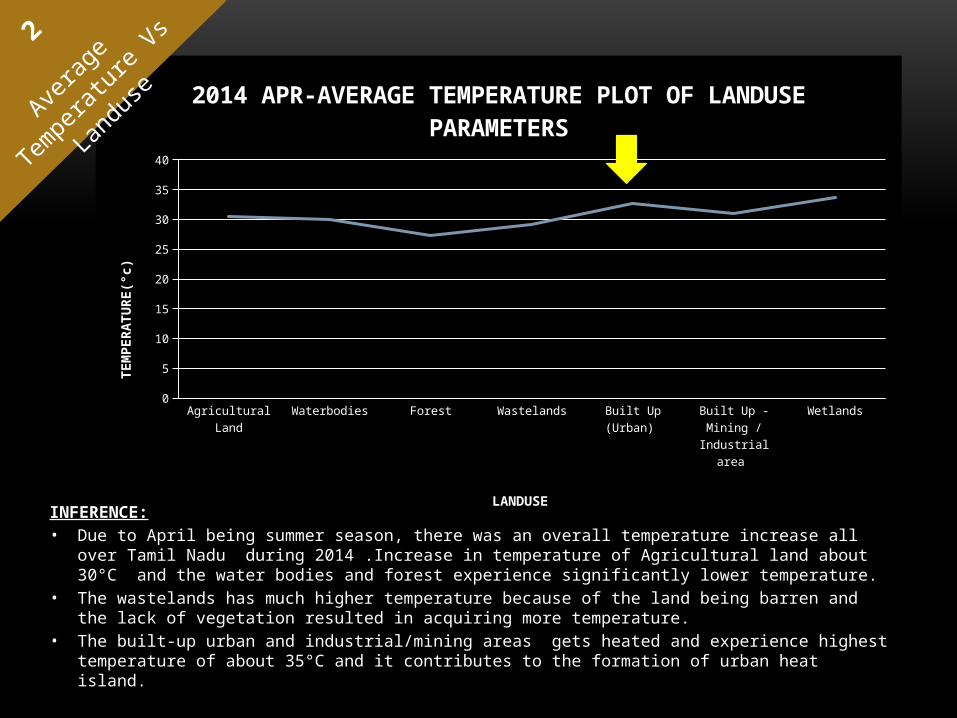
INFERENCE:• Due to April being summer season, there was an overall temperature increase all over Tamil Nadu during
2014 .Increase in temperature of Agricultural land about 30°C and the water bodies and forest experience significantly lower temperature.
• The wastelands has much higher temperature because of the land being barren and the lack of vegetation resulted in acquiring more temperature.
• The built-up urban and industrial/mining areas gets heated and experience highest temperature of about 35°C and it contributes to the formation of urban heat island.
2
Averag
e
Tempe
rature
Vs Lan
duse

Agricultural Land Waterbodies Forest Wastelands Built Up (Urban) Built Up - Mining / Industrial area
Wetlands0
2
4
6
8
10
12
14
16
18
20
2014 JULY-AVERAGE TEMPERATURE PLOT OF LANDUSE PARAMETERS
Land use
TEM
PERA
TURE
(°C)
2
Averag
e
Tempe
rature
Vs Lan
duse

2014 JULY
• The presence of maximum cloud cover in the path 144 and rows 051,052,053 during July 2014 has lead to the deviation of results of the average temperature analysis from normal.
• Hence, the land use in these areas could not have contributed to the average temperature.
2
Averag
e
Tempe
rature
Vs Lan
duse

INFERENCE:
• Due to Rainy Season Built-up Areas, wetlands, forest areas, agricultural lands, holds more water and became cooler than wasteland which leaches out water in a faster rate.
Agricultural Land Waterbodies Forest Wastelands Built Up (Urban) Built Up - Mining / Industrial area
Wetlands0
5
10
15
20
25
2014 OCT-AVERAGE TEMPERATURE PLOT OF LANDUSE PARAMETERS
Land use
TEM
PERA
TURE
(°c)
2
Averag
e
Tempe
rature
Vs Lan
duse

Agricu
ltural
Land
Waterbo
dies
Forest
Wastel
ands
Built Up (
Urban)
Built Up -
Minin
g / In
dustr
ial are
a
Wetlan
ds0
5
10
15
20
25
30
35
2015-AVERAGE TEMPERATURE PLOT OF LANDUSE PARAMETERS
LAND USE
TEM
PERA
TURE
(°C)
2
Averag
e
Tempe
rature
Vs Lan
duse

2015 JAN
• As it has accounted for large amount of clouds in path 144 due to it being winter during January 2015 which has lead to the deviation of results of the average temperature analysis from normal.
• Hence, the land use in these areas could not have contributed to the average temperature.
2
Averag
e
Tempe
rature
Vs Lan
duse

RESULTS AND DISCUSSION:
• Thus on the whole, it was observed that the Urban area contributed to the maximum temperature during 2005 , January 2014 and April 2014, though the wasteland showed significantly higher temperature during July 2014 and January 2015 due to insufficient availability of data because of cloud cover.
• It is indicative from the average temperature graphs that Urban areas (both built-up and mining) has lead to the formation of UHI in Tamil Nadu.
2
Averag
e
Tempe
rature
Vs Lan
duse

EFFECT OF LANDUSE POLYGON SIZE
3
Effect o
f
Land
use Poly
gon S
ize
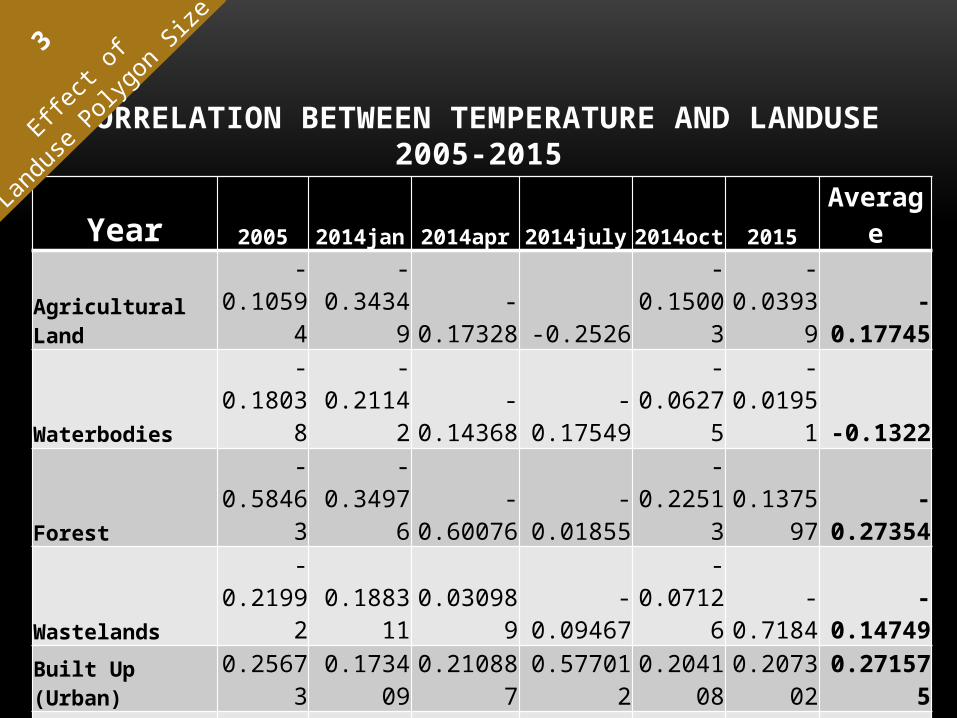
CORRELATION BETWEEN TEMPERATURE AND LANDUSE
2005-2015
Year 2005 2014jan 2014apr 2014july 2014oct 2015 Average
Agricultural Land -0.10594 -0.34349 -0.17328 -0.2526 -0.15003 -0.03939 -0.17745
Waterbodies -0.18038 -0.21142 -0.14368 -0.17549 -0.06275 -0.01951 -0.1322
Forest -0.58463 -0.34976 -0.60076 -0.01855 -0.22513 0.137597 -0.27354
Wastelands -0.21992 0.188311 0.030989 -0.09467 -0.07126 -0.7184 -0.14749
Built Up (Urban) 0.25673 0.173409 0.210887 0.5770120.204108 0.207302 0.271575
Built Up - Mining / Industrial area 0.30283 0.223932 0.107899 0.9205120.648294 0.663338 0.477805
Wetlands -0.13655 -0.25723 -0.34259 0.0011560.084292 -0.98511 -0.27267
3
Effect o
f
Land
use Poly
gon S
ize

INFERENCE:
• The land area of the Land use Polygon positively correlated with surface temperature for commercial, built up areas (r=0.27) and for mining and industrial areas(r=0.48), as the area of these polygons increases ,the temperature also tends to increase
• On the other hand, Agricultural land(r=-0.18), Waterbodies(r=-0.13), Forest areas(r=-0.27),wetlands(r=-0.27) showed a statistically significant negative relationship. As the area of the waterbody or agricultural land increases the temperature decreases.
3
Effect o
f
Land
use Poly
gon S
ize
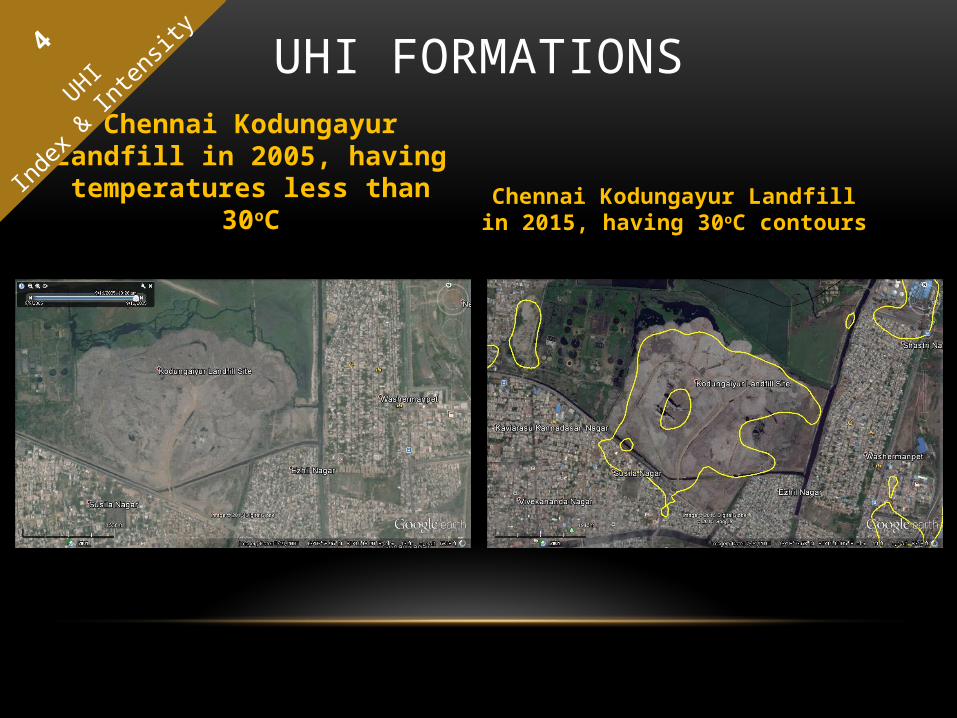
UHI FORMATIONS
Chennai Kodungayur Landfill in 2005, having temperatures less than 30oC
Chennai Kodungayur Landfill in 2015, having 30oC contours
4
UHI
Index
& Inten
sity

UHI FORMATIONS4
UHI
Index
& Inten
sity

UHI FORMATIONS
Water Bodies that escape from contour
Heat Absorbing Plain Sea shore Land
Vegetation that escape from the
contour
White Roofs that escape from the
contour
Chennai urban area
4
UHI
Index
& Inten
sity

UHI FORMATIONS2005 2015
2015: Areas inside the contour are less than 30 and all other are greater than 30
Water Bodies that are encapsulated into the contour
Heat Absorbing Plain Sea shore Land
2005: Areas inside the contour are greater than 30 and all other are less than 30
4
UHI
Index
& Inten
sity

UHI INTENSITY-1
The temperature varies 10oC in 620 ft (or) 189 m, therefore UHI Index is 0.05 oC/m
o620 ft
4
UHI
Index
& Inten
sity

UHI INTENSITY-2
The temperature varies 10oC in 97 ft (or) 29.5 m, therefore UHI Index is 0.33 oC/m
o
97 ft
4
UHI
Index
& Inten
sity

UHI INTENSITY-3
90 ft
The temperature varies 10oC in 90 ft (or) 27.5 m, therefore UHI Index is 0.36 oC/m
o
4
UHI
Index
& Inten
sity

UHI INTENSITY-4
The temperature varies 20oC in 180 ft (or) 55 m, therefore UHI Index is 0.36 oC/m
o
180 ft
4
UHI
Index
& Inten
sity

UHI INTENSITY-5
The temperature varies 20oC in 155 ft (or) 47 m, therefore UHI Index is 0.42 oC/m
o
155 ft
4
UHI
Index
& Inten
sity

COMPARISON OF UHI INTENSITY ANALYSIS AND RESULTS
UHI Place Type of land UHI Index (oC/m) Ranking Mitigation Measures1 Iyerpadi Hill Rocks
Surrounded by Forest
10oC / 189m = 0.05
5 Minor effect that could be neglected
2 Coimbatore Outer – 1
Barren Land Surrounded by Vegetation
20oC / 55m = 0.33
4 Agriculture / Afforestation is
encouraged3 Coimbatore
Outer - 2Barren Land Surrounded by Vegetation
20oC / 47m = 0.36
3 Agriculture / Afforestation is
encouraged4 Vadugapalay
amUrban Area Surrounded by Vegetation
10oC / 29.5m = 0.36
2 Vegetation in between the buildings & White roofs are encouraged
5 Jeeva Nagar Urban Area Surrounded by Vegetation
10oC / 27.5m = 0.42
1 Vegetation in between the buildings & White roofs are encouraged
4
UHI
Index
& Inten
sity

CONCLUSION & RECOMMENDATIONS
• The dark surfaces and lack of vegetation can be mitigated by
increasing reflective surfaces and increasing vegetative surfaces.
• In surfaces, the higher the reflectivity (ALBEDO) and emissivity of
a material, the less likely it is to store heat and radiate it back into
the atmosphere or into the building through the walls and roof.
• The reflectivity of a surface determines its ability to reflect solar
radiation. Albedo is represented on a scale of 0 to 1.
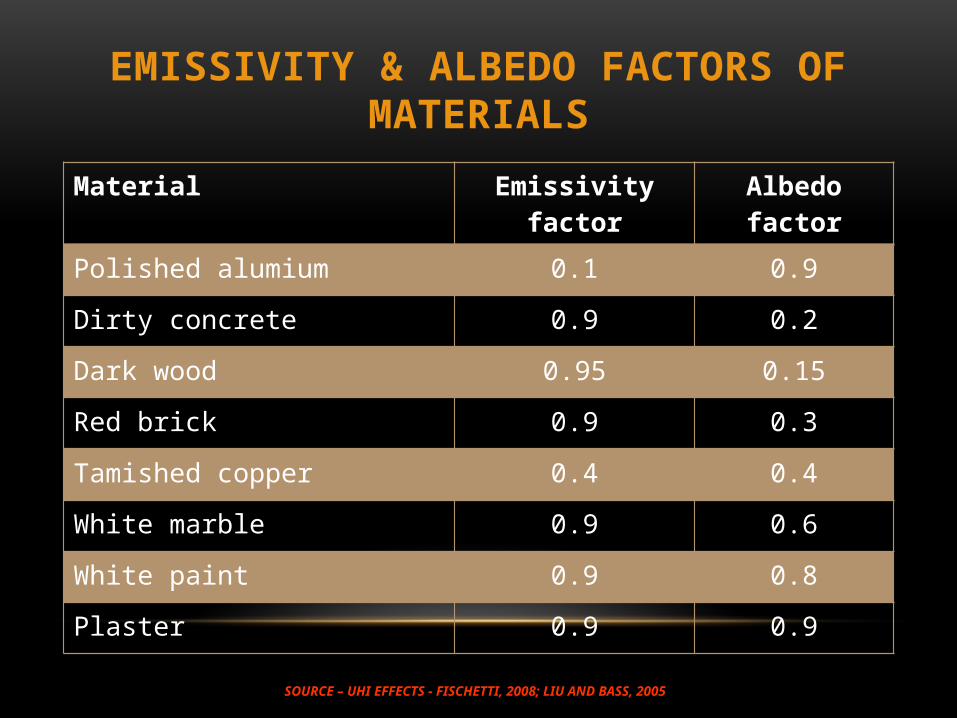
EMISSIVITY & ALBEDO FACTORS OF MATERIALS
Material Emissivity factor Albedo factor
Polished alumium 0.1 0.9
Dirty concrete 0.9 0.2
Dark wood 0.95 0.15
Red brick 0.9 0.3
Tamished copper 0.4 0.4
White marble 0.9 0.6
White paint 0.9 0.8
Plaster 0.9 0.9
SOURCE – UHI EFFECTS - FISCHETTI, 2008; LIU AND BASS, 2005

• All vegetation has the potential to provide these ecosystem services and
co-benefits to a city and surrounding areas: storm water filtration,
groundwater recharge, reduced stress on combined sewer overflow
systems, improved public recreation space, and increased urban habitat.
• Potential vegetation actions include installing green roofs, planting trees
to shade the south and west of homes, and using grass pavers where
possible. Green walls offer a building decreased heat absorption.
• On a sunny, 26°C day, a dark roof can reach a temperature of up to 80°C,
a white roof, 45°C, and a green roof, 29°C

Thank You


![Tamilnadu delicacies[1]](https://static.fdocuments.in/doc/165x107/551d02f94979595f198b4753/tamilnadu-delicacies1.jpg)