
Delineating white matter structure in diffusion tensor MRI ...
11
Delineating white matter structure in diffusion tensor MRI with anisotropy creases Gordon Kindlmann a, * , Xavier Tricoche b , Carl-Fredrik Westin a a Laboratory of Mathematics in Imaging, Department of Radiology, Harvard Medical School, USA b Computer Science Department, Purdue University, USA Received 2 May 2007; received in revised form 16 July 2007; accepted 17 July 2007 Available online 3 August 2007 Abstract Geometric models of white matter architecture play an increasing role in neuroscientific applications of diffusion tensor imaging, and the most popular method for building them is fiber tractography. For some analysis tasks, however, a compelling alternative may be found in the first and second derivatives of diffusion anisotropy. We extend to tensor fields the notion from classical computer vision of ridges and valleys, and define anisotropy creases as features of locally extremal tensor anisotropy. Mathematically, these are the loci where the gradient of anisotropy is orthogonal to one or more eigenvectors of its Hessian. We propose that anisotropy creases provide a basis for extracting a skeleton of the major white matter pathways, in that ridges of anisotropy coincide with interiors of fiber tracts, and valleys of anisotropy coincide with the interfaces between adjacent but distinctly oriented tracts. The crease extraction algorithm we pres- ent generates high-quality polygonal models of crease surfaces, which are further simplified by connected-component analysis. We dem- onstrate anisotropy creases on measured diffusion MRI data, and visualize them in combination with tractography to confirm their anatomic relevance. Ó 2007 Elsevier B.V. All rights reserved. Keywords: Diffusion tensor MRI; Anisotropy; Ridges and valleys; Crease surface extraction; White matter geometry 1. Introduction Diffusion tensor magnetic resonance imaging (DTI) has become a popular means of measuring the structure of white matter in the central nervous system (Basser et al., 1994; Pierpaoli et al., 1996; Basser and Jones, 2002). The coherent organization of axons in nerve bundles contrib- utes to the magnitude and orientation of diffusion aniso- tropy (Beaulieu, 2002). To the extent that a single diffusion tensor model captures the diffusive behavior in the underly- ing tissue, image processing of tensor-valued data can be leveraged to analyze the macroscopic architecture of the white matter in disease and in health. The de facto stan- dard measure of microstructural tissue organization, calcu- lated from the diffusion tensor, is fractional anisotropy, or FA (Basser, 1995). Many applications of DTI are based on region-of-interest measurements of FA, guided either by prior knowledge of neuroanatomy, or by measurements from functional MRI (Klingberg et al., 2000; Kubicki et al., 2003; Kanaan et al., 2005; Salat et al., 2005; Tuch et al., 2005). Fiber tractography is another common DTI analysis method, in which the course of axons in fiber tracts is approximated by path integrals along the direction of greatest diffusivity, the diffusion tensor principal eigenvec- tor (Basser et al., 2000). Neuroscientific studies can then be based upon measurements of tract geometry (Dougherty et al., 2005) or of tensor attributes along tracts (Corouge et al., 2006). Further post-processing of tractography can involve clustering coherent groups of similar tracts into models of major fiber pathways (Zhang et al., 2006; O’Donnell et al., 2006). The combination of tractography and clustering algorithms requires a non-trivial number of parameter settings, which may affect their practical 1361-8415/$ - see front matter Ó 2007 Elsevier B.V. All rights reserved. doi:10.1016/j.media.2007.07.005 * Corresponding author. Tel.: +1 617 525 6074; fax: +1 617 582 6033. E-mail address: [email protected] (G. Kindlmann). www.elsevier.com/locate/media Medical Image Analysis 11 (2007) 492–502
Transcript of Delineating white matter structure in diffusion tensor MRI ...

www.elsevier.com/locate/media
Medical Image Analysis 11 (2007) 492–502
Delineating white matter structure in diffusion tensor MRIwith anisotropy creases
Gordon Kindlmann a,*, Xavier Tricoche b, Carl-Fredrik Westin a
a Laboratory of Mathematics in Imaging, Department of Radiology, Harvard Medical School, USAb Computer Science Department, Purdue University, USA
Received 2 May 2007; received in revised form 16 July 2007; accepted 17 July 2007Available online 3 August 2007
Abstract
Geometric models of white matter architecture play an increasing role in neuroscientific applications of diffusion tensor imaging, andthe most popular method for building them is fiber tractography. For some analysis tasks, however, a compelling alternative may befound in the first and second derivatives of diffusion anisotropy. We extend to tensor fields the notion from classical computer visionof ridges and valleys, and define anisotropy creases as features of locally extremal tensor anisotropy. Mathematically, these are the lociwhere the gradient of anisotropy is orthogonal to one or more eigenvectors of its Hessian. We propose that anisotropy creases provide abasis for extracting a skeleton of the major white matter pathways, in that ridges of anisotropy coincide with interiors of fiber tracts, andvalleys of anisotropy coincide with the interfaces between adjacent but distinctly oriented tracts. The crease extraction algorithm we pres-ent generates high-quality polygonal models of crease surfaces, which are further simplified by connected-component analysis. We dem-onstrate anisotropy creases on measured diffusion MRI data, and visualize them in combination with tractography to confirm theiranatomic relevance.� 2007 Elsevier B.V. All rights reserved.
Keywords: Diffusion tensor MRI; Anisotropy; Ridges and valleys; Crease surface extraction; White matter geometry
1. Introduction
Diffusion tensor magnetic resonance imaging (DTI) hasbecome a popular means of measuring the structure ofwhite matter in the central nervous system (Basser et al.,1994; Pierpaoli et al., 1996; Basser and Jones, 2002). Thecoherent organization of axons in nerve bundles contrib-utes to the magnitude and orientation of diffusion aniso-tropy (Beaulieu, 2002). To the extent that a single diffusiontensor model captures the diffusive behavior in the underly-ing tissue, image processing of tensor-valued data can beleveraged to analyze the macroscopic architecture of thewhite matter in disease and in health. The de facto stan-dard measure of microstructural tissue organization, calcu-lated from the diffusion tensor, is fractional anisotropy, or
1361-8415/$ - see front matter � 2007 Elsevier B.V. All rights reserved.
doi:10.1016/j.media.2007.07.005
* Corresponding author. Tel.: +1 617 525 6074; fax: +1 617 582 6033.E-mail address: [email protected] (G. Kindlmann).
FA (Basser, 1995). Many applications of DTI are basedon region-of-interest measurements of FA, guided eitherby prior knowledge of neuroanatomy, or by measurementsfrom functional MRI (Klingberg et al., 2000; Kubickiet al., 2003; Kanaan et al., 2005; Salat et al., 2005; Tuchet al., 2005).
Fiber tractography is another common DTI analysismethod, in which the course of axons in fiber tracts isapproximated by path integrals along the direction ofgreatest diffusivity, the diffusion tensor principal eigenvec-tor (Basser et al., 2000). Neuroscientific studies can thenbe based upon measurements of tract geometry (Doughertyet al., 2005) or of tensor attributes along tracts (Corougeet al., 2006). Further post-processing of tractography caninvolve clustering coherent groups of similar tracts intomodels of major fiber pathways (Zhang et al., 2006;O’Donnell et al., 2006). The combination of tractographyand clustering algorithms requires a non-trivial numberof parameter settings, which may affect their practical

G. Kindlmann et al. / Medical Image Analysis 11 (2007) 492–502 493
application to neuroscientific studies (Moberts et al., 2005).This has motivated our exploration of modeling techniquesthat work more directly with the underlying tensor dataand its attributes.
In two-dimensional images and height fields, ridges andvalleys, collectively referred to as creases, have been anobject of study for many years in different disciplines. Inthe context of geomorphology, de Saint-Venant (1852)defines creases as the loci where the slope is minimal alongthe isocontours of the relief, which was later reformulatedin terms of the Hessian of the height function by Haralick(1983). Maxwell (1870) gives a topological and global def-inition of ridges and valleys as watersheds and water-courses: slope lines that connect saddle points to localmaxima or minima. Gauch and Pizer (1993) define ridgesin terms of differential geometry and topography, and trackthem through multiple scales of image feature size. Moregenerally, the localization of ridge and edge features inboth position and intrinsic scale is a focus of extensiveresearch (see e.g. Lindeberg, 1998 or ter Haar Romeny,2003 and references therein). Most relevant for ourapproach, Eberly et al. (1994) motivate the idea thatcreases should be defined locally and be invariant withrespect to a variety of transforms (rigid transforms, uni-form scaling, and monotonic mappings of intensity), andthey generalize the height-based definition of de Saint-Venant to d-dimensional manifolds embedded in n-dimen-sional image space. Other previous work focuses onextracting polygonal models of crease geometry; this isreviewed in Section 3.1.
We propose that a skeleton of the major white matterstructures can be approximated from creases extracteddirectly from the differential properties of scalar-valuedtensor attributes. Given the ubiquity of FA as a quantita-tive variable in the diffusion tensor literature, we start bydetecting creases in FA, and term these anisotropy creases
(Kindlmann et al., 2006). We propose that the ridge sur-faces and ridge lines of FA coincide with the interiors ofwhite matter fiber tracts, and that valley surfaces of anisot-ropy delineate the interfaces between fiber tracts that areadjacent but distinctly oriented (such as between the corpuscallosum and the cingulum bundles). Anisotropy creasesmay have utility in a variety of contexts, such as non-rigidregistration and shape analysis. The ability to extract whitematter skeletons directly from tensor invariants, withoutthe algorithmic complexity or parameter tuning of fibertracking and clustering, could also increase sensitivity inshape analysis studies. We emphasize that our algorithmis fundamentally a local structural analysis of tensor imagefeatures, rather than a global connectivity analysis. That is,we seek geometric models of major white matter structuresand their interfaces, not a detailed connectivity model overthe entire brain.
Major crease features may also play a role analogous tothat of the cortical surface in functional imaging, that is, areference manifold onto which variables of interest areprojected and analyzed. This general strategy is advanced
by the tract-based spatial statistics (TBSS) method ofSmith et al. (2006) (see Rouw and Scholte, 2007 for anexample application). TBSS enables voxel-based mor-phometry on a white matter skeleton calculated fromridges in a smooth mean FA image (from a set of regis-tered scan), although ‘‘ridges’’ are not mentioned per se,and the ridge representation is a discrete raster image.By using an established mathematical definition of creasefeatures, our technique extracts true codimension-onecrease surfaces from continuous tensor fields, from indi-vidual DTI scans. Other examples of previous work in fea-ture detection in DTI have also used, as we do, derivativesin tensor fields rather than tractography. Pajevic et al.(2002) use B-splines to generate continuous tensor fieldsthat are differentiated to highlight anisotropy boundaries.O’Donnell et al. (2004) use structure tensors to detect gen-eral boundaries in tensor values. In both cases, results arevisually evaluated by confirming a high edge strength nearstructural boundaries, but the techniques do not analyzethe familiar FA measure, nor is the feature geometryexplicitly extracted.
2. Theoretical background
2.1. Fractional anisotropy and its derivatives
Our method is based on measuring the differential struc-ture of fractional anisotropy (FA), so we review here thedefinition of FA (which leads to formulae for its spatialderivatives) and a method of creating a second-order con-tinuous tensor field from sampled data. We notate the ten-sor trace and determinant as tr( ) and det( ), respectively,the identity tensor as I, and the tensor norm as
jDj ¼ffiffiffiffiffiffiffiffiffiffiffiffiffiffiffiffiffitrðDDTÞ
q. The eigenvalues ki of tensor D are the
roots of the characteristic polynomial p(k) = detkI � D,and the coefficients of p(k) are the principal invariants J1,J2, J3 (Bourne and Kendall, 1977). An additional invariantJ4 can be defined for convenience:
J 1 ¼ trðDÞ; J 2 ¼trðDÞ2 � trðD2Þ
2;
J 3 ¼ detðDÞ; J 4 ¼ jDj2: ð1Þ
Basser and Pierpaoli (1996) define FA in terms of the devi-atoric tensor eD ¼ D� trðDÞI=3 and tensor contractionA:B = tr(ABT), which with some algebra can be re-expressed in terms of J2 and J4:
FA ¼
ffiffiffiffiffiffiffiffiffiffiffiffiffiffiffiffiffi3
2
eD : eDD : D
s¼
ffiffiffiffiffiffiffiffiffiffiffiffiffiffiffiffiffiffiffiffi1� J 2=J 4
p: ð2Þ
J2 and J4 can in turn be expressed in terms of the individualtensor coefficients:
J 2 ¼ DxxDyy þ DxxDzz þ DyyDzz � D2xy � D2
xz � D2yz ð3Þ
J 4 ¼ D2xx þ D2
yy þ D2zz þ 2D2
xy þ 2D2xz þ 2D2
yz ð4Þ
494 G. Kindlmann et al. / Medical Image Analysis 11 (2007) 492–502
Applying the chain rule to Eq. (2) generates an expressionfor the spatial gradient of FA in terms of the spatial gradi-ents of the individual tensor components:
rFA ¼ J 2rJ 4 � J 4rJ 2
2J 24FA
ð5Þ
rJ 2 ¼ ðDyy þ DzzÞrDxx þ ðDxx þ DzzÞrDyy
þ ðDxx þ DyyÞrDzz � 2ðDxyrDxy þ DxzrDxz
þ DyzrDyzÞ ð6ÞrJ 4 ¼ 2ðDxxrDxx þ DyyrDyy þ DzzrDzzÞ
þ 4ðDxyrDxy þ DxzrDxz þ DyzrDyzÞ ð7Þ
The formula for the second derivative (the Hessian) of FAis given in Appendix A. Our formulaic decomposition ofthe derivatives of FA also translates to an implementationstrategy, in which J2, J4 and their spatial derivatives arenumerically computed (as described in the next section),and then combined to find the gradient and Hessian of FA.
2.2. Continuous field reconstruction
Our method of crease extraction relies on a second-ordercontinuous (C2) reconstruction of the tensor field from thediscretely sampled data. Previous work has advanced theuse of cubic B-splines for interpolating the sampled tensorcoefficients to create a C2 tensor field (Aldroubi and Basser,1999; Pajevic et al., 2002). The geometric structure of thecrease features, however, does not depend on exact interpo-lation of the tensor values, and for the purposes of robust-
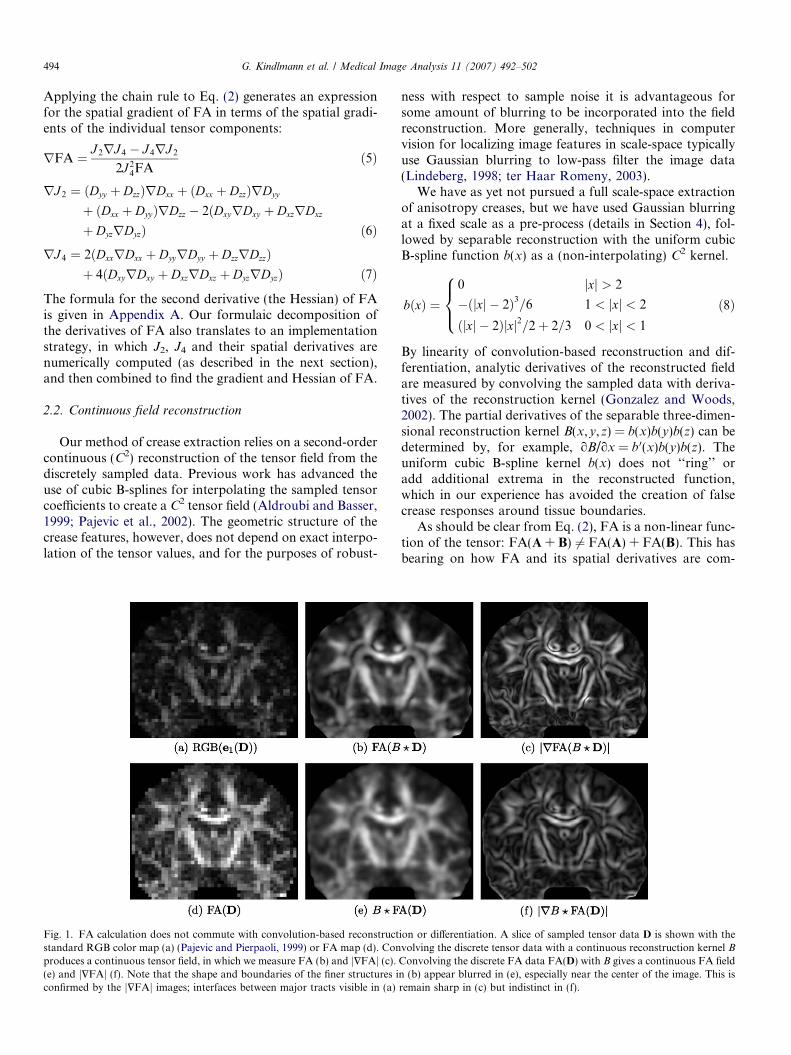
Fig. 1. FA calculation does not commute with convolution-based reconstructstandard RGB color map (a) (Pajevic and Pierpaoli, 1999) or FA map (d). Conproduces a continuous tensor field, in which we measure FA (b) and j$FAj (c).(e) and j$FAj (f). Note that the shape and boundaries of the finer structures iconfirmed by the j$FAj images; interfaces between major tracts visible in (a)
ness with respect to sample noise it is advantageous forsome amount of blurring to be incorporated into the fieldreconstruction. More generally, techniques in computervision for localizing image features in scale-space typicallyuse Gaussian blurring to low-pass filter the image data(Lindeberg, 1998; ter Haar Romeny, 2003).
We have as yet not pursued a full scale-space extractionof anisotropy creases, but we have used Gaussian blurringat a fixed scale as a pre-process (details in Section 4), fol-lowed by separable reconstruction with the uniform cubicB-spline function b(x) as a (non-interpolating) C2 kernel.
bðxÞ ¼0 jxj > 2
�ðjxj � 2Þ3=6 1 < jxj < 2
ðjxj � 2Þjxj2=2þ 2=3 0 < jxj < 1
8><>: ð8Þ
By linearity of convolution-based reconstruction and dif-ferentiation, analytic derivatives of the reconstructed fieldare measured by convolving the sampled data with deriva-tives of the reconstruction kernel (Gonzalez and Woods,2002). The partial derivatives of the separable three-dimen-sional reconstruction kernel B(x,y,z) = b(x)b(y)b(z) can bedetermined by, for example, oB/ox = b 0(x)b(y)b(z). Theuniform cubic B-spline kernel b(x) does not ‘‘ring’’ oradd additional extrema in the reconstructed function,which in our experience has avoided the creation of falsecrease responses around tissue boundaries.
As should be clear from Eq. (2), FA is a non-linear func-tion of the tensor: FA(A + B) 6¼ FA(A) + FA(B). This hasbearing on how FA and its spatial derivatives are com-
ion or differentiation. A slice of sampled tensor data D is shown with thevolving the discrete tensor data with a continuous reconstruction kernel B
Convolving the discrete FA data FA(D) with B gives a continuous FA fieldn (b) appear blurred in (e), especially near the center of the image. This isremain sharp in (c) but indistinct in (f).

G. Kindlmann et al. / Medical Image Analysis 11 (2007) 492–502 495
puted from discretely sampled tensor data. Specifically,pre-computing FA on a discrete grid and then convolvingor differentiating (an approach taken by, for example,Goodlett et al., 2006) is not equivalent to analytically cal-culating the FA and its derivatives (by Eq. (5)) of a contin-uous tensor field reconstruction. Fig. 1 demonstrates thiswith a two-dimensional coronal slice of a human brainDTI scan (acquisition details given in Section 4). One ofthe contributions of our approach is incorporating the ana-lytic calculation of FA (and its derivatives) directly into thecrease-finding algorithm, rather than the more straight-for-ward approach of pre-computing a scalar FA field andthen applying an existing crease-finding method.
2.3. Crease feature definition
Eberly et al. (1994) define crease features of a scalar fieldf in terms of the gradient g = $f and Hessian H, in a waythat easily generalizes to three and higher-dimensionalimages. Intuitively, creases are loci of constrained extrema,with the constraint surface defined by tangency to one ormore Hessian eigenvectors. A function is at extrema whereits gradient is orthogonal to the constraint surface (Mars-den and Tromba, 1996), so in three dimensions ridgesand valleys occur where the gradient g is orthogonal toone or two of the unit-length eigenvectors {e1,e2,e3} (withcorresponding sorted eigenvalues k1 P k2 P k3) of theHessian H:
Surface
LineRidge
g Æ e3 = 0, k3 < 0 g Æ e2 = g Æ e3 = 0, k3, k2 < 0 Valley g Æ e1 = 0, k1 > 0 g Æ e1 = g Æ e2 = 0, k1, k2 > 0In this definition, the strength of the image feature canbe assessed by the magnitude of the eigenvalues that arerequired to be negative or positive for ridges and valleys,respectively, which can be used to filter out insignificantfeatures. Specifically, crease surface strength is measuredby �k3 (for ridges) and k1 (for valleys), and crease linestrength is measured by �k2 (for ridges) and k2 (forvalleys).
3. Methods
3.1. Crease surface extraction
In our work to date we have implemented geometricextraction of crease surfaces, but not crease lines, becausesurfaces constitute the majority of the fiber tract geometrythat we seek to capture. We extract crease surfaces by per-voxel triangulation of the zero-isocontour of g Æ ei (g Æ e3 forridges, g Æ e1 for valleys) using marching cubes (MC)(Lorensen and Cline, 1987). Straight-forward applicationof MC, however, would not produce useful results, becausethe inherent sign ambiguity of eigenvectors leads to arbi-
trary signs in g Æ ei, which must be consistent for the MCcase tables to apply. The literature offers ways to overcomethis. Morse (1994) suggests determining correspondencesbetween sets of eigenvectors rather than individual ones,to handle eigenvector permutations associated with eigen-value equality. Furst et al. (1996) use similar ideas inmarching cores to extract crease manifolds in image scale-space. In their marching ridges method, Furst and Pizer(2001) compute the principal eigenvector of the averageof outer products of the eigenvectors at voxel corners,and use its (arbitrary) sign to impose a consistent sign toeigenvectors at voxel corners.
We have taken a more cautious approach, based onobservations suggesting that eigenvectors of the Hessianof non-linear scalar attributes of tensors (such as FA) canvary more rapidly than Hessian eigenvectors of a similarlysampled scalar field, which may confound the heuristics(described above) developed for scalar fields. Thus, wedetermine the correspondence between eigenvector signsat the voxel corners by continuously tracking the eigenvec-tor orientation along each voxel edge. Point samples areadaptively generated along all voxel edges until the anglebetween eigenvectors at adjacent samples are reducedbelow a threshold (20� in our current work). This process,which is currently the most time-consuming component ofour approach, determines whether the smooth transport ofei(v0) from vertex v0 to vertex v1 agrees in sign with eigen-vector ei(v1) or �ei(v1) computed at v1. The per-edge eigen-vector sign information is propagated along all voxel edgesto determine a per-voxel sign consistency prior to evaluat-ing the MC case. This process ensures intra-voxel eigenvec-tor sign consistency, but not inter-voxel sign consistency,which creates triangulations with inconsistent vertex wind-ings (the clockwise versus counter-clockwise order in whichthe triangle’s vertices are listed). Thus, as a final pass, wetraverse the crease surface mesh to make the vertex wind-ings consistent, while splitting the surface with vertexduplication in the case of non-orientable surfaces. Thisallows graphics hardware to appropriately render thecrease surfaces with two-sided lighting (Shreiner et al.,2004).
The remaining details of our method can decrease thecomputation time and increase the utility of the results.We refer to the grid on which the crease surface is triangu-lated one voxel at a time (by our modified MC) as the trian-
gulation grid. The continuous tensor field measurements(Section 2.2) allow the resolution of the triangulation gridto be independent of the sampling of underlying tensordata. A triangulation grid with finer sampling (higher reso-lution) than the underlying data improves the quality of thecrease surface triangulation, yet no up-sampling to the tri-angulation grid is required as a pre-process. By samplingthe crease surface strength (FA Hessian eigenvalue �k3
for ridges, k1 for valleys) at the vertices of triangulationgrid, we can skip the voxels that are unlikely to contributeto the crease surface. Even with these pre-cautions, theextracted crease surfaces are often made of many disjoint

Fig. 2. Demonstration of FA ridge and valley surfaces in a synthetic dataset. The tractography of the two arcs in (a) is color-coded by the usual RGB(e1).The lower FA between the arcs is highlighted in (b). In (c), the red and green ridge surfaces correctly model the shape of bands, and the white valley surfacecaptures the interface between them. (For interpretation of the references to color in this figure legend, the reader is referred to the web version of thisarticle.)
496 G. Kindlmann et al. / Medical Image Analysis 11 (2007) 492–502
pieces. We use connected-component analysis on the polyg-onal crease surfaces to filter out all but the largest few of thecrease surface components. We believe that removing thesmallest components increases the anatomic significanceof the crease surface results by removing the pieces thatare most apt to vary as a function of image noise and scaleselection. This geometric post-processing is a significantimprovement over the method presented in our previouswork (Kindlmann et al., 2006).
We demonstrate the method on a synthetic dataset priorto giving results on DTI scans. Fig. 2 shows results on asynthetic dataset containing two adjacent bands of orthog-onally oriented linear anisotropy. The ridge surfaces of FArepresent the interiors of the two bands, and the valley sur-face of FA marks the interface between them. It is in thissense that we claim that crease surfaces model the skeletonof the white matter fiber geometry.
4. Results
The results in this section used tensor data acquired on a1.5 T Philips scanner with SENSE parallel imaging (reduc-tion factor 2.5), using single-shot spin echo EPI diffusion-weighted images along 30 non-collinear gradient directions(b = 700 s/mm2), with five non-diffusion-weighted T2images. The field of view, the size of the acquisition matrix,and the slice thickness were 240 · 240 mm, 96 · 96, and2.5 mm, respectively, leading to an image resolution of2.5 mm2. Fifty-five axial slices were acquired to cover theentire brain. Unless otherwise noted, the standard devia-tion r of the Gaussian smoothing kernel (prior to B-spline-based reconstruction and differentiation) was1.25 mm, and the resolution of the triangulation grid is fivetimes that of the underlying tensor dataset. The computa-tion timings are with a 1.67 GHz PowerPC G4 with 2 GBof memory.
4.1. Slice inspection
Prior to their geometric extraction, the numerical ingre-dients of anisotropy crease features can be visualized ondensely sampled slices. Fig. 3 shows the numerical constit-uents of crease features on the same dataset slice used in
Fig. 1. The strength measures described in Section 2.3 arevisualized in the top half of the figure. These are used tomodulate the display in the bottom half of the figure ofthe scalar function whose zero level-set defines the creasefeature, with some additional contrast enhancement forclarity. Crease surfaces intersect with the cutting plane incurves, and crease lines intersect with the plane in points.Note that the ridge surfaces (Fig. 3d) closely follow theshape of the major white matter tracts (annotated inFig. 4a), and the valley surfaces (Fig. 3e) delineate theinterface between tracts that are adjacent but distinctly ori-ented. The anatomic utility of the ridge lines (Fig. 3f) is lim-ited to tracts with a more cylindrical shape, that is, featuresfor which the two smallest eigenvalues k2 and k3 of theHessian are approximately equal. This includes the cingu-lum bundles and fornix (Mori et al., 2005), although thenon-zero response of srl through-out the slice complicatesvisual confirmation.
The renderings in Fig. 4 (from a posterior viewpoint)show a cropped region around the same coronal slice ofprevious figures. In Fig. 4a fibers are seeded from theRGB-encoded plane, and some of the major pathwaysare indicated. Fig. 4b shows how the ridge surfaces (usingthe same RGB encoding) follow major fiber paths, espe-cially the corpus callosum (CC), internal capsule (IC), cor-ona radiata (CR), and fornix (FX) (Mori et al., 2005). The(white) anisotropy valley surfaces in Fig. 4c delineate inter-faces between the CC and cingulum bundles (CB), superiorfronto-occipital fasciculus (SFO) and IC, and IC and supe-rior longitudinal fasciculus (SLF). Fig. 4d also illustrateshow anisotropy valleys lie between adjacent paths of differ-ing orientation. The ridge and valley surface extractionseach took 10 min.
Fig. 5 illustrates anisotropy crease analysis in the brain-stem (lateral anterior superior viewpoint), a region with aclosely contained complex of fiber pathways along distinctdirections (Salamon et al., 2005). For anatomical context,Fig. 5a shows fiber tractography results, including the(from ventral to dorsal) middle cerebellar peduncle(MCP), corticospinal tract (CST), transverse pontine tract(TPT), medial lemniscus (ML), superior cerebellar pedun-cle (SCP), and inferior cerebellar peduncle (ICP). Thesepathways appear as anisotropy ridge surfaces in Fig. 5b.

Fig. 3. Functional components of crease feature definition. The ridge surface strength srs (a), valley surface strength svs (b), and ridge line strength srl (c)are all defined in terms of the eigenvalues of the FA Hessian. These are used to modulate the display of the ridge surface (d), valley surface (e), and ridgeline (f) functions defined in terms of the FA gradient g and Hessian eigenvectors ei. The crease features are visible as dark lines (in the case of creasesurfaces) or dark dots (in the case of ridge lines) in the bright areas.
Fig. 4. Anisotropy creases near the corpus callosum. CC, corpus callosum; IC, internal capsule; CR, corona radiata; FX, fornix; CB, cingulum bundles;SFO, superior fronto-occipital fasciculus; SLF, superior longitudinal fasciculus.
G. Kindlmann et al. / Medical Image Analysis 11 (2007) 492–502 497
The tract interfaces are delineated by the valley surfaces inFig. 5c, which also includes for reference a translucent cut-ting plane with RGB coloring of the principal diffusivity
direction, as well as a view-aligned clipping plane to revealthe RGB color differences among the MCP, CST, andTPT. Fig. 5d illustrates how valley surfaces delineate major

Fig. 5. Anisotropy creases in the brainstem.
498 G. Kindlmann et al. / Medical Image Analysis 11 (2007) 492–502
fiber bundles, faintly visible as tractography results. In par-ticular, valley surface patches are visible between MCP andCST, CST and TPT, TPT and ML, MCP and ICP, andICP and SCP, all of which are locations where distinctlyoriented fiber pathways pass near each other. The ridgeand valley surface extractions each took 9 min.
Fig. 6 demonstrates the connected-component analysismentioned in Section 3.1, which allows the main crease sur-face components to be extracted from the much larger col-lection of disjoint pieces. For these results and those inFig. 7, the tensor datasets were down-sampled by a factorof two, to simplify the field to only its largest features.Ridge surface extraction on this dataset produced 742 sur-face connected-components (CCs), but Fig. 6 shows thatthe largest nine CCs capture nearly all the large fiber tractsvisible in all CCs.
To demonstrate the repeatability of our method, Fig. 7expands the results from Fig. 6 to include five other scansfrom the same database, all processed identically. The com-putation of these ridge surfaces took 6 min per dataset. Inevery case, the single largest connected-component con-tains a single surface representing the corpus callosum, aswell as parts of other pathways, such as the corona radiata,and often the internal capsules. We are currently investigat-ing why ridge surface patches corresponding to distinctfiber pathways can appear joined in our ridge surface anal-ysis, which is likely related to the problem of kissing orcrossing fiber tracts.
5. Discussion and future work
The preliminary results in this work suggest that anisot-ropy creases delineate the major white matter structure inDTI, and that analytically measured anisotropy derivatives(and an adaptation of marching cubes) can lead to high-quality triangulated models of crease surface geometry.In contrast to the combination of tractography and cluster-ing algorithms, the invariance properties in the mathemat-ical definition of anisotropy creases give them the attractiveproperty of having very few parameters in their extraction.The main parameter is the scale of the Gaussian smoothingpre-process, since this puts a lower bound on the scale ofthe extracted features. Secondary parameters include thefeature strength threshold (Section 2.3), the resolution ofthe crease triangulation grid, and the manner of selectingconnected-components from the triangulation output(Section 3).
As mentioned in Section 1, our method is a structural
analysis of features in DTI, and not the connectivity analy-sis that is a popular research focus. This has implicationsfor the type of studies for which anisotropy creases maybe applied in future work (described below), as our focusis on the over-all shape of the white matter pathways,rather than on their course. In particular, for the task ofextracting a geometric model of the major white matterpathways, we accept the simplicity of the single tensormodel, despite its well-known inability to represent fiber-

Fig. 6. Ridge surface extraction results from a single scan, showing different numbers of connected-components: all 742 (left), nine largest (middle), andsingle largest (right).
G. Kindlmann et al. / Medical Image Analysis 11 (2007) 492–502 499
crossings and multiple fiber orientations (Alexander et al.,2002; Tuch et al., 2002), because it gives rise to a tractableanalysis of the differential properties of anisotropy asparameterized by FA (Eq. (5)), and because for large por-tions of the major pathways (e.g., visualized in Fig. 4b), thesingle tensor model appears sufficient. Indeed, for theextraction of fiber pathway interfaces (Fig. 4c), we embracethe fact that the partial voluming of distinctly orientedpathways gives rise to artifactual planar anisotropy bycomponent-wise interpolation (Alexander et al., 2001),which leads to lower FA values (Fig. 2b), which in turnenables FA valley surfaces to geometrically isolate theinterfaces (Figs. 2c and 4c). On the other hand, for futurework one could also consider measuring the differentialproperties of continuous maps of non-tensor or higher-order anisotropy measures (Ozarslan et al., 2005; Desco-teaux et al., 2006), which could possibly generate geometricmodels of areas of fiber-crossings in particular, or highlight
where our current FA-based analysis could be mostmisleading.
The continuous tensor field reconstruction method weuse (Aldroubi and Basser, 1999; Pajevic et al., 2002) is‘‘Euclidean’’ in that it implicitly considers diffusion tensorsas elements of a vector space, even though this neglects thestrictly positive-definite nature of diffusion. The DTI liter-ature provides a precedent for this simplifying assumptionin other contexts as well (Basser et al., 2000; Basser andPajavic, 2003; Basser and Pajevic, 2007). In a different lineof recent work, however, tensors are located on a Rie-mannian manifold that effectively creates an infinite dis-tance between valid tensors and those with zerodeterminant (Pennec, 2004; Fletcher and Joshi, 2004;Batchelor et al., 2005; Lenglet et al., 2006), and the Log-Euclidean methods provide computationally efficientapproximations (Arsigny et al., 2006; Fillard et al., 2006).The relative strengths of these two approaches (Euclidean
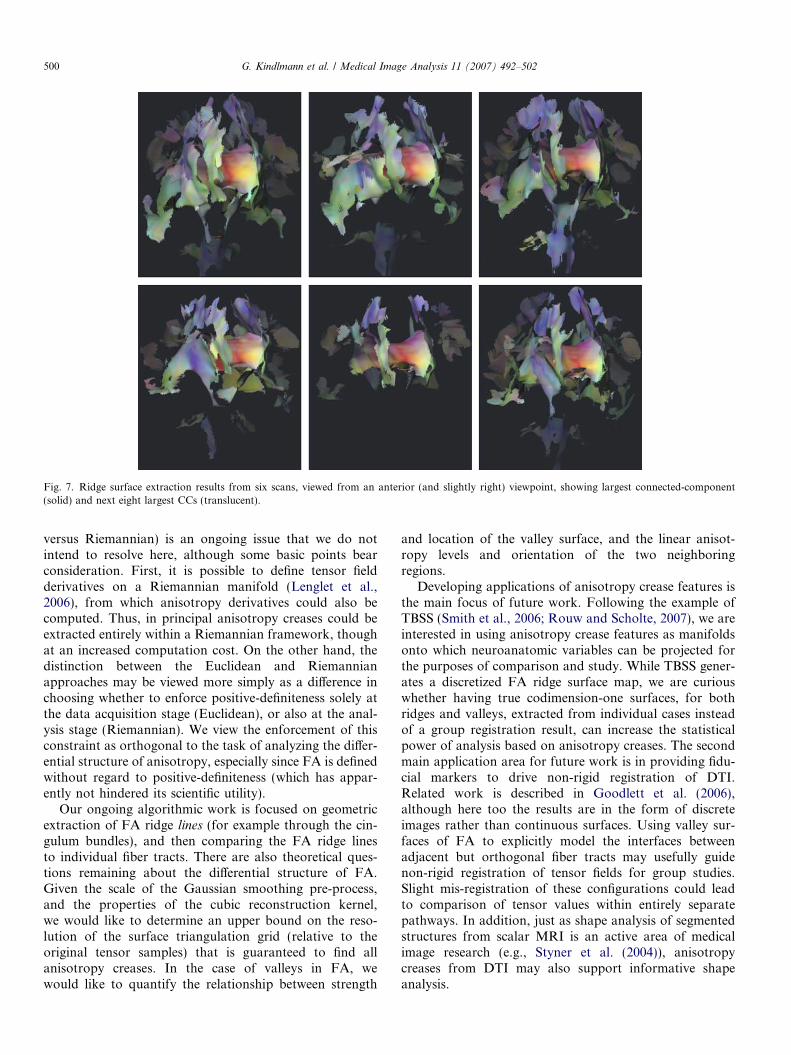
Fig. 7. Ridge surface extraction results from six scans, viewed from an anterior (and slightly right) viewpoint, showing largest connected-component(solid) and next eight largest CCs (translucent).
500 G. Kindlmann et al. / Medical Image Analysis 11 (2007) 492–502
versus Riemannian) is an ongoing issue that we do notintend to resolve here, although some basic points bearconsideration. First, it is possible to define tensor fieldderivatives on a Riemannian manifold (Lenglet et al.,2006), from which anisotropy derivatives could also becomputed. Thus, in principal anisotropy creases could beextracted entirely within a Riemannian framework, thoughat an increased computation cost. On the other hand, thedistinction between the Euclidean and Riemannianapproaches may be viewed more simply as a difference inchoosing whether to enforce positive-definiteness solely atthe data acquisition stage (Euclidean), or also at the anal-ysis stage (Riemannian). We view the enforcement of thisconstraint as orthogonal to the task of analyzing the differ-ential structure of anisotropy, especially since FA is definedwithout regard to positive-definiteness (which has appar-ently not hindered its scientific utility).
Our ongoing algorithmic work is focused on geometricextraction of FA ridge lines (for example through the cin-gulum bundles), and then comparing the FA ridge linesto individual fiber tracts. There are also theoretical ques-tions remaining about the differential structure of FA.Given the scale of the Gaussian smoothing pre-process,and the properties of the cubic reconstruction kernel,we would like to determine an upper bound on the reso-lution of the surface triangulation grid (relative to theoriginal tensor samples) that is guaranteed to find allanisotropy creases. In the case of valleys in FA, wewould like to quantify the relationship between strength
and location of the valley surface, and the linear anisot-ropy levels and orientation of the two neighboringregions.
Developing applications of anisotropy crease features isthe main focus of future work. Following the example ofTBSS (Smith et al., 2006; Rouw and Scholte, 2007), we areinterested in using anisotropy crease features as manifoldsonto which neuroanatomic variables can be projected forthe purposes of comparison and study. While TBSS gener-ates a discretized FA ridge surface map, we are curiouswhether having true codimension-one surfaces, for bothridges and valleys, extracted from individual cases insteadof a group registration result, can increase the statisticalpower of analysis based on anisotropy creases. The secondmain application area for future work is in providing fidu-cial markers to drive non-rigid registration of DTI.Related work is described in Goodlett et al. (2006),although here too the results are in the form of discreteimages rather than continuous surfaces. Using valley sur-faces of FA to explicitly model the interfaces betweenadjacent but orthogonal fiber tracts may usefully guidenon-rigid registration of tensor fields for group studies.Slight mis-registration of these configurations could leadto comparison of tensor values within entirely separatepathways. In addition, just as shape analysis of segmentedstructures from scalar MRI is an active area of medicalimage research (e.g., Styner et al. (2004)), anisotropycreases from DTI may also support informative shapeanalysis.

G. Kindlmann et al. / Medical Image Analysis 11 (2007) 492–502 501
Finally, to extract true image cores, crease detectionmust work simultaneously across image scales (Furstet al., 1996; Lindeberg, 1998). This will incur greater com-putational cost, and perhaps algorithmic complexity, butwe are investigating methods to limit the computation toregions around crease features (generalizing the existingstrategy of skipping voxels with low feature strength). Webelieve that incorporating scale-space analysis into ourcrease feature extraction may give the method better noiserobustness, because feature strength would be stronger atthe larger scales where noise is smoothed out.
Acknowledgements
This work supported by NIH Grants NIBIB T32-EB002177, U41 RR019703 (IGT), NCRR P41-RR13218(NAC) and P41-RR12553-07 (CIBC), R01-MH050740,and R01-MH074794. DWI data courtesy of Dr. SusumuMori, Johns Hopkins University, supported by NIHR01-AG20012-01 and P41-RR15241-01A1.
Appendix A. Hessian of Fractional Anisotropy
The Hessian of fractional anisotropy (FA) is determinedby differentiating Eqs. (5)–(7). The differential operator $produces a column vector, and H = $$T produces the Hes-sian matrix of second partial derivatives.
HðFAÞ ¼ rJ 2rTJ 4 �rJ 4rTJ 2 þ J 2HðJ 4Þ � J 4HðJ 2Þ2J 2
4FA
� ð2J 4rJ 4FAþ J 24rFAÞðJ 2rTJ 4 � J 4rTJ 2Þ2ðJ 2
4FAÞ2
ðA:1ÞHðJ 2Þ ¼ ðrDyy þrDzzÞrTDxx þ ðDyy þ DzzÞHðDxxÞ
þ ðrDxx þrDzzÞrTDyy þ ðDxx
þ DzzÞHðDyyÞ þ ðrDxx þrDyyÞrTDzz
þ ðDxx þ DyyÞHðDzzÞ � 2ðrDxyrTDxy
þ DxyHðDxyÞ þ rDxzrTDxz þ DxzHðDxzÞþ rDyzrTDyz þ DyzHðDyzÞÞ ðA:2Þ
HðJ 4Þ ¼ 2ðrDxxrTDxx þ DxxHðDxxÞ þ rDyyrTDyy
þ DyyHðDyyÞ þ rDzzrTDzz þ DzzHðDzzÞÞþ 4ðrDxyrTDxy þ DxyHðDxyÞþ rDxzrTDxz þ DxzHðDxzÞ þ rDyzrTDyz
þ DyzHðDyzÞÞ ðA:3Þ
References
Aldroubi, A., Basser, P., 1999. Reconstruction of vector and tensor fieldsfrom sampled discrete data. Contemporary Mathematics 247, 1–15.
Alexander, A., Hasan, K., Lazar, M., Tsuruda, J., Parker, D., 2001.Analysis of partial volume effects in diffusion-tensor MRI. MagneticResonance in Medicine 45, 770–780.
Alexander, D., Barker, G., Arridge, S., 2002. Detection and modeling ofnon-gaussian apparent diffusion coefficients profiles in human braindata. Magnetic Resonance in Medicine 48, 331–340.
Arsigny, V., Fillard, P., Pennec, X., Ayache, N., 2006. Log-Euclideanmetrics for fast and simple calculus on diffusion tensors. MagneticResonance in Medicine 56 (2), 411–421.
Basser, P., 1995. Inferring microstructural features and the physiologicalstate of tissues from diffusion-weighted images. Nuclear MagneticResonance in Biomedicine 8, 333–344.
Basser, P., Jones, D., 2002. Diffusion-tensor MRI: theory, experimentaldesign and data analysis – a technical review. Nuclear MagneticResonance in Biomedicine 15, 456–467.
Basser, P.J., Pajavic, S., 2003. A normal distribution for tensor-valuedrandom variables: applications to diffusion tensor MRI. IEEETransactions on Medical Imaging 22 (7), 785–794.
Basser, P.J., Pajevic, S., 2007. Spectral decomposition of a 4th-ordercovariance tensor: applications to diffusion tensor MRI. SignalProcessing 87, 220–236.
Basser, P.J., Pierpaoli, C., 1996. Microstructural and physiologicalfeatures of tissues elucidated by quantitative-diffusion-tensor MRI.Journal of Magnetic Resonance, Series B 111, 209–219.
Basser, P., Mattiello, J., LeBihan, D., 1994. MR diffusion tensorspectroscopy and imaging. Biophysics Journal 66 (1), 259–267.
Basser, P.J., Pajevic, S., Pierpaoli, C., Duda, J., Aldroubi, A., 2000. Invivo fiber tractograpy using DT-MRI data. Magnetic Resonance inMedicine 44, 625–632.
Batchelor, P.G., Moakher, M., Atkinson, D., Calamante, F., Connelly,A., 2005. A rigorous framework for diffusion tensor calculus. MagneticResonance in Medicine 53 (1), 221–225.
Beaulieu, C., 2002. The basis of anisotropic water diffusion in the nervoussystem – a technical review. Nuclear Magnetic Resonance in Biomed-icine 15, 435–455.
Bourne, D., Kendall, P., 1977. Vector Analysis and Cartesian Tensors,2nd ed. Thomas Nelson and Sons, Ltd, Great Britain (Chapter 9).
Corouge, I., Fletcher, P., Joshi, S., Gouttard, S., Gerig, G., 2006. Fibertract-oriented statistics for quantitative diffusion tensor MRI analysis.Medical Image Analysis 10 (5), 786–798.
de Saint-Venant, M., 1852. Surfaces a plus grande pente constituees surdes lignes courbes. Bulletin de la Societe Philomathematique de Paris,24–30.
Descoteaux, M., Angelino, E., Fitzgibbons, S., Deriche, R., 2006.Apparent diffusion coefficients from high angular resolution diffusionimaging: estimation and applications. Magnetic Resonance in Medi-cine 56, 395–410.
Dougherty, R.F., Ben-Shachar, M., Deutsch, G., Potanina, P., Bammer,R., Wandell, B.A., 2005. Occipital-callosal pathways in children:validation and atlas development. Annals of the New York Academyof Sciences 1064, 98–112.
Eberly, D., Gardner, R., Morse, B., Pizer, S., 1994. Ridges for imageanalysis. Journal of Mathematical Imaging and Vision 4, 351–371.
Fillard, P., Arsigny, V., Pennec, X., Ayache, N., 2006. Clinical DT-MRIestimation, smoothing and fiber tracking with Log-Euclidean metrics.In: Proceedings of the Third IEEE International Symposium onBiomedical Imaging (ISBI 2006). LNCS, Arlington, Virginia, USA,pp. 786–789.
Fletcher, P.T., Joshi, S., 2004. Principal geodesic analysis on symmetricspaces: statistics of diffusion tensors. Proceedings ECCV 2004 Work-shop on Computer Vision Approaches to Medical ImageAnalysis (CVAMIA). In: LNCS, vol. 31107. Springer-Verlag, pp.87–98.
Furst, J.D., Pizer, S.M., 2001. Marching ridges. In: Proceedings of 2001IASTED International Conference on Signal and Image Processing,pp. 22–26.
Furst, J.D., Pizer, S.M., Eberly, D.H., June 1996. Marching cores: amethod for extracting cores from 3D medical images. In: Proceedingsof IEEE Workshop on Mathematical Methods in Biomedical ImageAnalysis, pp. 124–130.

502 G. Kindlmann et al. / Medical Image Analysis 11 (2007) 492–502
Gauch, J.M., Pizer, S.M., 1993. Multiresolution analysis of ridges andvalleys in grey-scale images. IEEE Transactions on Pattern Analysisand Machine Intelligence 15 (6), 635–646.
Gonzalez, R., Woods, R., 2002. Digital Image Processing, second ed.Addison-Wesley Publishing Company, Reading, MA.
Goodlett, C., Davis, B., Jean, R., Gilmore, J.H., Gerig, G., 2006.Improved correspondence for DTI population studies via unbiasedatlas building. In: Ninth International Conference on Medical ImageComputing and Computer-Assisted Intervention (MICCAI’06). Lec-ture Notes in Computer Science, vol. 4190. Copenhagen, Denmark,pp. 260–267.
Haralick, R.M., 1983. Ridges and valleys on digital images. ComputerVision, Graphics, and Image Processing 22, 28–38.
Kanaan, R.A.A., Kim, J.-S., Kaufmann, W.E., Pearlson, G.D., Barker,G.J., McGuire, P.K., 2005. Diffusion tensor imaging in schizophrenia.Biological Psychiatry 58, 921–929.
Kindlmann, G., Tricoche, X., Westin, C.-F., 2006. Anisotropy creasesdelineate white matter structure in diffusion tensor MRI. In: Proceed-ings MICCAI 2006. Lecture Notes in Computer Science, vol. 4190.Copenhagen, Denmark, pp. 126–133.
Klingberg, T., Hedehus, M., Temple, E., Salz, T., Gabrielli, J.D.E.,Moseley, M.E., Poldrack, R.A., 2000. Microstructure of temporo-parietal white matter as a basis for reading ability: evidence fromdiffusion tensor magnetic resonance imaging. Neuron 25, 493–500.
Kubicki, M., Westin, C.-F., Maier, S., Mamata, H., Frumin, M., Ernst-Hirshefeld, H., Kikinis, R., Jolesz, F., McCarley, R., Shenton, M.,2003. Cingulate fasciculus integrity disruption in schizophrenia: amagnetic resonance diffusion tensor imaging study. Biological Psychi-atry 54, 1171–1180.
Lenglet, C., Rousson, M., Deriche, R., 2006. DTI segmentation bystatistical surface evolution. IEEE Transactions on Medical Imaging25, 685–700.
Lindeberg, T., 1998. Edge detection and ridge detection with automatic scaleselection. International Journal of Computer Vision 30 (2), 77–116.
Lorensen, W.E., Cline, H.E., 1987. Marching cubes: a high resolution 3Dsurface construction algorithm. Computer Graphics 21 (4), 163–169.
Marsden, J., Tromba, A., 1996. Vector Calculus. W.H. Freeman andCompany, New York.
Maxwell, J., 1870. On hills and dales. The London, Edinburgh and DublinPhilosophical Magazine and Journal of Science 40 (269), 421–425.
Moberts, B., Vilanova, A., van Wijk, J.J., 2005. Evaluation of fiberclustering methods for diffusion tensor imaging. In: Proceedings IEEEVisualization 2005, pp. 65–72.
Mori, S., Wakana, S., Nagae-Poetscher, L., Zijl, P.V., 2005. MRI Atlas ofHuman White Matter. Elsevier.
Morse, B.S., 1994. Computation of object cores from grey-level images.Ph.D. thesis, University of North Carolina at Chapel Hill, Chapel Hill,NC.
O’Donnell, L., Grimson, W., Westin, C.-F., 2004. Interface detection indiffusion tensor MRI. In: Proceedings MICCAI 2004, pp. 360–367.
O’Donnell, L., Kubicki, M., Shenton, M.E., Dreusicke, M., Grimson,W.E.L., Westin, C.-F., 2006. A method for clustering white matterfiber tracts. American Journal of Neuroradiology 27, 1032–1036.
Ozarslan, E., Vemuri, B.C., Mareci, T.H., 2005. Generalized scalarmeasures for diffusion MRI using trace, variance, and entropy.Magnetic Resonance in Medicine 53, 866–876.
Pajevic, S., Pierpaoli, C., 1999. Color schemes to represent the orientationof anisotropic tissues from diffusion tensor data: application to whitematter fiber tract mapping in the human brain. Magnetic Resonance inMedicine 42 (3), 526–540.
Pajevic, S., Aldroubi, A., Basser, P., 2002. A continuous tensor fieldapproximation of discrete DT-MRI data for extracting microstructuraland architectural features of tissue. Journal of Magnetic Resonance154, 85–100.
Pennec, X., 2004. Probabilities and statistics on riemannian manifolds: ageometric approach. Tech. Rep. 5093, INRIA, Sophia Antipolis.
Pierpaoli, C., Jezzard, P., Basser, P., Barnett, A., DiChiro, G., 1996.Diffusion tensor MR imaging of the human brain. Radiology 201 (3),637–648.
Rouw, R., Scholte, H.S., 2007. Increased structural connectivityin grapheme-color synesthesia. Nature Neuroscience 10, 792–797.
Salamon, N., Sicotte, N., Alger, J., Shattuck, D., Perlman, S., Sinha, U.,Schultze-Haakh, H., Salamon, G., 2005. Analysis of the brain-stemwhite-matter tracts with diffusion tensor imaging. Neuroradiology 47(12), 895–902.
Salat, D.H., Tuch, D.S., Hevelone, N.D., Fischl, B., Corkin, S., Rosas,H.D., Dale, A.M., 2005. Age-related changes in prefrontal whitematter measured by diffusion tensor imaging. Annals of the New YorkAcademy of Sciences 1064, 37–49.
Shreiner, D., Woo, M., Neider, J., Davis, T., 2004. OpenGL ProgrammingGuide, 4th ed. Addison-Wesley.
Smith, S.M., Jenkinson, M., Johansen-Berg, H., Rueckert, D., Nichols,T.E., Mackay, C.E., Watkins, K.E., Ciccarelli, O., Cader, M.Z.,Matthews, P.M., Behrens, T.E.J., 2006. Tract-based spatial statistics:voxelwise analysis of multi-subject diffusion data. NeuroImage 31,1487–1505.
Styner, M., Lieberman, J.A., Pantazis, D., Gerig, G., 2004. Boundary andmedial shape analysis of the hippocampus in schizophrenia. MedicalImage Analysis 8 (3), 197–203.
ter Haar Romeny, B.M., 2003. Front-end vision and multi-scale imageanalysis. In: Computational Imaging and Vision, vol. 27. KluwerAcademic Publishers, Dordrecht, The Netherlands.
Tuch, D.S., Reese, T.G., Wiegell, M.R., Makris, N., Belliveau, J.W.,Wedeen, V.J., 2002. High angular resolution diffusion imaging revealsintravoxel white matter fiber heterogeneity. Magnetic Resonance inMedicine 48, 577–582.
Tuch, D.S., Salat, D.H., Wisco, J.J., Zaleta, A.K., Hevelone, N.D., Rosas,H.D., 2005. Choice reaction time performance correlates with diffusionanisotropy in white matter pathways supporting visuospatial attention.Proceedings of the National Academy of Sciences 102 (34), 12212–12217.
Zhang, S., Correia, S., Tate, D.F., Laidlaw, D.H., 2006. Correlating DTIfiber clusters with white-matter anatomy. In: ProceedingsInternational Society for Magnetic Resonance in Medicine (ISMRM),p. 442.


![arXiv:1205.4220v2 [cs.MA] 5 May 2013 · 3. Distributed Optimization via Diffusion Strategies. 4. Adaptive Diffusion Strategies. 5. Performance of Steepest-Descent Diffusion Strategies.](https://static.fdocuments.in/doc/165x107/602e1f84e58e05019f17db5f/arxiv12054220v2-csma-5-may-2013-3-distributed-optimization-via-diiusion.jpg)