Deliberate disengagement: How education decreases...
39
Working Paper No. 156 Deliberate disengagement: How education decreases political participation in electoral authoritarian regimes by Kevin Croke, Guy Grossman, Horacio A. Larreguy, and John Marshall | April 2015
Transcript of Deliberate disengagement: How education decreases...
Working Paper No. 156
Deliberate disengagement:
How education decreases political
participation in electoral
authoritarian regimes
by Kevin Croke, Guy Grossman, Horacio A. Larreguy,
and John Marshall | April 2015
Afrobarometer Working Papers
Copyright © Afrobarometer 2015 2
Working Paper No. 156
Deliberate disengagement:
How education decreases political
participation in electoral
authoritarian regimes
by Kevin Croke, Guy Grossman, Horacio A. Larreguy,
and John Marshall | April 2015
Kevin Croke is a post-doctoral fellow in the Department of Global Health and Population, Harvard School of Public Health. Email: [email protected] Guy Grossman is an assistant professor in the Department of Political Science, University of Pennsylvania. Email: [email protected]. Horacio A. Larreguy is an assistant professor in the Department of Government, Harvard University. Email: [email protected]. John Marshall is a doctoral candidate in the Department of Government, Harvard University. Email: [email protected].
Abstract
A large literature examining advanced and consolidating democracies suggests that education increases political participation. However, in electoral authoritarian regimes, educated voters may instead deliberately disengage. If education increases critical capacities, political awareness, and support for democracy, educated citizens may believe that participation is futile or legitimates autocrats. We test this argument in Zimbabwe – a paradigmatic electoral authoritarian regime – by exploiting cross-cohort variation in access to education following a major educational reform. We find that education decreases political participation, substantially reducing the likelihood that better-educated citizens vote, contact politicians, or attend community meetings. Consistent with deliberate disengagement, education’s negative effect on participation dissipated following 2008’s more competitive election, which (temporarily) initiated unprecedented power sharing. Supporting the mechanisms underpinning our hypothesis, educated citizens experience better economic outcomes, are more interested in politics and more supportive of democracy, but are also more likely to criticize the government and support opposition parties.
Acknowledgements
This article benefited from helpful conversations with, and suggestions from, Karen Grépin, Patrick O’Halloran, Marc Meredith, and participants at the Boston Working Group in African Political Economy.
Afrobarometer Working Papers
Copyright © Afrobarometer 2015 1
Introduction
The question of what motivates political participation is central to political science. Participation is
essential for holding governments to account and for influencing incumbents to implement the
policies that citizens demand. A vast literature asserts that education is a major driver of political
participation, as well as many other forms of non-contentious civic action (Almond & Verba, 1963).
La Due Lake and Huckfeldt (1998:567) argue that the positive relationship between education and
political participation is “one of the most reliable results in empirical social science.” In a similar
vein, Hillygus (2005:25) states that the idea that education is a primary driver of increased political
participation is “largely uncontested,” while Putnam (1995:68) posits that education “is the best
individual level predictor of participation.”
There are, however, several problems with these law-like assertions. First, isolating the effect of
education – as distinct from innate ability (Spence, 1973), socioeconomic status (Jennings & Niemi,
1968), and family background (Nie, Junn, & Stehlik-Barry, 1996) – on political participation is a
formidable challenge. Debates between “education as cause” vs. “education as proxy” remain
far from settled (Berinsky & Lenz, 2011; Kam & Palmer, 2008). Second, with few exceptions, the
existing empirical literature investigating the causal link between education and political
participation has generally focused on a small set of rich advanced democracies (Sondheimer &
Green, 2010). This is problematic, because existing accounts of the positive effect of education on
participation implicitly assume that countries have an institutional environment and a civic culture
that might be absent in many developing countries.
Third, analyses in developing countries have primarily focused on aggregate correlations between
education and the likelihood that autocratic regimes transition to democracy.1 Here, too, scholars
have long assumed that education is a critical driver of political participation. For example,
Deutsch (1961), Lerner (1958), and Lipset (1959) all posited that more-educated citizens are central
to democracy. Indeed, Huntington (1991) explicitly claimed that education contributed to the
“Third Wave of Democratization” in the 1970s and 1980s. Given that the nature of dictatorial
regimes has dramatically changed over the past two decades (Schedler, 2013), and considering
the dearth of individual-level analyses in this area, the nature of the relationship between
education and nonviolent political participation in electoral authoritarian settings remains poorly
understood.
We address this gap in the literature by examining the causal relationship between education and
non-contentious political participation under electoral authoritarianism. Electoral authoritarian
regimes are a hybrid: While they permit some popular participation and elite contestation by
holding periodic elections, they fall a long way short of genuine democracy. In such regimes,
elections – while not purely pro forma – are far from fair, the government is almost assured of
remaining in power, and many other forms of political action are closely monitored (and often
limited) by the regime (Levitsky & Way, 2010). What political role do more-educated citizens play in
such contexts? We argue that the positive relationship between education and political
participation does not necessarily apply in electoral authoritarian settings. We further argue that in
electoral authoritarian regimes, education can be associated with decreased political
participation, even when education – as modernization theorists have long assumed – increases
interest in politics, support for democracy, and economic status.
1 See e.g. Acemoglu et al. (2005); Glaeser, Ponzetto, & Shleifer (2007); and Murtin & Wacziarg (2014). A small literature has instead examined education’s effect on violent forms of protest (Campante & Chor, 2012b; Samii & West, 2014).
Afrobarometer Working Papers
Copyright © Afrobarometer 2015 2
Political participation in democratic settings can be understood as the embodiment of the liberal
notion of free will (Rousseau, 1997). The act of voting, in particular, has been viewed as a
manifestation of political equality and individual agency (Lijphart, 1997). Yet in many non-
democratic settings, regimes compel political participation as a demonstration of allegiance,
rather than to aggregate social preferences or enable citizen voice (Hermet, 1978).2 Elections in
electoral authoritarian regimes seek to legitimize incumbents, appease the international
community, and demonstrate the omnipresence of the regime (Levitsky & Way, 2002). Under such
conditions, political participation loses both its normative and instrumental appeals for many.
When participation does not provide genuine input into the political process, or when it merely
serves to buttress the regime, refraining from political participation can serve as a powerful form of
dissent (Hermet, 1978; Karklins, 1986) or reflect the recognition that costly political action is futile
(Posner & Simon, 2002). This study’s key insight is that more-educated citizens are more likely to
exercise such deliberate political disengagement. First, education imbues citizens with cognitive
abilities that facilitate more critical thinking, which may result in lower levels of support for the
incumbent regime and thus less interest in legitimizing it with their participation.3 Second, education
may similarly lead to value change, with more-educated individuals placing a higher premium on
democratic values such as self-expression and individual voice than on social conformity (Inglehart
& Welzel, 2005). Third, if education also increases knowledge and understanding of politics,
educated voters may be more aware that political participation is unlikely to affect political
outcomes. Fourth, educated individuals may feel a higher level of disillusionment with autocratic
politics and economic mismanagement, given their greater economic potential (Campante &
Chor, 2012a).
We test our disengagement argument using the case of Zimbabwe, a paradigmatic electoral
authoritarian regime ruled by President Robert Mugabe and a civilian-military junta (Levitsky &
Way, 2010). While elections have been held regularly since 1980, the incumbent regime has used a
combination of intimidation, violence, manipulation of legal rules, and vote rigging to maintain
power. Thus, as in many electoral authoritarian regimes, elections in Zimbabwe provide some
restricted opportunities for public opinion to be registered without offering voters a genuine ability
to determine the ultimate distribution of power. The 2008 election was more competitive, ultimately
producing a power-sharing arrangement between Mugabe and opposition leader Morgan
Tsvangirai, and thus presents a valuable opportunity to compare the effects of education in more
and less politically competitive contexts.
Furthermore, Zimbabwe is an excellent case study because we are able to leverage a major
policy reform to identify the causal relationship between education and participation. Immediately
after majority rule was achieved in 1980, Zimbabwe implemented a far-reaching education reform
that greatly increased access to education. The reform substantially increased access to
secondary education for black students and induced some students to remedially attend primary
school. We exploit this natural experiment to analyse the effects of education by comparing
cohorts that were just young enough to enjoy greater access to secondary education to those
that were just too old. To deal with non-compliance across cohorts, we also estimate instrumental
variable (IV) regressions. Our primary result is that, in Zimbabwe, education reduces levels of
political participation.
2 This may be true in a broad range of African settings. Using Afrobarometer data, Bratton, Mattes, and Gyimah-Boadi (2005) find that “political participation – or at least voting, communing, and contacting – is predominantly mobilized” from above, rather than autonomous. 3 E.g. educated citizens may be able to critically evaluate regime propaganda, or may have the interest or financial means to access more critical foreign media.
Afrobarometer Working Papers
Copyright © Afrobarometer 2015 3
Contrary to the conventional wisdom, a higher level of education reduces not only voting, but also
other forms of non-contentious participation such as contacting one’s local councillor and
attending community meetings. Consistent with our argument that non-participation appears to
be an informed choice by relatively cognizant and politically aware citizens, we find that
education significantly increases economic well-being, interest in politics, and support for
democracy. Furthermore, consistent with the idea that education facilitates critical thinking, we
also find that increased education decreases support for the ruling party, reduces perceptions of
government performance, and increases support for the main opposition party. Finally, compatible
with the idea that educated citizens will re-engage with politics when the political sphere allows for
more meaningful contestation, we show that the large negative relationship between education
and participation weakens significantly after the 2008 election. We interpret these findings as
evidence that educated citizens consciously choose to withdraw from the political sphere under
electoral authoritarianism.
To increase confidence in our interpretation of these results, we examine two plausible alternative
explanations for our findings. First, we rule out the possibility that more-educated constituents are
less integrated into patronage or vote-buying mobilization networks, which could also lead to
lower turnout. Second, we show that there is no evidence in our data that educated constituents
are more likely to face violent repression intended to suppress participation.
This article’s main contribution is to the vast literature on the relationship between education and
political participation. Notwithstanding the centrality of education in political theories of
democratic citizenship, much is still unknown about the nature of the relationship between
educational attainment and political attitudes and behaviour. If education reduces political
participation in electoral authoritarian regimes, this provides an additional qualification to the
literature that commonly assumes a law-like positive relationship.4 We show that education
increases the ability of citizens to participate in politics and leads to greater interest in politics.
However, our findings suggest that whether citizens decide to use these facilities or “deliberately
withdraw” from the political arena is likely to depend on regime type. The article also contributes to
the literature on political participation in developing countries, especially that which focuses on
attitudes rather than resources as the key determinant of participation (e.g. Norris, 2002; Cox, 2003;
Kasara & Suryanarayan, 2014).
Finally, our results demonstrate that the impact of education might be conditional on a country’s
level of political contestation, which speaks to a growing cross-country literature that seeks to
isolate the impact of education on democracy (Acemoglu et al., 2005; Glaeser, Ponzetto, &
Shleifer, 2007; Woodberry, 2012). By discussing why those seen by modernization theorists as
“agents of change” withdraw from politics, this paper also suggests one reason why – contrary to
the expectation of the democratic-transition literature – many countries that took initial steps
toward liberalization got “stuck” in electoral authoritarian equilibria (Carothers, 2002). As such, our
findings also contribute to our understanding of regime stability and change theories.
Related literature
The relationship between education and political participation in advanced democracies is the
subject of a vast literature. Whereas early work suffered from insufficient attention to causal
identification, a number of recent studies have identified a positive effect of education on political
4 See Berinsky and Lenz (2011) for a comprehensive review of recent challenges to the traditional view that education has a uniform positive effect in the American context.
Afrobarometer Working Papers
Copyright © Afrobarometer 2015 4
participation in the developed world.5 In developing countries in general, and in Africa in
particular, there is a rich descriptive literature. For example, Evans and Rose (2006; 2007) find cross-
sectional associations between education and support for democracy in Africa, while Mattes and
Mughogho (2009) explore correlations between education, cognitive engagement, and
participation in politics. While this literature documents associations between education, political
attitudes, and participation, the study of the causal effect of education in developing countries is
somewhat less developed. Furthermore, none of the recent studies that attempt to identify a
causal relationship between education and participation in developing countries have examined
this question in the context of a repressive electoral authoritarian regime.6
Friedman et al. (2011) use a field experiment in western Kenya to study the effect of an increase in
education induced by a secondary school girls scholarship program. They find that secondary
education made young women from disadvantaged ethnic groups in rural areas more politically
informed, less deferential to political authority, and more likely to reject gender-based violence.
They do not find, however, that secondary education increases support for democracy,
community participation, political efficacy, or voting. Despite its innovative design, the study only
measures outcomes four to five years after initial enrolment and examines an unrepresentative
population. Given the comprehensiveness of Zimbabwe’s education reform, we are able to
identify mass public education’s long-term effects for a wide range of compliers (from a
representative sample) that small-scale field experiments cannot reach.
Our findings speak most directly to two recent working papers that examine the long-term political
effects of education. Wantchekon, Novta, and Klašnja (2013) use the placement of the first
missionary schools in Benin as a plausible source of exogenous variation in access to education.
They find that both the first generation of formally educated Beninois and their descendants are
more likely to join and campaign for political parties. They do not, however, report results regarding
voting behaviour and political attitudes, perhaps because their main focus is education’s effect on
well-being. Larreguy and Marshall (2014) exploit Nigeria’s 1976 education reform to show that
increased educational attainment causes more political participation in the form of voting,
contacting politicians, attending community meetings, and devoting attention to political events.7
While the above papers arguably identify the impact of education on political participation, they
all examine this relationship in contexts of genuine political contestation. While Benin, Kenya, and
Nigeria cannot be classified as consolidated democracies, they have experienced competitive
elections and turnovers of executive power in recent years.8 Zimbabwe, by contrast, has had no
alternation in executive power since majority rule was achieved in 1980, and election rigging has
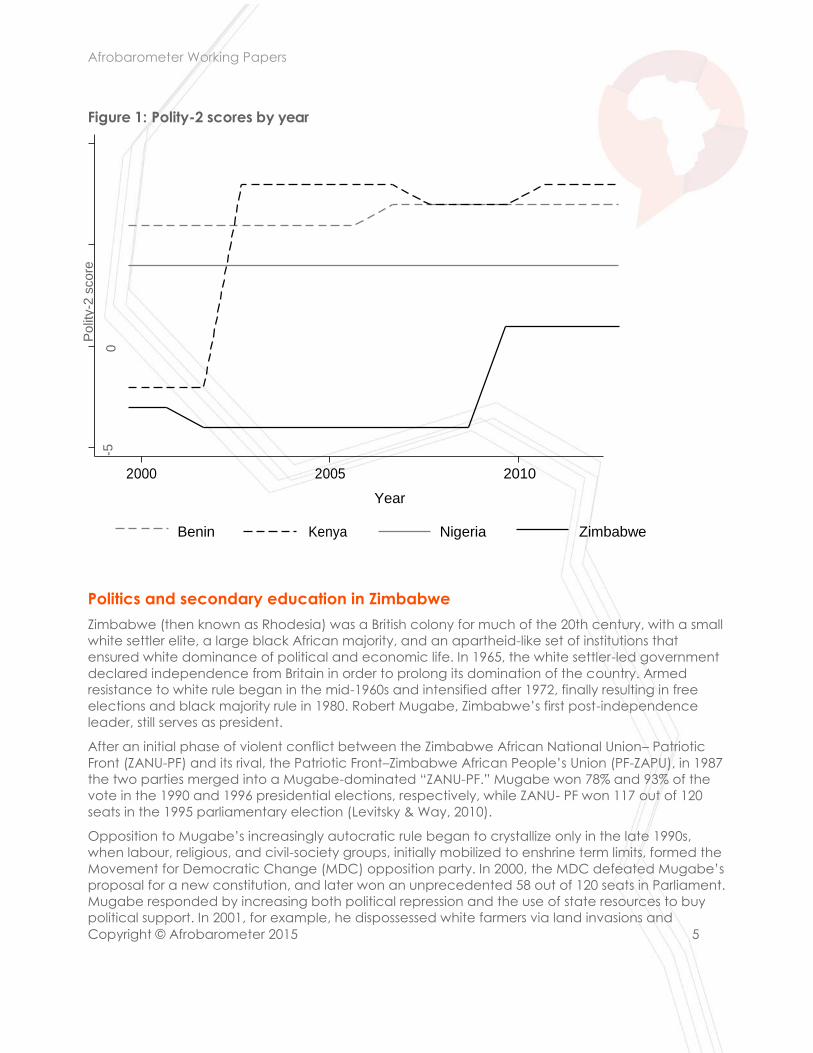
been widespread since 2002. These differences are reflected, for example, in Zimbabwe’s Polity-2
score, which is significantly lower than those of Kenya, Benin, and Nigeria during the period
covered by Afrobarometer (see Figure 1). Nevertheless, the level of contestation in Zimbabwe is
not constant: The increase in the Polity score following the 2008 election reflects an important
period of power sharing in which genuine change appeared possible.
5 Causal evidence for a positive relationship in developed countries includes Dee (2004), Persson (2011), and Sondheimer and Green (2010). Nevertheless, Berinsky and Lenz (2011), Kam and Palmer (2008), and Tenn (2007) provide evidence that not all types of schooling increase political participation. 6 See Kuenzi (2006), Kuenzi and Lambright (2005), and MacLean (2011). 7 Our cohort-specific identification strategy is related also to work by Mattes (2011) and Mattes and Richmond (2015), who explore the ways in which achievement of majority rule has affected political attitudes among the post-apartheid generation in South Africa. 8 Benin and Kenya have experienced opposition electoral victories. In Nigeria, presidential power has alternated between northerners and southerners within the ruling party since the return to democracy in 1999.
Afrobarometer Working Papers
Copyright © Afrobarometer 2015 5
Figure 1: Polity-2 scores by year
2000 2005 2010
Year
Benin Kenya Nigeria Zimbabwe
Politics and secondary education in Zimbabwe
Zimbabwe (then known as Rhodesia) was a British colony for much of the 20th century, with a small
white settler elite, a large black African majority, and an apartheid-like set of institutions that
ensured white dominance of political and economic life. In 1965, the white settler-led government
declared independence from Britain in order to prolong its domination of the country. Armed
resistance to white rule began in the mid-1960s and intensified after 1972, finally resulting in free
elections and black majority rule in 1980. Robert Mugabe, Zimbabwe’s first post-independence
leader, still serves as president.
After an initial phase of violent conflict between the Zimbabwe African National Union– Patriotic
Front (ZANU-PF) and its rival, the Patriotic Front–Zimbabwe African People’s Union (PF-ZAPU), in 1987
the two parties merged into a Mugabe-dominated “ZANU-PF.” Mugabe won 78% and 93% of the
vote in the 1990 and 1996 presidential elections, respectively, while ZANU- PF won 117 out of 120
seats in the 1995 parliamentary election (Levitsky & Way, 2010).
Opposition to Mugabe’s increasingly autocratic rule began to crystallize only in the late 1990s,
when labour, religious, and civil-society groups, initially mobilized to enshrine term limits, formed the
Movement for Democratic Change (MDC) opposition party. In 2000, the MDC defeated Mugabe’s
proposal for a new constitution, and later won an unprecedented 58 out of 120 seats in Parliament.
Mugabe responded by increasing both political repression and the use of state resources to buy
political support. In 2001, for example, he dispossessed white farmers via land invasions and
Polit
y-2
score
-5
0
Afrobarometer Working Papers
Copyright © Afrobarometer 2015 6
handed their farms over to ZANU-PF allies. In the 2002 presidential elections, Mugabe defeated
Tsvangirai – the MDC presidential candidate – with 56% of the vote amid violence and widespread
vote suppression (LeBas, 2006). Immediately after the 2005 parliamentary elections, in which ZANU-
PF won 65% of the parliamentary constituencies against an internally divided MDC (Bratton, 2014),
Mugabe launched Operation Murambatsvina (“Drive Out the Rubbish”), which displaced more
than 700,000 people from informal urban settlements.
The 2008 elections took place in a context of agricultural collapse and macroeconomic instability,
with hyperinflation at an annual rate of 231,000,000% (Bratton, 2014). Benefiting from (initially) lower
levels of election-related violence than in 2002 (Levitsky & Way, 2010), the MDC won an outright
parliamentary majority. Tsvangirai outpolled Mugabe in the first round of the presidential election,
but the electoral commission stated that he did not achieve the 50% threshold required for victory.
Prior to the second round, ZANU-PF and the military launched a brutal campaign of intimidation
and beatings against MDC supporters and candidates, and Tsvangirai withdrew from the race.
Mugabe won the resulting sham election by a landslide, but international pressure forced a
government of national unity, with Mugabe as president and Tsvangirai as prime minister (LeBas,
2014).
The national unity government and the end of hyperinflation allowed the economy to rebound
somewhat after 2009, and political violence declined. Yet despite the facade of power sharing,
ZANU-PF retained de facto control, while internal divisions weakened the MDC. The 2013 elections
marked the return of ZANU-PF dominance, as Mugabe comfortably beat Tsvangirai and won 70%
of parliamentary seats (LeBas, 2014).
The education reform of 1980
Prior to independence, access to education for the black community was deliberately restricted.
While schooling was compulsory and free for whites (until age 15), black Zimbabweans – who were
not required to attend school – had to pay high school fees. In addition, black Zimbabweans were
required to pass a series of increasingly difficult exams in order to continue past primary school,
while continuation to the first cycle of secondary school was automatic for whites. The education
budget for black Zimbabweans was tightly controlled at 2% of GDP, while out-of-pocket secondary
school tuition and boarding fees cost almost two months of the average wage.9 The government
spent about 12 times more per capita on primary schooling for whites than for blacks (Dorsey,
1989). King (2013) documents that such discriminative policies were implemented in many African
colonies, which had come to associate education with greater unrest.
Starting in April 1980, the ZANU government implemented a wide-ranging set of educational
reforms. Primary education was made free and compulsory for all Zimbabweans, regardless of
colour. While some fees were applied for secondary school, automatic progression from primary to
secondary school was decreed.10 Furthermore, age barriers were removed for older children,
allowing those who did not start school on time to attend. The government also undertook a large-
scale school-building campaign and reopened schools that had been closed during the
independence war. The number of primary schools almost doubled (from 2,401 to 4,291) between
1980 and 1986, while the number of secondary schools increased seven-fold, from 177 to 1,276
(Bourne, 2011).
9 Authors’ calculation based on 1979 school fee data and 1977 wage data from Riddell (1980). 10 Riddell (1980) estimates that fees at more distant boarding schools were twice as high as tuition fees for secondary schooling around 1979.
Afrobarometer Working Papers
Copyright © Afrobarometer 2015 7
500 Enrollment
Form 1
400
300
200
100
0
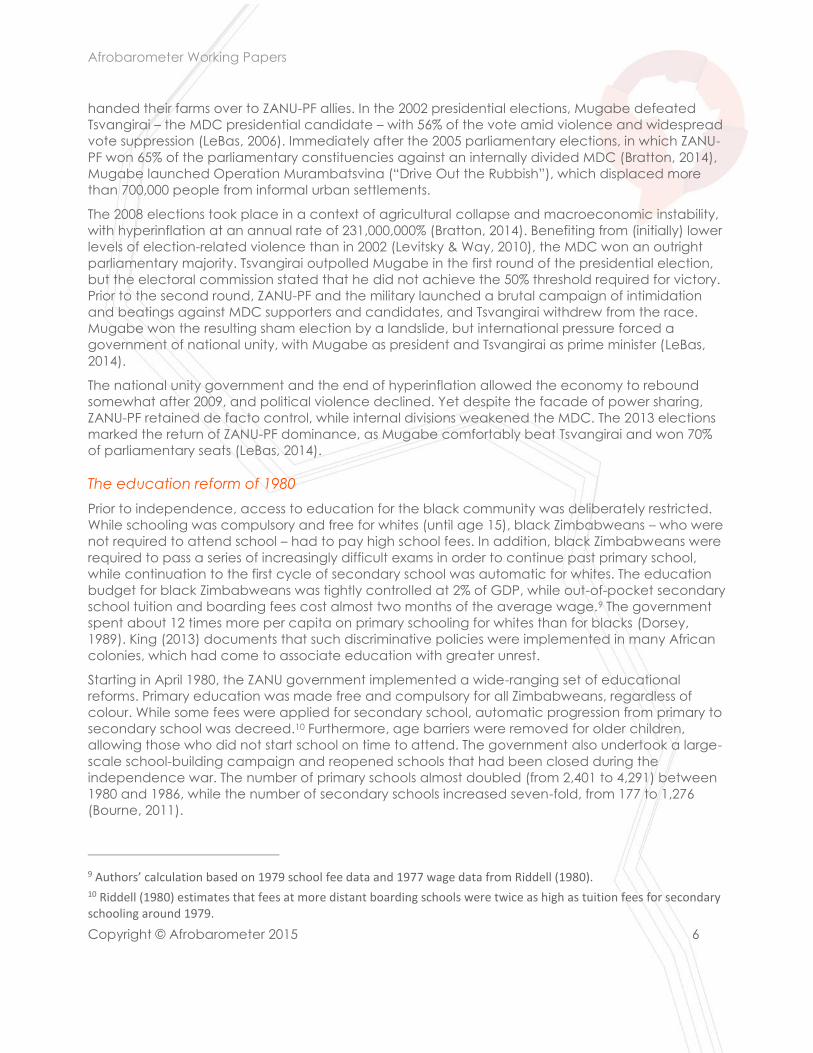
The reform had an immediate effect: Overall student enrolment doubled in one year (Narman,
2003). As Figure 2 illustrates, this increase was most dramatic for secondary enrolment, which rose
from 66,215 students in 1979 (7% of students) to 537,427 (19% of students) in 1986. The change is also
apparent in the primary-secondary progression statistics: While in 1979 only 25% of primary-school
leavers continued to secondary schools, by 1986 78% did.
Figure 2: Number of enrolled students in Form 1 (first year of secondary education) and in
all secondary education grades by year | 1979-1986
Secondary education expansion
Secondary (total)
1980 1982 1984 1986 Source: Government of Zimbabwe, Annual Report of the Secretary of Education, 1986
Based on the nature of Zimbabwe’s education reform, we focus on the expansion of secondary
education.11 Although primary school fees were formally banned, the reform did not significantly
affect primary educational attainment. This is likely because 80% of black Zimbabweans were
already enrolled in primary school even under white rule and because some primary schools
continued charging informal fees (Nhundu, 1992). Had the 1980 reforms significantly affected
primary enrolment, we would observe a sharp discontinuity in education for the cohorts of primary
school starting age in 1980, i.e. those born in 1972-74. However, we find no evidence of a
discontinuity around those birth years (see Figure 5 below).12 The reform’s small effect on primary
11 Agüero and Bharadwaj (2014) and Grépin and Bharadwaj (2014) similarly restrict their focus to secondary school access. 12 Similarly, there is no discontinuous change in education levels for primary-school-aged cohorts for the 1972-74 cohorts in the Demographic and Health Surveys data. See, for example, Grépin and Bharadwaj (2014).
Nu
mb
er
of
en
rolle
d s
tud
en
ts (
in 1
,00
0)
Afrobarometer Working Papers
Copyright © Afrobarometer 2015 8
school completion principally reflects the remedial education of individuals whose education was
interrupted by the war (Narman, 2003).13
Given the rapid expansion, qualified teachers could not be hired quickly enough, instructional
quality often suffered, and school construction lagged behind enrolment, leading to overcrowded
classrooms.14 While some slippage in quality was perhaps inevitable given the speed of the reform,
it remained high enough to deliver substantial material benefits to the reform’s beneficiaries, as we
demonstrate below. Notwithstanding these challenges, Zimbabwe was widely recognized as a
leader in expanding access to education in Africa during the 1980s (Dorsey, 1989) and provides a
unique setting in which to examine the role of education in electoral authoritarian regimes that
allow some restricted political contestation.
Research design
In this section we discuss the data sources, identification strategy, and estimation approaches that
we use to identify the long-term causal effects of Zimbabwe’s education reforms on individual
political participation.
Data
To examine the effects of education on political participation in Zimbabwe, we combine all
available rounds of the Afrobarometer surveys conducted in 1999, 2004, 2005, 2009, 2010, and
2012.15 Since the Afrobarometer questions change across survey rounds, different rounds may be
used to test different outcome measures (see Online Appendix https://sites.sas.upenn.edu/
ggros/files/onlineappendix_v1.pdf). We focus exclusively on black respondents, who comprise the
overwhelming majority of Zimbabwe’s population and were the education reform’s target group.16
Education is our key (endogenous) explanatory variable, which is measured using the following
seven-point ordinal scale: no schooling, incomplete primary, complete primary, incomplete
secondary, complete secondary, incomplete college, complete college. A one-category increase
in the education measure is equivalent to about two to four years of education, given the discrete
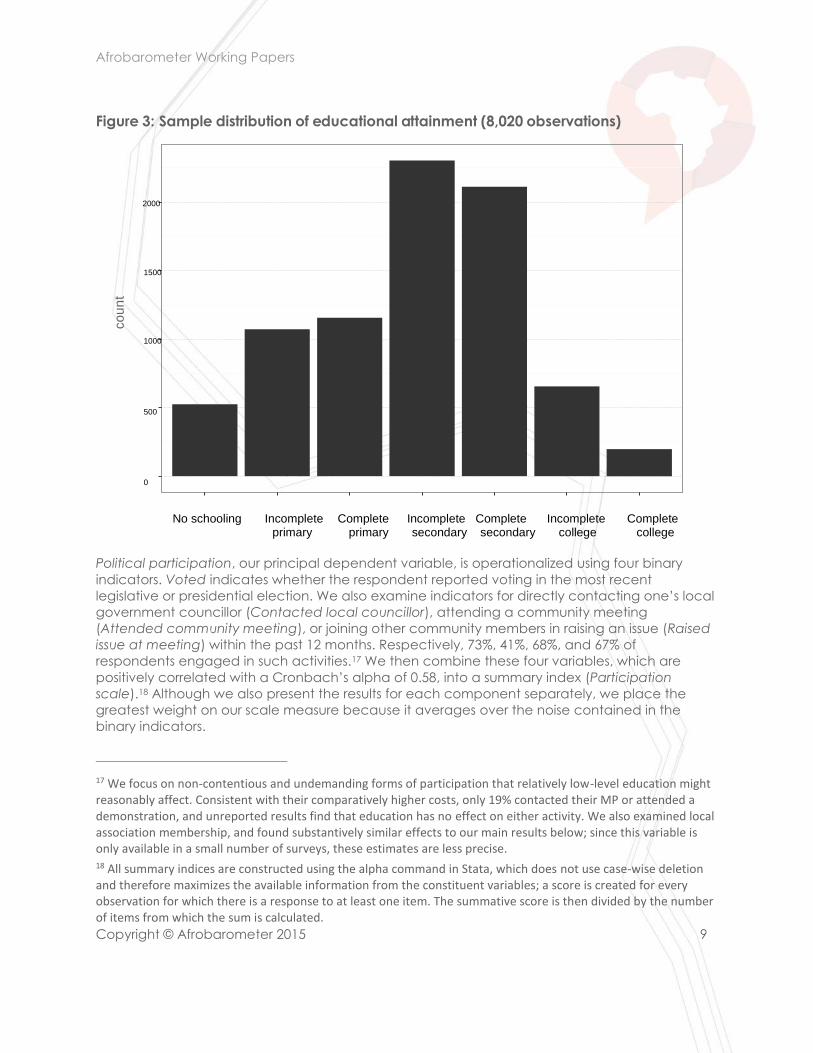
nature of the variable. Figure 3 shows the distribution of this measure in our data, indicating that
the modal level of schooling is incomplete or complete secondary school.
13 This was facilitated by a program allowing teenagers to return to complete primary school on an abbreviated three-year schedule (Chung, 2006). 14 A construction lag could potentially violate our identification assumption if, for example, the lag was correlated with unobserved features of areas that are also correlated with support for the regime. Agüero and Ramachandran (2014), who use a similar identification strategy for health outcomes, show that while some districts indeed opened schools sooner than others, by 1983 all disparities were eliminated. Comparing the educational attainment of those born in districts in which secondary schools opened “earlier” to those born in districts that opened schools “later” shows no difference. Furthermore, Chung (2006) suggests that civil-service reformers resisted pressure to build schools based on political considerations. 15 Afrobarometer conducts nationally representative surveys on the political attitudes of citizens in selected African countries. 16 There were insufficient white voters to conduct a difference-in-differences analysis utilizing the fact that the education reform was specifically targeted at Zimbabwe’s black population. However, Agüero and Ramachandran (2014) report that, using 2002 census data, there is no jump in education for white Zimbabweans at the 1980 threshold.
Afrobarometer Working Papers
Copyright © Afrobarometer 2015 9
Figure 3: Sample distribution of educational attainment (8,020 observations)
2000
1500
1000
500
0
No schooling Incomplete Complete Incomplete Complete Incomplete Complete primary primary secondary secondary college college
Political participation, our principal dependent variable, is operationalized using four binary
indicators. Voted indicates whether the respondent reported voting in the most recent
legislative or presidential election. We also examine indicators for directly contacting one’s local
government councillor (Contacted local councillor), attending a community meeting
(Attended community meeting), or joining other community members in raising an issue (Raised
issue at meeting) within the past 12 months. Respectively, 73%, 41%, 68%, and 67% of
respondents engaged in such activities.17 We then combine these four variables, which are
positively correlated with a Cronbach’s alpha of 0.58, into a summary index (Participation
scale).18 Although we also present the results for each component separately, we place the
greatest weight on our scale measure because it averages over the noise contained in the
binary indicators.
17 We focus on non-contentious and undemanding forms of participation that relatively low-level education might reasonably affect. Consistent with their comparatively higher costs, only 19% contacted their MP or attended a demonstration, and unreported results find that education has no effect on either activity. We also examined local association membership, and found substantively similar effects to our main results below; since this variable is only available in a small number of surveys, these estimates are less precise. 18 All summary indices are constructed using the alpha command in Stata, which does not use case-wise deletion and therefore maximizes the available information from the constituent variables; a score is created for every observation for which there is a response to at least one item. The summative score is then divided by the number of items from which the sum is calculated.
co
un
t
Afrobarometer Working Papers
Copyright © Afrobarometer 2015 10
Variation in access to secondary schooling
In order to identify the causal effect of educational attainment, we exploit the cross-cohort
variation in access to secondary schooling arising from Zimbabwe’s 1980 education reform.
Specifically, we compare black citizens from cohorts that were just young enough to be fully or
partially affected by the reform to black citizens from cohorts that were just too old to benefit
from the educational expansion.
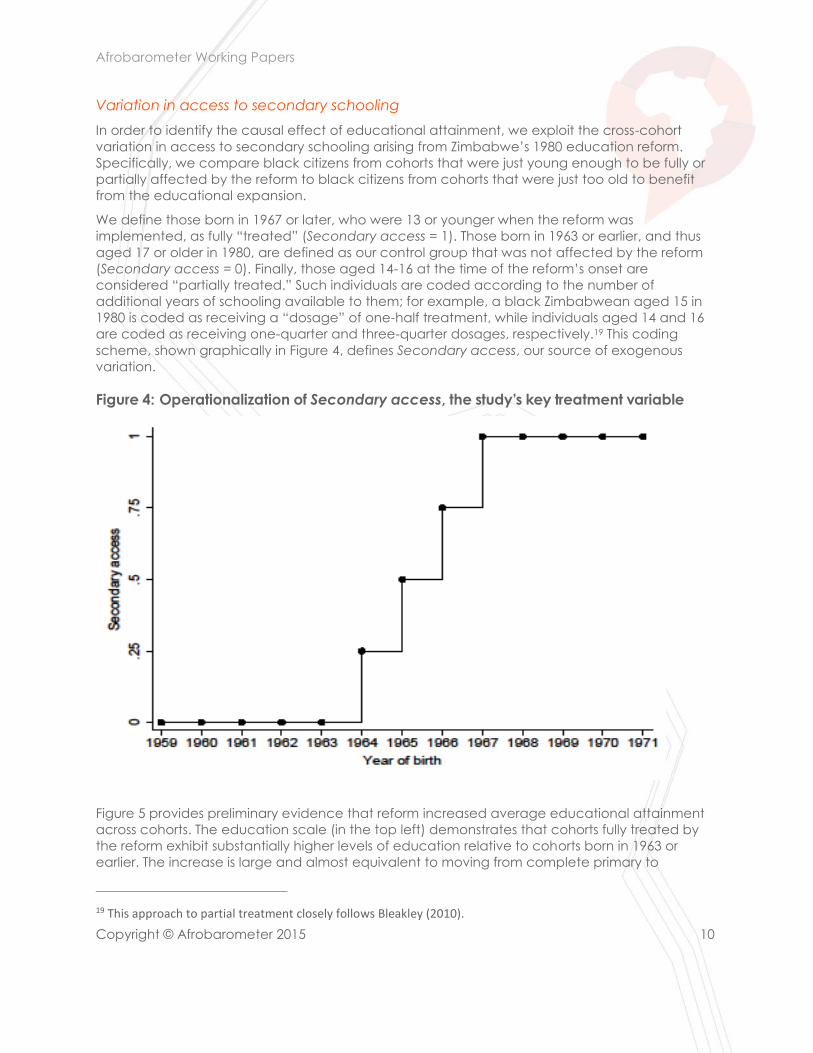
We define those born in 1967 or later, who were 13 or younger when the reform was
implemented, as fully “treated” (Secondary access = 1). Those born in 1963 or earlier, and thus
aged 17 or older in 1980, are defined as our control group that was not affected by the reform
(Secondary access = 0). Finally, those aged 14-16 at the time of the reform’s onset are
considered “partially treated.” Such individuals are coded according to the number of
additional years of schooling available to them; for example, a black Zimbabwean aged 15 in
1980 is coded as receiving a “dosage” of one-half treatment, while individuals aged 14 and 16
are coded as receiving one-quarter and three-quarter dosages, respectively.19 This coding
scheme, shown graphically in Figure 4, defines Secondary access, our source of exogenous
variation.
Figure 4: Operationalization of Secondary access, the study’s key treatment variable
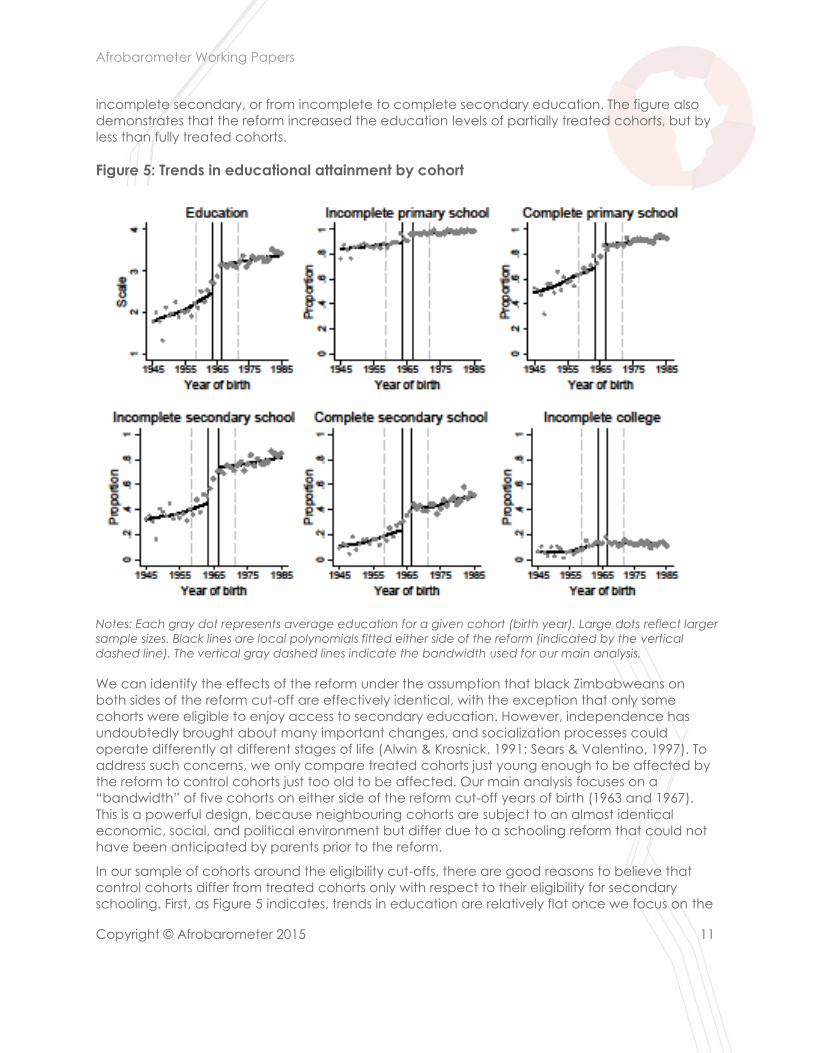
Figure 5 provides preliminary evidence that reform increased average educational attainment
across cohorts. The education scale (in the top left) demonstrates that cohorts fully treated by
the reform exhibit substantially higher levels of education relative to cohorts born in 1963 or
earlier. The increase is large and almost equivalent to moving from complete primary to
19 This approach to partial treatment closely follows Bleakley (2010).
Afrobarometer Working Papers
Copyright © Afrobarometer 2015 11
incomplete secondary, or from incomplete to complete secondary education. The figure also
demonstrates that the reform increased the education levels of partially treated cohorts, but by
less than fully treated cohorts.
Figure 5: Trends in educational attainment by cohort
Notes: Each gray dot represents average education for a given cohort (birth year). Large dots reflect larger
sample sizes. Black lines are local polynomials fitted either side of the reform (indicated by the vertical
dashed line). The vertical gray dashed lines indicate the bandwidth used for our main analysis.
We can identify the effects of the reform under the assumption that black Zimbabweans on
both sides of the reform cut-off are effectively identical, with the exception that only some
cohorts were eligible to enjoy access to secondary education. However, independence has
undoubtedly brought about many important changes, and socialization processes could
operate differently at different stages of life (Alwin & Krosnick, 1991; Sears & Valentino, 1997). To
address such concerns, we only compare treated cohorts just young enough to be affected by
the reform to control cohorts just too old to be affected. Our main analysis focuses on a
“bandwidth” of five cohorts on either side of the reform cut-off years of birth (1963 and 1967).
This is a powerful design, because neighbouring cohorts are subject to an almost identical
economic, social, and political environment but differ due to a schooling reform that could not
have been anticipated by parents prior to the reform.
In our sample of cohorts around the eligibility cut-offs, there are good reasons to believe that
control cohorts differ from treated cohorts only with respect to their eligibility for secondary
schooling. First, as Figure 5 indicates, trends in education are relatively flat once we focus on the
Afrobarometer Working Papers
Copyright © Afrobarometer 2015 12
five cohorts either side of the reform’s cut-off point (inside the gray dashed lines). Below, we also
document flat trends in our political outcomes. Second, our robustness checks demonstrate that
trends across cohorts are not driving our results by varying the bandwidth, using placebo
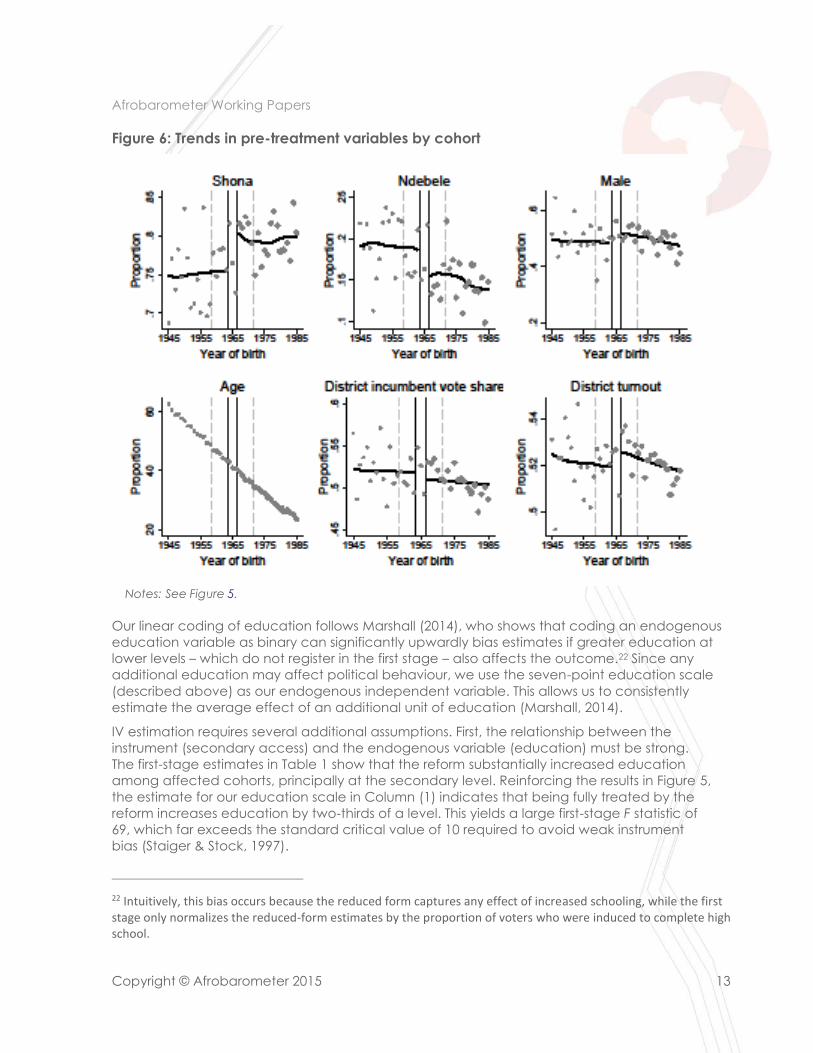
reforms, and including flexible cohort trends either side of the reform. Third, as Figure 6 indicates,
cohorts on either side of the reform are balanced across treatment groups with respect to
gender, age at the date of the survey, and district-level political aggregates. Although there is a
slight imbalance with respect to tribe, we show below that our findings are robust to the inclusion
of pre-treatment covariates and that the effects of access to education do not vary across
tribes. Finally, the frequency of surveyed individuals is not affected by the treatment, suggesting
that there is no differential fertility or migration across cohorts around the reform.20
Estimation strategies
Building on our key identifying assumption that access to secondary schooling is exogenous
across cohorts just affected or just unaffected by the reform, we utilize two main approaches to
identify the long-run effects of secondary education on political participation. Our first approach
includes partially treated respondents, and thus enables us to exploit differences in treatment
intensity (i.e. differential access to secondary schooling) across cohorts that were subject to
essentially identical common shocks. We first estimate the reduced-form effects of increasing
the availability of secondary education – which is equivalent to an “intent-to-treat” (ITT) analysis
– by estimating the following regression equation using ordinary least squares (OLS):
Yicdt = γSecondary accessc + ηt + εicdt (1)
where Yicdt is an outcome measure and Secondary accessc – our key treatment variable – allows
the effect of the education reform to vary across partially treated adolescents. We include
survey fixed effects, ηt, to account for time-varying shocks that impact respondents differently
across survey rounds and cluster standard errors by district.21
Access to public education, however, does not necessarily entail enrolment. Rather, the link
from educational access – an opportunity that equally affects all cohort members – to
educational outcome is probabilistic. This is because not all primary students continue to
secondary school, and because some older individuals returned to school after the war. To
identify the effects of actual education among Zimbabweans who only received additional
education because of the 1980 reform, we use access to secondary schooling to instrument for
education. In our first stage, we estimate the effect of access to secondary education on a
respondent’s educational attainment:
Educationicdt = δ Secondary accessc + ηt + ξicdt (2)
before estimating the following structural equation using two-stage least squares (2SLS):
Yicdt = β Educationicdt + ηt + ςicdt (3)
The IV estimates thus re-scale the reduced form to estimate the effect for black students who
only remained in school because of the reform.
20 Furthermore, the proportion of educated respondents in our surveys does not change after hyperinflation began in the mid-2000s. 21 Our results are robust to “double clustering” simultaneously by both district and cohort.
Afrobarometer Working Papers
Copyright © Afrobarometer 2015 13
Figure 6: Trends in pre-treatment variables by cohort
Notes: See Figure 5.
Our linear coding of education follows Marshall (2014), who shows that coding an endogenous
education variable as binary can significantly upwardly bias estimates if greater education at
lower levels – which do not register in the first stage – also affects the outcome.22 Since any
additional education may affect political behaviour, we use the seven-point education scale
(described above) as our endogenous independent variable. This allows us to consistently
estimate the average effect of an additional unit of education (Marshall, 2014).
IV estimation requires several additional assumptions. First, the relationship between the
instrument (secondary access) and the endogenous variable (education) must be strong.
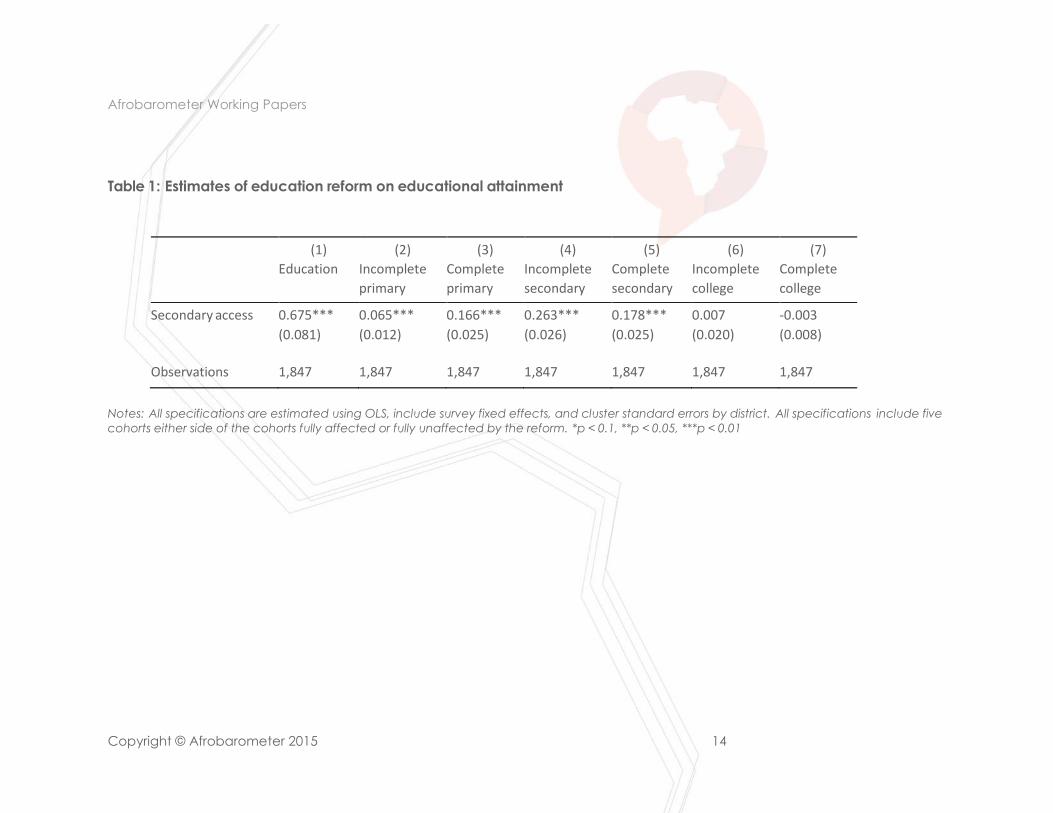
The first-stage estimates in Table 1 show that the reform substantially increased education
among affected cohorts, principally at the secondary level. Reinforcing the results in Figure 5,
the estimate for our education scale in Column (1) indicates that being fully treated by the
reform increases education by two-thirds of a level. This yields a large first-stage F statistic of
69, which far exceeds the standard critical value of 10 required to avoid weak instrument
bias (Staiger & Stock, 1997).
22 Intuitively, this bias occurs because the reduced form captures any effect of increased schooling, while the first stage only normalizes the reduced-form estimates by the proportion of voters who were induced to complete high school.
Afrobarometer Working Papers
Copyright © Afrobarometer 2015 14
Table 1: Estimates of education reform on educational attainment
(1) (2) (3) (4) (5) (6) (7)
Education Incomplete Complete Incomplete Complete Incomplete Complete
primary primary secondary secondary college college
Secondary access 0.675*** 0.065*** 0.166*** 0.263*** 0.178*** 0.007 -0.003
(0.081) (0.012) (0.025) (0.026) (0.025) (0.020) (0.008)
Observations 1,847 1,847 1,847 1,847 1,847 1,847 1,847
Notes: All specifications are estimated using OLS, include survey fixed effects, and cluster standard errors by district. All specifications include five
cohorts either side of the cohorts fully affected or fully unaffected by the reform. *p < 0.1, **p < 0.05, ***p < 0.01
Afrobarometer Working Papers
Copyright © Afrobarometer 2015 15
Second, the exclusion restriction requires that our instrument only affects political outcomes
through increased education. We discuss this assumption in greater detail below.23
Our second approach drops all partially treated respondents, and thus compares only
untreated respondents who were born in 1963 or earlier (i.e. too early to be affected by the
reform) to respondents who were fully treated. This allows us to focus on a sharp discontinuity in
treatment assignment and implement a regression discontinuity (RD) design that relies on the
weaker assumption that potential outcomes are smooth across the discontinuity.24 For this
second approach, we again estimate equations (1) and (3), excluding all partially treated
respondents. Finding consistent results across both approaches should increase confidence in
the study’s findings.
Education and political participation in Zimbabwe
This section presents our main finding: that education reduces political participation in
Zimbabwe, a paradigmatic electoral authoritarian regime. For each measure of participation,
we provide both graphical evidence and regression estimates. Each regression table provides
our reduced-form and IV estimates using both approaches to identification. We then
demonstrate the robustness of our findings.
Main estimates
Contrary to the positive effects of education in advanced democracies (Sondheimer & Green,
2010) and democratic developing country contexts (Larreguy & Marshall, 2014), we find that in
Zimbabwe education substantially and significantly reduces levels of political participation.
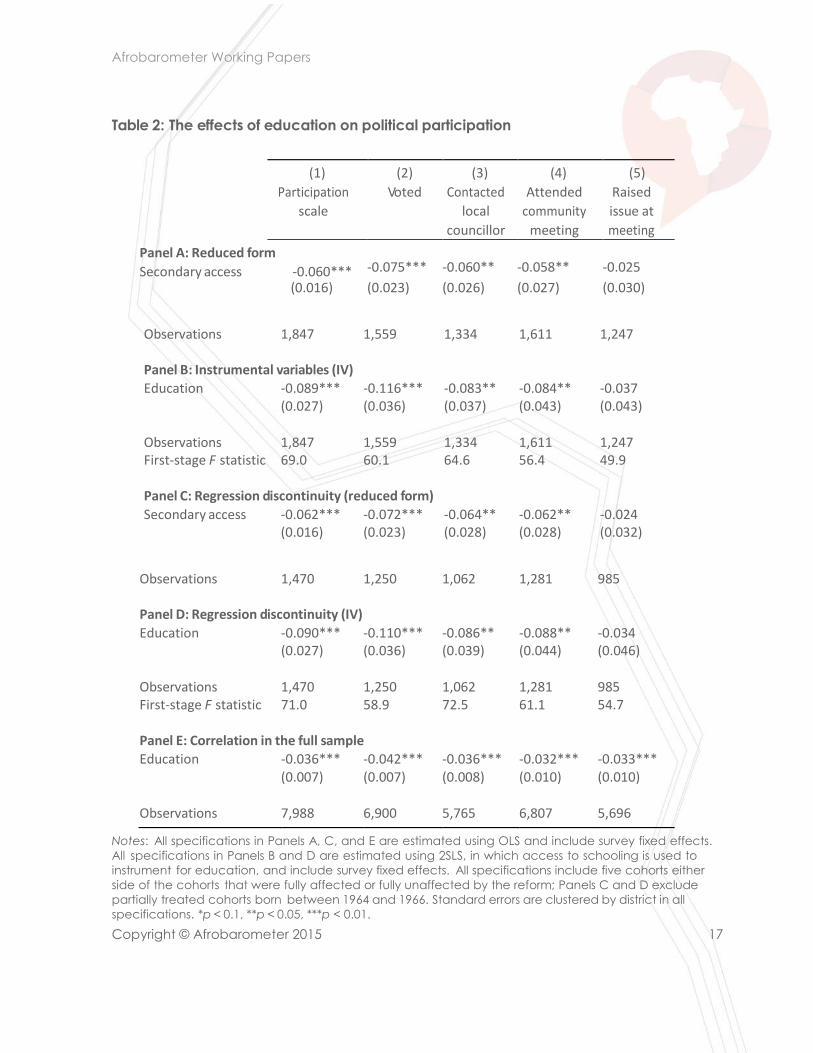
Column (1) in Table 2 reports the estimates for our participation index across all estimation
strategies. Relative to its sample mean of 0.64, Panel A shows that access to secondary
education reduces participation by around 10%. Panel C shows that this estimate is barely
affected by excluding partially treated respondents. The IV estimates in Panels B and D reveal a
similar story: Using both the partially treated and RD approaches, a one-unit increase in
education reduces participation by around 15% relative to its sample mean. Finally, we report
the simple correlation between education and political participation in Panel E in the sample
containing all cohorts, which also shows a negative correlation.25
Importantly, as Table 2 and Figure 7 clearly indicate, the negative effects of education on our
participation index are not simply due to an exceptionally large impact on one constituent
variable. Rather, a one-unit increase in access to secondary schooling and a one-unit increase
in the education scale both cause significant declines in a variety of ordinary forms of political
participation. Specifically, our estimates suggest that being exposed to the full treatment
reduces voting by 8 percentage points, contacting one’s local councillor by 6 percentage
points, attending a community meeting by 6 percentage points, and raising issues with others at
a meeting by 2.5 percentage points. Similarly, a one-unit increase in education attainment
reduces voting by 11 percentage points, contacting a local councillor by 9 percentage points,
attending a community meeting by 9 percentage points, and raising an issue by 3 percentage
points. Across all our specifications, only the decrease in raising an issue is not statistically
significant.
23 There is no reason to suspect that monotonicity is violated. 24 By removing partially treated cohorts, we slightly abuse the RD design, because the running variable is truncated. The RD requires that cohorts born in 1963 are comparable to cohorts born in 1967. 25 Using indicators for each level of education reveals that each level of education further decreases participation until the effect plateaus at the college level.

Afrobarometer Working Papers
Copyright © Afrobarometer 2015 16
Figure 7: Trends in political participation by cohort
Notes: See Figure 5.
Afrobarometer Working Papers
Copyright © Afrobarometer 2015 17
Table 2: The effects of education on political participation
(1)
Participation
scale
(2)
Voted
(3)
Contacted
local
councillor
(4)
Attended
community
meeting
(5)
Raised
issue at
meeting
Panel A: Reduced form
Secondary access -0.060***
-0.075***
-0.060**
-0.058**
-0.025
(0.016) (0.023) (0.026) (0.027) (0.030)
Observations 1,847 1,559 1,334 1,611 1,247 Panel B: Instrumental variables (IV)
Education -0.089*** -0.116*** -0.083** -0.084** -0.037
(0.027) (0.036) (0.037) (0.043) (0.043)
Observations 1,847 1,559 1,334 1,611 1,247 First-stage F statistic 69.0 60.1 64.6 56.4 49.9 Panel C: Regression discontinuity (reduced form)
Secondary access -0.062*** -0.072*** -0.064** -0.062** -0.024
(0.016) (0.023) (0.028) (0.028) (0.032)
Observations 1,470 1,250 1,062 1,281 985 Panel D: Regression discontinuity (IV)
Education -0.090*** -0.110*** -0.086** -0.088** -0.034
(0.027) (0.036) (0.039) (0.044) (0.046)
Observations 1,470 1,250 1,062 1,281 985 First-stage F statistic 71.0 58.9 72.5 61.1 54.7 Panel E: Correlation in the full sample
Education -0.036*** (0.007)
-0.042*** (0.007)
-0.036*** (0.008)
-0.032*** (0.010)
-0.033*** (0.010)
Observations 7,988 6,900 5,765 6,807 5,696
Notes: All specifications in Panels A, C, and E are estimated using OLS and include survey fixed effects.
All specifications in Panels B and D are estimated using 2SLS, in which access to schooling is used to
instrument for education, and include survey fixed effects. All specifications include five cohorts either
side of the cohorts that were fully affected or fully unaffected by the reform; Panels C and D exclude
partially treated cohorts born between 1964 and 1966. Standard errors are clustered by district in all
specifications. *p < 0.1, **p < 0.05, ***p < 0.01.
Afrobarometer Working Papers
Copyright © Afrobarometer 2015 18
Robustness checks
Given that these findings challenge the conventional wisdom that education increases
participation, it is essential to demonstrate their robustness. In Table 3 we present a series of
checks testing our identifying assumptions.
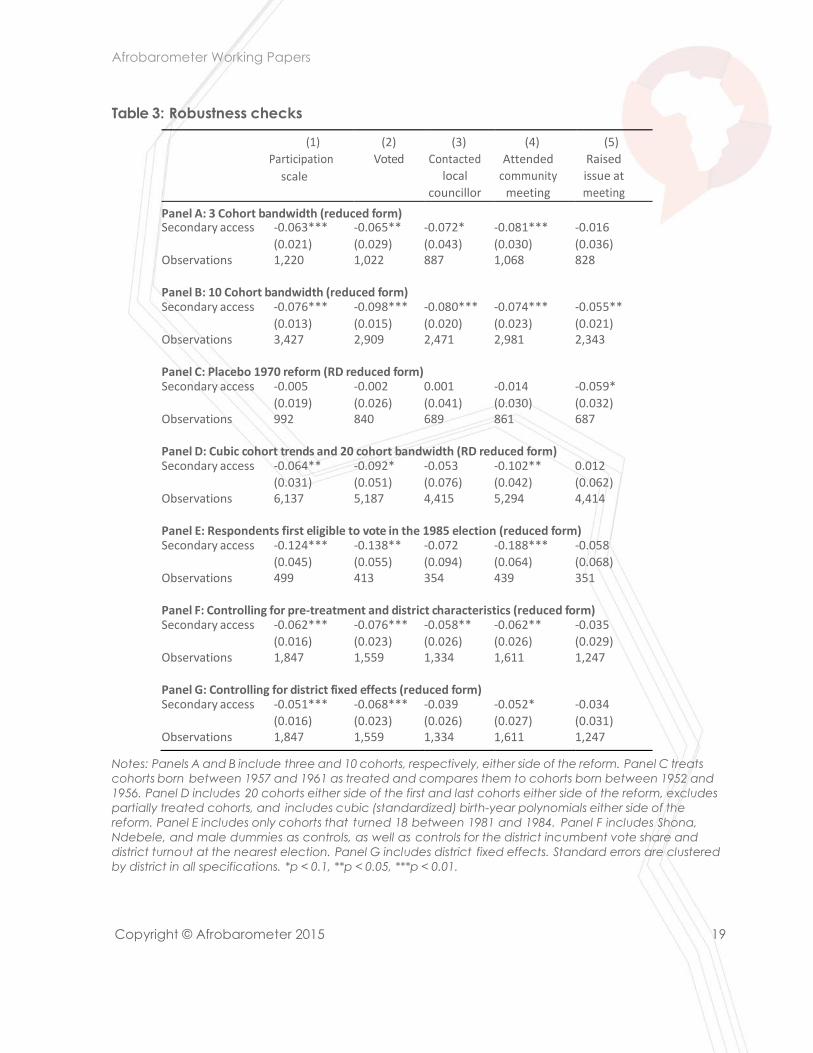
We first show that our results are not an artifact of specification choices or cohort trends. Panels
A and B show that the reduced-form estimates are similar when we include either three or 10
cohorts on either side of the reform eligibility threshold. To address the cohort trends concern, we
employ placebo tests and control flexibly for cohort trends. In Panel C, we examine a placebo
reform in which we estimate the reduced-form effects of a (hypothetical) reform in 1970 and
compare cohorts five years on either side of this arbitrary cut-off. Contrary to the concern that
trends are driving our results, we do not find a reduction in political participation around the
placebo reform save in the case of raising an issue. We find no effects for placebo reforms in
any year between 1960 and 1972.26 Furthermore, Panel D shows that when we include 20
cohorts and cubic polynomial birth-year trends on either side of the reform cut-off, the reduced-
form RD estimates are robust.27
As noted above, plausible confounding explanations must relate to political differences
between the cohorts immediately around the reform eligibility cut-off. First, one potential
concern is a “first election” effect, such that respondents with different levels of treatment
behave differently because they first voted in different elections (Meredith, 2009; Mullainathan &
Washington, 2009). To show that this cannot explain our results, in Panel E we restrict attention to
respondents born between 1963 and 1966 – who were first eligible to vote (at age 18) in the 1985
election – and find that the intensity of secondary access continues to significantly decrease
political participation. Second, a subtler “coming of age” hypothesis is that older students may
have been more cognizant of the independence movement, and their more intense support for
Mugabe’s regime could be manifested in greater participation that has persisted until today.
We thus test whether pro-nationalist sentiments are stronger among our older (untreated)
cohorts. Contrary to this alternative explanation, as the Online Appendix shows, expression of
national identity is instead positively (and insignificantly) associated with secondary access.
Furthermore, persistent differences in support for Mugabe’s regime across cohorts cannot
convincingly explain the differential change in the participation of younger (better-educated)
cohorts following the more competitive 2008 election (see below).
Furthermore, although our design minimizes differences in citizen characteristics around the
reform cut-off, we also show that our results are robust to the inclusion of other potentially
confounding omitted variables. Panel E, which includes the pre-treatment variables described in
Figure 6, yields similar results. In particular, these results suggest that participation is not being
driven by compositional changes in the proportion of Shona and Ndebele respondents. Panel F
demonstrates the robustness of our results to the inclusion of district fixed effects, although
contacting a local councillor falls slightly outside statistical significance. Finally, although
including age fixed effects decreases the precision of our estimates by removing considerable
cross-cohort variation, we show in the Online Appendix that, if anything, the magnitudes of our
negative estimates increase.
26 The most recent placebo is 1972, which allows us to include five cohorts after the placebo reform, including partially treated cohorts. 27 The inclusion of trends on either side of the discontinuity cannot be precisely estimated without extending the bandwidth. However, across all bandwidths, the estimates have similar magnitudes.
Afrobarometer Working Papers
Copyright © Afrobarometer 2015 19
Table 3: Robustness checks
(1)
Participation
scale
(2)
Voted
(3)
Contacted
local
councillor
(4)
Attended
community
meeting
(5)
Raised
issue at
meeting
Panel A: 3 Cohort bandwidth (reduced form) Secondary access -0.063*** -0.065** -0.072* -0.081*** -0.016
(0.021) (0.029) (0.043) (0.030) (0.036) Observations 1,220 1,022 887 1,068 828 Panel B: 10 Cohort bandwidth (reduced form) Secondary access -0.076*** -0.098*** -0.080*** -0.074*** -0.055**
(0.013) (0.015) (0.020) (0.023) (0.021) Observations 3,427 2,909 2,471 2,981 2,343 Panel C: Placebo 1970 reform (RD reduced form) Secondary access -0.005 -0.002 0.001 -0.014 -0.059*
(0.019) (0.026) (0.041) (0.030) (0.032) Observations 992 840 689 861 687 Panel D: Cubic cohort trends and 20 cohort bandwidth (RD reduced form) Secondary access -0.064** -0.092* -0.053 -0.102** 0.012
(0.031) (0.051) (0.076) (0.042) (0.062) Observations 6,137 5,187 4,415 5,294 4,414 Panel E: Respondents first eligible to vote in the 1985 election (reduced form) Secondary access -0.124*** -0.138** -0.072 -0.188*** -0.058
(0.045) (0.055) (0.094) (0.064) (0.068) Observations 499 413 354 439 351 Panel F: Controlling for pre-treatment and district characteristics (reduced form) Secondary access -0.062*** -0.076*** -0.058** -0.062** -0.035
(0.016) (0.023) (0.026) (0.026) (0.029) Observations 1,847 1,559 1,334 1,611 1,247 Panel G: Controlling for district fixed effects (reduced form) Secondary access -0.051*** -0.068*** -0.039 -0.052* -0.034
(0.016) (0.023) (0.026) (0.027) (0.031) Observations 1,847 1,559 1,334 1,611 1,247
Notes: Panels A and B include three and 10 cohorts, respectively, either side of the reform. Panel C treats
cohorts born between 1957 and 1961 as treated and compares them to cohorts born between 1952 and
1956. Panel D includes 20 cohorts either side of the first and last cohorts either side of the reform, excludes
partially treated cohorts, and includes cubic (standardized) birth-year polynomials either side of the
reform. Panel E includes only cohorts that turned 18 between 1981 and 1984. Panel F includes Shona,
Ndebele, and male dummies as controls, as well as controls for the district incumbent vote share and
district turnout at the nearest election. Panel G includes district fixed effects. Standard errors are clustered
by district in all specifications. *p < 0.1, **p < 0.05, ***p < 0.01.
Afrobarometer Working Papers
Copyright © Afrobarometer 2015 20
While our reduced-form (ITT) estimates do not require the exclusion restriction to hold, the IV
estimates do. There are, however, good reasons to believe that the secondary education reform
only affects participation through its effect on educational attainment. First, because education
is highly proximate to the reform itself, most downstream behavioural responses – such as fertility,
marriage, and vocation – are a function of a respondent’s education. Second, the fact that the
decrease in participation levels for partially treated respondents is lower than for fully treated
respondents but higher than for untreated respondents increases our confidence that
participation is responding to changes in actual schooling. If political responses to being
affected by the reform itself were driving the results via some other channel, then it is hard to see
why it would have differentially affected those receiving different instrument dosages. Third, a
typical concern with such reforms is the possibility of cross-cohort spill-overs. However, if cohorts
on either side of the reform cut-off interact with one another, spill-overs are likely to reduce the
effects of schooling as behaviour becomes more homogeneous. Nevertheless, we examine the
sensitivity of our results to arbitrary violations of the exclusion restriction by calculating the extent
of the violation required to nullify our finding. Using Conley, Hansen, and Rossi (2012)’s most
conservative (union of confidence intervals) sensitivity test, 37% of the reduced-form effect must
operate through channels other than education for the 95% confidence interval of our 2SLS
estimate of education’s effect on the participation scale to include zero.
Deliberate disengagement: Testable implications
Why are more-educated Zimbabweans less likely to be politically active? This section tests the
observable implications of our argument that in electoral authoritarian regimes, better-
educated citizens – who recognize that their participation will have little effect on policy and
distributive outcomes, yet will grant the regime a semblance of legitimacy – may deliberately
disengage from political participation. Since this theory is difficult to test directly – we do not
have access to the thought processes of our respondents when they are deciding whether (and
how) to participate – we examine empirically the observable implications of the deliberate
disengagement interpretation of our main finding that education reduces political participation
in Zimbabwe’s electoral authoritarian regime.
We propose four testable implications of our deliberate disengagement argument: first, whether
the relationship between education and participation varies as the nature of elections in
Zimbabwe has changed over time; second, whether access to secondary education indeed
increases the economic welfare of the cohorts that benefited from it; third, whether education
has a positive effect on attitudes that are closely associated with greater political participation
in advanced democracies, such as political interest and support for democratic institutions; and
fourth, whether education also creates a more critical citizenry, i.e. whether it has a negative
effect on the level of support for the incumbent authoritarian regime. Finally, we rule out
alternative mechanisms that could explain why education decreases participation in
Zimbabwe, such as whether educated constituents demonstrate greater fear of political
violence or whether they are less likely to be targets of electoral mobilization efforts.
For each test we present regression results in tabular form for both a summary index (when
Cronbach’s alpha exceeds 0.4) and for the index’s constituent variables. Graphical results are
provided in the Online Appendix.
Participation during competitive and non-competitive elections
We begin testing our deliberate disengagement argument by comparing survey rounds before
and after 2008, which was the first election since 1980 to substantively affect the distribution of
executive power. Zimbabwean elections during the study period (2000, 2002, 2005, and 2008)
Afrobarometer Working Papers
Copyright © Afrobarometer 2015 21
varied significantly in character. Notably, the 2008 elections were the first in which the opposition
obtained a share of power at the national level. The MDC (together with its splinter group,
MDC-M) gained a majority in the House of Assembly, a majority of municipal councils, and some
level of executive power through the internationally brokered national unity government. Thus, if
educated voters are more likely to disengage when they feel that participation is futile or only
serves to legitimate the government, we should also expect them to re-engage when elections
are able to meaningfully influence political outcomes. To explicitly test this expectation, we
compare the effects of education on political participation for respondents who were surveyed
before and after 2009 (the first survey since the 2008 election).28
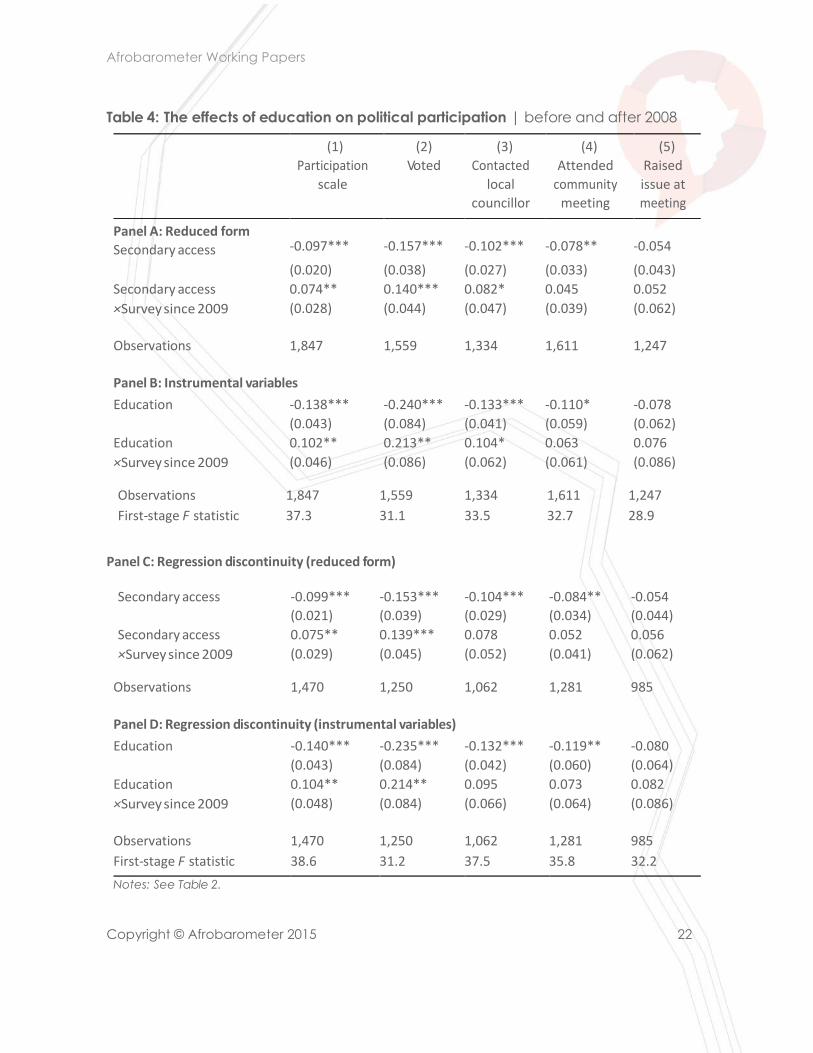
The results, reported in Table 4, suggest that education had different effects before and after
2008. Consistent with our theoretical argument, the effect of education is negative and very
large during the uncompetitive period before 2008. As demonstrated by the positive interaction
term for post-2009 survey responses, the effect of education was essentially zero when elections
affected the distribution of executive power. In no case is access to secondary education
statistically significant for respondents surveyed since 2009, while the difference in coefficients is
statistically significant for voting and contacting a local councillor. These results are also
important because they cannot be easily reconciled with the alternative explanations discussed
above.
Education increases economic outcomes
We continue by showing that education has a positive effect on economic outcomes.
Documenting this relationship serves as a marker that, despite concerns that the rapidly
executed reform diluted the quality of schooling, the education received by post-1980 cohorts
had significant welfare- enhancing implications. It also serves as a proxy for the social skills and
cognitive abilities that are hypothesized to link education to political participation (Hillygus,
2005). According to Rosenstone and Hansen (1993), among others, well-educated voters are
more likely to be politically active because schooling provides the “skills people need to
understand the abstract subject of politics.”
Closely related is the idea that increased cognitive ability leads to increased socioeconomic
status (SES). Increased SES can lead to greater political participation either because some forms
of participation are costly or because higher economic status leads to greater involvement in
social networks, which are entry points into such participation (Verba, Schlozman, & Brady,
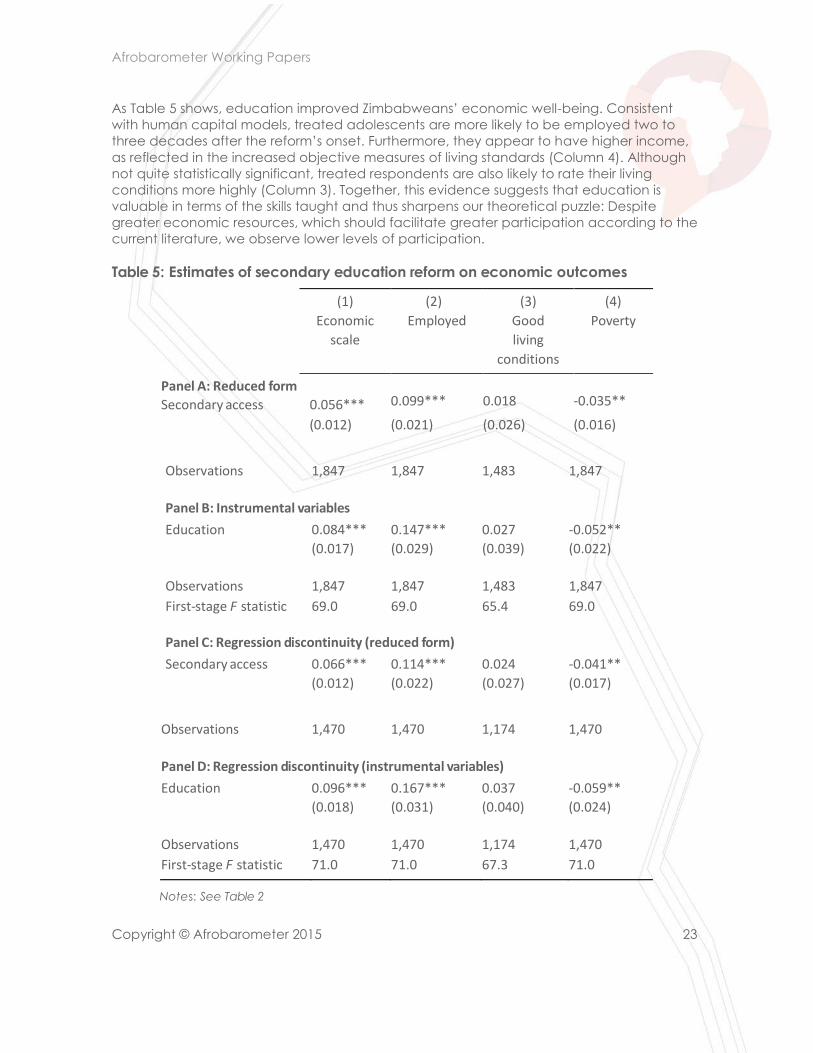
1995). We therefore examine the long-term economic returns of education for black
Zimbabweans in terms of (a) employment (Employed), (b) self-reported living conditions (Good
living conditions), and (c) a more objective poverty scale (Poverty).29 We also combine these
three measures to produce an economic outcomes scale (Economic scale). The Cronbach’s
alpha for this scale is 0.41.
28 Comparing the characteristics of survey respondents before and after 2009, we find no significant differences in gender, tribe (Shona or Ndebele), district incumbent vote share, or education level. The lack of such differences also indicates that any out-migration during Zimbabwe’s economic crisis did not systematically differ by type of survey respondent. 29 The poverty scale combines indicators for whether an individual has gone without food, medicine, or cash in the past year. We note that some of the scales have a relatively low alpha – those results should be handled with greater care and with an eye on the effect on the constituent variables that make up the index.
Afrobarometer Working Papers
Copyright © Afrobarometer 2015 22
Table 4: The effects of education on political participation | before and after 2008
(1)
Participation
scale
(2)
Voted
(3)
Contacted
local
councillor
(4)
Attended
community
meeting
(5)
Raised
issue at
meeting
Panel A: Reduced form
Secondary access
-0.097***
-0.157***
-0.102***
-0.078**
-0.054
(0.020) (0.038) (0.027) (0.033) (0.043)
Secondary access 0.074** 0.140*** 0.082* 0.045 0.052
× Survey since 2009 (0.028) (0.044) (0.047) (0.039) (0.062)
Observations 1,847 1,559 1,334 1,611 1,247
Panel B: Instrumental variables
Education -0.138*** -0.240*** -0.133*** -0.110* -0.078
(0.043) (0.084) (0.041) (0.059) (0.062)
Education 0.102** 0.213** 0.104* 0.063 0.076
× Survey since 2009 (0.046) (0.086) (0.062) (0.061) (0.086)
Observations 1,847 1,559 1,334 1,611 1,247
First-stage F statistic 37.3 31.1 33.5 32.7 28.9
Panel C: Regression discontinuity (reduced form)
Secondary access -0.099*** -0.153*** -0.104*** -0.084** -0.054
(0.021) (0.039) (0.029) (0.034) (0.044)
Secondary access 0.075** 0.139*** 0.078 0.052 0.056
× Survey since 2009 (0.029) (0.045) (0.052) (0.041) (0.062)
Observations 1,470 1,250 1,062 1,281 985
Panel D: Regression discontinuity (instrumental variables)
Education -0.140*** -0.235*** -0.132*** -0.119** -0.080
(0.043) (0.084) (0.042) (0.060) (0.064)
Education 0.104** 0.214** 0.095 0.073 0.082
× Survey since 2009 (0.048) (0.084) (0.066) (0.064) (0.086)
Observations 1,470 1,250 1,062 1,281 985
First-stage F statistic 38.6 31.2 37.5 35.8 32.2
Notes: See Table 2.
Afrobarometer Working Papers
Copyright © Afrobarometer 2015 23
As Table 5 shows, education improved Zimbabweans’ economic well-being. Consistent
with human capital models, treated adolescents are more likely to be employed two to
three decades after the reform’s onset. Furthermore, they appear to have higher income,
as reflected in the increased objective measures of living standards (Column 4). Although
not quite statistically significant, treated respondents are also likely to rate their living
conditions more highly (Column 3). Together, this evidence suggests that education is
valuable in terms of the skills taught and thus sharpens our theoretical puzzle: Despite
greater economic resources, which should facilitate greater participation according to the
current literature, we observe lower levels of participation.
Table 5: Estimates of secondary education reform on economic outcomes
(1) (2) (3) (4)
Economic Employed Good Poverty
scale living
conditions
Panel A: Reduced form
Secondary access 0.056***
0.099***
0.018
-0.035**
(0.012) (0.021) (0.026) (0.016)
Observations 1,847 1,847 1,483 1,847
Panel B: Instrumental variables
Education 0.084*** 0.147*** 0.027 -0.052**
(0.017) (0.029) (0.039) (0.022)
Observations 1,847 1,847 1,483 1,847
First-stage F statistic 69.0 69.0 65.4 69.0
Panel C: Regression discontinuity (reduced form)
Secondary access 0.066*** 0.114*** 0.024 -0.041**
(0.012) (0.022) (0.027) (0.017)
Observations 1,470 1,470 1,174 1,470
Panel D: Regression discontinuity (instrumental variables)
Education 0.096*** 0.167*** 0.037 -0.059**
(0.018) (0.031) (0.040) (0.024)
Observations 1,470 1,470 1,174 1,470
First-stage F statistic 71.0 71.0 67.3 71.0
Notes: See Table 2
Afrobarometer Working Papers
Copyright © Afrobarometer 2015 24
Political interest and support for democratic institutions
Education is also thought to increase interest in politics and support for democratic institutions.
Dating back to Aristotle, through Thomas Jefferson and Tocqueville, it has been argued that
education supports democratic institutions by breeding tolerance and acceptance of others’
opinions. By contrast, Lerner (1958) highlights the impact of education on self-assessment and self-
confidence. In Lerner’s model, educated people in modernizing societies start developing opinions
about public issues, which leads them to believe that they have the ability, and thus should have
the right, to provide input on matters of importance that affect their welfare. This psychological
change, argues Lerner (1958), translates into growing support for inclusive political institutions.
Interest in politics is also important for citizen behaviour, as informed citizens can more accurately
assess government performance and the likelihood that participation can affect political change.
We therefore test whether education increases both interest in politics and support for democratic
institutions. A null finding would be at odds with our “deliberate disengagement” argument.
Political interest is operationalized using three distinct measures. First, News scale combines
indicators for whether respondents are exposed to news from the radio, television, or newspapers
at least once a week. The scale has a Cronbach’s alpha of 0.74. Second, Politics not complicated
is an indicator variable for the 33% of respondents who agree or strongly agree that understanding
politics is not complicated. Third, Discuss politics is an indicator for the 73% of respondents who
report that they occasionally or frequently discuss politics with friends or family. In each case,
higher values suggest greater political interest.
We measure support for democracy in two ways. First, we examine the relationship between
education and Support democracy, an indicator for the 72% of respondents claiming to support or
strongly support democracy. Importantly, this question is not asking respondents whether they
approve of democracy as practiced in Zimbabwe. Second, to better capture specific support for
the liberal institutions associated with democracy, we group the following nine indicators into a
scale: do you agree that parties are needed, do you reject one-party government, do you reject
one-man government, are you against government banning civil-society organisations, are you
against government closing news stations, are you against presidential discretion, are you in favour
of Parliament making the laws, do you agree that the president should obey the laws, and do you
support term limits. All the variables that make up this Support liberal institutions index are positively
correlated with a Cronbach’s alpha of 0.83. Finally, we combine these two variables to produce a
Pro-democracy scale (alpha of 0.41). As with political interest, larger values indicate greater
support for democratic institutions.
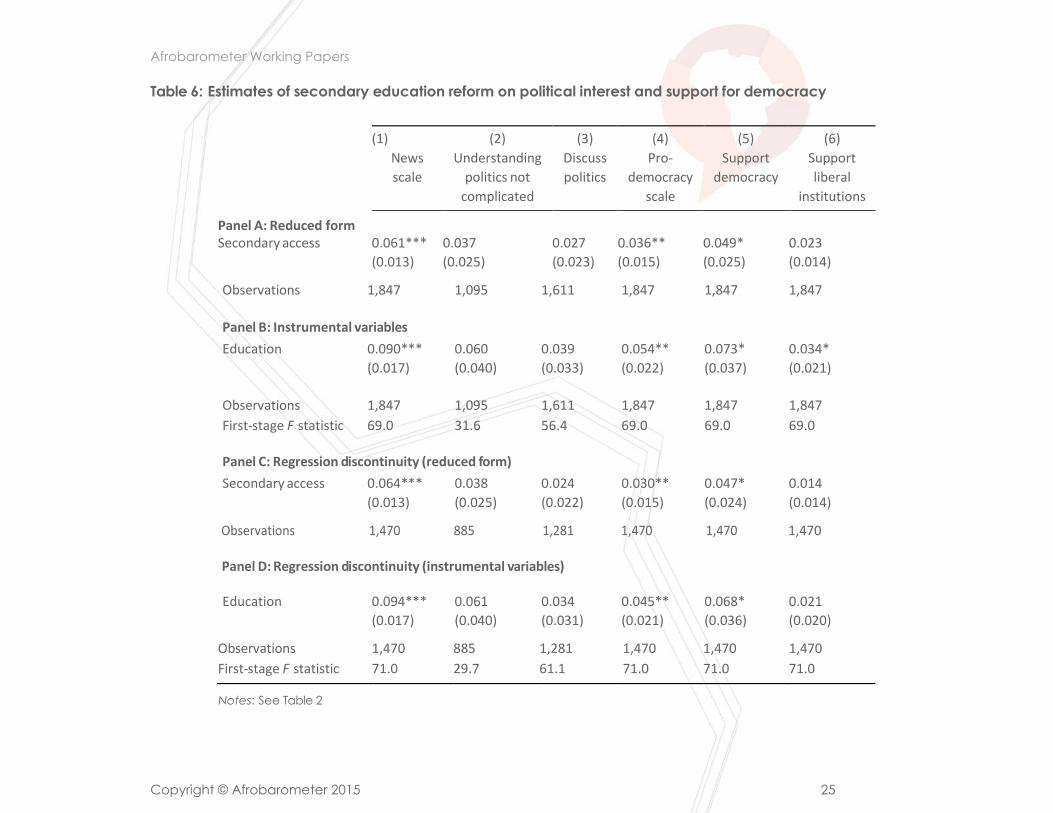
Consistent with a large number of studies from Western democracies, Table 6 shows that education
in Zimbabwe has a positive effect on political interest and support for democratic institutions. For
political interest, a one-unit increase in education raises the likelihood that an individual regularly
obtains political news by around 9 percentage points, or 25% relative to the sample mean (Column
1). Similarly, we find a positive, if weaker, effect of education on the belief that politics is not
complicated (Column 2) and the frequency with which individuals discuss politics (Column 3). Our
estimates thus demonstrate that reduced participation is not simply accounted for by a reduced
interest in politics. In fact, educated Zimbabweans are more interested in politics, at the same time
that they are less likely to participate.
Similarly belying an explanation rooted in a limited demand for democracy, we find that
education increases support for democracy in the abstract (Column 4). Similarly, we find that an
additional unit of education significantly increases the likelihood that an individual professes
support for democracy by 7 percentage points (Column 5). The positive effect on support for
liberal institutions suggests that voters possess a genuine understanding of the institutional building
Afrobarometer Working Papers
Copyright © Afrobarometer 2015 25
Table 6: Estimates of secondary education reform on political interest and support for democracy
Panel A: Reduced form
(1) (2) (3) (4) (5) (6)
News Understanding Discuss Pro- Support Support
scale politics not politics democracy democracy liberal
complicated scale institutions
Secondary access 0.061*** 0.037 0.027 0.036** 0.049* 0.023
(0.013) (0.025) (0.023) (0.015) (0.025) (0.014)
Observations 1,847 1,095 1,611 1,847 1,847 1,847
Panel B: Instrumental variables
Education 0.090*** 0.060 0.039 0.054** 0.073* 0.034*
(0.017) (0.040) (0.033) (0.022) (0.037) (0.021)
Observations 1,847 1,095 1,611 1,847 1,847 1,847
First-stage F statistic 69.0 31.6 56.4 69.0 69.0 69.0 Panel C: Regression discontinuity (reduced form)
Secondary access 0.064*** 0.038 0.024 0.030** 0.047* 0.014
(0.013) (0.025) (0.022) (0.015) (0.024) (0.014)
Observations 1,470 885 1,281 1,470 1,470 1,470 Panel D: Regression discontinuity (instrumental variables)
Education 0.094*** 0.061 0.034 0.045** 0.068* 0.021
(0.017) (0.040) (0.031) (0.021) (0.036) (0.020)
Observations 1,470 885 1,281 1,470 1,470 1,470
First-stage F statistic 71.0 29.7 61.1 71.0 71.0 71.0
Notes: See Table 2
Afrobarometer Working Papers
Copyright © Afrobarometer 2015 26
blocks required to support liberal democracy, although these estimates are typically not
quite statistically significant (Column 6). In sum, our results suggest that, consistent with our
deliberate disengagement argument, support for democracy increases with education.
Education increases criticism of the incumbent regime
If education reduces participation in non-contentious political action due to deliberate
disengagement, it follows that education should be associated with reduced support for the
incumbent autocratic regime. Qualitative assessments are consistent with this theoretical
expectation. For example, Chung (2006:310) states that “the democratization of education
also led to growing criticism of the government, as education enabled the newly educated
young to voice their opinions eloquently and openly.”
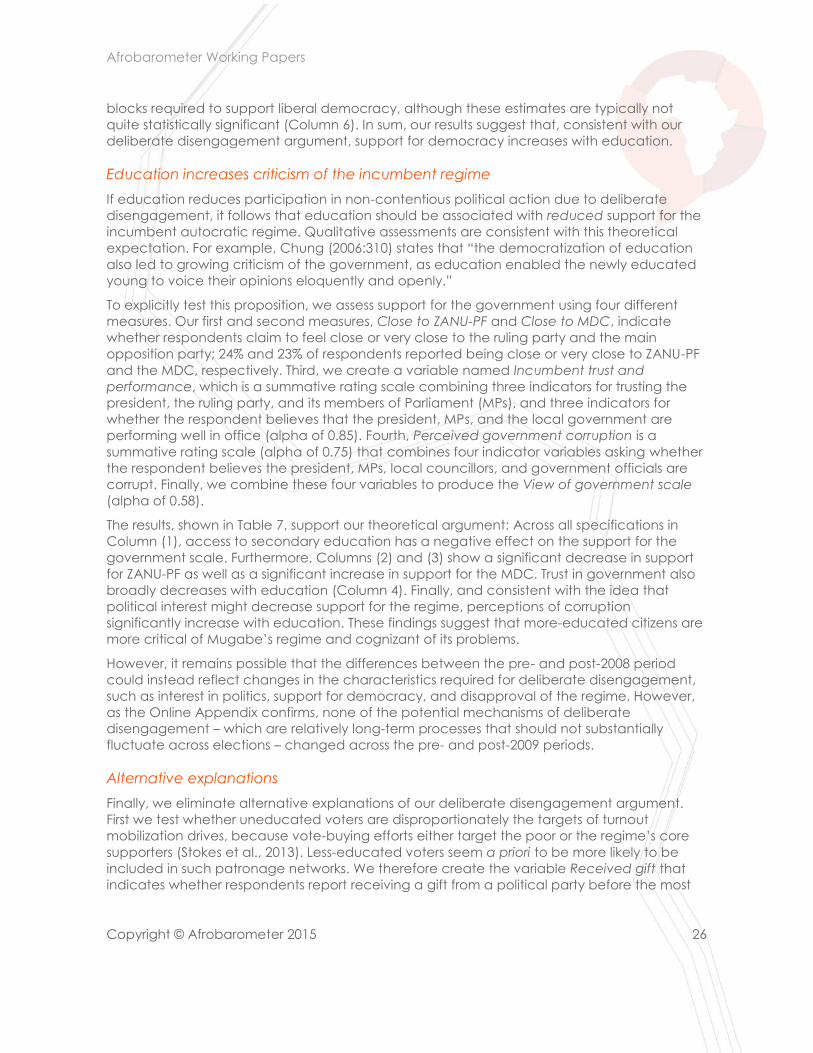
To explicitly test this proposition, we assess support for the government using four different
measures. Our first and second measures, Close to ZANU-PF and Close to MDC, indicate
whether respondents claim to feel close or very close to the ruling party and the main
opposition party; 24% and 23% of respondents reported being close or very close to ZANU-PF
and the MDC, respectively. Third, we create a variable named Incumbent trust and
performance, which is a summative rating scale combining three indicators for trusting the
president, the ruling party, and its members of Parliament (MPs), and three indicators for
whether the respondent believes that the president, MPs, and the local government are
performing well in office (alpha of 0.85). Fourth, Perceived government corruption is a
summative rating scale (alpha of 0.75) that combines four indicator variables asking whether
the respondent believes the president, MPs, local councillors, and government officials are
corrupt. Finally, we combine these four variables to produce the View of government scale
(alpha of 0.58).
The results, shown in Table 7, support our theoretical argument: Across all specifications in
Column (1), access to secondary education has a negative effect on the support for the
government scale. Furthermore, Columns (2) and (3) show a significant decrease in support
for ZANU-PF as well as a significant increase in support for the MDC. Trust in government also
broadly decreases with education (Column 4). Finally, and consistent with the idea that
political interest might decrease support for the regime, perceptions of corruption
significantly increase with education. These findings suggest that more-educated citizens are
more critical of Mugabe’s regime and cognizant of its problems.
However, it remains possible that the differences between the pre- and post-2008 period
could instead reflect changes in the characteristics required for deliberate disengagement,
such as interest in politics, support for democracy, and disapproval of the regime. However,
as the Online Appendix confirms, none of the potential mechanisms of deliberate
disengagement – which are relatively long-term processes that should not substantially
fluctuate across elections – changed across the pre- and post-2009 periods.
Alternative explanations
Finally, we eliminate alternative explanations of our deliberate disengagement argument.
First we test whether uneducated voters are disproportionately the targets of turnout
mobilization drives, because vote-buying efforts either target the poor or the regime’s core
supporters (Stokes et al., 2013). Less-educated voters seem a priori to be more likely to be
included in such patronage networks. We therefore create the variable Received gift that
indicates whether respondents report receiving a gift from a political party before the most
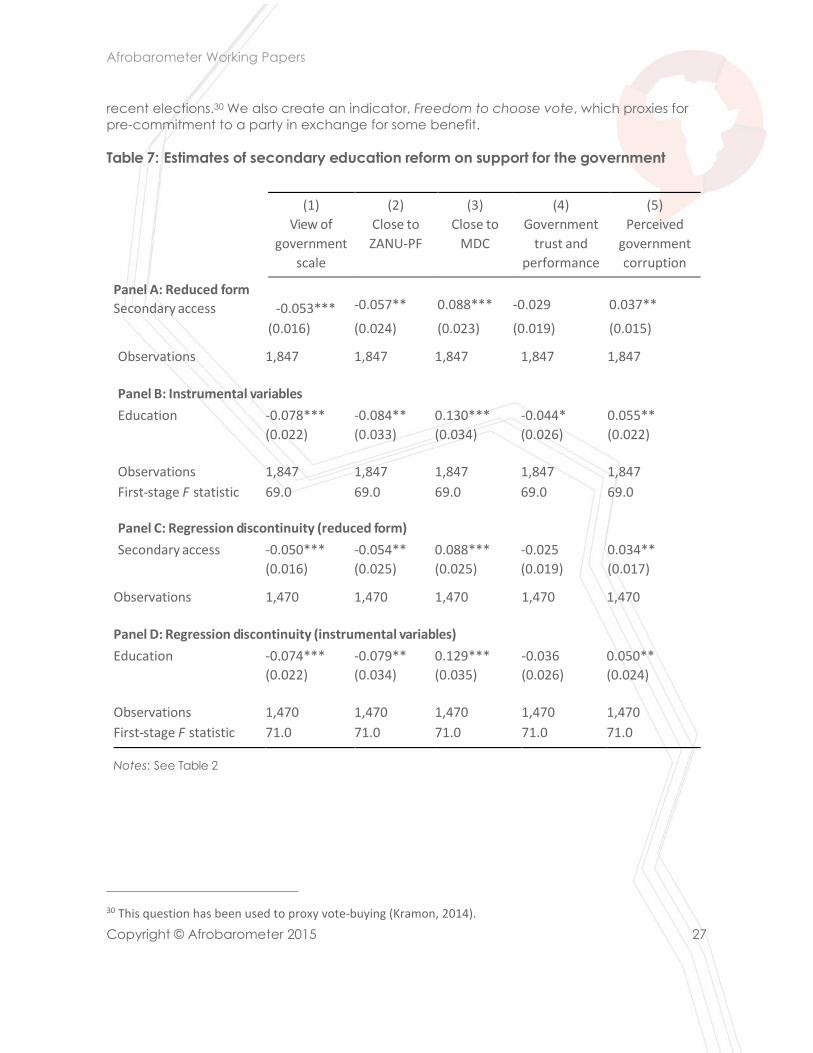
Afrobarometer Working Papers
Copyright © Afrobarometer 2015 27
recent elections.30 We also create an indicator, Freedom to choose vote, which proxies for
pre-commitment to a party in exchange for some benefit.
Table 7: Estimates of secondary education reform on support for the government
(1) (2) (3) (4) (5)
View of Close to Close to Government Perceived
government ZANU-PF MDC trust and government
scale performance corruption
Panel A: Reduced form
Secondary access -0.053***
-0.057**
0.088***
-0.029
0.037**
(0.016) (0.024) (0.023) (0.019) (0.015)
Observations 1,847 1,847 1,847 1,847 1,847
Panel B: Instrumental variables
Education -0.078*** -0.084** 0.130*** -0.044* 0.055**
(0.022) (0.033) (0.034) (0.026) (0.022)
Observations 1,847 1,847 1,847 1,847 1,847
First-stage F statistic 69.0 69.0 69.0 69.0 69.0 Panel C: Regression discontinuity (reduced form)
Secondary access -0.050*** -0.054** 0.088*** -0.025 0.034**
(0.016) (0.025) (0.025) (0.019) (0.017)
Observations 1,470 1,470 1,470 1,470 1,470
Panel D: Regression discontinuity (instrumental variables)
Education -0.074*** -0.079** 0.129*** -0.036 0.050**
(0.022) (0.034) (0.035) (0.026) (0.024)
Observations 1,470 1,470 1,470 1,470 1,470
First-stage F statistic 71.0 71.0 71.0 71.0 71.0
Notes: See Table 2
30 This question has been used to proxy vote-buying (Kramon, 2014).
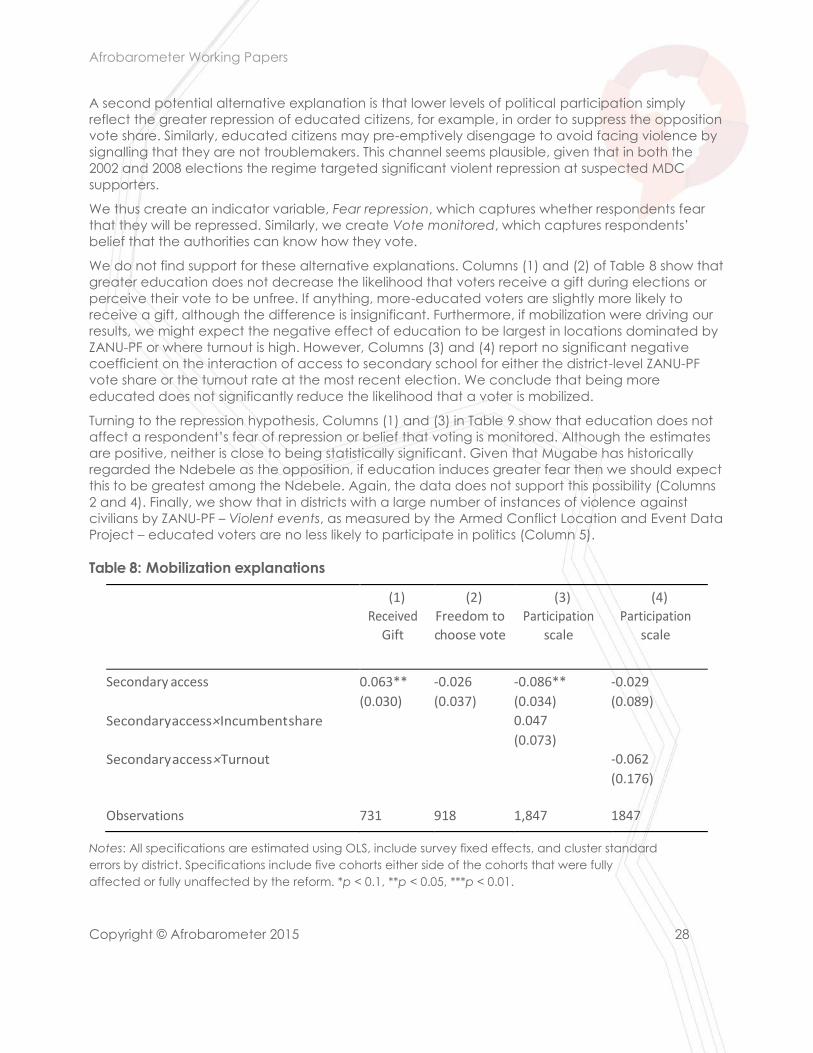
Afrobarometer Working Papers
Copyright © Afrobarometer 2015 28
A second potential alternative explanation is that lower levels of political participation simply
reflect the greater repression of educated citizens, for example, in order to suppress the opposition
vote share. Similarly, educated citizens may pre-emptively disengage to avoid facing violence by
signalling that they are not troublemakers. This channel seems plausible, given that in both the
2002 and 2008 elections the regime targeted significant violent repression at suspected MDC
supporters.
We thus create an indicator variable, Fear repression, which captures whether respondents fear
that they will be repressed. Similarly, we create Vote monitored, which captures respondents’
belief that the authorities can know how they vote.
We do not find support for these alternative explanations. Columns (1) and (2) of Table 8 show that
greater education does not decrease the likelihood that voters receive a gift during elections or
perceive their vote to be unfree. If anything, more-educated voters are slightly more likely to
receive a gift, although the difference is insignificant. Furthermore, if mobilization were driving our
results, we might expect the negative effect of education to be largest in locations dominated by
ZANU-PF or where turnout is high. However, Columns (3) and (4) report no significant negative
coefficient on the interaction of access to secondary school for either the district-level ZANU-PF
vote share or the turnout rate at the most recent election. We conclude that being more
educated does not significantly reduce the likelihood that a voter is mobilized.
Turning to the repression hypothesis, Columns (1) and (3) in Table 9 show that education does not
affect a respondent’s fear of repression or belief that voting is monitored. Although the estimates
are positive, neither is close to being statistically significant. Given that Mugabe has historically
regarded the Ndebele as the opposition, if education induces greater fear then we should expect
this to be greatest among the Ndebele. Again, the data does not support this possibility (Columns
2 and 4). Finally, we show that in districts with a large number of instances of violence against
civilians by ZANU-PF – Violent events, as measured by the Armed Conflict Location and Event Data
Project – educated voters are no less likely to participate in politics (Column 5).
Table 8: Mobilization explanations
(1)
Received
Gift
(2)
Freedom to
choose vote
(3)
Participation
scale
(4)
Participation
scale
Secondary access 0.063** -0.026 -0.086** -0.029
(0.030) (0.037) (0.034) (0.089)
Secondary access × Incumbent share 0.047
(0.073) Secondary access × Turnout -0.062
(0.176)
Observations 731 918 1,847 1847
Notes: All specifications are estimated using OLS, include survey fixed effects, and cluster standard
errors by district. Specifications include five cohorts either side of the cohorts that were fully
affected or fully unaffected by the reform. *p < 0.1, **p < 0.05, ***p < 0.01.
Afrobarometer Working Papers
Copyright © Afrobarometer 2015 29
Table 9: Repression explanations
(1)
Vote
monitored
(2)
Vote
monitored
(3)
Fear
repression
(4)
Fear
repression
(5)
Participation
scale
Secondary access 0.013 0.004 0.028 0.016 -0.054***
(0.029) (0.033) (0.027) (0.029) (0.019)
Secondary access × Ndebele 0.060 0.057
(0.075) (0.090)
Secondary access × Violent events -0.00001
(0.00002)
Observations 918 918 918 918 1,847
Notes: See Table 8
Conclusion
Reflecting on the large positive correlation between education and political participation, Phillip
Converse famously wrote that “education is everywhere the universal solvent, and the relationship
is always in the same direction” (Converse, 1972:324). In this article we seek to qualify “Converse’s
law” by testing whether the positive relationship between education and participation holds in
electoral authoritarian settings. Specifically, we develop and test a theory of “deliberate
disengagement,” according to which the more-educated citizenry may decide to disengage
from politics when initial political liberalization efforts prove to be futile. Non-participation, we
further argue, may serve as a non-violent form of protest designed to deprive the autocratic
regime of enjoying a semblance of legitimacy. We then demonstrate this argument using the case
of Zimbabwe, which in the past three decades has been controlled by a paradigmatic electoral
authoritarian regime.
In short, our results strongly suggest that “Converse’s law” should indeed be qualified. Exploiting
Zimbabwe’s major education reforms in 1980 as a natural experiment, we find that, in Zimbabwe,
education reduces various forms of non-contentious political action. This finding is robust to various
estimation approaches, to the inclusion and exclusion of “partially treated” respondents, to the
inclusion of a battery of pre-treatment control variables, to various placebo tests, and to varying
the length of the bandwidth around the cohort-eligibility cut-off point. This is, to the best of our
knowledge, the first article to argue – and causally demonstrate – that the positive relationship
between education and political participation is conditional on regime type. As such, it makes an
important contribution to our understanding of the determinants of political participation in the
developing world.
We also provide considerable evidence to support our claim that more-educated voters exhibit
lower levels of political participation due to deliberate disengagement rather than another
possible channel. Consistent with our theoretical argument, we find that education causally leads
to greater support for democracy, weaker support for the incumbent autocrat, greater interest in
politics, and higher living standards. We further find that these results are unlikely to be driven by
Afrobarometer Working Papers
Copyright © Afrobarometer 2015 30
alternative explanations such as political repression, though we acknowledge that this may be an
effective strategy for depressing support among opposition supporters.
Naturally, the findings reported in this study raise concerns regarding external validity. First, to
provide a suggestive step in this direction, we pool the Afrobarometer surveys for all available
countries and test whether the relationship between education and voting depends on regime
type. Encouragingly, we find a significant negative correlation for closed anocracies (Burkina Faso,
Tanzania, Uganda, and Zimbabwe, where Polity scores are between -4 and 0), and weak
insignificant correlations for open anocracies (where Polity scores are between 1 and 5). While
these correlations suggest that our findings might apply beyond Zimbabwe, more work is needed
to further qualify the conditions under which educated citizens choose to withdraw from the
political sphere. Second, this study investigates the negative effects of education on non-violent
forms of participation. A fruitful avenue of future research would be to explore the conditions
under which education leads individuals to instead support political violence, as Friedman et al.
(2011) find in western Kenya, or to personally adopt violent means of opposing an autocrat, as
seems to be the case in Burundi (Samii & West, 2014).

Afrobarometer Working Papers
31
Appendix
The Online Appendix is at https://sites.sas.upenn.edu/ggros/files/onlineappendix_v1.pdf.
Afrobarometer Working Papers
32
References
Acemoglu, D., Johnson, S., Robinson, J. A., & Yared, P. (2005). From education to democracy? American Economic Review, 95(2), 44–49.
Agüero, J. M., & Ramachandran, M. (2014). The intergenerational effects of increasing parental schooling: Evidence from Zimbabwe. Working paper.
Agüero, J. M., & Bharadwaj, P. (2014). Do the more educated know more about health? Evidence from schooling and HIV knowledge in Zimbabwe. Economic Development and Cultural Change, 62(3), 489–517.
Almond, G. A., & Verba, S. (1963). The civic culture: Political attitudes and democracy in five nations. Princeton, NJ: Princeton University Press.
Alwin, D. F., & Krosnick, J. A. (1991). Aging, cohorts, and the stability of sociopolitical orientations over the life span. American Journal of Sociology, 97(1), 169–195.
Berinsky, A. J., & Lenz, G. S. (2011). Education and political participation: Exploring the causal link. Political Behavior, 33(3), 357–373.
Bleakley, H. (2010). Malaria eradication in the Americas: A retrospective analysis of childhood exposure. American Economic Journal: Applied Economics 2(2), 1–45.
Bourne, R. (2011). Catastrophe: What went wrong in Zimbabwe? Zed Books. Bratton, M. (2014). Power politics in Zimbabwe. Boulder, CO: Lynne Rienner.
Bratton, M., Mattes, R., & Gyimah-Boadi, E. (2005). Public opinion, democracy, and market reform in Africa. Cambridge: Cambridge University Press.
Campante, F. R., & Chor, D. (2012a). Schooling, political participation, and the economy. Review of Economics and Statistics, 94(4), 841–859.
Campante, F. R., & Chor, D. (2012b). Why was the Arab world poised for revolution? Schooling, economic opportunities, and the Arab Spring. Journal of Economic Perspectives, 26(2), 167–187.
Carothers, T. (2002). The end of the transition paradigm. Journal of Democracy, 13(1), 5-21.
Chung, F. K. (2006). Re-living the second chimurenga: Memories from Zimbabwe’s liberation struggle. Nordic Africa Institute.
Conley, T. G., Christian, B. H., Rossi, P. E. (2012). Plausibly exogenous. Review of Economics and Statistics, 94(1), 260–272.
Converse, P. E. (1972). Change in the American electorate. In A. Campbell & P. E. Converse (Eds.), The Human Meaning of Social Change (pp. 263–337). New York, NY: Russell Sage Foundation.
Cox, M. (2003). When trust matters: Explaining differences in voter turnout. JCMS: Journal of Common Market Studies, 41(4), 757–770.
Dee, T. S. (2004). Are there civic returns to education? Journal of Public Economics, 88, 1697–1720.
Deutsch, K. W. (1961). Social mobilization and political development. American Political Science Review, 55(03), 493–514.
Dorsey, B. J. (1989). Educational development and reform in Zimbabwe. Comparative Education Review, 33(1), 40–58.
Evans, G., & Rose, P. (2006). Support for democracy in Malawi: Does schooling matter? Afrobarometer Working Paper No. 57. Available at www.afrobarometer.org.
Evans, G., & Rose, P. (2007). Testing mechanisms of influence: Education and support for democracy in sub-Saharan Africa. Afrobarometer Working Paper No. 75. Available at www.afrobarometer.org.
Afrobarometer Working Papers
33
Friedman, W., Kremer, M., Miguel E., & Thornton, R. (2011). Education as liberation? NBER Working Paper No. 16939.
Glaeser, E. L., Ponzetto, G. A. M., & Shleifer, A. (2007). Why does democracy need education? Journal of Economic Growth, 12(2), 77–99.
Grépin, K. A., & Bharadwaj, P. (2014). Maternal education and child mortality in Zimbabwe. Working paper.
Hermet, G. (1978). State-controlled elections: A framework. In G. Hermet, R. Rose, & A. Rouquie (Eds.). Elections without choice. New York: John Wiley.
Hillygus, D. S. (2005). The missing link: Exploring the relationship between higher education and political engagement. Political Behavior, 27(1), 25–47.
Huntington, S. P. (1991). Democracy’s third wave. Journal of Democracy, 2(2), 12–34.
Inglehart, R., & Welzel, C. (2005). Modernization, cultural change, and democracy: The human development sequence. Cambridge, New York: Cambridge University Press.
Jennings, M. K., & Niemi, R. G. (1968). The transmission of political values from parent to child. American Political Science Review, 62(1), 169–184.
Kam, C. D., & Palmer, C. L. (2008). Reconsidering the effects of education on political participation. The Journal of Politics, 70, 612–631.
Karklins, R. (1986). Soviet elections revisited: Voter abstention in noncompetitive voting. The American Political Science Review, 80(2), 449–470.
Kasara, K., & Suryanarayan, P. (2014). When do the rich vote less than the poor and why? Explaining turnout inequality across the world. American Journal of Political Science. doi: 10.1111/ajps.12134
King, E. (2013). From classrooms to conflict in Rwanda. Cambridge: Cambridge University Press.
Kramon, E. (2014). Vote buying or costly signaling? Electoral handouts and credibility in Africa. Working paper.
Kuenzi, M., & Lambright, G. M. S. (2005). Who votes in Africa? An examination of electoral turnout in 10 African countries. Afrobarometer Working Paper 51. Available at www.afrobarometer.org.
Kuenzi, M. T. (2006). Nonformal education, political participation, and democracy: Findings from Senegal. Political Behavior, 28(1), 1–31.
La Due Lake, R., & Huckfeldt, R. (1998). Social capital, social networks, and political participation. Political Psychology, 19(3), 567–584.
Larreguy, H. A., & Marshall, J. (2014). The effect of education on political engagement in weakly institutionalized democracies: Evidence from Nigeria. Working paper.
LeBas, A. (2006). Polarization as craft: Party formation and state violence in Zimbabwe. Comparative Politics, 38(4), 419–438.
LeBas, A. (2014). The perils of power sharing. Journal of Democracy, 25(2), 52–66.
Lerner, D. (1958). The passing of traditional society: Modernizing the Middle East. Glencoe, IL: Free Press.
Levitsky, S., & Way, L. A. (2002). The rise of competitive authoritarianism. Journal of Democracy, 13, 51–66.
Levitsky, S., & Way, L. A. (2010). Competitive authoritarianism: Hybrid regimes after the cold war. New York: Cambridge University Press.
Afrobarometer Working Papers
34
Lijphart, A. (1997). Unequal participation: Democracy’s unresolved dilemma. American Political Science Review, 91(1), 1–14.
Lipset, S. M. (1959). Some social requisites of democracy: Economic development and political legitimacy. American Political Science Review, 53(1), 69–105.
MacLean, L. M. (2011). State retrenchment and the exercise of citizenship in Africa.” Comparative Political Studies, 44(9), 1238–1266.
Marshall, J. (2014). Identifying education’s political effects with incomplete data: Instrumental variable estimates combining two datasets.” Working paper.
Mattes, R. (2011). The “Born Frees”: The prospects for generational change in post-apartheid South Africa. Afrobarometer Working Paper No. 131. Available at www.afrobarometer.org.
Mattes, R., & Mughogho, D. (2009). The limited impacts of formal education on democratic citizenship in Africa. Afrobarometer Working Paper No. 109. Available at www.afrobarometer.org.
Mattes, R., & Richmond, S. (2015). Are South Africa’s youth really a “ticking time bomb”? Afrobarometer Working Paper No. 152. Available at www.afrobarometer.org.
Meredith, M. (2009). Persistence in political participation. Quarterly Journal of Political Science, 4(3), 187–209.
Mullainathan, S., & Washington, E. (2009). Sticking with your vote: Cognitive dissonance and political attitudes. American Economic Journal: Applied Economics, 1(1), 86–111.
Murtin, F., & Wacziarg, R. (2014). The democratic transition. Journal of Economic Growth, 19(2), 141–181.
Narman, A. (2003). Education in Zimbabwe: A matter of success? In S. Darnolf & L. Laakso (Eds.), Twenty Years of Independence in Zimbabwe: From Liberation to Authoritarianism. London: Palgrave Macmillan.
Nhundu, T. J. (1992). A decade of educational expansion in Zimbabwe: Causes, consequences, and policy contradictions. The Journal of Negro Education, 61(1), 78–98.
Nie, N. H., Junn, J., & Stehlik-Barry, K. (1996). Education and democratic citizenship in America. Chicago: University of Chicago Press.
Norris, P. (2002). Democratic phoenix: Reinventing political activism. Cambridge: Cambridge University Press.
Persson, M. (2011). An empirical test of the relative education model in Sweden. Political Behavior, 33(3), 455-478.
Posner, D. N. & Simon, D. J. (2002). Economic conditions and incumbent support in Africa’s new democracies: Evidence from Zambia. Comparative Political Studies, 35(3), 313-336.
Putnam, R. D. (1995). Bowling alone: America’s declining social capital. Journal of Democracy, 6(1), 65–78.
Riddell, R. (1980). From Rhodesia to Zimbabwe: Alternatives to poverty. Catholic Institute for International Relations.
Rosenstone, S., & Hansen, J. M. (1993). Mobilization, participation and democracy in America. New York: MacMillan Publishing.
Rousseau, J.-J. (1997). Rousseau: The social contract and other later political writings. Cambridge: Cambridge University Press.
Samii, C., & West, E. (2014). Glass ceiling revolt? Theory and evidence from Burundi. Working paper.
Schedler, A. (2013). The politics of uncertainty: Sustaining and subverting electoral authoritarianism.
Afrobarometer Working Papers
35
Oxford, New York: Oxford University Press.
Sears, D. O., & Valentino, N. A. (1997). Politics matters: Political events as catalysts for preadult socialization. American Political Science Review, 91(1), 45–65.
Sondheimer, R. M., & Green, D. P. (2010). Using experiments to estimate the effects of education on voter turnout. American Journal of Political Science, 41(1), 178–189.
Spence, M. (1973). Job market signaling. Quarterly Journal of Economics, 87(3), 355–374.
Staiger, D., & Stock, J. H. (1997). Instrumental variables regression with weak instruments. Econometrica, 65(3), 557–586.
Stokes, S. C., Dunning, T., Nazareno, M., & Brusco, V. (2013). Brokers, voters, and clientelism: The puzzle of distributive politics. Cambridge, New York: Cambridge University Press.
Tenn, S. (2007). The effect of education on voter turnout. Political Analysis, 15(4), 446–464.
Verba, S., Lehman Schlozman, K., & Brady, H. E. (1995). Voice and equality: Civic voluntarism in American politics. Cambridge, MA: Harvard University Press.
Wantchekon, L., Novta, N., & Klašnja, M. (2013). Education and human capital externalities: Evidence from colonial Benin. Princeton Working Paper.
Woodberry, R. D. (2012). The missionary roots of liberal democracy. American Political Science Review, 106(2), 244–274.
Afrobarometer Working Papers
Copyright © Afrobarometer 2015 36
Recent Afrobarometer working papers
No. 155 Bleck, Jaimie & Kristin Michelitch. On the primacy of weak public service provision in rural Africa: Malians redefine ‘state breakdown’ amidst 2012 political crisis. 2015
No. 154 Leo, Benjamin, Robert Morello, & Vijaya Ramachandran. The face of African infrastructure: Service availability and citizens’ demands. 2015
No. 153 Gottlieb, Jessica, Guy Grossman, & Amanda Lea Robinson. Do men and women have different policy preferences, and if so, why? 2015
No. 152 Mattes, Robert & Samantha Richmond. Are South Africa’s youth really a ‘ticking time bomb’? 2015
No. 151 Mattes, Robert. South Africa’s emerging black middle class: A harbinger of political change? 2014
No. 150 Cheeseman, Nic. Does the African middle class defend democracy? Evidence from Kenya. 2014
No. 149 Schaub, Max. Solidarity with a sharp edge: Communal conflict and local collective action in rural Nigeria. 2014
No.148 Peiffer, Caryn & Richard Rose. Why do some Africans pay bribes while other Africans don’t? 2014
No. 147 Ellis, Erin. A vote of confidence: Retrospective voting in Africa. 2014
No. 146 Hollard, Guillaume & Omar Sene. What drives quality of schools in Africa? Disentangling social capital and ethnic divisions. 2014
No.145 Dionne, Kim Yi, Kris L. Inman, & Gabriella R. Montinola. Another resource curse? The impact of remittances on political participation. 2014
No.144 Carlson, Elizabeth. Social desirability bias and reported vote preferences in Africa surveys. 2014
No.143 Ali, Merima, Odd-Helge Fjeldstad, & Ingrid Hoem Sjursen. To pay or not to pay? Citizens’ attitudes towards taxation in Kenya, Tanzania, Uganda and South Africa. 2013
No.142 Bodenstein, Thilo. Ethnicity and individual attitudes towards international investors: Survey evidence from sub-Saharan Africa. 2013
No.141 Bandyopadhyay, Sanghamitra & Elliott Green. Pre-colonial political centralization and contemporary development in Uganda. 2012
No.140 Sacks, Audrey. Can donors and non-state actors undermine citizens’ legitimating beliefs? 2012
No.139 Justesen, Mogens K. & Christian Bjørnskov. Exploiting the poor: Bureaucratic corruption and poverty in Africa. 2012
No.138 De Luca, Giacomo & Marijke Verpoorten. From vice to virtue? Civil war and social capital in Uganda. 2012
No.137 Kerr, Nicholas. Perceptions versus reality: Assessing popular evaluations of electoral quality in Africa. 2011
No.136 Resnick, Danielle & Daniela Casale. Political participation of Africa’s youth: Turnout, partisanship, and protest. 2011
No.135 Conroy-Krutz, Jeffrey & Carolyn Logan. Museveni and the 2011 Ugandan election: Did the money matter? 2011
No.134 Carter, Danielle. Sources of state legitimacy in contemporary South Africa: A theory of political goods. 2011
No.133 Justesen, Mogens K. Too poor to care? The salience of AIDS in Africa. 2011
No.132 Kasara, Kimuli. Separate and suspicious: Local social and political context and ethnic tolerance in Kenya. 2011
No.131 Mattes, Robert. The ‘Born Frees’: The prospects for generational change in post-apartheid South Africa. 2011
Afrobarometer Working Papers
Copyright © Afrobarometer 2015 37
Afrobarometer Working Papers Series
Editor: Michael Bratton, [email protected] Editorial Board: E. Gyimah-Boadi, Carolyn Logan, Robert Mattes, Leonard Wantchekon Afrobarometer is produced collaboratively by social scientists from more than 30 African countries. Afrobarometer publications report the results of national sample surveys on the attitudes of citizens in selected African countries toward democracy, markets, civil society, and other aspects of development. Publications are simultaneously co-published by the six Afrobarometer core partner and support unit institutions. All publications can be searched and downloaded from our website at www.afrobarometer.org.
Support for Afrobarometer is provided by the UK’s Department for International Development (DFID), the Mo Ibrahim Foundation, the Swedish International Development Agency (SIDA), the United States Agency for International Development (USAID), and the World Bank.
Core partners: Center for Democratic Development (CDD-Ghana) 95 Nortei Ababio Street, North Airport Residential Area P.O. Box LG 404, Legon-Accra, Ghana Tel: +233 21 776 142 Fax: +233 21 763 028
www.cddghana.org
Institute for Development Studies (IDS), University of Nairobi P.O. Box 30197 Nairobi 00100, Kenya Tel: +254 20 2247968 Fax: +254 20 2222036 www.ids.uonbi.ac.ke
Institute for Empirical Research in Political Economy (IREEP) Arconville, Lot 104 - Parcelle J, 02 BP 372
Cotonou, République du Benin Tel: +229 21 363 873/ 229 94 940 108 Fax: +229 21 362 029
www.ireep.org
Institute for Justice and Reconciliation in South Africa (IJR) 105 Hatfield Street, Gardens 8001 Cape Town, South Africa Tel: +27 21 763 7128 Fax: +27 21 763 7138 www.ijr.org.za
Support units: Michigan State University (MSU) Department of Political Science East Lansing, MI 48824 Tel: +1 517 353 6590
Fax: +1 517 432 1091 www.polisci.msu.edu
University of Cape Town (UCT) Democracy in Africa Research Unit Centre for Social Science Research Private Bag Rondebosch 7701, South Africa Tel: +27 21 650 3827 | Dept: +27 21 650 3811 Fax: +27 21 650 4657
www.cssr.uct.org.za