Delft University of Technology Monitoring bolt tightness ...
23
Delft University of Technology Monitoring bolt tightness of rail joints using axle box acceleration measurements Oregui, M; Li, S.; Nunez, Alfredo; Li, Z; Carroll, R; Dollevoet, RPBJ DOI 10.1002/stc.1848 Publication date 2016 Document Version Accepted author manuscript Published in Structural Control and Health Monitoring: the bulletin of ACS Citation (APA) Oregui, M., Li, S., Nunez, A., Li, Z., Carroll, R., & Dollevoet, RPBJ. (2016). Monitoring bolt tightness of rail joints using axle box acceleration measurements. Structural Control and Health Monitoring: the bulletin of ACS, 24(2). https://doi.org/10.1002/stc.1848 Important note To cite this publication, please use the final published version (if applicable). Please check the document version above. Copyright Other than for strictly personal use, it is not permitted to download, forward or distribute the text or part of it, without the consent of the author(s) and/or copyright holder(s), unless the work is under an open content license such as Creative Commons. Takedown policy Please contact us and provide details if you believe this document breaches copyrights. We will remove access to the work immediately and investigate your claim. This work is downloaded from Delft University of Technology. For technical reasons the number of authors shown on this cover page is limited to a maximum of 10.
Transcript of Delft University of Technology Monitoring bolt tightness ...

Delft University of Technology
Monitoring bolt tightness of rail joints using axle box acceleration measurements
Oregui, M; Li, S.; Nunez, Alfredo; Li, Z; Carroll, R; Dollevoet, RPBJ
DOI10.1002/stc.1848Publication date2016Document VersionAccepted author manuscriptPublished inStructural Control and Health Monitoring: the bulletin of ACS
Citation (APA)Oregui, M., Li, S., Nunez, A., Li, Z., Carroll, R., & Dollevoet, RPBJ. (2016). Monitoring bolt tightness of railjoints using axle box acceleration measurements. Structural Control and Health Monitoring: the bulletin ofACS, 24(2). https://doi.org/10.1002/stc.1848
Important noteTo cite this publication, please use the final published version (if applicable).Please check the document version above.
CopyrightOther than for strictly personal use, it is not permitted to download, forward or distribute the text or part of it, without the consentof the author(s) and/or copyright holder(s), unless the work is under an open content license such as Creative Commons.
Takedown policyPlease contact us and provide details if you believe this document breaches copyrights.We will remove access to the work immediately and investigate your claim.
This work is downloaded from Delft University of Technology.For technical reasons the number of authors shown on this cover page is limited to a maximum of 10.
For Peer Review
STRUCTURAL CONTROL AND HEALTH MONITORING
Struct. Control Health Monit.2014;00:1–22
Published online in Wiley InterScience (www.interscience.wiley.com). DOI: 10.1002/stc
Monitoringbolt tightness of rail joints using Axle Box
Acceleration Measurements
M. Oregui1, S. Li1, A. Nunez1, Z. Li1∗, R. Carroll2 and R. Dollevoet1
1Delft University of Technology, Faculty of Civil Engineering and Geosciences, Section of Railway Engineering,
Stevinweg 1, 2628 CN Delft, the Netherlands
2Stagecoach Supertram Maintenance Ltd, Nunnery Depot, Woodbourn Road, Sheffield, S9 3LS, United Kingdom
SUMMARY
Rail joints are a weak component in railway tracks because of the large impact and wheel-rail contact forces.
Every train passage contributes to the deterioration of rail joints, causing visible (e.g. battered rails) and
invisible (e.g. loose bolts) damages. The invisible damage cannot be detected by the commonly performed
visual inspection, which is labor intensive, unreliable, intrusive and unsafe. In this paper, a vehicle-borne
monitoring system is used to automatically detect and assess the tightness condition of bolts at rail joints.
The monitoring method is developed based on field Axle Box Acceleration (ABA) measurements using
different bolt tightness conditions. The suitability of the method is assessed by bolt tightness prediction and
verification of a set of rail joints in the tram network of Sheffield, United Kingdom. The results show that
ABA system can be employed to monitor bolt tightness conditions at rail joints. With this information better
planning for selective preventive maintenance actions can be taken over rail joints. Copyrightc© 2014 John
Wiley & Sons, Ltd.
Received . . .
KEY WORDS: rail joint; bolt tightness; axle box acceleration measurement; health condition monitoring;
characteristic frequency
1. INTRODUCTION
Rail joints (RJs) are an important component in many railway networks worldwide; an example of
a RJ is shown in Figure1a. Although the use of continuously welded rail is nowadays more cost
∗Correspondence to: Delft University of Technology, Faculty of Civil Engineering and Geosciences, Section of Railway
Engineering Stevinweg 1, 2628 CN Delft, the Netherlands. E-mail: [email protected]
Copyright c© 2014 John Wiley & Sons, Ltd.
Prepared usingstcauth.cls [Version: 2010/05/13 v2.00]
Page 1 of 22
123456789101112131415161718192021222324252627282930313233343536373839404142434445464748495051525354555657585960
Please cite as: M. Oregui, S. Li, A. Núñez, Z. Li, R. Carroll, and R. Dollevoet, “Monitoring bolt tightness of rail joints using axle box acceleration measurements”. Structural Control and Health Monitoring 24:e1848, 2017. DOI: 10.1002/stc.1848

For Peer Review
2 M. OREGUI ET AL.
effectivedue to its significantly longer service life (1), many rails are still connected by rail joints.
Furthermore, insulated rail joints (IRJs), in whichthe two rail ends are separated with an insulating
material, are a fundamental component of the safety system in many railway networks.
(a) (b)
Figure 1. Two examplesof rail joints: (a) invisible damage: loose bolts, and (b) visible damage: missing boltand battered rail surface
When wheels roll over the discontinuity between rail ends, large impact and dynamic wheel-rail
contact forces occur accelerating the deterioration of RJs (2; 3; 4; 5; 6). Bolts get loose, rail joints
ends become battered, and cracks develop in the rail. These damage conditions at severe state may
lead to rail break, derailment and malfunctioning of the signaling system. In addition, impact noise
is a nuisance for the people living nearby railway tracks. To guarantee safety and acceptable noise
levels, cost-expensive maintenance measures are taken, usually at a late stage when the only solution
is replacement of RJs.
The inspection of RJs is mostly performed visually, which is subjective and labor expensive,
and often intrusive and unsafe, such as in 24/7 tram and metro networks. Furthermore, there is
the additional challenge of assessing the real damage state of RJs. For instance, the RJ shown in
Figure1b can be easily assessed: one bolt is missing and the rail ends are plastically deformed.
Thus, this RJ can be tagged as”severely damaged”. However, the condition of the RJ shown in
Figure1a is visually unknown. Although the RJ seems to be in good condition to the naked eye,
cracks in the rail web could bepresent or the bolts could be loose.
To overcome the limitations of visual inspection and improve safety conditions, vehicle-born
monitoring systems have been developed in recent years (see a review in (7)). High quality videos
and photos are taken from inspectionvehicles, but the detection range of this system is limited to
visible damage, such as missing fastenings (8). Vehicle-borne ultrasonic measurements are also
an alternative, used to detectsurface and internal rail defects (9; 10), but its reliability is also
limited (11). Different typesof deterioration, such as loose bolts or plastic deformation, cannot
be detected with ultrasonic measurements.
Copyright c© 2014John Wiley & Sons, Ltd. Struct. Control Health Monit.(2014)
Prepared usingstcauth.cls DOI: 10.1002/stc
Page 2 of 22
123456789101112131415161718192021222324252627282930313233343536373839404142434445464748495051525354555657585960
Please cite as: M. Oregui, S. Li, A. Núñez, Z. Li, R. Carroll, and R. Dollevoet, “Monitoring bolt tightness of rail joints using axle box acceleration measurements”. Structural Control and Health Monitoring 24:e1848, 2017. DOI: 10.1002/stc.1848

For Peer Review
MONITORING BOLT TIGHTNESS OF RAIL JOINTS USING ABA MEASUREMENTS 3
A vehicle-bornemonitoring system that may be able to detect different types of visible and
invisible damage at RJs is the Axle Box Acceleration (ABA) system (12; 13; 14; 15; 16). The
damage detection methodused by the ABA system is based on changes in the dynamic behavior of
vehicle-wheel/rail-track interaction. The response of a track is defined by its components and their
interaction, so that if one component deteriorates, the track response changes in the signature tunes
of the damage condition (i.e. characteristic frequencies and amplitudes). In the case of a RJ, vehicle-
track dynamics are excited when the wheel impacts the rail at the discontinuity and the dynamic
behavior of RJs changes for different visible damage states (17). In view of these promising results,
we are encouragedto study if ABA systems can detect invisible deterioration.
In this paper, we assess the capacity of an ABA system for evaluating bolt tightness condition at
RJs. For this purpose, a field test was carried out in which a vehicle with an ABA system run over a
reference RJ with different bolt tightness conditions for calibration, and then over a set of other RJs
for trial detection and verification. The paper is organized as follows. In Section2, the measurement
devices aredescribed. In Section3, a method for detecting bolt tightness condition based on wavelet
analysis is introduced.In addition, a designed test performed with resilient wheels at a reference RJ
under controlled conditions is shown. In this manner, a theoretical set of values is obtained to make
a comparison and assessment of the effectiveness of the methodology. In Section4, a case study
in Sheffield ispresented to evaluate the detection method for two RJs. The results are discussed in
Section5 and the main conclusions are summarized in Section6.
2. RAILWAY TRACK MEASUREMENTS
To assess the feasibility to automatically detect bolt tightness variation at rail joints, two
measurements types were performed: axle box accelerations and rail vertical-longitudinal profile.
For the former, the ABA system used is presented in Section2.1 and for the later, the Railprof
measurement system ispresented in Section2.2.
2.1. ABAsystem
ABA systems are dynamic-response-based vehicle-borne measurements (13; 14; 15; 12; 16). As
it is schematically shown in Figure2, the ABA system consists of three main components. First,
accelerometers are mountedon axle boxes to measure acceleration. Second, the position of the
vehicle is received in a GPS antenna. Third, the vehicle speed is usually obtained from a tacometer.
Copyright c© 2014 John Wiley & Sons, Ltd. Struct. Control Health Monit.(2014)
Prepared usingstcauth.cls DOI: 10.1002/stc
Page 3 of 22
Structural Control and Health Monitoring
http://mc.manuscriptcentral.com/stc
123456789101112131415161718192021222324252627282930313233343536373839404142434445464748495051525354555657585960
Please cite as: M. Oregui, S. Li, A. Núñez, Z. Li, R. Carroll, and R. Dollevoet, “Monitoring bolt tightness of rail joints using axle box acceleration measurements”. Structural Control and Health Monitoring 24:e1848, 2017. DOI: 10.1002/stc.1848

For Peer Review
4 M. OREGUI ET AL.
The measured accelerations contain information of the wheel-track structure. When the track
has deteriorated, changes with respect to healthy tracks measurements appear in the measured
signals, which are called signature tunes. By detecting signature tunes in the response, deteriorated
locations can be traced back by combining the measured position and vehicle speed. However,
each track defect type has its own signature tunes, which needs to be determined in advance by
defining the characteristic frequencies of interest. Thus, track defects can be detected only if their
characteristic frequencies are known. After detection, deterioration state of defects can be assessed
so that corrective maintenance measures can be planned according to the damage severity. For
example, an ABA system can successfully be used to automatically detect both severe and early
stage squats, which are a short wave defect on the rail top (18).
acceleration
Data
processing &
diagnoses
Data
logging
positioning speed
Data
acquisition
Plate
Rail
Wheel
Accelerometer
GPS Tacometer
Bolts
Figure 2. Schematic view of the ABA measuring and diagnosis system
In this paper,the ABA system was mounted on a regular Supertram tram with resilient wheels
in Sheffield (see Figure3). Four accelerometers were mounted on the four axle boxes of a bogie
to register acceleration measurement.The lower close-up in Figure2 shows a sensor mounted on
the Supertram bogie. Theaccelerometers are of piezoelectric type (MEMS), and have a range of
±100g, a frequency bandwidth of 30 kHz, and a sensitivity of 50 mV/g. The accelerometer chosen
is suitable for railway application as a similar instrumentation has been under extensive test in The
Netherlands for mainline applications (15).
The upper close-up inFigure3 shows the location of the positioning GPS antenna on the tram
roof. The speed signalwas obtained from the meter cabinet of the tram. The accelerations, speed
and position were recorded in a data acquisition system on-board of the Supertram test tram.
Copyright c© 2014 John Wiley & Sons, Ltd. Struct. Control Health Monit.(2014)
Prepared usingstcauth.cls DOI: 10.1002/stc
Page 4 of 22
123456789101112131415161718192021222324252627282930313233343536373839404142434445464748495051525354555657585960
Please cite as: M. Oregui, S. Li, A. Núñez, Z. Li, R. Carroll, and R. Dollevoet, “Monitoring bolt tightness of rail joints using axle box acceleration measurements”. Structural Control and Health Monitoring 24:e1848, 2017. DOI: 10.1002/stc.1848
For Peer Review
MONITORING BOLT TIGHTNESS OF RAIL JOINTS USING ABA MEASUREMENTS 5
GPS
Accelerometer
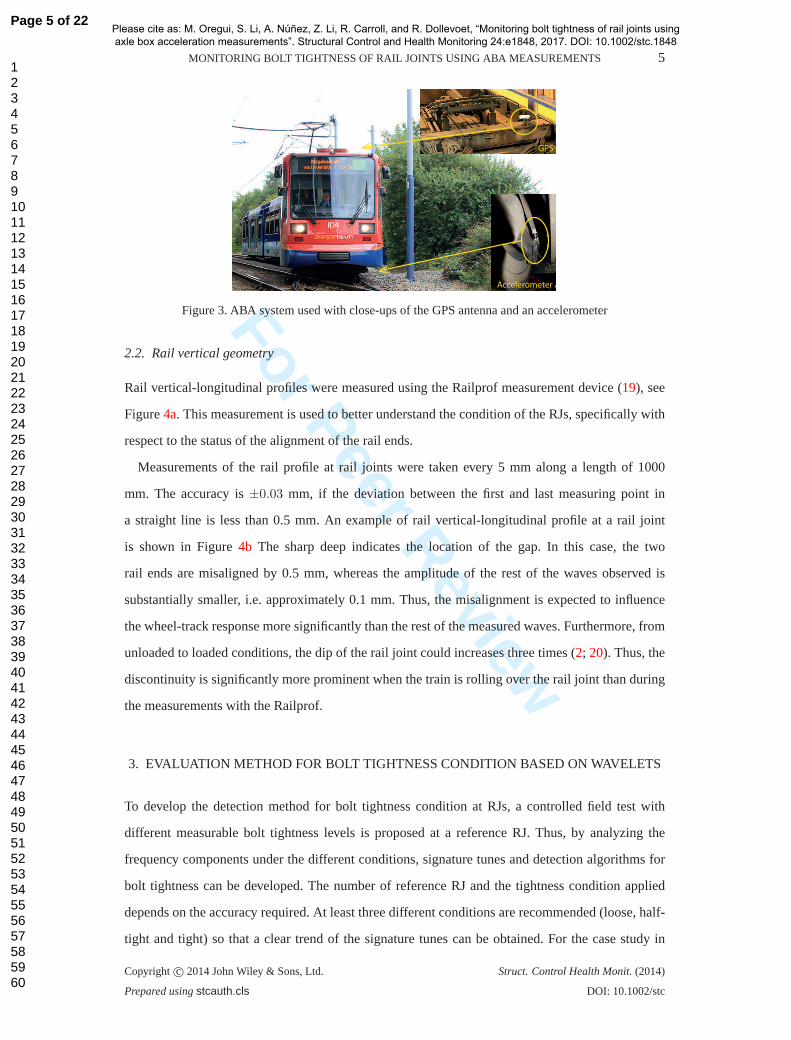
Figure 3. ABA system used with close-ups of the GPS antenna and an accelerometer
2.2. Rail verticalgeometry
Rail vertical-longitudinal profiles were measured using the Railprof measurement device (19), see
Figure4a. This measurementis used to better understand the condition of the RJs, specifically with
respect to thestatus of the alignment of the rail ends.
Measurements of the rail profile at rail joints were taken every 5 mm along a length of 1000
mm. The accuracy is±0.03 mm, if the deviation between the first and last measuring point in
a straight line is less than 0.5 mm. An example of rail vertical-longitudinal profile at a rail joint
is shown in Figure4b The sharp deep indicates the location of the gap. In this case, the two
rail ends are misalignedby 0.5 mm, whereas the amplitude of the rest of the waves observed is
substantially smaller, i.e. approximately 0.1 mm. Thus, the misalignment is expected to influence
the wheel-track response more significantly than the rest of the measured waves. Furthermore, from
unloaded to loaded conditions, the dip of the rail joint could increases three times (2; 20). Thus, the
discontinuity is significantly moreprominent when the train is rolling over the rail joint than during
the measurements with the Railprof.
3. EVALUATION METHOD FOR BOLT TIGHTNESS CONDITION BASED ON WAVELETS
To develop the detection method for bolt tightness condition at RJs, a controlled field test with
different measurable bolt tightness levels is proposed at a reference RJ. Thus, by analyzing the
frequency components under the different conditions, signature tunes and detection algorithms for
bolt tightness can be developed. The number of reference RJ and the tightness condition applied
depends on the accuracy required. At least three different conditions are recommended (loose, half-
tight and tight) so that a clear trend of the signature tunes can be obtained. For the case study in
Copyright c© 2014 John Wiley & Sons, Ltd. Struct. Control Health Monit.(2014)
Prepared usingstcauth.cls DOI: 10.1002/stc
Page 5 of 22
123456789101112131415161718192021222324252627282930313233343536373839404142434445464748495051525354555657585960
Please cite as: M. Oregui, S. Li, A. Núñez, Z. Li, R. Carroll, and R. Dollevoet, “Monitoring bolt tightness of rail joints using axle box acceleration measurements”. Structural Control and Health Monitoring 24:e1848, 2017. DOI: 10.1002/stc.1848
For Peer Review
6 M. OREGUI ET AL.
(a)
−0.5 −0.3 −0.1 0 0.1 0.3 0.5−1.6
−1.4
−1.2
−1
−0.8
−0.6
−0.4
−0.2
0
Rail longitudinal, [m]
Rai
l ver
tical
, [m
m]
(b)
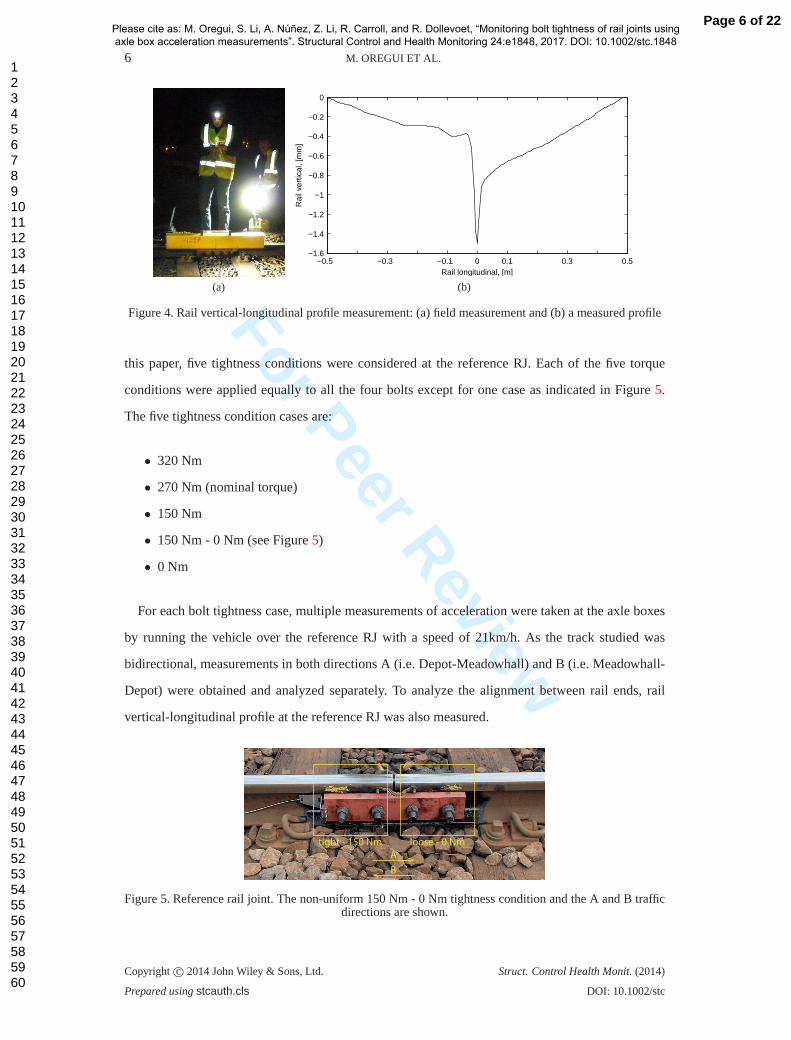
Figure 4. Rail vertical-longitudinalprofile measurement: (a) field measurement and (b) a measured profile
this paper, five tightness conditions were considered at the reference RJ. Each of the five torque
conditions were applied equally to all the four bolts except for one case as indicated in Figure5.
The five tightnesscondition cases are:
• 320 Nm
• 270 Nm (nominal torque)
• 150 Nm
• 150 Nm - 0 Nm (see Figure5)
• 0 Nm
For each bolt tightnesscase, multiple measurements of acceleration were taken at the axle boxes
by running the vehicle over the reference RJ with a speed of 21km/h. As the track studied was
bidirectional, measurements in both directions A (i.e. Depot-Meadowhall) and B (i.e. Meadowhall-
Depot) were obtained and analyzed separately. To analyze the alignment between rail ends, rail
vertical-longitudinal profile at the reference RJ was also measured.
tight - 150 Nm loose - 0 Nm
A
B
Figure 5. Reference rail joint. The non-uniform 150 Nm - 0 Nm tightness condition and the Aand B trafficdirections are shown.
Copyright c© 2014 John Wiley & Sons, Ltd. Struct. Control Health Monit.(2014)
Prepared usingstcauth.cls DOI: 10.1002/stc
Page 6 of 22
123456789101112131415161718192021222324252627282930313233343536373839404142434445464748495051525354555657585960
Please cite as: M. Oregui, S. Li, A. Núñez, Z. Li, R. Carroll, and R. Dollevoet, “Monitoring bolt tightness of rail joints using axle box acceleration measurements”. Structural Control and Health Monitoring 24:e1848, 2017. DOI: 10.1002/stc.1848

For Peer Review
MONITORING BOLT TIGHTNESS OF RAIL JOINTS USING ABA MEASUREMENTS 7
3.1. ABA measurements in the time domain
Figure6ashows the resulting vibrations at the axle of the vehicle-track interactions in the proximity
of the reference RJ.Thus, many vibrations are included in the final measured signal. To extract
the information related to rail joint bolt tightness condition, the signals were band-pass filtered
between 150 and 1200 Hz (see Figure6b). This was necessary to remove the frequency components
lower than 150 Hzwhich had a high energy concentration due to the low vehicle speed (21
km/h) and which would otherwise have submerged the frequency components related to the bolt
tightness condition of the RJs at this speed. At frequencies higher than 1200 Hz, no relevant energy
concentrations were observed.
distance, [m]-0.5 0 0.5
acce
lera
tion,
[m/s
2 ]
-50
0
50
v
(a)
distance, [m]-0.5 0 0.5
acce
lera
tion,
[m/s
2 ]
-30
-20
-10
0
10
20
30
v
(b)
Figure 6. Example ofmeasured ABA accelerations at a RJ: (a) without filter and (b) with a band-pass filterof 150-1200 Hz.
3.2. Data analysis based on wavelets
The wavelet transform analysis is used to extract signature tunes from the ABA measurements.
With wavelet transform, the energy content of the accelerations can be obtained as a function
of frequency and position along the track. One major advantage of wavelets is that the time-
frequency representation is not dependent on the scale (or window size). Therefore, wavelet analysis
is appropriate for investigation of non-stationary phenomena with local changes in the frequency
components. For example, the frequency range and position of track irregularities, such as rail joints,
can be identified.
Continuous wavelet transform (CWT) is a time-frequency analysis tool, where convolutions of
the analyzed signal with a group of shifted and scaled wavelet functions are calculated (21). CWT
Copyright c© 2014 JohnWiley & Sons, Ltd. Struct. Control Health Monit.(2014)
Prepared usingstcauth.cls DOI: 10.1002/stc
Page 7 of 22
123456789101112131415161718192021222324252627282930313233343536373839404142434445464748495051525354555657585960
Please cite as: M. Oregui, S. Li, A. Núñez, Z. Li, R. Carroll, and R. Dollevoet, “Monitoring bolt tightness of rail joints using axle box acceleration measurements”. Structural Control and Health Monitoring 24:e1848, 2017. DOI: 10.1002/stc.1848

For Peer Review
8 M. OREGUI ET AL.
canbe defined according to (1).
Wx (s, τ) =
∫ ∞
−∞
x(t)1√sψ∗
(
t− τ
s
)
dt (1)
wherex(t) is the analyzed signal,ψ(t) is a mother wavelet,1√sψ(
t−τs
)
is a family of wavelets
deduced from the mother wavelet by different translations and scaling,τ is a continuous variable
for the translations,s is a wavelet scale withs > 0, and∗ indicates a complex conjugate. In this
work, the Morlet function (2) is used as mother wavelet.
ψ0 (η) = π−1/4eiωoηe−η2/2 (2)
whereω0 is a non-dimensionalfrequency.
To analyze the most relevant frequency components in a signal, the wavelet power spectrum
diagram (or scalogram) is calculated using the square of the wavelet coefficients∣
∣W 2x (s, τ)
∣
∣. An
example of ABA acceleration and its scalogram for measurements over a rail joint is shown in
Figure7. The rolling distance is shown on the horizontal axis, whereas frequency is indicated on the
vertical axis. In this case, a measurement along 1 meter is shown with the discontinuity of the RJ at
0 mm. The frequencies shown are between 150 and 1200 Hz. The amount of energy concentrated
at a certain frequency and location is indicated with different colors according to the colorbar. Blue
means low energy concentration, whereas red means high energy concentration.
Figure 7. Example of scalogram from ABA measurements at a RJ.
In this example,there is a high energy concentration between 150 and 400 Hz along 0.1 m after the
discontinuity. This frequency range results to be the signature tune for bolt tightness analysis, which
will be deducted in Section3. In addition there is a high frequency component at approximately
Copyright c© 2014 JohnWiley & Sons, Ltd. Struct. Control Health Monit.(2014)
Prepared usingstcauth.cls DOI: 10.1002/stc
Page 8 of 22
123456789101112131415161718192021222324252627282930313233343536373839404142434445464748495051525354555657585960
Please cite as: M. Oregui, S. Li, A. Núñez, Z. Li, R. Carroll, and R. Dollevoet, “Monitoring bolt tightness of rail joints using axle box acceleration measurements”. Structural Control and Health Monitoring 24:e1848, 2017. DOI: 10.1002/stc.1848

For Peer Review
MONITORING BOLT TIGHTNESS OF RAIL JOINTS USING ABA MEASUREMENTS 9
1000 Hz just afterthe discontinuity. Due to its short duration and the high frequency, it is most
likely closely related to the wheel-rail impact. These frequency ranges are investigated in Section3.
The wavelet diagrams give a good overview of the energy distribution in frequency and location.
However, similarities and differences in frequency between measurements are difficult to quantify.
To facilitate the comparison, global wavelet spectraW2
(s, τ) are computed, which aredefined as
the wavelet spectrum averaged over the spectra (22). The global wavelet spectrum is calculated in a
discretized procedure, according to(3). The values ofW2
(s, τ) estimates the powerspectrum of a
time series in an unbiased and consistent manner (23).
W2
(s, τ) =1
N
N−1∑
n=0
|Wn (s, τ)|2 (3)
whereN is the number of position points. The magnitude of the impact between wheel and
rail fluctuates for different bolt tightness conditions, so that the global wavelet spectrum reaches
different energy values. To facilitate the comparison between different cases, global wavelet spectra
are normalized by its maximum value, see (4).
W2
N(s, τ) =
W2
(s, τ)
maxs,τ
{
W2
(s, τ)} (4)
3.3. Referencerail joint analysis
Figure8 shows the scalograms of the measured accelerations when the tram was running in the B
direction for the five tightness conditions proposed in the methodology. Two tram passages are
shown for each bolt loading conditions. The two measurements do not show exactly the same
frequency distribution and energy magnitude. This slight disagreement is because the wheels may
not run precisely along the same trajectory over the rail so that the wheel-rail contact and the stiffness
of the system differ to certain degree each time. This means that each measurement collects the
general characteristics of the system, in this case, for instance, the energy concentration between
150 and 600 Hz, as well as local characteristics which depend on the contact location. Figure8b
corresponds to the wavelet power spectrum diagram of the nominal bolt tightness condition (i.e. 270
Nm). For the nominal condition, most of the energy is concentrated between the beginning of the
gap at 0 m and the 3rd bolt at 0.05 m. The dominant frequency range covers between 150 and 600
Hz. Moreover, the measurement shows energy concentration at approximately 920 Hz immediately
after the gap. No energy concentration is noticed at the end of the RJ at 0.20 m.
Copyright c© 2014 John Wiley & Sons, Ltd. Struct. Control Health Monit.(2014)
Prepared usingstcauth.cls DOI: 10.1002/stc
Page 9 of 22 http://mc.manuscriptcentral.com/stc
123456789101112131415161718192021222324252627282930313233343536373839404142434445464748495051525354555657585960
Please cite as: M. Oregui, S. Li, A. Núñez, Z. Li, R. Carroll, and R. Dollevoet, “Monitoring bolt tightness of rail joints using axle box acceleration measurements”. Structural Control and Health Monitoring 24:e1848, 2017. DOI: 10.1002/stc.1848

For Peer Review
10 M. OREGUI ET AL.
To facilitate the comparison of the responses at different bolt tightness conditions, the global
wavelet spectra were calculated and the obtained values were normalized by their corresponding
maximum value, as explained in the previous section. Figure8 shows the normalized global wavelet
spectrum for the Aand B traffic directions. First, all the measurements show a dominant peak
between 380-420 Hz which can be identified as the characteristic frequency of the reference RJ.
This is not the axial tyre mode of the resilient wheel calculated at 433 Hz(see the numerical modal
analysis of the resilientwheel in Appendix A) because this mode vibrates in the axial direction
whereas the ABAmeasurements are in the vertical direction. Furthermore, the rubber layer of the
wheel performs a decoupling between the tyre and the web so that tyre modes barely disturb the web
and axle, on which the sensors were mounted. The maximum energy is concentrated on the 380-420
Hz peak, except when the plate is completely loose (i.e. 0 Nm in Figure8j). Thus, when the rail
joint does not fulfillits purpose of connecting the two rail ends, the dominant frequencies changes
with respect to the nominal conditions. Second, different running directions of the tram result in
different normalized global wavelet spectrum diagrams. If bolts are looser, energy concentrates at
low frequencies. If the tram travels in the A direction, loose bolts mean the appearance of a dominant
frequency around 250 Hz. This trend is observed by comparing the 150Nm, 150-0Nm and 0Nm
cases in Figures8h,8i and8j, respectively. Whereas if the tram travels in the B direction, loose bolts
mean the appearance ofone dominant frequency around 150 Hz and another at approximately 920
Hz. As the 250 Hz component is only observed in one direction, this frequency does not correspond
to the flexural axle mode of the resilient wheel(seeAppendix A)because then, it should be present
in the measurements of bothdirections.
The differences between the two traffic directions were further investigated by analyzing the
measured rail vertical-longitudinal profiles. Figure9 shows that there was a misalignment between
the rail ends. Themisalignment seems not compatible with the traffic directions because traffic
runs in both directions so that symmetric rail end geometry was expected. Rail end misalignment
was most probably caused by the field test, in which the reference RJ was reassembled one week
before the test, and during the test the tightness of bolts was changed from nominal value to being
completely loose. This misalignment is therefore a disturbance to the local track system, and is
causing impact between wheel and rail when the tram is traveling in the B direction. This impact
explains the difference between the two directions. Due to the impact, a significant amount of energy
concentrates at approximately 920 Hz when the wheel rolls from the gap to the end of the rail joint
at 0.2 m. This presence of the energy concentration is not observed in the A direction. As it is shown
Copyright c© 2014 John Wiley & Sons, Ltd. Struct. Control Health Monit.(2014)
Prepared usingstcauth.cls DOI: 10.1002/stc
Page 10 of 22
123456789101112131415161718192021222324252627282930313233343536373839404142434445464748495051525354555657585960
Please cite as: M. Oregui, S. Li, A. Núñez, Z. Li, R. Carroll, and R. Dollevoet, “Monitoring bolt tightness of rail joints using axle box acceleration measurements”. Structural Control and Health Monitoring 24:e1848, 2017. DOI: 10.1002/stc.1848

For Peer Review
MONITORING BOLT TIGHTNESS OF RAIL JOINTS USING ABA MEASUREMENTS 11
(a) 320 Nm (b) 270 Nm (c) 150 Nm (d) 150-0 Nm (e) 0 Nm
200 400 800 12000
0.2
0.4
0.6
0.8
1
frequency, [Hz]
W2 N(s,τ)
BA
(f) 320 Nm
200 400 800 12000
0.2
0.4
0.6
0.8
1
frequency, [Hz]
W2 N(s,τ)
BA
(g) 270 Nm
200 400 800 12000
0.2
0.4
0.6
0.8
1
frequency, [Hz]
W2 N(s,τ)
BA
(h) 150 Nm
200 400 800 12000
0.2
0.4
0.6
0.8
1
frequency, [Hz]
W2 N(s,τ)
BA
(i) 150-0 Nm
200 400 800 12000
0.2
0.4
0.6
0.8
1
frequency, [Hz]
W2 N(s,τ)
BA
(j) 0 Nm
Figure 8. Scalograms fordifferent bolt tightness conditions in B direction (a-e), and normalized globalwavelet diagram for different bolt tightness conditions in A and B directions (f-j).
in Figure9, the misalignment increases if the bolts become looser, so that the impact between wheel
and rail is larger and consequently, the energy concentrated at this frequency increases. The increase
in energy concentration at approximately 920 Hz is observed by comparing from left to right the
normalized global wavelet spectrum diagrams in lower row in Figure8).
−0.5 −0.3 −0.1 0 0.1 0.3 0.5−2.5
−2
−1.5
−1
−0.5
0
A
B
Rail longitudinal, [m]
Rai
l ver
tical
, [m
m]
320Nm270Nm150Nm150−0Nm
Figure 9. Measured rail vertical-longitudinal profile at the reference RJ for different bolt tightness conditions.Arrows indicate the rolling directions A and B.
In addition to the misalignment, the reassembling of the RJ may have altered other track
components, such as the condition of the support in the vicinity of the reference RJ. The sleepers
nearby the RJ may be slightly differently supported. Disturbances in sleeper and ballast conditions
Copyright c© 2014 John Wiley & Sons, Ltd. Struct. Control Health Monit.(2014)
Prepared usingstcauth.cls DOI: 10.1002/stc
Page 11 of 22
123456789101112131415161718192021222324252627282930313233343536373839404142434445464748495051525354555657585960
Please cite as: M. Oregui, S. Li, A. Núñez, Z. Li, R. Carroll, and R. Dollevoet, “Monitoring bolt tightness of rail joints using axle box acceleration measurements”. Structural Control and Health Monitoring 24:e1848, 2017. DOI: 10.1002/stc.1848

For Peer Review
12 M. OREGUI ET AL.
may cause the difference in low frequency between the two running directions (i.e. peak at 150
or 250 Hz) because these track components are dominant contributors to the response of the track
in this frequency range (24;25).The differences in support conditions may also explain the two
different slopes ofthe rail end tops towards the gap, as symmetry was expected because the traffic at
the track site is bidirectional. These slopes may be caused by increased settlements, which are often
larger at supports close to rail joints than at supports on continuous track due to higher loads (26).
Plastic deformation of therail end top may have also contributed to the development of the slopes.
If the wheel-rail contact forces due to impact are high enough, plastic deformation occurs on the
rail top after the gap. Consequently, the hardness of the rail top increases, as it was measured at
insulated rail joints (27). The field observations of (27) showed that the hardness decreases with
distance with respect tothe gap. This is, less plastic deformation occurs further from the gap, and
consequently, an slope develops on the rail top. In our case, as the track studied is bidirectional, the
plastic deformation may have happened on both rail end tops resulting in two slopes. Also, slight
different rolling conditions may have led to differential wear. In summary, the slope of the rail ends
towards the gap may be caused by increased settlements and plastic deformation.
3.4. Bolt Tightness and Alignment Detection Algorithm
A detection algorithm is proposed based on the analysis of the measurements at the reference RJ.
The decisions are taken according to the value of the normalized global wavelet spectrumW2
N(s, τ)
from (4) at the identified three characteristic frequencies: (1) 250 Hz (A direction) or 150 Hz(B
direction), (2) 380-420 Hz and (3) 920 Hz. The parameters of the algorithm are tuned according to
the experimental analysis described in the previous section. The detection algorithm evaluates bolt
tightness condition of half RJ after the discontinuity, which is the half RJ excited by the wheel-rail
impact. So for instance, bolts number 1 and 2 can be assessed when the tram travels in A direction;
whereas bolts number 3 and 4 when the tram travels in B direction. The following simple expert
system with three steps is proposed:
Step 1 Is the half RJ tight?
• A direction:
– If W2
N(s, τ) at 250 Hz is≥ 0.6, then the half RJ islooseor half-tight.
– Otherwise, ifW2
N(s, τ) at 250 Hz is< 0.6, then the half RJ istight.
• B direction:
– If W2
N(s, τ) at 150 Hzis ≥ 0.6, then the half RJ islooseor half-tight.
Copyright c© 2014 John Wiley & Sons, Ltd. Struct. Control Health Monit.(2014)
Prepared usingstcauth.cls DOI: 10.1002/stc
Page 12 of 22
123456789101112131415161718192021222324252627282930313233343536373839404142434445464748495051525354555657585960
Please cite as: M. Oregui, S. Li, A. Núñez, Z. Li, R. Carroll, and R. Dollevoet, “Monitoring bolt tightness of rail joints using axle box acceleration measurements”. Structural Control and Health Monitoring 24:e1848, 2017. DOI: 10.1002/stc.1848

For Peer Review
MONITORING BOLT TIGHTNESS OF RAIL JOINTS USING ABA MEASUREMENTS 13
– Otherwise, ifW2
N(s, τ) at 150 Hz is< 0.6, then the half RJ istight.
Step 2 If the half RJ is not tight,
• A or B direction:
– If W2
N(s, τ) around 380-420 Hz is≈ 1, then the half RJ ishalf-tight.
– Otherwise, ifW2
N(s, τ) around 380-420 Hz is< 1, then the half RJ isloose.
Step 3 Is there a misalignment between rail ends?
• A or B direction:
– If W2
N(s, τ) around 920 Hz is≥ 0.1, then there is misalignment.
– Otherwise, ifW2
N(s, τ) around 920 Hz is< 0.1, then there is not misalignment.
4. CASE STUDY
The proposed methodology to monitor bolt tightness condition was assessed by investigating two
rail joints that were not used for tuning the detection algorithm. First the detection algorithm
predicted their condition based on measured ABA signals, and later the bolt tightness condition
was measured on the field. In this manner, the prediction was verified.
4.1. Track site
The test track site was the Meadow hall curve of the Supertram network in Sheffield. An overview
of the test location is shown in Figure10a. The traffic runs in both directions. The BS-80A rail,
with 1/40 inclination, wassupported by wooden sleepers every 0.6 m. There were no railpads in
the track. At rail joints, the nominal rail gap was 6 mm. The two rail joints chosen for validation
(hereinafter denoted as RJ3 and RJ5) are on the outer rail and are shown in Figure11aand11e. The
locations of the tworail joints with respect to the reference RJ is shown in Figure10b.
4.2. Prediction
The axle boxresponses to RJ3 and RJ5 were measured during the tests. The measured ABA signals
were post-processed, and the scalograms and normalized global wavelet spectra calculated as shown
in Figure11. For the two rail joints of validation, the RJ characteristic frequency is observed at 420
Hz in both travel directions, in contrast to the reference RJ which showed two different characteristic
frequencies at 380 and 420 Hz depending on the rolling direction (see Figure8). Whereas RJ3 and
Copyright c© 2014 John Wiley & Sons, Ltd. Struct. Control Health Monit.(2014)
Prepared usingstcauth.cls DOI: 10.1002/stc
Page 13 of 22
123456789101112131415161718192021222324252627282930313233343536373839404142434445464748495051525354555657585960
Please cite as: M. Oregui, S. Li, A. Núñez, Z. Li, R. Carroll, and R. Dollevoet, “Monitoring bolt tightness of rail joints using axle box acceleration measurements”. Structural Control and Health Monitoring 24:e1848, 2017. DOI: 10.1002/stc.1848
For Peer Review
14 M. OREGUI ET AL.
(a)
A
B
RJref
RJ5
RJ3
16,4 m
49,6 m
(b)
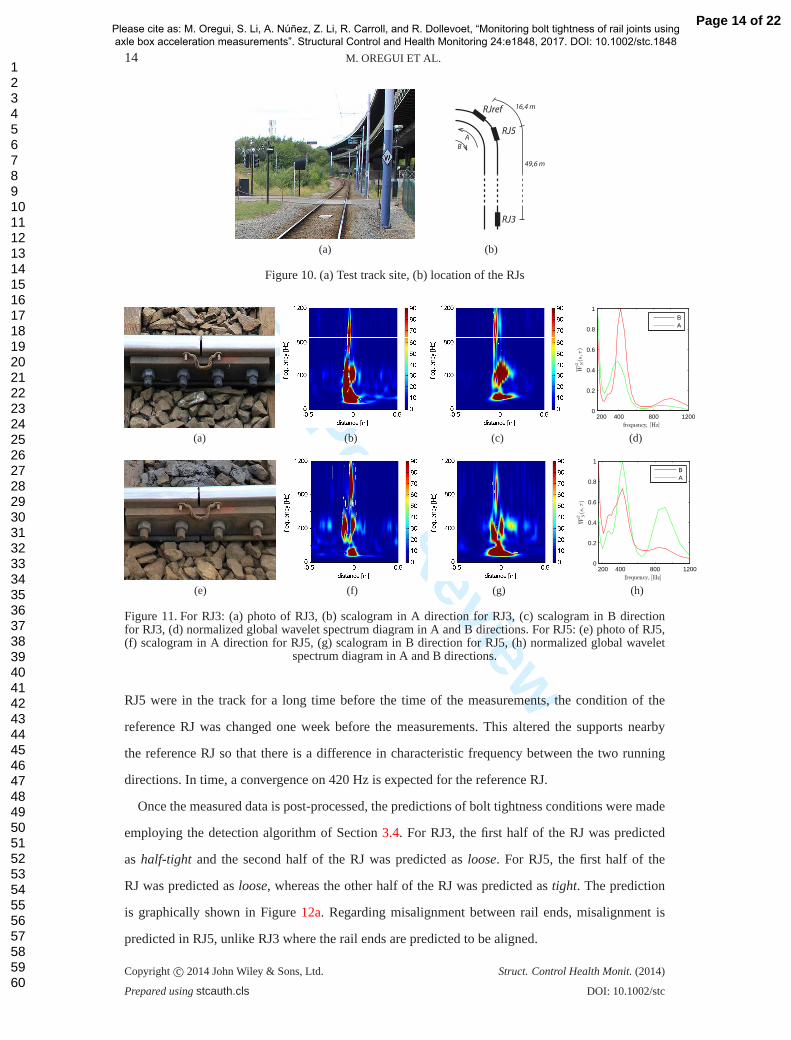
Figure 10. (a) Testtrack site, (b) location of the RJs
(a) (b) (c)
200 400 800 12000
0.2
0.4
0.6
0.8
1
frequency, [Hz]
W2 N(s,τ)
BA
(d)
(e) (f) (g)
200 400 800 12000
0.2
0.4
0.6
0.8
1
frequency, [Hz]W
2 N(s,τ)
BA
(h)
Figure 11. For RJ3:(a) photo of RJ3, (b) scalogram in A direction for RJ3, (c) scalogram in B directionfor RJ3, (d) normalized global wavelet spectrum diagram in A and B directions. For RJ5: (e) photo of RJ5,(f) scalogram in A direction for RJ5, (g) scalogram in B direction for RJ5, (h) normalized global wavelet
spectrum diagram in A and B directions.
RJ5 were in the track for a long time before the time of the measurements, the condition of the
reference RJ was changed one week before the measurements. This altered the supports nearby
the reference RJ so that there is a difference in characteristic frequency between the two running
directions. In time, a convergence on 420 Hz is expected for the reference RJ.
Once the measured data is post-processed, the predictions of bolt tightness conditions were made
employing the detection algorithm of Section3.4. For RJ3, the first half of the RJ was predicted
as half-tight and the second half ofthe RJ was predicted asloose. For RJ5, the first half of the
RJ was predicted asloose, whereas the other half of the RJ was predicted astight. The prediction
is graphically shown in Figure12a. Regarding misalignment between rail ends, misalignment is
predicted in RJ5, unlikeRJ3 where the rail ends are predicted to be aligned.
Copyright c© 2014 John Wiley & Sons, Ltd. Struct. Control Health Monit.(2014)
Prepared usingstcauth.cls DOI: 10.1002/stc
Page 14 of 22
123456789101112131415161718192021222324252627282930313233343536373839404142434445464748495051525354555657585960
Please cite as: M. Oregui, S. Li, A. Núñez, Z. Li, R. Carroll, and R. Dollevoet, “Monitoring bolt tightness of rail joints using axle box acceleration measurements”. Structural Control and Health Monitoring 24:e1848, 2017. DOI: 10.1002/stc.1848
For Peer Review
MONITORING BOLT TIGHTNESS OF RAIL JOINTS USING ABA MEASUREMENTS 15
A
RJref
RJ5
RJ3
loosehalf-tight
tightloose
B
(a)
A
RJref
RJ5
RJ3
loosehalf-tight
tightloose
loose
Algorithm to
be improved
B
(b)
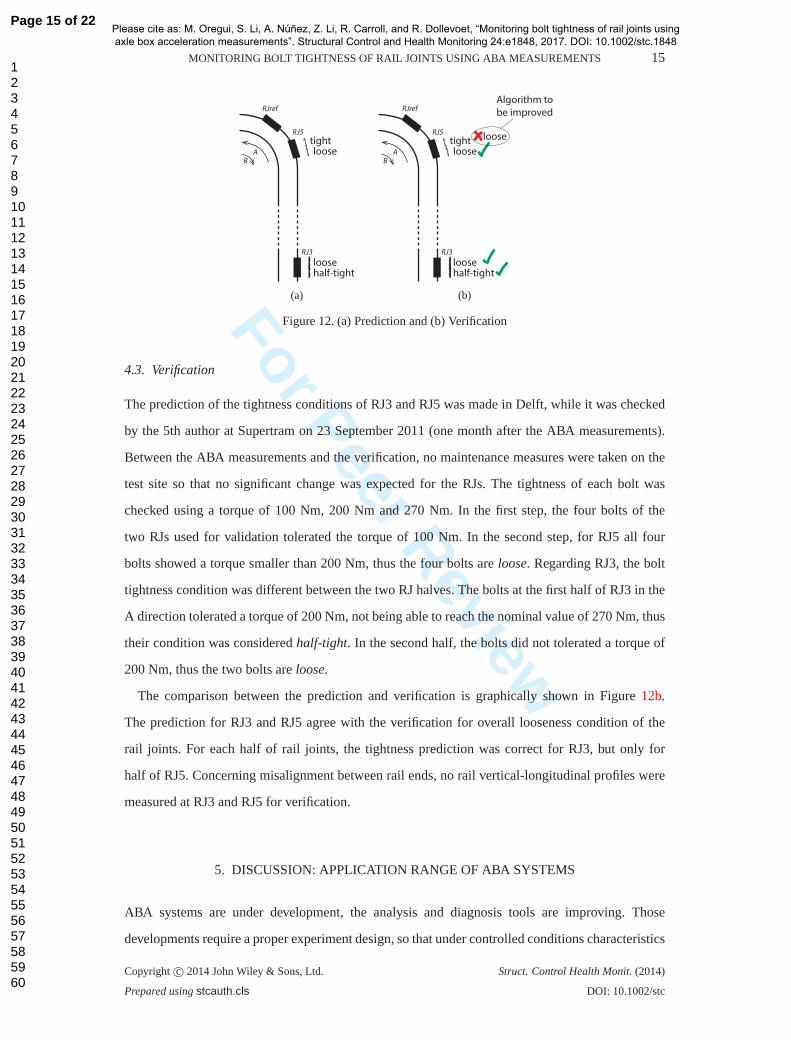
Figure 12. (a) Predictionand (b) Verification
4.3. Verification
The prediction of the tightness conditions of RJ3 and RJ5 was made in Delft, while it was checked
by the 5th author at Supertram on 23 September 2011 (one month after the ABA measurements).
Between the ABA measurements and the verification, no maintenance measures were taken on the
test site so that no significant change was expected for the RJs. The tightness of each bolt was
checked using a torque of 100 Nm, 200 Nm and 270 Nm. In the first step, the four bolts of the
two RJs used for validation tolerated the torque of 100 Nm. In the second step, for RJ5 all four
bolts showed a torque smaller than 200 Nm, thus the four bolts areloose. Regarding RJ3, the bolt
tightness condition was different between the two RJ halves. The bolts at the first half of RJ3 in the
A direction tolerated a torque of 200 Nm, not being able to reach the nominal value of 270 Nm, thus
their condition was consideredhalf-tight. In the second half, the bolts did not tolerated a torque of
200 Nm, thus the two bolts areloose.
The comparison between the prediction and verification is graphically shown in Figure12b.
The prediction for RJ3and RJ5 agree with the verification for overall looseness condition of the
rail joints. For each half of rail joints, the tightness prediction was correct for RJ3, but only for
half of RJ5. Concerning misalignment between rail ends, no rail vertical-longitudinal profiles were
measured at RJ3 and RJ5 for verification.
5. DISCUSSION: APPLICATION RANGE OF ABA SYSTEMS
ABA systems are under development, the analysis and diagnosis tools are improving. Those
developments require a proper experiment design, so that under controlled conditions characteristics
Copyright c© 2014 John Wiley & Sons, Ltd. Struct. Control Health Monit.(2014)
Prepared usingstcauth.cls DOI: 10.1002/stc
Page 15 of 22
123456789101112131415161718192021222324252627282930313233343536373839404142434445464748495051525354555657585960
Please cite as: M. Oregui, S. Li, A. Núñez, Z. Li, R. Carroll, and R. Dollevoet, “Monitoring bolt tightness of rail joints using axle box acceleration measurements”. Structural Control and Health Monitoring 24:e1848, 2017. DOI: 10.1002/stc.1848
For Peer Review
16 M. OREGUI ET AL.
of the track can be correctly correlated with ABA measurements. In this paper, a method to monitor
invisible damage, such as loose bolts, was presented using an ABA system. In addition to the ability
to detect invisible damage, the experimental analysis has given insight into the capacity of ABA
systems regarding measurement speed and vehicle type.
First, measurements were performed at 21 km/h, which is significantly lower than the usual ABA
measurement speeds of 80-100 km/h (18). High speeds are commonly employed because wheel-rail
impact is largerat small defects such as light squat, so that signature tunes are excited with more
energy, and consequently, they are easier to find in measured signals. At rail joints, the opposite
happens. Contrary to small rail defects, the discontinuity between rail ends is large (i.e. 6 mm gap)
so that when the wheel rolls over the discontinuity large impact occurs, even at low rolling speeds.
Thus, although high rolling speeds are employed to shorten measurement times, ABA systems are
able to detect defects at low speeds.
Second, the ABA prototype system was installed in a tram. The vehicle was significantly lighter
than the vehicles usually employed in mainlines. The vehicle weight could have affected the analysis
because lighter vehicles cause smaller impacts than heavier vehicles and consequently, signature
tunes are excited with less energy which may make the detection more difficult. However, the ABA
detection system worked when mounted in the tram.
Third, the presence of flexible wheels (also called resilient wheels) did not hinder the detection
capacity of the ABA measurement system. Resilient wheels are used to prevent some of the track
vibrations from reaching the vehicle and to reduce acoustic noise levels. In the case of this paper,
the resilient material layer between wheel tyre and web did not eliminate the signature tunes related
to bolt tightness and rail end misalignment. The influence of resilient wheels on detecting other type
of defects should be investigated in the future.
In summary, the successful experimental investigation has shown that ABA systems could be
employed in light rail systems, such as tram and metro lines, where rolling speeds are usually lower
than in mainlines, vehicles are lighter and resilient wheels are often used.
6. CONCLUSIONS
The capacity of Axle Box Acceleration (ABA) detection and monitoring system for evaluating bolt
tightness condition at rail joints (RJs) was experimentally investigated. First, the detection algorithm
was developed based on controlled tests at a RJ with different bolt tightness conditions. Then, the
bolt tightness condition of other RJs was used for verification of the method.
Copyright c© 2014 John Wiley & Sons, Ltd. Struct. Control Health Monit.(2014)
Prepared usingstcauth.cls DOI: 10.1002/stc
Page 16 of 22
123456789101112131415161718192021222324252627282930313233343536373839404142434445464748495051525354555657585960
Please cite as: M. Oregui, S. Li, A. Núñez, Z. Li, R. Carroll, and R. Dollevoet, “Monitoring bolt tightness of rail joints using axle box acceleration measurements”. Structural Control and Health Monitoring 24:e1848, 2017. DOI: 10.1002/stc.1848

For Peer Review
MONITORING BOLT TIGHTNESS OF RAIL JOINTS USING ABA MEASUREMENTS 17
The experimental analysis hasshown that:
• From ABA measurements, three states can be distinguished: tight RJ, intermediate loose RJ
and completely loose RJ.
• ABA detection systems may be used for light rail systems, low speeds and resilient wheels.
Future work include the further extension of the ABA detection system to other types of damage
at rail joints, such as cracks in the rail web, insulated rail joints, which are found in many
networks worldwide, and broad range of speed, from metros to conventional railways. Developing
numerical models is also part of future work so that, for example, the vibration modes related to the
characteristic frequencies can be identified. Although measurements are required for calibration and
validation, the ABA system extension can be faster and easier based on more flexible and relatively
fast numerical models than on time-consuming, expensive and safety threatening field testing.
APPENDIX A. NUMERICAL MODAL ANALYSIS OF THE RESILIENT WHEEL
ABA measurements include both wheel and track vibrations. Thus, wheel vibrations should be
differentiated from track vibrations when ABA measurements are analyzed. One way to obtain
information of wheel dynamics is by modal analysis. For this purpose, a free suspended finite
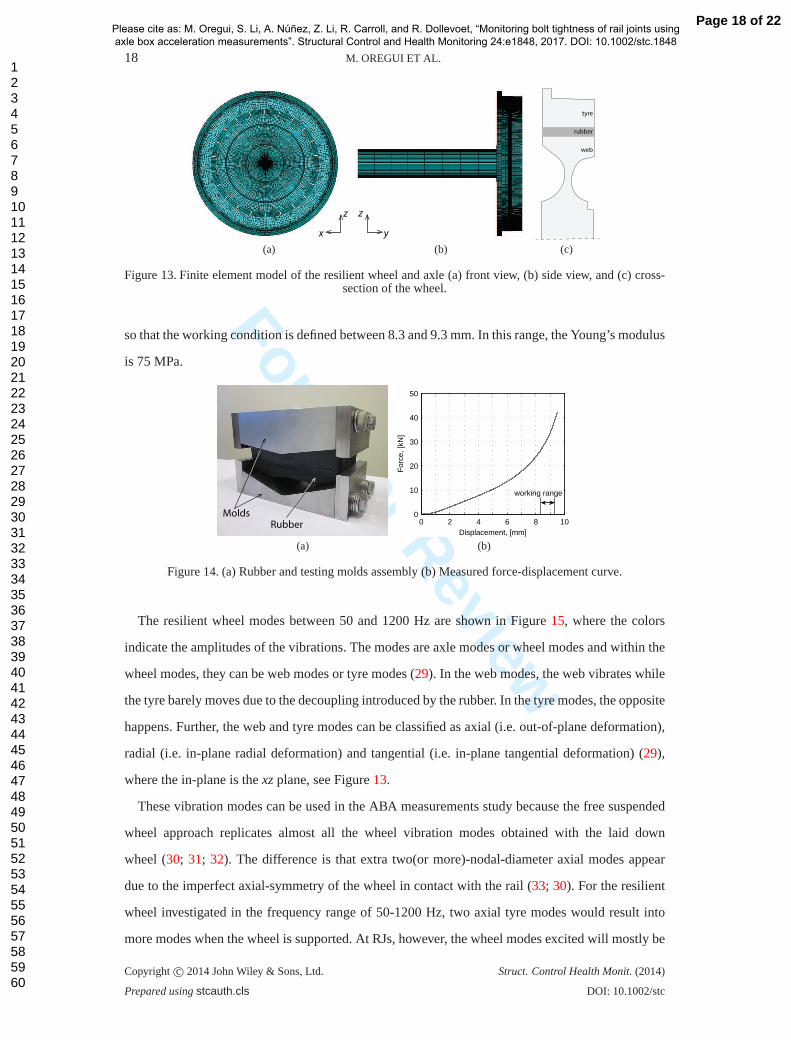
element (FE) of the test resilient wheel is developed. Figure13aand13bshow the single resilient
wheel and the half ofthe axle considered. The longitudinal direction is denoted asx, the lateral as
y, the vertical asz. The wheel consists of steel and has 22 rubber blocks between the tyre and the
web. A simplified nominal cross-section of the wheel is used and the rubber is modeled as a straight
band covering the whole width of the wheel to facilitate the modeling. The lateral confinement of
the rubber is considered by coupling in they-direction the displacements of the nodes on the lateral
surfaces of the rubber.
In modal analysis, materials are linear. Thus, the resilient wheel’s steel and rubber are defined
as elastic. For the steel, the Young’s modulus is 210 GPa, Poisson’s ratio is 0.3 and density is
7800 kg/m3. Regarding the rubber, its properties significantly influence the dynamic behavior of the
wheel (28). The density is 1190 kg/m3 and the Poisson’s ratiois assumed to be 0.49. The Young
modulus is obtained from laboratory force-displacement compression tests in which the molds of
the test resemble the real v-shape web-rubber-tyre geometry, see Figure14a. The resulting force-
displacement curve isshown in Figure14b. The rubber is pre-stressed when mounted in the wheel
Copyright c© 2014 John Wiley & Sons, Ltd. Struct. Control Health Monit.(2014)
Prepared usingstcauth.cls DOI: 10.1002/stc
Page 17 of 22
123456789101112131415161718192021222324252627282930313233343536373839404142434445464748495051525354555657585960
Please cite as: M. Oregui, S. Li, A. Núñez, Z. Li, R. Carroll, and R. Dollevoet, “Monitoring bolt tightness of rail joints using axle box acceleration measurements”. Structural Control and Health Monitoring 24:e1848, 2017. DOI: 10.1002/stc.1848
For Peer Review
18 M. OREGUI ET AL.
z
x
(a)
z
y
(b)
rubber
web
tyre
(c)
Figure 13. Finite elementmodel of the resilient wheel and axle (a) front view, (b) side view, and (c) cross-section of the wheel.
so that the working condition is defined between 8.3 and 9.3 mm. In this range, the Young’s modulus
is 75 MPa.
Molds
Rubber
(a)
0 2 4 6 8 100
10
20
30
40
50
working range
Displacement, [mm]
For
ce, [
kN]
(b)
Figure 14. (a) Rubberand testing molds assembly (b) Measured force-displacement curve.
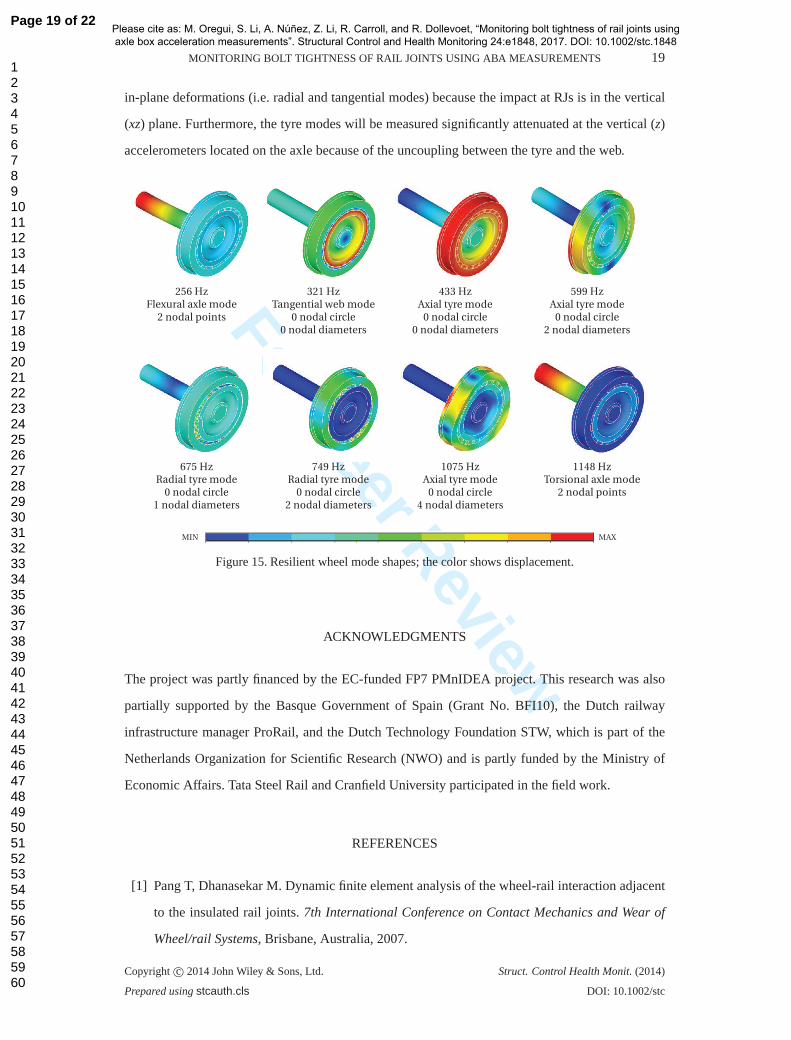
The resilient wheel modes between 50 and 1200 Hz are shown in Figure15, where the colors
indicate the amplitudes ofthe vibrations. The modes are axle modes or wheel modes and within the
wheel modes, they can be web modes or tyre modes (29). In the web modes, the web vibrates while
the tyre barely moves due to the decoupling introduced by the rubber. In the tyre modes, the opposite
happens. Further, the web and tyre modes can be classified as axial (i.e. out-of-plane deformation),
radial (i.e. in-plane radial deformation) and tangential (i.e. in-plane tangential deformation) (29),
where the in-plane isthexzplane, see Figure13.
These vibration modes canbe used in the ABA measurements study because the free suspended
wheel approach replicates almost all the wheel vibration modes obtained with the laid down
wheel (30;31; 32). The difference is that extra two(or more)-nodal-diameter axial modes appear
due to the imperfectaxial-symmetry of the wheel in contact with the rail (33; 30). For the resilient
wheel investigated in the frequency range of 50-1200 Hz, two axial tyre modes would result into
more modes when the wheel is supported. At RJs, however, the wheel modes excited will mostly be
Copyright c© 2014 John Wiley & Sons, Ltd. Struct. Control Health Monit.(2014)
Prepared usingstcauth.cls DOI: 10.1002/stc
Page 18 of 22
123456789101112131415161718192021222324252627282930313233343536373839404142434445464748495051525354555657585960
Please cite as: M. Oregui, S. Li, A. Núñez, Z. Li, R. Carroll, and R. Dollevoet, “Monitoring bolt tightness of rail joints using axle box acceleration measurements”. Structural Control and Health Monitoring 24:e1848, 2017. DOI: 10.1002/stc.1848
For Peer Review
MONITORING BOLT TIGHTNESS OF RAIL JOINTS USING ABA MEASUREMENTS 19
in-plane deformations (i.e. radialand tangential modes) because the impact at RJs is in the vertical
(xz) plane. Furthermore, the tyre modes will be measured significantly attenuated at the vertical (z)
accelerometers located on the axle because of the uncoupling between the tyre and the web.
1148 HzTorsional axle mode
2 nodal points
1075 HzAxial tyre mode
0 nodal circle4 nodal diameters
749 HzRadial tyre mode
0 nodal circle2 nodal diameters
675 HzRadial tyre mode
0 nodal circle1 nodal diameters
599 HzAxial tyre mode
0 nodal circle2 nodal diameters
433 HzAxial tyre mode
0 nodal circle0 nodal diameters
321 HzTangential web mode
0 nodal circle0 nodal diameters
256 HzFlexural axle mode
2 nodal points
MAXMIN
Figure 15. Resilient wheel mode shapes; the color shows displacement.
ACKNOWLEDGMENTS
The projectwas partly financed by the EC-funded FP7 PMnIDEA project. This research was also
partially supported by the Basque Government of Spain (Grant No. BFI10), the Dutch railway
infrastructure manager ProRail, and the Dutch Technology Foundation STW, which is part of the
Netherlands Organization for Scientific Research (NWO) and is partly funded by the Ministry of
Economic Affairs. Tata Steel Rail and Cranfield University participated in the field work.
REFERENCES
[1] Pang T, Dhanasekar M. Dynamic finite element analysis of the wheel-rail interaction adjacent
to the insulated rail joints.7th International Conference on Contact Mechanics and Wear of
Wheel/rail Systems, Brisbane, Australia, 2007.
Copyright c© 2014 John Wiley & Sons, Ltd. Struct. Control Health Monit.(2014)
Prepared usingstcauth.cls DOI: 10.1002/stc
Page 19 of 22
123456789101112131415161718192021222324252627282930313233343536373839404142434445464748495051525354555657585960
Please cite as: M. Oregui, S. Li, A. Núñez, Z. Li, R. Carroll, and R. Dollevoet, “Monitoring bolt tightness of rail joints using axle box acceleration measurements”. Structural Control and Health Monitoring 24:e1848, 2017. DOI: 10.1002/stc.1848
For Peer Review
20 M. OREGUI ET AL.
[2] Jenkins H, Stephenson J, Clayton G, Morland G, Lyon D. Effect of track and vehicle
parameters on wheel/rail vertical dynamic forces.Railw Eng J1974;3(1):2–16.
[3] Kabo E, Nielsen J, Ekberg A. Prediction of dynamic train-track interaction and subsequent
material deterioration in the presence of insulated rail joints.Vehicle System Dynamics2006;
44(SUPPL. 1):718–729.
[4] Remennikov A, Kaewunruen S. A review of loading conditions for railway track structures
due to train and track vertical interaction.Structural Control and Health Monitoring2008;
15(2):207–234.
[5] Li Z, Zhao X, Dollevoet R, Molodova M. Differential wear and plastic deformation as causes
of squat at track local stiffness change combined with other track short defects.Vehicle System
Dynamics2008;46(SUPPL.1):237–246.
[6] Bandula-Heva T, Dhanasekar M, Boyd P. Experimental investigation of wheel/rail rolling
contact at railhead edge.Experimental Mechanics2013;53(6):943–957.
[7] Ph Papaelias M, Roberts C, Davis CL. A review on non-destructive evaluation of rails: State-
of-the-art and future development.Proceedings of the Institution of Mechanical Engineers,
Part F: Journal of Rail and Rapid Transit2008;222(4):367–384.
[8] Mazzeo P, Nitti M, Stella E, Distante A. Visual recognition of fastening bolts for railroad
maintenance.Pattern Recognition Letters2004;25(6):669–677.
[9] Clark R. Rail flaw detection: Overview and needs for future developments.NDT and E
International2004;37(2):111–118.
[10] Loveday P. Guided wave inspection and monitoring of railway track.Journal of Nondestructive
Evaluation2012;31(4):303–309. Cited By (since 1996)4.
[11] Deliverable D21 of ACEM-Rail. Report on railway inspection and monitoring techniques
analysis of different approaches.http://www.acem-rail.eu/documents.html
2011.
[12] Weston P, Ling C, Goodman C, Roberts C, Li P, Goodall R. Monitoring lateral track
irregularity from in-service railway vehicles.Proceedings of the Institution of Mechanical
Engineers, Part F: Journal of Rail and Rapid Transit2007;221(1):89–100.
Copyright c© 2014 John Wiley & Sons, Ltd. Struct. Control Health Monit.(2014)
Prepared usingstcauth.cls DOI: 10.1002/stc
Page 20 of 22
123456789101112131415161718192021222324252627282930313233343536373839404142434445464748495051525354555657585960
Please cite as: M. Oregui, S. Li, A. Núñez, Z. Li, R. Carroll, and R. Dollevoet, “Monitoring bolt tightness of rail joints using axle box acceleration measurements”. Structural Control and Health Monitoring 24:e1848, 2017. DOI: 10.1002/stc.1848

For Peer Review
MONITORING BOLT TIGHTNESS OF RAIL JOINTS USING ABA MEASUREMENTS 21
[13] Bocciolone M, Caprioli A, Cigada A, Collina A. A measurement system for quick
rail inspection and effective track maintenance strategy.Mechanical Systems and Signal
Processing2007;21(3):1242–1254.
[14] Lee J, Choi S, Kim SS, Park C, Kim Y. A mixed filtering approach for track condition
monitoring using accelerometers on the axle box and bogie.IEEE Transactions on
Instrumentation and Measurement2012;61(3):749–758.
[15] Molodova M, Li Z, Dollevoet R. Axle box acceleration: Measurement and simulation for
detection of short track defects.Wear2011;271(1-2):349–356.
[16] Cantero D, Basu B. Railway infrastructure damage detection using wavelet transformed
acceleration response of traversing vehicle.Structural Control and Health Monitoring2014;
doi:10.1002/stc.1660.
[17] Oregui M, Li Z, Dollevoet R. Identification of characteristic frequencies of damaged railway
tracks using field hammer test measurements.Mechanical Systems and Signal Processing
2014;54:224–242.
[18] Molodova M, Li Z, Nunez A, Dollevoet R. Automatic detection of squats in railway
infrastructure.IEEE Transactions on Intelligent Transportation Systems2014; 15(5):1980–
1990.
[19] Esveld, C. Railprof measurement device.http://www.esveld.com/railprof.htm
2014.
[20] Mandal N. Ratchettingof railhead material of insulated rail joints (irjs) with reference to
endpost thickness.Engineering Failure Analysis2014;45:347–362.
[21] Vetterli M, Kovacevic J.Wavelets and Subband Coding. Prentice Hall PTR, 1995.
[22] Torrence C, Compo G. A practical guide to wavelet analysis.Bulletin of the American
Meteorological Society1998;79(1):61–78.
[23] Percival D. On estimation of the wavelet variance.Biometrika1995;82(3):619–631.
[24] Wu T, Thompson D. The effects of local preload on the foundation stiffness and vertical
vibration of railway track.Journal of Sound and Vibration1999;219(5):881–904.
Copyright c© 2014 John Wiley & Sons, Ltd. Struct. Control Health Monit.(2014)
Prepared usingstcauth.cls DOI: 10.1002/stc
Page 21 of 22
123456789101112131415161718192021222324252627282930313233343536373839404142434445464748495051525354555657585960
Please cite as: M. Oregui, S. Li, A. Núñez, Z. Li, R. Carroll, and R. Dollevoet, “Monitoring bolt tightness of rail joints using axle box acceleration measurements”. Structural Control and Health Monitoring 24:e1848, 2017. DOI: 10.1002/stc.1848

For Peer Review
22 M. OREGUI ET AL.
[25] Sadeghi J. Field investigation on vibration behavior of railway track systems.International
Journal of Civil Engineering2010;8(3):232–241.
[26] Zong N, Askarinejad H, Heva T, Dhanasekar M. Service condition of railroad corridors around
the insulated rail joints.Journal of Transportation Engineering2013;139(6):643–650.
[27] Oregui M, Molodova M, Nunez A, Dollevoet R, Li Z. Experimental investigation into
the condition of insulated rail joints by impact excitation.Experimental Mechanics2015;
55(9):1597–1612.
[28] Cigada A, Manzoni S, Vanali M. Geometry effects on the vibro-acoustic behavior of railway
resilient wheels.JVC/Journal of Vibration and Control2011;17(12):1761–1778.
[29] Periard FJ. Wheel-rail noise generation: curve squealing by trams. Phd, Delft University of
Technology 1998.
[30] Cigada A, Manzoni S, Vanali M. On the vibro-acoustic behaviour of high-speed train wheels.
2006; 4283–4297.
[31] Cigada A, Manzoni S, Vanali M. Vibro-acoustic characterization of railway wheels.Applied
Acoustics2008;69(6):530–545.
[32] Glocker C, Cataldi-Spinola E, Leine R. Curve squealing of trains: Measurement, modelling
and simulation.Journal of Sound and Vibration2009;324(1-2):365–386.
[33] Thompson D. Wheel-rail noise generation, part iv: Contact zone and results.Journal of Sound
and Vibration1993;161(3):447–466.
Copyright c© 2014 John Wiley & Sons, Ltd. Struct. Control Health Monit.(2014)
Prepared usingstcauth.cls DOI: 10.1002/stc
Page 22 of 22
123456789101112131415161718192021222324252627282930313233343536373839404142434445464748495051525354555657585960
Please cite as: M. Oregui, S. Li, A. Núñez, Z. Li, R. Carroll, and R. Dollevoet, “Monitoring bolt tightness of rail joints using axle box acceleration measurements”. Structural Control and Health Monitoring 24:e1848, 2017. DOI: 10.1002/stc.1848