Delft University of Technology Modeling the Propeller ...
16
Delft University of Technology Modeling the Propeller Slipstream Effect on Lift and Pitching Moment Bouquet, Thijs; Vos, Roelof DOI 10.2514/6.2017-0236 Publication date 2017 Document Version Accepted author manuscript Published in 55th AIAA Aerospace Sciences Meeting Citation (APA) Bouquet, T., & Vos, R. (2017). Modeling the Propeller Slipstream Effect on Lift and Pitching Moment. In 55th AIAA Aerospace Sciences Meeting: Grapevine, Texas [AIAA 2017-0236] American Institute of Aeronautics and Astronautics Inc. (AIAA). https://doi.org/10.2514/6.2017-0236 Important note To cite this publication, please use the final published version (if applicable). Please check the document version above. Copyright Other than for strictly personal use, it is not permitted to download, forward or distribute the text or part of it, without the consent of the author(s) and/or copyright holder(s), unless the work is under an open content license such as Creative Commons. Takedown policy Please contact us and provide details if you believe this document breaches copyrights. We will remove access to the work immediately and investigate your claim. This work is downloaded from Delft University of Technology. For technical reasons the number of authors shown on this cover page is limited to a maximum of 10.
Transcript of Delft University of Technology Modeling the Propeller ...

Delft University of Technology
Modeling the Propeller Slipstream Effect on Lift and Pitching Moment
Bouquet, Thijs; Vos, Roelof
DOI10.2514/6.2017-0236Publication date2017Document VersionAccepted author manuscriptPublished in55th AIAA Aerospace Sciences Meeting
Citation (APA)Bouquet, T., & Vos, R. (2017). Modeling the Propeller Slipstream Effect on Lift and Pitching Moment. In 55thAIAA Aerospace Sciences Meeting: Grapevine, Texas [AIAA 2017-0236] American Institute of Aeronauticsand Astronautics Inc. (AIAA). https://doi.org/10.2514/6.2017-0236
Important noteTo cite this publication, please use the final published version (if applicable).Please check the document version above.
CopyrightOther than for strictly personal use, it is not permitted to download, forward or distribute the text or part of it, without the consentof the author(s) and/or copyright holder(s), unless the work is under an open content license such as Creative Commons.
Takedown policyPlease contact us and provide details if you believe this document breaches copyrights.We will remove access to the work immediately and investigate your claim.
This work is downloaded from Delft University of Technology.For technical reasons the number of authors shown on this cover page is limited to a maximum of 10.
Modeling the Propeller Slipstream Effect on Lift and
Pitching Moment
Thijs Bouquet∗ and Roelof Vos†
Delft University of Technology, Delft, 2600AA, the Netherlands
A semi-analytical prediction method is presented to predict the effect of the propellerslipstream on the lift and pitching moment of a propeller-powered aircraft. The methodassesses three effects caused by the propeller slipstream: an increase in lift over the wing dueto the slipstream, a change in the tail-off pitching moment, and a change in the horizontaltail contribution to the pitching moment due to increased downwash and (possibly) dynamicpressure. This prediction method is validated using wind tunnel data for the Fokker 50 anda special version of the Saab 340 with T-tail. The prediction method shows good correlationwith the experimental results for various combinations of flap deflection, angle-of-attack,and thrust coefficient. Further analysis of the results demonstrates that the propellerslipstream effect reduces the tail effectiveness due to an increase in downwash gradient atthe horizontal tail. Furthermore, it is shown that the effectiveness of the tail is influencedby the vertical position of the tail with respect to the slipstream due to slipstream inflowand a (possible) change dynamic pressure ratio.
I. Introduction
The implementation of propeller engines has significant implications with respect to the stability and controlof an aircraft. Due to the increased flow velocity over the wing and a propeller normal force, the pitchingmoments change due to the presence of a propeller slipstream. Furthermore, the increasing downwash andpotential increase in dynamic pressure over the tail also changes the effectiveness of the horizontal tail. Thesechanges must be taken into account to accurately determine the minimal horizontal tail surface area. Thecomplex nature of the propeller slipstream effect means that these implications are normally not incorporatedin the conceptual design phase. As Phillips1 says, “The effects of the propeller slipstream on other airplanesurfaces such as the wing, tail and fuselage are very complex and do not lend themselves to accurate analyticaltreatment. These effects can be accurately evaluated only from powered wind tunnel tests. Such tests arecommonly performed in the final phase of the airplane design process. Simply because of complexity, theslipstream effects are usually neglected in the preliminary design phase. It should be remembered, however,that the slipstream effects can be significant.” Therefore, the question that this paper is trying to answer is,“How can the propeller slipstream effect on the longitudinal stability and control of a conventional aircraftbe predicted quickly during the preliminary design phase?”
Figure 1 illustrates the helical vortex system resulting from a propeller blade advancing through the flow.The helical vortex system tends to deform and roll-up, producing a slipstream tube with strong variations inflow quantities. Although the slipstream can be described using many variables, only the following variablesare discussed in further detail as these are relevant for the modeling of the slipstream in relation to the topicof this paper: (1) Axial and swirl velocity profiles, (2) Contraction, and (3) installed propeller effects on thewing.
When examining velocity profiles of an uninstalled propeller, the axial velocity (va) is determined as thevelocity along the propeller thrust axis. The axial velocity varies along the propeller blade, with a maximumat roughly 3/4 of the radius. The maximum occurs at this position as the blade loading is also maximum
∗MSc Student, Faculty of Aerospace Engineering, Delft University of Technology, P.O. Box 5058, 2600 GB Delft, TheNetherlands†Assistant Professor, Faculty of Aerospace Engineering, Delft University of Technology, P.O. Box 5058, 2600 GB Delft, The
Netherlands, Senior Member AIAA
1 of 15
American Institute of Aeronautics and Astronautics
This is an Accepted Manuscript of an article published in: 55th AIAA Aerospace Sciences Meeting, 9/01/17 - 13/01/17 Grapevine, USA ISBN: 978-1-62410-447-3Available online: https://arc.aiaa.org/doi/10.2514/6.2017-0236

Figure 1. Helical vortex system and slipstream tube generated by propeller2
at this location. The axial velocity in the propeller slipstream increases downstream of the propeller. Thismeans that the longitudinal distance between the propeller and a downstream location in the streamtubehas an important effect on the local axial velocity magnitude.The swirl velocity (vt) is the propeller inducedtangential velocity. The swirl velocity profile in the longitudinal direction is shown in Figure 2(b). It isassumed that the swirl velocity remains unchanged with longitudinal position.
(a) Axial velocity (b) Swirl velocity
Figure 2. Velocity variations induced by the propeller.2
For the uninstalled propeller, the streamtube is assumed to be circular with the same radius as thepropeller at the propeller location. Further downstream the streamtube contracts to maintain constantmass flow as the axial velocity increases. For the uninstalled propeller, the contraction ratio RS/R can beapproximated using the following equation as determined by Theodorsen:3
RS (x)
R=
√√√√ 1 + a
1 + a(
1 + x√R2+x2
) (1)
Where a is defined as the dimensionless axial velocity factor(vaV0
).
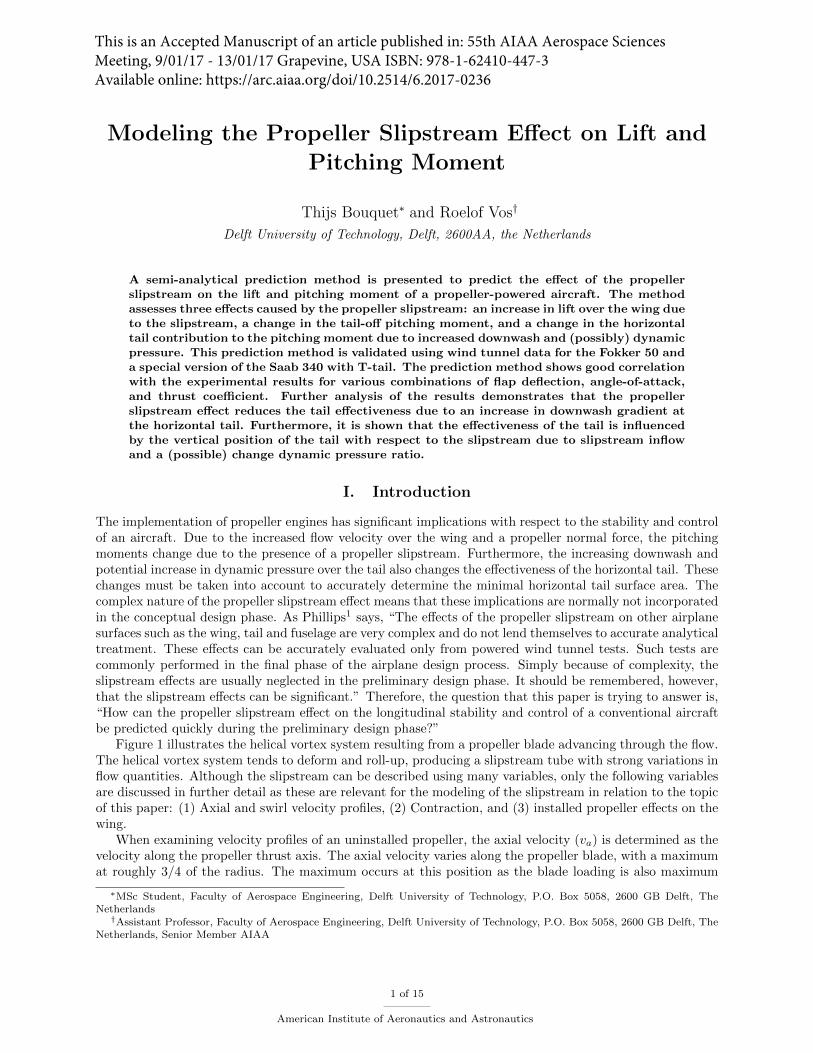
The installed propeller effects on the wing schematically shown in Figure 3. As the flow is acceleratedin axial direction by the propeller, the dynamic pressure over the wing is increased, resulting in an increasein local lift. Due to the rotation of the propeller the upward rotating blade causes an increase in localangle-of-attack on the wing resulting from the swirl velocity. In the same manner, the downward rotatingblade position produces a lower local angle-of-attack on the wing. This change in local angle-of-attack causesa respective increase or decrease in local lift coefficient as shown in the figure. The importance of rotationdirection is also shown by illustrating the placement of the local lift coefficient peak at the upward rotatingside in the inboard or outboard rotating case. Figure 3 shows the combination of these effects on the liftdistribution over the wing and demonstrate the effect of rotational direction.
2 of 15
American Institute of Aeronautics and Astronautics
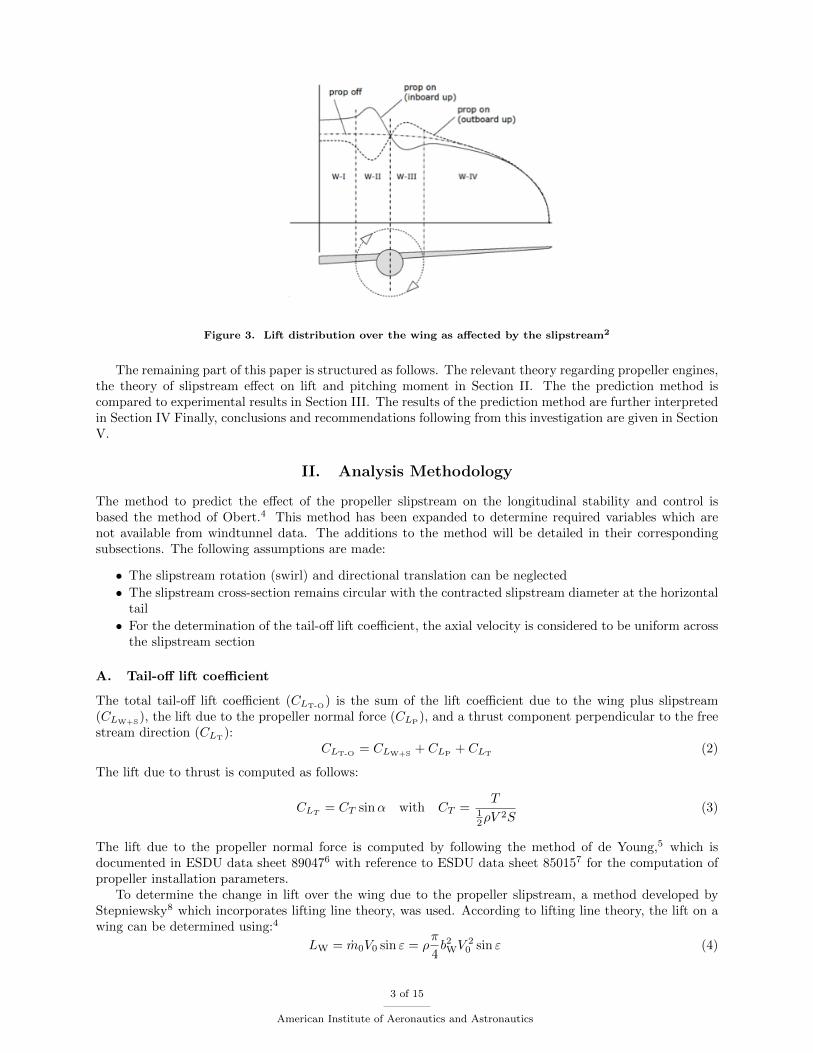
Figure 3. Lift distribution over the wing as affected by the slipstream2
The remaining part of this paper is structured as follows. The relevant theory regarding propeller engines,the theory of slipstream effect on lift and pitching moment in Section II. The the prediction method iscompared to experimental results in Section III. The results of the prediction method are further interpretedin Section IV Finally, conclusions and recommendations following from this investigation are given in SectionV.
II. Analysis Methodology
The method to predict the effect of the propeller slipstream on the longitudinal stability and control isbased the method of Obert.4 This method has been expanded to determine required variables which arenot available from windtunnel data. The additions to the method will be detailed in their correspondingsubsections. The following assumptions are made:
• The slipstream rotation (swirl) and directional translation can be neglected
• The slipstream cross-section remains circular with the contracted slipstream diameter at the horizontaltail
• For the determination of the tail-off lift coefficient, the axial velocity is considered to be uniform acrossthe slipstream section
A. Tail-off lift coefficient
The total tail-off lift coefficient (CLT-O) is the sum of the lift coefficient due to the wing plus slipstream(CLW+S
), the lift due to the propeller normal force (CLP), and a thrust component perpendicular to the free
stream direction (CLT):
CLT-O= CLW+S
+ CLP+ CLT
(2)
The lift due to thrust is computed as follows:
CLT = CT sinα with CT =T
12ρV
2S(3)
The lift due to the propeller normal force is computed by following the method of de Young,5 which isdocumented in ESDU data sheet 890476 with reference to ESDU data sheet 850157 for the computation ofpropeller installation parameters.
To determine the change in lift over the wing due to the propeller slipstream, a method developed byStepniewsky8 which incorporates lifting line theory, was used. According to lifting line theory, the lift on awing can be determined using:4
LW = m0V0 sin ε = ρπ
4b2WV
20 sin ε (4)
3 of 15
American Institute of Aeronautics and Astronautics

This equation states that the flow can be considered as a stream tube with circular cross section and diameterequal to the span of the wing which is deflected over the downwash angle (ε). Stepniewsky expanded on thisby stating that the lift due to propeller slipstream is equal to the momentum resulting from the downwarddeflection of each streamtube of the propeller slipstream deflected over the slipstream downwash angle (εS):8
LS = nemS (V0 + ∆V ) sin εS = neρπ
4D∗2(V0 + ∆V )
2sin εS (5)
In this equation, D∗ is the contracted slipstream diameter. The contracted slipstream diameter is dependenton the propeller diameter, freestream flow velocity and velocity increase over the propeller blade as given byRoskam:9
D∗ = D
√V0 + ∆V/2
V0 + ∆V(6)
Furthermore, the velocity increase in the fully contracted slipstream (∆V ) can be calculated using:
∆V
V0=Ve − V0
V0=
√1 + CT
SW
neπ4D
2− 1 (7)
To calculate the lift over a wing with slipstream present, the total cross-sectional area of the contractedslipstream tubes needs to be subtracted from the cross-sectional area describing the outer flow. Doing sogives the lift over a wing (W) with a propeller slipstream (S) present:
LW+S = ρV 20
[π4b2W − ne
π
4D∗2
]sin ε+ ρ[V0 + ∆V ]
2neπ
4D∗2 sin εS (8)
The corresponding lift coefficient is:
CLW+S =LW+S
12ρV
20 SW
=2
SW
(π4b2W − ne
π
4D∗2
)sin ε+ ne
πD∗2
2SW
(V0 + ∆V )2
V 20
sin εS (9)
The downwash due to slipstream (εs) is estimated by using the assumption that the lift due to slipstreamis equal to the lift on a wing in free flow with a span equal to the diameter of the fully contracted slipstreamand an airfoil section equal to the wing section at the propeller axes with flaps deflected.4 Combining thisassumption with lifting line theory gives:
sin εS =2CLαs,eff
πAs,effsinαS (10)
The effective aspect ratio of the wing part immersed in the slipstream (ASeff) is dependent on the thrust
coefficient. It is computed using:
ASeff= AS + (AW −AS)
(V0
V0 + ∆V
)(AW−AS)
(11)
The effective lift-curve slope of the slipstream section of the wing(CLαs,eff
)is found using Figure 4 from
NACA report 1098.10 The angle-of-attack of this section (αs) is the angle between the effective propellerslipstream center line and the zero-lift angle-of-attack with flaps deflected:
αS = α∗ + icS − α0 −∆α0,f (12)
where icS is the angle of incidence of the local wing chord with respect to the fuselage reference line, α0 isthe zero-lift angle-of-attack of the relevant airfoil section, and ∆α0,f is the change in zero-lift angle-of-attackdue to flap deflection. Finally, the change in flow direction due to the acceleration of the flow at the propellerdisk, α∗, is calculated using:
α∗ = arctanV0 sinαR
V0 cosαR + ∆V/2(13)
where αR is the aircraft angle-of-attack.
4 of 15
American Institute of Aeronautics and Astronautics
Aspect Ratio, ASeff[-]
0 1 2 3 4 5 6 7 8Lift-curveslop
e,CLα
1rad
0
0.01
0.02
0.03
0.04
0.05
0.06
0.07
0.08 0
30
40
50
60
Sweep angle [deg]
Figure 4. Variation of lift-curve slope with aspect ratio, and sweepback for subsonic incompressible flow10
The downwash directly behind the wing without propeller slipstream, ε, is found from lifting line theory:
sin ε =2CLW
πAW(14)
In this equation, the power-off lift coefficient of the wing, CLWis found by modeling the wing with the
vortex-lattice method AVL.11 The lift coefficient due to propeller slipstream can be calculated using:
CLS= CLW+S
− CLW(15)
B. Tail-Off Pitching Moment
The pitching moment of aircraft-less-tail with thrust-producing propellers is a summation of the pitchingmoment at zero thrust (CmCT=0
), the pitching moment due to the propeller normal force (CmP), the pitchingmoment due to the change in thrust vector (CmT
), and the pitching moment due to the slipstream effect(CmS
). In the subsequent paragraphs, all pitching moments are taken about the reference point of the aircraft,which is the quarter-chord of the mean aerodynamic chord, i.e. c/4. The pitching moment coefficient of theaircraft-less-tail is:
CmT-O = CmCT=0+ CmP + CmT + CmS (16)
The slipstream effect on pitching moment is caused by the change in flow velocity over the wing in thepropeller slipstream (CmS). The following contributions are distinguished: a contribution due to the slip-stream effect on the clean wing (CmS,0), a contribution due to the slipstream and flap deflection at constantangle-of-attack (CmS,δf
), and a contribution due to angle-of-attack at constant flap deflection, CmS,α.
CmS= CmS,0
+ ∆CmS,δf+ ∆CmS,α
(17)
Starting with the clean wing, the contribution to the pitching moment of the propeller slipstream can becomputed as:
CmS,0 = neD∗csSW
cm0,s
[(V0 + ∆V
V0
)2
− 1
](18)
where cm0,s is the local pitching moment coefficient of the airfoil located on the propeller axis. For cleanwings, the increase in lift due to propeller slipstream is assumed to apply at the quarter-chord point of thelocal chord in line with the propeller axis (cs). When flaps are deflected, the change in lift coefficient isapplied to the extended chord (c′s). Based on numerous windtunnel test results, Obert expanded Glauert’stheoretical relation for hinged flaps to the following equation:4
∆CmS, δf=c′scs
[−0.25 + 0.32
cfc′s
] [1 + 0.2
(1−√
2 sin δf
)]∆CLS,δf
(19)
5 of 15
American Institute of Aeronautics and Astronautics

where∆CLS,δf
= CLS − CLS |δf=0 (20)
The change in pitching moment about the quarter-chord point of the extended chord due to lift causedby the propeller slipstream at angle-of-attack (∆CmS,α
) is determined using:
∆CmS,α = F ×∆CLS,α (21)
with
F =
{[
0.5δf30 + 0.25
] (c′scs− 1)
+ 0.05δf30 + ∆Xfus
c
(1− δf
30
)}for 0 ≤ δf ≤ 30
−0.75(c′scs− 1)− 0.05 for δf > 30
(22)
and∆CLS,α = CLS − CLS |α=0 (23)
where ∆Xfus is representing a contribution of the fuselage to the shift in lift-force application point.12
C. Tail-On Pitching Moment
The tail-on pitching moment (Cm) is calculated by adding the horizontal tail pitching moment (∆Cmh) to
the previously calculated tail-off pitching moment, or simply:
Cm = CmT-O + Cmh(24)
where the horizontal tail pitching moment is computed as follows using:
Cmh= − (αR − ε+ ih)CLα,h
qh
q
ShlhSWc
(25)
where ih is the incidence angle of the horizontal tail, CLα,h its lift curve slope, qhq the ratio of dynamic
pressure at the horizontal tail, and ShlhSWc the tail volume coefficient (with lh being the horizontal distance
between the quarter chord points of the wing’s and horizontal tail plane’s mean aerodynamic chords). Whilethe lift-curve slope is found using a vortex-lattice method (AVL), the local downwash angle (ε) and localdynamic pressure (qh) need further elaboration. For both computations, the location of the slipstream centerline with respect to the horizontal tail plane needs to be determined.
1. Vertical Distance of Slipstream Center Line to Horizontal Tail
The distance h between the slipstream center line and the horizontal tail consists of four contributions:the geometrical distance between the tail surface and the propeller axis at zero angle-of-attack, the verticaldisplacement of the horizontal tail due to angle-of-attack, the vertical displacement of the slipstream centerline passing through the clean wing’s trailing edge, and the vertical displacement of the slipstream centerline due to the propeller axis not coinciding with the streamline leading to the forward stagnation point.This final contribution itself comprises of three components: the displacement of the propeller disk due toangle-of-attack with respect to the quarter chord reference point, the displacement of the center line dueto the downward displacement of the trailing edge when flaps are deflected, and the displacement of thecenterline caused by upwash in front of the wing due to flap deflection. The following equation is sums allthese distances to find the slipstream center line and the horizontal tail:4
h = zh − zprop − lh sinα+ l∗h sin (Kεε)−(xc/4 − xprop
)sinα+ cf sin δf + 0.25
[xc/4 − xprop
]sin ∆α0,f (26)
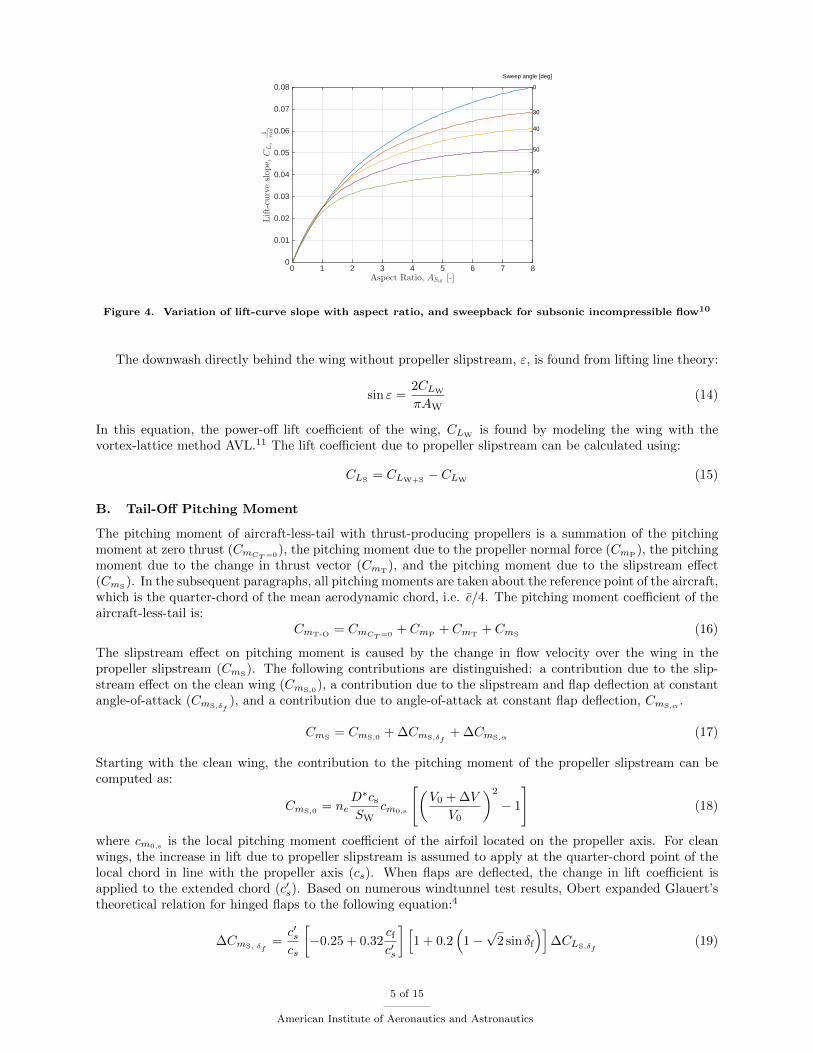
where z indicates vertical position of a component in the aircraft reference frame, ∆α0,f is the change inairfoil section zero-lift angle-of-attack due to flap deflection (obtained using AVL), and Kε is an empiricaldownwash factor (Kε = zW/zε). The latter is related to the horizontal distance between the wing trailingedge and horizontal-tail leading edge (l∗h) according to the curve shown in Figure 5. This factor accountsfor the fact that the slipstream center line continues to curve downwards downstream of the wing. In thisequation, the downwash (ε) is calculated assuming no inflow effects, which will be described in the followingsubsection.
6 of 15
American Institute of Aeronautics and Astronautics
Distance between trailing edge and tail w.r.t. MAC, l∗h/c [-]0 1 2 3 4 5
Dow
nwashfactor,K
ε[-]
0
0.5
1
1.5
2
2.5
3
Figure 5. Downwash factor Kε versus distance behind the wing trailing edge.4
2. Downwash
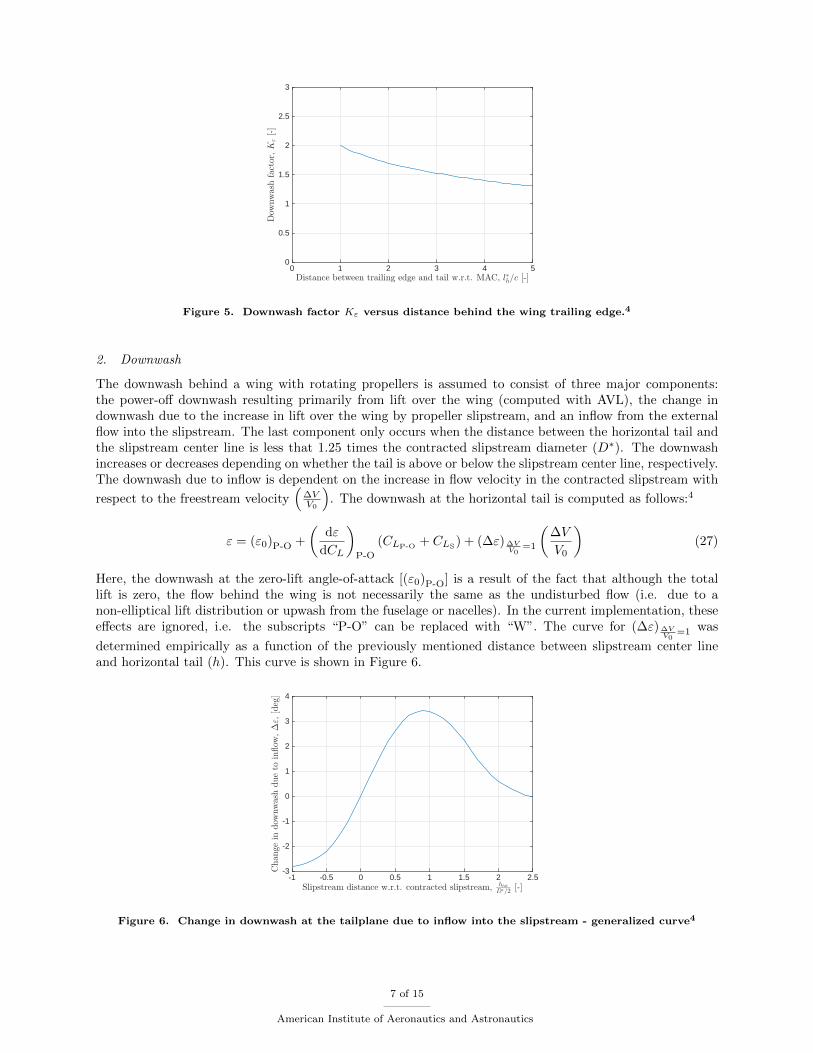
The downwash behind a wing with rotating propellers is assumed to consist of three major components:the power-off downwash resulting primarily from lift over the wing (computed with AVL), the change indownwash due to the increase in lift over the wing by propeller slipstream, and an inflow from the externalflow into the slipstream. The last component only occurs when the distance between the horizontal tail andthe slipstream center line is less that 1.25 times the contracted slipstream diameter (D∗). The downwashincreases or decreases depending on whether the tail is above or below the slipstream center line, respectively.The downwash due to inflow is dependent on the increase in flow velocity in the contracted slipstream with
respect to the freestream velocity(
∆VV0
). The downwash at the horizontal tail is computed as follows:4
ε = (ε0)P-O +
(dε
dCL
)P-O
(CLP-O + CLS) + (∆ε) ∆VV0
=1
(∆V
V0
)(27)
Here, the downwash at the zero-lift angle-of-attack [(ε0)P-O] is a result of the fact that although the totallift is zero, the flow behind the wing is not necessarily the same as the undisturbed flow (i.e. due to anon-elliptical lift distribution or upwash from the fuselage or nacelles). In the current implementation, theseeffects are ignored, i.e. the subscripts “P-O” can be replaced with “W”. The curve for (∆ε) ∆V
V0=1 was
determined empirically as a function of the previously mentioned distance between slipstream center lineand horizontal tail (h). This curve is shown in Figure 6.
Slipstream distance w.r.t. contracted slipstream, htot
D∗/2 [-]-1 -0.5 0 0.5 1 1.5 2 2.5
Chan
gein
dow
nwashdueto
inflow
,∆ε,
[deg]
-3
-2
-1
0
1
2
3
4
Figure 6. Change in downwash at the tailplane due to inflow into the slipstream - generalized curve4
7 of 15
American Institute of Aeronautics and Astronautics

3. Average Dynamic Pressure
The average dynamic pressure at the horizontal tail (qh) is determined by calculating the tail area coveredby the propeller streamtubes. This area can be determined using the situation sketched in Figure 7. Thetail area can be determined as:
SS = 2bSchs (28)
where the span of the tail covered by the slipstream is found using:
bS = D∗
√1−
(2h
D∗
)2
(29)
The average dynamic pressure at the tail can then be found using the assumption that no mixing occursbetween the slipstream and outer flow. Under this assumption, the dynamic pressure ratio is:4
qhq
=
[(1 +
∆V
V0
)2Sh,S
Sh+
(1− Sh,S
Sh
)](30)
bS
h
bh/2
D*
horizontal tail planefuselage center line
slipstream
perimeter
Figure 7. Tail span covered by the propeller slipstream
III. Method Verification
Little validation data exists in the open literature to validate the presented method. The only useable datasets that could be found are for the Fokker 504 and Saab 340 with a T-tail configuration13 (referred to asSaab 340T) . The dimensions for the Saab 340T were used as direct inputs for the method. The Fokker50I design was synthesized using the Initiator and therefore demonstrates the applicability of the method aspart of an aircraft synthesis program. Table 1 shows the difference in aircraft dimensions of the synthesizedaircraft versus the actual dimensions of the Fokker 50.
Table 1. Dimensions of synthesized propeller aircraft compared to actual Fokker 50 dimensions
Dimension Actual Fokker 50 Initiator Fokker 50I Difference
Fuselage Length [m] 25.25 24.1 -4.5%
Wing Area [m2] 70 68.3 -2.4%
Wing Span [m] 29 28.6 -1.3%
Propeller Diameter [m] 3.66 3.64 -0.4%
8 of 15
American Institute of Aeronautics and Astronautics

A. Tail-off Lift Coefficient
The tail-off lift curves show the tail-off lift coefficient (CLT-O) versus angle-of-attack at various propeller
thrust coefficients and flap deflections. The tail-off lift curves for the Saab 340T at various flap deflectionsand propeller thrust coefficients are shown in Figure 8(a). This figure shows a good correlation between thecalculated values and the windtunnel test results although the individual contributions of flap deflection andthrust cannot be discerned. Instead, Figure 8(b) gives a clearer indication of the propeller slipstream effecton the lift curves. This figure shows the difference between the tail-off lift-curve slopes in the power-off andpower-on (CT = 0.6) condition at a constant flap deflection of 20 degrees. For example, at α = 0 the liftcoefficient is increased by roughly 35%, proving the significant of the propeller slipstream. Furthermore, thefigure again shows a good correlation between the measured and calculated results.
Calculated: CT = 0.60, δ
f = 20 deg
Wind tunnel: CT = 0.60, δ
f = 20 deg
Calculated: CT = 0.60, δ
f = 40 deg
Wind tunnel: CT = 0.60, δ
f = 40 deg
Calculated: CT = 0.30, δ
f = 0 deg
Wind tunnel: CT = 0.30, δ
f = 0 deg
-4 -2
Tai
l-O
ff L
ift
Coef
fici
ent,
CL
, T
-O (
~)
Angle of Attack, α (deg)
0 2 4 6 8
1.0
1.5
2.0
2.5
3.0
-0.5
0
0.5
(a) Flaps 0, 20, 40 degrees
Measured CT = 0.30
Measured CT = 0.60
Calculated CT = 0.30
Calculated CT = 0.60
-4 -2
Tai
l-O
ff L
ift
Co
effi
cien
t, C
L, T
-O (
~)
Angle of Attack, α (deg)
0 2 4 6 80.4
2.4
2.0
1.6
1.2
0.8
(b) Flaps 20 degrees
Figure 8. Tail-off lift curves - Saab 340T
Figure 8(a) shows that the lift is predicted with a maximum discrepancy of 11% in lift coefficient occurringat 40degrees flap deflection. The main error in all three flight settings is that the lift curve slope is slightlysteeper compared to the test data. This error could be causes by an over prediction of the lift curve slopeby AVL, the propeller normal force slope, or the slipstream effect. From Figure 8(b) the conclusion can bedrawn that the lift curve slope as predicted by AVL is correct, albeit with a constant offset.
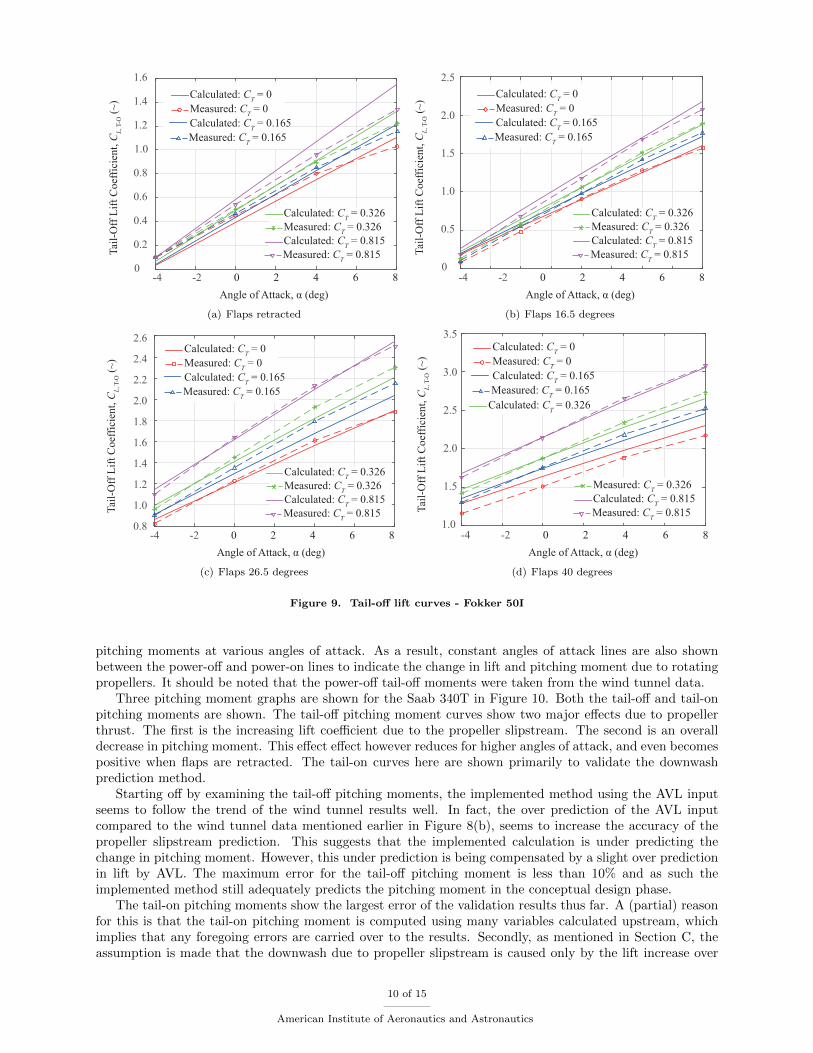
Figure 9 contains the lift curves at a constant flap deflection angle for increasing thrust coefficients ofthe Fokker 50I. These figures again clearly show the increase in tail-off lift, due to propeller thrust as the liftcurve slopes are steeper for higher thrust coefficients. Furthermore, as expected, the tail-off lift is higher athigher flap deflections.
The curves for the Fokker 50I show similar effects as the Saab 340T. In general, the calculated valuescoincide reasonably well with the measured values. However, a comparatively larger error occurs with respectto the Saab 340T. A larger error is expected because the Fokker 50I calculations are based on the aircraftdimensions which follow from the Initiator design (see Table 1). The larger error can be observed whencomparing the power-off lift curves in Figure 9 to the power-off lift curve of the Saab 340T. When comparingthe propeller slipstream contributions, the calculations seem to slightly over predict the effect. This can beseen as the calculated curves increase relatively compared to the measured curves. Although this meansthat the calculated values correlate better with the measured values in some cases (Figure 9(d)), this doesnot mean that this is correct. The over prediction is in line with the results for the Saab 340T, and couldthus be credited to a number of effects including an erroneous increase in propeller normal force or incorrecteffective lift slope for the slipstream section.
B. Pitching Moment Coefficient
The pitching moment curves, indicating the tail-off and tail-on pitching moments about a certain referencepoint versus the corresponding lift coefficient, are given per aircraft. Again the Saab 340T results arepresented first, followed by the Fokker 50I. These figures were found by determining the lift coefficient and
9 of 15
American Institute of Aeronautics and Astronautics
-4 -20
0.2
0.4
0.6
0.8
1.0
1.2
1.4
1.6
Tai
l-O
ff L
ift
Co
effi
cien
t, C
L, T
-O (
~)
Angle of Attack, α (deg)
0 2 4 6 8
Calculated: CT = 0
Measured: CT = 0
Calculated: CT = 0.165
Measured: CT = 0.165
Calculated: CT = 0.326
Measured: CT = 0.326
Calculated: CT = 0.815
Measured: CT = 0.815
(a) Flaps retracted
-4 -2
Tai
l-O
ff L
ift
Coef
fici
ent,
CL
, T
-O (
~)
Angle of Attack, α (deg)
0 2 4 6 8
Calculated: CT = 0
Measured: CT = 0
Calculated: CT = 0.165
Measured: CT = 0.165
Calculated: CT = 0.326
Measured: CT = 0.326
Calculated: CT = 0.815
Measured: CT = 0.815
0
0.5
1.0
1.5
2.0
2.5
(b) Flaps 16.5 degrees
-4 -2
Tai
l-O
ff L
ift
Co
effi
cien
t, C
L, T
-O (
~)
Angle of Attack, α (deg)
0 2 4 6 8
Calculated: CT = 0
Measured: CT = 0
Calculated: CT = 0.165
Measured: CT = 0.165
Calculated: CT = 0.326
Measured: CT = 0.326
Calculated: CT = 0.815
Measured: CT = 0.815
1.0
1.2
1.4
1.6
1.8
2.0
2.2
2.4
2.6
0.8
(c) Flaps 26.5 degrees
-4 -2
Tai
l-O
ff L
ift
Co
effi
cien
t, C
L, T
-O (
~)
Angle of Attack, α (deg)
0 2 4 6 8
Calculated: CT = 0
Measured: CT = 0
Calculated: CT = 0.165
Measured: CT = 0.165
Calculated: CT = 0.326
Measured: CT = 0.326
Calculated: CT = 0.815
Measured: CT = 0.815
1.0
1.5
2.0
2.5
3.0
3.5
(d) Flaps 40 degrees
Figure 9. Tail-off lift curves - Fokker 50I
pitching moments at various angles of attack. As a result, constant angles of attack lines are also shownbetween the power-off and power-on lines to indicate the change in lift and pitching moment due to rotatingpropellers. It should be noted that the power-off tail-off moments were taken from the wind tunnel data.
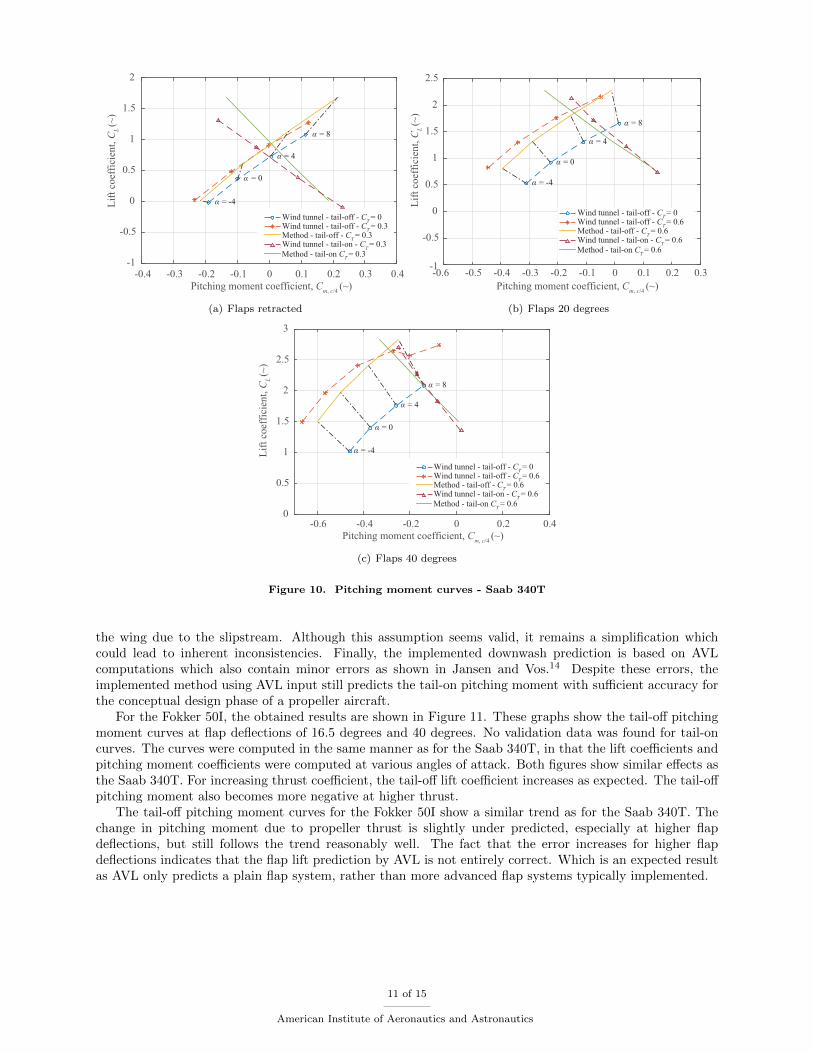
Three pitching moment graphs are shown for the Saab 340T in Figure 10. Both the tail-off and tail-onpitching moments are shown. The tail-off pitching moment curves show two major effects due to propellerthrust. The first is the increasing lift coefficient due to the propeller slipstream. The second is an overalldecrease in pitching moment. This effect effect however reduces for higher angles of attack, and even becomespositive when flaps are retracted. The tail-on curves here are shown primarily to validate the downwashprediction method.
Starting off by examining the tail-off pitching moments, the implemented method using the AVL inputseems to follow the trend of the wind tunnel results well. In fact, the over prediction of the AVL inputcompared to the wind tunnel data mentioned earlier in Figure 8(b), seems to increase the accuracy of thepropeller slipstream prediction. This suggests that the implemented calculation is under predicting thechange in pitching moment. However, this under prediction is being compensated by a slight over predictionin lift by AVL. The maximum error for the tail-off pitching moment is less than 10% and as such theimplemented method still adequately predicts the pitching moment in the conceptual design phase.
The tail-on pitching moments show the largest error of the validation results thus far. A (partial) reasonfor this is that the tail-on pitching moment is computed using many variables calculated upstream, whichimplies that any foregoing errors are carried over to the results. Secondly, as mentioned in Section C, theassumption is made that the downwash due to propeller slipstream is caused only by the lift increase over
10 of 15
American Institute of Aeronautics and Astronautics
Pitching moment coefficient, Cm, c/4
(~)
-0.4 -0.3 -0.2 -0.1 0 0.1 0.2 0.3 0.4-1
-0.5
0
0.5
1
1.5
2
α = -4
α = 0
α = 4
α = 8
Lif
t co
effi
cien
t, C
L (~
)
Wind tunnel - tail-off - CT = 0
Wind tunnel - tail-off - CT = 0.3
Method - tail-off - CT = 0.3
Method - tail-on CT = 0.3
Wind tunnel - tail-on - CT = 0.3
(a) Flaps retracted
-0.6 -0.5 -0.4 -0.3 -0.2 -0.1 0 0.1 0.2 0.3-1
-0.5
0
0.5
1
1.5
2
2.5
α = -4
α = 0
α = 4
α = 8
Pitching moment coefficient, Cm, c/4
(~)
Lif
t co
effi
cien
t, C
L (~
)
Wind tunnel - tail-off - CT = 0
Wind tunnel - tail-off - CT = 0.6
Method - tail-off - CT = 0.6
Method - tail-on CT = 0.6
Wind tunnel - tail-on - CT = 0.6
(b) Flaps 20 degrees
-0.6 -0.4 -0.2 0 0.2 0.40
0.5
1
1.5
2
2.5
3
α = -4
α = 0
α = 4
α = 8
Pitching moment coefficient, Cm, c/4
(~)
Lif
t co
effi
cien
t, C
L (~
)
Wind tunnel - tail-off - CT = 0
Wind tunnel - tail-off - CT = 0.6
Method - tail-off - CT = 0.6
Method - tail-on CT = 0.6
Wind tunnel - tail-on - CT = 0.6
(c) Flaps 40 degrees
Figure 10. Pitching moment curves - Saab 340T
the wing due to the slipstream. Although this assumption seems valid, it remains a simplification whichcould lead to inherent inconsistencies. Finally, the implemented downwash prediction is based on AVLcomputations which also contain minor errors as shown in Jansen and Vos.14 Despite these errors, theimplemented method using AVL input still predicts the tail-on pitching moment with sufficient accuracy forthe conceptual design phase of a propeller aircraft.
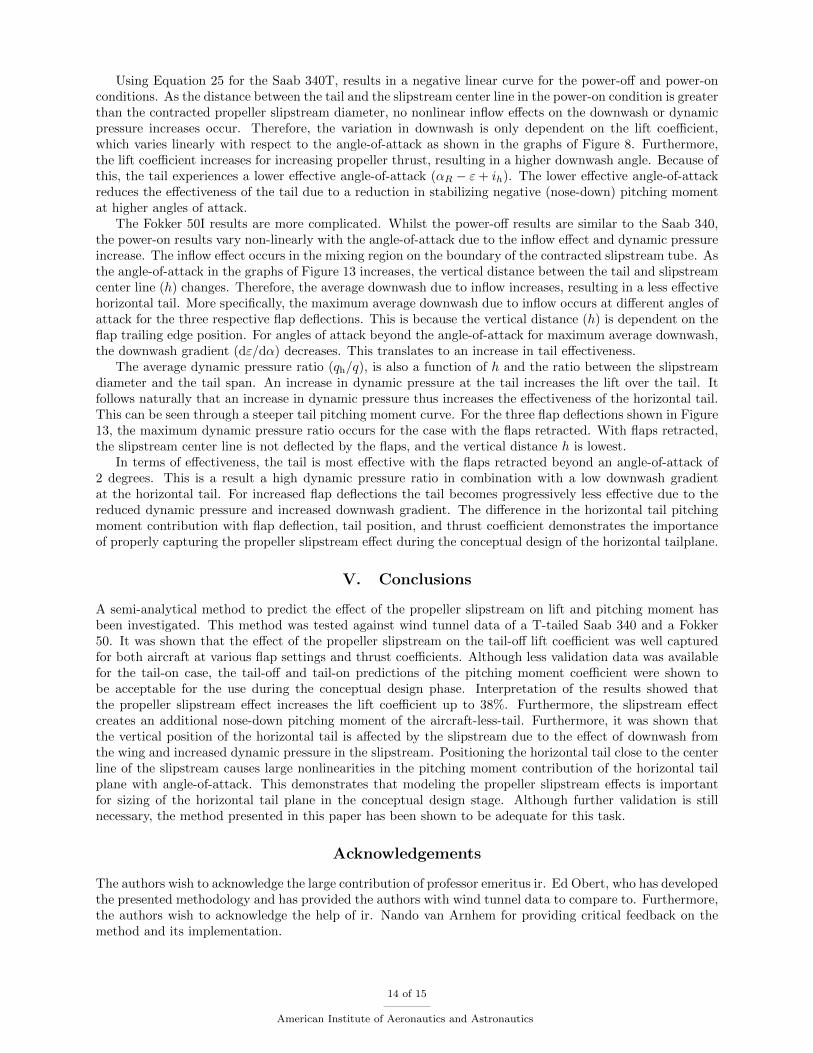
For the Fokker 50I, the obtained results are shown in Figure 11. These graphs show the tail-off pitchingmoment curves at flap deflections of 16.5 degrees and 40 degrees. No validation data was found for tail-oncurves. The curves were computed in the same manner as for the Saab 340T, in that the lift coefficients andpitching moment coefficients were computed at various angles of attack. Both figures show similar effects asthe Saab 340T. For increasing thrust coefficient, the tail-off lift coefficient increases as expected. The tail-offpitching moment also becomes more negative at higher thrust.
The tail-off pitching moment curves for the Fokker 50I show a similar trend as for the Saab 340T. Thechange in pitching moment due to propeller thrust is slightly under predicted, especially at higher flapdeflections, but still follows the trend reasonably well. The fact that the error increases for higher flapdeflections indicates that the flap lift prediction by AVL is not entirely correct. Which is an expected resultas AVL only predicts a plain flap system, rather than more advanced flap systems typically implemented.
11 of 15
American Institute of Aeronautics and Astronautics

-0.3 -0.250
0.5
1
1.5
2
2.5
Tail-off pitching moment coefficient, Cm, T-O, c/4
(~)
Tai
l-o
ff l
ift
coef
fici
ent,
CL
, T
-O (~
)
-0.1 -0.05-0.15-0.2 0
Windtunnel - CT = 0
Windtunnel - CT = 0.326
Method - CT = 0.326
Windtunnel - CT = 0.815
Method - CT = 0.815
(a) Flaps 16.5 degrees
3
-0.31
1.5
2
2.5
Tail-off pitching moment coefficient, Cm, T-O, c/4
(~)
Tai
l-o
ff l
ift
coef
fici
ent,
CL
, T
-O (~
)
-0.1-0.2 0-0.4-0.5
Windtunnel - CT = 0
Windtunnel - CT = 0.326
Method - CT = 0.326
Windtunnel - CT = 0.815
Method - CT = 0.815
(b) Flaps 40 degrees
Figure 11. Tail-off pitching moment curves - Fokker 50I
IV. Interpretation of Results
In this section, the results of the previous section are further interpreted and discussed to come to a betterunderstanding of the capabilities of the method and the impact of the propeller slipstream on the lift andpitching moment of the aircraft.
A. Tail-Off lift coefficient
The graphs in Figures 8 and 9 show the total effect of rotating propellers on the tail-off lift coefficient. Abreakdown of the tail-off lift coefficient in its individual components is given in Table 2 for the Saab 340Tat δf = 20◦ and CT = 0.6. This breakdown lists the four variables calculated as described in Section A forfour different angles of attack as well as the power-off and total power-on lift coefficient.
Table 2. Calculated tail-off lift coefficients for the Saab 340T with flaps deflected 20 degrees and thrustcoefficient of 0.6
angle-of-attack, α (deg) -4 0 4 8
Power-off lift, CLP-O (∼) 0.574 0.971 1.344 1.690
Wing lift minus slipstream, CLW-S(∼) 0.558 0.945 1.308 1.645
Lift due to slipstream, CLS(∼) 0.306 0.381 0.458 0.528
Propeller Normal Force, CLP (∼) 0.004 0.017 0.030 0.043
Vertical thrust component, CLT (∼) -0.045 0 0.045 0.090
Total Power-on lift, CL (∼) 0.824 1.344 1.839 2.305
It can be seen that the total lift coefficient is increased by an average of 38% with respect to the power-offcondition. This could also be seen from Figure 8(b) and clearly confirms the importance of determining thepropeller slipstream effect whilst designing a propeller aircraft. One important result from Table 2 is the factthat the majority (a minimum of 78% at an 8 degrees angle-of-attack) of the lift increase due to propellerthrust is caused by the increased flow velocity over the slipstream section of the wing (CLS ). In fact, at -4degrees angle-of-attack, the lift-due-to-slipstream is responsible for 116% of the increase in lift. This showsthat the one-engine-inoperative case in take-off condition can have drastic effect on the lateral lift balancecausing the aircraft to roll. Furthermore, it can be observed that the increase in lift is proportional to thepropeller thrust coefficient. This means that the propeller slipstream effect will be strongest during take-off,where the thrust is maximum due to the low aircraft velocity.
12 of 15
American Institute of Aeronautics and Astronautics

B. Tail-Off Pitching Moment Coefficient
The graphs in Figures 10 and 11 show the pitching moment on the x-axis as well as the lift coefficient onthe y-axis. It can be observed that the tail-off pitching moment becomes more negative (nose down) dueto rotating propellers according to the calculations and wind tunnel measurements. The pitching momentbecomes more nose down because the increase in lift over the slipstream section is applied aft of the momentreference center. Interestingly, the effect of propeller thrust reduces for higher angles of attack. At higherangles of attack, the positive pitching moment caused by the propeller normal force and the upwash causedby the fuselage and nacelles reduce the nose down pitching moment effect.
Furthermore, the effect explained above becomes stronger for higher thrust coefficients as expected, butalso for higher flap deflections. The flap deflection has an influence due to the fact that deflected flaps causethe increase in lift over the slipstream section of the wing to become larger and that the point of applicationof the lift force vector on the wing moves further aft.
C. Tail-On Pitching Moment Coefficient
The horizontal tail pitching moment contribution (Cmh) versus angle-of-attack curves are calculated. The
horizontal tail pitching moment is dependent on the downwash and average dynamic pressure at the tail.These variables are themselves dependent on the vertical distance between the horizontal tail and the slip-stream center line. As the Fokker 50I and Saab 340T differ in tail height, a significant difference is expectedin tail pitching moment. Figure 12 shows the effect of the propeller slipstream on the horizontal tail pitchingmoment for three different flap deflections of the Saab 340T. These graphs show that the difference betweenthe power-on and power-off pitching moment contributions increases for higher flap deflections.
Angle of Attack, α (deg)
-4 -2
HT
pit
chin
g m
om
ent,
Cm
h (~
)
-0.4
-0.2
0
0.2
0.4
0 2 4 6 8
Power off
Power on, CT = 0.6
(a) Flaps retracted
-0.4
-0.2
0
0.2
0.4
0.6
-4 -2
HT
pit
chin
g m
om
ent,
Cm
h (~
)
0 2 4 6 8
Power off
Power on, CT = 0.6
Angle of Attack, α (deg)
(b) Flaps 20 degrees
-0.2
0
0.2
0.4
0.6
-4 -2
HT
pit
chin
g m
om
ent,
Cm
h (~
)
0 2 4 6 8
Power off
Power on, CT = 0.6
Angle of Attack, α (deg)
(c) Flaps 40 degrees
Figure 12. Horizontal tail pitching moment - Saab 340T
The Fokker 50I has a low horizontal tail configuration. This low tail configuration leads to additionaleffects acting on the tail pitching moment as can be seen in Figure 13. Similar to the Saab 340, these figuresshow the effect of propeller thrust on the tail pitching moment for three different flap deflections. Althoughthe power-off curves show a similar negative linear trend as before, the power-on curves are drasticallydifferent. This difference occurs because of the nonlinear dynamic pressure and downwash inflow effects.Furthermore, this difference also depends on the flap deflection.
-0.2
0
0.2
0.4
f
Angle of Attack, α (deg)
HT
pit
chin
g m
om
ent,
Cm
h (~
)
Power off
Power on, CT = 0.815
-4 -2 0 2 4 6 8
(a) Flaps retracted
0
0.2
0.4
Angle of Attack, α (deg)
HT
pit
chin
g m
om
ent,
Cm
h (~
)
Power off
Power on, CT = 0.815
-4 -2 0 2 4 6 8
(b) Flaps 16.5 degrees
0
0.2
0.4
0.6
Angle of Attack, α (deg)
HT
pit
chin
g m
om
ent,
Cm
h (~
)
Power off
Power on, CT = 0.815
-4 -2 0 2 4 6 8
(c) Flaps 40 degrees
Figure 13. Horizontal tail pitching moment - Fokker 50I
13 of 15
American Institute of Aeronautics and Astronautics
Using Equation 25 for the Saab 340T, results in a negative linear curve for the power-off and power-onconditions. As the distance between the tail and the slipstream center line in the power-on condition is greaterthan the contracted propeller slipstream diameter, no nonlinear inflow effects on the downwash or dynamicpressure increases occur. Therefore, the variation in downwash is only dependent on the lift coefficient,which varies linearly with respect to the angle-of-attack as shown in the graphs of Figure 8. Furthermore,the lift coefficient increases for increasing propeller thrust, resulting in a higher downwash angle. Because ofthis, the tail experiences a lower effective angle-of-attack (αR − ε+ ih). The lower effective angle-of-attackreduces the effectiveness of the tail due to a reduction in stabilizing negative (nose-down) pitching momentat higher angles of attack.
The Fokker 50I results are more complicated. Whilst the power-off results are similar to the Saab 340,the power-on results vary non-linearly with the angle-of-attack due to the inflow effect and dynamic pressureincrease. The inflow effect occurs in the mixing region on the boundary of the contracted slipstream tube. Asthe angle-of-attack in the graphs of Figure 13 increases, the vertical distance between the tail and slipstreamcenter line (h) changes. Therefore, the average downwash due to inflow increases, resulting in a less effectivehorizontal tail. More specifically, the maximum average downwash due to inflow occurs at different angles ofattack for the three respective flap deflections. This is because the vertical distance (h) is dependent on theflap trailing edge position. For angles of attack beyond the angle-of-attack for maximum average downwash,the downwash gradient (dε/dα) decreases. This translates to an increase in tail effectiveness.
The average dynamic pressure ratio (qh/q), is also a function of h and the ratio between the slipstreamdiameter and the tail span. An increase in dynamic pressure at the tail increases the lift over the tail. Itfollows naturally that an increase in dynamic pressure thus increases the effectiveness of the horizontal tail.This can be seen through a steeper tail pitching moment curve. For the three flap deflections shown in Figure13, the maximum dynamic pressure ratio occurs for the case with the flaps retracted. With flaps retracted,the slipstream center line is not deflected by the flaps, and the vertical distance h is lowest.
In terms of effectiveness, the tail is most effective with the flaps retracted beyond an angle-of-attack of2 degrees. This is a result a high dynamic pressure ratio in combination with a low downwash gradientat the horizontal tail. For increased flap deflections the tail becomes progressively less effective due to thereduced dynamic pressure and increased downwash gradient. The difference in the horizontal tail pitchingmoment contribution with flap deflection, tail position, and thrust coefficient demonstrates the importanceof properly capturing the propeller slipstream effect during the conceptual design of the horizontal tailplane.
V. Conclusions
A semi-analytical method to predict the effect of the propeller slipstream on lift and pitching moment hasbeen investigated. This method was tested against wind tunnel data of a T-tailed Saab 340 and a Fokker50. It was shown that the effect of the propeller slipstream on the tail-off lift coefficient was well capturedfor both aircraft at various flap settings and thrust coefficients. Although less validation data was availablefor the tail-on case, the tail-off and tail-on predictions of the pitching moment coefficient were shown tobe acceptable for the use during the conceptual design phase. Interpretation of the results showed thatthe propeller slipstream effect increases the lift coefficient up to 38%. Furthermore, the slipstream effectcreates an additional nose-down pitching moment of the aircraft-less-tail. Furthermore, it was shown thatthe vertical position of the horizontal tail is affected by the slipstream due to the effect of downwash fromthe wing and increased dynamic pressure in the slipstream. Positioning the horizontal tail close to the centerline of the slipstream causes large nonlinearities in the pitching moment contribution of the horizontal tailplane with angle-of-attack. This demonstrates that modeling the propeller slipstream effects is importantfor sizing of the horizontal tail plane in the conceptual design stage. Although further validation is stillnecessary, the method presented in this paper has been shown to be adequate for this task.
Acknowledgements
The authors wish to acknowledge the large contribution of professor emeritus ir. Ed Obert, who has developedthe presented methodology and has provided the authors with wind tunnel data to compare to. Furthermore,the authors wish to acknowledge the help of ir. Nando van Arnhem for providing critical feedback on themethod and its implementation.
14 of 15
American Institute of Aeronautics and Astronautics

References
1Phillips, W., Mechanics of Flight , Wiley, 2004, ISBN:9780471334583.2Veldhuis, L., Propeller wing aerodynamic interference, TU Delft, Delft University of Technology, 2005, ISBN:9090195378.3Theodorsen, T., “The theory of propellers - Part III, The slipstream contraction with numerical values for two-blade and
four blade propellers,” NACA Report , Vol. 777, 1944.4Obert, E., “The Effect of Propeller Slipstream on the Static Longitudinal Stability and Control of Multi-Engined Aircraft,”
Proceedings of the International Council of the Aeronautical Sciences’ 19th Congress, Anaheim, CA, September 1994, p. 7.3.4.5De Young, J., “Propeller at high incidence,” Journal of Aircraft , Vol. 2, No. 3, 1965, pp. 241–250, ISSN:0021-8669.6Anon., In-plane forces and moments on installed inclined propellers at low forward speeds, IHS, 2006, ESDU data sheet
89047.7Anon., Introduction to installation effects on thrust and drag for propeller-driven aircraft , IHS, 1986, ESDU data sheet
85015.8Stepniewski, W., “Exprience tire des essais en vol d’un appareil VTOL a aile basculante.” Technique et Science Aero-
nautiques, Vol. No. 1, 1960.9Roskam, J. and Lan, C., Airplane Aerodynamics and Performance, Design, Analysis and Research Corporation, 1997,
ISBN = 9781884885440.10Campbell, J. and McKinney, M., “NACA Report 1098 - Summary of Methods for Calculating Dynamic Lateral Stability
and Response and for Estimating Lateral Stability Derivatives,” Report, National Advisory Committee for Aeronautics, 1952.11Drela, M. and Youngren, H., “Athena Vortex Lattice,” 2010.12Obert, E., “The Effect of Propeller Slipstream on the Longitudinal Characteristics of a Model of the Saab 2000.” unpub-
lished appendix to Delft Aerospace Report LR-761.13Obert, E., “The Effect of Propeller Slipstream on the Longitudinal Characteristics of a Model of the Saab 340 with a
T-tail,” unpublished appendix to Delft Aerospace Report LR-761.14Jansen, Q. and Vos, R., “Assessing the Effect of Decreased Longitudinal Stability on Aircraft Size and Performance,”
54th AIAA Aerospace Sciences Meeting, San Diego, CA, 4-8 January 2015, pp. 1–16.
15 of 15
American Institute of Aeronautics and Astronautics