delft hydraulics - Van der Meer · PDF filepublication no. 485 Wave run-up and wave...
23
publication no. 485 Wave run-up and wave overtopping at dikes and revetments J.W. van der Meer and J.P.F.M. Janssen August 1994 delft hydraulics
-
Upload
hoangthien -
Category
Documents
-
view
214 -
download
0
Transcript of delft hydraulics - Van der Meer · PDF filepublication no. 485 Wave run-up and wave...

publication no. 485
Wave run-up and wave overtopping at dikes and revetments
J.W. van der Meer and J.P.F.M. Janssen
August 1994
delft hydraulics

Wave run-up and wave overtopping at dikes and revetments August 1994
Wave run-up and wave overtopping at dikes and revetments
by
Jentsje W. van der Meer" and Johannes P.F.M. Janssen"
Abstract
This paper summarizes newly obtained results of wave run-up on and overtopping at dikes and similar structures as sloping revetments and seawalls. The contents is focussed on formulae for conceptual design. Various influences are incorporated in the formulae in the form of reduction factors. These include the influence of a berm, a shallow foreshore (depth limited waves), roughness elements on the slope and obliquely incoming waves, both shortcrested and long-crested. The wave run-up can be described as a function of the breaker parameter and reduction factors. Wave overtopping is given by two formulae, one for breaking waves, the other for non-breaking waves. In addition, a distribution is given for overtopping volumes per wave. The maximum volume of overtopping by the highest wave may be thousand times larger than the average overtopping discharge.
Wave runup
Introduction
Dikes or revetments usually have a rather mild slope, mostly of the order of 1:2 or milder. A dike consists of a toe construction, an outer slope, often with a berm, a crest of a certain height and an inner slope, see Figure 1. The outer slope may consist of various materials such as asphalt, a revetment of concrete stones, or grass on a clay cover layer. Combinations of these are also possible .
........................
toe construction
Figure 1 Cross-section of a dike: outer slope
1) Ph.D. DELFT HYDRAULICS, P.O. Box 152, 8300 AD Emmeloord, The Netherlands, Fax: +31-52743573 2) Rijkswaterstaat, Dutch Public Works and Water Management, Road and Hydraulic Engineering Division.
P.O. Box 5044, 2600 GA Delft, The Netherlands
delft hydraulics
Wave run-up and wave overtopping at dikes and revetments August 1994
Slopes are not always straight; the upper and lower parts do not always have a similar gradient if a berm has been applied. This paper does not cover the design of the dike's protection layer. Instead, the influences of berms, slope angles and roughness on wave runup and overtopping will be discussed.
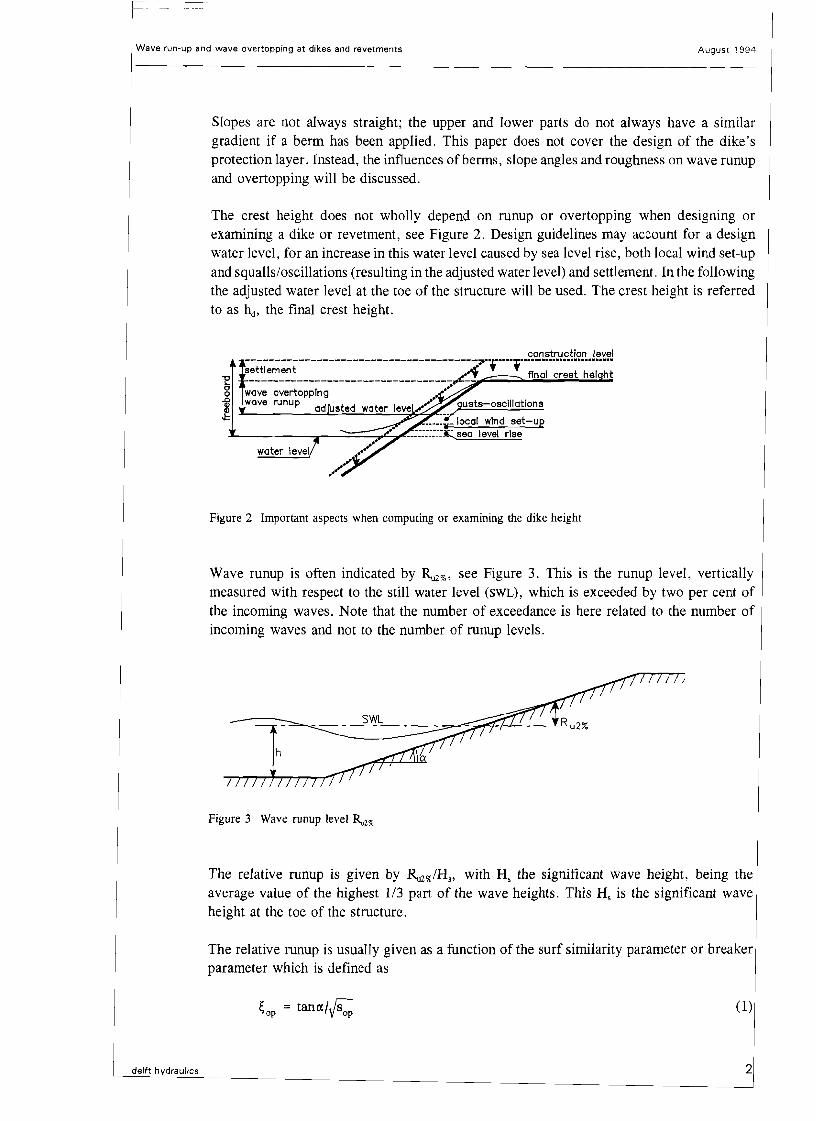
The crest height does not wholly depend on runup or overtopping when designing or examining a dike or revetment, see Figure 2. Design guidelines may account for a design water level, for an increase in this water level caused by sea level rise, both local wind set-up and squalls/oscillations (resulting in the adjusted water level) and settlement. In the following the adjusted water level at the toe of the structure will be used. The crest height is referred to as hd , the final crest height.
construction level--------------------------------------- ., ,settlement .,..; final crest hel ht
~ ----------------------------------~-~-~~~~~~~~~ g wave overtopping ••'! wave runup ad"usted water leve •••••• _.,Justs-oscillations
n ._ local wind set-up L -.,-_....::::::==:;.4,;!. ::::::::'sea level rise
water level
Figure 2 Important aspects when computing or examining the dike height
Wave runup is often indicated by ~%, see Figure 3. This is the runup level, vertically measured with respect to the still water level (SWL), which is exceeded by two per cent of the incoming waves. Note that the number of exceedance is here related to the number of incoming waves and not to the number of runup levels.
Figure 3 Wave runup level Ru2%
The relative runup is given by ~%!Hs' with H, the significant wave height, being the average value of the highest 1/3 part of the wave heights. This H, is the significant wave height at the toe of the structure.
The relative runup is usually given as a function of the surf similarity parameter or breaker parameter which is defined as
~op = tanrx/ys:;, (1)
delft hydraulics 2

Wave run-up and wave overtopping at dikes and revetments August 1994
with:
~op = breaker parameter IX = slope angle sop = wave steepness Tp = wave period, peak period of the wave spectrum
The wave steepness is a fictitious or computation quantity, especially meant to describe the influence of a wave period. This quantity is fictitious as the wave height at the location of the toe is related to the wave length in deep water (gT:/2rr.).
Several wave periods can be taken from a spectrum, among them the peak period Tp (the period yielding the peak of the spectrum which was used here), the mean period Tm
(computed from the spectrum or the time signal) and the significant period Tl/3' Applicable here is that the relation T/Tm mostly lies between 1.1 and 1.25 and that T, and T I /3 are virtually equal.
With ~op < 2 a2.5 the waves break on the slope. This is mostly the case with slopes of 1:3 or milder. For larger values of ~op the waves do not break on the slope any longer. In that case the slopes are often steeper than 1:3 and/or are the waves characterized by a smaller wave steepness (for example swell).
General formula for wave runup
The general design formula that can be applied for wave runup on dikes is given by:
(2)
with a maximum of 3.2 1'h 1'11'/3
with:
Ru2 % 2 % runup level above the still water line H, significant wave height near the toe of the structure ~op breaker parameter ~op = tana/vs:;, = tana/V2rr.Hs/(gT:)
~eq equivalent breaker parameter for a slope with a berm ~eq = 1'b ~op
g acceleration due to gravity T, peak period of the wave spectrum Yb reduction factor for a berm Yh reduction factor for a shallow foreshore Yf reduction factor for slope roughness Y~ reduction factor for oblique wave attack
The formula is valid for the range 0.5 < ~eq < 4 or 5. The relative wave runup ~%/Hs
depends on the breaker parameter ~op and on four reduction factors, namely: for the influence of a shallow foreshore (breaking waves at shallow water), roughness of the slope, oblique wave attack and for a berm. The influence of a berm is accounted for by an equivalent slope gradient expressed in ~eq' If there is no berm, then ~eq = ~op applies. We shall return later to the question of how the reduction factors should be computed.
delft hydraulics 3
Wave run-up and wave overtopping at dikes and revetments August 1994
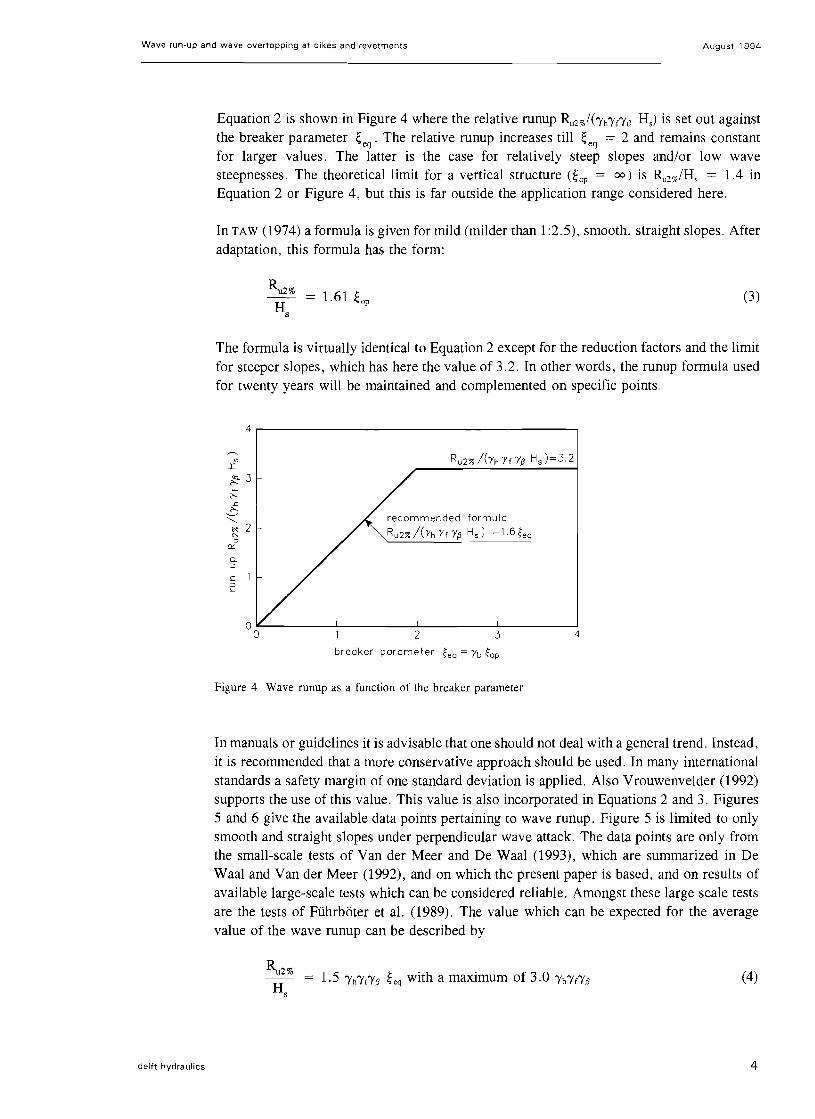
Equation 2 is shown in Figure 4 where the relative runup ~2%/( 'Yh'Y(yO H,) is set out against the breaker parameter ~eq' The relative runup increases till ~eq = 2 and remains constant for larger values. The latter is the case for relatively steep slopes and/or low wave steepnesses. The theoretical limit for a vertical structure (~op = 00) is Ru2%/Hs = 1.4 in Equation 2 or Figure 4, but this is far outside the application range considered here.
In TAW (1974) a formula is given for mild (milder than 1:2.5), smooth, straight slopes. After adaptation, this formula has the form:
= 1.61 ~oP (3)
The formula is virtually identical to Equation 2 except for the reduction factors and the limit for steeper slopes, which has here the value of 3.2. In other words, the runup formula used for twenty years will be maintained and complemented on specific points.
.c
'"~ recommended formula ~ 2 N Ru2%/('YhYfY,6 Hs ) =1.6~eq ~
D::.
o, O)
c 1 2
o
4r-----------------------,
I '" ;::-3
'"
o "- ...J...- ...J... ---'- ----J
2 3 4
breaker parameter ~eq = Yb ~op
Figure 4 Wave runup as a function of the breaker parameter
In manuals or guidelines it is advisable that one should not deal with a general trend. Instead, it is recommended that a more conservative approach should be used. In many international standards a safety margin of one standard deviation is applied. Also Vrouwenvelder (1992) supports the use of this value. This value is also incorporated in Equations 2 and 3. Figures 5 and 6 give the available data points pertaining to wave runup. Figure 5 is limited to only smooth and straight slopes under perpendicular wave attack. The data points are only from the small-scale tests of Van der Meer and De Waal (1993), which are summarized in De Waal and Van der Meer (1992), and on which the present paper is based, and on results of available large-scale tests which can be considered reliable. Amongst these large scale tests are the tests of Fuhrboter et al. (1989). The value which can be expected for the average value of the wave runup can be described by
1.5 'Yh'Yf'YO t q with a maximum of 3.0 'Yh'Yr'YO (4)
delft hydraulics 4

Wave run-up and wave overtopping at dikes and revetments August 1994
The scatter around Equation 4 can be described by interpreting the coefficient 1.5 as a normally distributed stochastic variable with a mean value of 1.5 and a variation coefficient (standard deviation divided by the mean value) of V = (J/fJ.. = 0.06.
4,-------------------------------_
~.3 I
~ f::. L i'~ ~ 2 :J
0:::
o, :0
C :0 L
I
2 I
.3
o small-scale 1 .3 ts srnall-scale 1 4
'V large-scale 1 .3 # large-scale 1: 6
o large-scale 1:8
4
breaker parameter ~eq = f'b ~op
Figure 5 Wave runup for a smooth slope with measured data
Figure 6 shows all available data points pertaining to slopes with berms or roughness and obliquely incoming, short-crested waves. When all the influences are incorporated into one figure, the scatter becomes larger than for only smooth, straight slopes. If we again take the coefficient of 1.5 as a stochastic variable (which is an over-estimation around ~eq = 2) then the variation coefficient can be taken as V = (J/ fJ.. = 0.085. In the two figures the 90 % confidence bands are presented along with Equation 4. In Figure 6 Equation 2 is also given.
However, Equation 4 should not be used for the wave runup when determinis tically designing dikes: for that purpose one should use Equation 2. For probabilistic designs Equation 4 should be taken with the above variation coefficients.
The reduction factors in Equation 2 have all been determined separately in model investigations. In the formula a combination of these reduction factors is possible that produces a very low total reduction. Since combinations of wave runup reduction factors have not been investigated, a minimum total reduction factor should be established. A minimum reduction factor is proposed of 'Yb'Yh'YlYlJ = 0.5. For the application of Equation 2 this implies that if 'Yb'Yh'YlYlJ < 0.5 both the 'Yb in ~ eq (provided a berm is present) and the combination 'Yh'YlYlJ should be multiplied by a factor of JO.5/(YbYhYfY~)' In specific cases it could be demonstrated by means of investigations that a lower reduction factor is acceptable.
In conclusion: the oldest and simplest formula which is still in use in the Netherlands is:
:Ru2% = 8 n, tan« (5)
delft hydraulics 5

Wave run-up and wave overtopping at dikes and revetments August 1994
This formula only corresponds to Equation 2 for an average wave steepness of sop = 0.040 and a value of 1.0 for all the reduction factors.
4,-----------------------------------;
4 I
3
o straight t:. berm
'V fare! an d
* rough o short -crested
o oblique long-crested
Ell oblique short-crested
* 'V 9070 ~---gvO--;-.iL-----
0* 0
I 2
recommended line Formula 2
---;;'3 :r: ~ ?:::. t: < ~ 2 '"~
0:::
0:J
C
2
breaker parameter ~eq = 'Yb ~op
Figure 6 Wave runup data including possible influences
Influence of a stepped slope and/or a berm on wave runup
Figure 7 shows an example of a dike with a berm. The front edge of the berm is located at a depth d, under the still water line. Typical berm slopes are about 1:15. The width of the berm is B.
slope
B
front edge
Figure 7 Front edge, slope and width of the berm
With a stepped slope (with or without berm) the slope gradient is not constant. This makes it necessary to define a representative slope gradient tano which leaves the berm out of consideration. The slope gradient which is most influential for runup is the average slope in the zone between the SWL - H, and the SWL + H, levels. A berm, if present, should not be accounted for when determining the average slope gradient. The procedure is as follows:
delft hydraulics 6

Wave run-up and wave overtopping at dikes and revetments August 1994
• draw a line parallel to the upper slope which intersects the front edge of the berm, • set a point on the lower slope at H, under the SWL,
• set a point on the relocated upper slope at H, above the SWL,
• connect the two points with a line. The angle of this line is the averaged slope gradient tan« pertaining to runup.
The influence of a berm on the runup can be determined by defining an equivalent slope gradient tanaeq- By doing so it is also possible to account for the influence of the berm location. A method with an equivalent slope means in fact that a reduction factor is applied to the breaker parameter itself instead of to the term Ru2%/Hs '
Expressed in a formula this becomes:
(6)~ eq = 'Yb ~ op
The reduction factor 'Yb consists of two other factors viz. one for the influence of the berm width rB and one for the location of the berm with respect to the SWL, rdh.
The following applies:
'Yb = 1 - rB(1-rdh ) and 0.6 S 'Yb S 1,0 (7)
If the berm is located at the water line (the most favourable case) then rdh = 0 and rB causes Yb to be less than 1 (influence of the berm width). If the berm is not situated at the water line, the reduction factor rB will be multiplied by a number less than 1 after which the reduction factor Yb again becomes larger than in the case where the berm is situated at the water line.
In Figure 9 the determination of an equivalent slope tanaeq is graphically depicted. This is accomplished by simply drawing a line through two points, namely, one lying at 1 H, above and below the front of the berm (i.e. not with respect to the water line!).
The influence of the berm width can be given by considering the change in slope gradient:
1 _ taneteq (8)
tan«
With tano the slope gradient as defined in Figure 8. When, for the sake of simplicity, a horizontal berm is considered the following formula can be established:
1 _ taneteq (9)
tan« 2cotet + B/Hs
The influence of the berm location with respect to the water line can be represented by:
dh )2 . [rdh = 0,5 H with 0 S rdh S 1 (10)
s
delft hydraulics 7
Wave run-up and wave overtopping at dikes and revetments August 1994
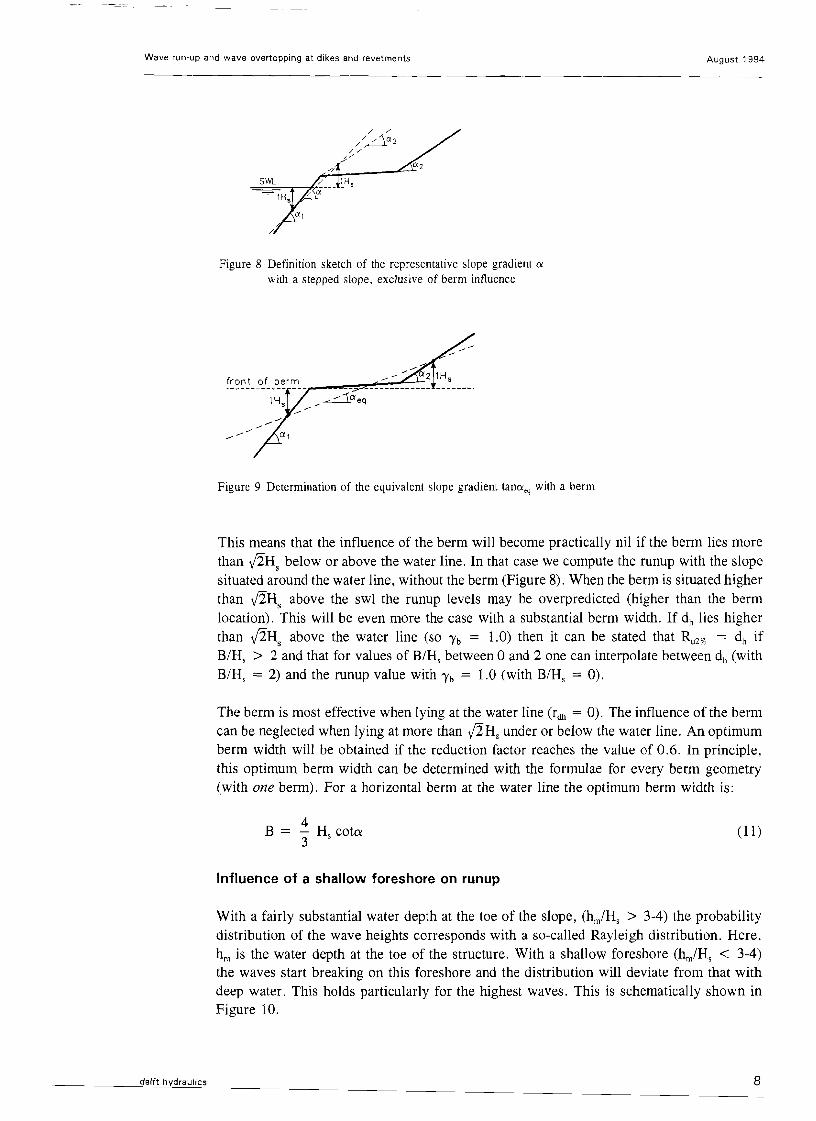
Figure 8 Definition sketch of the representative slope gradient cx with a stepped slope, exclusive of berm influence
fron t of berm
Figure 9 Determination of the equivalent slope gradient tancxeq with a berm
This means that the influence of the berm will become practically nil if the berm lies more than PHs below or above the water line. In that case we compute the runup with the slope situated around the water line, without the berm (Figure 8). When the berm is situated higher than PHs above the swl the runup levels may be overpredicted (higher than the berm location). This will be even more the case with a substantial berm width. If d, lies higher than PHs above the water line (so 'Yb = 1.0) then it can be stated that Ru2% = d, if B/H, > 2 and that for values of BIH, between 0 and 2 one can interpolate between d, (with B/H, = 2) and the runup value with 'Yb = 1.0 (with B/H, = 0).
The berm is most effective when lying at the water line (rdh = 0). The influence of the berm can be neglected when lying at more than PH, under or below the water line. An optimum berm width will be obtained if the reduction factor reaches the value of 0.6. In principle, this optimum berm width can be determined with the formulae for every berm geometry (with one berm). For a horizontal berm at the water line the optimum berm width is:
4B = - H, coto (11)
3
Influence of a shallow foreshore on runup
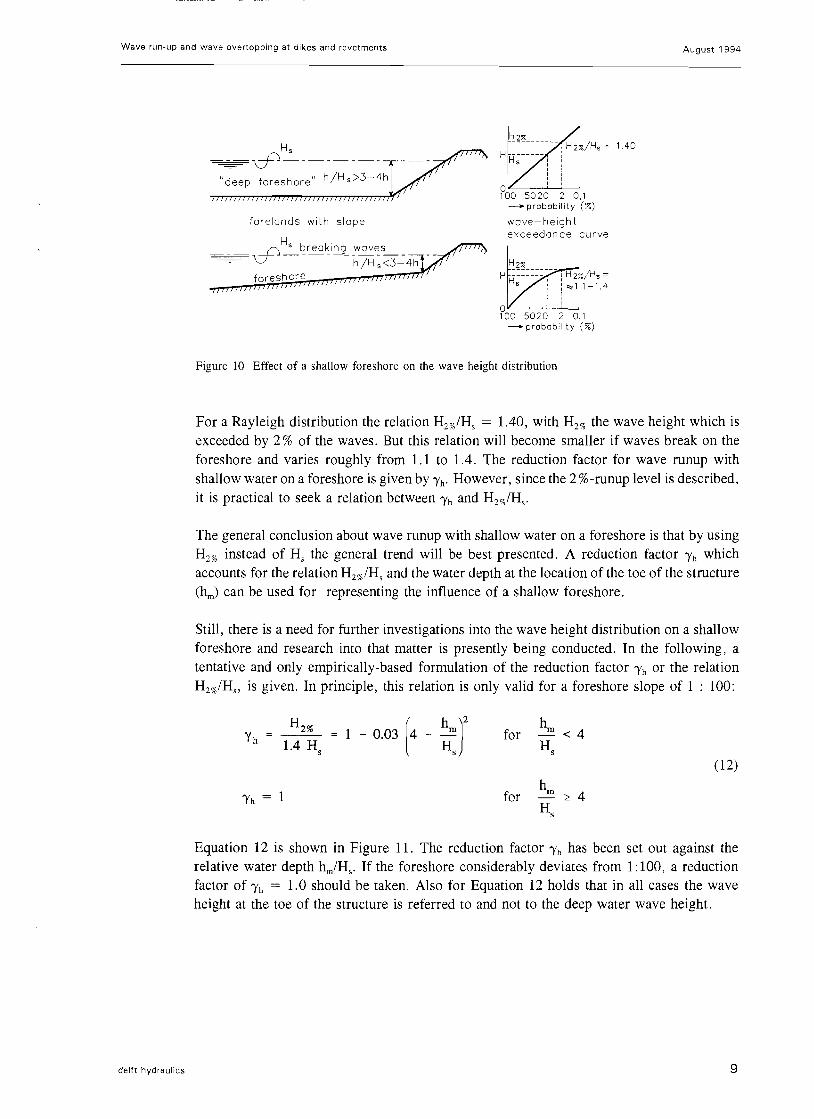
With a fairly substantial water depth at the toe of the slope, (hmlH, > 3-4) the probability distribution of the wave heights corresponds with a so-called Rayleigh distribution. Here, h., is the water depth at the toe of the structure. With a shallow foreshore (hm/H, < 3-4) the waves start breaking on this foreshore and the distribution will deviate from that with deep water. This holds particularly for the highest waves. This is schematically shown in Figure 10.
delft hydraulics 8
Wave run-up and wave overtopping at dikes and revetments August 1994
?oo 5020 2 0,1 -probability (%)
Hs --_ -cP-------"deep foreshore" h/H s>3-4h
forelands with slope wave- heigh t exceedance curve
_~Hs breaking waves -- '-:T - - ----h/H : <3-"::4h H2%
H ~::::::~-- : H 27./Hs =foreshore S J: .=::::1 1-1.4 , ,, ,, ,
o"-----~~-'-~
100 5020 2 0,1 -probability (%)
Figure 10 Effect of a shallow foreshore on the wave height distribution
For a Rayleigh distribution the relation H2%/Hs = 1.40, with H2% the wave height which is exceeded by 2 % of the waves. But this relation will become smaller if waves break on the foreshore and varies roughly from 1.1 to 1.4. The reduction factor for wave runup with shallow water on a foreshore is given by rho However, since the 2 %-runup level is described, it is practical to seek a relation between rh and H2%/H s '
The general conclusion about wave runup with shallow water on a foreshore is that by using H2% instead of H, the general trend will be best presented. A reduction factor rh which accounts for the relation H2%/Hs and the water depth at the location of the toe of the structure (hm) can be used for representing the influence of a shallow foreshore.
Still, there is a need for further investigations into the wave height distribution on a shallow foreshore and research into that matter is presently being conducted. In the following, a tentative and only empirically-based formulation of the reduction factor rh or the relation H2%/H" is given. In principle, this relation is only valid for a foreshore slope of 1 : 100:
hm2% = 1 - 0.03 4 - ~ for - < 4H (h rYh 1.4 H H H s s s
(12)
h mrh 1 for <: 4 Hs
Equation 12 is shown in Figure 11. The reduction factor rh has been set out against the relative water depth hm/Hs' If the foreshore considerably deviates from 1:100, a reduction factor of rh = 1.0 should be taken. Also for Equation 12 holds that in all cases the wave height at the toe of the structure is referred to and not to the deep water wave height.
delft hydraulics 9

Wave run-up and wave overtopping at dikes and revetments August 1994
1.2
1.0 .<:
(>-. ----------~----------1 (; 0.8 u ~
..2 0.6c
0 :;:; u :::l 0.4 I "~
0.2
O'------'----.J....------::----..J...------: o 2 3 4 5 relative water depth hm/Hs
Figure 11 Reduction factor Yh for a shallow foreshore (1: 100)
Influence of the roughness on runup
The influence of the roughness on runup is given by the reduction factor 'Y[. Reduction factors for various types of revetments have been published earlier. The origin of these factors dates back to Russian investigations performed in the fifties with regular waves. A table on these factors was further developed in TAW (1974) and published in several international manuals. New studies, often large-scale, and conducted with random waves have led to a new table (Table 1) of reduction factors for rough slopes. In Table 1, also smooth slopes are described on which roughness elements such as blocks and ripples were installed. The width of a block or ripple is given by fb and the ripple length by fL' Installation of the blocks is determined by the part of the total slope surface covered by these blocks. A rubble mound slope (rock) is characterized by the diameter D.
Type of slope Reduction
factor "Yf
Old relation
factors
Smooth, concrete, asphalt 1.0 1.0 Closed, smooth, block revetment 1.0 0.9 Grass (3 em) 0.90-1.0 0.85-0.90 1 rubble layer (H,/D = 1.5-3) 0.55-0.60 0.80 2 or more rubble layers (H,/D = 1.5-61
Roughness elements on a smooth slope. Height = f h, widch = f b
Label fh/fb fb/H, Surface
covered
0.50-0.55 0.50-0.55
1/25 block 0.88 0.12-0.24 1/25 0.75-0.85 1/9 block 0.88 0.12-0.19 1/9 0.70-0.75 half block height 0.44 0.12-0.24 1/25 0.85-0.95
only above wacer line 0.88 0.12-0.18 1/25 0.85-0.95 wide block 0.18 0.55-1.10 1/4 0.75-0.85
Ripples. fb/H, = 0.12-0.19 en fL/f h = 7 (optimal)
where f L = distance between the ripples
0.60-0.70
Table 1 Reduction factor Yf for a rough slope
The reduction factors in Table 1 apply for ~oP < 3-4. For larger values of ~oP the reduction factors become 1.
delft hydraulics 10
Wave run-up and wave overtopping at dikes and revetments August 1994
Influence of the angle of wave attack on runup
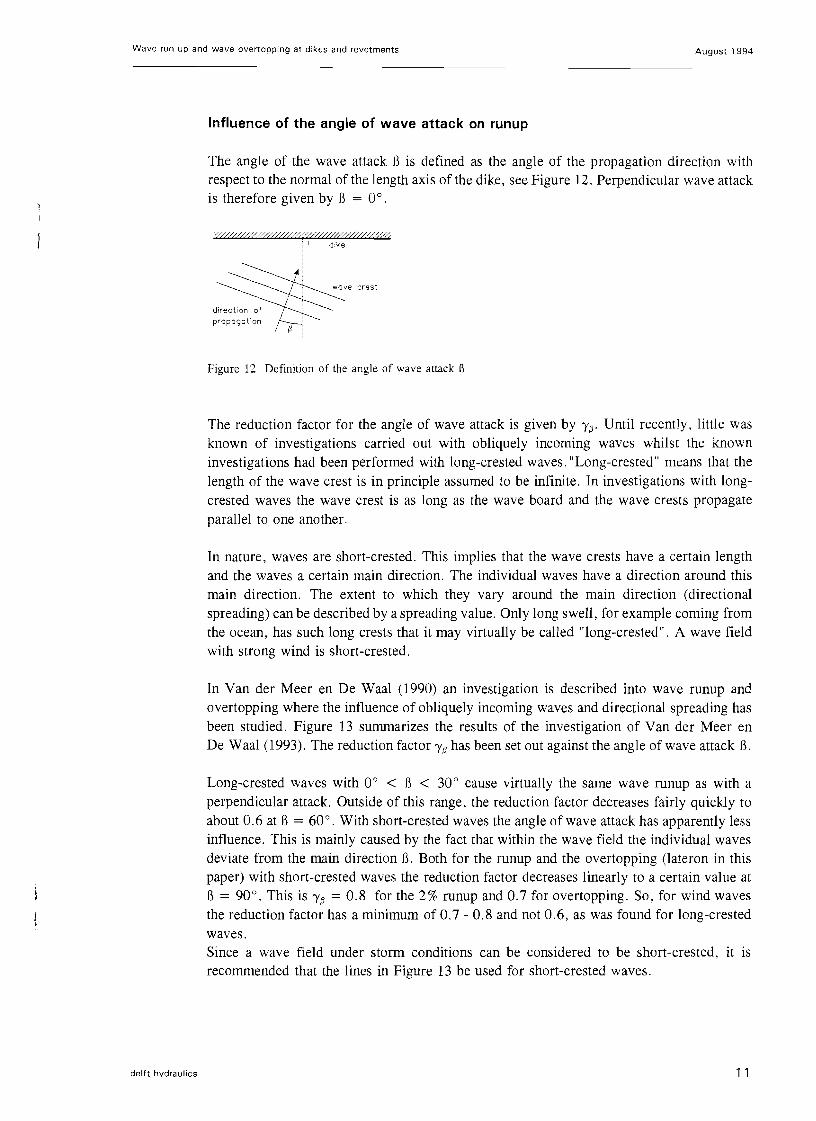
The angle of the wave attack B is defined as the angle of the propagation direction with respect to the normal ofthe length axis of the dike, see Figure 12. Perpendicular wave attack is therefore given by B = 0°.
:///4///////1/1///////-//1//1//1///////////// r-.J ,,,,,,,,
dike
wove crest
direction of
propagation {3
Figure 12 Definition of the angle of wave attack J3
The reduction factor for the angle of wave attack is given by 'Y{3' Until recently, little was known of investigations carried out with obliquely incoming waves whilst the known investigations had been performed with long-crested waves. "Long-crested" means that the length of the wave crest is in principle assumed to be infinite. In investigations with longcrested waves the wave crest is as long as the wave board and the wave crests propagate parallel to one another.
In nature, waves are short-crested. This implies that the wave crests have a certain length and the waves a certain main direction. The individual waves have a direction around this main direction. The extent to which they vary around the main direction (directional spreading) can be described by a spreading value. Only long swell, for example coming from the ocean, has such long crests that it may virtually be called "long-crested". A wave field with strong wind is short-crested.
In Van der Meer en De Waal (1990) an investigation is described into wave runup and overtopping where the influence of obliquely incoming waves and directional spreading has been studied. Figure 13 summarizes the results of the investigation of Van der Meer en De Waal (1993). The reduction factor 'Y{3 has been set out against the angle of wave attack B.
Long-crested waves with 0° < B < 30° cause virtually the same wave runup as with a perpendicular attack. Outside of this range, the reduction factor decreases fairly quickly to about 0.6 at B = 60°. With short-crested waves the angle of wave attack has apparently less influence. This is mainly caused by the fact that within the wave field the individual waves deviate from the main direction B. Both for the runup and the overtopping (lateron in this paper) with short-crested waves the reduction factor decreases linearly to a certain value at B = 90°. This is 'Y{3 = 0.8 for the 2% runup and 0.7 for overtopping. So, for wind waves the reduction factor has a minimum of 0.7 - 0.8 and not 0.6, as was found for long-crested waves. Since a wave field under storm conditions can be considered to be short-crested, it is recommended that the lines in Figure 13 be used for short-crested waves.
delft hydraulics 11

~~~~--------~-------------
Wave run-up and wave overtopping at dikes and revetments August 1994
1.2
------l.°r--~~~St=:::~~~lJ
r-------------------,
sa,?-- 0.8 L 2 u .2 06
run up long-crestedc: o
(not applicable):;; 0.4 -e ~
~ 02
Ol....----'-_........._--'-_..J--_l....---'-_........._--'-----J o 10 20 30 40 50 60 70 80 90
angle of wove attock {3
Figure 13 Reduction factor y p for the angle of wave attack
For the 2 % runup and overtopping different reduction factors apply for obliquely incident waves. The cause for this is that here the incoming wave energy per meter length of structure is less than that for perpendicular wave attack. The wave overtopping is defined as a volume per metre length while the runup does not depend on the structure length. The use of the lines given in Figure 13 for short-crested waves is recommended and can be described by the following formulae:
For the 2 %-wave runup with short-crested waves:
"1(3 = 1 - O. 0022;J (B in degrees) (13)
For wave overtopping with short-crested waves:
"1(3 = 1 - O.0033;J (B in degrees) (14)
Influence of double-peaked spectra
In most cases a wave spectrum has only one peak and this makes it possible to determine the peak period Tp in a rather unambiguous way. However, in some cases the spectrum may have two peaks. An example is a wave field which consists of both swell and locally generated waves. Such a wave field exists in the Wadden sea by Holland and Germany, where long waves from the North sea penetrate through the channels and the inlets and combine with locally generated short waves.
When dealing with double-peaked spectra the highest peak of the spectrum should not be used in the runup to apply runup and or overtopping formulae, as in that case both overtopping and runup will be underestimated. A sort of weighted average of the influence of both peaks should be determined. In Figure 14 the method is shown. The double-peaked spectrum is split into two areas: for each part the surface m, (the zeroth moment) and the peak period should be determined. Both the magnitude of the separate areas (a direct relation exists with the wave height as Hmo = 4/illo) and the two peak periods should be used to calculate the equivalent peak period. This equivalent peak period can be used to calculate the wave steepness or the breaker parameter which are part of the runup and the overtopping formulae. The formula to compute Tpeq is:
delft hydraulics 12

Wave run-up and wave overtopping at dikes and revetments August 199"
(15)
with:
Tpeq equivalent peak period with a double-peaked spectrum ~(l) area pertaining to the first peak n\)(2) area pertaining to the second peak
m, = total area, m, = ~(l) + ~(2). It applies that Hmo 4~
Tp(1) peak period pertaining to first peak Tp(2) peak period pertaining to second peak
With Equation 15 an overprediction of the runup or overtopping will be computed if the breaker parameter ~op (see Equation 1) for Tll) is larger than 2. In that case for TP) in Equations 15 a value can be used which pertains to t q = 2.
8.------------------------,mo=mo(1)+mo(2) Tp(l) =l/fp(l)
~ mo=mo(1)+mo(2) Tp(2)=1/fp(2)I N
<, 6 fp (2)N
~ c-,
~ 4 c <lJ
1:)
>,
0'> 2 ~ C <lJ
0.1 02 0.3 0.4
wave frequency (Hz)
Figure 14 Splitting up a double-peaked spectrum into two separate parts
Wave overtopping
Average overtopping discharge
With wave overtopping, the crest height is lower than the runup levels of the highest waves. The parameter to be considered here is the free crest height R, see Figure 15. This is the difference in level between SWL and the crest height. The crest height itself can be given as an absolute crest height hct , for example determined with respect to OD (Ordnance Datum). The crest height reduced by the water level (also with respect to OD) then yields the free crest height R,
Figure 15 Free crest height with wave overtopping
delft hydraulics 13
Wave run-up and wave overtopping at dikes and revetments August 1994
Wave overtopping is mostly given as an average discharge q per metre width, for example in mvs per m or in lis per m. The Dutch Guideline on river dykes (TAW, 1989) indicates that for relatively heavy seas and with wave heights of up to a few metres the 2 %-wave runup criterion yields an overtopping discharge of the order of 1 lis per m. It becomes 0.1 lis per m with lower waves such as those occurring in rivers. An overtopping of 1 lis per m in the river area can lead to a reduction of the freeboard of the dike. The same guideline further quotes "Which criterion applies depends of course also on the design of the dike and the possible presence of buildings. In certain cases, such as a covered crest and inner slopes, sometimes lOlls per m can be tolerated". In Dutch Guidelines it is assumed that the following average overtopping rates are allowable for the inner slope:
• 0.1 lis per m for sandy soil with a poor turf • 1.0 lis per m for clayey soil with relatively good grass • 10 lis per m with a clay protective layer and grass according to the standards for
an outer slope or with a revetment construction
At the moment studies are being carried out to better explain the relation 0.1, 1.0 and lOlls per m overtopping as well as the condition of the inner slope.
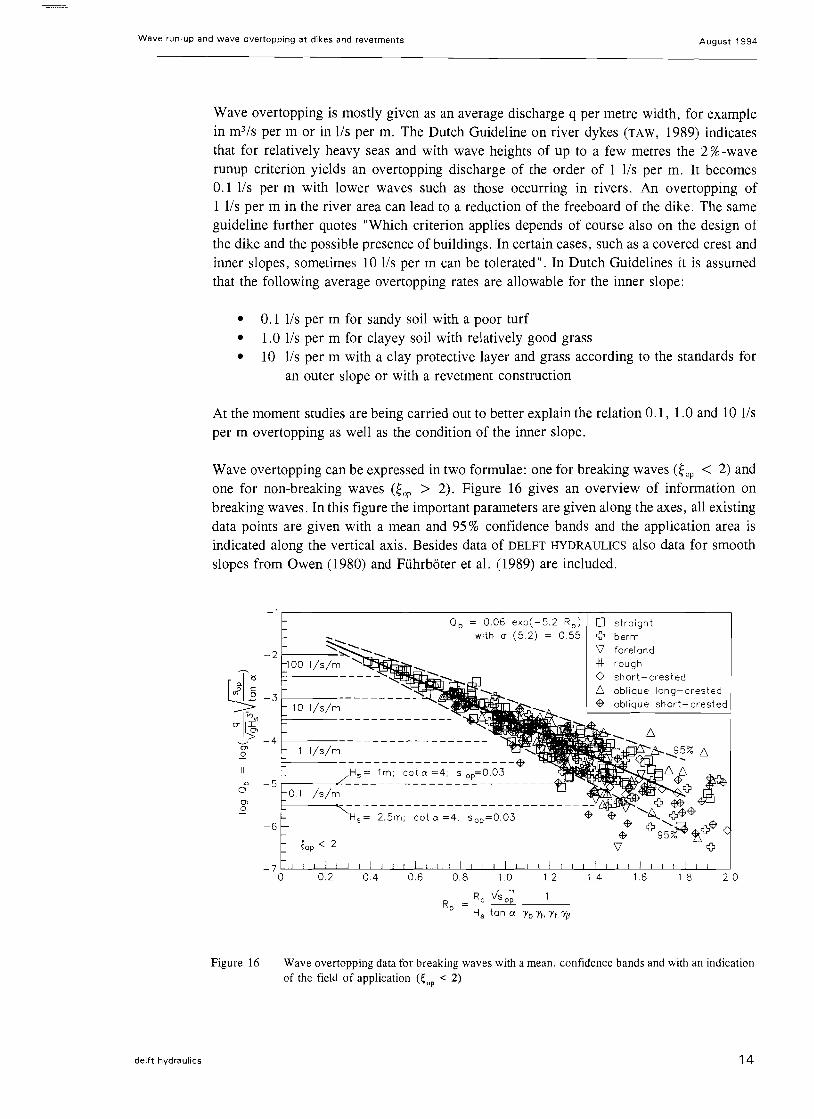
Wave overtopping can be expressed in two formulae: one for breaking waves (~op < 2) and one for non-breaking waves (~op > 2). Figure 16 gives an overview of information on breaking waves. In this figure the important parameters are given along the axes, all existing data points are given with a mean and 95 % confidence bands and the application area is indicated along the vertical axis. Besides data of DELFT HYDRAULICS also data for smooth slopes from Owen (1980) and Fuhrboter et al. (1989) are included.
-1,-----------------------,-----------, o, = 0.06 exp(-5.2 Rb ) straight
with (J (5.2) = 0.55 berm forel and -2f----....: rough short-crested oblique long-crested~ -3f--- oblique short-crested10 I/s/m
~-----------------CTI~ ~ -4~---------------------0' a
.c -5 a 0'
~--~-------------------------------.2 Hs= 2.5m; cot ex =4; sop=0.03
-6
~op < 2
Figure 16 Wave overtopping data for breaking waves with a mean, confidence bands and with an indication of the field of application (~op < 2)
delft hydraulics 14

Wave run-up and wave overtopping at dikes and revetments August 1994
The dimensionless overtopping discharge Qb (b for breaking waves) is given on the ordinate:
- q ~ (16)o, - ! H 3 ~ ~ g s
and the dimensionless crest height R, (application area 0.3 < R, < 2) with:
R vs:;,c (17) H s tan« YbYhYfY~
with
dimensionless overtopping discharge for breaking waves
«, < 2) q average overtopping discharge (in m3/s per m width) g acceleration due to gravity Hs significant wave height (average of highest 1/3 part)
2
RTsop wave steepness = 27rH,/(gTp )
p peak period, with a double-peaked spectrum Tpeq, see Formula 15
b dimensionless crest height with breaking waves (~op < 2) Rc free crest height above still water line
reduction factors for influence of a berm, shallow foreshore, roughYb'Yh' Yr, yp ness and angle of wave attack, see previous part. Minimum value using a combination of factors is 0.5.
Both the dimensionless overtopping discharge and the dimensionless crest height are related to the significant wave height, the wave steepness and the slope gradient. To account for the varying conditions, the dimensionless crest height is virtually increased through division
by the reduction factors Yb'Yh,Yr'Y{J which were described earlier. This is Equation 7 for Yb'
Equation 12 for Yh' Table 1 for Yr and Equation 14 for Y{J'
The average of all the observations in Figure 16 can be described by:
Q, = 0.06 exp(-5.2 Rb) for ~op < 2 (18)
The reliability of the formula is given by taking the coefficient 5.2 as a normally distributed stochastic variable with an average of 5.2 and a standard deviation (J = 0.55. By means of this standard deviation also confidence bands (Il- ± xo) can be drawn with for x times the standard deviation (1.64 for the 90% and 1.96 for the 95% confidence limit).
Also, in Figure 16 several overtopping discharges are illustrated, namely, 0.1, 1, 10 and 100 lis per m. The discharges apply for a 1:4 slope and a wave steepness of sop = 0.03. The upper line of the interval applies to a significant wave height of 1.0 m (for example river dikes) and the lower one for a wave height of 2.5 m (for example for sea dikes).
The available data points for non-breaking waves (~op > 2) have been set out in Figure 17.
delft hydraulics 15

Wave run-up and wave overtopping at dikes and revetments August 1994
The dimensionless overtopping discharge is now given along the vertical ordinate by:
(19)
and the dimensionless crest height R, along the abscissa by:
(20)
with:
Qn dimensionless overtopping discharge for non-breaking waves (~op > 2) R, dimensionless crest height for non-breaking waves (~op > 2)
0,-------------------------,------------, an = 0.2 exp(-2.6 Rn) o straight
with a (2.6) = 0.35 <> berm \l foreland =If rough-1 <>
100
-2
crl~ '--' 0' 10 2. -3
c a 0' 2.
-4
0.1
-5
-6 0 4.0
short-crested D, oblique long-crested $ oblique short-crested
~oP > 2
1.5 2.5 3.0 3.5
#
R = ~ -- n Hs )'b)'h)'1 )'(3
Figure 17 Wave overtopping data for non-breaking waves with a mean, confidence bands and with an indication of the field of application (~op > 2)
As with wave runup (see Formula 2), the wave steepness and slope gradient do not have an influence any longer on the overtopping in the area of non-breaking waves. For 'Yb in Equation 20, the influence of a berm vanishes if ~oP :2: 4 (since 'Yb = 1). In the interval 2/'Yb < ~op < 4 a larger value for 'Yb must be taken than computed with Equation 7, namely, a value from linear interpolation between 'Yb (for ~op = 2/'Yb) and 1.0 (for ~op = 4).
delft hydraulics 16

Wave run-up and wave overtopping at dikes and revetments August 1994
The average of all observations in Figure 17 is given by
Qn = 0.2 exp(-2.6 Ru) (21)
The reliability of the formula can be given by taking the coefficient 2.6 as a normally distributed stochastic variable having a standard deviation of (J = 0.35. With this standard deviation the 95 % confidence bands have been drawn in Figure 17.
The dimensionless overtopping and crest height as defined by Equations 19 and 20 can also be used for vertical structures. Although Equation 21 will not be valid for vertical structures. it is possible to plot data in a graph similar to Figure 17. With a reduction factor of about 0.6 for vertical structures the data may be described by Equation 21.
Also, in Figure 17 the intervals are given along the ordinate which express the overtopping discharges of 0.1, 1, 10, and 100 lis per m respectively. These intervals hold for a wave height of H, = 1 m (upper line) and 2.5 m (lower line) and are independent of the slope gradient and the wave steepness.
As for wave runup, a somewhat more conservative formula should be applied for design purposes than the average value. The two recommended formulae for overtopping are:
for breaking waves with ~op < 2:
(22)
and for non-breaking waves with ~op > 2:
(23)
with Q, and R; as defined in Equations 19 and 20.
Both design formulae are graphically shown in Figures 18 and 19. In these figures the recommended lines, the mean and the 95% conidence limits are given.
Also, in Figure 18 the formula from TAW (1974) is drawn and is practically the same as the newly recommended line.
When assessing a crest height of a dike in a deterministic way Equations 22 and 23 are recommended. With probabilistic computations both the given estimates of the mean value (Equations 18 and 21) and the given standard deviations can be taken.
In general, it can be said that the results for runup and overtopping on smooth, straight slopes differ very little from TAW (1974). With the new formulae steep slopes are accounted for by considering non-breaking waves separately. The improvement is mainly the description of the reliability of the formulae and a better description of the influence of berms, a shallow foreshore, roughness and the angle of wave attack.
delft hydraulics 17

Wave run-up and wave overtopping at dikes and revetments August 1994
-1 r--------------------------, <1>
2' o-5 -2 .~ ---..
i tJ1 -3
]o
or!} -4
(J) C1' (J)
<1> .2 c -5 0 'iii .D C a<1>
C1' -6,~ ." .2
-7 0,2 0,4 0,6 0,8 10 1,2 1,4 1,6 1,8 2,0° s, 'IS; 1
dimensionless crest height Rb = - ---Hs tan C( 'Yb 'Yh 'Yf 'Y{3
Figure 18 Wave overtopping with breaking waves (~op < 2)
° <1>
2' 0 -1
.I: U (J)
'6 C1' -2 ,S 0. ~
<1> >
.g0.
orff -3 0 (J) C1' (J)
<1> .2 -4 c 0 'iii cc a<1>
E C1' -5 '6 .2
-6 0,5 1,0 1,5 2,0 2,5 3,0 3,5 4,0° Rc 1
dimensionless crest height Rn Hs 'Yb'ih 'Yf 'Y{3
Figure 19 Wave overtopping with non-breaking waves (~op > 2)
Wave overtopping volumes per wave
The recommended line for the overtopping discharge q is described in the preceding section by the Equations 22 and 23. However, the average overtopping discharge does not say much about the amount of water of a certain overtopping wave passing the crest. The volumes of individual waves deviate considerably from the average discharge. By means of the average overtopping discharge the probability distribution function of the overtopping discharges can be computed. This probability distribution function is a Weibull distribution with a form factor of 0.75 and a scale factor a which is dependent of the average overtopping discharge per wave and the overtopping probability. The probability distribution function is given by:
delft hydraulics 18

Wave run-up and wave overtopping at dikes and revetments August 1994
(24)
a == Tmq
084 , P (25) ow
with:
Py probability of the overtopping volume per wave V being less than or similar to V
V overtopping volume per wave (in m' per m width)
Tm average wave period (NTm is the storm duration or time interval considered)
q average overtopping volume (in rrr' per m width)
Pow No)Nw = probability of overtopping per wave
Now = number of overtopping waves
Nw number of incoming waves during the time the storm lasts
The probability of overtopping can be computed by
(26)
The value of c follows from the assumption that the runup distribution is similar to the
Rayleigh distribution and that the 2 % runup is calculated with Equation 2. The relation
for the coefficient c has the form of Equation 2 for that reason, except for a factor
-Jln 0.02 = 1.98. The value of c is found by:
c = 0.81 'Yh 'Yf 'Y(J s., with a maximum of c = 1.62 'Yh 'Yf 'Y(J (27)
The reduction factors 'Yh 'Yf 'Y(J and the equivalent breaker parameter ~eq have been defined earlier.
As an illustration a probability distribution function is given in Figure 20, based on the Equations 24-26. The presented line applies for an average overtopping discharge of
q = 1 lis per m, a wave period of Tm = 5 s and a overtopping probability of POll = 0.10 (10% of the incoming waves).
This implies that a = 0.042 (Equation 25) and that the probability distribution is given by:
V )0'75)PV == P(y :::; V) == 1 - exp - -- (28)( ( 0.042
The volume for a certain exceedance probability 1 - P, follows from:
4
V == a [-In(1 - PV;I] 3 (29)
delft hydraulics 19

--
Wave run-up and wave overtopping at dikes and revetments
A first estimate can be obtained for the maximum volume of one wave which can be
expected in a certain period by substituting the total number of overtopping waves No,,:
4
V (30)max
0.5 E <,
"' -S 0.4
'"> o ~
~ 0 ..3 '"Q.
'" E ::l 0.2 ~ en c ii 0.1 Q.
~ '"> o a
V
/ /
.// I
.> 100 50 10 5 2 1 0.5 01
probability of exceedonce (%)
Figure 20 Probability distribution function for overtopping volumes per wave: q = Ills per m width, 'I'; = 5 sand Pov = 0.10
To give an impression of the relation between the average overtopping discharge q and the
expected value of the maximum volume in the largest overtopping wave Vmax' this relation
is given for two situations in Figure 21. Conditions here are a storm duration of 1 hour, a
slope gradient of 1:4 and a wave steepness of s., = 0.04 with a T/Tm ratio of 1.15.
Relations have been drawn for a wave height of H, = I m and 2.5 m. For small average
overtopping discharges the relation VmaJq is of the order of 1000 and for large average overtopping discharges of the order of 100.
100.000
E <, co
>'"0 10.000 ~
en S Q. Q.
~ '"> 1.0000
.S
'"E ::l
"5 >
100E ::l
.~ x 0 E
1III10 0.01 1000
/v Hs 2.5m
,/ .1A' V Hs=lm
,/
.,.. .... ton a. 1/4
Sop 0.04 during 1 hour
IIIII 0.1 1 10 100
average overtopping discharge q (I/s per m)
Figure 21 Relation between average overtopping discharge and maximum volume of the highest overtopping wave
delft hydraulics 20

Wave run-up and wave overtopping at dikes and revetments AUgUS1 1994
Conclusions
Formulae have been given for conceptual design on wave run-up and overtopping of dikes
and sloping structures. Influences of structure geometry and wave boundary conditions have
been included in a practical way. Formulae were given for deterministic design, including
some safety, but also for probabilistic design, giving the average trend and the reliability
by a variation coefficient.
Acknowledgements
The Rijkswaterstaat, Dutch Public Works Department and the TAW, the Technical Advisory
Committee on Water Defences in The Netherlands are greatfully acknowledged for their
financial and technical support.
References
Battjes, J.A., 1974. Computation of set-up. longshore currents, run-up and overtopping due to wind-generated waves. Communications on Hydraulics. Delft University of Technology, Report no. 74-2. The Netherlands.
Fuhrboter , A., Sparboom, U. and Witte, H.H., 1989. Groner Wellenkanal Hannover: Versuchsergebnisse tiber den Wellenauflauf auf glatten und rauhen Deichboschungen met der Neigung 1:6. Die Kii~te. Archive for Research and Technology on the North Sea and Baltic Coast.
Owen, M.W., 1980. Design of seawalls allowing for wave overtopping. Report No. EX 924, Hydraulics Research, Wallingford, UK.
TAW, 1974. Wave run-up and overtopping. Technical Advisory Committee on Water Defences in The Netherlands. Government publishing office, The Hague, The Netherlands.
TAW, 1986. Leidraad voor het ontwerpen van rivierdijken. Deel 1 - boven-rivierengebied. "Guideline for the design of river dikes. Part 1 - Upper river area". In Dutch.
Van der Meer, J.W. en de Waal, J.P., 1990. Invloed van scheve golfinval en richtingspreiding op gal foploop en overslag. "Influence of oblique wave attack and directional spreading on wave run-up and overtopping". Delft Hydraulics Report on model investigation, H638. In Dutch.
Van der Meer, J.W. en de Waal, J.P., 1993. Waterbeweging op taluds. Invloed van berm. ruwheid. ondiep voorland en scheve lang- en kortkammige golfaanval. "Water movement on slopes". Intluence of berm roughness shallow foreshore and oblique and short-crested wave attack. Delft Hydraulics Report on model investigation, H1256. In Dutch.
Vrouwenvelder, 1992. Probabilistic basis for reliability verification. Note cON-92-0531 vRA/MNL ofTNO-Bouw. Rijswijk, The Netherlands.
De Waal, J.P. and Van der Meer, J.W., 1992. Wave run-up and overtopping at coastal structures. ASCE, Proc. 23rd ICCE, Venice, Italy.
delft hydraulics 21

Wave run-up and wave overtopping at dikes and revetments
Notation
B b~w~ ~
d, berm depth relative to SWL (m) g acceleration due to gravity (m/s')
Hmo significant wave height based on the spectrum 4.jtll; (m) H, significant wave height, average of the highest 1/3 part (m) h water depth (m) R, crest height relative to SWL (m) h., water depth at the position of the toe of the structure (m) Lop wave length at deep water based on Tp (Lop == (g/2n) * T:) (m) N, number of incoming waves (-) Now number of overtopping waves (-) P, = P(Y:::: V) probability of the overtopping volume Y being smaller
or greater than V (-) Pow probability of overtopping per wave Qb dimensionless overtopping discharge with breaking waves ; op < 2 (-) Qn dimensionless overtopping discharge with non-breaking waves ;op > 2 (-) q average overtopping discharge per unit crest length (mvs per m) R wave runup, measured vertically with respect to the still water line (m) Ru2% height of wave runup exceeded by 2 % of the incoming waves (m) R, dimensionless crest height with breaking waves ;op < 2 (-) R, dimensionless crest height with non-breaking waves ; op > 2 (-) rB reduction factor for the berm width (-) rdh reduction factor for the berm location (-) sop wave steepness with L, based on Tp (sop = H/Lop) (-)
T wave period (s) Tm mean period (s) T, peak period (s) Tpeq equivalent peak period with double-peaked spectra (s) T, significant period, average of the highest 1/3 part (s) V volume of overtopping wave per unit crest width (rrr' per m)
slope gradient equivalent slope gradient for a slope with a berm angle of wave attack reduction factor for a berm reduction factor for the roughness reduction factor for a shallow foreland reduction factor for the angle of wave attack surf similarity parameter based on Tp (;op == tanrx/vsop) equivalent surf similarity parameter (;eq = Yb ;op)
delft hydraulics 22