DELAWARE STATE HOUSING AUTHORITY A Component Unit of …
89
DELAWARE STATE HOUSING AUTHORITY A Component Unit of the State of Delaware Basic Financial Statements And Supplemental Information For the Fiscal Year Ended June 30, 2012 Including Requirements of The Single Audit Act and Independent Auditor's Reports
Transcript of DELAWARE STATE HOUSING AUTHORITY A Component Unit of …
DELAWARE STATE HOUSING AUTHORITY A Component Unit of the State of Delaware
Basic Financial Statements And Supplemental Information
For the Fiscal Year Ended June 30, 2012
Including Requirements of The Single Audit Act and
Independent Auditor's Reports
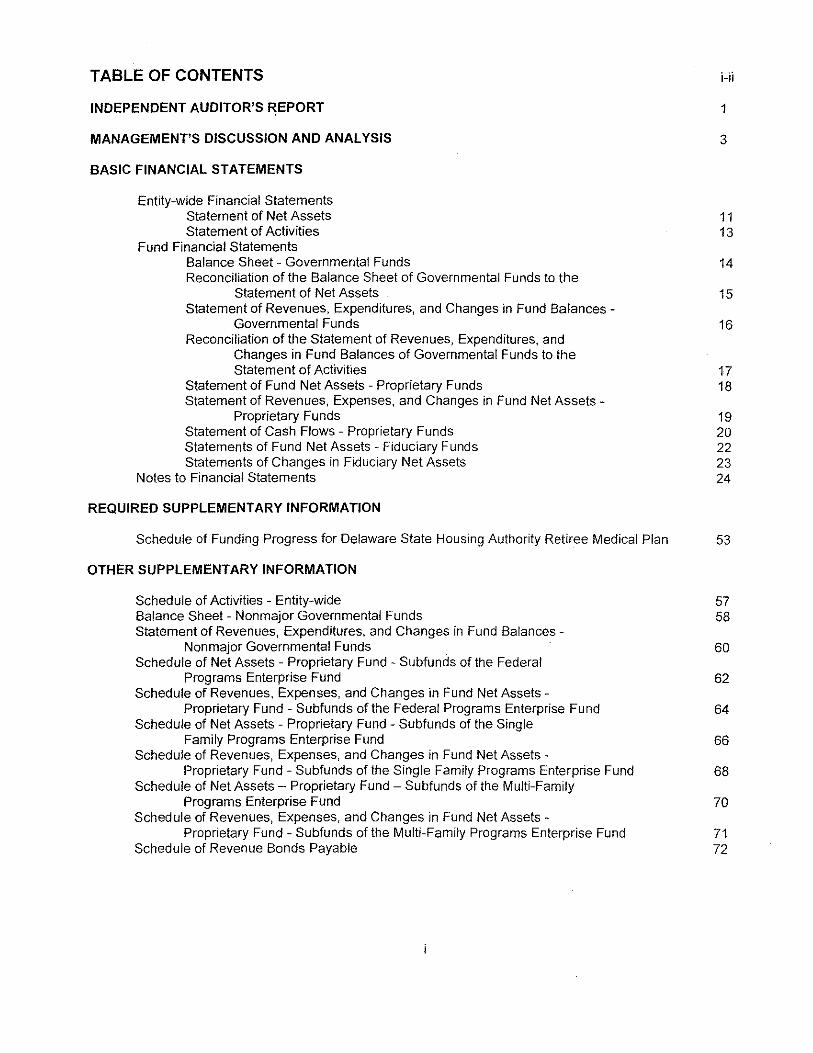
TABLE OF CONTENTS
INDEPENDENT AUDITOR'S REPORT
MANAGEMENT'S DISCUSSION AND ANALYSIS
BASIC FINANCIAL STATEMENTS
Entity-wide Financial Statements Statement of Net Assets Statement of Activities
Fund Financial Statements Balance Sheet- Governmental Funds Reconciliation of the Balance Sheet of Governmental Funds to the
Statement of Net Assets Statement of Revenues, Expenditures, and Changes in Fund Balances
Governmental Funds Reconciliation of the Statement of Revenues, Expenditures, and
Changes in Fund Balances of Governmental Funds to the Statement of Activities
Statement of Fund Net Assets- Proprietary Funds Statement of Revenues, Expenses, and Changes in Fund Net Assets -
Proprietary Funds Statement of Cash Flows- Proprietary Funds Statements of Fund Net Assets- Fiduciary Funds Statements of Changes in Fiduciary Net Assets
Notes to Financial Statements
REQUIRED SUPPLEMENTARY INFORMATION
i-ii
1
3
11 13
14
15
16
17 18
19 20 22 23 24
Schedule of Funding Progress for Delaware State Housing Authority Retiree Medical Plan 53
OTHER SUPPLEMENTARY INFORMATION
Schedule of Activities - Entity-wide Balance Sheet- Nonmajor Governmental Funds Statement of Revenues, Expenditures, and Changes in Fund Balances
Non major Governmental Funds Schedule of Net Assets - Proprietary Fund - Subfunds of the Federal
Programs Enterprise Fund Schedule of Revenues, Expenses, and Changes in Fund Net Assets
Proprietary Fund- Subfunds of the Federal Programs Enterprise Fund Schedule of Net Assets- Proprietary Fund- Subfunds of the Single
Family Programs Enterprise Fund Schedule of Revenues, Expenses, and Changes in Fund Net Assets-
Proprietary Fund - Subfunds of the Single Family Programs Enterprise Fund Schedule of Net Assets- Proprietary Fund- Subfunds of the Multi-Family
Programs Enterprise Fund Schedule of Revenues, Expenses, and Changes in Fund Net Assets-
Proprietary Fund - Subfunds of the Multi-Family Programs Enterprise Fund Schedule of Revenue Bonds Payable
57 58
60
62
64
66
68
70
71 72
TABLE OF CONTENTS, continued
SINGLE AUDIT SUPPLEMENT
Report on Internal Control over Financial Reporting and on Compliance and Other Matters Based on an Audit of Financial Statements Performed in Accordance with Government Auditing Standards
Independent Auditor's Report on Compliance with Requirements That Could Have a Direct And Material Effect on Each Major Program and on Internal Control over Compliance in Accordance with OMB Circular A-133
Schedule of Findings and Questioned Costs
Schedule of Expenditures of Federal Awards
Supplemental Statement of Public Housing Actual Modernization Capital Fund Grant Costs
Notes to Schedule of Expenditures of Federal Awards and Supplemental Statement of Public Housing Actual Modernization Capital Fund Grant Costs
ii
77
79
81
82
84
85
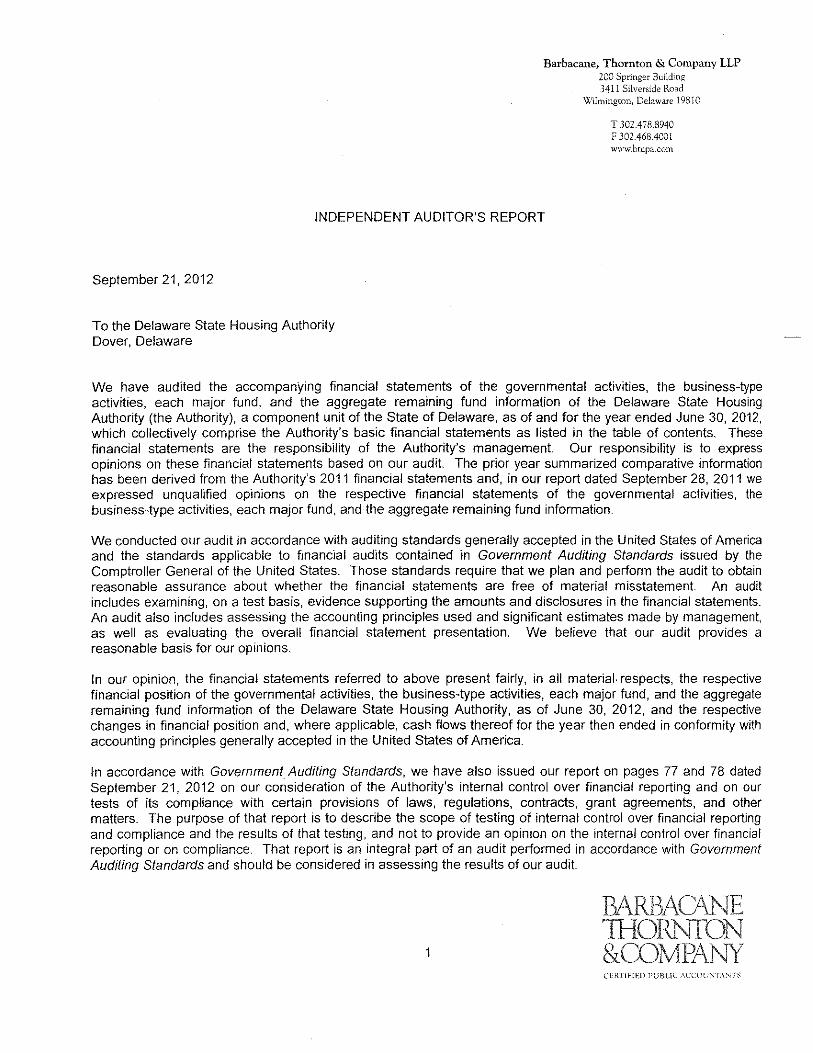
Barbacane, Thornton & Company LLP 200 Springer Building 3411 Silverside Road
Wilmington, Delaware 19810
T 302.478.8940 F 302.468.400! www.btcpa.com
INDEPENDENT AUDITOR'S REPORT
September 21, 2012
To the Delaware State Housing Authority Dover, Delaware
We have audited the accompanying financial statements of the governmental activities, the business-type activities, each major fund, and the aggregate remaining fund information of the Delaware State Housing Authority (the Authority), a component unit of the State of Delaware, as of and for the year ended June 30, 2012, which collectively comprise the Authority's basic financial statements as listed in the table of contents. These financial statements are the responsibility of the Authority's management. Our responsibility is to express opinions on these financial statements based on our audit. The prior year summarized comparative information has been derived from the Authority's 2011 financial statements and, in our report dated September 28, 2011 we expressed unqualified opinions on the respective financial statements of the governmental activities, the business-type activities, each major fund, and the aggregate remaining fund information.
We conducted our audit in accordance with auditing standards generally accepted in the United States of America and the standards applicable to fmancial audits contained in Government Auditing Standards issued by the Comptroller General of the United States. Those standards require that we plan and perform the audit to obtain reasonable assurance about whether the financial statements are free of material misstatement. An audit includes examining, on a test basis, evidence supporting the amounts and disclosures in the financial statements. An audit also includes assessing the accounting principles used and significant estimates made by management, as well as evaluating the overall financial statement presentation. We believe that our audit provides a reasonable basis for our opinions.
In our opinion, the financial statements referred to above present fairly, in all material. respects, the respective financial position of the governmental activities, the business-type activities, each major fund, and the aggregate remaining fund information of the Delaware State Housing Authority, as of June 30, 2012, and the respective changes in financial position and, where applicable, cash flows thereof for the year then ended in conformity with accounting principles generally accepted in the United States of America.
In accordance with Government Auditing Standards, we have also issued our report on pages 77 and 78 dated September 21, 2012 on our consideration of the Authority's internal control over financial reporting and on our tests of its compliance with certain provisions of laws, regulations, contracts, grant agreements, and other matters. The purpose of that report is to describe the scope of testing of internal control over financial reporting and compliance and the results of that testing, and not to provide an opinion on the internal control over financial reporting or on compliance. That report is an integral part of an audit performed in accordance with Government Auditing Standards and should be considered in assessing the results of our audit.
1
BARBAO\NE 1HORNTON &COMPANY CERTlFlED l'L'BL\C ACCOL'NTA~TS
Accounting principles generally accepted in the United States of America require that the management's discussion and analysis and schedule of funding progress on pages 3 through 10 and page 53 be presented to supplement the basic financial statements. Such information, although not a part of the basic financial statements, is required by the Governmental Accounting Standards Board, who considers it to be an essential part of financial reporting for placing the basic financial statements in an appropriate operational, economic, or historical context. We have applied certain limited procedures to the required supplementary information in accordance with auditing standards generally accepted in the United States of America, which consisted of inquiries of management about the methods of preparing the information and comparing the information for consistency with management's responses to our inquiries, the basic financial statements, and other knowledge we obtained during our audit of the basic financial statements. We do not express an opinion or provide any assurance on the information because the limited procedures do not provide us with sufficient evidence to express an opinion or provide any assurance.
Our audit was conducted for the purpose of forming opinions on the financial statements that collectively comprise the Authority's financial statements as a whole. The other supplementary information listed in the table of contents and the Supplemental Statement of Public Housing Actual Modernization Capital Fund Grant Costs are presented for the purposes of additional analysis and are not a required part of the financial statements. The accompanying schedule of expenditures of federal awards is presented for purposes of additional analysis as required by the U.S. Office of Management and Budget Circular A-133, Audits of States, Local Governments and Nonprofit Organizations, and is also not a required part of the financial statements. The other supplementary information, the Supplemental Statement of Public Housing Actual Modernization Capital Fund Grant Costs and the schedule of expenditures of federal awards are the responsibility of management and were derived from and relate directly to the underlying accounting and other records used to prepare the financial statements. The information has been subjected to the auditing procedures applied in the audit of the financial statements and certain additional procedures, including comparing and reconciling such information directly to the underlying accounting and other records used to prepare the financial statements or to the financial statements themselves, and other additional procedures in accordance with auditing standards generally accepted in the United States of America. In our opinion, the information is fairly stated in all material respects in relation to the financial statements as a whole.
;J~~~tlrf?LLP BARBACANE, THORNTON & COMPANY LLP
2
Management's Discussion and Analysis, June 30 2012
The Delaware State Housing Authority (the Authority), a component unit of the State of Delaware, is a public corporation whose Director is appointed by and reports directly to the Governor of the State. The Authority's functions are to provide home ownership, affordable rental housing, and both housing and community rehabilitation assistance. Funding for the home ownership program is derived from the issuance of single family mortgage revenue bonds. The affordable rental housing programs are supported through Federal grant funds from the U.S. Department of Housing and Urban Development (US Dept of HUD), and the State Housing Development Fund. Housing rehabilitation is also funded through the State sponsored Housing Development Fund. Community rehabilitation is provided through grants from US Dept of HUD.
As management of the Authority, we offer readers of the Authority's financial statements this narrative overview and analysis of the financial activities of the Authority for the Fiscal Year Ended June 30, 2012. The Authority's Management's Discussion and Analysis (MD&A) is designed to (a) assist the reader in focusing on significant financial issues, (b) provide an overview of the Authority's financial activity, (c) identify changes in the Authority's financial position (its ability to address the next and subsequent year challenges), and (d) identify individual fund issues or concerns.
Since the MD&A is designed to focus on the current year's activities, resulting changes and currently known facts, please read it in conjunction with the Authority's financial statements (beginning on page 11 ).
Financial Highlights
• The Authority's assets exceeded liabilities at the close of the fiscal year by $365,990,246 (net assets).
• Unrestricted net assets totaled $39,146,822. This amount is dedicated to the Authority's operations, pursuant to Title 31, Chapter 40 of the Delaware Code and the Authority's bond resolutions. A General Fund cash and investment balance of $38,329,034 contributes to this unrestricted net asset total.
• The Authority's total net assets increased by $26,333,914. Governmental activities increased by $35,989,650, while business-type activities decreased by $9,655,736. The most significant factors contributing to the increase were the appropriation of $19,570,000 from the State of Delaware to the Housing Development Fund and the receipt of $3,431,526 in HOME Investment Partnership Program federal grant funds, both for the purpose of making loans and grants to meet affordable housing needs, and the receipt of $1,132,894 in federal grant funds for capital asset improvements.
• At the close of the current fiscal year, the Authority's governmental funds reported combined ending fund balances of $265,775,370, an increase of $35,800,038 in comparison with the prior year.
• The Authority's total debt, excluding compensated absences, decreased by $71,747,237 (8.0 percent) during the Fiscal Year 2012. The Single Family Programs issued new revenue bond debt of $213,144,016 during the fiscal year. This amount was offset by scheduled maturities of $4,330,000, bond calls of $227,775,239, primarily the result of bond refunding and mortgage prepayments experienced by the Single Family and Multi-Family Programs, and $978,815 representing the net of accretion on capital appreciation bonds, deferred amounts on refunding, and bond forgiveness. The Single Family Programs also report a net decrease in a note payable to the Federal Home Loan Bank of Pittsburgh in the amount of $53,764,829.
• The American Recovery and Reinvestment Act of 2009 (ARRA), created to help the economy and increase employment, provided the Authority with $18.9 million during Fiscal Year 2010, $12.3 million during Fiscal Year 2011, and an additional $9.84 million during Fiscal Year 2012. This increased funding was used to make capital improvements to public housing sites, provide additional resources to the Community Development Block Grant Program, and fund a new program for homeless prevention. ARRA also created the Housing Tax Credit Assistance Program which, along with additional funding for exchanging unused low income housing tax credits for cash through the IRS, was used in the financing of low income housing development projects.
3
Overview of the Financial Statements
This discussion and analysis is intended to serve as an introduction to the Authority's basic financial statements. The Authority's basic financial statements comprise three components: 1) entity-wide financial statements, 2) fund financial statements, and 3) notes to the financial statements. This report also contains supplementary information in addition to the basic financial statements themselves.
Entity-wide Financial Statements
The entity-wide financial statements are designed to provide readers with a broad overview of the Authority's finances, in a manner similar to a private-sector business.
The statement of net assets presents information on all of the Authority's assets and liabilities, with the difference between the two reported as net assets. Over time, increases or decreases in net assets may serve as a useful indicator of whether the financial position of the Authority is improving or deteriorating.
The statement of activities presents information showing how the Authority's net assets changed during the most recent fiscal year. All changes in net assets are reported as soon as the underlying event giving rise to the change occurs, regardless of the timing of related cash flows. Thus, revenues and expenses are reported in this statement for some items that will only result in cash flows in future fiscal periods (e.g., earned but unused vacation leave).
Both of the entity-wide financial statements distinguish functions of the Authority that are principally supported by state grants, interest income, and transfers (governmental activities) from other functions that are intended to recover all or a significant portion of their costs through federal grants and interest income (business-type activities). The governmental activities of the Authority include administrative, home ownership, affordable rental housing, and housing rehabilitation. The business-type activities of the Authority include home ownership, affordable rental housing, and community rehabilitation.
The entity-wide financial statements can be found on pages 11-13 of this report.
Fund Financial Statements
A fund is a grouping of related accounts that is used to maintain control over resources that have been segregated for specific activities or objectives. The Authority, like other state and local governments, uses fund accounting to ensure and demonstrate compliance with finance-related legal requirements. All of the funds of the Authority can be divided into three categories: governmental funds, proprietary funds, and fiduciary funds.
Governmental Funds
Governmental funds are used to account for the same functions reported as governmental activities in the entitywide financial statements. However, unlike the entity-wide financial statements, governmental fund financial statements focus on near -term inflows and outflows of spendable resources, as well as on balances of spendable resources available at the end of the fiscal year. Such information may be useful in evaluating the Authority's near-term financing requirements.
Because the focus of governmental funds is narrower than that of the entity-wide financial statements, it is useful to compare the information presented for governmental funds with similar information presented for governmental activities in the entity-wide financial statements. By doing so, readers may better understand the long-term impact of the government's near-term financing decisions. Both the governmental fund balance sheet and the governmental fund statement of revenues, expenditures, and changes in fund balances provide reconciliation between governmental funds and governmental activities to facilitate this comparison.
The Authority maintains ten individual governmental funds. Information is presented separately in the governmental fund balance sheet and in the governmental fund statement of revenues, expenditures, and changes in fund balances for the General Fund, the Housing Development Fund, and the OSHA Second Mortgage Assistance Loan program, all of which are considered to be major funds. Data from the other governmental funds are combined into a single, aggregated presentation. Individual fund data for each of these non-major governmental funds is provided in the form of supplementary combining schedules elsewhere in this
4
report. The basic governmental fund financial statements can be found on pages 14-17 of this report.
Proprietary Funds
The Authority maintains one type of proprietary fund. Enterprise funds are used to report the same activities presented as business-type activities in the entity-wide financial statements. The Authority uses enterprise funds to account for its federal, single family, and multi-family programs.
Proprietary funds provide the same type of information as the entity-wide financial statements, only in more detail. The proprietary fund financial statements provide separate information for the federal programs, single family, and multi-family funds, all of which are considered to be major funds of the Authority. The basic proprietary fund financial statements can be found on pages 18-21 of this repo'rt.
Fiduciary Funds
Fiduciary funds are used to account for resources held for the benefit of parties outside the entity. Fiduciary funds are not reftected in the entity-wide financial statements because the resources of those funds are not available to support the Authority's own programs. The accounting used for fiduciary funds is much like that used for proprietary funds.
The Authority reports one fiduciary type fund, the OSHA Retiree Medical Trust Fund. This fund accounts for transactions, assets, liabilities, and net assets available for post-employment healthcare insurance premiums of the Authority's non-state employees. The basic fiduciary fund financial statements can be found on pages 22-23 of this report.
Notes to the Financial Statements
The notes provide additional information that is essential to a full understanding of the data provided in the entitywide and fund financial statements. The notes to the financial statements can be found on pages 24-50 of this report.
Other Information
This report contains certain individual fund, program, and bond financial schedules on pages 57-73 Also contained in this report is the Authority's Single Audit Supplement, pages 77-85, presented in compliance with U.S. Office of Management and Budget Circular A-133, Audits of States, Local Governments and Nonprofit Organizations.
Entity-wide Financial Analysis
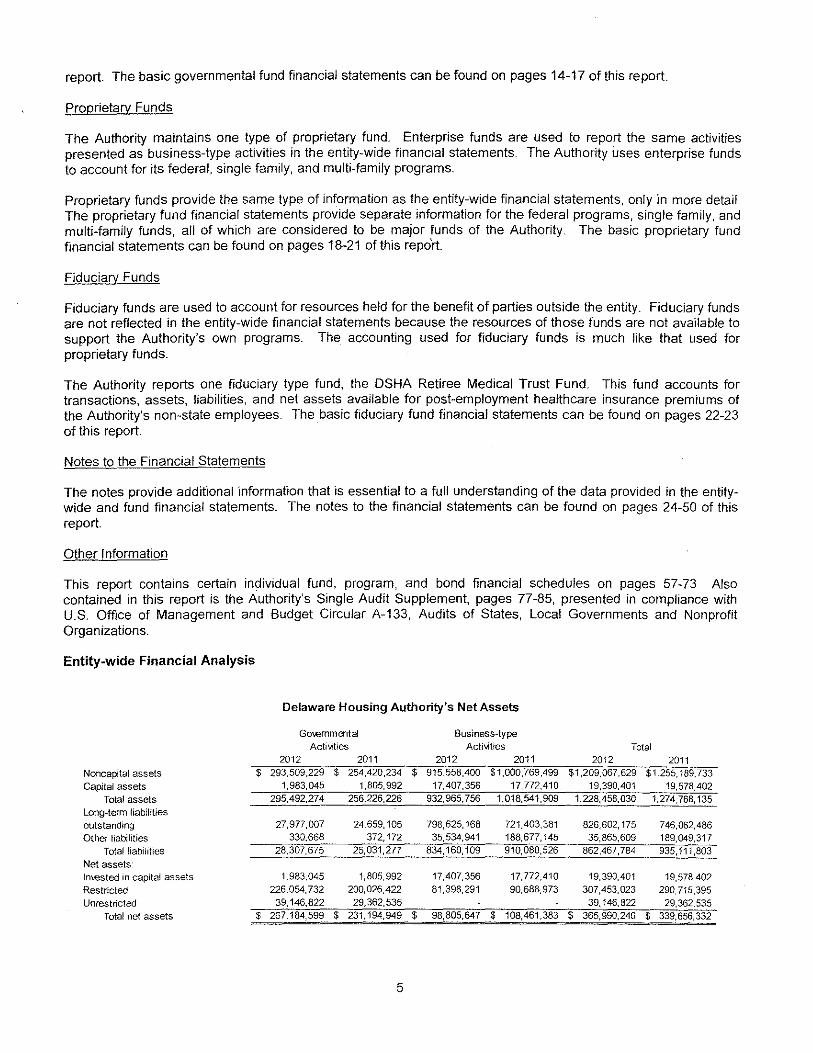
Delaware Housing Authority's Net Assets
Governmental Business-type Acti-..ities Acti~Aties Total
2012 2011 2012 2011 2012 2011
Noncapltal assets $ 293,509,229 $ 254,420,234 $ 915,558.400 $1,000,769.499 $1,209,067,629 $1,255,189,733
Capital assets 1,983,045 1,805,992 17,407,356 17,772,410 19,390,401 19,578,402 Total assets 295,492,274 256,226,226 932,965,756 1,018,541,909 1 ,228,458, 030 1,274,768,135
Long-term liabiHties outstanding 27,977,007 24,659,105 798,625,168 721,403,381 826,602,175 7 46,062,486 Other liabilities 330,668 372,172 35,534,941 188,677,145 35,865,609 189,049,317
Total liabilities 28,307,675 25,031,277 834,160,109 910,080,526 862,467,784 935,111,803
Net assets· tnx.ested in capital assets 1,983,045 1,805,992 17,407,356 17,772,410 19,390,401 19,578,402 Restricted 226,054,732 200,026,422 81,398,291 90,688,973 307.453,023 290,715,395
Unrestricted 39,146,822 29,362,535 39,146,822 29,362,535 Total net assets $ 267,184,599 $ 231,194,949 $ 98,805,647 $ 108,461,383 $ 365,990,246 $ 339,656,332
5
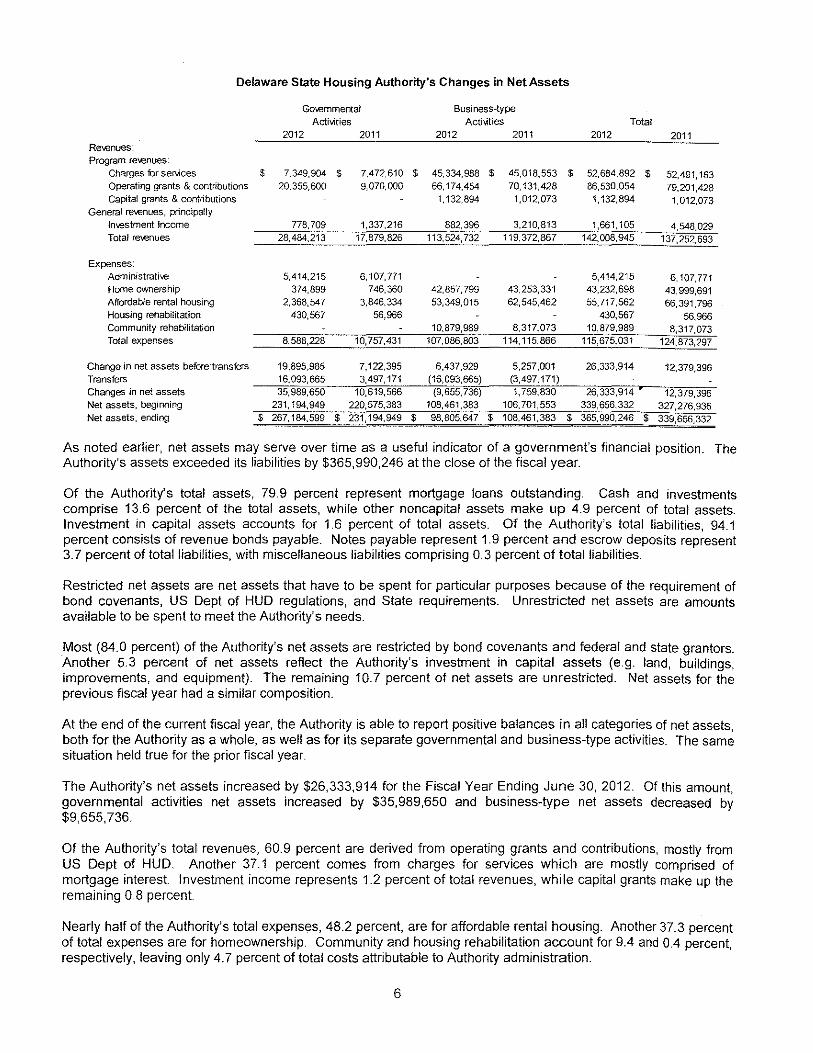
Delaware State Housing Authority's Changes in Net Assets
Revenues: Program revenues:
Charges for services Operating grants & contributions
Capital grants & contributions
General re'venues, principat!y
ln-.estment Income
Total revenues
Expenses: Administrati-.e
Home ownership Affordable rental housing
Housing rehabilitation
Community rehabilitation
Total expenses
Change in net assets before· transfers Transfers
Changes in net assets
Net assets, beginning
Net assets, ending
$
Governmental Business-type Activities Acf1\oities Total
2012 2011 2012 2011 2012 2011
7.349,904 $ 20,355,600
7,472,610 $ 45,334,988 $ 45,018,553 $ 52,684,892 $ 52,491' 163 9,070,000 66,174,454 70,131,428 86,530,054 79,201,428
1,132,894 1,012,073 1,132,894 1,012,073
778,709 1,337,216 882,396 3,210,813 1,661,105 4,548,029 28,484,213 17,879,826 113,524,732 119,372,867 142,008,945 137,252,693
5,414,215 6,107,771 374,899 746,360
2,368,547 3,846,334 430,567 56,966
8,588,228 10,757,431
19,895,985 7,122,395 16,093,665 3,497,171 35,989,650 10,619,566
231,194,949 220,575,383
42,857,799
53,349,015
10,879,989 107,086,803
6,437,929 (16,093,665) (9,655.736)
108,461,383
5,414,215
43,253,331 43,232,698 62,545,462 55,717,562
430,567 8,317,073 10,879,989
114,115,866 115,675,031
5,257,001 26,333,914 (3,497, 171) 1,759,830 26,333,914
106,701,553 339,656,332
6,107,771 43,999,691 66,391,796
56,966 8,317,073
124,873,297
12,379,396
12,379,396 327,276,936
$ 267,184,599 $ 231,194,949 $ 98,805,647 $ 108,461,383 $ 365,990,246 $ 339,656,332
As noted earlier, net assets may serve over time as a useful indicator of a government's financial position. The Authority's assets exceeded its liabilities by $365,990,246 at the close of the fiscal year.
Of the Authority's total assets, 79.9 percent represent mortgage loans outstanding. Cash and investments comprise 13.6 percent of the total assets, while other noncapital assets make up 4.9 percent of total assets. Investment in capital assets accounts for 1.6 percent of total assets. Of the Authority's total liabilities, 94.1 percent consists of revenue bonds payable. Notes payable represent 1.9 percent and escrow deposits represent 3.7 percent of total liabilities, with miscellaneous liabilities comprising 0.3 percent of total liabilities.
Restricted net assets are net assets that have to be spent for particular purposes because of the requirement of bond covenants, US Dept of HUD regulations, and State requirements. Unrestricted net assets are amounts available to be spent to meet the Authority's needs.
Most (84.0 percent) of the Authority's net assets are restricted by bond covenants and federal and state grantors. Another 5.3 percent of net assets reflect the Authority's investment in capital assets (e.g. land, buildings, improvements, and equipment). The remaining 10.7 percent of net assets are unrestricted. Net assets for the previous fiscal year had a similar composition.
At the end of the current fiscal year, the Authority is able to report positive balances in all categories of net assets, both for the Authority as a whole, as well as for its separate governmental and business-type activities. The same situation held true for the prior fiscal year.
The Authority's net assets increased by $26,333,914 for the Fiscal Year Ending June 30, 2012. Of this amount, governmental activities net assets increased by $35,989,650 and business-type net assets decreased by $9,655,736.
Of the Authority's total revenues, 60.9 percent are derived from operating grants and contributions, mostly from US Dept of HUD. Another 37.1 percent comes from charges for services which are mostly comprised of mortgage interest. Investment income represents 1.2 percent of total revenues, while capital grants make up the remaining 0.8 percent.
Nearly half of the Authority's total expenses, 48.2 percent, are for affordable rental housing. Another 37.3 percent of total expenses are for homeownership. Community and housing rehabilitation account for 9.4 and 0.4 percent, respectively, leaving only 4.7 percent of total costs attributable to Authority administration.
6
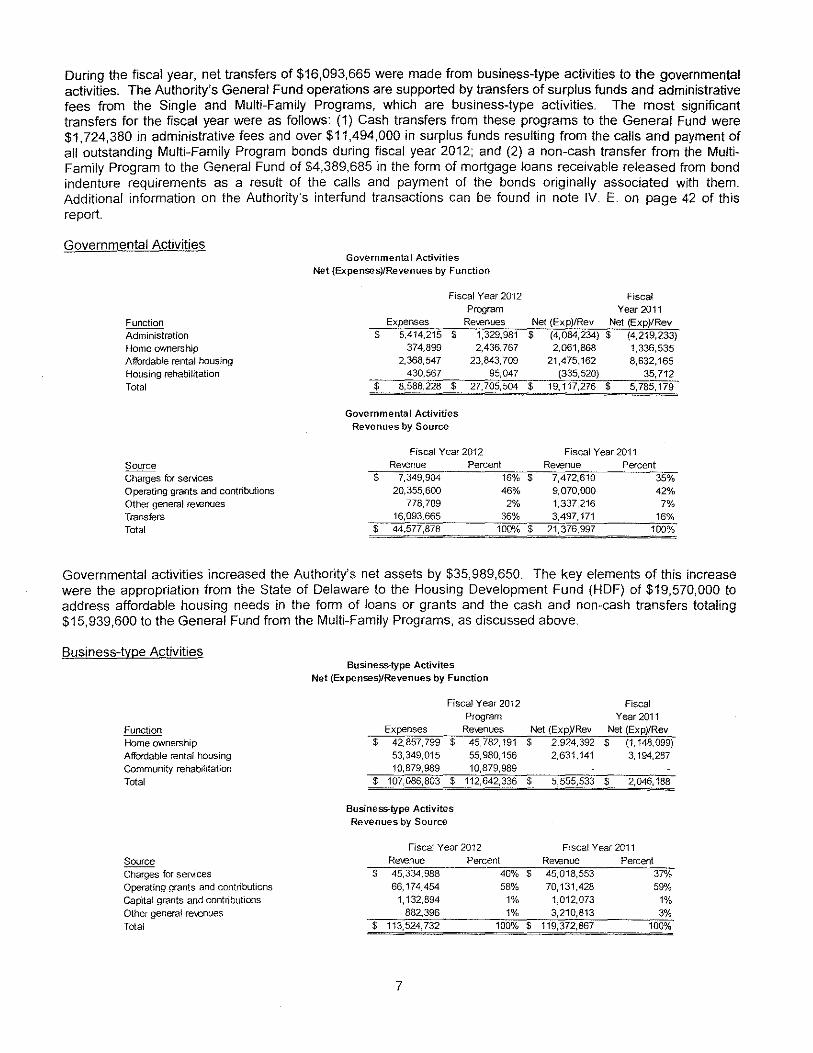
During the fiscal year, net transfers of $16,093,665 were made from business-type activities to the governmental activities. The Authority's General Fund operations are supported by transfers of surplus funds and administrative fees from the Single and Multi-Family Programs, which are business-type activities. The most significant transfers for the fiscal year were as follows: (1) Cash transfers from these programs to the General Fund were $1,724,380 in administrative fees and over $11,494,000 in surplus funds resulting from the calls and payment of all outstanding Multi-Family Program bonds during fiscal year 2012; and {2) a non-cash transfer from the MultiFamily Program to the General Fund of $4,389,685 in the form of mortgage loans receivable released from bond indenture requirements as a result of the calls and payment of the bonds originally associated with them. Additional information on the Authority's interfund transactions can be found in note IV. E. on page 42 of this report.
Governmental Activities
Administration Home ownership Affordable rental housing Housing rehabilitation
Total
Source Charges for ser.ices Operating grants and contributions Other genera! re-..enues Transfers Total
Governmental Activities Net {Expenses)JRevenues by Function
Fiscal Year 2012 Fiscal Program Year 2011
Expenses Re-..enues Net (Exp)/Rev Net (Exp)/Rev $ 5,414,215 $ 1,329,981 $ (4,084,234) $ (4,219,233)
374,899 2,436,767 2,061,868 1,336,535 2,368,547 23,843,709 21,475,162 8,632,165
430,567 95,047 (335,520) 35,712 $ 8,588,228 $ 27,705,504 $ 19,117,276 $ 5,785,179
Governmental Activities Revenues by Source
Fiscal Year 2012 Re-.enue
$ 7,349,904 20,355,600
778,709 16,093,665
$ 44,577,878
Percent 16% $ 46%
2% 36%
100% $
Fiscal Year 2011 Re\renue Percent
7,472,610 35% 9,070,000 42% 1,337,216 7% 3,497,171 16%
21,376,997 100%
Governmental activities increased the Authority's net assets by $35,989,650. The key elements of this increase were the appropriation from the State of Delaware to the Housing Development Fund (HDF) of $19,570,000 to address affordable housing needs in the form of loans or grants and the cash and non-cash transfers totaling $15,939,600 to the General Fund from the Multi-Family Programs, as discussed above.
Business-type Activities
Function Home ownership Affordable rental housing Community rehabilitation
Total
Source Charges for services Operating grants and contributions Capital grants and contributions Other general re\€nues Total
Business-type Activites Net (Expenses)IRevenues by Function
Fiscal Year 2012 Program
Expehses Revenues
$ 42,857,799 $ 45,782,191 53,349,015 55,980,156 10,879,989 10,879,989
Net {Exp)IRev $ 2,924,392
2,631,141
Fiscal Year 2011
Net {Exp)/Rev $ (1,148,099)
3,194,287
$ 107,086,803 $ 112,642,336 $ 5,555,533 $ 2,046,188
Business-type Activites Revenues by Source
Fiscal Year 2012 Fiscal Year 2011 Re\€nue Percent Re\-enue Percent
$ 45,334,988 66,174,454
1,132,894 882,396
$ 113,524,732
7
40% $ 45,018,553 58% 70,131,428
1% 1,012,073 1% 3,210,813
100% $ 119,372,867
37%
59% 1% 3%
100%
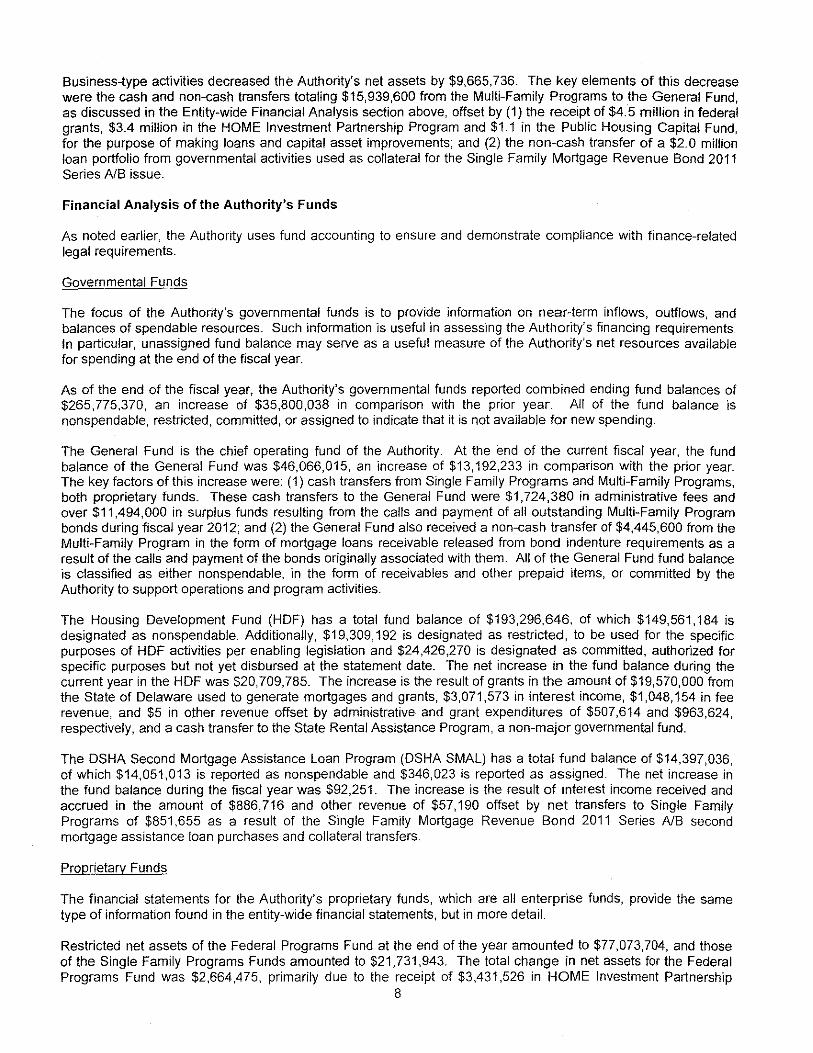
Business-type activities decreased the Authority's net assets by $9,665,736. The key elements of this decrease were the cash and non-cash transfers totaling $15,939,600 from the Multi-Family Programs to the General Fund, as discussed in the Entity-wide Financial Analysis section above, offset by (1) the receipt of $4.5 million in federal grants, $3.4 million in the HOME Investment Partnership Program and $1.1 in the Public Housing Capital Fund, for the purpose of making loans and capital asset improvements; and (2) the non-cash transfer of a $2.0 million loan portfolio from governmental activities used as collateral for the Single Family Mortgage Revenue Bond 2011 Series AlB issue.
Financial Analysis of the Authority's Funds
As noted earlier, the Authority uses fund accounting to ensure and demonstrate compliance with finance-related legal requirements.
Governmental Funds
The focus of the Authority's governmental funds is to provide information on near-term inflows, outflows, and balances of spendable resources. Such information is useful in assessing the Authority's financing requirements. In particular, unassigned fund balance may serve as a useful measure of the Authority's net resources available for spending at the end of the fiscal year.
As of the end of the fiscal year, the Authority's governmental funds reported combined ending fund balances of $265,775,370, an increase of $35,800,038 in comparison with the prior year. All of the fund balance is nonspendable, restricted, committed, or assigned to indicate that it is not available for new spending.
The General Fund is the chief operating fund of the Authority. At the end of the current fiscal year, the fund balance of the General Fund was $46,066,015, an increase of $13,192,233 in comparison with the prior year. The key factors of this increase were: (1) cash transfers from Single Family Programs and Multi-Family Programs, both proprietary funds. These cash transfers to the General Fund were $1,724,380 in administrative fees and over $11,494,000 in surplus funds resulting from the calls and payment of all outstanding Multi-Family Program bonds during fiscal year 2012; and (2) the General Fund also received a non-cash transfer of $4,445,600 from the Multi-Family Program in the form of mortgage loans receivable released from bond indenture requirements as a result of the calls and payment of the bonds originally associated with them. All of the General Fund fund balance is classified as either nonspendable, in the form of re,;eivables and other prepaid items, or committed by the Authority to support operations and program activities.
The Housing Development Fund (HDF) has a total fund balance of $193,296,646, of which $149,561,184 is designated as nonspendable. Additionally, $19,309,192 is designated as restricted, to be used for the specific purposes of HDF activities per enabling legislation and $24,426,270 is designated as committed, authorized for specific purposes but not yet disbursed at the statement date. The net increase in the fund balance during the current year in the HDF was $20,709,785. The increase is the result of grants in the amount of $19,570,000 from the State of Delaware used to generate mortgages and grants, $3,071,573 in interest income, $1,048,154 in fee revenue, and $5 in other revenue offset by administrative and grant expenditures of $507,614 and $963,624, respectively, and a cash transfer to the State Rental Assistance Program, a non-major governmental fund.
The OSHA Second Mortgage Assistance Loan Program (OSHA SMAL) has a total fund balance of $14,397,036, of which $14,051,013 is reported as nonspendable and $346,023 is reported as assigned. The net increase in the fund balance during the fiscal year was $92,251. The increase is the result of interest income received and accrued in the amount of $886,716 and other revenue of $57,190 offset by net transfers to Single Family Programs of $851,655 as a result of the Single Family Mortgage Revenue Bond 2011 Series AlB second mortgage assistance loan purchases and collateral transfers.
Proprietary Funds
The financial statements for the Authority's proprietary funds, which are all enterprise funds, provide the same type of information found in the entity-wide financial statements, but in more detail.
Restricted net assets of the Federal Programs Fund at the end of the year amounted to $77,073,704, and those of the Single Family Programs Funds amounted to $21,731,943. The total change in net assets for the Federal Programs Fund was $2,664,475, primarily due to the receipt of $3,431,526 in HOME Investment Partnership
8
Program grant funds for affordable rental housing mortgage loans and $1,132,894 in grant funds for capital asset improvements. The total change in net assets for the Single Family Program Funds was $4,177,654, primarily due to interest income on loans and investments of $40,884,336 and the non-cash transfer in of a $2,498,000 loan portfolio from governmental funds provided as collateral for the Single Family Mortgage Revenue Bond 2011 Series AlB issue offset by interest expense on bonds of $38,449,879. The total change in net assets for the MultiFamily Programs Funds was $(16,497,865), reducing the net assets to zero. All outstanding bonds were called and paid during fiscal year 2012. After all restrictive covenants of the bond resolutions and indentures were met the remaining mortgage receivables and other assets became property of the Authority.
General Fund Budget
Under Governmental Accounting Standards Board (GASB) Statement No. 34, budgetary comparison information is required to be presented for the general fund and each major special revenue fund with a legally adopted budget. The Authority is not legally required to adopt a budget for the general fund. Therefore, budget comparison information is not included in the Authority's financial statements. However, the Authority does implement an executive budget each fiscal year. The executive budget is reviewed and approved by the Director, monitored for compliance on a monthly basis, and any use of the general fund beyond the approved executive budget must be approved by the Director.
Capital Asset and Debt Administration
Capital Assets
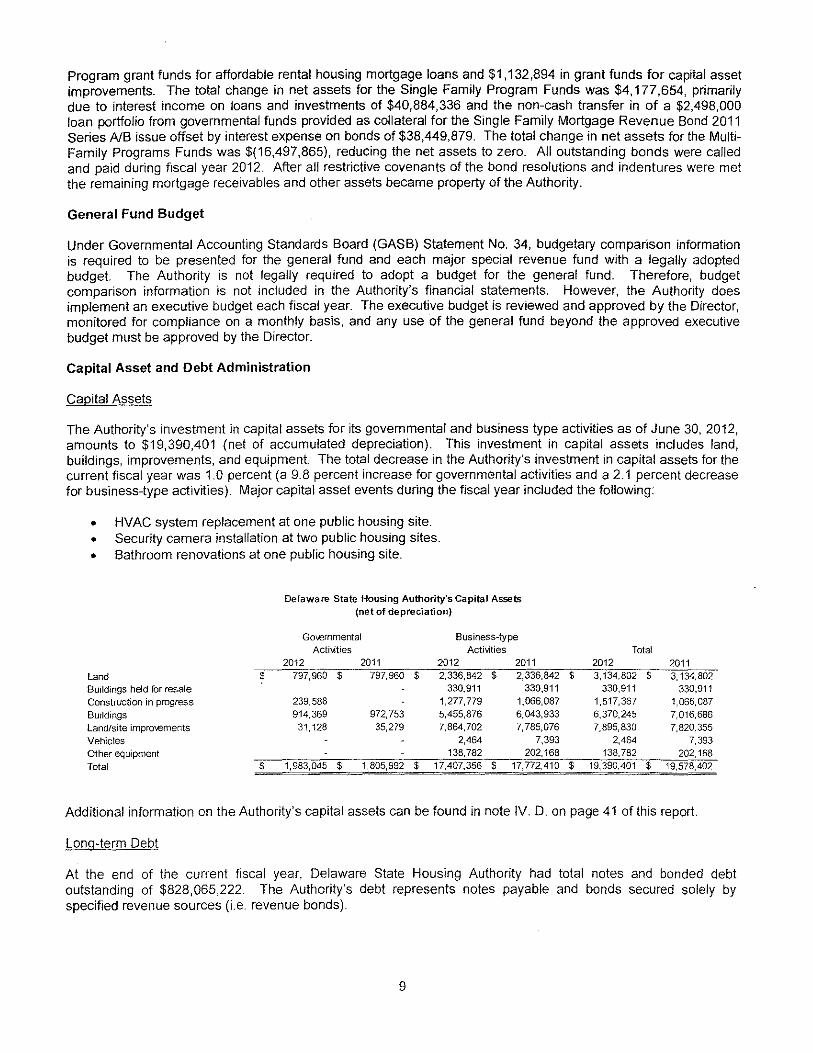
The Authority's investment in capital assets for its governmental and business type activities as of June 30, 2012, amounts to $19,390,401 (net of accumulated depreciation). This investment in capital assets includes land, buildings, improvements, and equipment. The total decrease in the Authority's investment in capital assets for the current fiscal year was 1.0 percent (a 9.8 percent increase for governmental activities and a 2.1 percent decrease for business-type activities). Major capital asset events during the fiscal year included the following:
• HVAC system replacement at one public housing site. • Security camera installation at two public housing sites. • Bathroom renovations at one public housing site.
Land $ Buildings held for resale Construction in progress Buildings Land/site improYements Vehicles Other equipment Total $
Delaware State Housing Authority's Capital Assets (net of depreciation}
Go\.€rnmenta! Business-type Acti-..1ties Acti'-lities
2012 2011 2012 2011 797,960 $ 797,960 $ 2,336,842 $ 2,336,842
330,911 330,911 239,588 1,277,779 1,066,087 914,369 972,753 5,455,876 6,043,933
31 '128 35,279 7,864,702 7,785,076
2,464 7,393 138,782 202,168
1,983,045 $ 1,805,992 $ 17,407,356 $ 17,772.410
Total 2012 2011
$ 3,134,802 $ 3,134,802 330,911 330,911
1,517,367 1,066,087 6,370,245 7,016,686 7,895,830 7,820,355
2,464 7,393 138,782 202,168
$ 19,390,401 $ 19,578,402
Additional information on the Authority's capital assets can be found in note IV. D. on page 41 of this report.
Long-term Debt
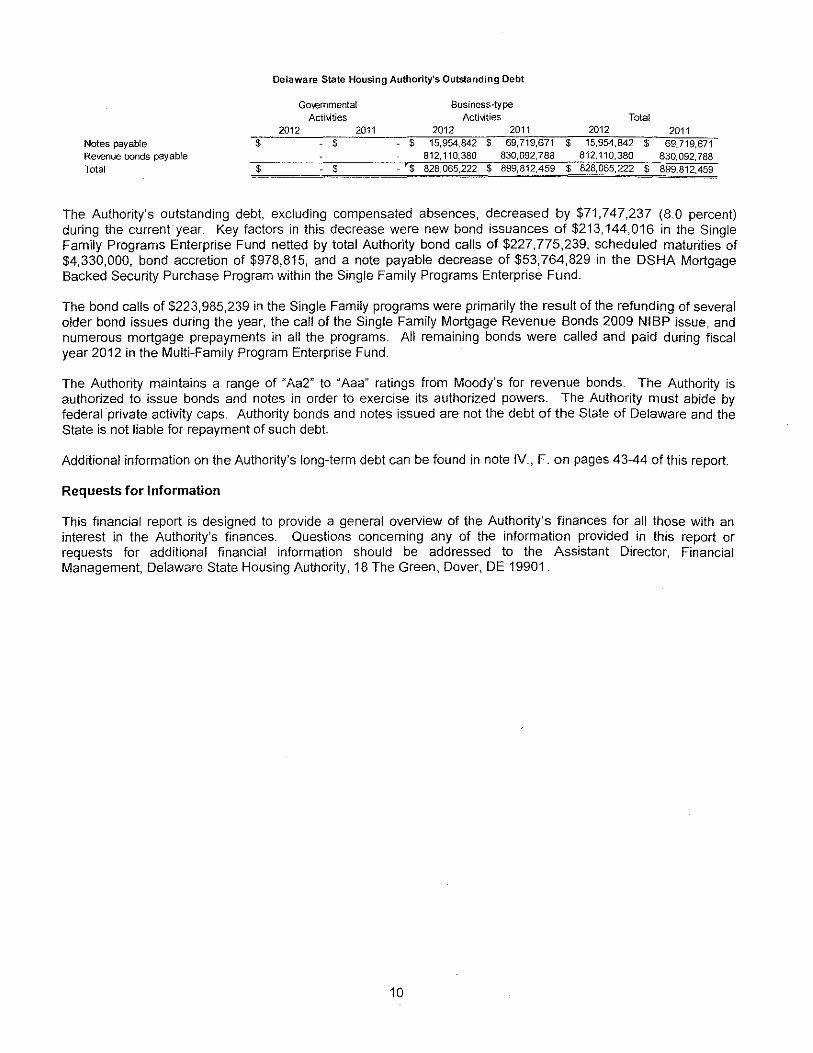
At the end of the current fiscal year, Delaware State Housing Authority had total notes and bonded debt outstanding of $828,065,222. The Authority's debt represents notes payable and bonds secured solely by specified revenue sources (i.e. revenue bonds).
9
Notes payable Revenue bonds payable Total
$
$
Delaware State Housing Authority's Outstanding Debt
Govemmentat Business~type
Acti-..ities Acti-.1ties 2012 2011 2012 2011
$ $ 15,954,842 $ 69,719,671 812,110,380 830,092,788
$ $ 828,065,222 $ 899,812,459
Total 2012 2011
$ 15,954,842 $ 69,719,671 812,110,380 830,092,788
$ 828,065,222 $ 899,812.459
The Authority's outstanding debt, excluding compensated absences, decreased by $71,747,237 (8.0 percent) during the currentyear. Key factors in this decrease were new bond issuances of $213,144,016 in the Single Family Programs Enterprise Fund netted by total Authority bond calls of $227,775,239, scheduled maturities of $4,330,000, bond accretion of $978,815, and a note payable decrease of $53,764,829 in the OSHA Mortgage Backed Security Purchase Program within the Single Family Programs Enterprise Fund.
The bond calls of $223,985,239 in the Single Family programs were primarily the result of the refunding of several older bond issues during the year, the call of the Single Family Mortgage Revenue Bonds 2009 NIBP issue, and numerous mortgage prepayments in all the programs. All remaining bonds were called and paid during fiscal year 2012 in the Multi-Family Program Enterprise Fund.
The Authority maintains a range of "Aa2" to "Aaa" ratings from Moody's for revenue bonds. The Authority is authorized to issue bonds and notes in order to exercise its authorized powers. The Authority must abide by federal private activity caps. Authority bonds and notes issued are not the debt of the State of Delaware and the State is not liable for repayment of such debt.
Additional information on the Authority's long-term debt can be found in note IV., F. on pages 43-44 of this report.
Requests for Information
This financial report is designed to provide a general overview of the Authority's finances for all those with an interest in the Authority's finances. Questions concerning any of the information provided in this report or requests for additional financial information should be addressed to the Assistant Director, Financial Management, Delaware State Housing Authority, 18 The Green, Dover, DE 19901.
10
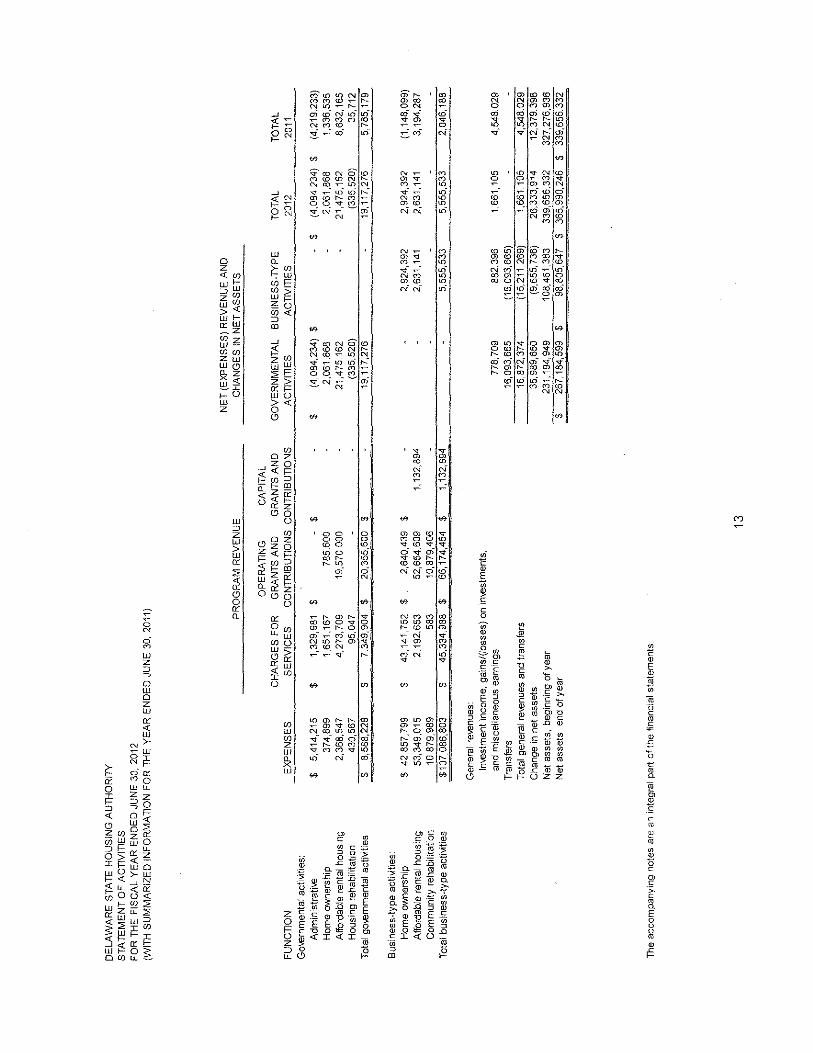
DELAWARE STATE HOUSING AUTHORfTY
STATEMENT OF NET ASSETS
JUNE 30, 2012 (WITH SUMMARIZED INFORMATION AS OF JUNE 30, 2011)
ASSETS Current assets:
Cash and cash equivalents
lmestments Mortgages receivable Accrued interest & other receivables
Grants receivable-US Dept of HUD
lntem:3J balances Other post employment benefits (OPEB) asset
Prepaid expenses Deferred bond issuance costs
Total current assets Non-current assets:
Cash, restricted for payment of escrows
lmestments Mortgages recei\rable, net Accrued interest & other receivables, net
Deferred bond issuance costs
Capital assets: Capital assets not being depreciated Capital assets net of accumulated depreciation
Total non-current assets
TOTAL ASSETS
LIABILITIES AND NET ASSETS
UABIUllES Current liabilities:
Accounts payable and other current liabilities
Due to St of Delaware-pension costs Accrued arbitrage rebate payable
Compensated absences payable
Accrued interest payable
Nonrefundable deferred commitment fees
Notes payable Re\€nue bonds payable
Total current liabilities
Non-current liabilities: Accrued arbitrage rebate payable
Compensated absences payable
Escrow deposits Nonrefundable deferred commitment fees
Re~.enue bonds payable
Total non-current liabilities
TOTAL LIABILITIES
NET ASSETS
Invested in capital assets Restficted by federal and state regulations
Restricted by bond co\€nants
Restricted for Authority Loan Program
Unrestricted, for Authority's purposes
TOTAL NET ASSETS TOTAL LIABILITIES AND NET ASSETS
GOVERNMENTAL
ACTIVITIES
$ 13,910,930 51,060,934
751,707 31,082,191
3,381,602
2,264 85,113
100,274,741
49,180,470
144,054,018
1,037,548
945,497
195,217,533
$ 295,492,274
$ 312,821
5,137
12,710
330,668
563,370
27,413,637
27,977,007
28,307,675
1,983,045
219,709,355
6,345,377
39,146,822
267,184,599
$ 295,492,274
The accompanying notes are an integral part of the financial statements
11
BUSINESS TYPE TOTAL TOTAL ACTIVITIES 2012 2011
$ 2,454,607 $ 16,365,537 $ 5,445,694 44,299,025 95,359,959 206,571,363 11,868,357 12,620,064 14,412,902 8,123,512 39,205,703 35,864,418
284,316 284,316 515,405 (3, 381 '602)
2,264 2,554 3,576,324 3,661,437 3,433,846
527,794 527,794 534,583 67,752,333 168,027,074 266,780,765
933,042 933,042
5,773,836 54,954,306 81,558,761 824,785,257 968,839,275 891,285,160
8,643,880 8,643,880 7,588,971 7,670,052 7,670,052 7,976,076
3,945,532 4,983,080 4,531,800 13,461,824 14,407,321 15,046,602
865,213,423 1,060,430,956 1,007,987,370
$ 932,965,756 $ 1,228,458,030 $ 1,274,768,135
$ 920,577 $ 1,233,398 $ 1,397,297
1,648 6,785 7,229
149,151 9,624 22,334 29,993 4,057 4,057 239,876
56,764 15,954,842 15,954,842 69,719,671 18,644,193 18,644,193 117,449,336 35,534,941 35,865,609 189,049,317
159,735
374,157 937,527 946,978
4,784,824 32,198.461 31,749,098 563,223
793,466,187 793,466, 1_87 712,643,452 798,625,168 826,602,175 746,062,486 834,160, 109 862,467,784 935,111,803
17,407,356 19,390,401 19,578,402 59,666,348 279,375,703 253,738,369 21,731,943 21,731,943 34,052,154
6,345,377 2,924,872
39,146,822 29,362,535
98,805,647 365,990,246 339,656,332
$ 932,965,756 $ 1,228,458,030 $ 1,274,768,135
THIS PAGE INTENTIONALLY LEFT BLANK
12
DE
LA
WA
RE
ST
AT
E H
OU
SIN
G A
UT
HO
RI"
TY
S
TA
TE
ME
NT
OF
AC
TIV
ITIE
S
FO
R T
HE
FIS
CA
L Y
EA
R E
ND
ED
JU
NE
30,
20
12
(WIT
H S
UM
MA
RIZ
ED
IN
FO
RM
AT
ION
FO
R T
HE
YE
AR
EN
DE
D J
UN
E 3
0, 2
01
1)
PR
OG
RA
M R
EV
EN
UE
OP
ER
AT
ING
C
AP
ITA
L
CH
AR
GE
S F
OR
G
RA
NT
S A
ND
G
RA
NT
S A
ND
FU
NC
TIO
N
EX
PE
NS
ES
S
ER
VIC
ES
C
ON
TR
IBU
TIO
NS
C
ON
TR
IBU
TIO
NS
Gov
ernm
enta
l acf
1\iit
ies:
A
dm
inis
tra
ti\€
$
5,4
14
,21
5
$ 1,
329,
981
$ $
Ho
me
ow
ne
rsh
ip
37
4,8
99
1,
651,
167
78
5,6
00
Affo
rdab
le r
enta
l ho
usin
g 2
,36
8,5
47
4
,27
3.7
09
1
9,5
70
,00
0
Ho
usi
ng
reh
abili
tatio
n 4
30
,56
7
95
,04
7
Tot
al g
o>
ern
me
nta
l a
ctiv
itie
s $
8,5
88
,22
8
$ 7,
349,
904
$ 2
0,3
55
,60
0
$
Bu
sin
ess
-typ
e a
ctiv
ities
H
ome
owne
rshi
p $
42
,85
7,7
99
$
43
,14
1,7
52
$
2,6
40
,43
9
$ A
fford
able
ren
tal
hous
ing
53
,34
9,0
15
2
,19
2,6
53
5
2,6
54
,60
9
1,1
32
,89
4
Co
mm
un
ity
reh
ab
ilita
tio
n
10
,87
9,9
89
58
3 1
0,8
79
,40
6
Tot
al b
usin
ess-
type
act
iviti
es
~86,803
$ 4
5,3
34
,98
8
$ 6
6,1
74
,45
4
$ 1
,13
2,8
94
Ge
ne
ral
reve
nues
: In
vest
men
t inc
ome,
gal
ns/(
loss
es)
on 'l
n\.-e
stm
ents
, an
d m
isce
llane
ous
earn
ings
Tr
ansf
ers
Tota
l ge
nera
l re
~Jen
ues
and
trans
fers
C
hang
e in
net
ass
ets
N
et a
sse
ts,
begi
nnin
g o
f ye
ar
Ne
t a
sse
ts,
en
d o
f ye
ar
The
acc
om
pa
nyi
ng
not
es a
re a
n in
tegr
al p
art
of t
he
fin
anci
al s
tate
me
nts
.
i3
NE
T (
EX
PE
NS
ES
) R
EV
EN
UE
AN
D
CH
AN
GE
S I
N N
ET
AS
SE
TS
GO
VE
RN
ME
NT
AL
B
US
INE
SS
-"TY
PE
T
OT
AL
T
OT
AL
AC
TIV
ITIE
S
AC
TIV
ITIE
S
20
12
20
11
$ (4
,08
4,2
34
) $
$ (4
,08
4,2
34
) $
(4,2
19
,23
3)
2,0
61
,86
8
2,0
61
,86
8
1,3
36
,53
5
21
,47
5,1
62
2
1,4
75
,16
2
8,6
32
,16
5
(33
5,5
20
) (3
35
,52
0)
35
,71
2
19
,11
7,2
76
1
9,1
17
,27
6
5,7
85
,17
9
2,9
24
,39
2
2,9
24
,39
2
(1' 1
48
,09
9)
2,6
31
,14
1
2,63
1,14
1 3
,19
4,2
87
5,5
55
,53
3
5,5
55
,53
3
2,0
46
,18
8
77
8,7
09
8
82
,39
6
1,6
61
,10
5
4,5
48
,02
9
23
1,1
94
,94
9
10
8,4
61
,38
3
33
9,6
56
,33
2
32
7,2
76
,93
6
$ 2
67
,18
4,5
99
$
98
,80
5,6
47
$
36
5,9
90
,24
6
$ 3
39
,65
6,3
32
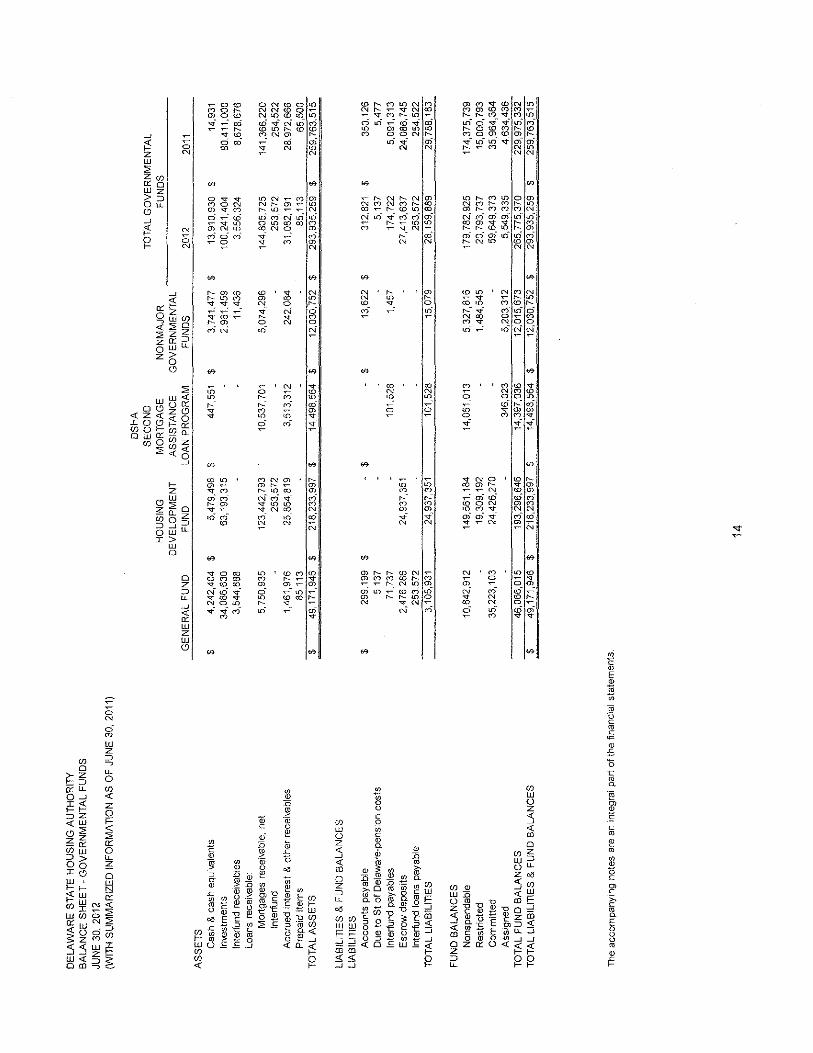
DE
LA
WA
RE
ST
AT
E H
OU
SIN
G A
UT
HO
RIT
Y
BA
LA
NC
E S
HE
ET
-G
OV
ER
NM
EN
TA
L F
UN
DS
JUN
E 3
0, 2
01
2
(WIT
H S
UM
MA
RIZ
ED
IN
FO
RM
AT
ION
AS
OF
JU
NE
30,
20
11
)
OS
HA
SE
CO
ND
T
OT
AL
GO
VE
RN
ME
NT
AL
H
OU
SIN
G
MO
RT
GA
GE
N
ON
MA
JOR
F
UN
DS
D
EV
EL
OP
ME
NT
A
SS
IST
AN
CE
G
OV
ER
NM
EN
TA
L
GE
NE
RA
L F
UN
D
FU
ND
L
OA
N P
RO
GR
AM
F
UN
DS
2
01
2
2011
A
SS
ET
S
Ca
sh &
ca
sh e
qu
iva
len
ts
$ 4
,24
2,4
04
$
5,4
79
,49
8
$ 44
7,55
1 $
3,7
41
,47
7
$ 1
3,9
10
,93
0
$ 14
,931
ln~,estments
34
,08
6,6
30
6
3,1
93
,31
5
2,9
61
,45
9
10
0,2
41
,40
4
80
,41
1,0
00
!n
terf
un
d r
ece
iva
ble
s 3
,54
4,8
88
1
1,4
36
3
,55
6,3
24
8
,67
8,6
76
L
oa
ns
rece
ivab
le·
Mo
rtg
ag
es
rece
ivab
le,
ne
t 5
,75
0,9
35
1
23
,44
2,7
93
10
,537
,701
5
,07
4,2
96
1
44
,80
5,7
25
1
41
,36
6,2
20
ln
terf
und
25
3,5
72
2
53
,57
2
25
4,5
22
A
ccru
ed
in
tere
st &
oth
er
rece
iva
ble
s 1
,46
1,9
76
2
5,8
64
,81
9
3,5
13
,31
2
24
2,0
84
3
1,0
82
,19
1
28
,97
2,6
66
P
rep
aid
ite
ms
85,1
13
85
,11
3
65
,50
0
TO
TA
L A
SS
ET
S
$ 4
9,1
71
,94
6
$ 2
18
,23
3,9
97
$
14
,49
8,5
64
$
12,0
30,7
52
$ 2
93
,93
5,2
59
$
25
9,7
63
,51
5
LIA
BIL
ITIE
S &
FU
ND
BA
LA
NC
ES
LIA
BIL
ITIE
S
Acc
ou
nts
pa
yab
le
$ 2
99
,19
9
$ $
$ 1
3,6
22
$
312,
821
$ 3
50
,12
6
Du
e t
o S
t o
f D
ela
wa
re-p
en
sio
n c
ost
s 5,
137
5,13
7 5,
477
lnte
rfu
nd
pa
yab
les
71,7
37
10
1,5
28
1
,45
7
17
4,7
22
5
,09
1,3
13
Esc
row
dep
osits
2
,47
6,2
86
2
4,9
37
,35
1
27
,41
3,6
37
2
4,0
86
,74
5
lnte
rfun
d lo
an
s p
aya
ble
25
3,57
2 2
53
,57
2
254,
522
TO
TA
L L
IAB
ILIT
IES
3,
105,
931
24
,93
7,3
51
1
01
,52
8
15,0
79
28
,15
9,8
89
2
9,7
88
,18
3
FU
ND
BA
LA
NC
ES
Non
spen
dabl
e 1
0,8
42
,91
2
14
9,5
61
,18
4
14
,05
1,0
13
5
,32
7,8
16
1
79
,78
2,9
25
1
74
,37
5,7
39
Res
tric
ted
19
,30
9,1
92
1
,48
4,5
45
2
0,7
93
,73
7
15
,00
0,7
93
C
om
mit
ted
3
5,2
23
,10
3
24
,42
6,2
70
5
9,6
49
,37
3
35
,96
4,3
64
A
ssig
ned
34
6,0
23
5
,20
3,3
12
5
,54
9,3
35
4
,63
4,4
36
T
OT
AL
FU
ND
BA
LA
NC
ES
4
6,0
66
,01
5
19
3,2
96
,64
6
14
,39
7,0
36
1
2,0
15
,67
3
26
5,7
75
,37
0
22
9,9
75
,33
2
TO
TA
L L
IAB
ILIT
IES
& F
UN
D B
AL
AN
CE
S
$ 4
9,1
71
,94
6
$ 2
18
,23
3,9
97
$
14,4
98,5
64
$ 1
2,0
30
,75
2
$ 2
93
,93
5,2
59
$
25
9,7
63
,51
5
The
acc
om
pa
ny'
tng
not
es a
re a
n in
teg
ral
pa
rt o
f th
e f
lna
nci
al
sta
tem
en
ts.
14
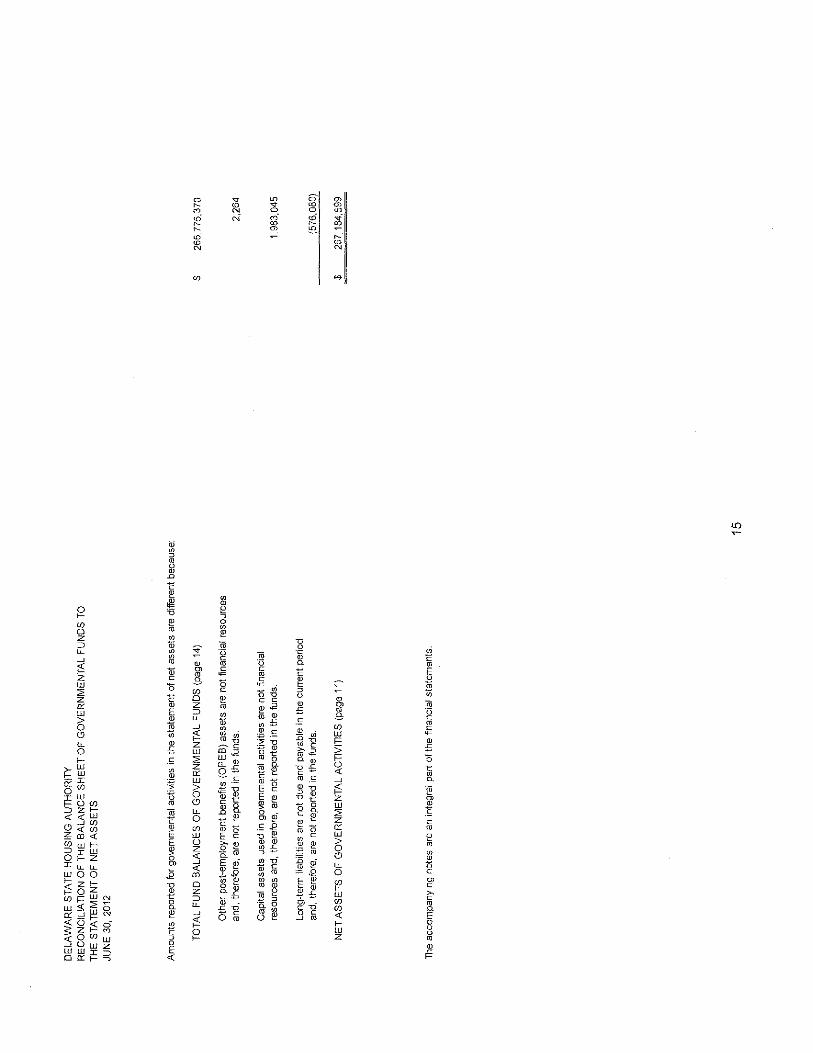
DE
LAW
AR
E S
TATE
HO
US
ING
AU
THO
RIT
Y
RE
CO
NC
ILIA
TIO
N O
F TH
E B
ALA
NC
E S
HE
ET
OF
GO
VE
RN
ME
NT
AL
FUN
DS
TO
TH
E S
TA
TE
ME
NT
OF
NE
T A
SS
ET
S
JUN
E 3
0, 2
012
Am
ount
s re
porte
d fo
r go
-.ern
men
tal
actii
Atie
s in
the
sta
tem
ent
of n
et a
sset
s ar
e di
ffere
nt b
ecau
se:
TOTA
L FU
ND
BA
LAN
CE
S O
F G
OV
ER
NM
EN
TA
L FU
ND
S (
page
14)
Oth
er p
ost-
empl
oym
ent
bene
fits
{OP
EB
) as
sets
are
not
fin
anci
al r
esou
rces
an
d, t
here
fore
, ar
e no
t re
porte
d in
the
fun
ds.
Cap
ital
asse
ts u
sed
in g
over
nmen
tal
activ
ities
are
not
fin
anci
al
reso
urce
s an
d, t
here
fore
, ar
e no
t re
porte
d in
the
fun
ds.
Long
-ter
m l
iabi
litie
s ar
e no
t du
e an
d pa
yabl
e in
the
cur
rent
per
iod
and,
the
refo
re,
are
not
repo
rted
in t
he f
unds
.
NE
T A
SS
ET
S O
F G
OV
ER
NM
EN
TA
L A
CTI
VIT
IES
(pa
ge 1
1)
The
acc
om
pa
nyi
ng
no
tes
are
an
inte
gral
par
t o
f th
e fi
nanc
ial
sta
tem
en
ts.
$ 26
5.77
5,37
0
2,26
4
1,98
3,04
5
(576
,080
)
$ 26
7,18
4,59
9
15
DE
LA
WA
RE
ST
AT
E H
OU
SIN
G A
UT
I-IO
RilY
S
TA
TE
ME
NT
OF
RE
VE
NU
ES
, E
XP
EN
DIT
UR
ES
, A
ND
CH
AN
GE
S I
N F
UN
D B
AL
AN
CE
S •
GO
VE
RN
ME
NT
AL
FU
ND
S
FO
R T
I-lE
YE
AR
EN
DE
D J
UN
E 3
0, 2
01
2
(WIT
H S
UM
MA
RIZ
ED
IN
FO
RM
AT
ION
FO
R T
HE
YE
AR
EN
DE
D J
UN
E 3
0,
2011
)
OS
HA
S
EC
ON
D
TO
TA
L G
OV
ER
NM
EN
TA
L
HO
US
ING
M
OR
TG
AG
E
NO
NM
AJO
R
FU
ND
S
DE
VE
LO
PM
EN
T
AS
SIS
TA
NC
E
GO
VE
RN
ME
NT
AL
G
EN
ER
AL
FU
ND
F
UN
D
LO
AN
PR
OG
RA
M
FU
ND
S
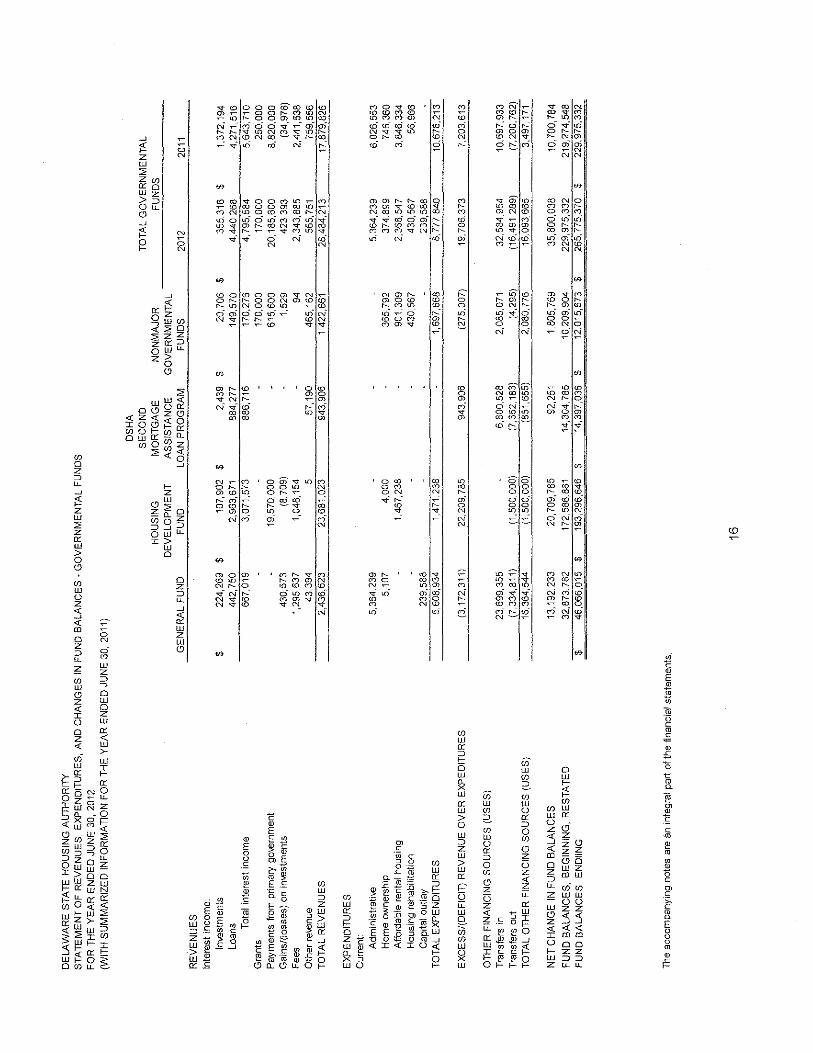
2012
20
11
RE
VE
NU
ES
Inte
rest
inco
me:
ln
-.est
men
ts
$ 2
24
,26
9
$ 1
07
,90
2
$ 2
,43
9
$ 2
0,7
06
$
35
5,3
16
$
1,3
72
,19
4
Loan
s 4
42
,75
0
2,9
63
,67
1
88
4,2
77
14
9,57
0 4
,44
0,2
68
4
,27
1,5
16
T
otal
int
eres
t in
com
e 6
67
,01
9
3,0
71
,57
3
88
6,7
16
1
70
,27
6
4,7
95
,58
4
5,6
43
,71
0
Gra
nts
1
70
,00
0
17
0,0
00
2
50
,00
0
Pa
yme
nts
fro
m p
rim
ary
go
vern
me
nt
19
,57
0,0
00
6
15
,60
0
20
,18
5,6
00
8
,82
0,0
00
G
ain
s/(l
oss
es)
on
in~.
estm
ents
4
30
,57
3
(8,7
09
) 1
,52
9
42
3,3
93
(3
4,9
78
) F
ee
s 1
,29
5,6
37
1
,04
8,1
54
94
2
,34
3,8
85
2
,44
1,5
38
O
the
r re
~.en
ue
43
,39
4
5 5
7,1
90
4
65
,16
2
565,
751
75
9,5
56
T
OT
AL
RE
VE
NU
ES
2
,43
6,6
23
2
3,6
81
,02
3
94
3,9
06
1
,42
2,6
61
2
8,4
84
,21
3
17
,87
9,8
26
EX
PE
ND
ITU
RE
S
Cu
rre
nt·
Ad
min
istr
ati
ve
5,3
64
,23
9
5,3
64
,23
9
6,0
26
,55
3
Ho
me
ON
ners
hip
5,1
07
4
,00
0
36
5,7
92
3
74
,89
9
74
6,3
60
A
ffo
rda
ble
ren
tal
ho
usi
ng
1
.46
7,2
38
9
01
,30
9
2,3
68
,54
7
3,8
46
,33
4
Ho
usi
ng
re
ha
bili
tatio
n
43
0,5
67
43
0,56
7 5
6,9
66
C
ap
ital
ou
tla
y 2
39
,58
8
23
9,5
88
T
OT
AL
EX
PE
ND
ITU
RE
S
5,6
08
,93
4
1,4
71
,23
8
1,6
97
,66
8
8, 7
77
,84
0
lil,6
76
,21
3
EX
CE
SS
/(D
EF
ICIT
1 R
EV
EN
UE
OV
ER
EX
PE
DIT
UR
ES
(3
,17
2,3
11
) 22
,209
,785
9
43
,90
6
(27
5,0
07
) 1
9,7
06
,37
3
7,2
03
,61
3
OT
I-IE
R F
INA
NC
ING
SO
UR
CE
S (
US
ES
)
Tra
nsf
ers
in
23
,69
9,3
55
6
,80
0,5
28
2
,08
5,0
71
32
58
4,9
54
1
0,6
97
,93
3
Tra
nsf
ers
ou
t (7
,33
4,8
11
) (1
,50
0,0
00
) (7
,652
, 183
) (4
,29
5)
(16
,49
1,2
89
) (7
,20
0,7
62
)
TO
TA
L O
TI-
IER
FIN
AN
CIN
G S
OU
RC
ES
(U
SE
S)
16
,36
4,5
44
(1
,50
0,0
00
) (8
51,6
55)
2,0
80
,77
6
16
,09
3,6
65
3.
497,
171
NE
T C
HA
NG
E I
N F
UN
D B
AL
AN
CE
S
13
,19
2,2
33
2
0,7
09
,78
5
92,2
51
1,8
05
,76
9
35
,80
0,0
38
1
0,7
00
,78
4
FU
ND
BA
LA
NC
ES
, B
EG
INN
ING
, R
ES
TA
TE
D
32
,87
3,7
82
1
72
,58
6,8
61
1
4,3
04
,78
5
10
,20
9,9
04
2
29
,97
5,3
32
21
9,27
4,54
8 F
UN
D B
AL
AN
CE
S,
EN
DII
NG
$
46
,06
6,0
15
$
19
3,2
96
,64
6
$ 1
4,3
97
,03
6
$ 1
2,0
15
,67
3
$ 2
65
,77
5,3
70
$
22
9,9
75
,33
2
The
acc
om
pa
nyi
ng
no
tes
are
an in
teg
ral
pa
rt o
f th
e f
ina
nci
al
sta
tem
en
ts,
16
DE
LA
WA
RE
ST
AT
E H
OU
SIN
G A
UT
HO
RIT
Y
RE
CO
NC
ILIA
TIO
N O
F T
HE
ST
AT
EM
EN
T O
F R
EV
EN
UE
S,
EX
PE
ND
ITU
RE
S,
AN
D C
HA
NG
ES
IN
FU
ND
BA
LA
NC
ES
OF
GO
VE
RN
ME
NT
AL
FU
ND
S T
O
TH
E S
TA
TE
ME
NT
OF
AC
TIV
ITlE
S
FO
R T
HE
YE
AR
EN
DE
D J
UN
E 3
0, 2
01
2
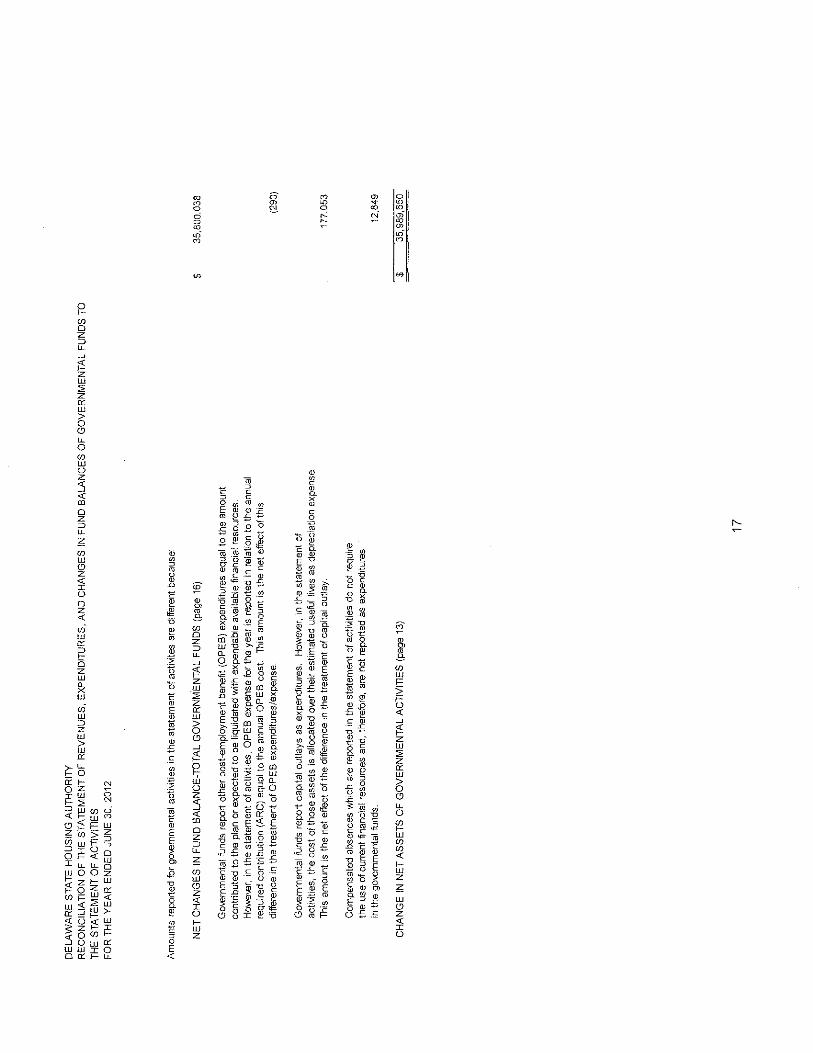
Am
ou
nts
re
po
rte
d f
or g
o-.e
rnm
enta
l ac
ti'vi
ties
in t
he
sta
tem
en
t o
f act
i1A
tes
are
diffe
rent
bec
ause
:
NE
T C
HA
NG
ES
IN
FU
ND
BA
LA
NC
E-T
OT
AL
GO
VE
RN
ME
NT
AL
FU
ND
S (
page
16)
Go
\ern
me
nta
l fu
nds
repo
rt o
the
r post~employment b
enef
it (O
PE
S)
expe
nditu
res
equa
l to
the
am
ount
co
ntr
ibu
ted
to
th
e p
lan
or
exp
ect
ed
to
be
liqu
ida
ted
with
exp
en
da
ble
ava
ilabl
e fin
anci
al r
eso
urc
es.
H
owel
.€r,
in
the
sta
tem
en
t o
f act
iviti
es,
OP
ES
exp
en
se f
or t
he y
ea
r is
rep
orte
d in
rel
atio
n to
the
ann
ual
requ
ired
con
trib
utio
n (
AR
C)
equa
l to
the
ann
ual
OP
ES
co
st.
Thi
s am
ount
is
the
ne
t ef
fect
of t
his
di
ffer
ence
in t
he
tre
atm
en
t o
f OP
ES
exp
en
ditu
res/
exp
en
se.
Gov
ernm
enta
l fu
nds
repo
rt c
ap
ital
ou
tla
ys a
s e
xpe
nd
iture
s.
How
ever
, ·In
th
e s
tate
me
nt
of
actii
Atie
s, t
he
co
st o
f th
ose
ass
ets
is
allo
cate
d O
\oer
th
eir
est
ima
ted
use
ful
li\.e
s as
de
pre
cia
tion
exp
en
se
Thi
s a
mo
un
t is
th
e n
et e
ffec
t o
f th
e d
iffer
ence
in t
he
tre
atm
en
t o
f ca
pita
l ou
tlay.
Co
mp
en
sate
d a
bse
nce
s w
hic
h a
re r
epor
ted
in t
he
sta
tem
en
t o
f act
i\1tie
s d
o n
ot r
equi
re
the
use
of c
urr
en
t fi
na
nd
al
reso
urc
es
and,
the
refo
re,
are
not
repo
rted
as
exp
en
ditu
res
in t
he
gm
em
me
nta
l fu
nds.
CH
AN
GE
IN
NE
T A
SS
ET
S O
F G
OV
ER
NM
EN
TA
L A
CllV
ITlE
S (
page
13)
17
$ 3
5,8
00
,03
8
(290
)
17
7,0
53
12,8
49
$ 3
5,9
89
,65
0
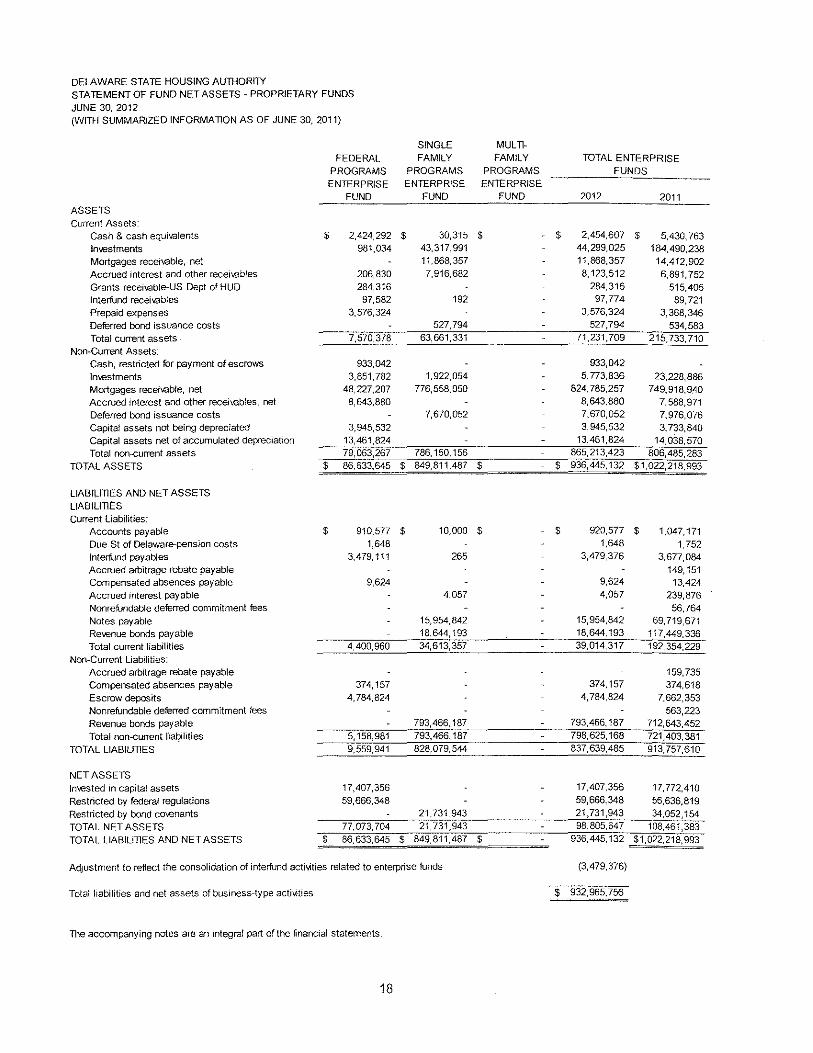
DELAWARE STATE HOUSING AUTHORI1Y
STATEMENT OF FUND NET ASSETS- PROPRIETARY FUNDS
JUNE 30, 2012 (WITH SUMMARIZED INFORMATION AS OF JUNE 30, 2011)
SINGLE MULTI-
FEDERAL FAMILY FAMILY TOTAL ENTERPRISE
PROGRAMS PROGRAMS PROGRAMS FUNDS
ENTERPRISE ENTERPRISE ENTERPRISE
FUND FUND FUND 2012 2011 ASSETS Current Assets:
Cash & cash equivalents $ 2,424,292 $ 30,315 $ $ 2,454,607 $ 5,430, 763 ln\.€stments 981,034 43,317,991 44,299,025 184,490,238
Mortgages receivable, net 11,868,357 11,868,357 14,412,902
Accrued interest and other receivables 206,830 7,916,682 8,123,512 6,891,752 Grants receivable-US Dept of HUD 284,316 284,316 515,405 lnterfund recei\t8bles 97,582 192 97,774 89,721 Prepaid expenses 3,576,324 3,576,324 3,368,346 Deferred bond issuance costs 527,794 527,794 534,583 Total current assets. 7,570,378 63,661,331 71,231,709 215,733,710
Non-Current Assets: Cash, restricted for payment of escrows 933,042 933,042
Investments 3,851,782 1,922,054 5,773,836 23,228,886
Mortgages receivable, net 48,227,207 776,558,050 824,785,257 749,918,9.40
Accrued interest and other recel~.ebles, net 8,643,880 8,643,880 7,588,971 Deferred bond issuance costs 7,670,052 7,670,052 7,976,076
Capital assets not being depreciated 3,945,532 3,945,532 3,733,840
Capital assets net of accumulated depreciation 13,461,824 13,461,824 14,038,570 Total non-current assets 79,063,267 786,150,156 865,213,423 806,485,283
TOTAL ASSETS $ 86,633,645 $ 849,811,487 $ $ 936,445,132 $1,022,218,993
LIABILITIES AND NET ASSETS
LIABILITI~S Current Liabilities:
Accounts payable $ 910,577 $ 10,000 $ $ 920,577 $ 1,047,171
Due St of Delaware-pension costs 1,648 1,648 1,752
lnterfund payables 3,479,111 265 3,479,376 3,677,084
Accrued arbitrage rebate payable 149,151 Compensated absences payable 9,624 9,624 13,424
Accrued interest payable 4,057 4,057 239,876
Nonrefundable deferred commitment fees 56,764
Notes payable 15,954,842 15,954,842 69,719,671
Revenue bonds payable 18,644,193 18,644,193 117,449,336
Total current liabilities 4,400,960 34,613,357 39,014,317 192,354,229
Non-Current Liabilities: Accrued arbitrage rebate payable 159,735
Compensated absences payable 374,157 374,157 374,618
Escrow deposits 4,784,824 4,784,824 7,662,353
Nonrefundable deferred commitment fees 563,223
Revenue bonds payable 793,466,187 793,466,187 712,643,452
Total non-current nat?ilities 5,158,981 793,466,187 798,625,168 721,403,381
TOTAL LIABILITIES 9,559,941 828,079,544 837,639,485 913,757,610
NET ASSETS
Invested in capital assets 17,407,356 17,407,356 17,772,410
Restricted by federal regulations 59,666,348 59,666,348 56,636,819
Restricted by bond cmenants 21,731,943 21,731,943 34,052,154
TOTAL NET ASSETS 77,073,704 21,731,943 98,805,647 108,461,383
TOTAL LIABILITIES AND NET ASSETS $ 86,633,645 $ 849,811,487 $ 936,445,132 $1,022,218,993
Adjustment to reflect the consolidation of interfund act!~,ities related to enterprise funds (3,479,376)
Total liabilities and net assets of business-type activities $ 932,965,756
The accompanying notes are an integral part of the financial statements.
18
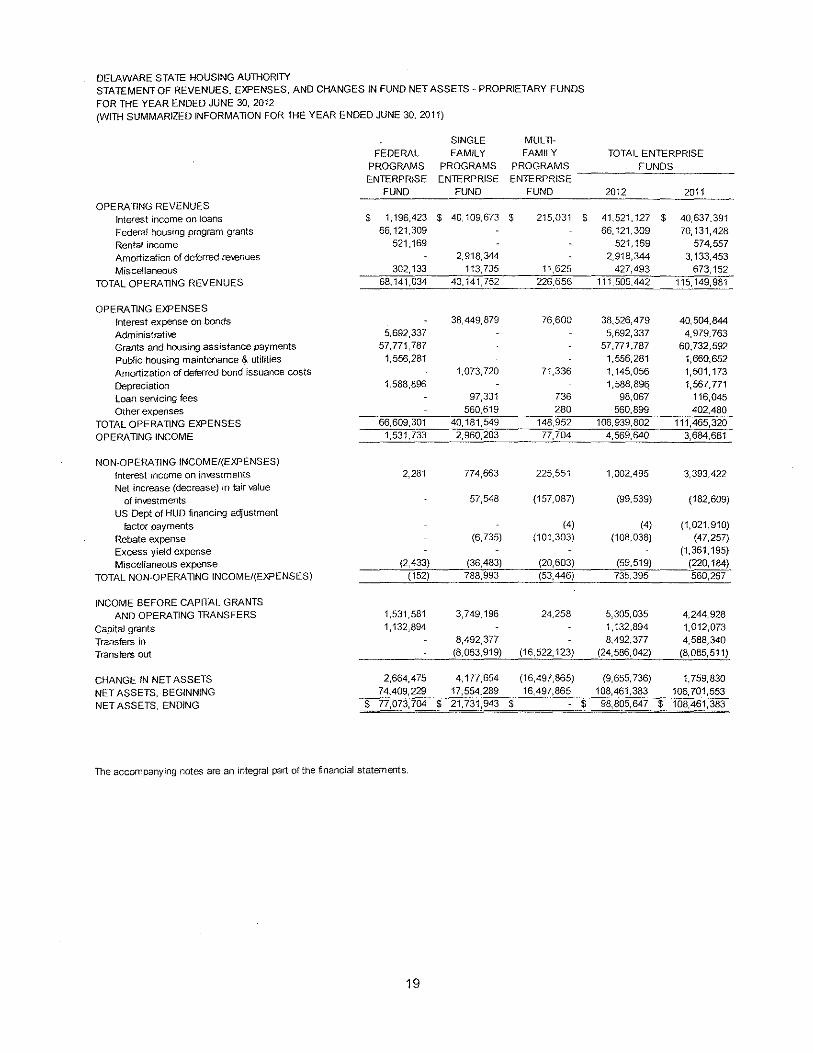
DELAWARE STATE HOUSING AUTHORITY STATEMENT OF REVENUES, EXPENSES. AND CHANGES IN FUND NET ASSETS - PROPRIETARY FUNDS
FOR THE YEAR ENDED JUNE 30, 2012 (WITH SUMMARIZED INFORMATION FOR THE YEAR ENDED JUNE 30, 2011)
SINGLE MULTI-
FEDERAL FAMILY FAMILY TOTAL ENTERPRISE PROGRAMS PROGRAMS PROGRAMS FUNDS ENTERPRISE ENTERPRISE ENTERPRISE
FUND FUND FUND 2012 2011 OPERATING REVENUES
Interest income on loans $ 1,196,423 $ 40,109,673 $ 215,031 $ 41,521.127 $ 40,637,391
Federal housing program grants 66,121,309 66,121,309 70,131,428
Rental income 521,169 521,169 574,557 Amortization of deferred re-.enues 2,918,344 2,918,344 3,133,453
Miscellaneous 302,133 113,735 11,625 427,493 673,152
TOTAL OPERATING REVENUES 68,141,034 43,141,752 226,656 111,509.442 115,149,981
OPERATING EXPENSES Interest expense on bonds 38,449,879 76,600 38,526,479 40,504,844
Administrati\e 5,692,337 5,692,337 4,979,763
Grants and housing assistance payments 57,771,787 57,771,787 60,732,592
Public housing maintenance & utilities 1,556,281 1,556,281 1,660,652 Amortization of deferred bond issuance costs 1.073,720 71,336 1,145,056 1,501,173
Depreciation 1,588,896 1,588,89q 1,567,771
Loan ser.icing fees 97,331 736 98,067 116,045
Other expenses 560,619 280 560,899 402,480
TOTAL OPERATING EXPENSES 66,609,301 40,181,549 148,952 106,939,802 111,465,320
OPERATING INCOME 1,531,733 2,960,203 77,704 4,569,640 3,684,661
NON-OPERATING INCOME/(EXPENSES) Interest income on in\restments 2,281 774,663 225,551 1,002,495 3,393,422
Net increase (decrease) in fair value of in\restments 57,548 (157,087) (99,539) (182,609)
US Dept of HUD financing adjustment factor payments (4) (4) (1,021,910)
Rebate expense (6,735) (101,303) (108,038) (47,257)
Excess yield expense (1,361,195)
Miscellaneous expense (2,433) (36,483) (20,603) (59,519) (220,184)
TOTAL NON-OPERATING INCOME/(EXPENSES) (152) 788,993 (53,446) 735,395 560,267
INCOME BEFORE CAPITAL GRANTS AND OPERATING TRANSFERS 1,531,581 3,749,196 24,258 5,305,035 4,244,928
Capital grants 1,132,894 1,132,894 1,012,073
Transfers in 8,492,377 8,492,377 4,588,340
Transfers out (8,063,919) (16,522, 123) (24,586,042) (8,085,511)
CHANGE IN NET ASSETS 2,664,475 4,177,654 (16,497,865) (9,655,736) 1,759,830
NET ASSETS. BEGINNING 74,409,229 17,554,289 16,497,865 108,461,383 106,701,553
NET ASSETS, ENDING $ 77,073,704 $ 21,731,943 $ $ 98,805,647 $ 108,461,383
The accompanying notes are an integral part of the financial statements.
19
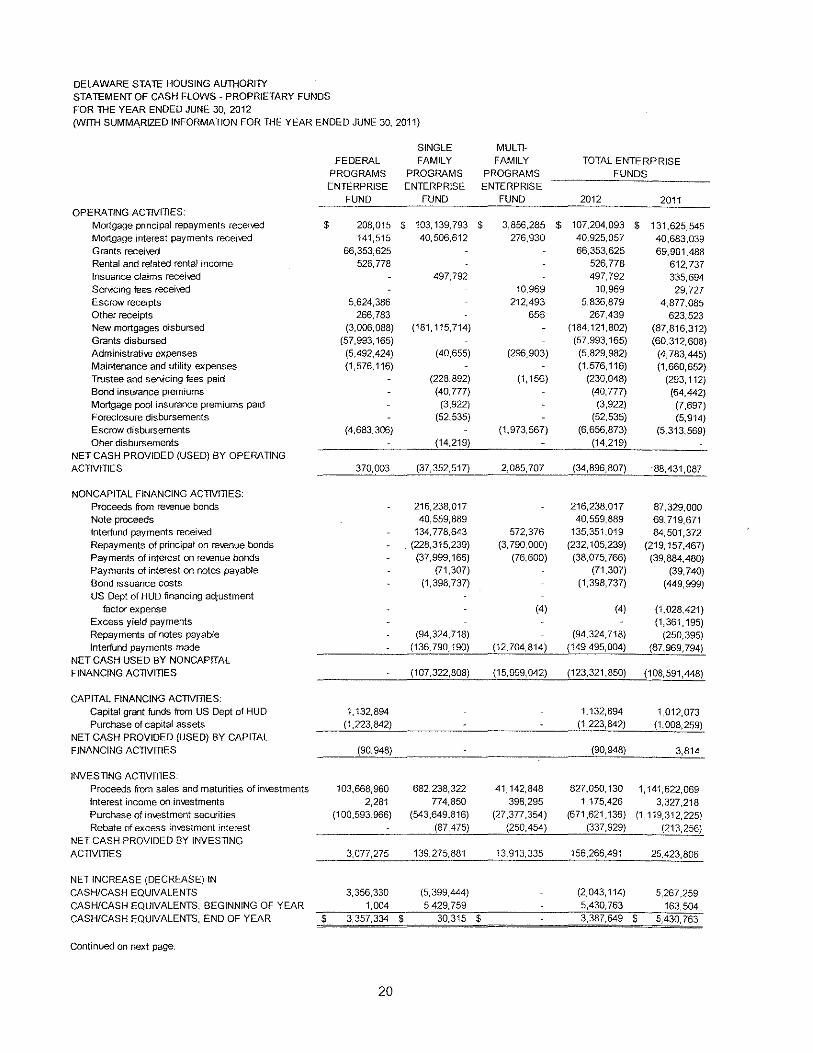
DElAWARE STATE HOUSING AU-mORITY STATEMENT OF CASH FLOWS· PROPRIETARY FUNDS
FOR mE YEAR ENDED JUNE 30, 2012
(Willi SUMMARIZED INFORMATION FOR lliE YEAR ENDED JUNE 30, 2011)
SINGLE MULTI·
FEDERAL FAMILY FAMILY TOTAL ENTERPRISE PROGRAMS PROGRAMS PROGRAMS FUNDS ENTERPRISE ENTERPRISE ENTERPRISE
FUND FUND FUND 2012 2011 OPERATING ACTIVITIES:
Mortgage principal repayments recei\oed $ 208,015 $ 103,139,793 $ 3,856,285 $ 107,204,093 $ 131,625,545 Mortgage interest payments received 141,515 40,506,612 276,930 40,925,057 40,683,039 Grants received 66,353,625 66,353,625 69,901.488 Rental and related rental income 526,778 526,778 612,737 lnsuance claims recei\ed 497,792 497,792 335,694 Servicing fees received 10,969 10,969 29,727 Escrow receipts 5,624,386 212,493 5,836,879 4,877,085 Other receipts 266,783 656 267,439 623,523 New mortgages disbursed (3,006,088) (181,115,714) (184,121,802) (87,816,312) Grants disbursed (57,993, 165) (57,993, 165) (60,312,608) Administrati-.e expenses (5,492,424) (40,655) (296,903) (5,829,982) (4,783,445) Maintenance and utility expenses (1,576,116) (1,576,116) (1,660,652) TI1Jstee and servicing fees paid (228,892) (1,156) (230,048) (293, 112) Bond insurance premiums (40,777) (40,777) (64,442) Mortgage pool insurance premiums paid (3,922) (3,922) (7,697) Foreclosure disbursements (52,535) (52,535) (5,914) Escrow disbursements (4,683,306) (1,973,567) (6,656,873) (5,313,569) Oher disbursements (14,219) (14,219)
NET CASH PROVIDED (USED) BY OPERATING
ACTIVIllES 370,003 (37,352,517) 2,085,707 (34,896,807) ·88,431,087
NONCAPITAL FINANCING ACllVnlES:
Proceeds from re\renue bonds 216,238,017 216,238,017 87,329,000 Note proceeds 40,559,889 40,559,889 69,719,671 lnterfund payments recei\red 134,778,643 572,376 135,351,019 84,501,372 Repayments of principal on re\-enue bonds (228,315,239) (3,790,000) (232, 105,239) (219, 157,467) Payments of interest on re\renue bonds (37,999,166) (76,600) (38,075,766) (39,884,480) Payments of interest on notes payable (71 ,307) (71,307) (39,740) Bond issuance costs (1,398,737) (1,398,737) (449,999) US Dept of HUD financing adjustment
factor expense (4) (4) (1,028,421) Excess yield payments (1,361,195) Repayments of notes payable (94,324,718) (94,324,718) (250,395) lnterfund payments made (136, 790, 190) (12,704,814) (149,495,004) (87,969,794)
NET CASH USED BY NONCAPITAL FINANCING ACTIVIllES (107,322,808) (15,999,042) (123,321,850) (108,591,448)
CAPITAL FINANCING ACTIVIllES
Capital grant funds from US Dept of HUD 1,132,894 1,132,894 1,012,073 Purchase of capital assets (1 ,223,842) (1,223,842) (1,008,259)
NET CASH PROVIDED (USED) BY CAPITAL
FINANCING ACTIVIllES (90,948) (90,948) 3,814
INVESTING ACTIVIllES
Proceeds from sales and maturities of imestments 103,668,960 682,238,322 41,142,848 827,050,130 1,141,622,069
Interest income on in\restments 2,281 774,850 398,295 1' 175,426 3,327,218 Purchase of imestment securities (100,593,966) (543,649,816) (27,377,354) (671 ,621 '136) (1' 119,312,225) Rebate of excess in~Rstment interest (87,475) (250,454) (337,929) (213,256)
NET CASH PROVIDED BY INVESTING
ACTIVIllES 3,077,275 139,275,881 13,913,335 156,266,491 25,423,806
NET INCREASE (DECREASE) IN
CASH/CASH EQUIVALENTS 3,356,330 (5,399,444) (2,043, 114) 5,267,259 CASH/CASH EQUIVALENTS, BEGINNING OF YEAR 1,004 5,429,759 5,430,763 163,504 CASH/CASH EQUIVALENTS, END OF YEAR $ 3,357,334 $ 30,315 $ 3,387,649 $ 5,430,763
Continued on next page.
20
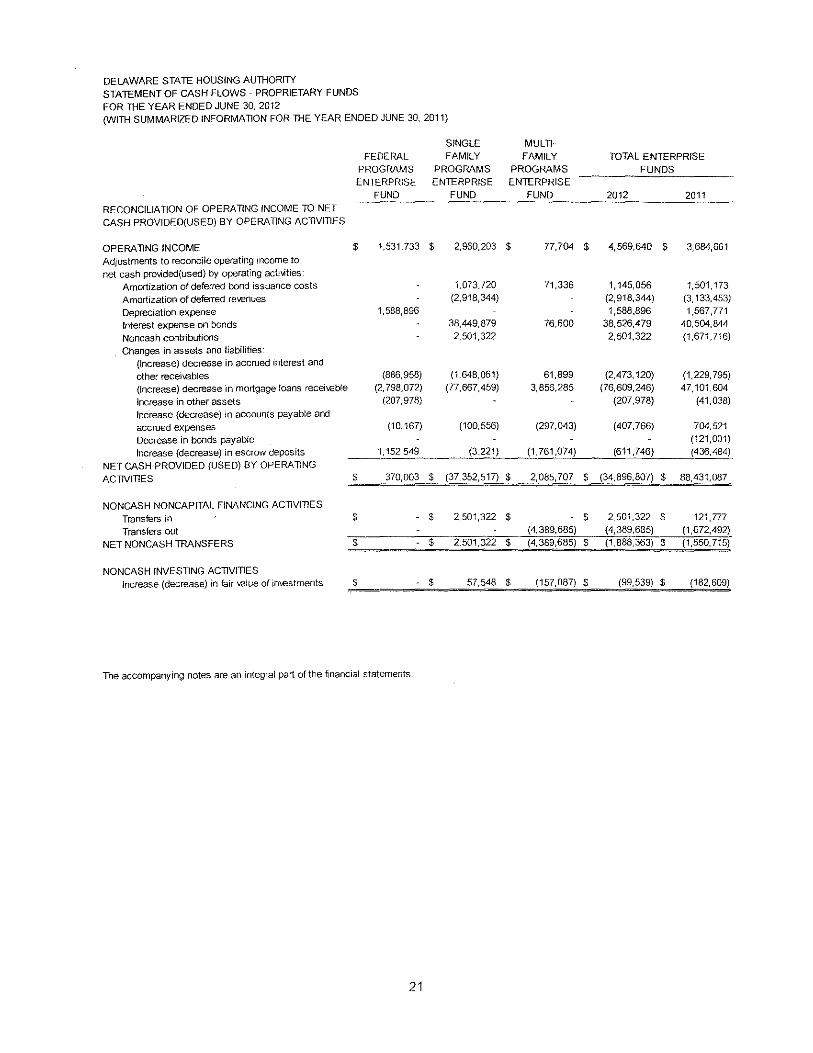
DElAWARE STATE HOUSING AUTl-IORITY
STATEMENT OF CASH FLOWS- PROPRIETARY FUNDS
FOR Tl-IE YEAR ENDED JUNE 30, 2012 (Will-I SUMMARIZED INFORMATION FOR Tl-IE YEAR ENDED JUNE 30, 2011)
SINGLE
FEDERAL FAMILY
PROGRAMS PROGRAMS
EN1ERPRISE ENTERPRISE
FUND FUND
RECONCILIATION OF OPERA llNG INCOME TO NET
CASH PROVIDED(USED) BY OPERA llNG ACllVIllES
OPERA llNG INCOME $ 1,531,733 $ 2,960,203
Adjustments to reconcile operating income to
net cash provided(used) by operating acth-itles: Amortization of deferred bond issuance costs 1,073,720
Amortization of deferred re-enues (2,918,344)
Depreciation expense 1,588,896
Interest expense on bonds 38,449,879
Noncash contributions 2,501,322
Changes in assets and liabilities (Increase) decrease in accrued interest and
other receivables (886,958) (1,648,061)
(Increase) decrease in mortgage loans recei\eb!e (2, 798,072) (77,667,459)
Increase in other assets (207,978)
Increase {decrease) in accounts payable and
accrued expenses (10, 167) (100,556)
Decrease in bonds payable
Increase (decrease) in escrow deposits 1,152,549 (3,221)
NET CASH PROVIDED (USED) BY OPERA llNG
ACllVIllES $ 370,003 $ (37,352,517)
NONCASH NONCAPITAL FINANCING ACllVIllES
Transfers in $ $ 2,501,322
Transfers out NET NONCASH llRANSFERS $ $ 2,501,322
NONCASH INVESTING ACllVIllES Increase (decrease) in fair value of in...estments $ - $ 57,548
The accompanying notes are an integral part of the financial statements.
21
MULTI-
FAMILY TOTAL ENTERPRISE
PROGRAMS FUNDS ENTERPRISE
FUND 2012 2011
$ 77,704 $ 4,569,640 $ 3,684,661
71,336 1,145,056 1,501,173
(2,918,344) (3, 133,453) 1,588,896 1,567.771
76,600 38,526,479 40,504,844
2,501,322 (1,671,716)
61,899 (2,473, 120) (1,229,795)
3,856,285 (76,609,246) 47,101,604 (207,978) (41,038)
(297,043) (407,766) 704,521
(121,001) (1,761,074) (611 ,746) (436,484)
$ 2,085,707 $ (34,896,807) $ 88,431,087
$ $ 2,501,322 $ 121,777 (4,389,685) (4,389,685) (1,672,492)
$ (4,389,685) $ (1,888,363) $ (1,550,715)
$ (157,087) $ (99,539) $ (182,609)
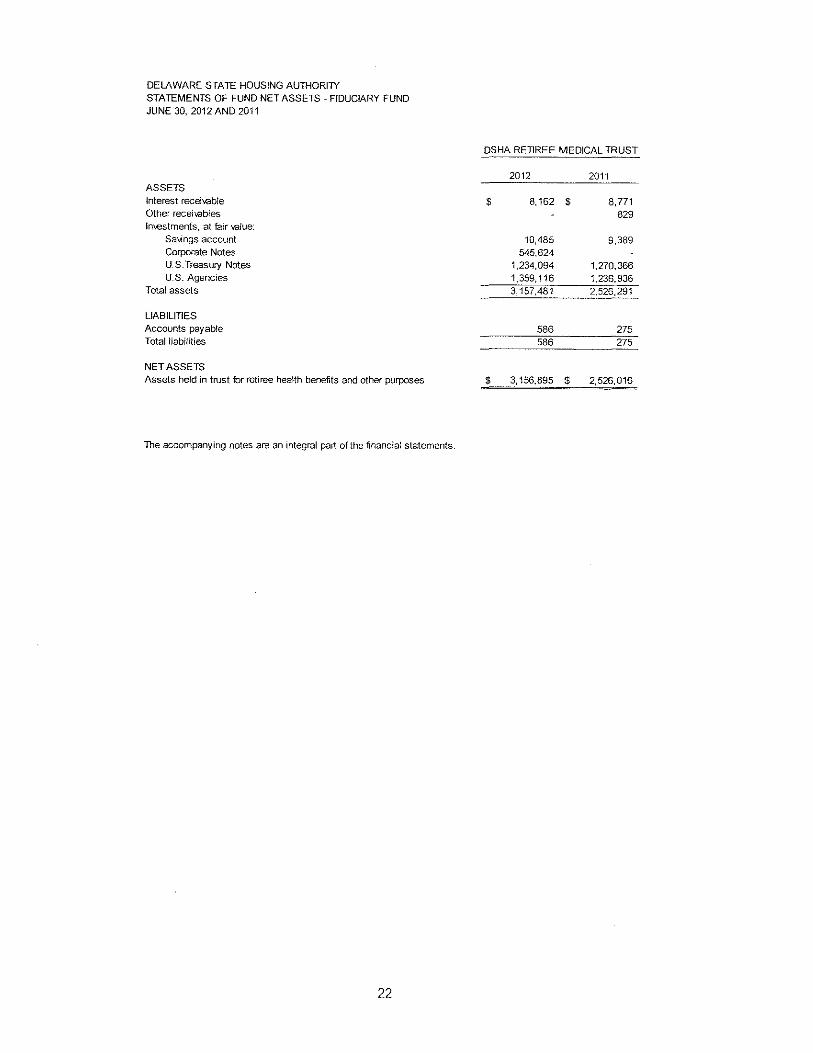
DELAWARE STATE HOUSING AUTHORITY
STATEMENTS OF FUND NET ASSETS- FIDUCIARY FUND
JUNE 30, 2012AND2011
ASSETS
Interest receivable
Other receivables ln'v€stments, at fair value:
Savings account
Corporate Notes
U.S.Treasury Notes U.S. Agencies
Total assets
LIABILITIES
Accounts payable
Total liabilities
NET ASSETS
Assets held in trust for retiree health benefits and other purposes
The accompanying notes are an integral part of the financial statements.
22
OSHA RETIREE MEDICAL TRUST
2012 2011
$ 8,162 $ 8,771 829
10,485 9,389 545,624
1,234,094 1,270,366 1,359,116 1,236,936 3,157,481 2,526,291
586 275
586 275
$ 3,156,895 $ 2,526,016
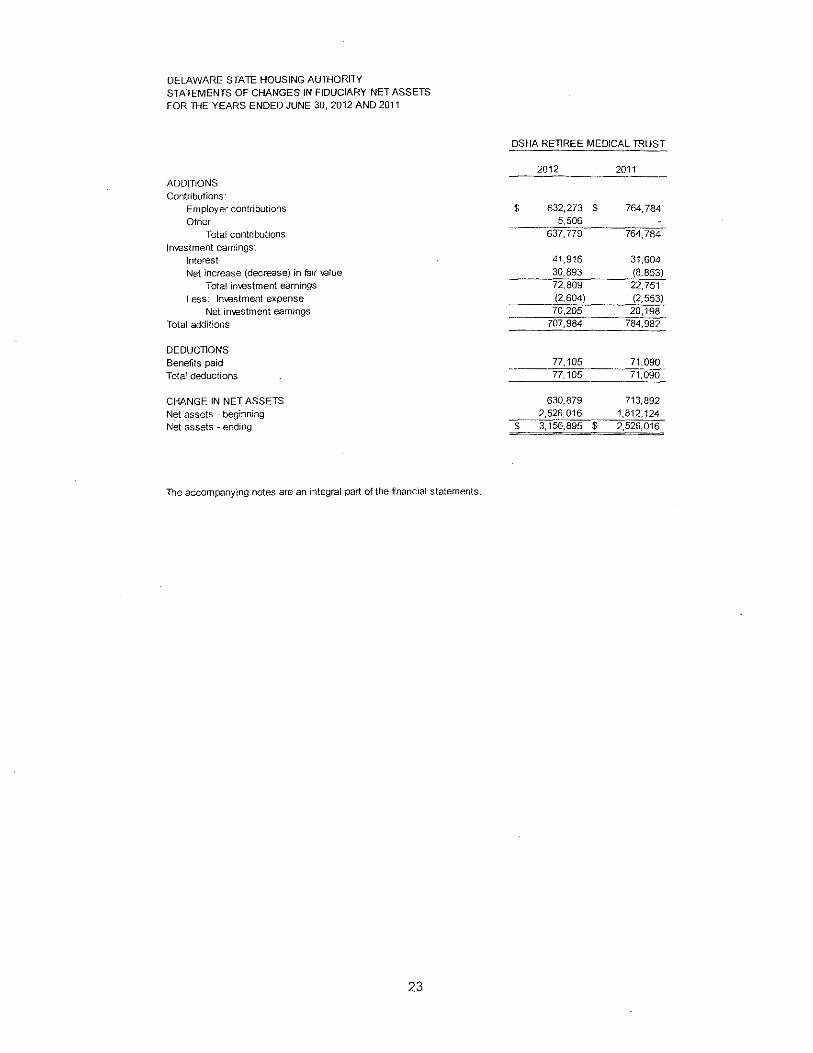
DELAWARE STATE HOUSING AUTHORITY STATEMENTS OF CHANGES IN FIDUCIARY NET ASSETS FOR THE YEARS ENDED JUNE 30, 2012 AND 2011
ADD!TlONS Contributions·
Employer contributions Other
Total contributions Investment eamings·.
Interest Net increase (decrease) in fair value
Total imestment earnings Less: Investment expense
Net investment earnings T a tal additions
DEDUCTIONS Benefits paid Total deductions
CHANGE IN NET ASSETS Net assets -beginning Net assets -ending
The accompanying notes are an integral part of the financial statements.
23
OSHA RETIREE MEDICAL 1RUST
2012 2011
$ 632,273 $ 764,784 5,506
637,779 764,784
41,916 31,604 30,893 (8,853) 72,809 22,751 (2,604) (2,553)
70,205 20,198 707,984 784,982
77,105 71,090 77,105 71,090
630,879 713,892 2,526,016 1,812,124
$ 3,156,895 $ 2,526,016
DELAWARE STATE HOUSING AUTHORITY NOTES TO FINANCIAL STATEMENTS, JUNE 30,2012
Index
I
II
Ill
IV_
v_
SUMMARY OF SIGNIFICANT ACCOUNTING POLICIES
A B. C. D.
Reporting Entity Entity-wide and fund financial statements Measurement focus, basis of accounting, and financial statement presentation Assets, liabilities, and net assets or equity
RECONCILIATION OF ENTITY-WIDE AND FUND FINANCIAL STATEMENTS
A
B.
Explanation of certain differences between the governmental fund balance sheet and the entity-wide statement of net assets Explanation of certain differences between the governmental fund statement of revenues, expenditures, and changes in fund balances and the entity-wide statement of activities
COMPLIANCE AND ACCOUNTABILITY
DETAILED NOTES ON ALL FUNDS
A B. c D. E. F. G.
Deposits and investments Receivables Accounts payable Capital assets lnterfund transactions Short-term and long-term debt Segment information
OTHER INFORMATION
A B. c_ D. E. F. G_ H.
Risk management Related organizations and related party transactions Economic dependency Post-retirement health care benefits Pension plans Contingent liabilities Subsequent events Restatement of prior year fund balances
24
25
25 25 31 32
36
36
36
36
36
36 39 40 41 42 43 44
47
47 47 47 47 49 50 50 50
DELAWARE STATE HOUSING AUTHORITY NOTES TO FINANCIAL STATEMENTS, JUNE 30,2012
I. SUMMARY OF SIGNIFICANT ACCOUNTING POLICIES
A. Reporting entity
The Delaware State Housing Authority (the Authority) was created in 1968 by an act of the General Assembly of the State of Delaware (the State). The Authority, which is a public corporation, was originally established as the Department of Housing. It was organized under the Department of Community Affairs in 1970 and under the Delaware Economic Development Office in 1987. The Authority was established in July 1998 as an independent Authority in the Executive Department, reporting directly to the Governor of the State, institutionalizing the role of affordable housing as a key aspect of State policy. For financial reporting purposes, the Authority is a discretely presented component unit of the State.
The Authority is authorized, among other things, to (1) make mortgage, construction and other loans to not-for-profit and limited-profit housing sponsors, (2) make loans to mortgage lenders, requiring the proceeds thereof to be used for making new qualified residential mortgage loans, (3) purchase qualified mortgage loans from mortgage lenders, and (4) apply for and receive assistance and subsidies under programs from the Federal government and others.
The Authority is authorized to issue bonds and notes in order to exercise its authorized powers. The Authority must abide by federal private activity caps. Bonds and notes issued by the Authority are not a debt or liability of the State (nor any political subdivision or agency thereof), and the faith, credit, nor taxing power of the State is not liable for repayment of such obligations. Bonds and notes of the Authority are secured solely by the revenues, loans and other pledged assets under the related Bond Indenture and are not payable from any other revenues of the Authority. Furthermore, the Authority has no taxing power.
In 1987, the State transferred the administrative responsibility for the Housing Development Fund (HDF), Community Development Block Grant and the Delaware Housing Insurance Fund to the Authority, and accordingly, the basic financial statements of the Authority include these activities.
B. Entity-wide and fund financial statements
The Authority's financial report consists of entity-wide financial statements and fund financial statements, accompanied by these notes to the financial statements, a management's discussion and analysis, and supplementary information.
The entity-wide financial statements (i.e., the statement of net assets and the statement of activities) report information on all activities of the Authority. Except for interfund activity and balances between the funds that underlie governmental activities and the funds that underlie business-type activities, the effect of interfund activity has been eliminated from these statements. Governmental activities, which normally are supported by state grants, interest income, and transfers, are reported separately from business-type activities, which rely to a significant extent on federal grants, interest income, mortgage repayments, and bond proceeds for support.
The statement of activities demonstrates the degree to which the direct expenses of a given function are offset by program revenues. Direct expenses are those that are clearly identifiable with a specific function. Indirect expenses are allocated to a specific function in accordance with the Authority's U.S. Department of Housing and Urban Development (US Dept of HUD) approved cost allocation plan. Interest expense on longterm debt is included in the direct expense of an individual function on the entity-wide statement of activities. Program revenues include 1) charges to clients or applicants who use or directly benefit from services provided by a given function and 2) grants and contributions that are restricted to meeting the operational or capital requirements of a particular function. Investment income and other items not properly included among program revenues are reported instead as general revenues.
The accounts of the Authority are organized on the basis of funds, each of which is considered a separate accounting entity. The operations of each fund are accounted for with a separate set of self balancing
25
accounts that comprise its assets, liabilities, fund equity, revenues and expenditures or expenses, as applicable. Resources are allocated to and accounted for in individual funds based upon the purposes for which they are to be spent in accordance with the Authority's enabling legislation, the various note and bond resolutions and indentures, and/or the requirements of the US Dept of HUD.
Separate financial statements are provided for governmental funds, proprietary funds, and fiduciary funds, even though the latter are excluded from the entity-wide financial statements. Major governmental and enterprise funds are reported as separate columns in the fund financial statements. The Authority reports the General Fund, the Housing Development Fund, and the OSHA Second Mortgage Assistance Loan Program as major governmental funds. All other governmental funds are reported as non-major. The Authority also reports its only enterprise funds- the Federal Programs, Single Family Programs, and Multi-Family Programs funds - as major.
The Authority's funds are as follows:
Governmental Fund Types
The General Fund is the Authority's primary operating fund. It accounts for all financial resources of the Authority, except those required to be accounted for in another fund. The General Fund accounts for the primary operations of the Authority. The operational costs are supported by transfers of administrative fees, management fees, and surplus funds from the Single Family, Multi-family, and Federal programs. The General Fund also receives support from the collection of certain other charges for services. The General Fund also accounts for certain single family, multi-family, and second mortgage assistance loans released from bond indenture requirements as a result of refunding the bonds the loans were originally associated with. Once released from the bond indentures, these loans are considered assets of OSHA and revenues generated from them are accounted for in the General Fund.
Special Revenue Funds are used for the proceeds of specific revenue sources that are restricted to expenditures for specified purposes (other than for major capital projects). The Authority's Special Revenue Funds are as follows:
• Housing Development Fund (HDF)- This program provides for the development of affordable housing on a statewide level. Funding for this program is made through appropriations from the General Assembly. These funds are typically loaned to qualified borrowers who can be either non-profit developers or forprofit developers; however, a small portion of these funds are granted to non-profit groups when debt service or repayments are not feasible. To qualify, developers must commit to rent to a predetermined percentage of low and moderate-income individuals for 20 years or the term of the loan, whichever is longer. Various restrictions are placed on mortgages, loans and grants as specified in the closing documents. Because the HDF is a revolving fund, most of its financing activity is in the form of both short and long-term loans which are used to finance pre-development expenses and construction costs, as well as assist in permanent financing. The HDF is used for homeownership assistance on a limited basis.
The HDF also accounts for OSHA's Live Near Your Work Grant Program (LNYW), a grant program originally financed by the HDF which provides matching grants up to $1,000 per eligible family to assist with down payment/settlement costs. The program is in cooperation with the Delaware Development Office, the Delaware Chamber of Commerce, certain businesses and local jurisdictions to provide financial assistance for employees to purchase homes near the workplace.
The HDF also accounts for the remaining loans in OSHA's Northeast Initiative Program (NE), a loan program originally financed by the HOF to provide interest-free deferrable loans to renovate owner occupied housing and low-interest deferrable loans to investors. The program was terminated in August 2002
• OSHA Second Mortgage Assistance Program (OSHA SMAL) - This program accounts for a program originally financed by the Housing Development Fund that provided second mortgage assistance loans to qualified first time home buyers who had inadequate savings to cover up-front costs associated with a home purchase. OSHA discontinued this program in February 2007, with no new loans being made after that date. Additionally, in August of 2008, the Delaware Housing Partnership granted a loan portfolio of
26
over $9 million to this program for the purpose of securing additional funding for second mortgage assistance. To date over $4.5 million of this program's loan portfolio has been granted to OSHA's Single Family program to be used as collateral for bond issues that included over $9 million of bond proceeds to be made available for second mortgage assistance loans.
OSHA SMAL also accounts for second mortgage assistance loans financed with loans from Housing Finance Operations. Beginning in April of 2010, HFO began funding Second Mortgage Assistance Loans to qualified borrowers who utilize OSHA's Single Family Mortgage Revenue Bond Program loans for their first mortgages. Accrued interest, interest payments and principal repayments are accounted for in this program. Repayment to Housing Finance Operations is made from the proceeds of subsequent single family mortgage revenue bond sales and the purchase of these loans by the bond issue.
• Delaware Emergency Mortgage Assistance Program (DEMAP) - Funded through the Housing Development Fund, State Banking Commission licensing fees, and contributions DEMAP is a loan program to help homeowners who have fallen behind on their mortgages due to financial hardships beyond their control. DEMAP low-interest loans provide eligible homeowners up to $25,000 for reinstating delinquent mortgages and keeping the mortgage up to date for a period of up to 24 months from the date of delinquency. OSHA's Hou~ing Finance Office originates, underwrites, approves, and services these loans. There is a mortgage recorded against the subject property, in second or third lien position.
• Delaware Housing Insurance Fund (DHIF) - This program accounts for the activity related to OSHA's administration of State funds which provide loan insurance for certain housing development loans. Additionally, the DHIF is used to pay debt service to SMAL bondholders for loans that foreclosed but were not forgiven by the bondholders.
• Foreclosure Prevention Program (FPP) - OSHA received $250,000 from the State of Delaware in fiscal year 2011 and an additional $615,600 in fiscal 2012 for the purpose of funding foreclosure prevention services throughout the state.
• Housing Rehabilitation Loan Program (HRLP) - The HRLP is funded through the Housing Development Fund. The purpose of the program is to encourage the preservation of existing housing stock already occupied by low and moderate income people. This program provides an interest rate of 3% on housing rehabilitation loans to qualified owner-occupants and to lar!dlords who rent their units to low-income persons. Owner occupants and investors may borrow 100% of rehabilitation costs. The limit on such rehabilitation costs is $35,000 for owner-occupied and $25,000 for investor owned. Loans carry up to a 15 year term. These loans are originated by one of four Local Administering Agencies (LAA), New Castle County, Kent County, Sussex County, and City of Wilmington. OSHA underwrites and approves the loans. Artisans Bank services these loans.
The HRLP also accounts for the activity of OSHA's Neighborhood Revitalization Fund (NRF). NRF was a fund established under the 21" Century Fund of the State of Delaware to support revitalization of communities and preserve the affordable housing stock for low and moderate-income families by rehabilitating substandard houses in selected communities throughout the State of Delaware. This program provided grants with a lien on the property for 3, 6, or 10 years dependent on the amount of funding. Grants were provided up to a maximum of $35,000 per home for owner occupant. OSHA loans under this program are deferred. ·
• State Rental Assistance Program (SRAP) - SRAP is designed to serve individuals who have access to continuing supportive services but require affordable housing to live safely and independently in the community. This population includes youth exiting foster care, families for whom the lack of affordable housing is a barrier to reunification, individuals exiting long-term care facilities, and individuals at-risk of being admitted to, or requiring supportive services from, a state-supported institution. The program will utilize rental subsidies administered by OSHA for households referred by the Department of Health and Social Services (DHSS) and the Departments of Services for Children, Youth, and their Families (DSCYF). The Delaware General Assembly approved a $1.5 million allocation to fund SRAP through the FY 2012 Bond and Capital Improvements Act ("Bond Bill"). This amount is expected to create approximately 150 to 200 rental subsidies for eligible program applicants.
27
• Wexford Village Rehab (WVR)- Accounts for OSHA funds set aside from the termination of the Financing Adjustment Factor Reserve Program (FAF) and Multi-Family Bond Programs (MF). OSHA management has designated these funds for use in the rehabilitation of Wexford Village, a 48 unit Low Income Housing Tax Credit (LIHTC) site located in Laurel, DE, owned by Wexford Village Housing Corporation, a nonprofit corporation of OSHA
• Wilmington Senior Tax Assistance Program (WSTAP)- The Wilmington Senior Tax assistance Program is designed to assist homeowners in the City of Wilmington who are 62 years of age or older and facing imminent foreclosure due to delinquent property taxes, or sewer and water bills. This program is funded with grants from United Way of Delaware and the City of Wilmington. Program payments of taxes and/or water/sewer bills for approved applicants are made by OSHA directly to the City of Wilmington. The maximum grant amount available under this program is $3,000.
Proprietary Fund Type
Three Enterprise funds are used to account for the activities of the Authority's Federal Programs, Single Family Programs, and Multi-Family Programs as described below:
Federal Programs Fund
Moving To Work Demonstration Program (MTW) - The MTW Demonstration Program offers OSHA the opportunity to design and test housing and self-sufficiency strategies for low-, very-low, and extremely lowincome families by allowing exemptions from existing public housing and tenant-based Housing Choice Voucher rules and, with HUD approval, permits OSHA to combine operating, capital, and tenant-based assistance funds into a single agency-wide funding source.
The MTW program provides housing assistance for a maximum of five years to low-income Delawareans. Participants in the Moving To Work Program sign a Contract of Mutual Participation which outlines a plan to assist them in becoming more financially independent.
The MTW Demonstration Program does not provide any additional funding to OSHA. Funding originates from the following US Dept of HUD programs:
• Capital Fund Program (CFP) -This program provides funding for the modernization of OSHA's public housing sites.
• Housing Choice Voucher Program (HCVP) - This program provides housing subsidies through OSHA's consolidated MTW program to eligible low-income individuals and families to rent existing privately owned units from participating landlords in Kent and Sussex Counties. OSHA administers this program and rents are subsidized by US Dept of HUD. To qualify, residents must meet income criteria and each landlord must meet federal housing quality standards.
• Public Housing (PH) - Accounts for the activity related to OSHA's operation of ten housing projects c1
sites under the US Dept of HUD Low Income Housing Program. Under this Program, US Dept of HUD provides funding via an annual contributions contract. These funds, combined with the rental income received from tenants, are available solely to meet the operating and debt service expenses of the projects. Escrow deposits in this program represent amounts set aside from rental income for participants within the Public Housing Program who also participate in the Authority's Moving To Work (MTW) Program. The MTW Program provides housing assistance for a maximum of five years to low-income Delawareans. Participants in the MTW program sign a Contract of Mutual Participation which outlines a plan to assist them in becoming more financially independent.
Community Development Block Grants - Grants received from US Dept of HUD are distributed as loans or grants in furtherance of community development. The grants accounted for under this program are as follows:
• Community Development Block Grant (CDBG) - This grant program provides funding for rehabilitation, demolition, and Housing Code enforcement to maintain and improve existing housing, and provide the
28
infrastructure to support this housing for low and moderate income persons. Eligible local governments implement this program by adopting a local Community Housing and Development Plan and submitting an application to OSHA for approvaL A review panel evaluates applications based upon the extent of low-income individuals affected. Currently, only Kent and Sussex Counties, and municipalities within those two counties are eligible to apply under this program.
• Emergency Shelter Grant Program (ESGP) - This grant program provides existing emergency housing providers with assistance to expend and renovate homeless shelters and provides supportive housing service assistance to homeless persons and famili'es in Kent and Sussex Counties.
• Housing Opportunities for People With AIDS (HOPWA) - This grant program provides funding for payment of project-based and/or tenant-based rental assistance, including shared housing, rent, mortgage, and/or utility payments to prevent homelessness for the tenant or mortgagor, in Kent and Sussex Counties. Funds may also be used for supportive services. The funds are awarded to the Delaware HIV Consortium.
• Neighborhood Stabilization Program (NSP1) - The purpose of this grant program is (1) to assist communities that have been, or are likely to be, affected by foreclosed and abandoned properties by stimulating re-use of the property, and (2) to provide affordable rental and homeownership opportunities to households at or below 120% of Area Median Income (AMI), with 25% of the funds targeted to provide assistance to households at less than 50% of AMI.
• Neighborhood Stabilization Program (NSP3) - This grant program is being used to fund OSHA's Rebuilding Our Communities Program (ROC). ROC assists low- to moderate-income borrowers in the purchase of foreclosed or abandoned single-family homes, in qualified census tracts, by providing down payment and closing cost assistance of $15,000 at 0% interest in the form of a forgivable loan.
Other Federal Funded Programs
• Delaware Emergency Mortgage Assistance Program/Emergency Homeowners Loan Program (DEMAPIEHLP)- OSHA has been awarded $6 million through the US Dept of HUD by the Dodd-Frank Wall Street Reform and Consumer Protection Act. The DEMAPIEHLP will offer a forgivable loan of up to $50,000 to assist homeowners who are unemployed or under-employed with past due and future mortgage payments, including insurance and property taxes. Those homeowners facing foreclosure as a result of serious medical events may also qualify.
• Family Unification Program (FUP) - US Dept of HUD funding provided for housing vouchers to be made available to families for whom the lack of adequate housing is a primary factor in the separation, or threat of imminent separation, of children from their families or in the prevention of reunifying the children with their families. The vouchers are also available to provide housing assistance to youth between 18 and 21 years of age who have left foster care. To qualify, residents must meet income criteria and each landlord must meet federal housing quality standards.
• HOME Investment Partnership Program (HOME) - US Dept of HUD funding provided for low-interest and interest-free loans and/or grants to nonprofit and limited profit housing sponsors for the development of certain housing for low-to-moderate income persons
• National Foreclosure Mitigation Counseling Program (NFMC) - OSHA administers an award from NeighborWorks America, a congressionally chartered nonprofit organization dedicated to improving distressed communities. OSHA's role is that of an administrative pass-through agency to three nonprofit agencies, which are paid set fees per client for mortgage delinquency and foreclosure prevention counseling sessions.
• Section 8 Contract Administration (CA) - OSHA administers Housing Assistance Payment (HAP) contracts for 59 US Dept of HUD financednnsured Section 8 developments in Delaware.
29
The American Reinvestment and Recovery Act of 2009 Programs
The American Recovery and Reinvestment Act of 2009 (ARRA), created to help the economy and increase employment, provided OSHA with increased funding to be used to make capital improvements to public housing sites, provide additional resources to the Community Development Block Grant Program, and fund a new program for homeless prevention. ARRA also created the Housing Tax Credit Assistance Program which, along with additional funding for exchanging unused tax credits for cash through the IRS, will be used in the financing of low income housing development projects.
• Homeless Prevention and Rapid Re-housing Program (HPRP) Direct Grant - OSHA awarded HPRP funds to five sub grantees for homeless prevention and rapid re-housing and one sub grantee for data collection and reporting. Of the $934,980 total US Dept of HUD grant, $611,039 was awarded for financial assistance, $227,912 was awarded for housing relocation and stabilization services, $17,129 was awarded for administration and $50,850 was awarded for data collection and reporting. In addition, OSHA will retain $28,050 for administration. This grant is reported in the Community Development Block Grant Program subfund of the Federal Programs. As of June 30, 2012, $918,260 of the grant was spent.
• Neighborhood Stabilization Program (NSP2) Competitive Grant- OSHA's NSP2 targets the census tracts identified by HUD as those most at risk of being destabilized because of foreclosures. The NSP2 funds of over $10 million will be used for two activities to stabilize those neighborhoods, (1) financing and (2) purchase/rehabilitation. Financing may include down payment assistance, below interest mortgages or second mortgages where the principle due is reduced during the tenure of the homeowner. Purchase/Rehabilitation allows local governments and nonprofits to acquire foreclosed and abandoned properties to restore to code and upgrade with energy efficient appliances and other green technologies. These homes will be sold using finance mechanisms listed above. OSHA has allocated funds to four Jurisdictions who will act as our sub-recipients and work with the venders. The Jurisdictions are as follows: New Castle County, City of Wilmington, Kent County, and Sussex County. These sub recipients will carry out the NSP activities in their targeted census tracts. As of June 30, 2012, $7,803,699 of the grant was spent.
• Tax Credit Assistance Program (TCAP) - provides US Dept of HUD funding of over $6.6 million in assistance to eligible Low-Income Housing Tax Credit projects. The program is intended primarily to supplement affordable housing developments that have been unable to secure adequate equity commitments in the current market. This grant is reported in the HOME Investment Partnership Program subfund of the Federal Programs. As of June 30, 2012, the total grant amount was spent.
• Low Income Housing Tax Credit Exchange Program- provides US Treasury funding of over $22,000,000 for OSHA to "exchange" a portion of its 2009 housing credit ceiling for cash, which can be used to make "subawards" to finance the construction or acquisition and rehabilitation of qualified low-income buildings. This grant is reported as a subfund of the Federal Programs. As of June 30, 2012, $20,550,434 of the grant was spent.
• Sustainable Energy Utility/Delaware Energy Office Program (SEU/DEO) - OSHA partnered with the Delaware Energy Office (DEO) and Sustainable Energy Utility, Inc. (SEU) to provide SEU loans through OSHA's Housing Development Fund (HDF) to borrowers who are also receiving Low Income Housing Tax Credits. Under provisions of this agreement, DEO allocated funds received from a US Dept of Energy ARRA grant to SEU. SEU will provide up to $1.4 million of these funds to be used in conjunction with HDF funds to provide multi-family financing opportunities. The SEU loans are intended to encourage borrowers to increase energy efficiency in the renovation and construction of affordable housing developments throughout the State of Delaware.
Single Family Programs Fund
• Single Family Bond Program - This program accounts for the proceeds of the single family mortgage revenue bonds that are used to purchase long-term mortgage loans on owner occupied single family homes. Beginning in fiscal 2009, the Authority included provisions for some bond proceeds to be used to purchase second mortgage assistance loans for qualifying home buyers. Private financial institutions act as agents for the Authority and process, disburse and service individual loans. Separate accounts are
30

maintained for each series of bonds in accordance with the applicable bond resolution and indenture; however, for financial statement presentation, these accounts have been combined. Any excess of revenues over expenses in these accounts, as defined by the resolution and indenture, is not available for the general and lawful use of the Authority until all of the restrictive covenants of the applicable bond resolutions and indentures have been met.
• OSHA Mortgage Backed Securities Purchase Program - This program accounts for the purchasing of mortgaged backed securities to be held as investments prior to the issuance of revenue bonds under the 1994 General Resolution. The mortgaged backed securities are purchased with funds provided by a note payable to the Federal Home Loan Bank (FHLB) Pittsburgh. Proceeds from the next bond issue will be used to pay the note and the mortgaged backed securities will become assets of the bond issue.
• Second Mortgage Assistance .Loan (SMAL) Bond Program - This program accounts for the proceeds of the Senior SMAL Mortgage Revenue Bonds, which provided second mortgages for qualifYing home buyers.
Multi-Family Programs Fund
• Multi-Family Bond Program- This program accounted for the proceeds of Housing Development Revenue Bonds used to provide permanent financing for multi-family housing projects; the proceeds of Multi-Family Mortgage Revenue Bonds used to provide permanent financing for multi-family housing projects. All outstanding bonds payable were called and paid during fiscal year 2012. After all restrictive covenants of the bond resolutions and indentures were met the remaining mortgage receivables and other assets became property of OSHA.
• Financing Adjustment Factor (FAF) Reserve Program- The FAF Reserve accounts for the proceeds of the General Obligation bonds issued on behalf of the Authority by the State of Delaware to enable the Authority to obtain immediate benefit of the FAF savings as required by US Dept of HUD to permit US Dept of HUD to obtain the benefit of lower financing interest rates. An outstanding note payable to the State of Delaware was paid in full during fiscal year 2011. All activity during fiscal year 2012 refiects the termination of the program.
Fiduciary Fund Type
The OSHA Retiree Medical Trust Fund accounts for transactions, assets, liabilities, and net assets held in· trust for post employment healthcare insurance premiums of OSHA non-state employees (Note V.,D.).
C. Measurement focus, basis of accounting, and financial statement presentation
The entity-wide financial statements are reported using the economic resources measurement focus and the accrual basis of accounting, as are the proprietary fund and fiduciary fund financial statements. Revenues are recorded when earned, and expenses are recorded when a liability is incurred, regardless of the timing of related cash flows. Grants are recognized as revenue when all eligibility requirements have been met.
Private-sector standards of accounting and financial reporting issued prior to December 1, 1989, are followed in both the entity-wide and enterprise fund financial statements to the extent that those standards do not conflict with or contradict guidance of the Governmental Accounting Standards Board. Governments also have the option of following subsequent private-sector guidance for their business-type activities and enterprise funds, subject to this same limitation. The Authority has elected not to follow subsequent privatesector guidance.
Proprietary funds distinguish operating revenues and expenses from non operating items. Operating revenues and expenses generally result from providing mortgages and grants in connection with a proprietary fund's principal ongoing operations. The principal operating revenues of the Authority enterprise funds are US Dept of HUD grants and mortgage interest. Operating grants are classified as operating revenues if they finance a program that the Authority would not otherwise undertake. These grants re·lmburse the costs of these programs whose activity is inherently part of the operations of the Authority. The Authority also recognizes as operating revenue rental income from Public Housing sites. Operating expenses for enterprise
31
funds include grant expenses, administrative expenses, and depreciation on capital assets. All revenues and expenses not meeting this definition are reported as non operating revenues and expenses.
The governmental fund financial statements (General and Special Revenue Funds) are reported using the current financial resources measurement focus and the modified accrual basis of accounting. Revenues are recognized as soon as they are both measurable and available. Revenues are considered to be available when they are collectible within the current period or soon enough thereafter to pay liabilities of the current period. For this purpose, the Authority considers revenues to be available if they are collected within 60 days of the end of the current fiscal period. Revenues are recognized for the major revenue categories subject to the availability criteria as follows:
• Grant revenues (wherein monies must be expended on specific purposes prior to the Authority being reimbursed) are recognized as reimbursable expenditures as incurred.
• Service revenues are recognized as earned. • Interest revenues on cash and investments are recognized as earned. • Interest revenues on mortgage loans are recognized as earned.
However, changes in the fair value of investments are recognized as revenue without reference to the availability criteria.
Under the modified accrual basis of accounting, expenditures (operating, capital and debt service) are generally recognized when the related fund liability is incurred. However, debt service expenditures, as well as expenditures related to compensated absences and claims and judgments, are recorded only when payment is due.
o: Assets, liabilities, and net assets or equity
Cash and Cash Equivalents
The Authority considers all checking deposits, demand deposits and uninvested principal cash to be cash and cash equivalents.
Investments
Investment securities are recorded at fair value, except that investment securities with a remaining maturity at time of purchase of one year or less are reported at cost adjusted for the amortization of premium or the accretion of discount over the term of the investment, which approximates fair value (see Note IV., A)
Accrued Interest and Other Receivables
An allowance for doubtful accounts in the amount of $18,336 has been established for tenant accounts receivable in the business-type activities and the Federal Programs Enterprise Fund as of June 30, 2012. The allowance is based upon an aging of the tenant accounts receivable and is adjusted annually. All tenant account receivable balances with no payment activity within 120 days are considered doubtful accounts.
Mortgage Loans Receivable
Mortgage loans are recorded at their unpaid principal balances net of allowances for doubtful accounts (see Note IV., B.). Allowances are estimated as a percentage of total outstanding balances within the following loans programs at June 30: First and second homeowner mortgages of the Authority Loan Programs within the General Fund, OSHA Second Mortgage Assistance Loan Program (OSHA SMAL), Delaware Emergency Mortgage Assistance Loans (DEMAP), Housing Rehab Loan Program (HRLP), Neighborhood Revitalization Fund (NRF), Northeast Initiative Program (NE), and Single Family Programs. These percentages are reviewed and revised by the Authority on an annual basis.
Capital Assets
Capital assets acquired for general Authority operations are capitalized at cost and reported in the entity-wide
32
and proprietary fund financial statements net of accumulated depreciation.
All land and buildings are capitalized, regardless of cost. Buildings and. land/site improvements are capitalized when the cost of the project equals $100,000 or more. Software purchases are capitalized when the cost equals or exceeds $50,000. Equipment and vehicles are capitalized when the cost of individual items is $25,000 or more, with the exception of items purchased with federal funds, which are capitalized when the cost exceeds $5,000 in accordance with OMB Circular A-87.
Capital assets of the Authority are depreciated using the straight line method over the following estimated useful lives:
Buildings Buildings and Land/Site Improvements Computer Software Telecommunication Equipment Computer Equipment Vehicles Other Equipment
Deferred Bond Issuance Costs
27 years 15 years 10 years 10 years 3 years 3 years 5 years
Bond issuance costs are capitalized and amortized over the term of the bond issue using the bonds outstanding method which approximates the level yield method.
Accrued Arbitrage Rebate Payable
The Authority accrues the arbitrage rebate owed to the Internal Revenue Service when the investment earnings exceed the allowable earnings.
Compensated Absences Payable
In accordance with GASB Statement No. 16, the Authority has accrued a liability for future absences, recognizing the obligation relating to compensation for absences attributable to services already rendered.
The current portion of compensated absences for both the entity-wide and fund proprietary financial statements includes all annual leave amounts that exceed a 318 hour maximum allowable carryover per employee, as these amounts will have to be used within the next year or be forfeited. The Authority believes that those balances will be used and not forfeited. Additionally, current compensated absences include annual leave balances payable to employees at fiscal year end based on the Authority's knowledge of pending retirements or resignations. The balance of annual leave accrual is considered noncurrent. The Authority considers all sick leave accruals noncurrent.
Escrow Deposits
In the General Fund, escrow deposits represent amounts withheld from housing assistance contributions received from US Dept of HUD for the payment of property insurance, property taxes and property replacement requirements for the multi-family authority loans.
In the Federal Programs Fund, escrow deposits are held for the HOME and MTW programs. The HOME escrow deposits represent funds received from project owners for the payment of property insurance, property taxes, and property replacement requirements. MTW escrow deposits represent amounts set aside from rental income for the Moving To Work Rental Housing Program.
In the Housing Development Fund, escrow deposits represent funds received from project owners for the payment of property insurance, property taxes, and property replacement requirements for the Housing Development Fund.
Interest earnings from the investment of such escrows are distributed to the escrow accounts.
33
Nonrefundable Deferred Commitment Fees
Commitment and application fees in the Single Family Programs Fund represent non-refundable payments from contractors for the purpose of securing a commitment for permanent mortgage loans for single family units to be constructed by the contractor. These fees are capitalized and amortized over the Joan period using the bonds outstanding method which approximates the level yield method.
Restricted Resources
The Authority spends restricted resources first and uses unrestricted resources for purposes for which restricted resources are not available.
Net Assets/Fund Equity
In the entity-wide statement of net assets, the Authority reports net assets in three categories - invested in capital assets, restricted, and unrestricted. The amount of unrestricted net assets is dedicated to the Authority's operations, pursuant to Title 31, Chapter 40 of the Delaware Code and the Authority's bond resolutions.
Beginning with the Year Ended June 30, 2011, the Authority has implemented GASB Statement No. 54, "Fund Balance Reporting and Governmental Fund Type Definitions." This statement provides more clearly defined fund balance categories to make the nature and extent of the constraints placed on the Authority's fund balances more transparent. The following classifications describe the relative strength of the spending constraints:
General Fund
• Nonspendable: Total of interfund receivables, loans receivable, accrued interest and other receivables and prepaid items as reported on the balance sheet.
• Committed: Amounts designated by General Order of the Authority, as approved by the Director, a position appointed by the Governor and authorized by Delaware Code, found at Title 31, Chapters 40 and 43, as follows:
Program Activities - amount based upon the greater of the Authority's current administrative budget or the projected general fund balance amount needed to support operations over a ten year period as identified in the most recent Resource Allocation Plan, and
Program Investments - amount in excess of program activity needs, as described above, to be conservatively invested in existing or proposed Authority programs to further the Authority's mission.
Housing Development Fund
• Nonspendable: Total of interfund receivables, loans receivable, accrued interest and other receivables and prepaid items as reported on the balance sheet.
• Restricted: Amount in excess of nonspendable and committed fund balances to be used for the specific purpose of Housing Development Fund activities per enabling legislation.
• Committed: Amounts designated on Council on Housing Resolutions as approved by the Council on Housing, an eleven member board appointed by the Governor and authorized by Delaware Code, found at Title 31, Chapter 40, for specific purposes (i.e., loans and grants) but not yet disbursed at statement date.
Other Governmental Funds
• Nonspendable: Total of interfund receivables, loans receivable, accrued interest and other
34
receivables and prepaid items as reported on the balance sheet.
• Restricted: Amount in excess of nonspendable fund balances to be used for the specific program activities per enabling legislation.
• Assigned: Amount in excess of nonspendable fund balances which the Authority, as approved by the Director, a position appointed by the Governor and authorized by Delaware Code, found at Title 31, Chapters 40 and 43, intends to use for a specific purpose.
When an expenditure is incurred for which committed, assigned, or unassigned fund balances are available, the Authority considers amounts to have been spent first out of committed funds, then assigned funds, and finally unassigned funds, as needed, unless the Authority has provided otherwise in its commitment or assignment actions. Commitments may be modified or rescinded only through General Order or by Housing Council.
Comparative Data
Comparative total data for the prior year is presented in the basic financial statements to provide an understanding of changes in the Authority's financial position and operations. That comparative data is not at the level of detail required for a presentation in conformity with generally accepted accounting principles and has been restated and reclassified, as needed, from the presentation in the Authority's June 30, 2011, financial statements to be comparative with the current-year presentation.
For the fiscal year ending June 30, 2012, the Authority combined the following non-major governmental fund programs shown separately at June 30, 2011: the Authority Loan Program has been combined with the General Fund; Live Near Your Work Program and Northeast Initiative have been combined with the Housing Development Fund; HFO Second Mortgage Assistance Loan Program has been combined with the DSHA Second Mortgage Assistance Loan Program; Neighborhood Revitalization Fund has been combined with the Housing Rehabilitation Loan Program. The effect of these changes in presentation was to increase the General Fund's beginning fund balance by $2,924,872, to increase the Housing Development Fund's beginning fund balance by $1,964,822, to increase the DSHA Second Mortgage Assistance Loan Program beginning fund balance by $128,752 and to decrease the beginning fund balance of the non-major governmental funds by $5,018,446. During the current year, management reviewed the purpose of its special revenue funds and determined that the funds reclassified above no longer met the definition of special revenue funds under GASB 54.
For the fiscal year ending June 30, 2012, the Public Housing Program sub fund, which had a net asset balance of $15,065,229 as of June 30, 2011 and the Housing Choice Vouchers Program sub fund, which had a net asset balance of $5,795,069 as of June 30, 2011 have been reported as the Moving To Work Demonstration Program sub fund and the Family Unification Program sub fund. All programs are sub funds of the major Federal Programs Enterprise Fund and therefore beginning net assets of the major Federal Programs Enterprise Fund did not change. This change in presentation was made in order to be consistent with how these programs are reported on the Schedule of Expenditures of Federal Awards.
Statement of Cash Flows
For purposes of reporting cash flows of Proprietary Funds, cash balances consist of checking deposits, demand deposits, and uninvested principal cash. GASB Statement No. 9 requires reporting both purchases and sales of investments under Investing Activities. As permitted under Statement No. 9, however, certain investment transactions have been reported as a net change in the statement of cash flows because the turnover rate of such investments is high and their maturities are short.
Budgetary Comparisons
Under GASB No. 34, budgetary comparison information is required to be presented for the general fund and each major special revenue fund with a legally adopted budget. The Authority is not legally required to adopt a budget for the general fund. Therefore, budget comparison information is not included in the Authority's financial statements. However, the Authority does implement an executive budget each fiscal year. The
35
executive budget is reviewed and approved by the Director, monitored for compliance on a monthly basis, and any use of the general fund beyond the approved executive budget must be approved by the Director.
II. RECONCILIATION OF ENTITY-WIDE AND FUND FINANCIAL STATEMENTS
A. Explanation of certain differences between the governmental fund balance sheet and the entity-wide statement of net assets
The governmental fund balance sheet includes reconciliation between fund balance - total governmental funds and net assets - governmental activities as reported in the entity-wide statement of net assets. One element of that reconciliation explains that capital assets are not financial resources and therefore, are not reported in the funds. The details of this $1,983,045 difference are as follows:
Capital assets Less: Accumulated depreciation Net capital asset adjustment
$3,661,772 (1 ,678, 727)
$1 983 045
The other element of that reconciliation explains that long-term liabilities are not due and payable in the current period and therefore are not reported in the funds. The details of this $576,080 difference are as follows:
Compensated absences $ 576,080
B. Explanation of certain differences between the governmental fund statement of revenues, expenditures, and changes in fund balances and the entity-wide statement of activities
The governmental fund statement of revenues, expenditures, and changes in fund balances includes reconciliation between net changes in fund balances - total governmental funds and changes in net assets of governmental activities as reported in the entity-wide statement of activities. One element of that reconciliation explains that governmental funds report capital outlays as expenditures. However, in the statement of activities the cost of those assets is allocated over their estimated useful lives and reported as depreciation expense. The details of this $177,053 difference are as follows:
Capital outlay Less: Depreciation expense Net capital asset adjustment
Ill. COMPLIANCE AND ACCOUNTABILITY
$ 239,588 (62,535)
$ 177 053
The Authority implements an executive budget each fiscal year. The executive budget is reviewed and approved by the Director, monitored for compliance on a monthly basis, and any use of the general fund beyond the approved executive budget must be approved by the Director.
IV. DETAILED NOTES ON ALL FUNDS
A. Deposits and investments
Investment Policies
The Authority has an investment policy that encompasses all moneys related to the issuance of bonds, as well as, all funds otherwise held by the Authority. The Authority seeks first and foremost to ensure safety of principal, and secondly, to attain the highest possible return available given the risk constraints. The Authority is allowed to invest in certain qualified investments as defined by amended Section 4013, Chapter 40, Title 31, of the Delaware Code and the Authority's formal investment policy. Subject to certain limitations, such as the credit ratings on bonds and the capitalization level of depositories, "qualified investments" include:
• Obligations of or explicitly guaranteed by the US or Delaware state governments • Obligations of US government-sponsored enterprises and US government agencies and instrumentalities. • Obligations of depositories and other financial institutions. • Bankers' acceptances.
36
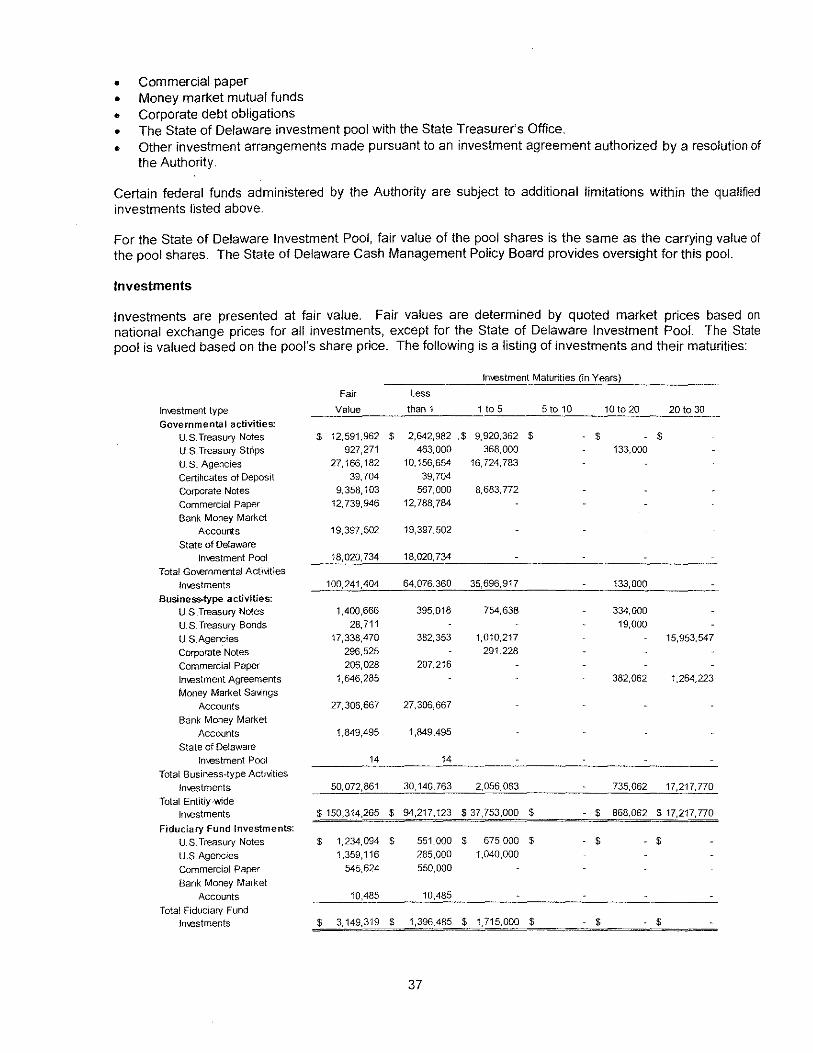
• Commercial paper • Money market mutual funds • Corporate debt obligations • The State of Delaware investment pool with the State Treasurer's Office. • Other investment arrangements made pursuant to an investment agreement authorized by a resolution of
the Authority.
Certain federal funds administered by the Authority are subject to additional limitations within the qualified investments listed above.
For the State of Delaware Investment Pool, fair value of the pool shares is the same as the carrying value of the pool shares. The State of Delaware Cash Management Policy Board provides oversight for this pool.
Investments
Investments are presented at fair value. Fair values are determined by quoted market prices based on national exchange prices for all investments, except for the State of Delaware Investment Pool. The State pool is valued based on the pool's share price. The following is a listing of investments and their maturities:
Jn\E!stment Maturities {In Years)
Fair less
Investment type Value than 1 1 to 5 5 to 10 10 to 20 20 to 30
Governmental activities: U.S. Treasury Notes $ 12,591,962 $ 2,642,982 .$ 9,920,362 $ $ $ U.S. Treasury Strips 927,271 463,000 368,000 133,000
U.S. Agencies 27,166,182 10,156,654 16,724,783
Certificates of Deposit 39,704 39,704
Corporate Notes 9,358,103 567,000 8,683,772
Commercial Paper 12,739,946 12,788,784
Bank Money Market
Accounts 19,397,502 19,397,502
State of Delaware
Investment Pool 18,020,734 18,020,734
Total Go-.ernmental Activities
lm.estments 100,241,404 64,076,360 35,696,917 133,000
Business-type activities: U.S.Treasury Notes 1 ,400,666 395,018 754,638 334,000
U.S. Treasury Bonds 28,711 19,000
U.S.Agencies 17,338,470 382,353 1,010,217 15,953,547
Corporate Notes 296,525 291,228
Commercial Paper 206,028 207,216
lm-estment Agreements 1,646,285 382,062 1,264,223
Money Market Sa\oings
Accounts 27,306,667 27,306,667
Bank Money Market
Accounts 1,849,495 1,849,495
State of Delaware
tm.-estment Pool 14 14
Total Business-type Activities
ln-..estments 50,072,861 30,140,763 2,056,083 735,062 17,217,770
Total Entitiy-wide
ln...estments $ 150,314,265 $ 94,217,123 $ 37,753,000 $ $ 868,062 $ 17,217,770
Fiduciary Fund Investments:
U.S_ Treasury Notes $ 1,234,094 $ 551,000 $ 675,000 $ $ $
U.S.Agencies 1 ,359,116 285,000 1,040,000
Commercial Paper 545,624 550,000
Bank Money Market
Accounts 10,485 10,485
Total Fiduciary Fund
ln-..estments $ 3,149,319 $ 1,396,485 $ 1,715,000 $ $ $
37
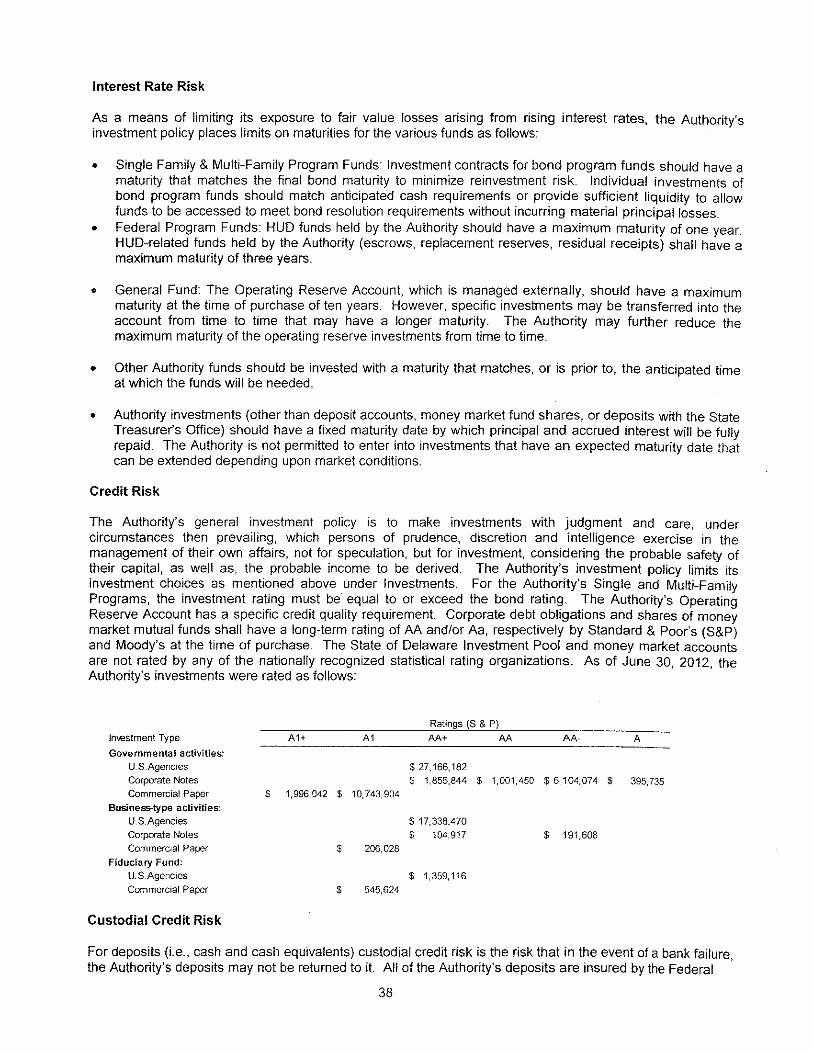
Interest Rate Risk
As a means of limiting its exposure to fair value losses arising from rising interest rates, the Authority's investment policy places limits on maturities for the various funds as follows:
• Single Family & Multi-Family Program Funds: Investment contracts for bond program funds should have a maturity that matches the final bond maturity to minimize reinvestment risk. Individual investments of bond program funds should match anticipated cash requirements or provide sufficient liquidity to allow funds to be accessed to meet bond resolution requirements without incurring material principal losses.
• Federal Program Funds: HUD funds held by the Authority should have a maximum maturity of one year. HUD-related funds held by the Authority (escrows, replacement reserves, residual receipts) shall have a maximum maturity of three years.
• General Fund: The Operating Reserve Account, which is managed externally, should have a maximum maturity at the time of purchase of ten years. However, specific investments may be transferred into the account from time to time that may have a longer maturity. The Authority may further reduce the maximum maturity of the operating reserve investments from time to time.
• Other Authority funds should be invested with a maturity that matches, or is prior to, the anticipated time at which the funds will be needed.
• Authority investments (other than deposit accounts, money market fund shares, or deposits with the State Treasurer's Office) should have a fixed maturity date by which principal and accrued interest will be fully repaid. The Authority is not permitted to enter into investments that have an expected maturity date that can be extended depending upon market conditions.
Credit Risk
The Authority's general investment policy is to make investments with judgment and care, under circumstances then prevailing, which persons of prudence, discretion and intelligence exercise in the management of their own affairs, not for speculation, but for investment, considering the probable safety of their capital, as well as, the probable income to be derived. The Authority's investment policy limits its investment choices as mentioned above under Investments. For the Authority's Single and Multi-Family Programs, the investment rating must be equal to or exceed the bond rating. The Authority's Operating Reserve Account has a specific credit quality requirement. Corporate debt obligations and shares of money market mutual funds shall have a long-term rating of AA and/or Aa, respectively by Standard & Poor's (S&P) and Moody's at the time of purchase. The State of Delaware Investment Pool and money market accounts are not rated by any of the nationally recognized statistical rating organizations. As of June 30, 2012, the Authority's investments were rated as follows:
Investment Type
Governmental activities: U.S.Agencies
Corporate Notes Commercial Paper
Business-type activities: U.S.Agencies Corporate Notes Commercial Paper
Fiduciary Fund: U.S.Agencies Commercial Paper
Custodial Credit Risk
A1+ A1
$ 1,996,042 $ 10,743,904
$ 206,028
$ 545,624
Ratings (S & P)
AA+ AA AA· A
$ 27,166,182
$ 1,856,844 $ 1,001,450 $6,104,074 $ 395,735
$ 17,338,470 $ 104,917
$ 1,359,116
$ 191,608
For deposits (i.e., cash and cash equivalents) custodial credit risk is the risk that in the event of a bank failure, the Authority's deposits may not be returned to it. All of the Authority's deposits are insured by the Federal
38
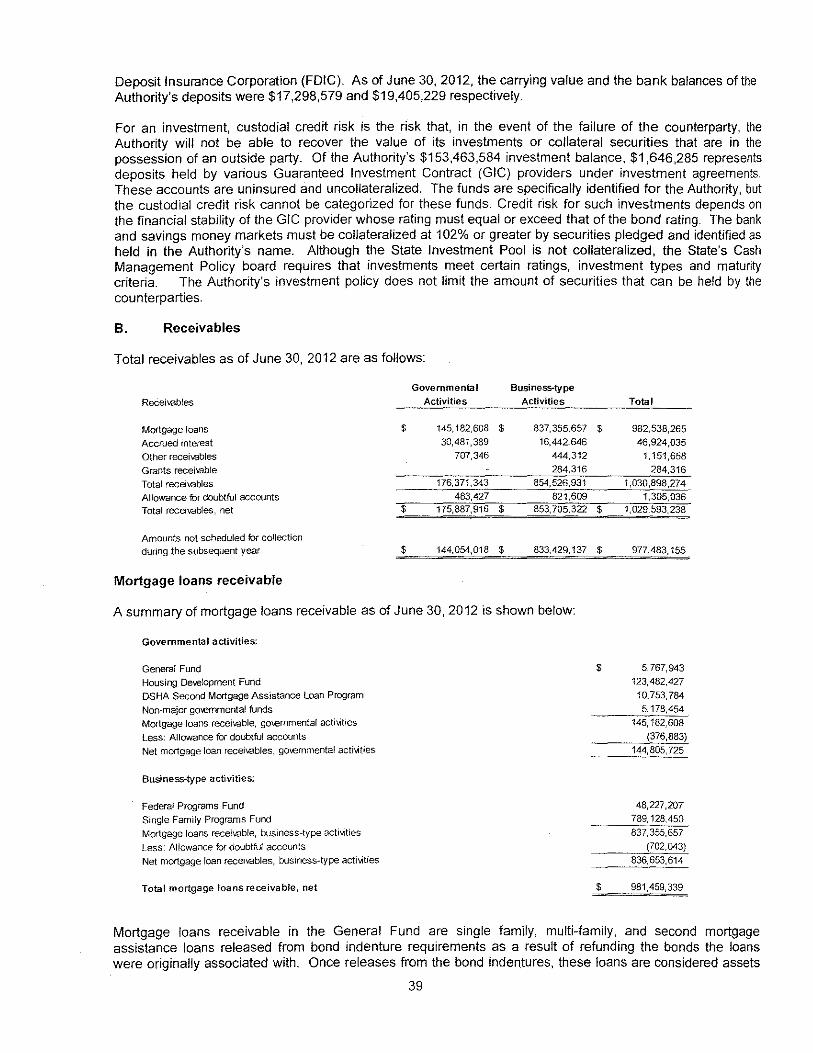
Deposit Insurance Corporation (FDIC). As of June 30,2012, the carrying value and the bank balances of the Authority's deposits were $17,298,579 and $19,405,229 respectively.
For an investment, custodial credit risk is the risk that, in the event of the failure of the counterparty, the Authority will not be able to recover the value of its investments or collateral securities that are in the possession of an outside party. Of the Authority's $153,463,584 investment balance, $1,646,285 represents deposits held by various Guaranteed Investment Contract (GIC) providers under investment agreements. These accounts are uninsured and uncollateralized. The funds are specifically identified for the Authority, but the custodial credit risk cannot be categorized for these funds. Credit risk for such investments depends on the financial stability of the GIC provider whose rating must equal or exceed that of the bond rating. The bank and savings money markets must be collateralized at 102% or greater by securities pledged and identified as held in the Authority's name. Although the State Investment Pool is not collateralized, the State's Cash Management Policy board requires that investments meet certain ratings, investment types and maturity criteria. The Authority's investment policy does not limit the amount of securities that can be held by the counterparties.
B. Receivables
Total receivables as of June 30, 2012 are as follows:
Governmental Business-type
Receivables Activities Activities
Mortgage loans $ 145,182,608 $ 837,355,657
Accrued interest 30,481,389 16,442,646
Other receivables 707,346 444,312
Grants receivable 284,316
Total receivables 176,371' 343 854,526,931
Allowance for doubtful accounts 483,427 821,609
Total receivables, net $ 175,887,916 $ 853,705,322
Amounts not scheduled for collection during the subsequent year $ 144,054,018 $ 833,429, 137
Mortgage loans receivable
A summary of mortgage loans receivable as of June 30, 2012 is shown below:
Governmental activities:
General Fund
Housing Development Fund OSHA Second Mortgage Assistance Loan Program Non-major go1.emmental funds Mortgage loans receivable, go1.emmental acti~Aties Less: Allowance for doubtful accounts Net mortgage loan receivables, governmental acti~Aties
Business-type activities:
Federal Programs Fund Single Family Programs Fund Mortgage loans receivable, business-type acti~Aties Less: Allowance for doubtful accounts Net mortgage loan receivables, business-type acti~Aties
Total mortgage loans receivable, net
$
$
$
$
$
Total
982,538,265
46,924,035
1,151,658
284,316
1,030,898,274
1,305,036 1,029,593,238
977,483,155
5,767,943
123,482,427
10,753,784
5,178,454
145,182,608
(376,883)
144,805,725
48,227,207
789, 128,450
837,355,657
(702,043)
836,653,614
981,459,339
Mortgage loans receivable in the General Fund are single family, multi-family, and second mortgage assistance loans released from bond indenture requirements as a result of refunding the bonds the loans were originally associated with. Once releases from the bond indentures, these loans are considered assets
39
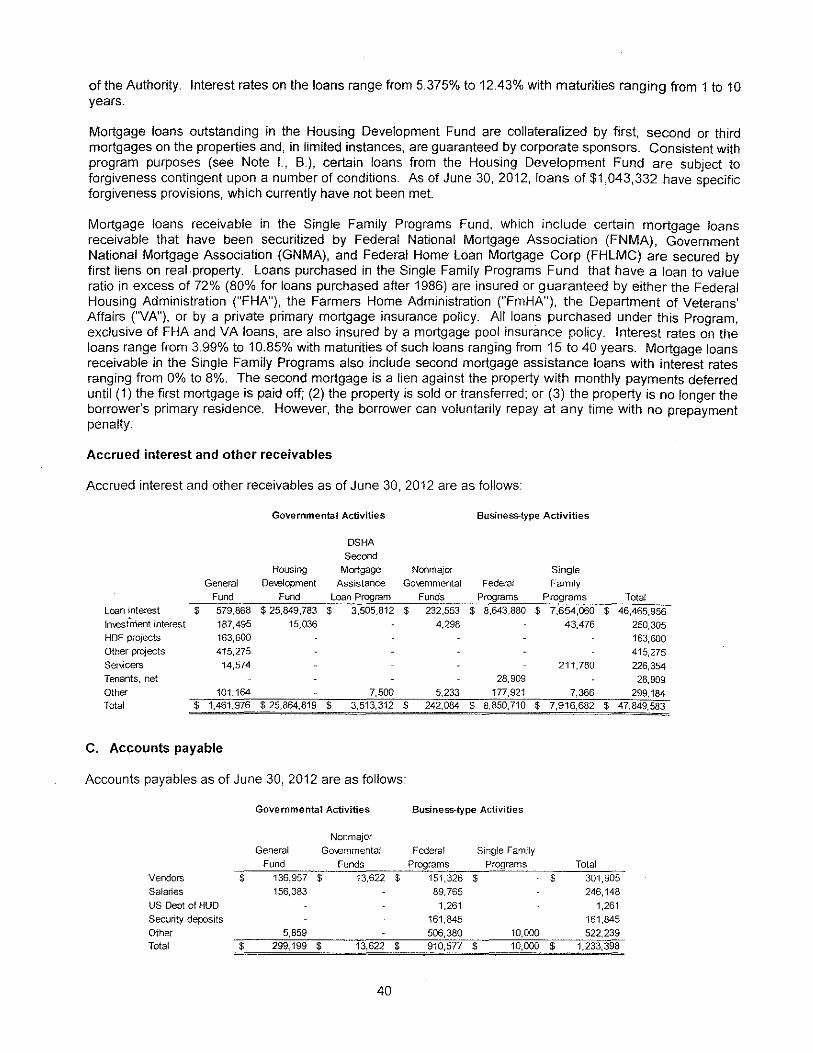
of the Authority. Interest rates on the loans range from 5.375% to 12.43% with maturities ranging from 1 to 10 years.
Mortgage loans outstanding in the Housing Development Fund are collateralized by first, second or third mortgages on the properties and, in limited instances, are guaranteed by corporate sponsors. Consistent with program purposes (see Note 1., B.), certain loans from the Housing Development Fund are subject to forgiveness contingent upon a number of conditions. As of June 30, 2012, loans of $1,043,332 have specific forgiveness provisions, which currently have not been met
Mortgage loans receivable in the Single Family Programs Fund, which include certain mortgage loans receivable that have been securitized by Federal National Mortgage Association (FNMA), Government National Mortgage Association (GNMA), and Federal Home Loan Mortgage Corp (FHLMC) are secured by first liens on real property. Loans purchased in the Single Family Programs Fund that have a loan to value ratio in excess of 72% (80% for loans purchased after 1986) are insured or guaranteed by either the Federal Housing Administration ("FHA"), the Farmers Home Administration ("FmHA"), the Department of Veterans' Affairs ("VA"), or by a private primary mortgage insurance policy. All loans purchased under this Program, exclusive of FHA and VA loans, are also insured by a mortgage pool insurance policy. Interest rates on the loans range from 3.99% to 10.85% with maturities of such loans ranging from 15 to 40 years. Mortgage loans receivable in the Single Family Programs also include second mortgage assistance loans with interest rates ranging from 0% to 8%. The second mortgage is a lien against the property with monthly payments deferred until (1) the first mortgage is paid off; (2) the property is sold or transferred; or (3) the property is no longer the borrower's primary residence. However, the borrower can voluntarily repay at any time with no prepayment penalty.
Accrued interest and other receivables
Accrued interest and other receivables as of June 30, 2012 are as follows:
Governmental Activities Business-type Activities
OSHA Second
Housing Mortgage Nonmajor Single General Oe-..elopment Assistance Go\€mmental Federal Family
Fund Fund Loan Program Funds Programs Programs Total Loan interest $ 579,868 $ 25,849,783 $ 3,505,812 $ 232,553 $ 8.643,880 $ 7,654,060 $ 46,465,956
ln\€St"inent interest 187,495 15,036 4,298 43,476 250,305 HDF projects 163,600 163,600 Other projects 415,275 415,275 Ser.icers 14,574 211,780 226,354 Tenants, net 28,909 28,909 Other 101,164 7,500 5,233 177,921 7,366 299,184 Total $ 1,461,976 $ 25,864,819 $ 3,513,312 $ 242,084 $ 8.850,710 $ 7,916,682 $ 47,849,583
C. Accounts payable
Accounts payables as of June 30, 2012 are as follows:
Governmental Activities Business-type Activities
Nonmajor
General Go\.emmental Federal Single Family
Fund Funds Programs Programs Total
Vendors $ 136,957 $ 13.622 $ 151,326 $ $ 301,905
Salaries 156,383 89.765 246,148 US Dept of HUO 1,261 1,261
Security deposits 161,845 161,845
Other 5,859 506,380 10,000 522,239 Total $ 299,199 $ 13,622 $ 910,577 $ 10,000 $ 1,233,398
40
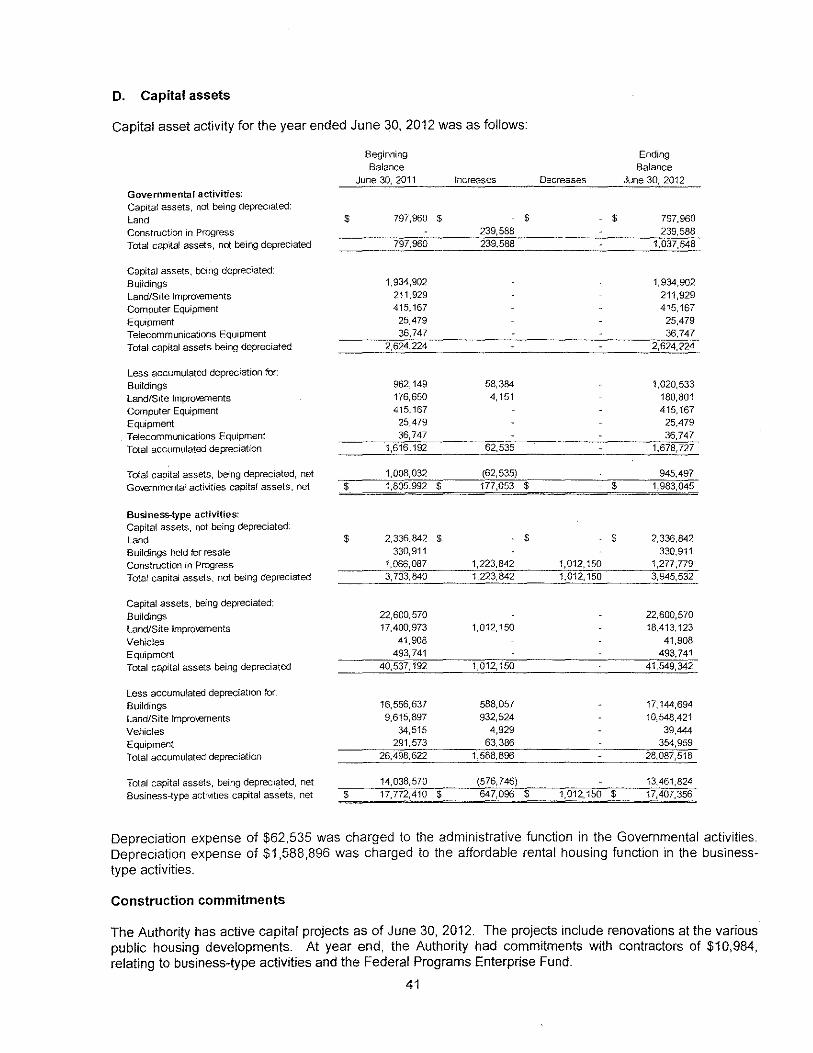
D. Capital assets
Capital asset activity for the year ended June 30. 2012 was as follows:
Governmental activities: Capital assets, not being depreciated:
Land Construction in Progress Total capital assets, not being depreciated
Capital assets. being depreciated
Buildings Land/Site Improvements
Computer Equipment
Equipment Telecommunications Equipment Total capital assets being depreciated
Less accumulated depreciation for:
Buildings Land/Site lmpro-..ements
Computer Equipment Equipment Telecommunications Equipment
Total accumulated depreciation
Total capital assets, being depreciated, net Gmernmental acti\iities capital assets, net
Business-type activities: Capital assets, not being depreciated:
Land Buildings held for resale
Construction in Progress Total capital assets, not being depreciated
Capital assets, being depreciated:
Buildings Land/Site lmpro~.ements
Vehicles
Equipment Total capital assets being depreciated
Less accumulated depreciation for.
Buildings
Land/Site tmpro~.ements
Vehicles
Equipment Total accumulated depreciation
Total capital assets, being depreciated, net Business-type activities capital ass.ets, net
$
$
$
$
Beginning
Balance
June 30, 2011
797,960 $
797,960
1,934,902
211,929 415,167
25,479 36,747
2,624,224
962,149
176,650 415,167
25,479
36,747 1,616,192
1,008,032 1,805,992 $
2,336,842 $ 330,911
1,066,087 3,733,840
22,600,570
17,400,973 41,908
493,741
40,537,192
16,556,637
9,615,897
34,515 291,573
26,498,622
14,038,570
17,772,410 $
Increases
239,588 239,588
58,384
4,151
62,535
$
(62,535)
177,053 $
1,223,842
1,223,842
1,012,150
1,012,150
588,057
932,524
4,929 63,386
1,588,896
$
(576,746)
647,096 $
Decreases
$
$
$
1,012,150 1,012,150
1,012,150 $
Ending
Balance
June 30, 2012
797,960
239,588 1,037,548
1,934,902
211,929 415,167
25,479 36,747
2,624,224
1,020,533 180,801 415,167
25,479 36,747
1,678,727
945,497
1,983,045
2,336,842 330,911
1,277,779 3,945,532
22,600,570
18,413,123
41,908 493,741
41,549,342
17,144,694
10,548,421
39,444
354,959 28,087,518
13,461,824
17,407,356
Depreciation expense of $62,535 was charged to the administrative function in the Governmental activities. Depreciation expense of $1,588,896 was charged to the affordable rental housing function in the businesstype activities.
Construction commitments
The Authority has active capital projects as of June 30, 2012. The projects include renovations at the various public housing developments. At year end, the Authority had commitments with contractors of $10,984, relating to business-type activities and the Federal Programs Enterprise Fund.
41
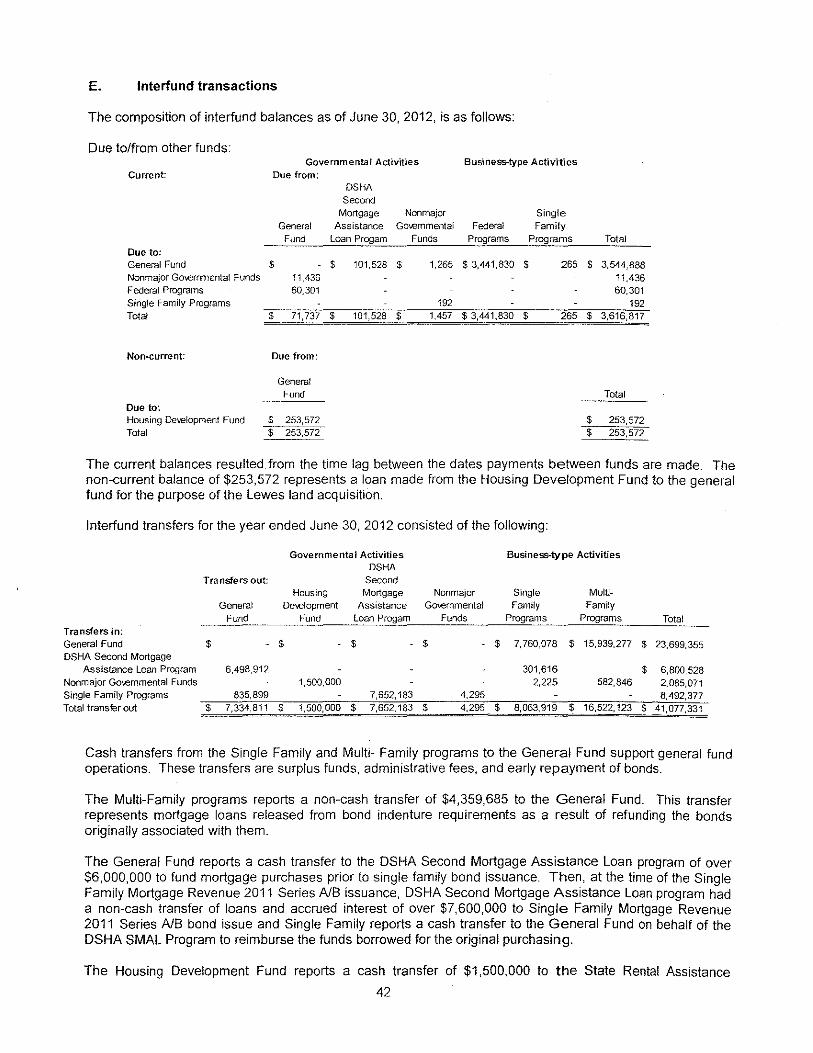
E. lnterfund transactions
The composition of interfund balances as of June 30, 2012, is as follows:
Due to/from other funds:
Current
Due to: General Fund Nonmajor Gm.ernmental Funds Federal Programs Single Family Programs Total
Non.current:
Due to: Housing Oe\€lopment Fund Total
Governmental Activities Due from:
OSHA Second
Mortgage Nonmajor General Assistance Go\€mmental
Fund Loan Progam Funds
$ $ 101,528 $ 1,265 11,436
60,301 192
$ 71,737 $ 101,528 $ 1,457
Due from:
General Fund
$ 253,572 $ 253,572
Business..type Activities
Single Federal Family
Programs Programs
$ 3,441,830 $ 265
$ 3,441,830 $ 265
Total
$ 3,544,888 11,436 60,301
192 $ 3,616,817
Total
$ 253,572 $ 253,572
The current balances resulted from the time lag between the dates payments between funds are made. The non-current balance of $253,572 represents a loan made from the Housing Development Fund to the general fund for the purpose of the Lewes land acquisition.
lnterfund transfers for the year ended June 30, 2012 consisted of the following:
Governmental Activities Business--type Activities OSHA
Transfers out: Second Housing Mortgage Nonmajor Single Multi-
General De-..elopment Assistance Go-.ernmental Family Family Fund Fund loan Progam Funds Programs Programs Total
Transfers in: General Fund $ $ $ $ $ 7,760,078 $ 15,939,277 $ 23,699,355 OSHA Second Mortgage
Assistance loan Program 6,498,912 301,616 $ 6,800,528 Nonmajor Go~.emmental Funds 1,500,000 2,225 582,846 2,085,071 Single Family Programs 835,899 7,652,183 4,295 8,492,377 Total transfer out $ 7,334,811 $ 1,500,000 $ 7,652,183 $ 4,295 $ 8,063,919 $ 16,522,123 $ 41,077,331
Cash transfers from the Single Family and Multi- Family programs to the General Fund support general fund operations. These transfers are surplus funds, administrative fees, and early repayment of bonds.
The Multi-Family programs reports a non-cash transfer of $4,359,685 to the General Fund. This transfer represents mortgage loans released from bond indenture requirements as a result of refunding the bonds originally associated with them.
The General Fund reports a cash transfer to the OSHA Second Mortgage Assistance Loan program of over $6,000,000 to fund mortgage purchases prior to single family bond issuance. Then, at the time of the Single Family Mortgage Revenue 2011 Series AlB issuance, OSHA Second Mortgage Assistance Loan program had a non-cash transfer of loans and accrued interest of over $7,600,000 to Single Family Mortgage Revenue 2011 Series AlB bond issue and Single Family reports a cash transfer to the General Fund on behalf of the OSHA SMAL Program to reimburse the funds borrowed for the original purchasing.
The Housing Development Fund reports a cash transfer of $1,500,000 to the State Rental Assistance
42
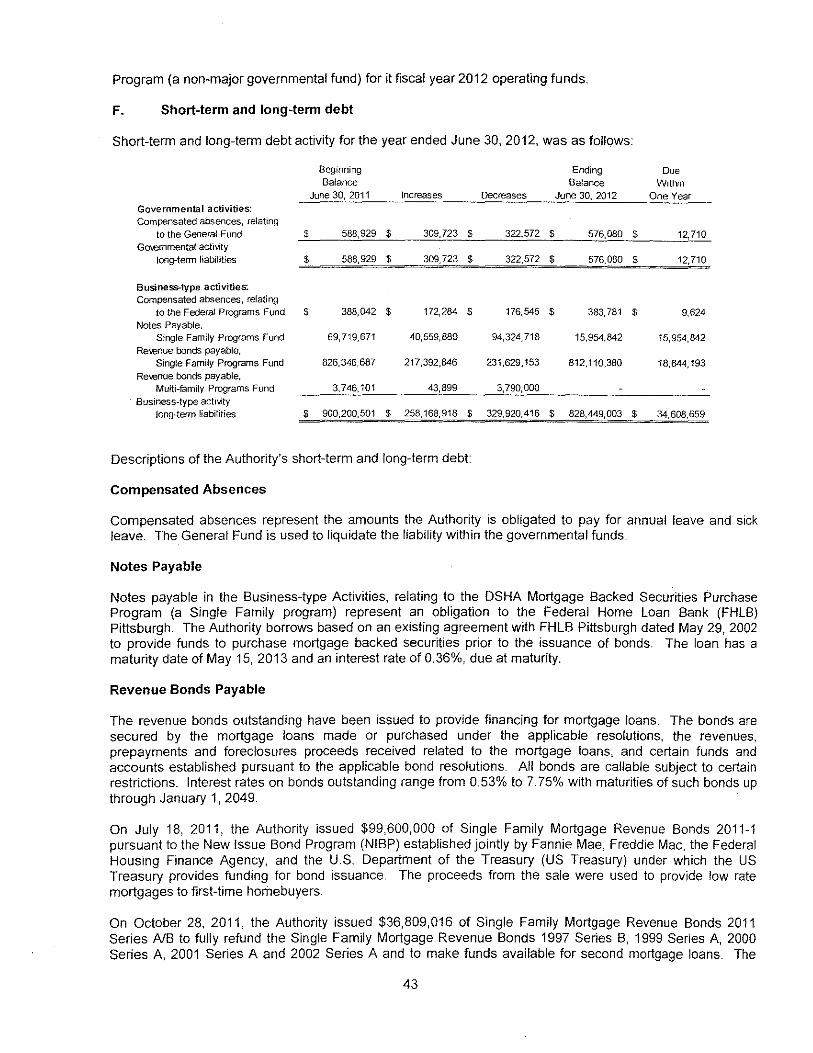
Program (a non-major governmental fund) for it fiscal year 2012 operating funds.
F. Short-term and long-term debt
Short-term and long-term debt activity for the year ended June 30, 2012, was as follows:
Beginning Ending Oue Balance Balance Within
June 30, 2011 Increases Decreases June 30, 2012 One Year Governmental activities: Compensated absences, relating
to the General Fund $ 588,929 $ 309,723 $ 322,572 $ 576,080 $ 12,710 Gmemmenta! acf1\oity
long-term liabilities $ 588,929 $ 309,723 $ 322,572 $ 576,080 $ 12,710
Business-type activities. Compensated absences, relating
to the Federal Programs Fund $ 388,042 $ 172,284 $ 176,545 $ 383,781 $ 9,624 Notes Payable,
Single Family Programs Fund 69,719,671 40,559,889 94,324,718 15,954,842 15,954,842 Re-..enue bonds payable,
Single Family Programs Fund 826,346,687 217,392,846 231,629,153 812,110,380 18,844,193 Re-..enue bonds payable,
Multi-family Programs Fund 3,746,101 43,899 3,790,000
Business-type acti'.ity long-term liabilities $ 900,200,501 $ 258,168,918 $ 329,920,416 $ 828,449,003 $ 34,608,659
Descriptions of the Authority's short-term and long-term debt:
Compensated Absences
Compensated absences represent the amounts the Authority is obligated to pay for annual leave and sick leave. The General Fund is used to liquidate the liability within the governmental funds.
Notes Payable
Notes payable in the Business-type Activities, relating to the OSHA Mortgage Backed Securities Purchase Program (a Single Family program) represent an obligation to the Federal Home Loan Bank (FHLB) Pittsburgh. The Authority borrows based on an existing agreement with FHLB Pittsburgh dated May 29, 2002 to provide funds to purchase mortgage backed securities prior to the issuance of bonds. The loan has a maturity date of May 15, 2013 and an interest rate of 0.36%, due at maturity.
Revenue Bonds Payable
The revenue bonds outstanding have been issued to provide financing for mortgage loans. The bonds are secured by the mortgage loans made or purchased under the applicable resolutions, the revenues, prepayments and foreclosures proceeds received related to the mortgage loans, and certain funds and accounts established pursuant to the applicable bond resolutions. All bonds are callable subject to certain restrictions. Interest rates on bonds outstanding range from 0.53% to 7. 75% with maturities of such bonds up through January 1, 2049.
On July 18, 2011, the Authority issued $99,600,000 of Single Family Mortgage Revenue Bonds 2011-1 pursuant to the New Issue Bond Program (NIBP) established jointly by Fannie Mae, Freddie Mac, the Federal Housing Finance Agency, and the U.S. Department of the Treasury (US Treasury) under which the US Treasury provides funding for bond issuance. The proceeds from the sale were used to provide low rate mortgages to first-time homebuyers.
On October 28, 2011, the Authority issued $36,809,016 of Single Family Mortgage Revenue Bonds 2011 Series NB to fully refund the Single Family Mortgage Revenue Bonds 1997 Series B, 1999 Series A, 2000 Series A, 2001 Series A and 2002 Series A and to make funds available for second mortgage loans. The
43
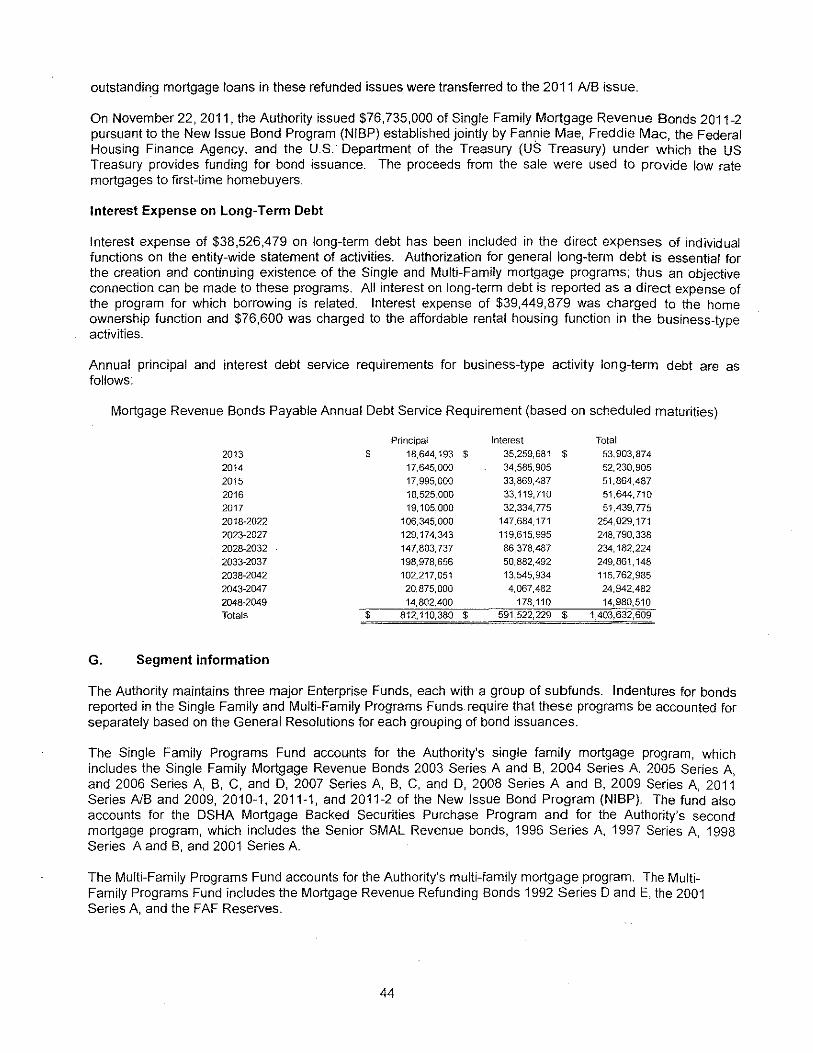
outstanding mortgage loans in these refunded issues were transferred to the 2011 NB issue.
On November 22, 2011, the Authority issued $76,735,000 of Single Family Mortgage Revenue Bonds 2011-2 pursuant to the New Issue Bond Program (NIBP) established jointly by Fannie Mae, Freddie Mac, the Federal Housing Finance Agency, and the U.S. Department of the Treasury (US Treasury) under which the us Treasury provides funding for bond issuance. The proceeds from the sale were used to provide low rate mortgages to first-time homebuyers.
Interest Expense on Long-Term Debt
Interest expense of $38,526,479 on long-term debt has been included in the direct expenses of individual functions on the entity-wide statement of activities. Authorization for general long-term debt is essential for the creation and continuing existence of the Single and Multi-Family mortgage programs; thus an objective connection can be made to these programs. All interest on long-term debt is reported as a direct expense of the program for which borrowing is related. Interest expense of $39,449,879 was charged to the home ownership function and $76,600 was charged to the affordable rental housing function in the business-type activities.
Annual principal and interest debt service requirements for business-type activity long-term debt are as follows:
Mortgage Revenue Bonds Payable Annual Debt Service Requirement (based on scheduled maturities)
2013 2014 2015 2016 2017 2018-2022 2023-2027 202~2032
2033-2037 2038-2042 2043-2047 2048-2049 Totals
G. Segment information
$
$
Principal 18,644,193 $ 17,645,000
17,995,000
18,525,000 19,105,000
106,345,000
129,174,343
147,803,737
198,978,656
102,217,051 20,875,000
14,802,400 812,110,380 $
Interest Total 35,259,681 $ 53,903,874
34,585,905 52,230,905
33,869,487 51,864,487
33,119,710 51,644,710 32,334,775 51,439,775
147,684,171 254,029,171
119,615,995 248,790,338
86,378,487 234,182,224
50,882,492 249,861,148
13,545,934 115,762,985
4,067,482 24,942,482 178,110 14,980,510
591,522,229 $ 1,403,632,609
The Authority maintains three major Enterprise Funds, each with a group of subfunds. Indentures for bonds reported in the Single Family and Multi-Family Programs Funds require that these programs be accounted for separately based on the General Resolutions for each grouping of bond issuances.
The Single Family Programs Fund accounts for the Authority's single family mortgage program, which includes the Single Family Mortgage Revenue Bonds 2003 Series A and B, 2004 Series A, 2005 Series A, and 2006 Series A, B, C, and D, 2007 Series A, B, C, and D, 2008 Series A and B, 2009 Series A, 2011 Series NB and 2009, 2010-1,2011-1, and 2011-2 of the New Issue Bond Program (NIBP). The fund also accounts for the DSHA Mortgage Backed Securities Purchase Program and for the Authority's second mortgage program, which includes the Senior SMAL Revenue bonds, 1996 Series A, 1997 Series A, 1998 Series A and B, and 2001 Series A
The Multi-Family Programs Fund accounts for the Authority's multi-family mortgage program. The MultiFamily Programs Fund includes the Mortgage Revenue Refunding Bonds 1992 Series D and E, the 2001 Series A, and the FAF Reserves.
44
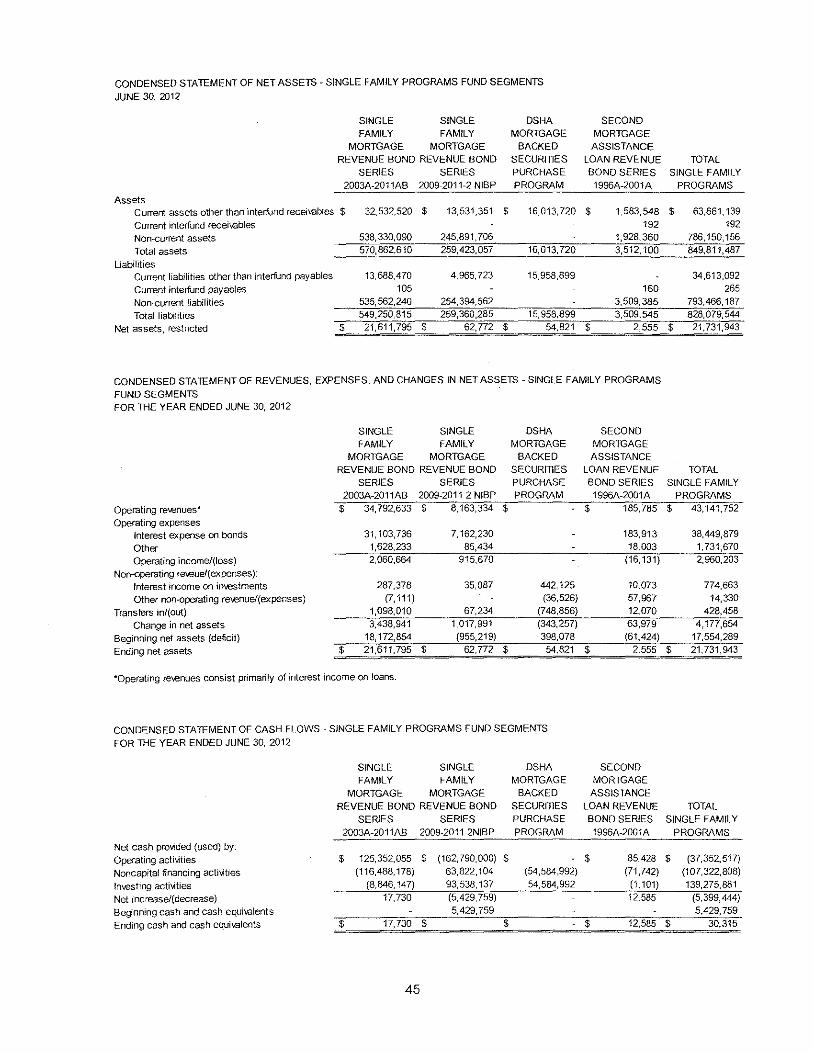
CONDENSED STATEMENT DF NET ASSETS- SINGLE FAMILY PROGRAMS FUND SEGMENTS
JUNE 30, 2012
SINGLE SINGLE DSHA SECOND
FAMILY FAMILY MORTGAGE MORTGAGE
MORTGAGE MORTGAGE BACKED ASSISTANCE
REVENUE BOND REVENUE BOND SECUR111ES LOAN REVENUE
SERIES SERIES PURCHASE BOND SERIES
2003A-2011AB 2009-2011-2 NIBP PROGRAM 1996A-2001A
Assets Current assets other than interfund receivables $ 32,532,520 $ 13,531,351 $ 16,013,720 $ 1,583,548
Current interfund receivables 192
Non-current assets 538,330,090 245,891 '706 1,928,360
Total assets 570,862,610 259,423,057 16,013,720 3,512,100
Liabilities Current liabilities other than interfund pay abies 13,688,470 4,965,723 15,958,899
Current interfund payables 105 160
Non-current liabilities 535,562,240 254,394,562 3,509,385
Total liabilities 549,250,815 259,360,285 15,958,899 3,509,545
Net assets, restricted $ 21,611,795 $ 62,772 $ 54,821 $ 2,555
CONDENSED STATEMENT OF REVENUES, EXPENSES, AND CHANGES IN NET ASSETS -SINGLE FAMILY PROGRAMS
FUND SEGMENTS FOR THE YEAR ENDED JUNE 30, 2012
SINGLE SINGLE OSHA
FAMILY FAMILY MORTGAGE
MORTGAGE MORTGAGE BACKED
REVENUE BOND REVENUE BOND SECURITlES
SERIES SERIES PURCHASE
2003A-2011AB 2009-2011-2 NIBP PROGRAM
Operating re\enues* $ 34,792,633 $ 8,163,334 $
Operating expenses Interest expense on bonds 31,103,736 7,162,230
Other 1,628,233 85,434
Operating income/(loss) 2,060,664 915,670
Non-operating re\eue/(expenses):
Interest income on investments 287,378 35,087 442,125
Other non-operating re-.enuef(expenses} (7, 111) (36,526)
Transfers int(out) 1,098,010 67,234 (748,856)
Change in net assets 3,438,941 1,017,991 (343,257)
Beginning net assets (deficit) 18,172,854 (955,219) 398,078
Ending net assets $ 21,611,795 $ 62,772 $ 54,821
"'Operating re-.enues consist primarily of interest income on loans.
CONDENSED STATEMENT OF CASH FLOWS -SINGLE FAMILY PROGRAMS FUND SEGMENTS
FOR THE YEAR ENDED JUNE 30, 2012
SINGLE SINGLE OSHA
FAMILY FAMILY MORTGAGE
MORTGAGE MORTGAGE BACKED
REVENUE BOND REVENUE BOND SECURITlES
SERIES SERIES PURCHASE
2003A-2011AB 2009-2011-2NtBP PROGRAM
Net cash pro\>ided (used} by:
Operating activities $ 125,352,055 $ (162,790,000) $ Noncapitat financing activities (116,488,178) 63,822,104 (54,584,992)
!n-.esting activities (8,846, 147) 93,538,137 54,584,992
Net increase/(decrease} 17,730 (5,429,759)
Beginning cash and cash equivalents 5,429,759
Ending cash and cash equivalents $ 17,730 $ $
45
SECOND MORTGAGE
ASSISTANCE
LOAN REVENUE
BOND SERIES
1996A-2001A
$ 185,785
183,913
18,003
(16, 131)
10,073
57,967
12,070
63,979
(61,424)
$ 2,555
SECOND
MORTGAGE
ASSISTANCE
LOAN REVENUE
BONO SERIES
1996A-2001A
$ 85,428
(71,742)
(1, 101)
12,585
$ 12,585
TCTAL
SINGLE FAMILY
PROGRAMS
$ 63,661,139 192
786,150,156 849,811,487
34,613,092
265
793,466,187
828,079,544
$ 21,731,943
TOTAL
SINGLE FAMILY
PROGRAMS
$ 43,141,752
38,449,879
1,731,670
2,960,203
774,663 14,330
428,458
4,177,654
17,554,289
$ 21,731,943
TOTAL SINGLE FAMILY
PROGRAMS
$ (37,352,517)
(107,322,808)
139,275,881
(5,399,444)
5,429,759
$ 30,315
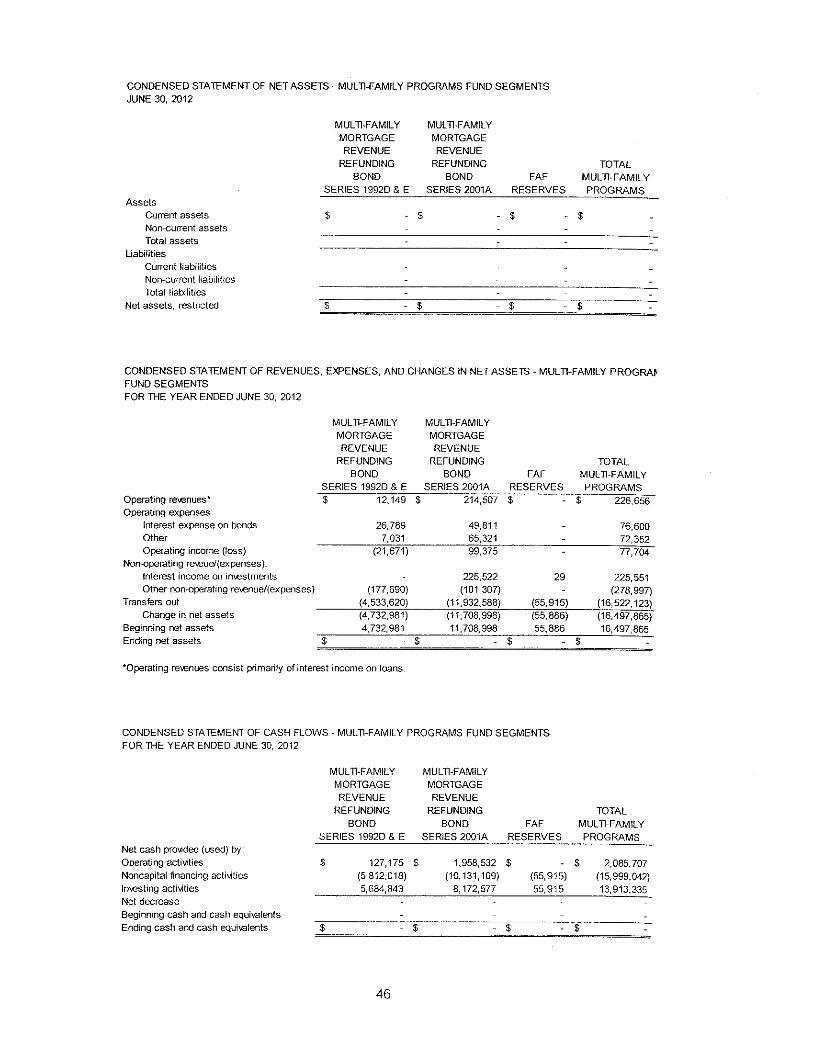
CONDENSED STA1EMENT OF NET ASSETS- MUL11-FAMILY PROGRAMS FUND SEGMENTS JUNE 30, 2012
Assets Current assets Non-current assets Total assets
Liabilities Current liabilities
Non-current liabilities
Total liabilities
Net assets, restricted
MUL 11-FAMILY MORTGAGE
REVENUE
REFUNDING BOND
SERIES 19920 & E
$
$
MUL11-FAMILY
MORTGAGE
REVENUE
REFUNDING
BOND FAF
SERIES 2001A RESERVES
$ $
$ $
TOTAL
MUL 11-FAMIL Y
PROGRAMS
$
$
CONDENSED STA 1EMENT OF REVENUES, EXPENSES, AND CHANGES IN NET ASSETS - MUL 11-FAMILY PROGRA~ FUND SEGMENTS
FOR THE YEAR ENDED JUNE 30, 2012
Operating revenues*
Operating expenses Interest expense on bonds
Other Operating income (loss)
Non-operating re~.eue/(expenses):
Interest income on in-..estments
Other non-operating re-.enue/(expenses)
Transfers out
Change in net assets Beginning net assets Ending net assets
MULTI-FAMILY
MORTGAGE
REVENUE REFUNDING
BONO
SERIES 19920 & E
$ 12,149
26,789
7,031 (21 ,671}
(177,690}
(4,533,620} (4,732,981)
4,732,981
$
*Operating re...enues consist primarily of interest income on loans_
MULTI-FAMILY
MORTGAGE
REVENUE
REFUNDING
BOND FAF SERIES 2001A RESERVES
$ 214,507 $
49,811 65,321
99,375
225,522 29 (101,307}
(11,932,588} (55,915)
(11,708,998) (55,886)
11,708,998 55,886
$ $
CONDENSED STA 1EMENT OF CASH FLOWS - MUL 11-FAMIL Y PROGRAMS FUND SEGMENTS
FOR lHE YEAR ENDED JUNE 30, 2012
Net cash provided (used) by:
Operating activities
Noncapital financing activities
ln-..esting acti\oities
Net decrease
Beginning cash and cash equivalents
Ending cash and cash equivalents
MULTI-FAMILY
MORTGAGE
REVENUE
REFUNDING
BOND
SERIES 19920 & E
$ 127,175
(5,812,018)
5,684,843
$
46
MUL11-FAMILY
MORTGAGE
REVENUE
REFUNDING
BOND FAF
SERIES 2001A RESERVES
$ 1,958,532 $ (10,131,109) (55,915)
8,172,577 55,915
$ $
TOTAL
MULTI-FAMILY PROGRAMS
$ 226,656
76,600 72,352 77,704
225,551 (278,997)
(16,522, 123)
(16,497,865)
16,497,865 $
TOTAL
MULTI-FAMILY
PROGRAMS
$ 2,085,707
(15,999,042)
13,913,335
$
V. OTHER INFORMATION
A. Risk management
The Authority is exposed to various risks of loss related to workers' compensation, non-state employee health care and accident, automobile, and property and casualty claims. The latter discussion of post-retirement health care benefits defines state and non-state employees. These risks are covered by commercial insurance purchased from independent third parties. Settled claims from these risks have not exceeded commercial insurance coverage for the past three years.
The Authority, as a public corporation, is responsible for all risk liabilities associated with its operations, with the exception that employees in state-owned vehicles and its offices in the Carvel State Office Building are covered by the State of Delaware. Over the past five years, the Authority insurance premiums have ranged between $160,000, and $180,000. The top four policies by premium amount were: commercial property, workers compensation, director and officer liability, and auto. The Authority's retained risk, meaning insurance deductible outlays through self insurance, has ranged from $25,000 to $50,000 per year. The primary insurance coverage was $41 million (with $25,000 deductible) for property insurance; up to $4.0 million (with $10,000 deductible) for genera/liability insurance; up to $3.0 million (with $1,000 deductible) for auto insurance; and $1.0 million (with $50,000 deductible) for director and officer liability insurance.
B. Related organizations and related party transactions
Organizations for which the Authority appoints all or some of the governing boards, but for which it is not financially accountable, are considered to be related organizations. Delaware Housing Partnership Corporation (DHP), Huling Cove Housing Corporation (HCHC), and Wexford Village Housing Corporation (WVHC) are related organizations of the Authority. Accordingly, financial information for these three entities is excluded from the Authority's financial statements.
During the Year Ended June 30, 2012, DHP and HCHC were under agreement with the Authority for the management of their operations. For the Year Ended June 30, 2012, DHP and HCHC paid management fees to the Authority totaling $60,000 and $35,295, respectively.
As of June 30, 2012, HCHC and WVHC were indebted to the Authority for Housing Development Fund loans in the amounts of $3,597,469 and $2,035,979, respectively.
For the Year Ended June 30, 2012, Section 8 Contract Administration housing assistance payments totaling $325,704 from the US Dept. of HUD passed through the Authority to HCHC.
C. Economic dependency
During the Year Ended June 30, 2012, the Authority's business-type activities received 57.7 percent of its revenue from the U.S. Department of Housing and Urban Development (HUD).
D. Post-retirement health care benefits
State Employees
Authority state employees are hired by the Authority through the State of Delaware Office of Personnel and are eligible for State of Delaware employee benefits. The State provides post-retirement health care benefits, in accordance with the State statutes, to all State employees of the Authority who retire from the State after meeting the eligibility requirements. Please refer to the State Comprehensive Annual Financial Report (CAFR) for post-retirement health care benefits. A copy of the CAFR may be obtained by writing to The State of Delaware, Department of Finance, Division of Accounting, 820 Silver Lake Boulevard, Dover, DE 19904; calling 1-302-672-5505; or visiting: http//accounting.delaware.gov.
The Authority's contribution to the State of Delaware Employees' Pension Plan, a cost-sharing, multipleemployer defined benefit public employees retirement system (the "State PERS"), for post-retirement health care benefits for the Year Ended June 30, 2012 was $84,587, equal to the required contribution for the year.
47
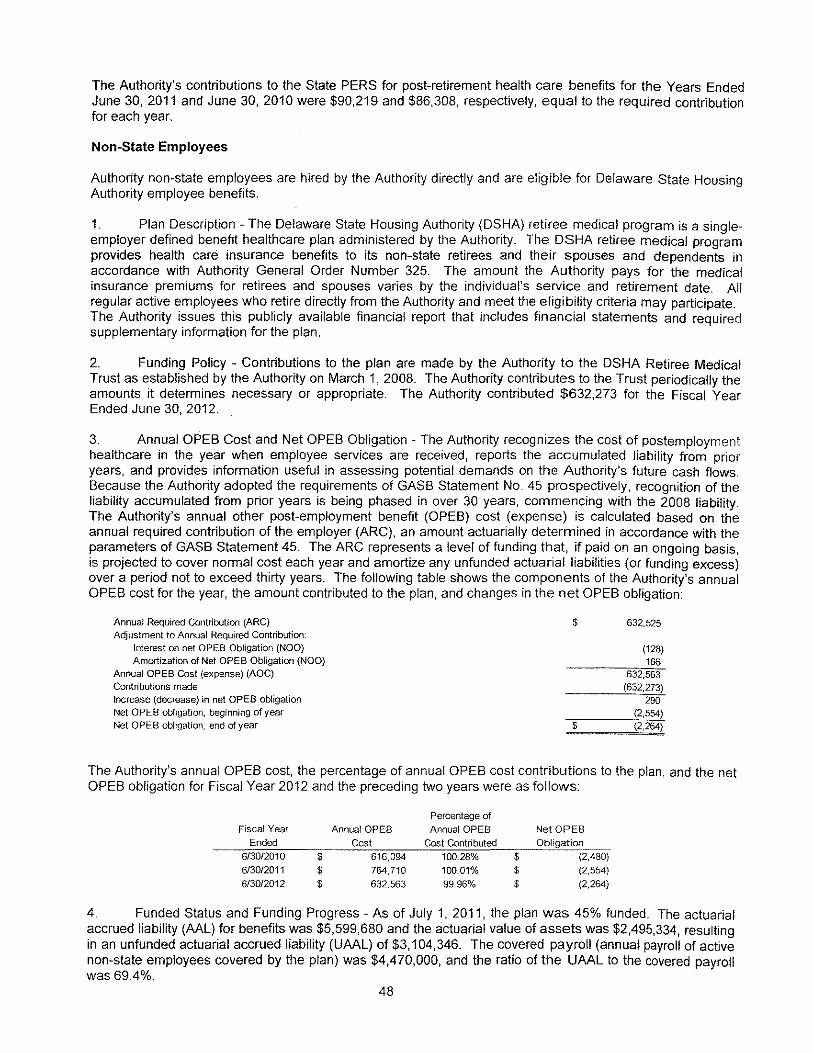
The Authority's contributions to the State PERS for post-retirement health care benefits for the Years Ended June 30, 2011 and June 30, 2010 were $90,219 and $86,308, respectively, equal to the required contribution for each year.
Non-State Employees
Authority non-state employees are hired by the Authority directly and are eligible for Delaware State Housing Authority employee benefits.
1. Plan Description - The Delaware State Housing Authority (OSHA) retiree medical program is a singleemployer defined benefit healthcare plan administered by the Authority. The OSHA retiree medical program provides health care insurance benefits to its non-state retirees and their spouses and dependents in accordance with Authority General Order Number 325. The amount the Authority pays for the medical insurance premiums for retirees and spouses varies by the individual's service and retirement date. All regular active employees who retire directly from the Authority and meet the eligibility criteria may participate. The Authority issues this publicly available financial report that includes financial statements and required supplementary information for the plan.
2. Funding Policy - Contributions to the plan are made by the Authority to the OSHA Retiree Medical Trust as established by the Authority on March 1, 2008. The Authority contributes to the Trust periodically the amounts it determines necessary or appropriate. The Authority contributed $632,273 for the Fiscal Year Ended June 30, 2012.
3. Annual OPEB Cost and Net OPEB Obligation -The Authority recognizes the cost of postemployment healthcare in the year when employee services are received, reports the accumulated liability from prior years, and provides information useful in assessing potential demands on the Authority's future cash flows. Because the Authority adopted the requirements of GASB Statement No. 45 prospectively, recognition of the liability accumulated from prior years is being phased in over 30 years, commencing with the 2008 liability. The Authority's annual other post-employment benefit (OPEB) cost (expense) is calculated based on the annual required contribution of the employer (ARC), an amount actuarially determined in accordance with the parameters of GASB Statement 45. The ARC represents a level of funding that, if paid on an ongoing basis, is projected to cover normal cost each year and amortize any unfunded actuarial liabilities (or funding excess) over a period not to exceed thirty years. The following table shows the components of the Authority's annual OPEB cost for the year, the amount contributed to the plan, and changes in the net OPEB obligation:
Annual Required Contribution (ARC) Adjustment to Annual Required Contribution:
Interest on net OPEB Obligation (NOO) Amortization of Net OPEB Obligation (NOO)
Annual OPES Cost (expense) (AOC)
Contributions made Increase {decrease) in net OPES obligation Net OPES obligation, beginning of year Net OPES obligation, end of year
$
$
632.525
(128) 166
632.563 (632,273)
290 (2,554) (2,264)
The Authority's annual OPEB cost, the percentage of annual OPEB cost contributions to the plan, and the net OPEB obligation for Fiscal Year 2012 and the preceding two years were as follows:
Percentage of Fiscal Year Annual OPEB Annual OPEB Net OPES
Ended Cost Cost Contributed Obligation 6/30/2010 $ 616,094 100.28% $ (2,480)
6/30/2011 $ 764,710 100.01% $ (2.554)
6/30/2012 $ 632.563 99.96% $ (2,264)
4. Funded Status and Funding Progress- As of July 1, 2011, the plan was 45% funded. The actuarial accrued liability (ML) for benefits was $5,599,680 and the actuarial value of assets was $2,495,334, resulting in an unfunded actuarial accrued liability (UML) of $3,104,346. The covered payroll (annual payroll of active non-state employees covered by the plan) was $4,470,000, and the ratio of the UML to the covered payroll was 69.4%.
48
Actuarial valuations of an ongoing plan involve estimates of the value of reported amounts and assumptions about the probability of occurrence of events far into the future. Examples include assumptions about future employment, mortality, and the healthcare cost trend. Amounts determined regarding the funded status of the plan and the annual required contributions of the employer are subject to continual revision as actual results are compared with past expectations and new estimates are made about the future. The schedule of funding progress, presented as required supplementary information following the notes to the financial statements, presents multiyear trend information about whether the actuarial value of the plan assets is increasing or decreasing over time relative to the actuarial accrued liabilities for benefits.
5. Actuarial Methods and Assumptions - Projections of benefits for financial reporting purposes are based on the substantive plan (the plan as understood by the employer and the plan members) and include the types of benefits provided at the time of each valuation. The actuarial methods and assumptions used include techniques that are designed to reduce the effects of short-term volatility in actuarial accrued liabilities and the actuarial value of assets, consistent with the long-term perspective of the calculations.
In the July 1, 2011 actuarial valuation the projected unit credit cost method was used. The actuarial assumptions included a 5.0% investment rate of return and an annual hea!thcare cost trend assumption beginning at 8.0% and decreasing to a 5.0% long-term trend rate after seven years. A 3.0% inflation rate assumption was used. The level dollar open amortization method is being used to amortize the UAAL over 30 years.
E. Pension plans
State Employees
Authority state employees are hired by the Authority through the State of Delaware Office of Personnel and are eligible for State of Delaware employee benefits.
1. Plan Description - All State employees of the Authority are covered by the State of Delaware Employees' Pension Plan which is a cost-sharing, multiple-employer defined benefit public employees retirement system (the "State PERS"). The State of Delaware General Assembly is responsible for setting benefits and amending plan provisions. The State Board of Pension Trustees determines the contributions required. All eligible State employees are required to contribute to the pension plan according to Chapter 55, Title 29 of the Delaware Code.
All full-time or regular part-time employees are eligible to participate in the State PERS. The State PERS provides pension, disability, and death benefits. In general, employees are eligible for pension benefits if they retire at age 62 with at least five years of credited service, at age 60 with at least 15 years of credited service, or at any age after 30 years of credited service. Monthly benefits equal final average monthly compensation multiplied by 2.0% and multiplied by years of credited service prior to January 1, 1997 plus final average monthly compensation multiplied by 1.85% and multiplied by credited service after December 31, 1996, subject to minimum limitations. For this plan, final average monthly compensation is the monthly average of the highest three years of compensation.
Pension provisions include survivor's benefits, whereby the employee must have been receiving a pension or have been an active employee with five years of credited services. Eligible survivors receive 50% of the pension the employee would have received at age 62. Additionally, the plan provides for monthly disability provisions which are the same as the pension benefit. The employee must have five years of credited service subject to limitations. The plan's death benefit is $7,000 per member. The State PERS issues a publicly available financial report that includes the financial statements and required supplementary information. That report may be obtained by writing to the State of Delaware Public Employee Retirement System, McArdle Building, Suite 1, 860 Silver Lake Blvd., Dover, DE 19904, or by calling 1-800-722-7300.
2. Funding Policy - Employees of the Authority are required to contribute 3% of earnings in excess of $6,000. Additionally, for the Year Ended June 30, 2012, the Authority was required to contribute 9.27% of covered payroll to the plan. The Authority's contribution to the State PERS for the Year Ended June 30, 2012 was $96,951, equal to the required contribution for the year. The Authority's contributions to the State PERS for the Years Ended June 30, 2011 and June 30, 2010 were $93,845 and $97,756, respectively, equal to the
49
required contribution for each year.
Non-State Employees
Authority non-state employees are hired by the Authority directly and are eligible for Delaware State Housing Authority employee benefits.
1. Plan Description - Full-time non-state employees are covered by the Housing-Renewal and Local Agency Retirement Plan. The Administrator of the plan is William M. Mercer, Incorporated. The Authority establishes and amends contributions through a General Order which is approved by the Authority's Director. The Plan shall be construed, regulated. and administered according to the laws of the State of Tennessee, where the plan is incorporated, except those areas preempted by the laws of the United States of America. The Housing-Renewal and Local Agency Retirement Plan provides pension, disability, and death benefits. In general, employees are eligible for pension benefits if they retire at age 65 with at least five years of credited service, or the date on which the employee completes ten (10) years of combined participation in this Plan and their prior plan, if any. The employee is entitled to the full value of their account as of the date of retirement.
2. Funding Policy - This defined contribution plan is funded by contributions from both the covered employees and the Authority. Non-state employees of the Authority are required to contribute 3.5% of their basic salary. The Authority's contribution rate was 9.59% of covered payroll for the Fiscal Year Ended June 30, 2012. The Authority's contribution to the Housing Renewal and Local Agency Retirement Plan for the Year Ended June 30, 2012 was $426,299 equal to the required contribution for the year. The Authority's contributions to the plan for the Years Ended June 30, 2011 and June 30, 2010 were $411,562 and $408,371, respectively, equal to the required contributions for each year.
F. Contingent liabilities
Amounts received or receivable from grant agencies are subject to audit and adjustment by grantor agencies, principally the federal government. Any disallowed claims, including amounts already collected, may constitute a liability of the applicable funds. The amount, if any, of expenditures that may be disallowed by the grantor cannot be determined at this time, the Authority expects such amounts, if any, to be immaterial.
G. Subsequent events
As of September 21, 2012, the Authority had borrowed as additional $30,248,635 from FHLB Pittsburgh under the agreement disclosed on page 43 of this report. The additional borrowing was used for the purchase of mortgaged backed securities and will be repaid with the proceeds of a bond issue expected to occur in the near future.
H. Restatement of prior year fund balances
During the current year, management determined that certain prior year short term debt was incorrectly reported on the Governmental Statement of Revenues, Expenditures, and Changes in Fund Balances instead of the Balance Sheet. The effect of this adjustment was to decrease the General Fund's fund balance as of July 1, 2010 by $851,914 and to increase the change in the General Fund's fund balance for the fiscal year ended June 30, 2011 by $851,914.
50
DELAWARE STATE HOUSING AUTHORITY
REQUIRED SUPPLEMENTARY INFORMATION
51
THIS PAGE INTENTIONALLY LEFT BLANK
52
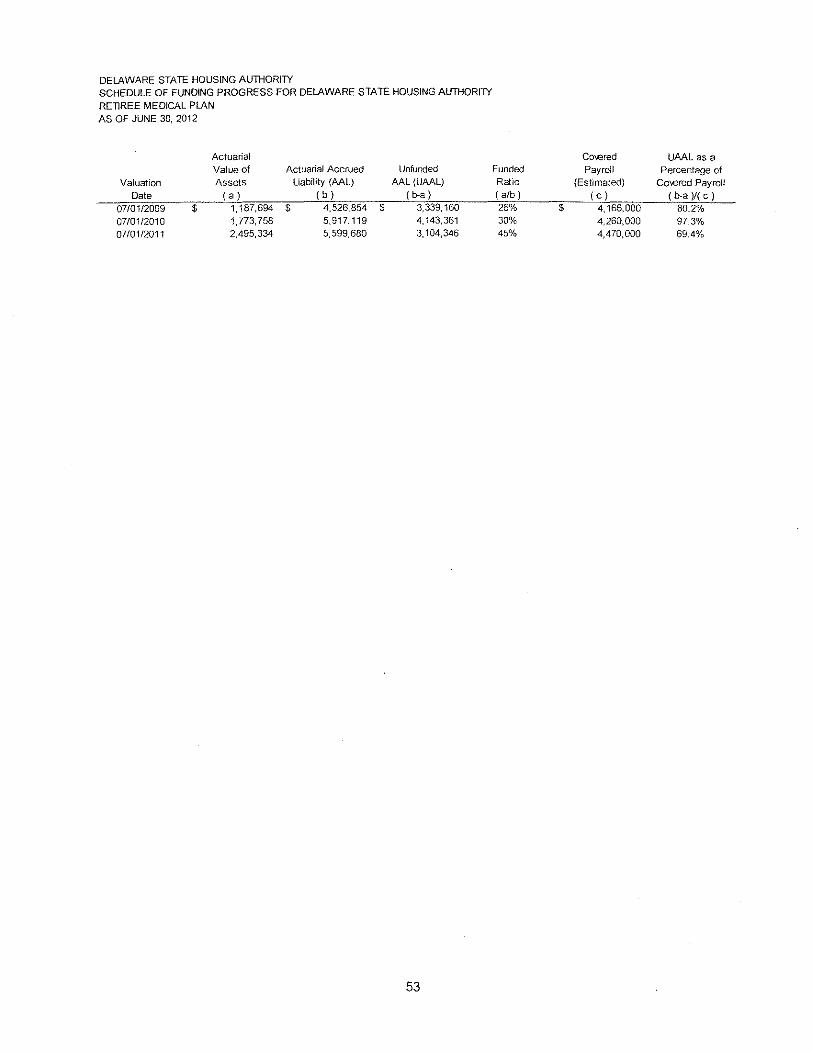
DELAWARE STATE HOUSING AUTHORI1Y SCHEDULE OF FUNDING PROGRESS FOR DELAWARE STATE HOUSING AUTHORI1Y
RETIREE MEDICAL PLAN AS OF JUNE 30, 2012
Actuarial Value of Actuarial Accrued Unfunded
Valuation Assets Liability (AAL) AAL (UAAL)
Date (a) (b) ( b~a)
0710112009 $ 1,187,694 $ 4,526,854 $ 3,339,160
07/01/2010 1,773,758 5,917,119 4,143,361
07/01/2011 2,495,334 5,599,680 3,104,346
53
Co\€ red UAAL as a Funded Payroll Percentage of Ratio {Estimated) Co-.ered Payroll (alb) (c) (b~a)l(c)
26% $ 4,166,000 80_2% 30% 4,260,000 97.3% 45% 4,470,000 69.4%

THIS PAGE INTENTIONALLY LEFT BLANK
54
DELAWARE STATE HOUSING AUTHORITY
OTHER SUPPLEMENTARY INFORMATION
55
THIS PAGE INTENTIONALLY LEFT BLANK
56
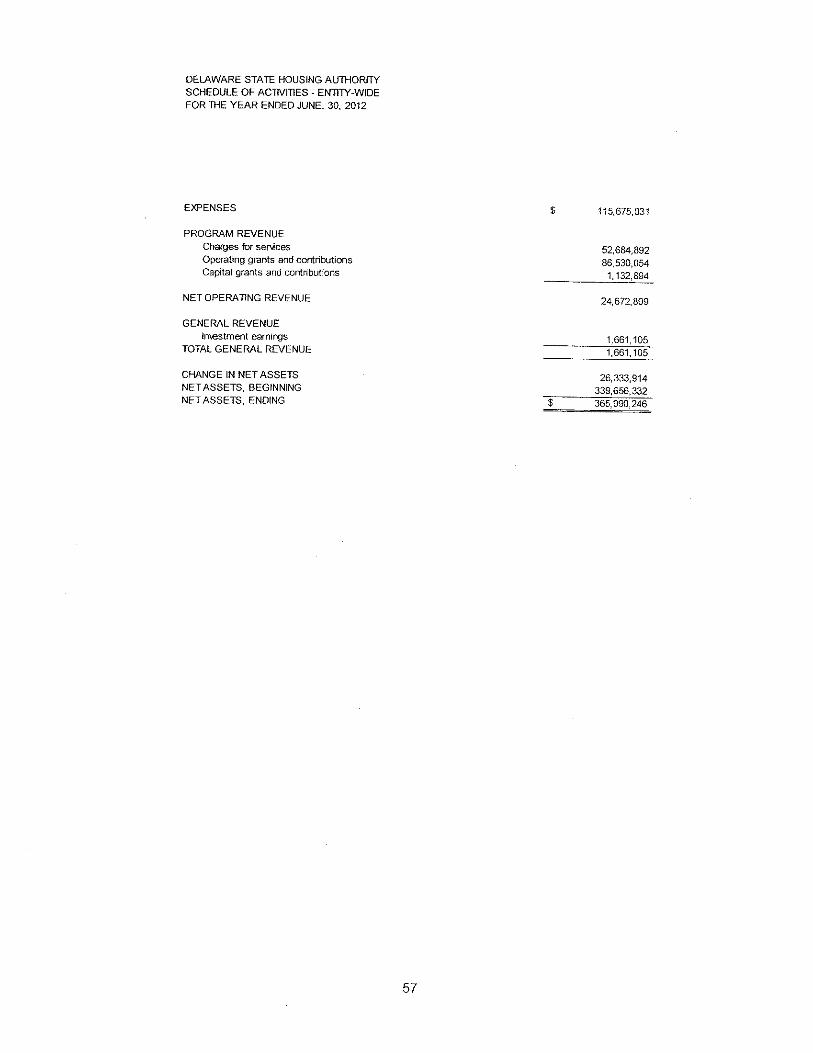
DELAWARE STATE HOUSING AUTHORITY
SCHEDULE OF ACTIVITlES - ENTITY -WIDE
FOR THE YEAR ENDED JUNE, 30, 2012
EXPENSES
PROGRAM REVENUE
Charges for seNces Operating grants and contributions Capital grants and contributions
NET OPERATING REVENUE
GENERAL REVENUE
lmestment earnings TOTAL GENERAL REVENUE
CHANGE IN NET ASSETS
NET ASSETS, BEGINNING
NET ASSETS, ENDING
$ 115,675,031
52,684,892
86,530,054 1,132,894
24,672,809
1,661,105
1,661,105
26,333,914 339,656,332
$ 365,990,246
57
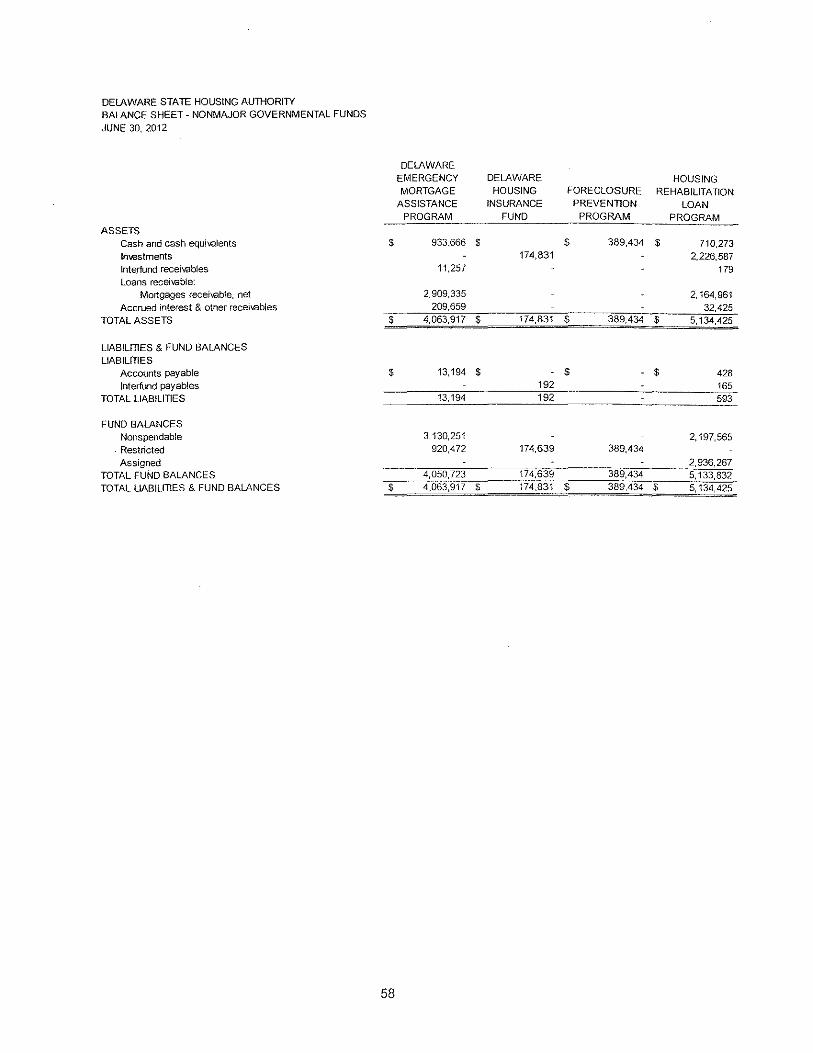
DELAWARE STATE HOUSING AUTHORilY BALANCE SHEET- NONMAJOR GOVERNMENTAL FUNDS
JUNE 30, 2012
DELAWARE EMERGENCY DELAWARE HOUSING MORTGAGE HOUSING FORECLOSURE REHABILITA llON
ASSISTANCE INSURANCE PREVENTION LOAN PROGRAM FUND PROGRAM PROGRAM
ASSETS Cash and cash equivalents $ 933,666 $ $ 389,434 $ 710,273 lmestments 174,831 2,226,587 lnterfund receivables 11,257 179 Loans receivable:
Mortgages receivable, net 2,909,335 2,164,961 Accrued interest & other recei~Jables 209,659 32,425
TOTAL ASSETS $ 4,063,917 $ 174,831 $ 389,434 $ 5,134,425
LIABILillES & FUND BALANCES
LIABILillES Accounts payable $ 13,194 $ $ $ 428 lnterfund payables 192 165
TOTAL LIABILillES 13,194 192 593
FUND BALANCES Nonspendable 3,130,251 2,197,565
. Restricted 920,472 174,639 389,434
Assigned 2,936,267 TOTAL FUND BALANCES 4,050,723 174,639 389,434 5,133,832 TOTAL LIABILillES & FUND BALANCES $ 4,063,917 $ 174,831 $ 389,434 $ 5,134,425
58
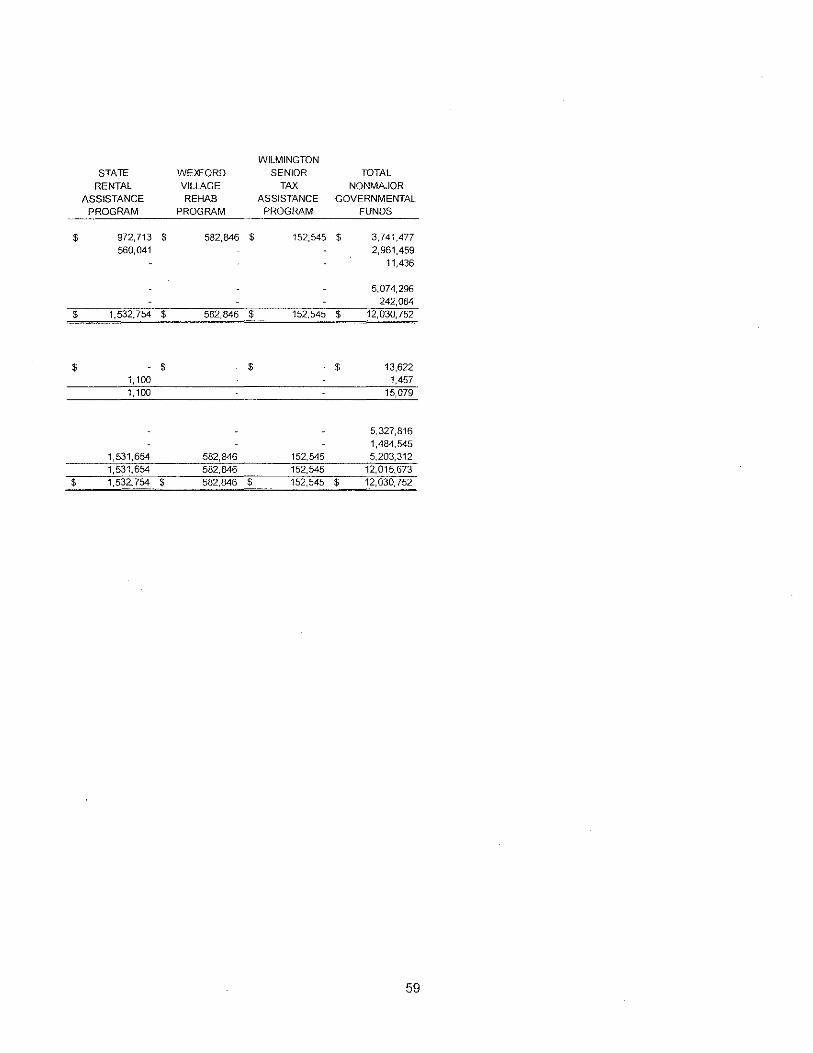
WILMINGTON
STATE WEXFORD SENIOR TOTAL
RENTAL VILLAGE TAX NONMAJOR
ASSISTANCE REHAB ASSISTANCE GOVERNMENTAL
PROGRAM PROGRAM PROGRAM FUNDS
$ 972,713 $ 582,846 $ 152,545 $ 3,741.477 560,041 2,961,459
11,436
5,074,296 242,084
$ 1,532,754 $ 582,846 $ 152,545 $ 12,030,752
$ $ $ $ 13,622
1,100 1,457
1,100 15,079
5,327,816
1,484,545 1,531,654 582,846 152,545 5,203,312 1,531,654 582,846 152,545 12,015,673
$ 1,532, 754 $ 582,846 $ 152,545 $ 12,030,752
59
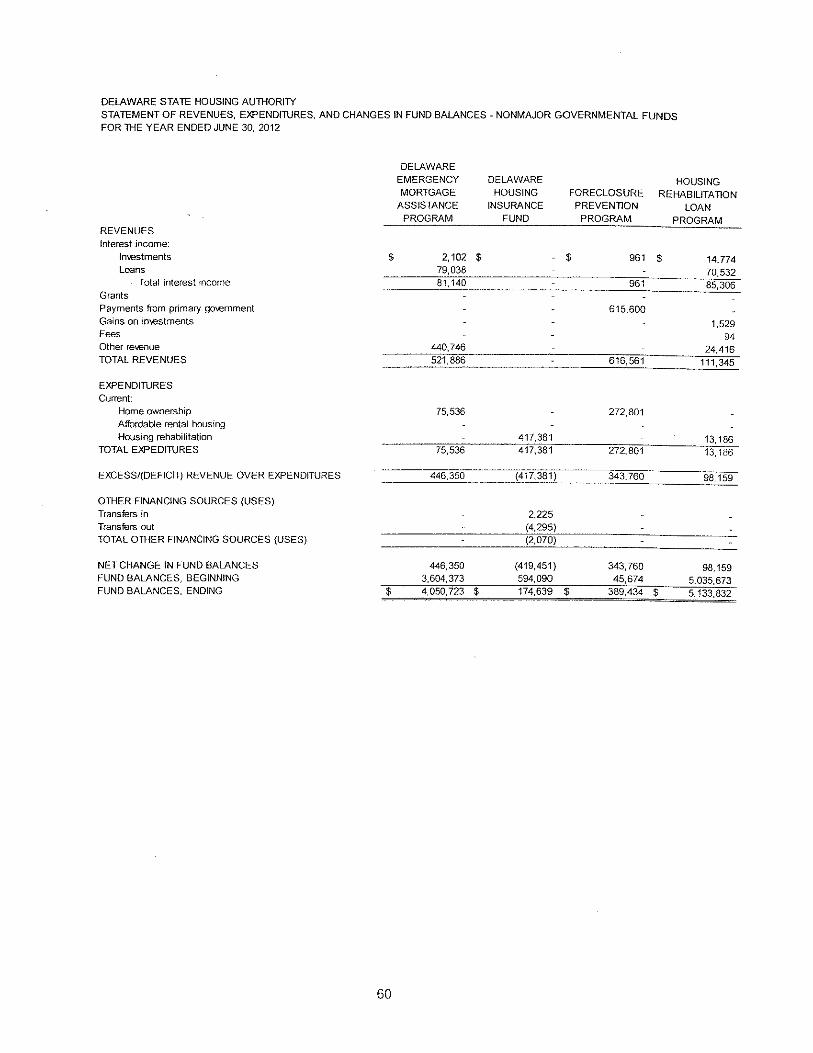
60
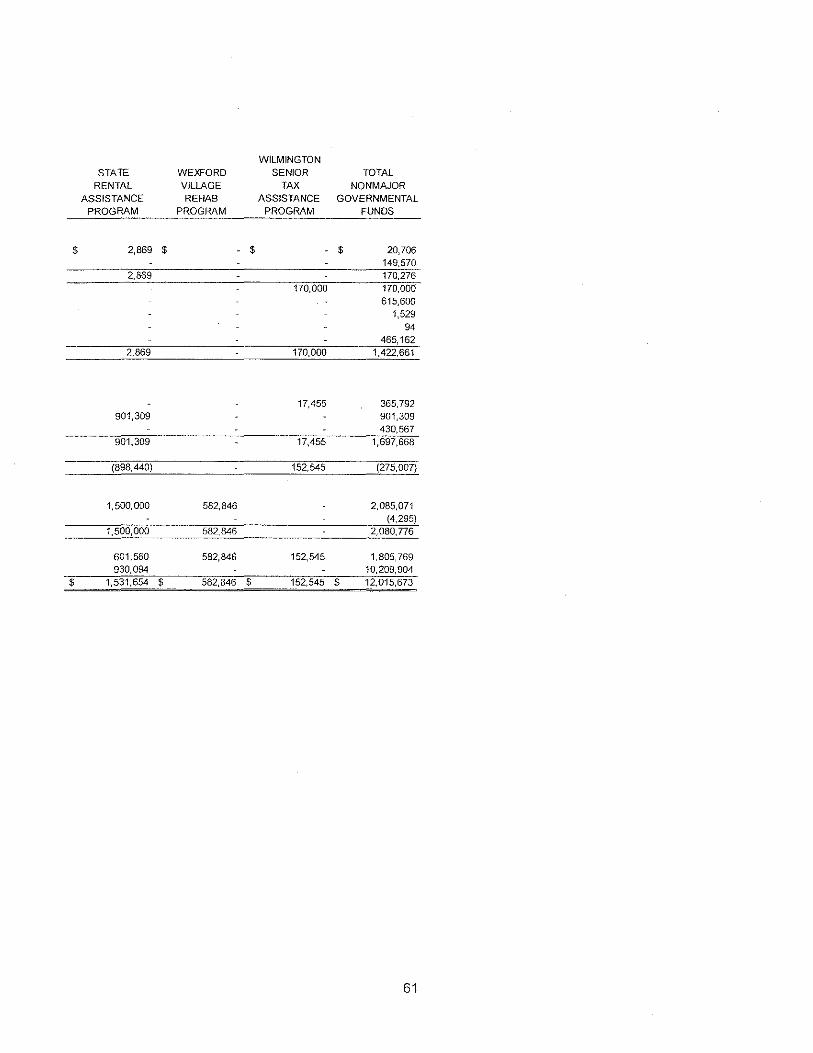
WILMINGTON STATE WEXFORD SENIOR TOTAL
RENTAL VILLAGE TAX NONMAJOR ASSISTANCE REHAB ASSISTANCE GOVERNMENTAL
PROGRAM PROGRAM PROGRAM FUNDS
$ 2,869 $ $ $ 20,706 149,570
2,869 170,276 170,000 170,000
615,600 1,529
94 465,162
2,869 170,000 1,422,661
17,455 365,792 901,309 901,309
430,567 901,309 17,455 1,697,668
(898,440) 152,545 (275,007)
1,500,000 582,846 2,085,071 (4,295)
1,500,000 582,846 2,080,776
601,560 582,846 152,545 1.805,769 930,094 10,209,904
$ 1,531,654 $ 582,846 $ 152,545 $ 12,015,673
61
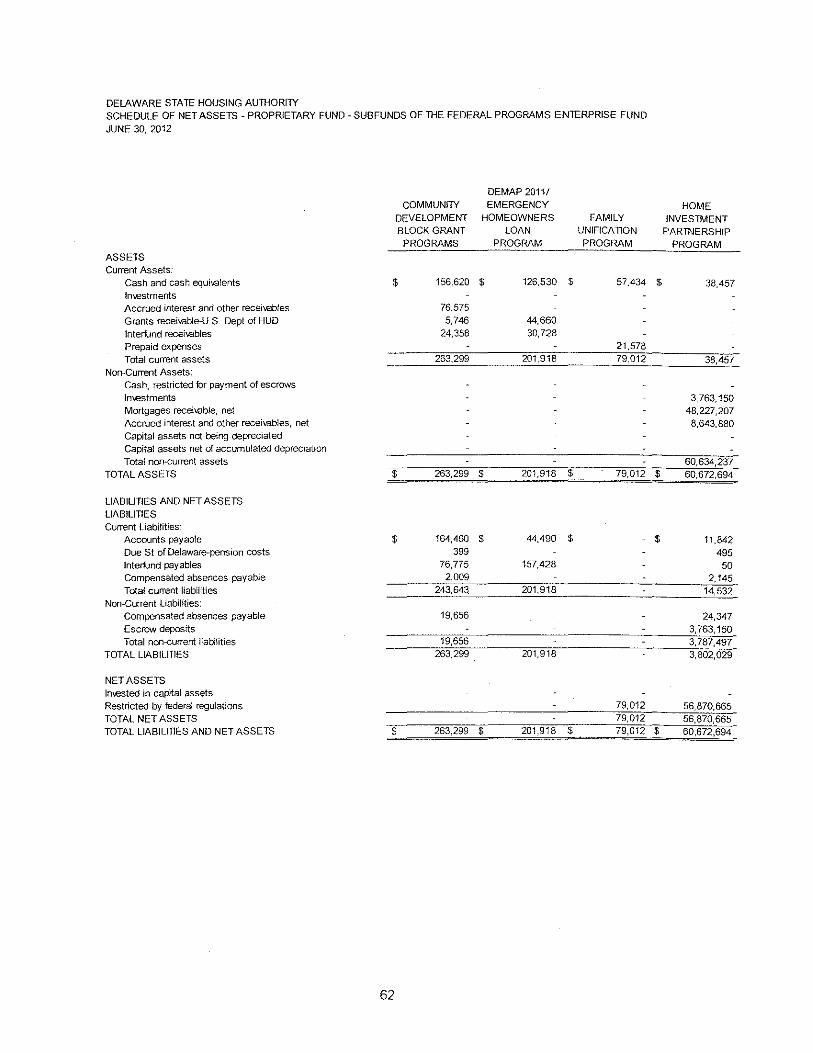
DElAWARE STATE HOUSING AUTHORITY SCHEDULE OF NET ASSETS - PROPRIETARY FUND- SUB FUNDS OF THE FEDERAL PROGRAMS ENTERPRISE FUND
JUNE 30, 2012
DEMAP 2011/
COMMUNITY EMERGENCY
DEVELOPMENT HOMEOWNERS FAMILY
BLOCK GRANT LOAN UNIF!CA llON
PROGRAMS PROGRAM PROGRAM
ASSETS Current Assets:
Cash and cash equivalents $ 156,620 $ 126,530 $ 57,434
lmestments Accrued interest and other receivables 76,575
Grants receivable-U.S Dept ofHUD 5,746 44,660
lnterfund receivables 24,358 30,728
Prepaid expenses 21,578 Total current assets 263,299 201,918 79,012
Non-Current Assets: Cash, restricted for payment of escrows
!n-.estments
Mortgages receivable, net Accrued interest and other receivables, net
Capital assets not being depreciated Capital assets net of accumulated depreciation Total non--current assets
TOTAL ASSETS $ 263,299 $ 201,918 $ 79,012
LIABILITIES AND NET ASSETS
LIABILITIES Current Uabl!ities:
Accounts payable $ 164,460 $ 44,490 $ Due St of Delaware-pension costs 399
lnterfund payables 76,775 157,428
Compensated absences payable 2,009
Total current Jiabllities 243,643. 201,918
Non-Current Liabilities: Compensated absences payable 19,656
Escrow deposits
Total non-current liabilities 19,656
TOTAL LIABILITIES 263,299 201,918
NET ASSETS !mested in capital assets
Restricted by federal regulations 79,012
TOTAL NET ASSETS 79,012
TOTAL LIABILITIES AND NET ASSETS $ 263,299 $ 201,918 $ 79,012
62
HOME
INVESTMENT PARTNERSHIP
PROGRAM
$ 38,457
38,457
3,763,150
48,227,207 8,643,880
60,634,237 $ 60,672,694
$ 11,842
495
50 2,145
14,532
24,347
3,763,150
3,787,497
3,802,029
56,870,665 56,870,665
$ 60,672,694
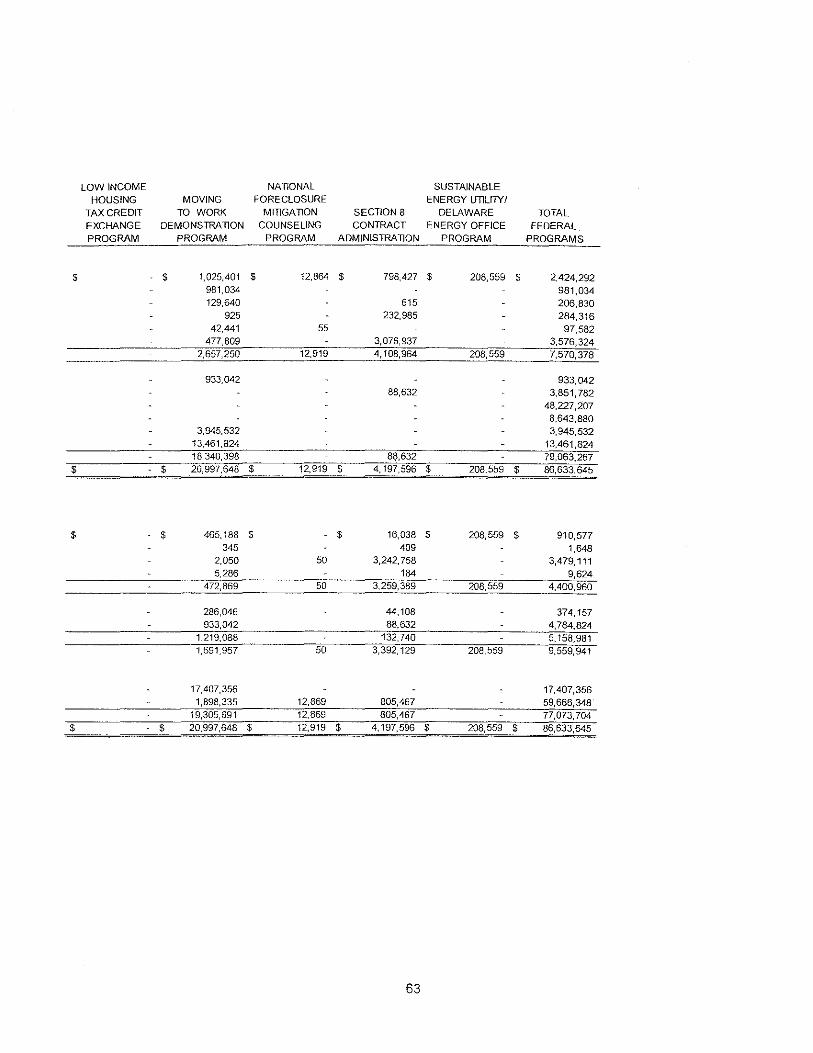
LOW INCOME NATIONAL SUSTAINABLE
HOUSING MOVING FORECLOSURE ENERGY UTILITY/ TAX CREDIT TO WORK MITIGATION SECTION 8 DELAWARE TOTAL EXCHANGE DEMONS1RA TION COUNSELING CON1RACT ENERGY OFFICE FEDERAL PROGRAM PROGRAM PROGRAM ADMINIS1RATION PROGRAM PROGRAMS
$ $ 1,025,401 $ 12,864 $ 798,427 $ 208,559 $ 2,424,292 981,034 981,034 129,640 615 206,830
925 232,985 284,316 42,441 55 97,582
477,809 3,076,937 3,576,324 2,657,250 12,919 4,108,964 208,559 7,570,378
933,042 933,042 88,632 3,851,782
48,227,207 8,643,880
3,945,532 3,945,532 13,461,824 13.461,824 18,340,398 8$,632 79,063,267
$ $ 20,997,648 $ 12,919 $ 4,197,596 $ 208,559 $ 86,633,645
$ $ 465,188 $ $ 16,038 $ 208,559 $ 910,577 345 409 1,648
2,050 50 3,242,758 3,479,111 5,286 184 9,624
472,869 50 3,259,389 208,559 4,400,960
286,046 44,108 374,157 933,042 88,632 4,784,824
1,219,088 132,740 5,158,981 1,691,957 50 3,392,129 208,559 9,559,941
17,407,356 17,407,356 1,898,335 12,869 805,467 59,666,348
19,305,691 12,869 805,467 77,073,704 $ $ 20,997,648 $ 12,919 $ 4,197,596 $ 208,559 $ 86,633,645
63
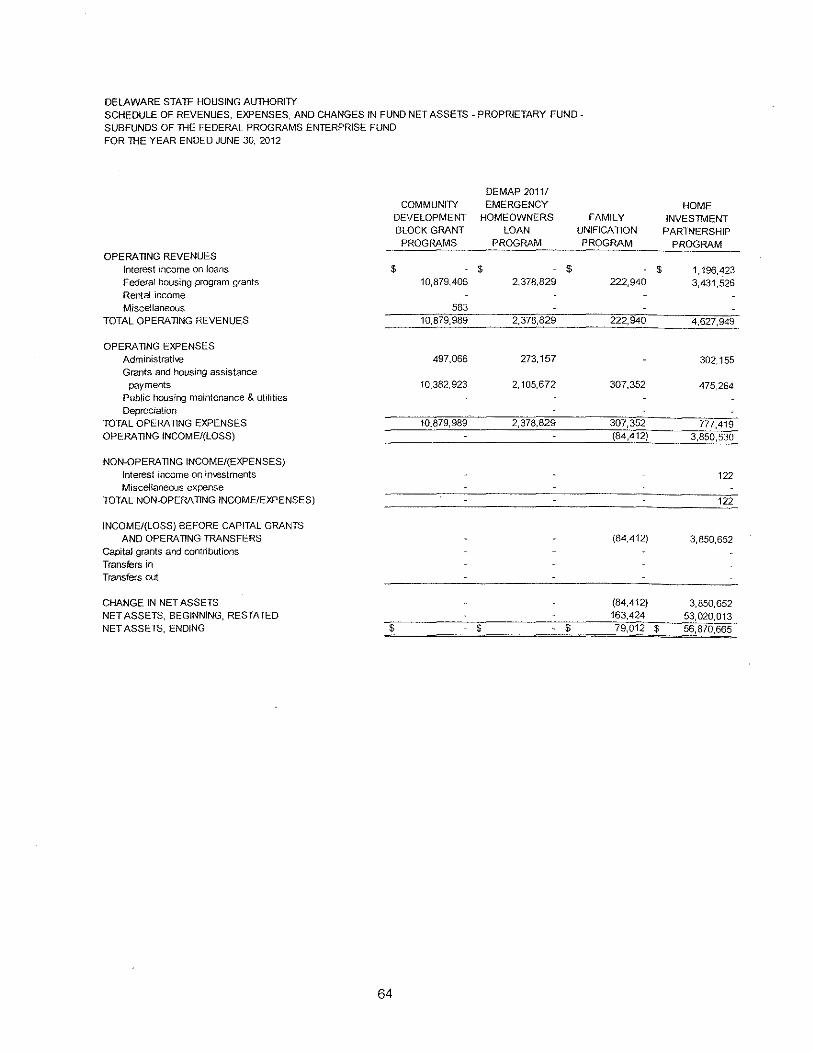
DELAWARE STATE HOUSING AUTHORI1Y SCHEDULE OF REVENUES, EXPENSES, AND CHANGES IN FUND NET ASSETS -PROPRIETARY FUNDSUBFUNDS OF THE FEDERAL PROGRAMS ENTERPRISE FUND FOR THE YEAR ENDED JUNE 30, 2012
DEMAP 2011/ COMMUNI1Y EMERGENCY
DEVELOPMENT HOMEOWNERS FAMILY BLOCK GRANT LOAN UNIFICA TlON
PROGRAMS PROGRAM PROGRAM
OPERATING REVENUES Interest income on loans $ $ $ Federal housing program grants 10,879,406 2,378,829 222,940 Rental income Miscellaneous 583
TOTAL OPERATING REVENUES 10,879,989 2,378,829 222,940
OPERATING EXPENSES Administrative 497,066 273,157 Grants and housing assistance
payments 10,382,923 2,105,672 307,352 Public housing maintenance & utilities Depreciation
TOTAL OPERATING EXPENSES 10,879,989 2,378,829 307,352
OPERATING INCOME/(LOSS) (84,412)
NON-OPERATING INCOME/(EXPENSES) Interest income on imestments Miscellaneous expense
TOTAL NON-OPERATING INCOME/EXPENSES)
INCOME/(LOSS) BEFORE CAPITAL GRANTS AND OPERATING TRANSFERS (84,412)
Capital grants and contributions Transfers in Transfers out
CHANGE IN NET ASSETS (84,412) NET ASSETS, BEGINNING, REST A TED 163,424
NET ASSETS, ENDING $ $ $ 79,012
64
HOME INVESTMENT
PARTNERSHIP PROGRAM
$ 1' 196,~23 3,431,526
4,627,949_ ..
302,155
475,264
777,419 3,850,530
122
122
3,850,652
3,850,652 53,020,013
$ 56,870,665
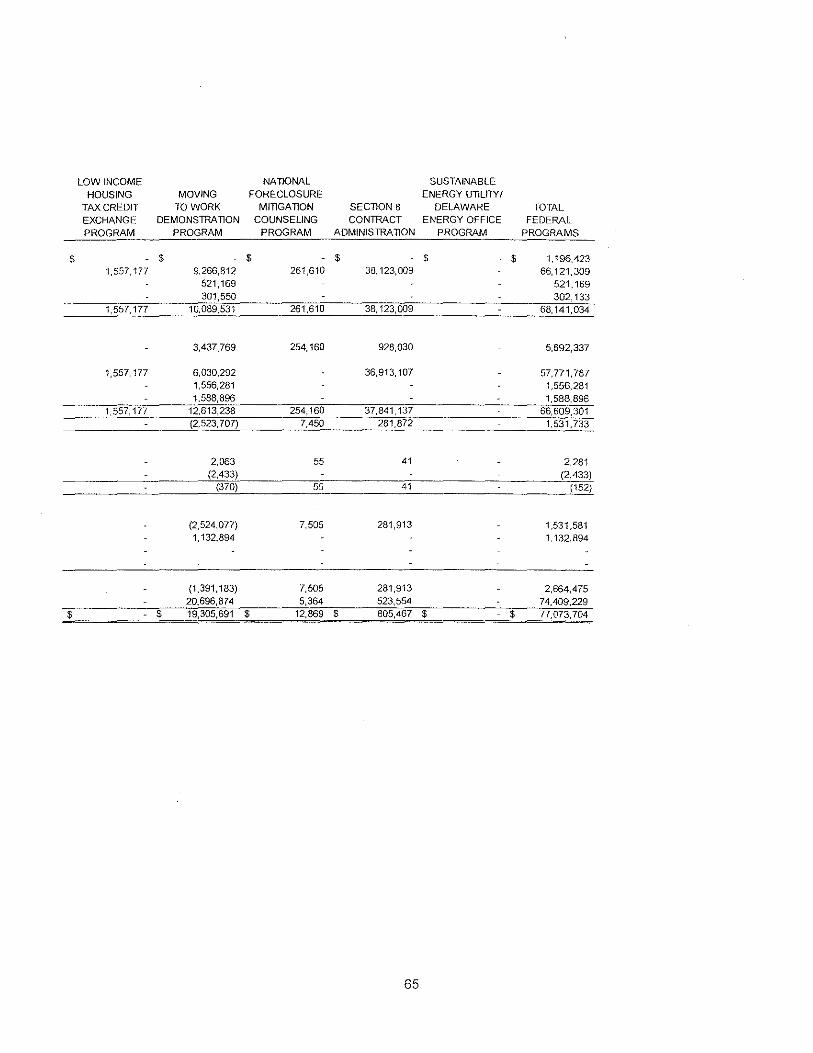
LOW INCOME
HOUSING TAX CREDIT
EXCHANGE
PROGRAM
$ 1,557,177
1,557,177
1,557,177
1,557,177
$
MOVING
TO WORK DEMONSTRATION
$
PROGRAM
9,266,812
521,169 301,550
10,089,531
3,437,769
6,030,292 1,556,281 1,588,896
12,613,238
(2,523,707)
2,063
(2,433) (370)
(2,524,077)
1,132,894
(1,391, 183)
20,696,874
NATIONAL
FORECLOSURE
$
MITIGATION
COUNSELING
PROGRAM
261,610
261,610
254,160
254,160 7,450
55
55
7,505
7,505
5,364
SECTION 8
CONTRACT ADMINISTRATION
$ 38,123,009
38,123,009
928,030
36,913,107
37,841,137 281,872
41
41
281,913
281,913 523,554
SUSTAINABLE
ENERGY UTI LilY I DELAWARE
ENERGY OFFICE
PROGRAM
$
$ 19,305,691 $ 12,869 $ 805,467 $
65
$
$
TOTAL FEDERAL
PROGRAMS
1,196,423 66,121,309
521,169 302,133
68,141,034
5,692,337
57,771.787 1,556,281 1,588,896
66,609,301
1,531,733
2,281 (2,433)
(152)
1,531,581 1,132,894
2,664,475
74,409,229 77,073,704
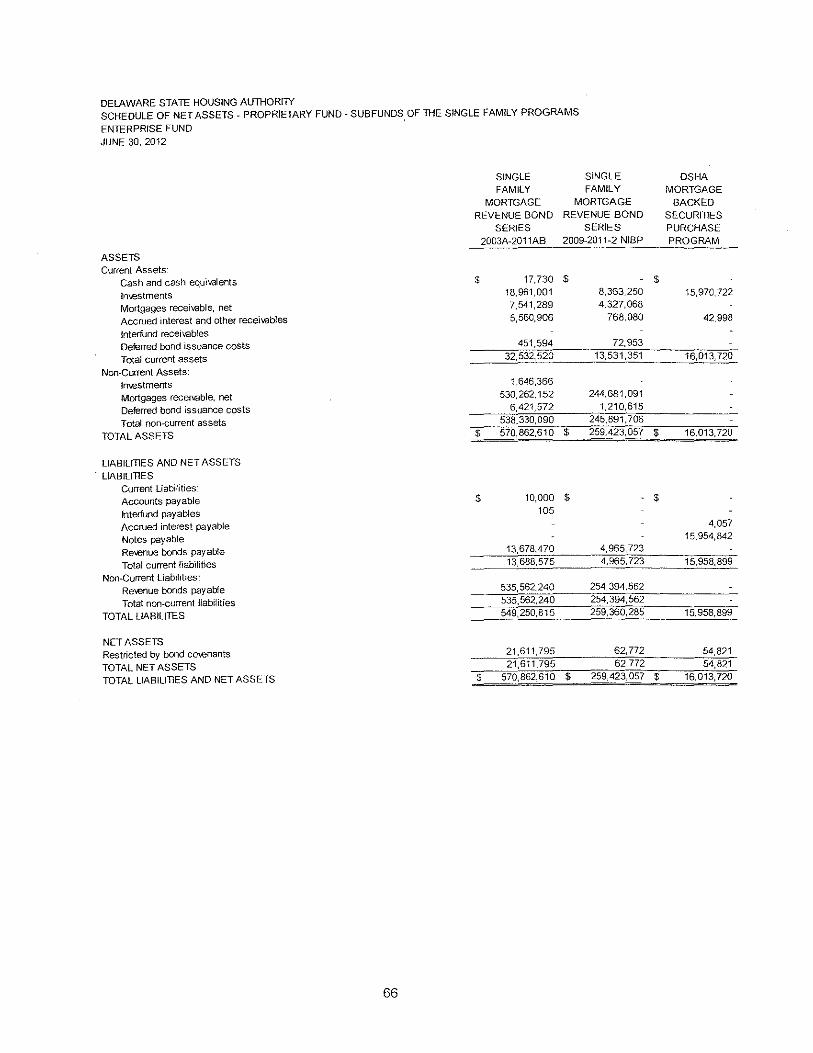
DElAWARE STATE HOUSING AUTHORITY SCHEDULE OF NET ASSETS- PROPRIETARY FUND- SUB FUNDS OF TI-lE SINGLE FAMILY PROGRAMS
ENTERPRISE FUND
JUNE 30, 2012
SINGLE SINGLE OSHA FAMILY FAMILY MORTGAGE
MORTGAGE MORTGAGE BACKED REVENUE BOND REVENUE BOND SECURITlES
SERIES SERIES PURCHASE 2003A-2011AB 2009-2011-2 NIBP PROGRAM
ASSETS Current Assets·
Cash and cash equivalents $ 17,730 $ $
ln\€stments 18,961,001 8,363,250 15,970,722
Mortgages receivable, net 7,541,289 4,327,068
Accrued interest and other receivables 5,560,906 768,080 42,998
lnterfund receivables Deferred bond issuance costs 451,594 72,953
Total current assets 32,532,520 13,531,351 16,013,720
Non-Current Assets: ln-.estments 1,646,366
Mortgages receivable, net 530,262,152 244,681,091
Deferred bond issuance costs 6,421,572 1,210,615
Total non-current assets 538,330,090 245,891,706
TOTAL ASSETS $ 570,862,610 $ 259,423,057 $ 16,013,720
LIABIUTlES AND NET ASSETS . UABJLITlES
Current Liabilities· Accounts payable $ 10,000 $ $
lnterfund payables 105
Accrued interest payable 4,057
Notes payable 15,954,842
Re-..enue bonds payable 13,678,470 4,965,723
Total current liabilities 13,688,575 4,965,723 15.958,899
Non-Current Liabilities: Re\€nue bonds payable 535,562,240 254,394,562
Total non-current liabilities 535,562,240 254,394,562
TOTAL LIABILITES 549,250,815 259,360,285 15,958,899
NET ASSETS Restricted by bond co...enants 21,611,795 62,772 54,821
TOTAL NET ASSETS 21,611,795 62,772 54,821
TOTAL LIABILITIES AND NET ASSETS $ 570,862,610 $ 259,423,057 $ 16,013,720
66
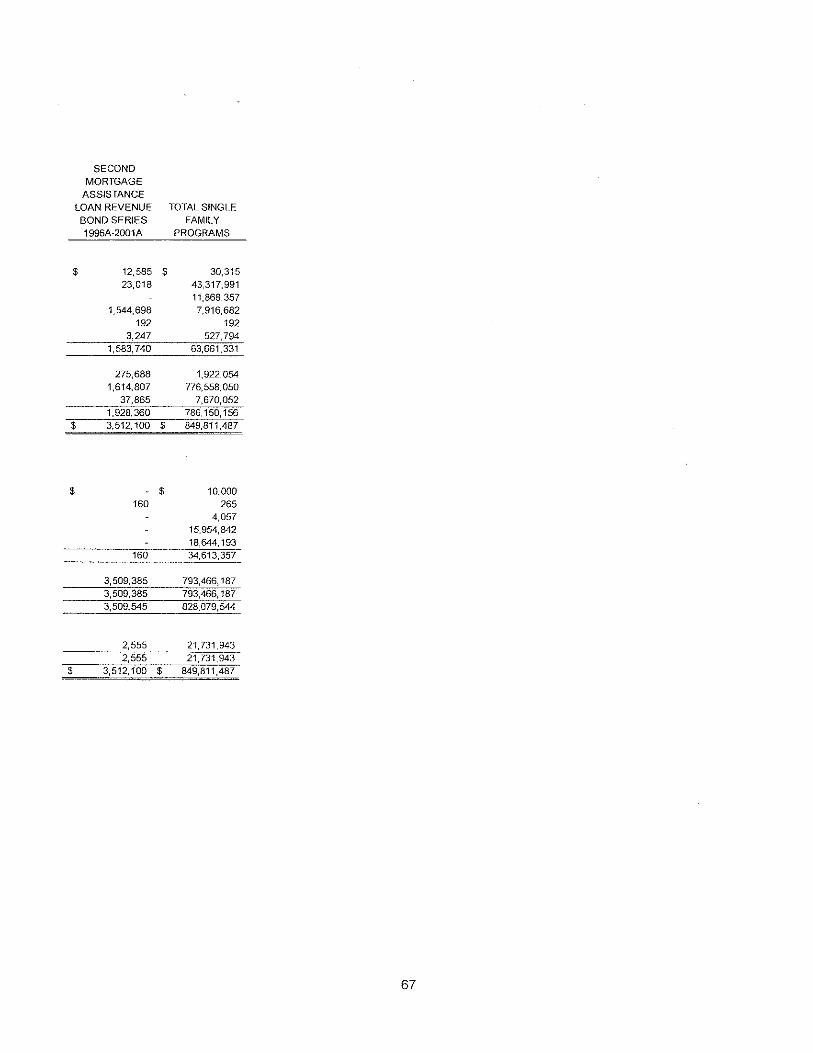
SECOND
MORTGAGE ASSISTANCE
LOAN REVENUE TOTAL SINGLE
BOND SERIES FAMILY
1996A-2001A PROGRAMS
$ 12,585 $ 30,315 23,018 43,317,991
11,868,357 1,544,698 7,916,682
192 192 3,247 527,794
1,583,740 63,661,331
275,688 1,922,054 1,614,807 776,558,050
37,865 7,670,052 1,928,360 786,150,156
$ 3,512,100 $ 849,811,487
$ $ 10,000 160 265
4,057 15,954,842
18,644,193 160 34,613,357
3,509,385 793,466,187 3,509,385 793,466, 187 3,509,545 828,079,544
2,555 21,731,943 2,555 21,731,943
$ 3,512,100 $ 849,811,487
67
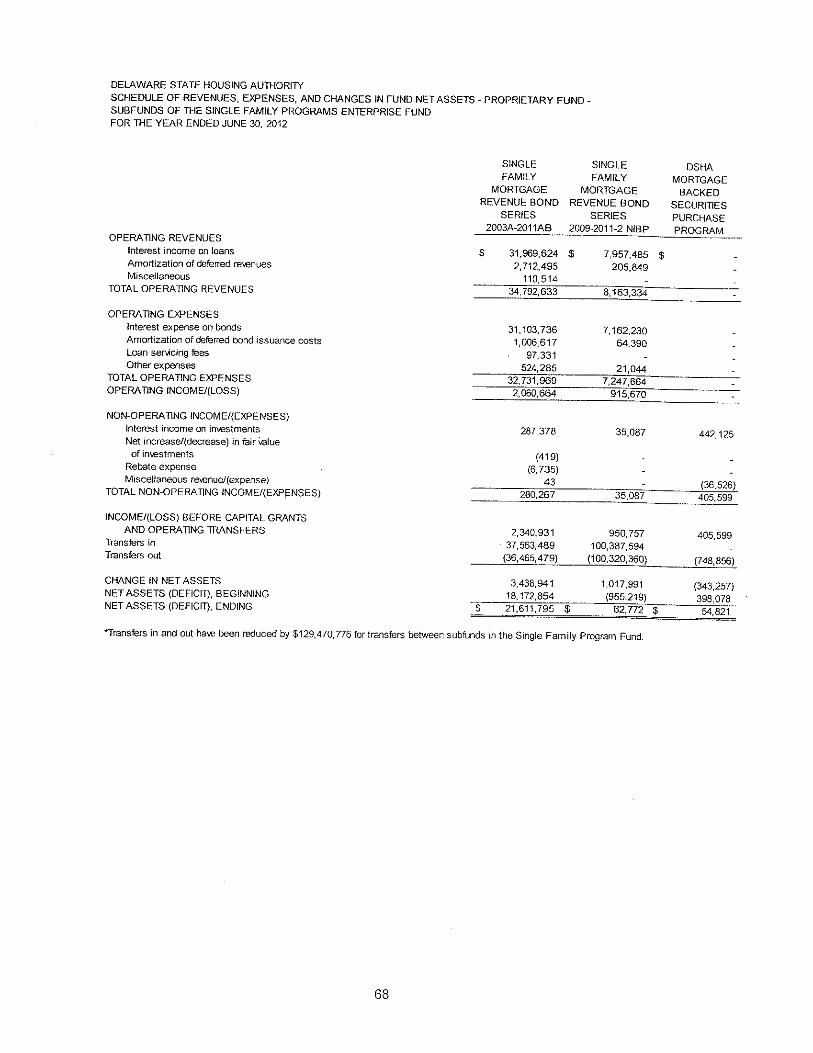
DELAWARE STATE HOUSING AUTHORITY
SCHEDULE OF REVENUES, EXPENSES, AND CHANGES IN FUND NET ASSETS -PROPRIETARY FUND-SUBFUNDS OF THE SINGLE FAMILY PROGRAMS ENTERPRISE FUND FOR THE YEAR ENDED JUNE 30, 2012
SINGLE SINGLE OSHA FAMILY FAMILY MORTGAGE
MORTGAGE MORTGAGE BACKED REVENUE BOND REVENUE BOND SECURITIES
SERIES SERIES PURCHASE 2003A-2011AB 2009-2011-2 NIBP PROGRAM
OPERATING REVENUES Interest income on loans $ 31,969,624 $ 7,957,485 $ Amortization of deferred re\.enues 2,712,495 205,849 Miscellaneous 110,514
TOTAL OPERA llNG REVENUES 34,792,633 8,163,334
OPERA llNG EXPENSES Interest expense on bonds 31,103,736 7,162,230 Amortization of deferred bond issuance costs 1,006,617 64,390 Loan servicing fees 97,331 Other expenses 524,285 21,044
TOTAL OPERA llNG EXPENSES 32,731,969 7,247,664 OPERA llNG INCOME/(LOSS) 2,060,664 915,670
NON-OPERA llNG INCOME/(EXPENSES) Interest income on in'-€stments 287,378 35,087 442,125 Net increase/(decrease) in fair Value of in\.€stments (419)
Rebate expense (6,735) Miscel!aneous re\€nue/(expense) 43
TOTAL NON-OPERA llNG INCOME/(EXPENSES)
INCOME!(LOSS) BEFORE CAPITAL GRANTS AND OPERA llNG 1RANSFERS 2,340,931 950,757 405,599
Transfers in . 37,563,489 100,387,594 Transfers out (36,465,479) (100,320,360) (748,856)
CHANGE IN NET ASSETS 3,438, 941 1,017,991 (343,257) NET ASSETS (DEFICIT), BEGINNING 18,172,854 (955,219) 398,078 NET ASSETS (DEFICIT), ENDING $ 21,611,795 $ 62,772 $ 54,821
*Transfers in and out ha-.e been reduced by $129,470,776 for transfers between subfunds in the Single Family Program Fund.
68
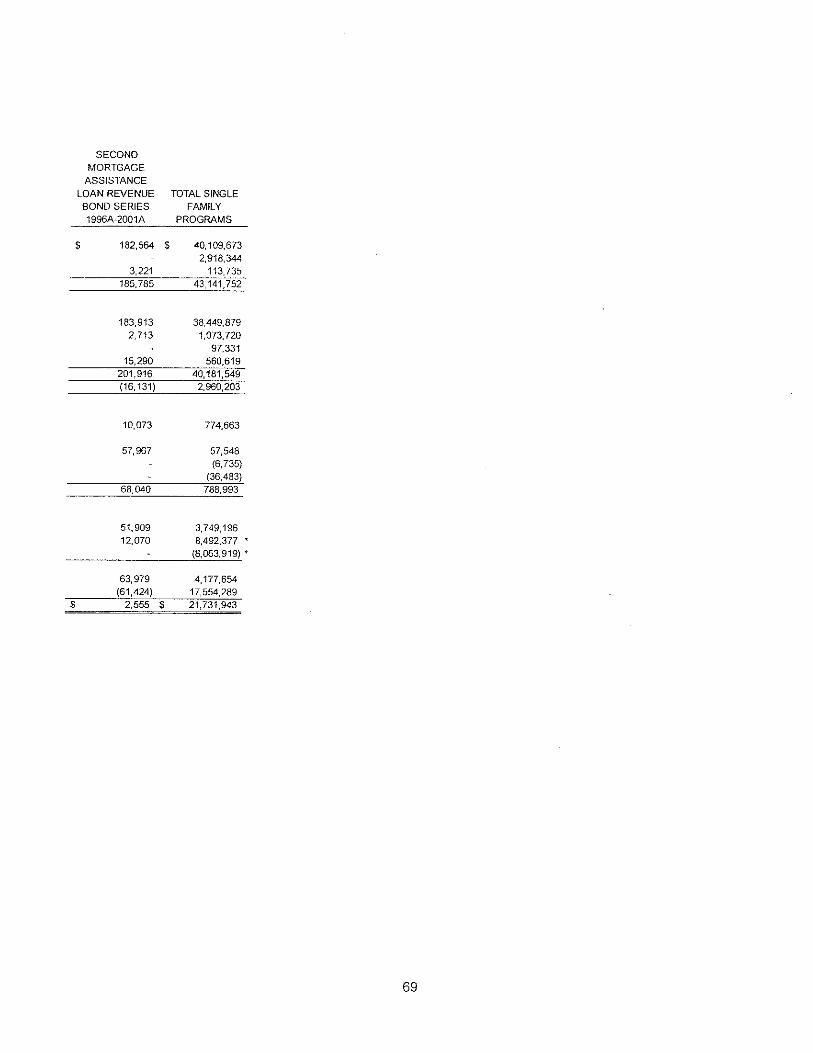
SECOND
MORTGAGE
ASSISTANCE
LOAN REVENUE TOTAL SINGLE
BOND SERIES FAMILY 1996A-2001A PROGRAMS
$ 182,564 $ 40,109,673
2,918,344 3,221 113,735
185,785 43,141,752
183,913 38,449,879
2,713 1,073,720
97,331
15,290 560,619 201,916 40,181,549 (16, 131) 2,960,203
10,073 774,663
57,967 57,548
(6,735)
(36,483)
68,040 788,993
51,909 3,749,196 12,070 8,492,377
(8,063,919) •
63,979 4,177,654 (61,424) 17,554,289
$ 2,555 $ 21,731,943
69
DELAWARE STATE HOUSING AU1HORI1Y SCHEDULE OF NET ASSETS~ PROPRIETARY FUND~ SUB FUNDS OF 1HE MUL TI~FAMILY PROGRAMS
ENTERPRISE FUND
JUNE 30, 2012
MULTI-FAMILY MULTI-FAMILY
MORTGAGE MORTGAGE
REVENUE REVENUE
REFUNDING REFUNDING
SERIES 1992D&E SERIES 2001A
ASSETS Current Assets:
lmestments $ $ $ Mortgages receivable, net Accrued interest and other receivables
Deferred bond Issuance costs
Total current assets
Non-Current Assets:
!n'.lestments Mortgages receivable, net
Deferred bond issuance costs
Total non-current assets
TOTAL ASSETS $ $ $
LIABILITIES AND NET ASSETS
LIABILITIES Current liabilities·
Accounts payable $ $ $ Jnterfund payables
Accrued arbitrage rebate payable
Accrued interest payable
Re\€nue bonds payable Total current liabilities
Non-Current liabilities:
Escrow deposits Re\€nue bonds payable
Total non-current liabi!ities
TOTAL LIABILillES
NET ASSETS Restricted by bond co-.enants
TOTAL NET ASSETS
TOTAL UABILillES AND NET ASSETS $ $ $
70
TOTAL MULTI~FAMILY
FAF REFUNDING RESERVES LOAN PROGRAM PROGRAMS
$
$
$
$
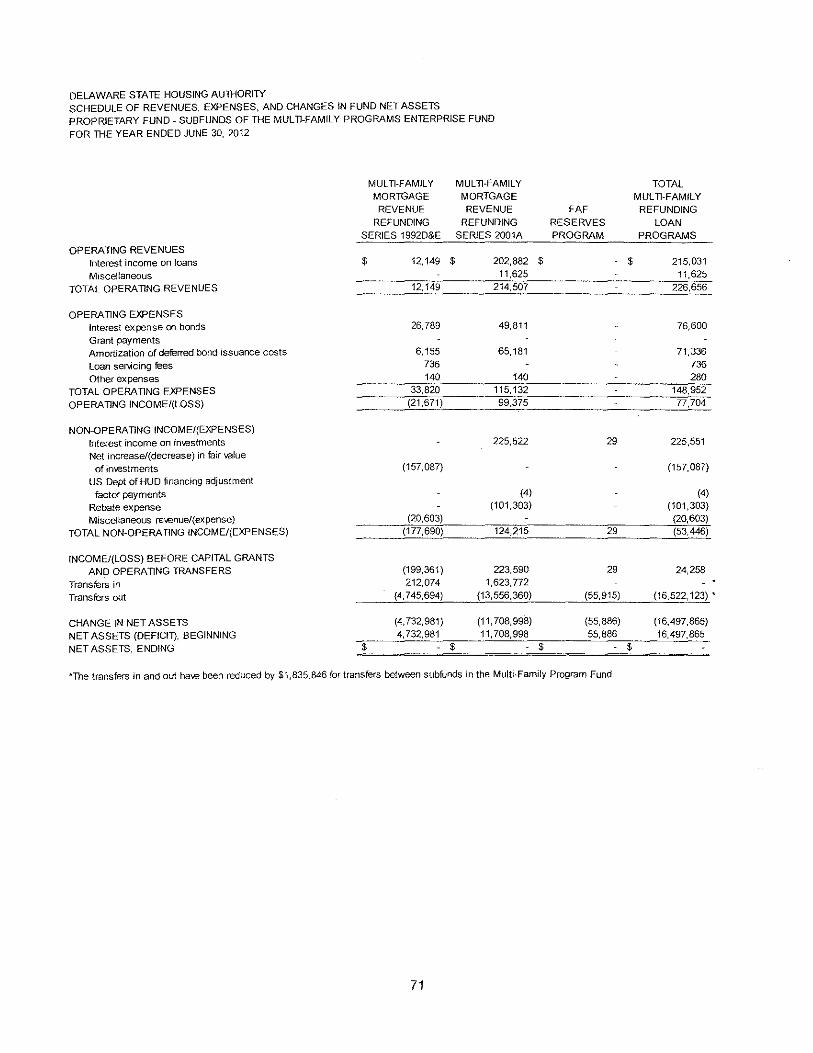
DELAWARE STATE HOUSING AUTHORITY SCHEDULE OF REVENUES, EXPENSES, AND CHANGES IN FUND NET ASSETS PROPRIETARY FUND- SUBFUNDS OF THE MULTI-FAMILY PROGRAMS ENTERPRISE FUND
FOR THE YEAR ENDED JUNE 30, 2012
MULTI-FAMILY MULTI-FAMILY MORTGAGE MORTGAGE
REVENUE REVENUE REFUNDING REFUNDING
SERIES 1992D&E SERIES 2001A
OPERAT1NG REVENUES Interest income on loans $ 12,149 $ 202,882
Miscellaneous 11,625
TOTAL OPERAT1NG REVENUES 12,149 214,507
OPERATING EXPENSES Interest expense on bonds 26,789 49,811
Grant payments Amortization of deferred bond issuance costs 6,155 65,181
loan servicing fees 736
Other expenses 140 140
TOTAL OPERAT1NG EXPENSES 33,820 115,132
OPERATING INCOMEI(LOSS) (21,671) 99,375
NON-OPERATING INCOMEI(EXPENSES) Interest income on in\.€stments 225,522
Net increase/(decrease) in fair value of im.estments (157,087)
US Dept of HUD financing adjustment
factor payments (4)
Rebate expense (101 ,303)
Miscellaneous re'.€nue/{expense) (20,603)
TOTAL NON-OPERA TlNG INCOMEI(EXPENSES) (177,690) 124,215
INCOMEI(LOSS) BEFORE CAPITAL GRANTS AND OPERATJNG TRANSFERS (199,361) 223,590
Transfers in 212,074 1,623,772
Transfers aut (4,745,694) (13,556,360)
CHANGE IN NET ASSETS (4,732,981) (11,708,998)
NET ASSETS (DEFICIT), BEGINNING 4,732,981 11,708,998
NET ASSETS, ENDING $ $
FAF
RESERVES PROGRAM
$
29
29
29
(55,915)
(55,886) 55,886
$
*The transfers in and out have been reduced by $1,835,846 for transfers between subfunds in the Multi-Family Program Fund.
71
TOTAL MULTI-FAMILY
REFUNDING LOAN
PROGRAMS
$ 215,031 11,625
226,656
76,600
71,336 736 280
148,952 77,704
225,551
(157,087)
(4) (101,303)
(20,603) (53,446)
24,258
(16,522, 123) •
(16,497,865) 16,497,865
$
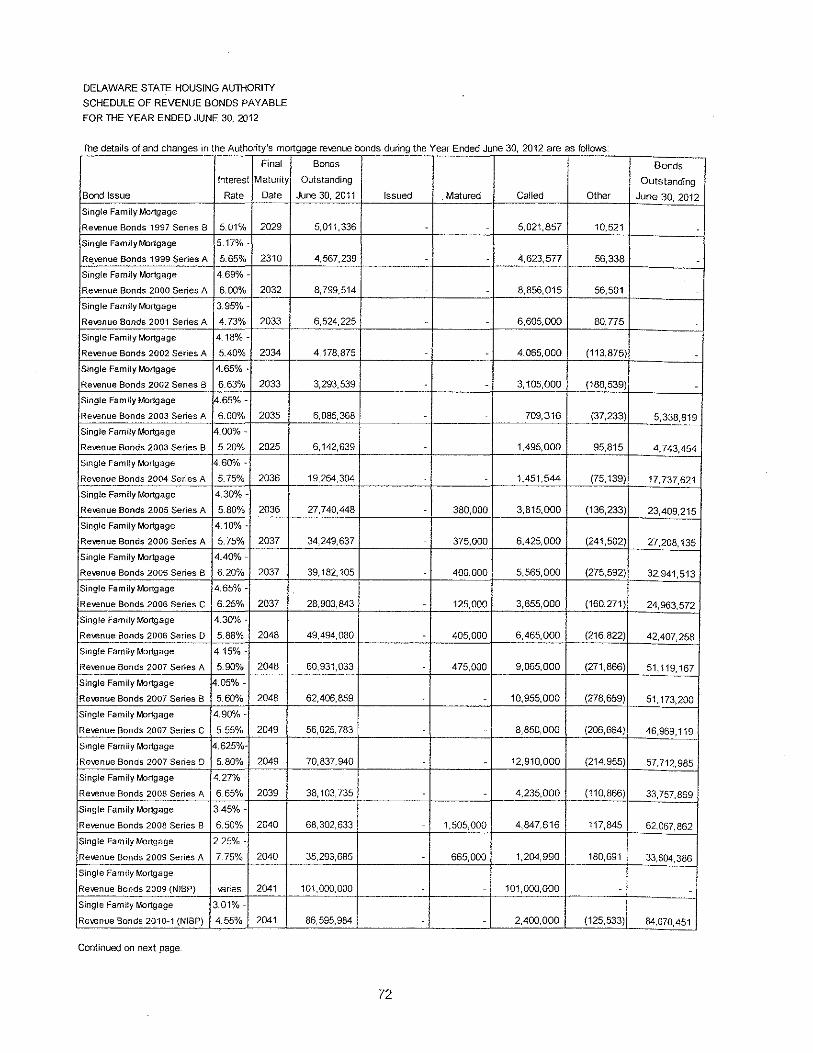
DELAWARE STATE HOUSING AUTHORITY
SCHEDULE OF REVENUE BONDS PAYABLE
FOR THE YEAR ENDED JUNE 30, 2012
The details of and changes in the Authority's mortgage re-.enue bonds during the Year Ended June 30 2012 are as follows
Final Bonds
Interest Maturity Outstanding
Bond Issue Rate Date June 30, 2011 Issued Matured Called Other
Single Family Mortgage
Re-.enue Bonds 1997 Series B 5.01% 2029 5,011,336 - 5,021,857 10,521
Single Family Mortgage 5.17%-
Re_venue Bonds 1999 Series A 5.65% 2310 4,567,239 - - 4,623,577 56,338
Single Family Mortgage 4.69%-
Revenue Bonds 2000 Series A 6.00% 2032 8,799,514 - 8,856,015 56,501
Single Family Mortgage 3.95%-
Re..enue Bonds 2001 Series A 4.73% 2033 6,524,225 - - 6,605,000 80,775
Single Family Mortgage 4.18%:>-
Revenue Bonds 2002 Series A SAO% 2034 4,178,875 - 4,065,000 (113,875)
Single Family Mortgage 4.65%-
Revenue Bonds 2002 Series 8 6.63% 2033 3,293,539 - 3,105,000 (188,539)
Single Family Mortgage 4.65%-
Re\o10!nue Bonds 2003 Series A 6.00% 2035 6,085,368 - 709,316 (37,233)
Single Family Mortgage 4.00%-
Re-..enue Bonds 2003 Series B 5.20% 2025 6,142,639 1,495,000 95,815
Single Family Mortgage 4.60%-
Re\o10!nue Bonds 2004 Series A 5.75% 2036 19,264,304 1,451,544 (75,139)
Single Family Mortgage 4.30%-
Re-..enue Bonds 2005 Series A 5.80% 2036 27,740,448 - 380,000 3,815,000 (136,233)
Single Family Mortgage 4.10%-
Revenue Bonds 2006 Series A 5.75% 2037 34,249,637 - 375,000 6,425,000 (241,502)
Single Family Mortgage 4.40%-
Re-..enue Bonds 2006 Series B 6.20% 2037 39,182,105 - 400,000 5,565,000 (275,592)
Single Family Mortgage 4.65%-
Re-..enue Bonds 2006 Series C 6.25% 2037 28,903,843 125,000 3,655,000 (160,271)
Single Family rv!ortgage 4.30%-
Re-..enue Bonds 2006 Series D 5.88% 2048 49,494,080 405,000 6,465,000 (216,822)
Single Family Mortgage 4.15%-
Re-..enue Bonds 2007 Series A 5.90% 2048 60,931,033 475,000 9,065,000 (271,866)
Single Family WK!rtgage 4.05%-
Re-..enue Bonds 2007 Series B 5.60%, 2048 62,406,859 - 10,955,000 (278,659)
Single Family Mortgage 4.90%-
Revenue Bonds 2007 Series C 5.55% 2049 56,025,783 - 8,850,000 (206,664)
Single Family Mortgage 4.625%-
Revenue Bonds 2007 Series D 5.80% 2049 70,837,940 - 12,910,000 (214,955)
Single Family WK!rtgage 4.27%-
Re-..enue Bonds 2008 Series A 6.65% 2039 38,103,735 - 4,235,000 (110,866)
Single Family Mortgage 3.45%-
Revenue Bonds 2008 Series B 6.50% 2040 68,302,633 - 1,505,000 4,847,616 117,845
Single Family Mortgage 2.25%-
Re\oenue Bonds 2009 Series A 7.75% 2040 35,293,685 665,000 1,204,990 180,691
Single Family Mortgage
Revenue Bonds 2009 (NIBP) varies 2041 101' 000,000 - 101,000,000
Single Family Mortgage 3.01%-
Re\oenue Bonds 2010-1 (NIBP) 4.55% 2041 86,595,984 - 2,400,000 (125,533)
Continued on next page
72
Bonds
Outstanding
June 30, 2012
-
-
-
5,338,819
4,743,454
17,737,621
23,409,215
27,208,135
32,941,513
24,963,572
42,407,258
51,119,167
51,173,200
46,969,119
57,712,985
33,757,869
62,067,862
33,604,386
-
84,070,451
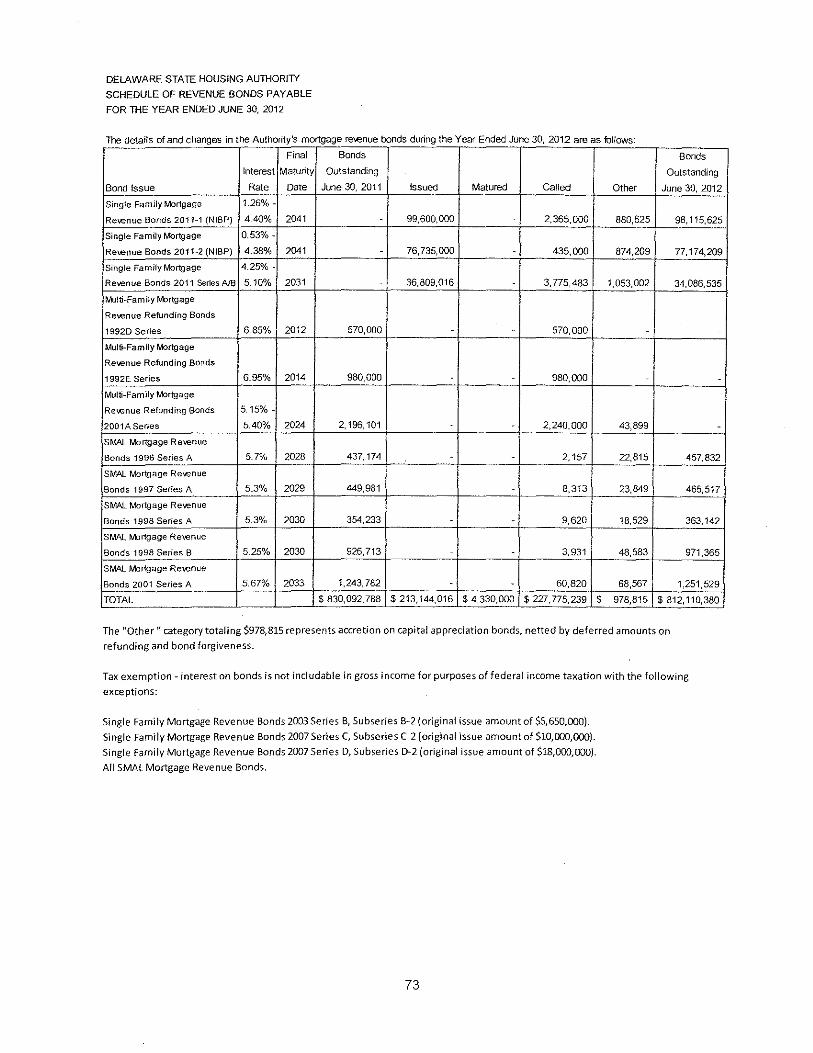
DELAWARE STATE HOUSING AUTHORI1Y
SCHEDULE OF REVENUE BONDS PAYABLE
FOR THE YEAR ENDED JUNE 30, 2012
The details of and changes in the Authority's mortgage re\€nue bonds during the Year Ended June 30 2012 are as fol!ows·
Final Bonds
Interest Maturity Outstanding
Bond Issue Rate Date June 30, 2011 Issued Matured Called Other
Single Family Mortgage 1.26%-
Revenue Bonds 2011-1 (NIBP) 4.40°/o 2041 - 99,600,000 - 2,365,000 880,625
Single Family Mortgage 0.53%-
Rewnue Bonds 2011-2 (NIBP) 4.38% 2041 - 76,735,000 435,000 874,209
Single Family Mortgage 4.25%-
Revenue Bonds 2011 Series AlB 5.10% 2031 - 36,809,016 3,775,483 1,053,002
Multi-Family rv1ortgage
Revenue Refunding Bonds
19920 Series 6.85% 2012 570,000 - - 570,000 -Multi-Family Mortgage
Revenue Refunding Bonds
1992E Series 6.95% 2014 980,000 980,000 -Multi-Family Mortgage
Revenue Refunding Bonds 5.15%-
2001ASeries 5.40% 2024 2, 196,101 - - 2,240,000 43,899
SMAL Mortgage Revenue
Bonds 1996 Series A 5.7% 2028 437,174 - - 2,157 22,815
SMAL fvbrtgage Revenue
Bonds 1997 Series A 5.3% 2029 449,981 - 8,313 23,849
SMM_ Mortgage Revenue
Bonds 1998 Series A 5.3% 2030 354,233 - - 9,620 18,529
SMAL Mortgage Revenue
Bonds 1998 Series 8 5.25% 2030 926,713 - 3,931 48,583
SMAL Mortgage Revenue
Bonds 2001 Series A 5.67% 2033 1,243,782 - - 60,820 68,567
TOTAL $ 830,092,788 $ 213,144,016 $ 4,330,000 $ 227,775,239 $ 978,815
Bonds
Outstanding
June 30, 2012
98,115,625
77,174,209
34,086,535
-
-
-
457,832
465,517
363,142
971,365
1,251,529
$812,110,380
The ''Other" category totaling $978,815 represents accretion on capita! appreciation bonds, netted by deferred amounts on
refunding and bond forgiveness.
Tax exemption- interest on bonds is not includable in gross income for purposes of federal income taxation with the following
exceptions:
Single Family Mortgage Revenue Bonds 2003 Series B, Subseries B-2 (original issue amount of $5,650,000).
Single Family Mortgage Revenue Bonds 2007 Series C, Subseries C-2 (original issue amount of $10,000,000). Single Family Mortgage Revenue Bonds 2007 Series D, Subseries D-2 (original issue amount of $18,000,000).
All SMAL Mortgage Revenue Bonds.
73

THIS PAGE INTENTIONALLY LEFT BLANK
74
DELAWARE STATE HOUSING AUTHORITY
SINGLE AUDIT SUPPLEMENT
75

THIS PAGE INTENTIONALLY LEFT BLANK
76
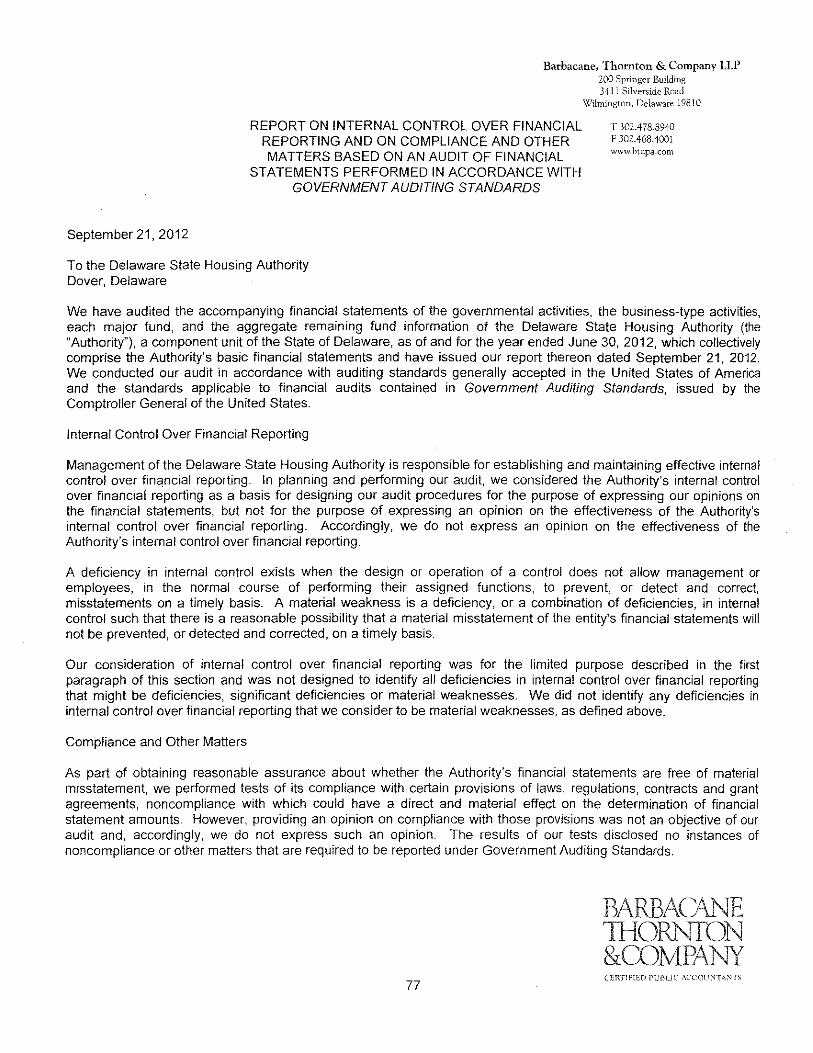
Barbacane, Thornton & Company LLP 200 Springer Building
September 21, 2012
REPORT ON INTERNAL CONTROL OVER FINANCIAL REPORTING AND ON COMPLIANCE AND OTHER MATTERS BASED ON AN AUDIT OF FINANCIAL
STATEMENTS PERFORMED IN ACCORDANCE WITH GOVERNMENT AUDITING STANDARDS
To the Delaware State Housing Authority Dover, Delaware
3411 Silverside Road Wilmington, Delaware 19810
T 302.478.8940 F 302.468.4001 www,htcpa.corn
We have audited the accompanying financial statements of the governmental activities, the business-type activities, each major fund, and the aggregate remaining fund information of the Delaware State Housing Authority (the "Authority"), a component unit of the State of Delaware, as of and for the year ended June 30, 2012, which collectively comprise the Authority's basic financial statements and have issued our report thereon dated September 21, 2012. We conducted our audit in accordance with auditing standards generally accepted in the United States of America and the standards applicable to financial audits contained in Government Auditing Standards, issued by the Comptroller General of the United States.
Internal Control Over Financial Reporting
Management of the Delaware State Housing Authority is responsible for establishing and maintaining effective internal control over financial reporting. In planning and performing our audit, we considered the Authority's internal control over financial reporting as a basis for designing our audit procedures for the purpose of expressing our opinions on the financial statements, but not for the purpose of expressing an opinion on the effectiveness of the Authority's internal control over financial reporting. Accordingly, we do not express an opinion on the effectiveness of the Authority's internal control over financial reporting.
A deficiency in internal control exists when the design or operation of a control does not allow management or employees, in the normal course of performing their assigned functions, to prevent, or detect and correct, misstatements on a timely basis. A material weakness is a deficiency, or a combination of deficiencies, in internal control such that there is a reasonable possibility that a material misstatement of the entity's financial statements will not be prevented, or detected and corrected, on a timely basis.
Our consideration of internal control over financial reporting was for the limited purpose described in the first paragraph of this section and was not designed to identify all deficiencies in internal control over financial reporting that might be deficiencies, significant deficiencies or material weaknesses. We did not identify any deficiencies in internal control over financial reporting that we consider to be material weaknesses, as defined above.
Compliance and Other Matters
As part of obtaining reasonable assurance about whether the Authority's financial statements are free of material misstatement, we performed tests of its compliance with certain provisions of laws, regulations, contracts and grant agreements, noncompliance with which could have a direct and material effect on the determination of financial statement amounts. However, providing an opinion on compliance with those provisions was not an objective of our audit and, accordingly, we do not express such an opinion. The results of our tests disclosed no instances of noncompliance or other matters that are required to be reported under Government Auditing Standards.
77
BARBAO\NE 1HORNTON &CDMPANY CERTIFIED PCBUC ACCOU~TA~T~
Delaware State Housing Authority Dover, Delaware
This report is intended solely for the information and use of the Authority's management, federal awarding agencies and pass-through entities, Office of the Governor, Office of the Controller General, Office of the Attorney General, Office of Management and Budget, Department of Finance, and Office of Auditor of Accounts; and is not intended to be and should not be used by anyone other than these specified parties. However, under 29 Dei.C., Section 10002(d), this report is a public record and its distribution is not limited.
BARBACANE, THORNTON & COMPANY LLP
78
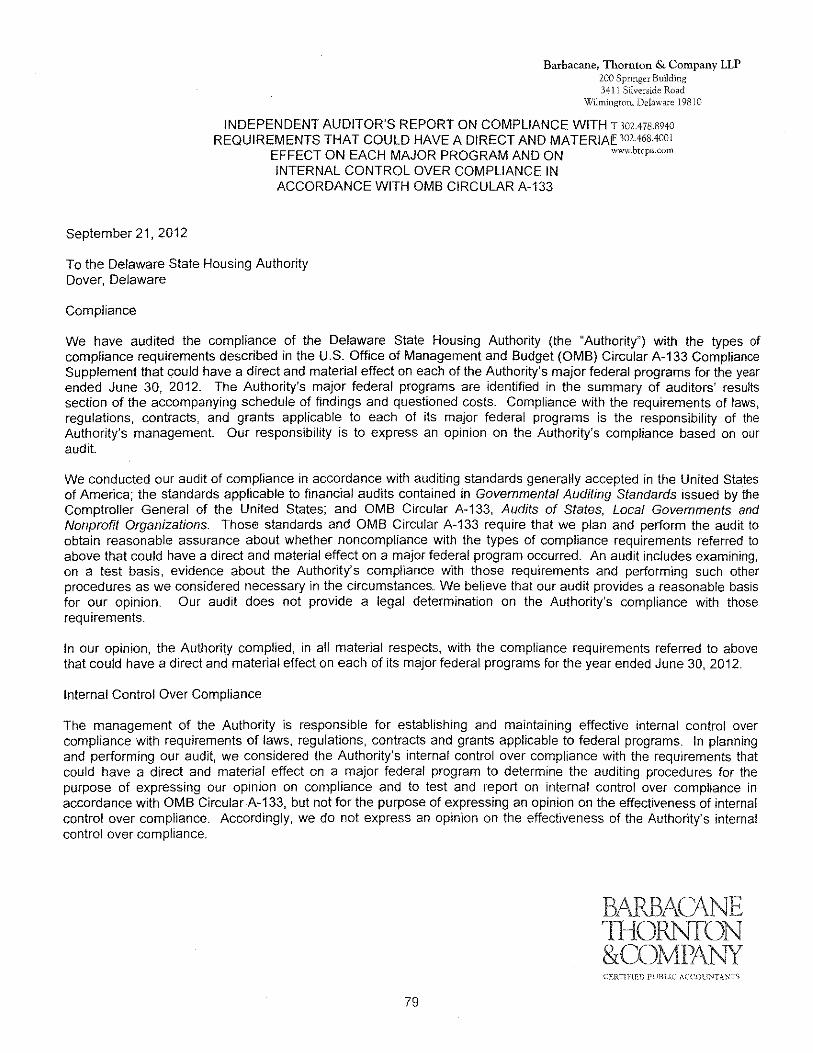
September 21, 2012
Barbacane, Thornton & Company LLP 200 Springer Building 3411 Si!verside Ro<1d
Wilmington, Delaware 19810
INDEPENDENT AUDITOR'S REPORT ON COMPLIANCE WITH T 302478.8940 REQUIREMENTS THAT COULD HAVE A DIRECT AND MATERIAJI'3024684001
EFFECT ON EACH MAJOR PROGRAM AND ON www.bropo.com
INTERNAL CONTROL OVER COMPLIANCE IN ACCORDANCE WITH OMB CIRCULAR A-133
To the Delaware State Housing Authority Dover, Delaware
Compliance
We have audited the compliance of the Delaware State Housing Authority (the "Authority") with the types of compliance requirements described in the U.S. Office of Management and Budget (OMB) Circular A-133 Compliance Supplement that could have a direct and material effect on each of the Authority's major federal programs for the year ended June 30, 2012. The Authority's major federal programs are identified in the summary of auditors' results section of the accompanying schedule of findings and questioned costs. Compliance with the requirements of laws, regulations, contracts, and grants applicable to each of its major federal programs is the responsibility of the Authority's management. Our responsibility is to express an opinion on the Authority's compliance based on our audit.
We conducted our audit of compliance in accordance with auditing standards generally accepted in the United States of America; the standards applicable to financial audits contained in Governmental Auditing Standards issued by the Comptroller General of the United States; and OMB Circular A-133, Audits of States, Local Governments and Nonprofit Organizations. Those standards and OMB Circular A-133 require that we plan and perform the audit to obtain reasonable assurance about whether noncompliance with the types of compliance requirements referred to above that could have a direct and material effect on a major federal program occurred. An audit includes examining, on a test basis, evidence about the Authority's compliance with those requirements and performing such other procedures as we considered necessary in the circumstances .. We believe that our audit provides a reasonable basis for our opinion. Our audit does not provide a legal determination on the Authority's compliance with those requirements.
In our opinion, the Authority complied, in all material respects, with the compliance requirements referred to above that could have a direct and material effect on each of its major federal programs for the year ended June 30, 2012.
Internal Control Over Compliance
The management of the Authority is responsible for establishing and maintaining effective internal control over compliance with requirements of laws, regulations, contracts and grants applicable to federal programs. In planning and performing our audit, we considered the Authority's internal control over compliance with the requirements that could have a direct and material effect on a major federal program to determine the auditing procedures for the purpose of expressing our opinion on compliance and to test and report on internal control over compliance in accordance with OMB Circular A-133, but not for the purpose of expressing an opinion on the effectiveness of internal control over compliance. Accordingly, we do not express an opinion on the effectiveness of the Authority's internal control over compliance.
79
BARBAO\NE 1HORNIDN &COMPANY CERTIFIED PUBLIC i\CCOt::\T,\NT'-:
Delaware State Housing Authority Dover, Delaware
A deficiency in internal control over compliance exists when the design or operation of a control over compliance does not allow management or employees, in the normal course of performing their assigned functions, to prevent, or detect and correct, noncompliance with a type of compliance requirement of a federal program on a timely basis. A material weakness in internal control over compliance is a deficiency, or combination of deficiencies, in internal control over compliance, such that there is a reasonable possibility that material noncompliance with a type of compliance requirement of a federal progmm will not be prevented, or detected and corrected, on a timely basis.
Our consideration of internal control over compliance was ·tor the limited purpose described in the first paragraph of this section and was not designed to identify all deficiencies in internal control over compliance that might be deficiencies, significant deficiencies or material weaknesses. We did not identify any deficiencies in internal control over compliance that we consider to be material weaknesses, as defined above.
This report is intended solely for the.information and use of the Authority's management, federal awarding agencies and pass-through entities, Office of the Governor, Office of the Controller General, Office of the Attorney General, Office of Management and Budget, Department of Finance, and Office of Auditor of Accounts; and is not intended to be and should not be used by anyone other than these specified parties. However, under 29 Dei.C., Section 10002(d), this report is a public record and its distribution is not limited.
J$~~1{/,-f?LLP BARBACANE, THORNTON & COMPANY LLP
80
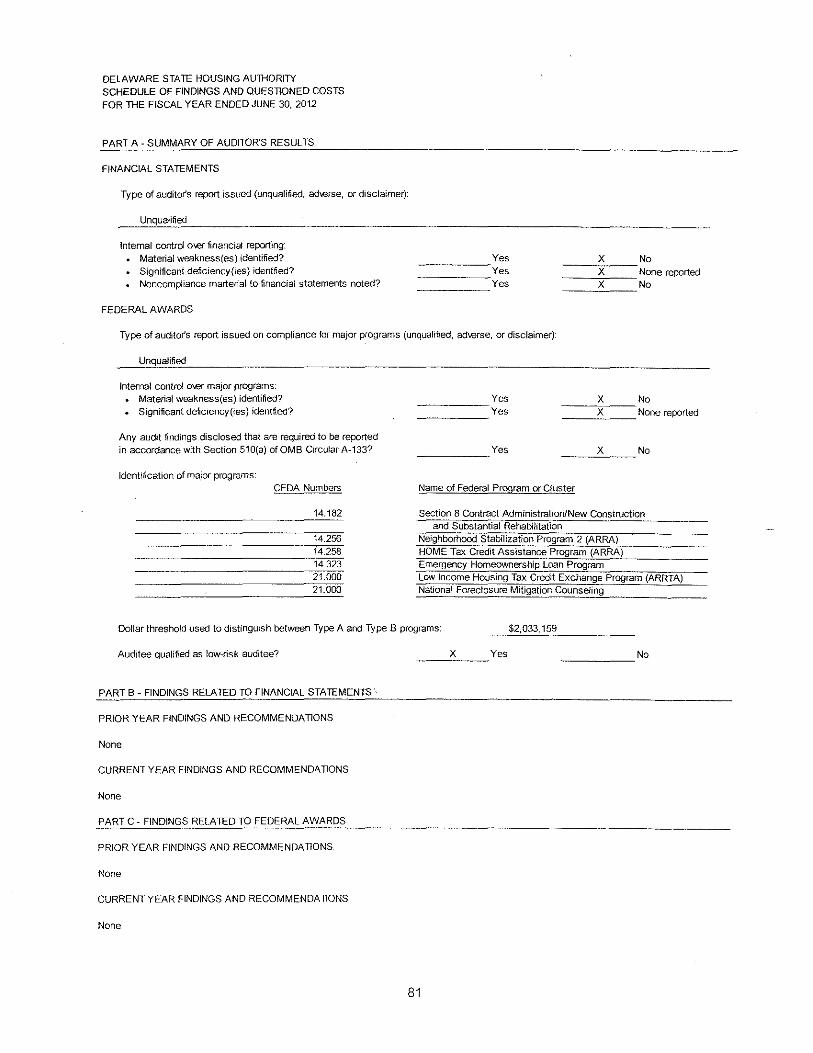
DELAWARE STATE HOUSING AUTHORITY
SCHEDULE OF FINDINGS AND OUESllONEO COSTS
FOR 1HE FISCAL YEAR ENDED JUNE 30, 2012
PART A- SUMMARY OF AUDITOR'S RESULTS
FINANCIAL STATEMENTS
Type of auditor's report issued (unqualified, ad\€rse, or disclaimer):
Unqualified
Internal control O\€r financial reporting:
Material weakness{es) identified?
Significant deficiency(ies) identfied? Noncompliance marterial to financial statements noted?
FEDERAL AWARDS
Yes ------Yes
______ Yes
X No ---'x:;---None reported
X No ---'-'--
Type of auditor's report issued on compliance far major programs (unqualified, ad\€rse, or disclaimer):
Unqualified
Internal control o-.er major programs:
Material weakness(es) identified? • Significant deficiency(ies) identfiecl?
Any audit findings disclosed that are required to be reported
in accordance with Section 510(a) of OMB Circular A-133?
Identification of major programs: CFDA Numbers
14.182
14.256 14.258 14.323 21.000 21.000
_____ Yes
Yes X No
---X7----None reported ----
_____ Yes __ _:X:.:__ __ No
Name of Federal Program or Cluster
Section 8 Contract Administration/New Construction and Substantial Rehabilitation
Neighborhood Stabilization Program 2 (ARRA)
HOME Tax Credit Assistance Program (ARRA)
Emergency Homeownership Loan Program
Low Income Housing Tax Credit Exchange Program (ARRTA) National Foreclosure Mitigation Counseling
Dollar threshold used to distinguish between Type A and Type 8 programs: $2,033,159
Auditee qualified as low-risk auditee? __ __:X:.:__ __ Yes _____ No
PART B- FINDINGS RELATED TO FINANCIAL STATEMENTS'
PRIOR YEAR FINDINGS AND RECOMMENDA llONS
None
CURRENT YEAR FINDINGS AND RECOMMENDA llONS
None
PART C- FINDINGS RELATED TO FEDERAL AWARDS
PRIOR YEAR FINDINGS AND RECOMMENDATIONS
None
CURRENT YEAR FINDINGS AND RECOMMENDA llONS
None
81
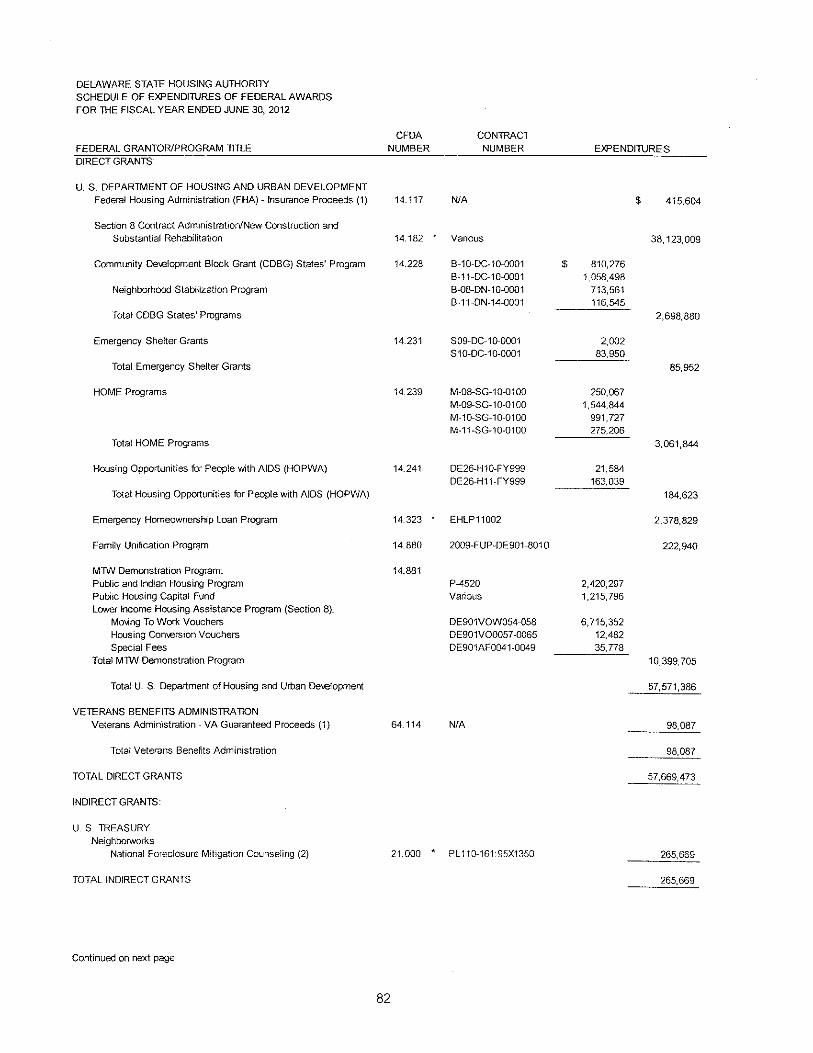
DELAWARE STATE HOUSING AUTHORITY
SCHEDULE OF EXPENDITURES OF FEDERAL AWARDS
FOR lHE FISCAL YEAR ENDED JUNE 30, 2012
CFDA CONTRACT FEDERAL GRANTOR/PROGRAM 11TLE NUMBER NUMBER EXPENDITURES
DIRECT GRANTS
U. S. DEPARTMENT OF HOUSING AND URBAN DEVELOPMENT
Federal Housing Administration (FHA)- Insurance Proceeds (1) 14.117 NIA $ 415,604
Section 8 Contract Administration/New Construction and
Substantial Rehabilitation 14.182 Various 38,123,009
Community De've!opment Block Grant (CDBG) States' Program 14.228 B-10-DC-10-0001 $ 810,276 B-11-DC-10-0001 1,058,498
Neighborhood Stabilization Program B-08-DN-10-0001 713,561 8-11-DN-14-0001 116,545
Total CDBG States' Programs 2,698,880
Emergency Shelter Grants 14.231 S09-DC-10--0001 2,002 S10-DC-10-0001 83,950
Total Emergency Shelter Grants 85,952
HOME Programs 14.239 M-08-SG-10-0100 250,067 M-09-SG-10-0100 1,544,844 M-10-SG-10-0100 991,727 M-11-SG-10-0100 275,206
Total HOME Programs 3,061,844
Housing Opportunities for People with AIDS (HOPWA) 14.241 DE26-H10-FY999 21,584 DE26-H11-FY999 163,039
Total Housing Opportunities for People with AIDS (HOPWA) 184,623
Emergency Homeownership loan Program 14.323 EHLP11002 2,378,829
Family Unification Progr~m 14.880 2009-FUP-DE901-801 0 222,940
MTW Demonstration Program: 14.881
Public and Indian Housing Program P-4520 2,420,297 Public Housing Capital Fund Various 1,215,796 Lower Income Housing Assistance Program (Section 8):
Moving To Work Vouchers DE901VOW054-058 6,715,352 Housing Comersion Vouchers DE901V00057-0065 12.482 Special Fees DE901AF0041-0049 35,778
Total MTW Demonstration Program 10,399,705
Total U. S. Department of Housing and Urban Development 57,571,386
VETERANS BENEFITS ADMINISTRA 110N
Veterans Administration- VA Guaranteed Proceeds (1) 64.114 N/A 98,087
Total Veterans Benefits Administration 98,087
TOTAL DIRECT GRANTS 57,669,473
INDIRECT GRANTS
u S TREASURY
Neighborworks
National Foreclosure Mitigation Counseling (2) 21.000 . PL110-16195X1350 265,669
TOTAL INDIRECT GRANTS 265,669
Continued on next page
82
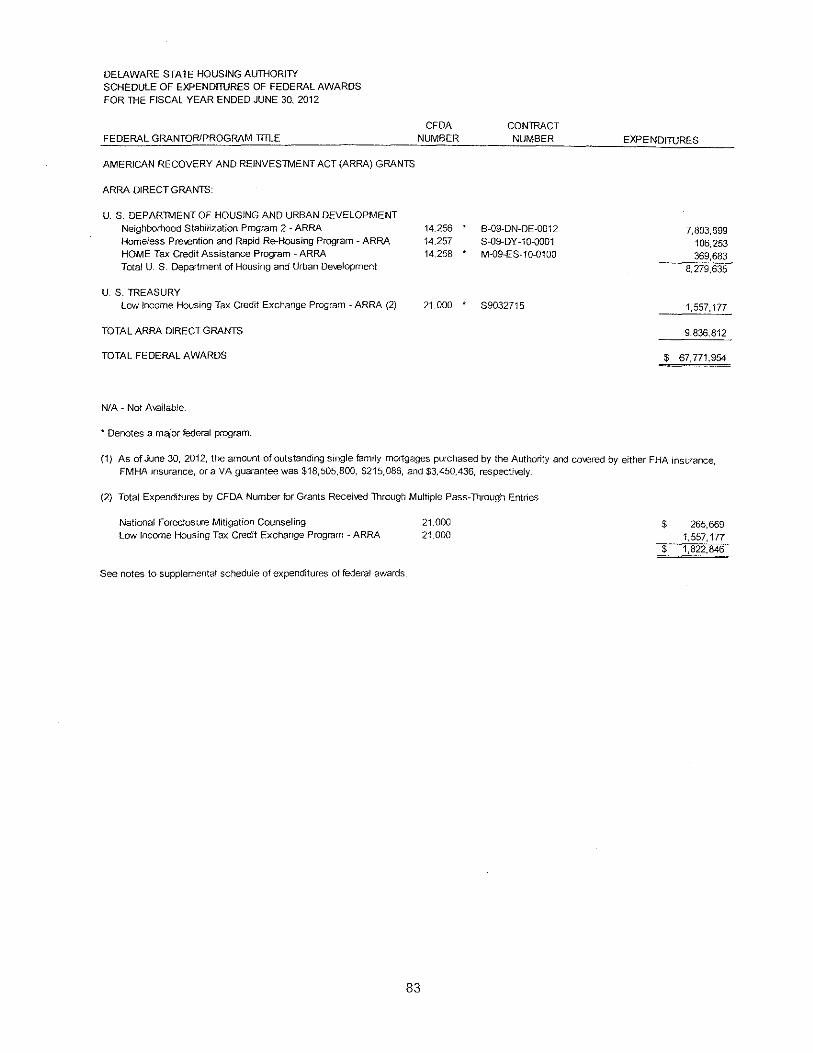
DELAWARE STATE HOUSING AUTHORI1Y SCHEDULE OF EXPENDITURES OF FEDERAL AWARDS FOR THE FISCAL YEAR ENDED JUNE 30, 2012
FEDERAL GRANTOR/PROGRAM TITLE
AMERICAN RECOVERY AND REINVESTMENT ACT (ARRA) GRANTS
ARRA DIRECT GRANTS:
U. S. DEPARTMENT OF HOUSING AND URBAN DEVELOPMENT Neighborhood Stabilization Program 2 ~ ARRA Homeless Pre-.ention and Rapid Re-Housing Program - ARRA HOME Tax Credit Assistance Program - ARRA Total U_ $_Department of Housing and Urban Oe\€1opment
U S. TREASURY Low Income Housing Tax Credit Exchange Program - ARRA (2)
TOTAL ARRA DIRECT GRANTS
TOTAL FEDERAL AWARDS
N/A- Not Available.
* Denotes a major federal program.
CFDA NUMBER
14.256 14.257 14.258
CONTRACT NUMBER
B-09-DN-DE-0012
S-09-DY-10-0001 M-09-ES-10-0100
21.000 * $9032715
EXPENDITIJRES
7,803,699 106,253 369,683
8,279,635
1,557,177
9,836,812
$ 67,771,954
(1) As of June 30, 2012, the amount of outstanding single family mortgages purchased by the Authority and co~.ered by either FHA insurance, FMHA insurance, or a VA guarantee was $18,505,800, $215,086, and $3.450,436, respecti\€/y.
(2) Total Expenditures by CFDA Number tor Grants Recei~.-ed Through Multiple Pass-Through Entries
National Foreclosure Mitigation Counseling Low Income Housing Tax Credit Exchange Program - ARRA
See notes to supplemental schedule of expenditures of federal awards
83
21_000
21.000 $ 265,669
1,557,177 $ 1,822,846
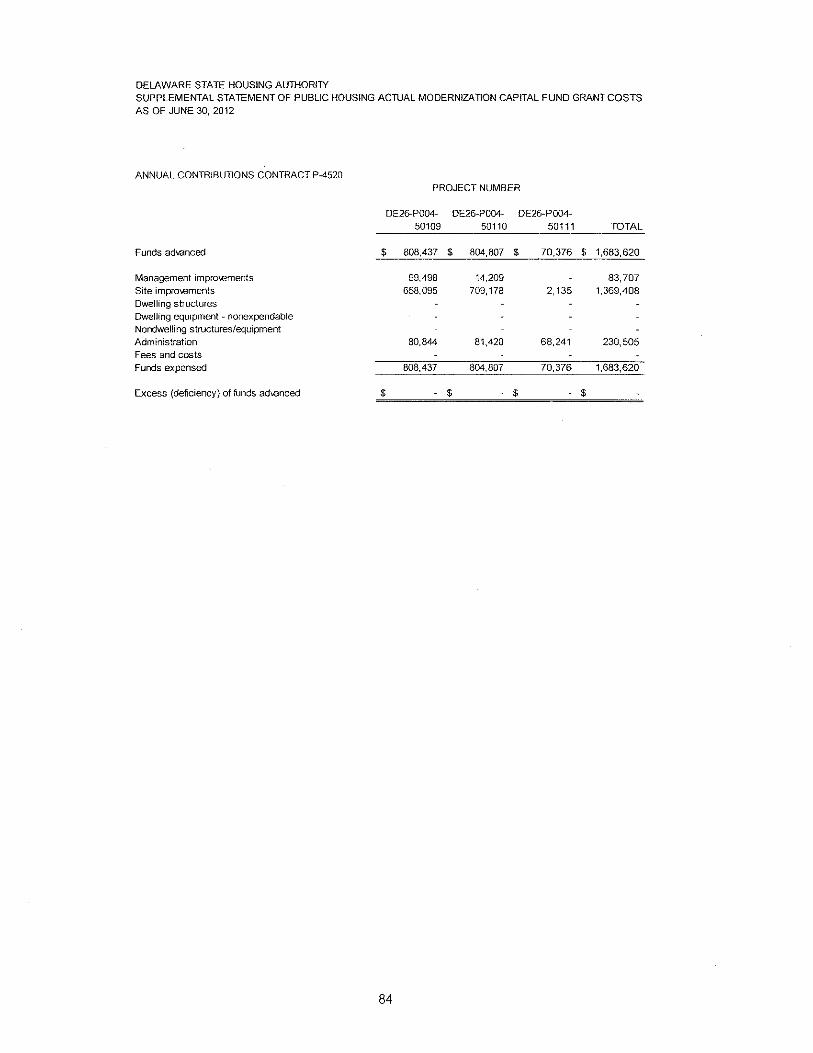
DElAWARE STATE HOUSING AUTHORITY SUPPLEMENTAL STATEMENT OF PUBLIC HOUSING ACTUAL MODERNIZATION CAPITAL FUNO GRANT COSTS AS OF JUNE 30, 2012
ANNUAL CONTRIBUTIONS CONTRACT P-4520 PROJECT NUMBER
DE26-P004- DE26~P004~ DE26-P004-50109 50110 50111 TOTAL
Funds advanced $ 808.437 $ 804,807 $ 70,376 $ 1,683,620
Management impro\€ments 69,498 14,209 83,707 Site impro-.ements 658,095 709,178 2,135 1,369,408 Dwelling structures Dwelling equipment - nonexpendab!e Nondwelling structures/equipment Administration 80,844 81,420 68,241 230,505 Fees and costs Funds expensed 808,437 804,807 70,376 1,683,620
Excess (deficiency) of funds advanced $ $ $ $
84
DELAWARE STATE HOUSING AUTHORITY
NOTES TO SCHEDULE OF EXPENDITURES OF FEDERAL AWARDS AND SUPPLEMENTAL STATEMENT OF PUBLIC HOUSING ACTUAL MODERNIZATION CAPITAL FUND GRANT COSTS
1. SUMMARY OF SIGNIFICANT ACCOUNTING POLICIES
HUD regulations prescribe the accounting principles and financial reporting requirements to be followed by the Authority in the preparation of supplemental schedules prepared under the annual contributions contracts. The following is a summary of the significant accounting and reporting policies followed by the Authority.
Basis of Accounting - The schedule of expenditures of federal awards is prepared on the accrual basis of accounting with the exception of advance payments, which are considered to be expenditures when passed through to the subrecipient.
85

86