Delaware Solid Waste Authority Statewide Waste...
68
Submitted by: Delaware Solid Waste Authority Statewide Waste Characterization Study, FY 2016 FINAL REPORT January 9, 2017
Transcript of Delaware Solid Waste Authority Statewide Waste...

Submitted by:
Delaware Solid Waste Authority Statewide Waste Characterization Study, FY 2016 FINAL REPORT
January 9, 2017

Delaware Solid Waste Authority | Statewide Waste Characterization Study
Delaware Solid Waste Authority Statewide Waste Characterization Study
FY 2016
FINAL REPORT
TABLE OF CONTENTS
EXECUTIVE SUMMARY ....................................................................................................................... i Introduction ............................................................................................................................................... i Results ...................................................................................................................................................... ii
Total Tonnage by Facility ...................................................................................................................... ii Per Capita and Per Household Disposal ............................................................................................... ii State-Wide Aggregated Composition .................................................................................................. iv State-Wide Aggregated Composition- Allocation of Residential and ICI MSW................................... vi
I. INTRODUCTION ..............................................................................................................................1 II. METHODOLOGY .............................................................................................................................3
Definitions of Waste Sectors .................................................................................................................... 3 Statistical Sampling of Residential and ICI Wastes ................................................................................... 3
Vehicle Selection .................................................................................................................................. 3 Allocation of Samples by Site, Sector, Vehicle Type, and Season ........................................................ 4 Visual Surveys of Self-Haul Loads ......................................................................................................... 5 Driver Surveys ...................................................................................................................................... 6
III. RESULTS ........................................................................................................................................7
Allocation of Tons Delivered to DSWA Facilities ...................................................................................... 7 Material Composition by Management Type ........................................................................................... 8 State-Wide Aggregate Waste Composition .............................................................................................. 9 Analysis by Facility .................................................................................................................................. 13
Cherry Island Landfill .......................................................................................................................... 13 Pine Tree Transfer Station .................................................................................................................. 15 Sandtown Landfill ............................................................................................................................... 17 Milford Transfer Station ..................................................................................................................... 19 Route 5 Transfer Station .................................................................................................................... 21 Jones Crossroads Landfill ................................................................................................................... 23
Multi-Family MSW .................................................................................................................................. 25 Self-Haul Loads ....................................................................................................................................... 25 Targeted Generator Loads ...................................................................................................................... 30

Delaware Solid Waste Authority | Statewide Waste Characterization Study
IV. ANALYSIS OF RESULTS ................................................................................................................. 36
Change in Tons Disposed ........................................................................................................................ 36 Success of Recent Diversion Efforts ........................................................................................................ 37 Organic Waste Diversion ........................................................................................................................ 39 General Observations ............................................................................................................................. 40
Per Capita and Per Household Disposal ............................................................................................. 40 Comparison with Other Recent Waste Characterizations ................................................................. 40 Comparison of Residential and ICI MSW ............................................................................................ 41 Multi-Family Residential..................................................................................................................... 42 Targeted Commercial Generators ...................................................................................................... 42
State-Wide ..................................................................................................................................... 46 Cherry Island .................................................................................................................................. 48 Pine Tree Transfer Station .............................................................................................................. 50 Sandtown ....................................................................................................................................... 52 Milford Transfer Station ................................................................................................................. 54 Route 5 Transfer Station ................................................................................................................ 56 Jones Crossroads Landfill ............................................................................................................... 58
APPENDIX
A - MATERIAL SORT CATEGORIES B - HAND SORT DATA, SEASON 2, JUNE 2016

Delaware Solid Waste Authority | Statewide Waste Characterization Study
| i
EXECUTIVE SUMMARY
Introduction
The Delaware Solid Waste Authority (DSWA) contracted with DSM Environmental Services, Inc. (DSM) to conduct a characterization study of municipal solid waste (MSW) generated in Delaware and disposed at DSWA facilities. DSM has sub-contracted with MidAtlantic Solid Waste Consultants (MSW Consultants) to conduct hand sorting of MSW, and Cascadia Consulting Group (Cascadia) to statistically analyze the samples (collectively called the Project Team). DSWA contracted for a two season study to characterize mixed solid waste delivered to DSWA’s six transfer and disposal facilities. One hundred and eight samples of Residential and Industrial, Commercial and Institutional (ICI) waste were sorted over one week in November, 2015 and another 102 samples sorted over one week in June, 2016. Solid waste from both the Residential and ICI sectors were subject to a statistical sampling process, and the representative, randomly chosen samples hand sorted into up to 54 material types. An analysis of the weight data associated with each sample produced estimates of the average waste composition from each sector. Hand sorting also involved sorting of targeted generator loads from the following specified ICI generator categories, as well as residential waste from multi-family buildings:
Small retail;
Large retail;
Office;
Restaurant;
Convenience stores; and,
Grocery stores. Visual characterizations of Self-Haul loads were also carried out to characterize this waste stream for inclusion in the total waste characterization analysis. Finally, surveys of waste truck drivers entering each facility were carried out to more accurately characterize the delivered waste between residential and ICI loads. These driver surveys were used to refine the estimates of total tons of residential versus ICI waste delivered to each DSWA facility. The refined tonnage data, multiplied by the waste characterization percentages, yield total estimated tons by material type and generator type disposed at each DSWA facility, and in aggregate, state-wide. Data from the two seasons were aggregated to create state-wide tonnages by material type. These are weighted averages based on the throughput of each facility, and are therefore representative of total state-wide waste disposal by material type. The sampling methodology for this 2015/16 waste characterization analysis is the same as that used to conduct the 2006/2007 waste characterization study (Final Report, October 31, 2007). As such it is

Delaware Solid Waste Authority | Statewide Waste Characterization Study
| ii
possible to compare the results over the two time periods to determine what changes have occurred in waste disposal in Delaware over the past seven years1.
Results
Total Tonnage by Facility
Table E.1 presents total Residential, ICI, and C&D/Other tonnage by facility which were used to calculate tons by material type delivered to each facility, and to aggregate the tonnage over the six DSWA facilities. Note that because C&D wastes were not characterized, C&D waste delivered by Self-Haul vehicles as well as by commercial haulers has been excluded from the analysis, in order to calculate total municipal solid waste (MSW) only, by facility, as presented in the grey highlighted columns. Table E.1. Allocation of Tonnage by Facility, July 2015 – June 2016 Facility
Res ICI Res ICI C&D Res ICI C&D & Other Bulky MSW All Waste
(tons) (tons) (tons) (tons) (tons) (tons) (tons) (tons) (tons) (tons) (tons)
Sandtown 33,369 39,050 3,147 179 851 36,516 39,229 10,257 4,877 75,745 91,730
Jones Crossroads 21,274 29,762 2,468 1,825 7,971 23,741 31,587 70,376 12,091 55,328 145,766
Cherry Island 152,618 151,901 1,310 9,836 6,001 153,927 161,737 40,344 6,277 315,664 368,285
Pine Tree 37,945 24,064 1,676 450 1,486 39,621 24,514 3,747 1,497 64,135 70,866
Milford 20,665 14,571 1,778 252 614 22,443 14,823 836 651 37,266 39,366
Route 5 41,392 34,716 2,519 149 1,816 43,910 34,866 3,265 1,251 78,776 85,108
Total 18,738 320,159 306,755 128,825 26,644 626,914 801,121
MSW Self-Haul Total MSW Non-MSW Grand Total
Per Capita and Per Household Disposal
Total residential and ICI waste disposed at DSWA facilities has declined by 35 and 31 percent respectively between 2006/07 and 2015/16. It is interesting to convert this decline into per capita and per household disposal, both overall and for residential waste only. Extrapolating from US census data, the population of Delaware in 2007 was roughly 863,500 with approximately 328,300 (rounded) households. Delaware’s population had increased to 945,900 (rounded) by 2015 with 360,000 households. Dividing total, residential and ICI waste by population and households in both time periods, per capita and per household disposal rates can be calculated. As illustrated by Table E.2, there has been a significant decline in per capita and per household disposal over the seven years between the two waste characterization studies. As discussed in the body of this report, this is due to both national trends toward light-weighting of materials as well as State of Delaware policies enacted since 2007 which have increased diversion for recycling and yard waste processing.
1 The only exception is that Construction & Demolition (C&D) wastes were not characterized for this study but
were characterized in 2006/07.

Delaware Solid Waste Authority | Statewide Waste Characterization Study
| iii
Table E.2. Comparison of Annual Per Capita and Per Household Disposal Rates, 2006/08 and 2015/16, in Pounds
2006/07 Unit Per Capita Per HH
Population 863,500
Households 328,327
Total MSW (tons) 933,683 2,163 5,688
Residential Tons 491,686 1,139 2,995
ICI Tons 441,997 1,024 2,692
2015/16
Population 945,934
Households 359,677
Total MSW (tons) 626,914 1,325 3,486
Residential Tons 320,159 677 1,780
ICI Tons 306,755 649 1,706 Table E.3 then compares disposal of recyclables accepted at the single stream MRF, and yard waste banned from landfills for 2006/07 and 2015/16. Paper and bottles and cans accepted at the Single Stream MRF are highlighted in blue, with yard waste banned from landfill highlighted in green. As illustrated by Table E.3, there has been an overall reduction in disposal of recyclables since the 2006/07 Waste Characterization of 52 percent, and a similar reduction in yard waste disposal of 61 percent. The bulk of the reduction in recyclables disposed at DSWA facilities comes from reductions in paper – with the greatest reduction occurring in newsprint. Newsprint declines represent a combination of declining newspaper sales, and the ease of recycling newspaper under the Universal Recycling law. Corrugated cardboard disposal has also declined significantly, despite the increased use of corrugated cardboard to ship products to homes via Amazon and other large on-line retailers. In this case, the decline is almost completely attributable to the ease of recycling under the Universal Recycling law. Disposal of plastic packaging has also declined, although by smaller amounts due in part to the large increase in quantities of plastic packaging over the past ten years. And finally, as illustrated by Table E.2, yard waste has declined significantly due to the ban on disposal of yard waste and the availability of alternative management options for yard waste.

Delaware Solid Waste Authority | Statewide Waste Characterization Study
| iv
Table E.3. Percent Reduction in Recyclables and Yard Waste Disposed at DSWA Facilities, 2006/07 to 2015/2016 Material 2006/07 2015/16 % Reduction
(tons) (tons)
Total Paper 189,959 77,205 59%
Newspaper and Inserts 31,530 10,317 67%
Corrugated Cardboard/Kraft Paper 89,803 36,907 59%
High Grade Office Paper 18,013 5,809 68%
Mixed Recyclable Paper 50,613 22,731 55%
Aseptic Boxes and Gable Top Cartons - 1,441
Total Plastic 24,135 19,773 18%
PET #1 Bottles, Jars, or Containers 9,638 10,993 -14%
HDPE #2 Natural and Colored Bottles 6,945 5,352 23%
Rigid HDPE #2 Containers - 510
#3 to #7 Bottles or Jars 1,026 523 49%
Injection Molded Tubs #2, #4, #5, #6, & #7 2,076 1,728 17%
All Other Rigid Plastic Packaging 4,450 668 85%
Total Metal Food and Beverage Containers 12,596 8,053 36%
Tin/Steel Containers 8,220 5,333 35%
Aluminum Beverage & Cat Food Containers 4,376 2,720 38%
Total Glass Containers 18,188 13,437 26%
Glass Bottles and Jars 18,188 13,437 26%
Total Single Stream Material 244,878 118,468 52%
Total Yard Waste 70,392 27,571 61%
Leaves, Grass, and Brush 68,662 25,690 63%
Branches and Stumps 1,730 1,881 -9%
State-Wide Aggregated Composition
Figures E.1 through E.2 present state-wide composition (combined Residential and ICI MSW) by potential management category, showing materials being disposed that could be delivered to the Materials Recovery Facility (MRF) in blue, and materials that could conceivably be managed through an organics management facility in green. As illustrated by Figure E.2 roughly 19 percent (rounded) of the total material disposed at DSWA facilities could be recycled under the Universal Recycling law, and another 26 percent diverted to one or more organics processing facilities. However, it is important to note that no recycling or organics diversion program recovers one hundred percent of the material that could be managed. In fact, recent recovery rate data from other states indicate that a recovery rate of 60 to 80 percent would be considered a high performing program. A second report outlining actual recovery rates for key materials is being prepared by DSM for DSWA based on the results of this Waste Characterization study and the annual RPAC recycling report. This second report will provide additional information for DSWA as to the success of current recycling programs. However, as illustrated by Table E.2 above, increased recycling and yard waste management have clearly resulted in significant declines in the disposal or recyclables and yard waste.

Delaware Solid Waste Authority | Statewide Waste Characterization Study
| v
Figure E.1.
Tons Disposed by Management Category, Statewide Residential and ICI MSW Combined
Figure E.2. Percent Composition by Management Category, Statewide Combined Residential and ICI
MSW Disposed

Delaware Solid Waste Authority | Statewide Waste Characterization Study
| vi
State-Wide Aggregated Composition- Allocation of Residential and ICI MSW
Figures E.3 and E.4 present state-wide aggregated composition by management category for Residential MSW only and ICI MSW only.
Figure E.3. State-Wide Composition of Residential MSW by Management Category
Figure E.4.
State-Wide Composition of ICI MSW by Management Category

Delaware Solid Waste Authority | Statewide Waste Characterization Study
| 1
I. INTRODUCTION
The Delaware Solid Waste Authority (DSWA) contracted with DSM Environmental Services, Inc. (DSM) to conduct a characterization study of municipal solid waste (MSW) generated in Delaware and disposed at DSWA facilities. DSM sub-contracted with MidAtlantic Solid Waste Consultants (MSW Consultants) to conduct hand sorting of MSW, and Cascadia Consulting Group (Cascadia) to statistically analyze the samples (collectively called the Project Team). The primary purpose of the Statewide Waste Characterization Study was to estimate the composition of waste from Residential and Institutional /Commercial/Industrial (ICI) generators disposed at DSWA facilities. The resultant data will help guide DSWA future planning.
The study was carried out over the course of two seasons (Fall/November, 2015 and Summer/June, 2016), with waste sampling activities occurring at all six DSWA facilities. An Interim Report (March 2016) presented the results of the fall season sort in percentages only, not in tons. This was to emphasize that the fall data could not be relied on to adequately characterize deliveries to DSWA facilities, given the sample size and single season of sampling. Subsequent to the June sampling, the results of the fall and summer waste sampling were combined, and are presented in detail in this Final Report. The data for the summer sort only are presented, in percentages by material type, in Appendix A for comparison against the fall (November) sample results.
Solid waste from both the Residential and ICI sectors were subject to a statistical sampling process, and the representative, randomly chosen samples hand sorted into up to 54 material types (note that not all material types will be present in any one sample). An analysis of the weight data associated with each sample produces estimates of the average waste composition from each sector.
Hand sorting also involved collection and sorting of samples from targeted generator loads from the following specified ICI generator categories:
Small retail;
Large retail;
Office;
Restaurant;
Convenience stores; and,
Grocery stores.
Finally, hand sorting included limited sorting of residential waste identified as coming from multi-family buildings. Visual characterizations of Self-Haul loads were also carried out to characterize this waste stream for inclusion in the total waste characterization analysis.2 In addition to hand sorting of residential and ICI waste, DSM also conducted surveys of drivers entering each facility to more accurately allocate waste deliveries to the residential and ICI sectors. Driver survey
2 Exclusive of yard waste delivered to the yard waste recycling areas

Delaware Solid Waste Authority | Statewide Waste Characterization Study
| 2
results by vehicle type were used to refine the estimates of total tons of residential versus ICI waste delivered to each DSWA facility. The refined tonnage data, multiplied by the waste characterization percentages, yield total estimated tons by material type and generator type disposed at each DSWA facility, and in aggregate, state-wide. It should be noted that the sampling methodology for this 2015/16 waste characterization analysis is the same as that used to conduct the 2006/2007 waste characterization study (Final Report, October 31, 2007). However, this 2015/2016 characterization does not characterize waste coded as construction and demolition (C&D) waste entering DSWA facilities. Because C&D wastes were characterized in 2006/2007 with the results added to the mixed solid waste, the 2015/2016 facility tonnages shown are lower because coded C&D loads are excluded. While this difference in methodology prevents direct comparison of the composition percentages when compared to 2006/2007, a review of tons disposed, by material type, allows for comparing the two reports. Percentages by material type will be higher for MSW materials in 2015/2016 because coded C&D wastes have been excluded from the tables.3 But tonnages have been significantly reduced, as illustrated by Table E.2 and 43.
3 C&D material disposed as mixed solid waste (MSW) is included in this analysis but the majority of C&D waste
delivered to DSWA facilities is coded as C&D waste at the scale house and is not included in this analysis.

Delaware Solid Waste Authority | Statewide Waste Characterization Study
| 3
II. METHODOLOGY
Definitions of Waste Sectors
The sectors of the waste stream analyzed in the study are defined as follows:
Residential – defined as waste brought to the DSWA landfill or transfer station by commercially or municipally operated vehicles, in which 80% or more of the waste is from single-family and/or multifamily residential sources.
Institutional/Commercial/Industrial (ICI) – defined as waste brought to the DSWA landfill or transfer station by commercially operated vehicles, in which 80% or more of the waste is from institutional, commercial, or industrial sources. This sector excludes Construction and Demolition debris as well as Bulky Waste.
Unacceptable Loads – Loads that contain less than 80% of either residential or ICI waste, and loads primarily containing Bulky Waste, C&D waste, or Special Wastes.
Self-Haul Wastes – Wastes delivered to DSWA facilities by residents and small contractors, as opposed to commercial haulers. This waste was visually characterized at each facility and included in this report.
Statistical Sampling of Residential and ICI Wastes
Vehicle Selection
At each facility the Field Supervisor followed a systematic selection procedure to identify residential and ICI waste vehicles for sampling. To calculate vehicle sampling frequency for each waste sector, the Field Supervisor first established a sampling interval at each facility. Sampling intervals were determined by dividing the total expected number of loads for each sector arriving at the facility on the scheduled day by the number of samples needed each day. The resulting number was the sampling frequency, which determined whether, for example, every third vehicle, sixth vehicle, or 20th vehicle was selected for sampling. Vehicles entering the DSWA facility during the hand sorting days that met the definition of the nth vehicle were first surveyed by the Field Supervisor to verify they were eligible for sampling. Eligibility was determined by verifying the load fit within the residential and ICI definitions (see above). The Field Supervisor collected data regarding the vehicle type and waste type and assuming the load was suitable for sampling, contacted the scale house with the appropriate identifying information (hauler name and DSWA placard number) so that a weight slip could be set aside for the Field Supervisor to collect at the end of the day for all loads sampled. The driver was then directed to dump the entire load in a designated area for sampling. From each selected load, one sample of waste was taken based on systematic “grabs” from the perimeter of the load. For example, if the tipped pile is viewed from the top as a clock face with 12:00 being the part of the load closest to the front of the truck, the first sample is taken from 3 o’clock, then 6 o’clock, 9 o’clock, in a continuous rotation.

Delaware Solid Waste Authority | Statewide Waste Characterization Study
| 4
Then, with the assistance of a loader operator, a sample of waste was removed by machine from the designated area and brought to the sample staging area. Depending upon the availability of key host facility personnel, the Field Supervisor either collected the sample directly from the bucket of the front-end loader, or directed the sample to be dumped on a tarp or a paved surface. When collecting samples directly from the bucket, 35-gallon cans or carts were arranged side-by-side on a tarp, with the loader bucket positioned directly overhead. The Field Supervisor then collected the sample systematically, by working from one side of the bucket to the other, emptying all of the contents from the front of the bucket to the back, until the desired sample weight (200 – 250 pounds) was achieved. To minimize sample collection bias, samples were collected from the loader bucket in an alternating fashion by working from the left side of the bucket to the right side for one sample, and then from right to left for the next sample.
Allocation of Samples by Site, Sector, Vehicle Type, and Season
The Study Design specified hand-sorting 40 samples of residential and 60 samples of ICI waste each season, each weighing 200 to 250 pounds. The overall quota of 208 samples (over the two seasons) was split relatively evenly over the six DSWA facilities, although more days were spent at the Cherry Island facility to accommodate the additional multi-family and targeted generator loads (see below). Tables 1 and 2 summarize planned and actual sample targets by generator category and facility for each season. Note that for the targeted commercial generator loads, four samples were taken from a single load which contained waste from multiple generators of the same commercial sector due to the high cost of obtaining the samples (which required paying the company an hourly charge for the truck and driver to collect the load from multiple locations). A single sample could also be obtained from a roll-off that is identified as one of the targeted loads, such as a grocery store. In addition, if a roll-off was randomly selected for ICI sampling, but also identified as one of the targeted generators (e.g. grocery, large retail, or office) the sample was counted as both one of the ICI samples and one of the targeted samples. As illustrated by Tables 1 and 2, the Project Team exceeded the goal of 208 samples over both seasons. Table 1. Planned and Actual Sample Count by Generator Type and Location, November 2015 Facility
Planned
RES
Actual
RES
Planned
MF
Actual
MF
Planned
ICI
Actual
ICI
Planned
Sourced
Target
Actual
Sourced
Target
Planned
Targeted
RO
Actual
Targeted
RO
Planned
TOTAL
Actual
TOTAL
Milford TS 5 5 5 5 1 10 11
Route 5 TS 5 5 6 6 11 12
Sandtown Landfill 4 5 8 11 1 12 17
Cherry Island Landfill 5 4 8 8 5 5 8 20 4 30 37
Jones Crossroads Landfill 4 6 4 6 4 4 8 1 20 17
Pine Tree Corners TS 9 7 8 3 4 4 21 14
Totals 32 32 8 8 36 36 12 24 16 7 104 108
Season 1 Sample Summary
Notes: RES – Residential MF – Multi-Family ICI – Institutional, Commercial, Industrial RO – Roll-Off

Delaware Solid Waste Authority | Statewide Waste Characterization Study
| 5
Table 2. Planned and Actual Sample Count by Generator Type and Location, June 2016
Facility
Planned
RES
Actual
RES
Planned
MF
Actual
MF
Planned
ICI
Actual
ICI
Planned
Sourced
Targeted
Actual
Sourced
Targeted
Planned
Targeted
RO
Actual
Targeted
RO
Planned
TOTAL
Actual
TOTAL
Milford TS 5 8 5 4 1 10 13
Route 5 TS 5 4 6 4 4 1 11 13
Sandtown Landfill 4 7 8 8 1 12 16
Cherry Island Landfill 5 3 8 4 5 5 8 16 4 1 30 29
Jones Crossroads Landfill 4 6 4 8 4 0 8 1 20 15
Pine Tree TS 9 5 8 10 4 1 21 16
Totals 32 33 8 4 36 39 12 20 16 6 104 102
Season 2 Sample Summary
Visual Surveys of Self-Haul Loads
In addition to hand sorting, the Project Team conducted four (4) hours of visual surveys of self-haul loads at each facility each season. This resulted in completing a total of 162 visual surveys in November and 178 visual surveys in June, as illustrated by Table 3. The visual surveys were conducted similar to a recent C&D characterization study performed by DSWA (see Construction and Demolition Waste Characterization, Jones Crossroads Landfill, December 2015), using the same visual form, but with the enumerator stationed at the small vehicle unloading area. It should be noted here, that because of the more extensive analysis of loads at the Jones Crossroads landfill in 2015, self-haul visuals were conducted only at the lower level at the Jones Crossroads landfill, as opposed to both the lower level and the small load landfill face at both Sandtown and Cherry Island. Table 3. Visual Survey Count by Facility, November 2015 and June 2016
Facility November J une
Cherry Island 37 39
Pine Tree 40 33
Milford 22 20
Route 5 14 25
Sandtown 29 49
Jones Crossroads 20 12
Total 162 178 Standard visual estimation protocol requires the enumerator to first annotate all of the materials observed in the load, and then to estimate the volume percentage of each material from the largest to the smallest. Note that there is significantly greater error in visual volumetric estimation compared to physical sorting and weighing. For that reason, volumetric estimates for large materials are typically to the nearest five percent, with trace amounts of materials recorded as one percent. All bagged waste was simply recorded as MSW, with the volume estimated. The composition of the bagged waste was then assumed to be the same as the average of the hand sorted residential and ICI waste.

Delaware Solid Waste Authority | Statewide Waste Characterization Study
| 6
Driver Surveys
Driver Surveys were carried out for a minimum of four (4) hours at each of the six DSWA facilities. The purpose of the driver surveys was to confirm (or modify) past DSWA driver survey data designed to allocate waste in rear-load, side-load and front-load trucks into residential versus ICI wastes. A total of 152 driver surveys were carried out over the six DSWA facilities in Season 1 and 169 in Season 2, as illustrated by Tables 4 and 5.
Table 4. Driver Surveys by Facility, November 2015
Date Location # Surveys
16-Nov-15 Cherry Island 31
17-Nov-15 Pine Tree 24
18-Nov-15 Sandtown 25
19-Nov-15 Milford 11
19-Nov-15 Route 5 16
20-Nov-15 Jones Crossroads 45
Total: 152
Table 5. Driver Surveys by Facility, June 2016
Date Location # Surveys
22-Jun-16 Route 5 35
23-Jun-16 Milford 20
24-Jun-16 Jones Crossroads 53
27-Jun-16 Pinetree 11
27-Jun-16 Sandtown 9
28-Jun-16 Cherry Island 41
Total: 169 The surveys involved asking the driver what type of waste they had collected on that load – residential or ICI - with a follow-up question to determine if there was residential waste in a load described as ICI waste, or ICI waste in a load described as residential waste. If the driver answers yes, then the enumerator pressed the driver to provide their best estimate of the percent of the load represented by residential versus ICI. The data was recorded by truck type. The enumerator also collected DSWA placard information from all surveyed trucks, as well as the time of the survey. This assured that net weights for each truck surveyed could be matched to the survey results to develop weighted averages by truck type to allocate residential and ICI waste entering each DSWA facility. The results from the two seasons were averaged for allocation purposes.

Delaware Solid Waste Authority | Statewide Waste Characterization Study
| 7
III. RESULTS
Allocation of Tons Delivered to DSWA Facilities
The goal of the two season waste characterization is to develop estimated tons disposed by material type for the waste characterized. To achieve this, the Project Team converted DSWA incoming scale data to tons by material type, both state-wide and by facility following the protocol described below. First, DSWA provided the Project Team with scale data for FY 2016 (July 2015 – June 2016) “Vehicle Type for Revenue Tons” for all six DSWA facilities. Tons delivered to the three DSWA transfer stations are ultimately transferred for disposal at one of the three DSWA landfills. For purposes of this analysis, the tons delivered to a transfer station are reported by material type at that transfer station, and are then not used to allocate tons by material type at the landfill, since that would be double counting. Second, the truck survey data (321 surveys over two seasons), together with an analysis of the scale data by material type were used to allocate tons by vehicle type to MSW, C&D and “Other” Waste by facility. The intent was to make sure that the hand sort data of mixed solid waste (MSW) are only applied to MSW, and not to C&D waste and to “Other” waste. This waste characterization did not include C&D wastes; and the hand sort data are not representative of “Other” wastes, which include sludge, and residue from the Revolution Recovery facility (C&D processing). Third, the driver survey data were also used to allocate MSW tons delivered between Residential and ICI sources. That is, while most rear-loading packer trucks are used to collect residential waste, some waste collected in a rear-loader may be from businesses. Also, it is not uncommon for a front-load truck to contain residential waste collected from multi-family households and condominiums together with business waste. And, some front load trucks are now used to collect and tip carts. The driver surveys asked the driver to estimate what percent of the load was residential versus business (or institutional) waste, and the results of the driver surveys were used to allocate waste by vehicle type. Fourth, while some bulky waste is included in MSW – and accounted for in the MSW hand sorts – there are roll-off loads of bulky waste from household and ICI clean-outs which are also not representative of the MSW hand sort. Data on the amount of bulky waste entering the individual facilities was not available. However, DSM undertook a separate C&D waste composition analysis at the Jones Crossroads landfill in 2015 which did include visual analysis of “dry wastes” delivered in roll-offs – which included bulky wastes. Bulky wastes were 17.7 percent by weight of open top roll-off waste delivered to the Jones Crossroads landfill (2015). This same allocation was applied to roll-off waste delivered at the other DSWA facilities as a rough means of eliminating bulky waste delivered in roll-offs from total MSW characterized by facility. Finally, visual analysis of self-haul loads were conducted as part of this waste characterization. The visual data were converted to tons using scale data for each vehicle surveyed together with material density data; and then the self-haul data were allocated to residential and ICI MSW, and to self-haul C&D. This allocation was based on questions asked of the driver of the self-haul load, observations of the load content and the allocation of waste to MSW and C&D by the enumerator. This enabled C&D loads delivered to the self-haul area to be removed from the MSW characterization.

Delaware Solid Waste Authority | Statewide Waste Characterization Study
| 8
Table 6 presents the final allocation by facility. As illustrated by Table 6, of the 801,121 tons delivered to DSWA facilities during FY 2016:
Total MSW (highlighted in grey) includes 320,159 tons of Residential MSW and 306,755 tons of ICI MSW, for a grand total of 626,914 tons; and,
Non MSW deliveries (highlighted in blue) include an estimated 26,644 tons (roughly 3 percent) of bulky waste clean-out loads and 147,563 tons of C&D or Other Wastes (including 18,738 tons of Self-Haul C&D wastes) totaling 174,207 tons.
That means that the hand sort and self-haul MSW characterized represent 78 percent of the total waste delivered to DSWA facilities in FY 2016. These MSW tons are allocated by material type in the Composition Tables below. Table 6. Allocation of Waste by Facility and Material Type, FY 2016 Facility
Res ICI Res ICI C&D Res ICI C&D & Other Bulky MSW All Waste
(tons) (tons) (tons) (tons) (tons) (tons) (tons) (tons) (tons) (tons) (tons)
Sandtown 33,369 39,050 3,147 179 851 36,516 39,229 10,257 4,877 75,745 91,730
Jones Crossroads 21,274 29,762 2,468 1,825 7,971 23,741 31,587 70,376 12,091 55,328 145,766
Cherry Island 152,618 151,901 1,310 9,836 6,001 153,927 161,737 40,344 6,277 315,664 368,285
Pine Tree 37,945 24,064 1,676 450 1,486 39,621 24,514 3,747 1,497 64,135 70,866
Milford 20,665 14,571 1,778 252 614 22,443 14,823 836 651 37,266 39,366
Route 5 41,392 34,716 2,519 149 1,816 43,910 34,866 3,265 1,251 78,776 85,108
Total 18,738 320,159 306,755 128,825 26,644 626,914 801,121
MSW Self-Haul Total MSW Non-MSW Grand Total
Material Composition by Management Type
Data are presented in table form for statewide aggregate composition, state-wide residential, and statewide ICI composition; and then in the same format for each of the six DSWA facilities. In each case a table listing all of the material categories is presented first followed by a table of the top ten materials, based on weight. In each case certain material types are highlighted by management category, with blue highlights indicating metal, plastic and glass materials that can be recycled under the universal recycling law and green indicating organic materials (food wastes and dirty paper) that might be diverted to a composting or anaerobic digester. The material categories by management type are:
Recyclable paper (accepted at the Single Stream MRF)
Recyclable metal and glass (accepted at the Single Stream MRF)
Recyclable plastic (accepted at the Single Stream MRF)
Vegetative food wastes, unpackaged
Protein food waste, unpackaged
Food waste in plastic packaging
Food waste in other packaging
Yard waste
Other waste

Delaware Solid Waste Authority | Statewide Waste Characterization Study
| 9
The intent of the management breakdown is to provide information on the maximum amount of diversion that could occur under the existing universal recycling law, and if DSWA were to construct one or more organic waste processing facilities. It should be noted here that no materials diversion strategy succeeds in diverting 100 percent of the material. In general, an eighty percent diversion rate for any targeted recyclable would be considered a high performing program. As such, there will always be some material that could be diverted in the landfill. This is even more important for organics diversion because of contaminants inherent in the material. For this reason, organic wastes have been further sub-divided into relatively uncontaminated vegetative and protein waste, and then vegetative and protein (meat) waste that would be contaminated with packaging. Contamination can be a significant impediment to both aerobic and anaerobic processing systems.
State-Wide Aggregate Waste Composition
Tables 7 and 8 present the overall composition of MSW delivered to the six DSWA facilities. These tables combine Residential and ICI MSW based on the allocations by facility. As above, all materials accepted at the MRF are highlighted in blue and organic materials that could be managed through composting or anaerobic digestion are highlighted in green. These are followed by overall, state-wide Residential MSW composition (Tables 9 and 10) and state-wide ICI MSW composition (Tables 11 and 12). Table 7 through 12 all represent weighted averages based on the tonnage delivered to each facility (Table 6, above). All tables present the weighted average tons by material type followed by the expected range of the mean (as a percentage) at a 90 percent confidence interval. Thus, for each material, the second column presents the range that the actual mean is expected to vary around the calculated mean at a 90 percent confidence interval. The standard deviation is also presented. The standard deviation measures how widely values within the data set are dispersed from the sample mean. A higher standard deviation denotes higher variation in the underlying samples for each material, while a lower standard deviation reflects lower variation among the individual samples. The standard deviation is stated in the same unit as the sample mean, which in this case is percent by weight.

Delaware Solid Waste Authority | Statewide Waste Characterization Study
| 10
Table 7. Overall State-Wide MSW Composition by Material Type
Material Est. Tons Mean +/-
Stnd.
Dev. Material Est. Tons Mean +/-
Stnd.
Dev.
Paper 148,030 23.6% Metal 19,557 3.1%Newspaper and Inserts 10,317 1.6% 0.4% 0.3% Tin/Steel Containers 5,333 0.9% 0.1% 0.1%Corrugated Cardboard/Kraft Paper 36,907 5.9% 1.2% 0.7% Other Ferrous 6,829 1.1% 0.4% 0.2%High Grade Office Paper 5,809 0.9% 0.3% 0.2% Aluminum Beverage & Cat Food Containers 2,720 0.4% 0.1% 0.0%Mixed Recyclable Paper 22,731 3.6% 0.7% 0.4% Other Aluminum 1,757 0.3% 0.1% 0.0%Compostable Paper 62,258 9.9% 1.6% 1.0% Other Non-Ferrous 2,919 0.5% 0.3% 0.2%Aseptic Boxes and Gable Top Cartons 1,441 0.2% 0.1% 0.1%Remainder/Composite Paper 8,567 1.4% 0.4% 0.2% Glass 16,612 2.6%
Glass Bottles and Jars 13,437 2.1% 0.4% 0.2%Plastic 93,369 14.9% Remainder/Composite Glass 3,176 0.5% 0.3% 0.2%
PET #1 Bottles, Jars, or Containers 10,993 1.8% 0.3% 0.2%HDPE #2 Natural and Colored Bottles 5,352 0.9% 0.1% 0.1% C&D 66,131 10.5%Rigid HDPE #2 Containers 510 0.1% 0.0% 0.0% Pallets/Crates 2,161 0.3% 0.2% 0.1%#3 to #7 Bottles or Jars 523 0.1% 0.0% 0.0% Clean Lumber 9,554 1.5% 0.5% 0.3%Injection Molded Tubs #2, #4, #5, #6, & #7 1,728 0.3% 0.1% 0.0% Painted and Stained Wood 2,428 0.4% 0.2% 0.1%All Other Rigid Plastic Packaging 668 0.1% 0.1% 0.0% Other Engineered Wood 10,679 1.7% 0.8% 0.5%White Expanded Polystyrene (Styrofoam) 4,346 0.7% 0.2% 0.1% Wood Furniture 11,515 1.8% 1.0% 0.6%Recoverable Film 5,196 0.8% 0.2% 0.1% Other Wood 5,233 0.8% 0.4% 0.2%All Other Film 35,565 5.7% 0.6% 0.4% Asphalt Roofing 780 0.1% 0.1% 0.1%Agricultural Film & Marine Shrink Wrap 508 0.1% 0.1% 0.1% Asphalt, Brick, Concrete, and Rocks 11,667 1.9% 2.7% 1.7%Large Plastic Items 3,134 0.5% 0.3% 0.2% Drywall/Gypsum Board 3,046 0.5% 0.5% 0.3%Remainder/Composite Plastic 24,848 4.0% 0.7% 0.4% Remainder/Composite C&D 9,069 1.4% 0.9% 0.6%
Organic 252,039 40.2% Other 31,175 5.0%Vegetative Food Waste, Unpackaged 57,704 9.2% 1.9% 1.2% Tires 2,132 0.3% 0.5% 0.3%Protein Food Waste, Unpackaged 21,125 3.4% 0.8% 0.5% Small Appliances 474 0.1% 0.1% 0.0%Food Waste in Plastic Packaging 43,749 7.0% 1.0% 0.6% Large Electronics 6,154 1.0% 0.6% 0.4%
Food Waste in Other Packaging 9,421 1.5% 0.6% 0.4% Other Small Consumer Electronics 1,566 0.2% 0.2% 0.1%Leaves, Grass, and Brush 25,690 4.1% 1.4% 0.9% Items with CRTs 1,857 0.3% 0.4% 0.2%Branches and Stumps 1,881 0.3% 0.2% 0.1% Other Larger Electronics 14 0.0% 0.0% 0.0%Textiles 32,323 5.2% 2.1% 1.2% Other Haz. or Household Haz. Waste (HHW) 3,168 0.5% 0.3% 0.2%Rubber/Leather 3,842 0.6% 0.2% 0.1% All Other Wastes 15,809 2.5% 0.6% 0.4%Diapers and Sanitary Products 18,705 3.0% 0.5% 0.3%Carpet and Carpet Padding 20,072 3.2% 2.2% 1.3% Hauler Collected MSW Tons 601,326 Remainder/Composite Organic 17,526 2.8% 0.6% 0.4% Tons of Non C&D Materials from Self-haul Customers 25,588
Totals 626,914 100%Sample Count 152
Confidence intervals calculated at a 90% confidence level. Table 8. Top Ten Materials, By Weight, Overall State-Wide Material Composition
Estimated Cumulative Estimated
Material Type Percent Percent Tons
Compostable Paper 9.9% 9.9% 62,258
Vegetative Food Waste, Unpackaged 9.2% 19.1% 57,704
Food Waste in Plastic Packaging 7.0% 26.1% 43,749
Corrugated Cardboard/Kraft Paper 5.9% 32.0% 36,907
All Other Film 5.7% 37.7% 35,565
Textiles 5.2% 42.8% 32,323
Leaves, Grass, and Brush 4.1% 46.9% 25,690
Remainder/Composite Plastic 4.0% 50.9% 24,848
Mixed Recyclable Paper 3.6% 54.5% 22,731
Protein Food Waste, Unpackaged 3.4% 57.9% 21,125
Subtotal 57.9% 362,901 -
All Other Materials 42.1% 264,013 -
Total 100.0% 626,914

Delaware Solid Waste Authority | Statewide Waste Characterization Study
| 11
Table 9. State-Wide Residential MSW Composition
Material Est. Tons Mean +/-
Stnd.
Dev. Material Est. Tons Mean +/-
Stnd.
Dev.
Paper 68,421 21.4% Metal 10,569 3.3%Newspaper and Inserts 5,922 1.8% 0.6% 0.4% Tin/Steel Containers 3,554 1.1% 0.2% 0.1%Corrugated Cardboard/Kraft Paper 11,560 3.6% 0.9% 0.5% Other Ferrous 2,979 0.9% 0.3% 0.2%High Grade Office Paper 1,992 0.6% 0.2% 0.1% Aluminum Beverage & Cat Food Containers 1,541 0.5% 0.1% 0.0%Mixed Recyclable Paper 13,147 4.1% 0.6% 0.4% Other Aluminum 1,052 0.3% 0.0% 0.0%Compostable Paper 30,867 9.6% 0.9% 0.5% Other Non-Ferrous 1,444 0.5% 0.2% 0.1%Aseptic Boxes and Gable Top Cartons 445 0.1% 0.0% 0.0%Remainder/Composite Paper 4,489 1.4% 0.6% 0.4% Glass 11,472 3.6%
Glass Bottles and Jars 9,015 2.8% 0.5% 0.3%Plastic 41,404 12.9% Remainder/Composite Glass 2,457 0.8% 0.5% 0.3%
PET #1 Bottles, Jars, or Containers 5,467 1.7% 0.2% 0.1%HDPE #2 Natural and Colored Bottles 3,243 1.0% 0.1% 0.1% C&D 29,703 9.3%Rigid HDPE #2 Containers 332 0.1% 0.1% 0.0% Pallets/Crates 93 0.0% 0.0% 0.0%#3 to #7 Bottles or Jars 372 0.1% 0.1% 0.0% Clean Lumber 5,498 1.7% 0.9% 0.5%Injection Molded Tubs #2, #4, #5, #6, & #7 736 0.2% 0.0% 0.0% Painted and Stained Wood 2,045 0.6% 0.4% 0.2%All Other Rigid Plastic Packaging 505 0.2% 0.1% 0.1% Other Engineered Wood 6,918 2.2% 1.3% 0.8%White Expanded Polystyrene (Styrofoam) 1,733 0.5% 0.1% 0.0% Wood Furniture 6,328 2.0% 1.3% 0.8%Recoverable Film 2,465 0.8% 0.1% 0.1% Other Wood 1,853 0.6% 0.3% 0.2%All Other Film 14,676 4.6% 0.4% 0.2% Asphalt Roofing 322 0.1% 0.2% 0.1%Agricultural Film & Marine Shrink Wrap 425 0.1% 0.2% 0.1% Asphalt, Brick, Concrete, and Rocks 220 0.1% 0.0% 0.0%Large Plastic Items 1,860 0.6% 0.4% 0.3% Drywall/Gypsum Board 2,205 0.7% 0.9% 0.5%Remainder/Composite Plastic 9,587 3.0% 0.4% 0.2% Remainder/Composite C&D 4,219 1.3% 0.8% 0.5%
Organic 134,603 42.0% Other 23,987 7.5%Vegetative Food Waste, Unpackaged 24,342 7.6% 1.1% 0.7% Tires 1,988 0.6% 1.0% 0.6%Protein Food Waste, Unpackaged 11,184 3.5% 0.7% 0.5% Small Appliances 474 0.1% 0.2% 0.1%Food Waste in Plastic Packaging 25,411 7.9% 1.2% 0.7% Large Electronics 6,079 1.9% 1.2% 0.8%
Food Waste in Other Packaging 3,976 1.2% 0.4% 0.2% Other Small Consumer Electronics 808 0.3% 0.1% 0.1%Leaves, Grass, and Brush 14,709 4.6% 1.5% 0.9% Items with CRTs 1,416 0.4% 0.7% 0.4%Branches and Stumps 1,056 0.3% 0.2% 0.1% Other Larger Electronics 14 0.0% 0.0% 0.0%Textiles 17,705 5.5% 0.9% 0.5% Other Haz. or Household Haz. Waste (HHW) 1,610 0.5% 0.2% 0.1%Rubber/Leather 2,070 0.6% 0.2% 0.1% All Other Wastes 11,597 3.6% 1.0% 0.6%Diapers and Sanitary Products 14,273 4.5% 0.7% 0.4%Carpet and Carpet Padding 8,816 2.8% 1.2% 0.7% Hauler Collected MSW Tons 307,262 Remainder/Composite Organic 11,061 3.5% 0.9% 0.5% Tons of Non C&D Materials from Self-haul Customers 12,897
Totals 320,159 100%Sample Count 77
Confidence intervals calculated at a 90% confidence level. Table 10. Top Ten Materials, by Weight in State-Wide Residential Waste
Estimated Cumulative Estimated
Material Type Percent Percent Tons
Compostable Paper 9.6% 9.6% 30,867
Food Waste in Plastic Packaging 7.9% 17.6% 25,411
Vegetative Food Waste, Unpackaged 7.6% 25.2% 24,342
Textiles 5.5% 30.7% 17,705
Leaves, Grass, and Brush 4.6% 35.3% 14,709
All Other Film 4.6% 39.9% 14,676
Diapers and Sanitary Products 4.5% 44.3% 14,273
Mixed Recyclable Paper 4.1% 48.5% 13,147
All Other Wastes 3.6% 52.1% 11,597
Corrugated Cardboard/Kraft Paper 3.6% 55.7% 11,560
Subtotal 55.7% 178,286 -
All Other Materials 44.3% 141,873 -
Total 100.0% 320,159
Delaware Solid Waste Authority | Statewide Waste Characterization Study
| 12
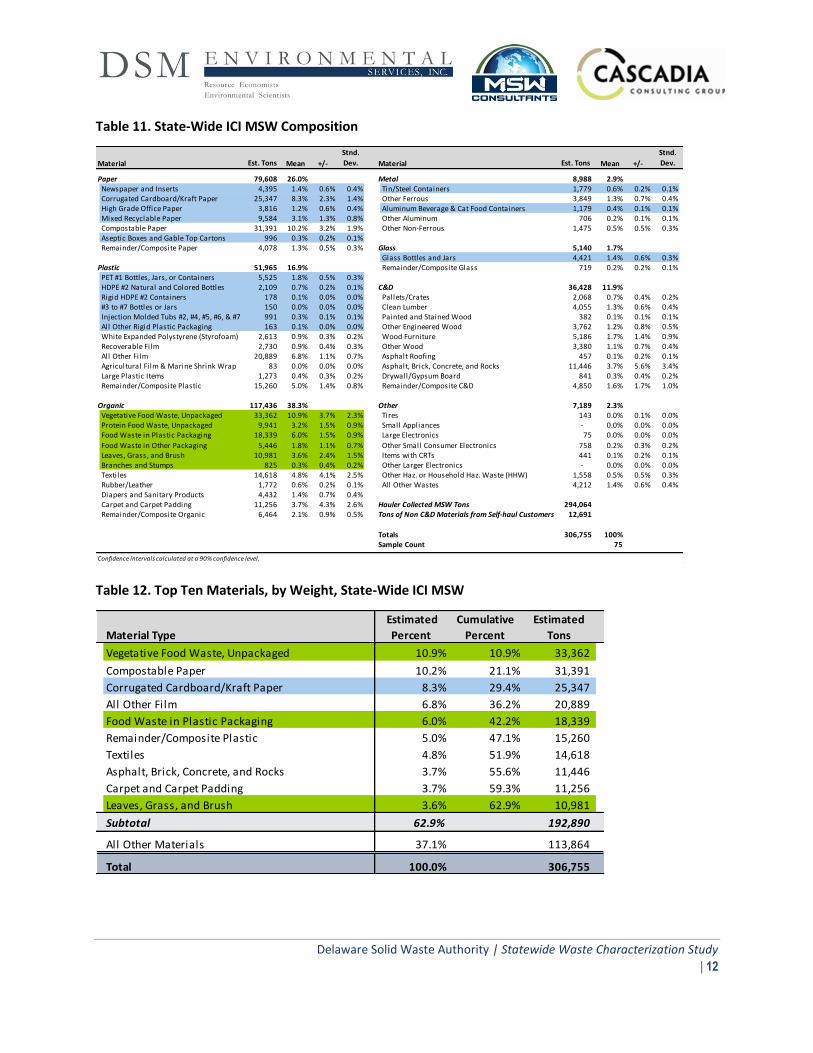
Table 11. State-Wide ICI MSW Composition
Material Est. Tons Mean +/-
Stnd.
Dev. Material Est. Tons Mean +/-
Stnd.
Dev.
Paper 79,608 26.0% Metal 8,988 2.9%Newspaper and Inserts 4,395 1.4% 0.6% 0.4% Tin/Steel Containers 1,779 0.6% 0.2% 0.1%Corrugated Cardboard/Kraft Paper 25,347 8.3% 2.3% 1.4% Other Ferrous 3,849 1.3% 0.7% 0.4%High Grade Office Paper 3,816 1.2% 0.6% 0.4% Aluminum Beverage & Cat Food Containers 1,179 0.4% 0.1% 0.1%Mixed Recyclable Paper 9,584 3.1% 1.3% 0.8% Other Aluminum 706 0.2% 0.1% 0.1%Compostable Paper 31,391 10.2% 3.2% 1.9% Other Non-Ferrous 1,475 0.5% 0.5% 0.3%Aseptic Boxes and Gable Top Cartons 996 0.3% 0.2% 0.1%Remainder/Composite Paper 4,078 1.3% 0.5% 0.3% Glass 5,140 1.7%
Glass Bottles and Jars 4,421 1.4% 0.6% 0.3%Plastic 51,965 16.9% Remainder/Composite Glass 719 0.2% 0.2% 0.1%
PET #1 Bottles, Jars, or Containers 5,525 1.8% 0.5% 0.3%HDPE #2 Natural and Colored Bottles 2,109 0.7% 0.2% 0.1% C&D 36,428 11.9%Rigid HDPE #2 Containers 178 0.1% 0.0% 0.0% Pallets/Crates 2,068 0.7% 0.4% 0.2%#3 to #7 Bottles or Jars 150 0.0% 0.0% 0.0% Clean Lumber 4,055 1.3% 0.6% 0.4%Injection Molded Tubs #2, #4, #5, #6, & #7 991 0.3% 0.1% 0.1% Painted and Stained Wood 382 0.1% 0.1% 0.1%All Other Rigid Plastic Packaging 163 0.1% 0.0% 0.0% Other Engineered Wood 3,762 1.2% 0.8% 0.5%White Expanded Polystyrene (Styrofoam) 2,613 0.9% 0.3% 0.2% Wood Furniture 5,186 1.7% 1.4% 0.9%Recoverable Film 2,730 0.9% 0.4% 0.3% Other Wood 3,380 1.1% 0.7% 0.4%All Other Film 20,889 6.8% 1.1% 0.7% Asphalt Roofing 457 0.1% 0.2% 0.1%Agricultural Film & Marine Shrink Wrap 83 0.0% 0.0% 0.0% Asphalt, Brick, Concrete, and Rocks 11,446 3.7% 5.6% 3.4%Large Plastic Items 1,273 0.4% 0.3% 0.2% Drywall/Gypsum Board 841 0.3% 0.4% 0.2%Remainder/Composite Plastic 15,260 5.0% 1.4% 0.8% Remainder/Composite C&D 4,850 1.6% 1.7% 1.0%
Organic 117,436 38.3% Other 7,189 2.3%Vegetative Food Waste, Unpackaged 33,362 10.9% 3.7% 2.3% Tires 143 0.0% 0.1% 0.0%Protein Food Waste, Unpackaged 9,941 3.2% 1.5% 0.9% Small Appliances - 0.0% 0.0% 0.0%Food Waste in Plastic Packaging 18,339 6.0% 1.5% 0.9% Large Electronics 75 0.0% 0.0% 0.0%
Food Waste in Other Packaging 5,446 1.8% 1.1% 0.7% Other Small Consumer Electronics 758 0.2% 0.3% 0.2%Leaves, Grass, and Brush 10,981 3.6% 2.4% 1.5% Items with CRTs 441 0.1% 0.2% 0.1%Branches and Stumps 825 0.3% 0.4% 0.2% Other Larger Electronics - 0.0% 0.0% 0.0%Textiles 14,618 4.8% 4.1% 2.5% Other Haz. or Household Haz. Waste (HHW) 1,558 0.5% 0.5% 0.3%Rubber/Leather 1,772 0.6% 0.2% 0.1% All Other Wastes 4,212 1.4% 0.6% 0.4%Diapers and Sanitary Products 4,432 1.4% 0.7% 0.4%Carpet and Carpet Padding 11,256 3.7% 4.3% 2.6% Hauler Collected MSW Tons 294,064 Remainder/Composite Organic 6,464 2.1% 0.9% 0.5% Tons of Non C&D Materials from Self-haul Customers 12,691
Totals 306,755 100%Sample Count 75
Confidence intervals calculated at a 90% confidence level. Table 12. Top Ten Materials, by Weight, State-Wide ICI MSW
Estimated Cumulative Estimated
Material Type Percent Percent Tons
Vegetative Food Waste, Unpackaged 10.9% 10.9% 33,362
Compostable Paper 10.2% 21.1% 31,391
Corrugated Cardboard/Kraft Paper 8.3% 29.4% 25,347
All Other Film 6.8% 36.2% 20,889
Food Waste in Plastic Packaging 6.0% 42.2% 18,339
Remainder/Composite Plastic 5.0% 47.1% 15,260
Textiles 4.8% 51.9% 14,618
Asphalt, Brick, Concrete, and Rocks 3.7% 55.6% 11,446
Carpet and Carpet Padding 3.7% 59.3% 11,256
Leaves, Grass, and Brush 3.6% 62.9% 10,981
Subtotal 62.9% 192,890 -
All Other Materials 37.1% 113,864 -
Total 100.0% 306,755

Delaware Solid Waste Authority | Statewide Waste Characterization Study
| 13
Analysis by Facility
The following 18 tables provide data at the individual DSWA facility level for hand sorted MSW.
Cherry Island Landfill
Table 13. Overall MSW Composition, Cherry Island Landfill
Material Est. Tons Mean +/-
Stnd.
Dev. Material Est. Tons Mean +/-
Stnd.
Dev.
Paper 69,085 21.9% Metal 9,116 2.9%Newspaper and Inserts 5,255 1.7% 0.6% 0.4% Tin/Steel Containers 2,646 0.8% 0.3% 0.2%Corrugated Cardboard/Kraft Paper 15,529 4.9% 1.5% 0.9% Other Ferrous 2,457 0.8% 0.5% 0.3%High Grade Office Paper 2,645 0.8% 0.4% 0.3% Aluminum Beverage & Cat Food Containers 1,290 0.4% 0.1% 0.1%Mixed Recyclable Paper 10,962 3.5% 1.3% 0.8% Other Aluminum 902 0.3% 0.1% 0.1%Compostable Paper 30,787 9.8% 3.1% 1.9% Other Non-Ferrous 1,821 0.6% 0.5% 0.3%Aseptic Boxes and Gable Top Cartons 422 0.1% 0.0% 0.0%Remainder/Composite Paper 3,486 1.1% 0.7% 0.4% Glass 9,453 3.0%
Glass Bottles and Jars 7,621 2.4% 0.7% 0.4%Plastic 42,612 13.5% Remainder/Composite Glass 1,831 0.6% 0.5% 0.3%
PET #1 Bottles, Jars, or Containers 6,172 2.0% 0.5% 0.3%HDPE #2 Natural and Colored Bottles 2,493 0.8% 0.1% 0.1% C&D 36,551 11.6%Rigid HDPE #2 Containers 4 0.0% 0.0% 0.0% Pallets/Crates - 0.0% 0.0% 0.0%#3 to #7 Bottles or Jars 136 0.0% 0.0% 0.0% Clean Lumber 2,856 0.9% 0.7% 0.4%Injection Molded Tubs #2, #4, #5, #6, & #7 1,057 0.3% 0.1% 0.1% Painted and Stained Wood 1,941 0.6% 0.4% 0.2%All Other Rigid Plastic Packaging 402 0.1% 0.1% 0.1% Other Engineered Wood 5,617 1.8% 1.3% 0.8%White Expanded Polystyrene (Styrofoam) 1,474 0.5% 0.1% 0.1% Wood Furniture 4,795 1.5% 1.5% 0.9%Recoverable Film 1,696 0.5% 0.2% 0.1% Other Wood 2,637 0.8% 0.7% 0.4%All Other Film 17,122 5.4% 1.0% 0.6% Asphalt Roofing - 0.0% 0.0% 0.0%Agricultural Film & Marine Shrink Wrap 76 0.0% 0.0% 0.0% Asphalt, Brick, Concrete, and Rocks 10,960 3.5% 5.5% 3.3%Large Plastic Items 1,610 0.5% 0.4% 0.2% Drywall/Gypsum Board 2,072 0.7% 0.9% 0.6%Remainder/Composite Plastic 10,369 3.3% 0.6% 0.4% Remainder/Composite C&D 5,673 1.8% 1.7% 1.0%
Organic 134,139 42.5% Other 14,708 4.7%Vegetative Food Waste, Unpackaged 31,019 9.8% 3.5% 2.1% Tires 1,928 0.6% 1.0% 0.6%Protein Food Waste, Unpackaged 10,434 3.3% 1.4% 0.8% Small Appliances 49 0.0% 0.0% 0.0%Food Waste in Plastic Packaging 26,099 8.3% 1.8% 1.1% Large Electronics 4,664 1.5% 1.2% 0.7%
Food Waste in Other Packaging 3,751 1.2% 0.6% 0.3% Other Small Consumer Electronics 974 0.3% 0.3% 0.2%Leaves, Grass, and Brush 12,164 3.9% 2.4% 1.5% Items with CRTs 1,416 0.4% 0.7% 0.4%Branches and Stumps 774 0.2% 0.3% 0.2% Other Larger Electronics - 0.0% 0.0% 0.0%Textiles 19,024 6.0% 4.0% 2.4% Other Haz. or Household Haz. Waste (HHW) 373 0.1% 0.1% 0.0%Rubber/Leather 1,293 0.4% 0.2% 0.1% All Other Wastes 5,304 1.7% 0.8% 0.5%Diapers and Sanitary Products 9,575 3.0% 0.9% 0.5%Carpet and Carpet Padding 13,378 4.2% 4.3% 2.6% Hauler Collected MSW Tons 304,519 Remainder/Composite Organic 6,627 2.1% 0.6% 0.4% Tons of Non C&D Materials from Self-haul Customers 11,145
Totals 315,664 100%Sample Count 29
Confidence intervals calculated at a 90% confidence level.

Delaware Solid Waste Authority | Statewide Waste Characterization Study
| 14
Table 14. Composition of Residential MSW, Cherry Island Landfill
Table 15. Composition, ICI MSW, Cherry Island Landfill
Material Est. Tons Mean +/-
Stnd.
Dev. Material Est. Tons Mean +/-
Stnd.
Dev.
Paper 36,013 22.3% Metal 4,280 2.6%Newspaper and Inserts 2,274 1.4% 0.9% 0.5% Tin/Steel Containers 914 0.6% 0.4% 0.3%Corrugated Cardboard/Kraft Paper 8,003 4.9% 2.4% 1.5% Other Ferrous 1,144 0.7% 0.8% 0.5%High Grade Office Paper 1,710 1.1% 0.8% 0.5% Aluminum Beverage & Cat Food Containers 741 0.5% 0.2% 0.1%Mixed Recyclable Paper 4,501 2.8% 2.3% 1.4% Other Aluminum 450 0.3% 0.2% 0.1%Compostable Paper 17,931 11.1% 5.8% 3.5% Other Non-Ferrous 1,032 0.6% 0.9% 0.5%Aseptic Boxes and Gable Top Cartons 207 0.1% 0.1% 0.0%Remainder/Composite Paper 1,387 0.9% 0.6% 0.4% Glass 2,220 1.4%
Glass Bottles and Jars 1,682 1.0% 0.9% 0.5%Plastic 23,303 14.4% Remainder/Composite Glass 537 0.3% 0.3% 0.2%
PET #1 Bottles, Jars, or Containers 3,392 2.1% 1.0% 0.6%HDPE #2 Natural and Colored Bottles 1,003 0.6% 0.2% 0.1% C&D 21,895 13.5%Rigid HDPE #2 Containers 4 0.0% 0.0% 0.0% Pallets/Crates - 0.0% 0.0% 0.0%#3 to #7 Bottles or Jars 10 0.0% 0.0% 0.0% Clean Lumber 540 0.3% 0.5% 0.3%Injection Molded Tubs #2, #4, #5, #6, & #7 695 0.4% 0.3% 0.2% Painted and Stained Wood 352 0.2% 0.3% 0.2%All Other Rigid Plastic Packaging 89 0.1% 0.1% 0.0% Other Engineered Wood 1,604 1.0% 1.1% 0.7%White Expanded Polystyrene (Styrofoam) 730 0.5% 0.2% 0.1% Wood Furniture 2,261 1.4% 2.3% 1.4%Recoverable Film 553 0.3% 0.2% 0.1% Other Wood 2,131 1.3% 1.3% 0.8%All Other Film 10,646 6.6% 1.8% 1.1% Asphalt Roofing - 0.0% 0.0% 0.0%Agricultural Film & Marine Shrink Wrap 48 0.0% 0.0% 0.0% Asphalt, Brick, Concrete, and Rocks 10,815 6.7% 10.7% 6.5%Large Plastic Items 376 0.2% 0.3% 0.2% Drywall/Gypsum Board 30 0.0% 0.0% 0.0%Remainder/Composite Plastic 5,757 3.6% 1.0% 0.6% Remainder/Composite C&D 4,161 2.6% 3.3% 2.0%
Organic 72,921 45.1% Other 1,105 0.7%Vegetative Food Waste, Unpackaged 19,367 12.0% 6.6% 4.0% Tires - 0.0% 0.0% 0.0%Protein Food Waste, Unpackaged 5,316 3.3% 2.5% 1.5% Small Appliances - 0.0% 0.0% 0.0%Food Waste in Plastic Packaging 11,347 7.0% 2.6% 1.6% Large Electronics - 0.0% 0.0% 0.0%
Food Waste in Other Packaging 1,771 1.1% 1.0% 0.6% Other Small Consumer Electronics 597 0.4% 0.6% 0.4%Leaves, Grass, and Brush 9,192 5.7% 4.5% 2.7% Items with CRTs - 0.0% 0.0% 0.0%Branches and Stumps 661 0.4% 0.7% 0.4% Other Larger Electronics - 0.0% 0.0% 0.0%Textiles 10,125 6.3% 7.7% 4.7% Other Haz. or Household Haz. Waste (HHW) 239 0.1% 0.1% 0.1%Rubber/Leather 771 0.5% 0.3% 0.2% All Other Wastes 270 0.2% 0.1% 0.1%Diapers and Sanitary Products 2,601 1.6% 1.3% 0.8%Carpet and Carpet Padding 9,525 5.9% 8.2% 5.0% Hauler Collected MSW Tons 151,901 Remainder/Composite Organic 2,243 1.4% 0.8% 0.5% Tons of Non C&D Materials from Self-haul Customers 9,836
Totals 161,737 100%Sample Count 10
Confidence intervals calculated at a 90% confidence level.
Material Est. Tons Mean +/-
Stnd.
Dev. Material Est. Tons Mean +/-
Stnd.
Dev.
Paper 33,072 21.5% Metal 4,835 3.1%Newspaper and Inserts 2,981 1.9% 0.8% 0.5% Tin/Steel Containers 1,732 1.1% 0.3% 0.2%Corrugated Cardboard/Kraft Paper 7,526 4.9% 1.7% 1.0% Other Ferrous 1,313 0.9% 0.5% 0.3%High Grade Office Paper 935 0.6% 0.3% 0.2% Aluminum Beverage & Cat Food Containers 550 0.4% 0.1% 0.1%Mixed Recyclable Paper 6,461 4.2% 0.9% 0.6% Other Aluminum 452 0.3% 0.1% 0.0%Compostable Paper 12,856 8.4% 1.4% 0.9% Other Non-Ferrous 789 0.5% 0.4% 0.2%Aseptic Boxes and Gable Top Cartons 215 0.1% 0.0% 0.0%Remainder/Composite Paper 2,099 1.4% 1.2% 0.7% Glass 7,233 4.7%
Glass Bottles and Jars 5,939 3.9% 1.0% 0.6%Plastic 19,309 12.5% Remainder/Composite Glass 1,294 0.8% 1.0% 0.6%
PET #1 Bottles, Jars, or Containers 2,781 1.8% 0.3% 0.2%HDPE #2 Natural and Colored Bottles 1,490 1.0% 0.1% 0.1% C&D 14,656 9.5%Rigid HDPE #2 Containers - 0.0% 0.0% 0.0% Pallets/Crates - 0.0% 0.0% 0.0%#3 to #7 Bottles or Jars 126 0.1% 0.1% 0.0% Clean Lumber 2,316 1.5% 1.3% 0.8%Injection Molded Tubs #2, #4, #5, #6, & #7 361 0.2% 0.1% 0.1% Painted and Stained Wood 1,589 1.0% 0.8% 0.5%All Other Rigid Plastic Packaging 312 0.2% 0.2% 0.1% Other Engineered Wood 4,014 2.6% 2.5% 1.5%White Expanded Polystyrene (Styrofoam) 745 0.5% 0.1% 0.1% Wood Furniture 2,533 1.6% 2.0% 1.2%Recoverable Film 1,144 0.7% 0.2% 0.1% Other Wood 506 0.3% 0.3% 0.2%All Other Film 6,476 4.2% 0.6% 0.3% Asphalt Roofing - 0.0% 0.0% 0.0%Agricultural Film & Marine Shrink Wrap 28 0.0% 0.0% 0.0% Asphalt, Brick, Concrete, and Rocks 145 0.1% 0.1% 0.0%Large Plastic Items 1,234 0.8% 0.8% 0.5% Drywall/Gypsum Board 2,042 1.3% 1.9% 1.1%Remainder/Composite Plastic 4,612 3.0% 0.7% 0.4% Remainder/Composite C&D 1,512 1.0% 0.8% 0.5%
Organic 61,219 39.8% Other 13,603 8.8%Vegetative Food Waste, Unpackaged 11,652 7.6% 1.8% 1.1% Tires 1,928 1.3% 2.0% 1.2%Protein Food Waste, Unpackaged 5,118 3.3% 1.0% 0.6% Small Appliances 49 0.0% 0.1% 0.0%Food Waste in Plastic Packaging 14,751 9.6% 2.3% 1.4% Large Electronics 4,664 3.0% 2.4% 1.5%
Food Waste in Other Packaging 1,981 1.3% 0.6% 0.3% Other Small Consumer Electronics 377 0.2% 0.2% 0.1%Leaves, Grass, and Brush 2,972 1.9% 1.4% 0.8% Items with CRTs 1,416 0.9% 1.5% 0.9%Branches and Stumps 113 0.1% 0.1% 0.1% Other Larger Electronics - 0.0% 0.0% 0.0%Textiles 8,899 5.8% 1.4% 0.9% Other Haz. or Household Haz. Waste (HHW) 134 0.1% 0.0% 0.0%Rubber/Leather 522 0.3% 0.2% 0.1% All Other Wastes 5,034 3.3% 1.6% 1.0%Diapers and Sanitary Products 6,975 4.5% 1.1% 0.7%Carpet and Carpet Padding 3,853 2.5% 2.0% 1.2% Hauler Collected MSW Tons 152,618 Remainder/Composite Organic 4,384 2.8% 0.9% 0.6% Tons of Non C&D Materials from Self-haul Customers 1,310
Totals 153,927 100%Sample Count 19
Confidence intervals calculated at a 90% confidence level.

Delaware Solid Waste Authority | Statewide Waste Characterization Study
| 15
Pine Tree Transfer Station
Table 16. Overall MSW Composition, Pine Tree Transfer Station
Material Est. Tons Mean +/-
Stnd.
Dev. Material Est. Tons Mean +/-
Stnd.
Dev.
Paper 14,508 22.6% Metal 1,841 2.9%Newspaper and Inserts 938 1.5% 0.8% 0.5% Tin/Steel Containers 519 0.8% 0.3% 0.2%Corrugated Cardboard/Kraft Paper 3,768 5.9% 3.5% 2.2% Other Ferrous 685 1.1% 0.8% 0.5%High Grade Office Paper 1,289 2.0% 1.8% 1.1% Aluminum Beverage & Cat Food Containers 223 0.3% 0.1% 0.1%Mixed Recyclable Paper 2,022 3.2% 1.4% 0.8% Other Aluminum 159 0.2% 0.1% 0.0%Compostable Paper 5,104 8.0% 1.4% 0.8% Other Non-Ferrous 255 0.4% 0.5% 0.3%Aseptic Boxes and Gable Top Cartons 135 0.2% 0.1% 0.1%Remainder/Composite Paper 1,252 2.0% 1.0% 0.6% Glass 739 1.2%
Glass Bottles and Jars 654 1.0% 0.4% 0.2%Plastic 6,932 10.8% Remainder/Composite Glass 85 0.1% 0.1% 0.0%
PET #1 Bottles, Jars, or Containers 852 1.3% 0.3% 0.2%HDPE #2 Natural and Colored Bottles 607 0.9% 0.2% 0.1% C&D 8,975 14.0%Rigid HDPE #2 Containers 27 0.0% 0.0% 0.0% Pallets/Crates 517 0.8% 0.9% 0.6%#3 to #7 Bottles or Jars 116 0.2% 0.2% 0.1% Clean Lumber 1,672 2.6% 2.1% 1.3%Injection Molded Tubs #2, #4, #5, #6, & #7 152 0.2% 0.2% 0.1% Painted and Stained Wood 130 0.2% 0.3% 0.2%All Other Rigid Plastic Packaging 182 0.3% 0.2% 0.1% Other Engineered Wood 2,159 3.4% 2.4% 1.5%White Expanded Polystyrene (Styrofoam) 266 0.4% 0.1% 0.1% Wood Furniture 3,015 4.7% 3.9% 2.4%Recoverable Film 394 0.6% 0.2% 0.1% Other Wood 113 0.2% 0.1% 0.1%All Other Film 2,922 4.6% 0.9% 0.6% Asphalt Roofing 322 0.5% 0.8% 0.5%Agricultural Film & Marine Shrink Wrap 19 0.0% 0.0% 0.0% Asphalt, Brick, Concrete, and Rocks 232 0.4% 0.6% 0.3%Large Plastic Items 80 0.1% 0.2% 0.1% Drywall/Gypsum Board 1 0.0% 0.0% 0.0%Remainder/Composite Plastic 1,317 2.1% 0.6% 0.4% Remainder/Composite C&D 813 1.3% 1.3% 0.8%
Organic 28,039 43.7% Other 3,102 4.8%Vegetative Food Waste, Unpackaged 4,781 7.5% 3.3% 2.0% Tires - 0.0% 0.0% 0.0%Protein Food Waste, Unpackaged 1,855 2.9% 1.2% 0.8% Small Appliances 293 0.5% 0.7% 0.4%Food Waste in Plastic Packaging 4,436 6.9% 1.5% 0.9% Large Electronics - 0.0% 0.0% 0.0%
Food Waste in Other Packaging 1,388 2.2% 1.5% 0.9% Other Small Consumer Electronics 228 0.4% 0.2% 0.1%Leaves, Grass, and Brush 4,171 6.5% 3.8% 2.3% Items with CRTs - 0.0% 0.0% 0.0%Branches and Stumps - 0.0% 0.0% 0.0% Other Larger Electronics - 0.0% 0.0% 0.0%Textiles 4,033 6.3% 2.4% 1.5% Other Haz. or Household Haz. Waste (HHW) 440 0.7% 0.4% 0.2%Rubber/Leather 370 0.6% 0.3% 0.2% All Other Wastes 2,140 3.3% 1.7% 1.0%Diapers and Sanitary Products 2,118 3.3% 1.2% 0.7%Carpet and Carpet Padding 3,431 5.3% 3.2% 1.9% Hauler Collected MSW Tons 62,009 Remainder/Composite Organic 1,457 2.3% 1.0% 0.6% Tons of Non C&D Materials from Self-haul Customers 2,126
Totals 64,135 100%Sample Count 25
Confidence intervals calculated at a 90% confidence level.

Delaware Solid Waste Authority | Statewide Waste Characterization Study
| 16
Table 17. Composition of Residential MSW, Pine Tree Transfer Station
Material Est. Tons Mean +/-
Stnd.
Dev. Material Est. Tons Mean +/-
Stnd.
Dev.
Paper 7,682 19.4% Metal 1,068 2.7%Newspaper and Inserts 482 1.2% 0.6% 0.3% Tin/Steel Containers 245 0.6% 0.2% 0.1%Corrugated Cardboard/Kraft Paper 1,157 2.9% 1.1% 0.7% Other Ferrous 352 0.9% 0.7% 0.4%High Grade Office Paper 365 0.9% 0.6% 0.4% Aluminum Beverage & Cat Food Containers 159 0.4% 0.2% 0.1%Mixed Recyclable Paper 1,607 4.1% 2.2% 1.3% Other Aluminum 105 0.3% 0.1% 0.0%Compostable Paper 3,172 8.0% 1.8% 1.1% Other Non-Ferrous 206 0.5% 0.8% 0.5%Aseptic Boxes and Gable Top Cartons 58 0.1% 0.1% 0.1%Remainder/Composite Paper 842 2.1% 1.2% 0.7% Glass 355 0.9%
Glass Bottles and Jars 277 0.7% 0.3% 0.2%Plastic 4,329 10.9% Remainder/Composite Glass 78 0.2% 0.1% 0.1%
PET #1 Bottles, Jars, or Containers 525 1.3% 0.3% 0.2%HDPE #2 Natural and Colored Bottles 382 1.0% 0.3% 0.2% C&D 5,417 13.7%Rigid HDPE #2 Containers 23 0.1% 0.1% 0.0% Pallets/Crates - 0.0% 0.0% 0.0%#3 to #7 Bottles or Jars 101 0.3% 0.3% 0.2% Clean Lumber 802 2.0% 2.2% 1.3%Injection Molded Tubs #2, #4, #5, #6, & #7 39 0.1% 0.1% 0.0% Painted and Stained Wood 130 0.3% 0.4% 0.3%All Other Rigid Plastic Packaging 171 0.4% 0.4% 0.2% Other Engineered Wood 1,266 3.2% 2.4% 1.5%White Expanded Polystyrene (Styrofoam) 134 0.3% 0.1% 0.1% Wood Furniture 2,031 5.1% 5.9% 3.6%Recoverable Film 243 0.6% 0.1% 0.1% Other Wood 76 0.2% 0.2% 0.1%All Other Film 1,701 4.3% 0.8% 0.5% Asphalt Roofing 322 0.8% 1.2% 0.8%Agricultural Film & Marine Shrink Wrap 19 0.0% 0.1% 0.0% Asphalt, Brick, Concrete, and Rocks 11 0.0% 0.0% 0.0%Large Plastic Items 80 0.2% 0.3% 0.2% Drywall/Gypsum Board 1 0.0% 0.0% 0.0%Remainder/Composite Plastic 912 2.3% 1.0% 0.6% Remainder/Composite C&D 779 2.0% 2.2% 1.3%
Organic 17,836 45.0% Other 2,934 7.4%Vegetative Food Waste, Unpackaged 1,646 4.2% 1.7% 1.0% Tires - 0.0% 0.0% 0.0%Protein Food Waste, Unpackaged 785 2.0% 1.1% 0.7% Small Appliances 293 0.7% 1.1% 0.7%Food Waste in Plastic Packaging 2,550 6.4% 1.6% 1.0% Large Electronics - 0.0% 0.0% 0.0%
Food Waste in Other Packaging 923 2.3% 2.3% 1.4% Other Small Consumer Electronics 194 0.5% 0.3% 0.2%Leaves, Grass, and Brush 3,858 9.7% 6.2% 3.7% Items with CRTs - 0.0% 0.0% 0.0%Branches and Stumps - 0.0% 0.0% 0.0% Other Larger Electronics - 0.0% 0.0% 0.0%Textiles 2,451 6.2% 3.3% 2.0% Other Haz. or Household Haz. Waste (HHW) 412 1.0% 0.6% 0.4%Rubber/Leather 150 0.4% 0.3% 0.2% All Other Wastes 2,035 5.1% 2.7% 1.7%Diapers and Sanitary Products 1,620 4.1% 1.8% 1.1%Carpet and Carpet Padding 2,616 6.6% 4.5% 2.7% Hauler Collected MSW Tons 37,945 Remainder/Composite Organic 1,237 3.1% 1.6% 1.0% Tons of Non C&D Materials from Self-haul Customers 1,676
Totals 39,621 100%Sample Count 12
Confidence intervals calculated at a 90% confidence level. Table 18. Composition of ICI MSW, Pine Tree Transfer Station
Material Est. Tons Mean +/-
Stnd.
Dev. Material Est. Tons Mean +/-
Stnd.
Dev.
Paper 6,826 27.8% Metal 773 3.2%Newspaper and Inserts 456 1.9% 1.9% 1.2% Tin/Steel Containers 274 1.1% 0.6% 0.4%Corrugated Cardboard/Kraft Paper 2,610 10.6% 9.1% 5.5% Other Ferrous 332 1.4% 1.8% 1.1%High Grade Office Paper 924 3.8% 4.5% 2.7% Aluminum Beverage & Cat Food Containers 63 0.3% 0.1% 0.1%Mixed Recyclable Paper 416 1.7% 0.8% 0.5% Other Aluminum 54 0.2% 0.1% 0.1%Compostable Paper 1,932 7.9% 2.0% 1.2% Other Non-Ferrous 49 0.2% 0.2% 0.2%Aseptic Boxes and Gable Top Cartons 78 0.3% 0.3% 0.2%Remainder/Composite Paper 409 1.7% 1.8% 1.1% Glass 383 1.6%
Glass Bottles and Jars 376 1.5% 1.0% 0.6%Plastic 2,602 10.6% Remainder/Composite Glass 7 0.0% 0.0% 0.0%
PET #1 Bottles, Jars, or Containers 327 1.3% 0.5% 0.3%HDPE #2 Natural and Colored Bottles 225 0.9% 0.2% 0.1% C&D 3,558 14.5%Rigid HDPE #2 Containers 3 0.0% 0.0% 0.0% Pallets/Crates 517 2.1% 2.4% 1.5%#3 to #7 Bottles or Jars 15 0.1% 0.1% 0.0% Clean Lumber 870 3.5% 4.2% 2.5%Injection Molded Tubs #2, #4, #5, #6, & #7 113 0.5% 0.5% 0.3% Painted and Stained Wood - 0.0% 0.0% 0.0%All Other Rigid Plastic Packaging 11 0.0% 0.1% 0.0% Other Engineered Wood 893 3.6% 5.0% 3.1%White Expanded Polystyrene (Styrofoam) 132 0.5% 0.2% 0.1% Wood Furniture 984 4.0% 3.5% 2.1%Recoverable Film 151 0.6% 0.4% 0.3% Other Wood 37 0.2% 0.2% 0.1%All Other Film 1,221 5.0% 2.1% 1.3% Asphalt Roofing - 0.0% 0.0% 0.0%Agricultural Film & Marine Shrink Wrap - 0.0% 0.0% 0.0% Asphalt, Brick, Concrete, and Rocks 222 0.9% 1.5% 0.9%Large Plastic Items - 0.0% 0.0% 0.0% Drywall/Gypsum Board - 0.0% 0.0% 0.0%Remainder/Composite Plastic 405 1.7% 0.4% 0.2% Remainder/Composite C&D 34 0.1% 0.2% 0.1%
Organic 10,204 41.6% Other 167 0.7%Vegetative Food Waste, Unpackaged 3,135 12.8% 8.1% 4.9% Tires - 0.0% 0.0% 0.0%Protein Food Waste, Unpackaged 1,071 4.4% 2.7% 1.7% Small Appliances - 0.0% 0.0% 0.0%Food Waste in Plastic Packaging 1,886 7.7% 2.9% 1.8% Large Electronics - 0.0% 0.0% 0.0%
Food Waste in Other Packaging 464 1.9% 1.2% 0.8% Other Small Consumer Electronics 34 0.1% 0.2% 0.1%Leaves, Grass, and Brush 313 1.3% 1.4% 0.9% Items with CRTs - 0.0% 0.0% 0.0%Branches and Stumps - 0.0% 0.0% 0.0% Other Larger Electronics - 0.0% 0.0% 0.0%Textiles 1,582 6.5% 3.5% 2.1% Other Haz. or Household Haz. Waste (HHW) 28 0.1% 0.1% 0.0%Rubber/Leather 220 0.9% 0.6% 0.4% All Other Wastes 105 0.4% 0.4% 0.3%Diapers and Sanitary Products 498 2.0% 1.4% 0.9%Carpet and Carpet Padding 815 3.3% 4.0% 2.4% Hauler Collected MSW Tons 24,064 Remainder/Composite Organic 220 0.9% 0.6% 0.3% Tons of Non C&D Materials from Self-haul Customers 450
Totals 24,514 100%Sample Count 13
Confidence intervals calculated at a 90% confidence level.

Delaware Solid Waste Authority | Statewide Waste Characterization Study
| 17
Sandtown Landfill
Table 19. Overall Composition, Sandtown MSW
Material Est. Tons Mean +/-
Stnd.
Dev. Material Est. Tons Mean +/-
Stnd.
Dev.
Paper 16,540 21.8% Metal 2,692 3.6%Newspaper and Inserts 985 1.3% 0.6% 0.4% Tin/Steel Containers 790 1.0% 0.3% 0.2%Corrugated Cardboard/Kraft Paper 2,816 3.7% 1.1% 0.7% Other Ferrous 1,035 1.4% 0.9% 0.6%High Grade Office Paper 629 0.8% 0.6% 0.4% Aluminum Beverage & Cat Food Containers 341 0.4% 0.1% 0.1%Mixed Recyclable Paper 3,407 4.5% 1.3% 0.8% Other Aluminum 209 0.3% 0.1% 0.1%Compostable Paper 7,800 10.3% 2.0% 1.2% Other Non-Ferrous 319 0.4% 0.4% 0.3%Aseptic Boxes and Gable Top Cartons 246 0.3% 0.3% 0.2%Remainder/Composite Paper 657 0.9% 0.4% 0.2% Glass 1,975 2.6%
Glass Bottles and Jars 1,618 2.1% 0.8% 0.5%Plastic 15,787 20.8% Remainder/Composite Glass 357 0.5% 0.4% 0.2%
PET #1 Bottles, Jars, or Containers 1,234 1.6% 0.3% 0.2%HDPE #2 Natural and Colored Bottles 691 0.9% 0.2% 0.1% C&D 6,696 8.8%Rigid HDPE #2 Containers 150 0.2% 0.2% 0.1% Pallets/Crates 750 1.0% 0.9% 0.6%#3 to #7 Bottles or Jars 99 0.1% 0.1% 0.1% Clean Lumber 1,799 2.4% 1.4% 0.8%Injection Molded Tubs #2, #4, #5, #6, & #7 106 0.1% 0.0% 0.0% Painted and Stained Wood 88 0.1% 0.1% 0.1%All Other Rigid Plastic Packaging 17 0.0% 0.0% 0.0% Other Engineered Wood 1,138 1.5% 1.4% 0.9%White Expanded Polystyrene (Styrofoam) 361 0.5% 0.1% 0.1% Wood Furniture 225 0.3% 0.5% 0.3%Recoverable Film 765 1.0% 0.4% 0.2% Other Wood 1,423 1.9% 1.2% 0.7%All Other Film 5,137 6.8% 2.0% 1.2% Asphalt Roofing 457 0.6% 1.0% 0.6%Agricultural Film & Marine Shrink Wrap 379 0.5% 0.8% 0.5% Asphalt, Brick, Concrete, and Rocks 119 0.2% 0.2% 0.1%Large Plastic Items 340 0.4% 0.7% 0.4% Drywall/Gypsum Board 110 0.1% 0.2% 0.1%Remainder/Composite Plastic 6,509 8.6% 4.9% 3.0% Remainder/Composite C&D 585 0.8% 0.7% 0.4%
Organic 29,033 38.3% Other 3,021 4.0%Vegetative Food Waste, Unpackaged 5,244 6.9% 2.3% 1.4% Tires 204 0.3% 0.3% 0.2%Protein Food Waste, Unpackaged 2,468 3.3% 1.3% 0.8% Small Appliances - 0.0% 0.0% 0.0%Food Waste in Plastic Packaging 4,946 6.5% 1.9% 1.1% Large Electronics 79 0.1% 0.2% 0.1%
Food Waste in Other Packaging 2,874 3.8% 4.0% 2.4% Other Small Consumer Electronics 48 0.1% 0.1% 0.0%Leaves, Grass, and Brush 2,203 2.9% 2.7% 1.7% Items with CRTs 441 0.6% 1.0% 0.6%Branches and Stumps 342 0.5% 0.4% 0.3% Other Larger Electronics 4 0.0% 0.0% 0.0%Textiles 3,211 4.2% 1.6% 0.9% Other Haz. or Household Haz. Waste (HHW) 319 0.4% 0.2% 0.1%Rubber/Leather 518 0.7% 0.3% 0.2% All Other Wastes 1,926 2.5% 2.1% 1.3%Diapers and Sanitary Products 1,936 2.6% 0.7% 0.4%Carpet and Carpet Padding 1,850 2.4% 1.6% 1.0% Hauler Collected MSW Tons 72,418 Remainder/Composite Organic 3,441 4.5% 3.0% 1.8% Tons of Non C&D Materials from Self-haul Customers 3,326
Totals 75,745 100%Sample Count 31
Confidence intervals calculated at a 90% confidence level.

Delaware Solid Waste Authority | Statewide Waste Characterization Study
| 18
Table 20. Composition of Residential MSW, Sandtown Landfill
Material Est. Tons Mean +/-
Stnd.
Dev. Material Est. Tons Mean +/-
Stnd.
Dev.
Paper 7,610 20.8% Metal 1,461 4.0%Newspaper and Inserts 382 1.0% 0.3% 0.2% Tin/Steel Containers 608 1.7% 0.6% 0.4%Corrugated Cardboard/Kraft Paper 1,004 2.7% 0.9% 0.5% Other Ferrous 385 1.1% 0.9% 0.5%High Grade Office Paper 108 0.3% 0.2% 0.1% Aluminum Beverage & Cat Food Containers 271 0.7% 0.2% 0.1%Mixed Recyclable Paper 1,890 5.2% 2.0% 1.2% Other Aluminum 156 0.4% 0.2% 0.1%Compostable Paper 3,837 10.5% 1.5% 0.9% Other Non-Ferrous 41 0.1% 0.1% 0.1%Aseptic Boxes and Gable Top Cartons 60 0.2% 0.1% 0.0%Remainder/Composite Paper 330 0.9% 0.2% 0.1% Glass 931 2.5%
Glass Bottles and Jars 689 1.9% 0.6% 0.4%Plastic 6,185 16.9% Remainder/Composite Glass 242 0.7% 0.7% 0.4%
PET #1 Bottles, Jars, or Containers 684 1.9% 0.3% 0.2%HDPE #2 Natural and Colored Bottles 467 1.3% 0.2% 0.2% C&D 2,309 6.3%Rigid HDPE #2 Containers 102 0.3% 0.4% 0.2% Pallets/Crates - 0.0% 0.0% 0.0%#3 to #7 Bottles or Jars 70 0.2% 0.2% 0.1% Clean Lumber 664 1.8% 1.4% 0.9%Injection Molded Tubs #2, #4, #5, #6, & #7 76 0.2% 0.1% 0.0% Painted and Stained Wood 74 0.2% 0.2% 0.1%All Other Rigid Plastic Packaging 10 0.0% 0.0% 0.0% Other Engineered Wood 492 1.3% 2.1% 1.3%White Expanded Polystyrene (Styrofoam) 210 0.6% 0.1% 0.1% Wood Furniture - 0.0% 0.0% 0.0%Recoverable Film 451 1.2% 0.7% 0.4% Other Wood 945 2.6% 1.9% 1.2%All Other Film 2,213 6.1% 1.5% 0.9% Asphalt Roofing - 0.0% 0.0% 0.0%Agricultural Film & Marine Shrink Wrap 379 1.0% 1.6% 1.0% Asphalt, Brick, Concrete, and Rocks 29 0.1% 0.1% 0.1%Large Plastic Items 340 0.9% 1.5% 0.9% Drywall/Gypsum Board 78 0.2% 0.3% 0.2%Remainder/Composite Plastic 1,183 3.2% 0.4% 0.2% Remainder/Composite C&D 27 0.1% 0.1% 0.0%
Organic 17,456 47.8% Other 564 1.5%Vegetative Food Waste, Unpackaged 2,709 7.4% 2.5% 1.5% Tires 60 0.2% 0.3% 0.2%Protein Food Waste, Unpackaged 1,361 3.7% 1.1% 0.6% Small Appliances - 0.0% 0.0% 0.0%Food Waste in Plastic Packaging 2,783 7.6% 2.5% 1.5% Large Electronics 4 0.0% 0.0% 0.0%
Food Waste in Other Packaging 278 0.8% 0.3% 0.2% Other Small Consumer Electronics 39 0.1% 0.1% 0.1%Leaves, Grass, and Brush 1,712 4.7% 5.2% 3.2% Items with CRTs - 0.0% 0.0% 0.0%Branches and Stumps 342 0.9% 0.9% 0.5% Other Larger Electronics 4 0.0% 0.0% 0.0%Textiles 2,217 6.1% 2.0% 1.2% Other Haz. or Household Haz. Waste (HHW) 177 0.5% 0.3% 0.2%Rubber/Leather 259 0.7% 0.4% 0.3% All Other Wastes 280 0.8% 0.8% 0.5%Diapers and Sanitary Products 1,421 3.9% 1.1% 0.7%Carpet and Carpet Padding 1,472 4.0% 3.2% 1.9% Hauler Collected MSW Tons 33,369 Remainder/Composite Organic 2,900 7.9% 6.2% 3.7% Tons of Non C&D Materials from Self-haul Customers 3,147
Totals 36,516 100%Sample Count 12
Confidence intervals calculated at a 90% confidence level. Table 21. Composition of ICI MSW, Sandtown Landfill
Material Est. Tons Mean +/-
Stnd.
Dev. Material Est. Tons Mean +/-
Stnd.
Dev.
Paper 8,930 22.8% Metal 1,231 3.1%Newspaper and Inserts 603 1.5% 1.1% 0.7% Tin/Steel Containers 182 0.5% 0.2% 0.1%Corrugated Cardboard/Kraft Paper 1,812 4.6% 2.0% 1.2% Other Ferrous 650 1.7% 1.6% 1.0%High Grade Office Paper 522 1.3% 1.1% 0.7% Aluminum Beverage & Cat Food Containers 69 0.2% 0.1% 0.0%Mixed Recyclable Paper 1,517 3.9% 1.8% 1.1% Other Aluminum 53 0.1% 0.1% 0.0%Compostable Paper 3,962 10.1% 3.7% 2.2% Other Non-Ferrous 278 0.7% 0.9% 0.5%Aseptic Boxes and Gable Top Cartons 187 0.5% 0.5% 0.3%Remainder/Composite Paper 327 0.8% 0.7% 0.4% Glass 1,044 2.7%
Glass Bottles and Jars 930 2.4% 1.4% 0.8%Plastic 9,601 24.5% Remainder/Composite Glass 115 0.3% 0.3% 0.2%
PET #1 Bottles, Jars, or Containers 549 1.4% 0.5% 0.3%HDPE #2 Natural and Colored Bottles 224 0.6% 0.2% 0.1% C&D 4,388 11.2%Rigid HDPE #2 Containers 47 0.1% 0.1% 0.1% Pallets/Crates 750 1.9% 1.8% 1.1%#3 to #7 Bottles or Jars 29 0.1% 0.1% 0.0% Clean Lumber 1,135 2.9% 2.3% 1.4%Injection Molded Tubs #2, #4, #5, #6, & #7 30 0.1% 0.0% 0.0% Painted and Stained Wood 15 0.0% 0.1% 0.0%All Other Rigid Plastic Packaging 7 0.0% 0.0% 0.0% Other Engineered Wood 645 1.6% 1.9% 1.2%White Expanded Polystyrene (Styrofoam) 152 0.4% 0.2% 0.1% Wood Furniture 225 0.6% 0.9% 0.6%Recoverable Film 314 0.8% 0.5% 0.3% Other Wood 479 1.2% 1.4% 0.8%All Other Film 2,925 7.5% 3.6% 2.2% Asphalt Roofing 457 1.2% 1.9% 1.2%Agricultural Film & Marine Shrink Wrap - 0.0% 0.0% 0.0% Asphalt, Brick, Concrete, and Rocks 91 0.2% 0.3% 0.2%Large Plastic Items - 0.0% 0.0% 0.0% Drywall/Gypsum Board 32 0.1% 0.1% 0.1%Remainder/Composite Plastic 5,325 13.6% 9.4% 5.7% Remainder/Composite C&D 559 1.4% 1.3% 0.8%
Organic 11,577 29.5% Other 2,456 6.3%Vegetative Food Waste, Unpackaged 2,535 6.5% 3.9% 2.4% Tires 143 0.4% 0.6% 0.4%Protein Food Waste, Unpackaged 1,106 2.8% 2.4% 1.5% Small Appliances - 0.0% 0.0% 0.0%Food Waste in Plastic Packaging 2,163 5.5% 2.8% 1.7% Large Electronics 75 0.2% 0.3% 0.2%
Food Waste in Other Packaging 2,595 6.6% 7.8% 4.7% Other Small Consumer Electronics 9 0.0% 0.0% 0.0%Leaves, Grass, and Brush 491 1.3% 2.1% 1.3% Items with CRTs 441 1.1% 1.9% 1.1%Branches and Stumps - 0.0% 0.0% 0.0% Other Larger Electronics - 0.0% 0.0% 0.0%Textiles 994 2.5% 2.4% 1.4% Other Haz. or Household Haz. Waste (HHW) 141 0.4% 0.3% 0.2%Rubber/Leather 259 0.7% 0.4% 0.2% All Other Wastes 1,646 4.2% 4.1% 2.5%Diapers and Sanitary Products 515 1.3% 0.8% 0.5%Carpet and Carpet Padding 378 1.0% 1.1% 0.7% Hauler Collected MSW Tons 39,050 Remainder/Composite Organic 541 1.4% 0.5% 0.3% Tons of Non C&D Materials from Self-haul Customers 179
Totals 39,229 100%Sample Count 19
Confidence intervals calculated at a 90% confidence level.

Delaware Solid Waste Authority | Statewide Waste Characterization Study
| 19
Milford Transfer Station
Table 22. Composition of Overall MSW, Milford Transfer Station
Material Est. Tons Mean +/-
Stnd.
Dev. Material Est. Tons Mean +/-
Stnd.
Dev.
Paper 9,410 25.3% Metal 1,456 3.9%Newspaper and Inserts 329 0.9% 0.3% 0.2% Tin/Steel Containers 420 1.1% 0.4% 0.2%Corrugated Cardboard/Kraft Paper 1,713 4.6% 2.0% 1.2% Other Ferrous 596 1.6% 1.4% 0.9%High Grade Office Paper 421 1.1% 0.7% 0.4% Aluminum Beverage & Cat Food Containers 209 0.6% 0.2% 0.1%Mixed Recyclable Paper 1,275 3.4% 1.3% 0.8% Other Aluminum 182 0.5% 0.2% 0.1%Compostable Paper 4,063 10.9% 1.6% 1.0% Other Non-Ferrous 48 0.1% 0.1% 0.1%Aseptic Boxes and Gable Top Cartons 133 0.4% 0.5% 0.3%Remainder/Composite Paper 1,475 4.0% 2.3% 1.4% Glass 706 1.9%
Glass Bottles and Jars 543 1.5% 0.5% 0.3%Plastic 6,810 18.3% Remainder/Composite Glass 164 0.4% 0.5% 0.3%
PET #1 Bottles, Jars, or Containers 614 1.6% 0.3% 0.2%HDPE #2 Natural and Colored Bottles 361 1.0% 0.3% 0.2% C&D 1,164 3.1%Rigid HDPE #2 Containers 47 0.1% 0.2% 0.1% Pallets/Crates 91 0.2% 0.3% 0.2%#3 to #7 Bottles or Jars 34 0.1% 0.1% 0.1% Clean Lumber 329 0.9% 0.7% 0.4%Injection Molded Tubs #2, #4, #5, #6, & #7 112 0.3% 0.1% 0.1% Painted and Stained Wood 35 0.1% 0.1% 0.1%All Other Rigid Plastic Packaging 21 0.1% 0.1% 0.0% Other Engineered Wood 116 0.3% 0.3% 0.2%White Expanded Polystyrene (Styrofoam) 391 1.0% 0.5% 0.3% Wood Furniture 28 0.1% 0.1% 0.1%Recoverable Film 234 0.6% 0.3% 0.2% Other Wood 263 0.7% 0.5% 0.3%All Other Film 2,593 7.0% 1.6% 1.0% Asphalt Roofing - 0.0% 0.0% 0.0%Agricultural Film & Marine Shrink Wrap 35 0.1% 0.2% 0.1% Asphalt, Brick, Concrete, and Rocks 177 0.5% 0.8% 0.5%Large Plastic Items 84 0.2% 0.4% 0.2% Drywall/Gypsum Board 72 0.2% 0.3% 0.2%Remainder/Composite Plastic 2,283 6.1% 2.3% 1.4% Remainder/Composite C&D 53 0.1% 0.1% 0.1%
Organic 14,919 40.0% Other 2,801 7.5%Vegetative Food Waste, Unpackaged 3,581 9.6% 2.9% 1.8% Tires - 0.0% 0.0% 0.0%Protein Food Waste, Unpackaged 1,365 3.7% 1.1% 0.7% Small Appliances - 0.0% 0.0% 0.0%Food Waste in Plastic Packaging 2,477 6.6% 1.9% 1.1% Large Electronics 99 0.3% 0.4% 0.3%
Food Waste in Other Packaging 561 1.5% 0.8% 0.5% Other Small Consumer Electronics 58 0.2% 0.1% 0.1%Leaves, Grass, and Brush 1,757 4.7% 2.8% 1.7% Items with CRTs - 0.0% 0.0% 0.0%Branches and Stumps 493 1.3% 1.4% 0.9% Other Larger Electronics 10 0.0% 0.0% 0.0%Textiles 934 2.5% 0.7% 0.4% Other Haz. or Household Haz. Waste (HHW) 423 1.1% 1.3% 0.8%Rubber/Leather 591 1.6% 0.9% 0.5% All Other Wastes 2,211 5.9% 2.2% 1.3%Diapers and Sanitary Products 1,294 3.5% 1.1% 0.7%Carpet and Carpet Padding 402 1.1% 1.8% 1.1% Hauler Collected MSW Tons 35,236 Remainder/Composite Organic 1,465 3.9% 2.1% 1.3% Tons of Non C&D Materials from Self-haul Customers 2,030
Totals 37,266 100%Sample Count 22
Confidence intervals calculated at a 90% confidence level.

Delaware Solid Waste Authority | Statewide Waste Characterization Study
| 20
Table 23. Composition of Residential MSW, Milford Transfer Station
Material Est. Tons Mean +/-
Stnd.
Dev. Material Est. Tons Mean +/-
Stnd.
Dev.
Paper 5,150 22.9% Metal 864 3.8%Newspaper and Inserts 270 1.2% 0.4% 0.3% Tin/Steel Containers 320 1.4% 0.6% 0.4%Corrugated Cardboard/Kraft Paper 706 3.1% 1.5% 0.9% Other Ferrous 227 1.0% 0.9% 0.5%High Grade Office Paper 187 0.8% 0.4% 0.3% Aluminum Beverage & Cat Food Containers 169 0.8% 0.3% 0.2%Mixed Recyclable Paper 835 3.7% 2.0% 1.2% Other Aluminum 122 0.5% 0.2% 0.1%Compostable Paper 2,572 11.5% 1.7% 1.0% Other Non-Ferrous 25 0.1% 0.1% 0.1%Aseptic Boxes and Gable Top Cartons 29 0.1% 0.1% 0.0%Remainder/Composite Paper 554 2.5% 1.6% 1.0% Glass 580 2.6%
Glass Bottles and Jars 419 1.9% 0.8% 0.5%Plastic 3,194 14.2% Remainder/Composite Glass 161 0.7% 0.8% 0.5%
PET #1 Bottles, Jars, or Containers 426 1.9% 0.4% 0.3%HDPE #2 Natural and Colored Bottles 224 1.0% 0.3% 0.2% C&D 768 3.4%Rigid HDPE #2 Containers 41 0.2% 0.3% 0.2% Pallets/Crates 91 0.4% 0.5% 0.3%#3 to #7 Bottles or Jars 12 0.1% 0.0% 0.0% Clean Lumber 313 1.4% 1.2% 0.7%Injection Molded Tubs #2, #4, #5, #6, & #7 54 0.2% 0.1% 0.1% Painted and Stained Wood 34 0.1% 0.2% 0.1%All Other Rigid Plastic Packaging 5 0.0% 0.0% 0.0% Other Engineered Wood 104 0.5% 0.5% 0.3%White Expanded Polystyrene (Styrofoam) 145 0.6% 0.2% 0.1% Wood Furniture - 0.0% 0.0% 0.0%Recoverable Film 126 0.6% 0.2% 0.1% Other Wood 131 0.6% 0.4% 0.3%All Other Film 1,121 5.0% 1.0% 0.6% Asphalt Roofing - 0.0% 0.0% 0.0%Agricultural Film & Marine Shrink Wrap - 0.0% 0.0% 0.0% Asphalt, Brick, Concrete, and Rocks 6 0.0% 0.0% 0.0%Large Plastic Items - 0.0% 0.0% 0.0% Drywall/Gypsum Board 66 0.3% 0.5% 0.3%Remainder/Composite Plastic 1,040 4.6% 1.7% 1.1% Remainder/Composite C&D 24 0.1% 0.1% 0.1%
Organic 9,592 42.7% Other 2,295 10.2%Vegetative Food Waste, Unpackaged 2,082 9.3% 3.1% 1.9% Tires - 0.0% 0.0% 0.0%Protein Food Waste, Unpackaged 811 3.6% 1.1% 0.7% Small Appliances - 0.0% 0.0% 0.0%Food Waste in Plastic Packaging 1,553 6.9% 1.9% 1.2% Large Electronics 99 0.4% 0.7% 0.4%
Food Waste in Other Packaging 179 0.8% 0.4% 0.3% Other Small Consumer Electronics 42 0.2% 0.2% 0.1%Leaves, Grass, and Brush 1,205 5.4% 3.9% 2.4% Items with CRTs - 0.0% 0.0% 0.0%Branches and Stumps 493 2.2% 2.4% 1.4% Other Larger Electronics 10 0.0% 0.1% 0.0%Textiles 787 3.5% 1.1% 0.7% Other Haz. or Household Haz. Waste (HHW) 413 1.8% 2.2% 1.3%Rubber/Leather 450 2.0% 1.4% 0.9% All Other Wastes 1,731 7.7% 3.3% 2.0%Diapers and Sanitary Products 1,146 5.1% 1.7% 1.0%Carpet and Carpet Padding 402 1.8% 2.9% 1.8% Hauler Collected MSW Tons 20,665 Remainder/Composite Organic 484 2.2% 0.8% 0.5% Tons of Non C&D Materials from Self-haul Customers 1,778
Totals 22,443 100%Sample Count 13
Confidence intervals calculated at a 90% confidence level. Table 24. Composition of ICI MSW, Milford Transfer Station
Material Est. Tons Mean +/-
Stnd.
Dev. Material Est. Tons Mean +/-
Stnd.
Dev.
Paper 4,260 28.7% Metal 592 4.0%Newspaper and Inserts 60 0.4% 0.3% 0.2% Tin/Steel Containers 101 0.7% 0.4% 0.2%Corrugated Cardboard/Kraft Paper 1,008 6.8% 4.4% 2.7% Other Ferrous 369 2.5% 3.3% 2.0%High Grade Office Paper 234 1.6% 1.7% 1.0% Aluminum Beverage & Cat Food Containers 40 0.3% 0.1% 0.1%Mixed Recyclable Paper 440 3.0% 1.6% 1.0% Other Aluminum 60 0.4% 0.3% 0.2%Compostable Paper 1,491 10.1% 3.2% 2.0% Other Non-Ferrous 23 0.2% 0.1% 0.1%Aseptic Boxes and Gable Top Cartons 105 0.7% 1.1% 0.7%Remainder/Composite Paper 922 6.2% 5.3% 3.2% Glass 126 0.9%
Glass Bottles and Jars 123 0.8% 0.6% 0.4%Plastic 3,616 24.4% Remainder/Composite Glass 3 0.0% 0.0% 0.0%
PET #1 Bottles, Jars, or Containers 188 1.3% 0.6% 0.4%HDPE #2 Natural and Colored Bottles 137 0.9% 0.7% 0.4% C&D 396 2.7%Rigid HDPE #2 Containers 6 0.0% 0.1% 0.0% Pallets/Crates - 0.0% 0.0% 0.0%#3 to #7 Bottles or Jars 23 0.2% 0.2% 0.1% Clean Lumber 17 0.1% 0.2% 0.1%Injection Molded Tubs #2, #4, #5, #6, & #7 58 0.4% 0.2% 0.1% Painted and Stained Wood 1 0.0% 0.0% 0.0%All Other Rigid Plastic Packaging 16 0.1% 0.1% 0.1% Other Engineered Wood 12 0.1% 0.1% 0.1%White Expanded Polystyrene (Styrofoam) 246 1.7% 1.2% 0.7% Wood Furniture 28 0.2% 0.3% 0.2%Recoverable Film 108 0.7% 0.8% 0.5% Other Wood 132 0.9% 1.1% 0.7%All Other Film 1,472 9.9% 3.7% 2.2% Asphalt Roofing - 0.0% 0.0% 0.0%Agricultural Film & Marine Shrink Wrap 35 0.2% 0.4% 0.2% Asphalt, Brick, Concrete, and Rocks 171 1.2% 1.9% 1.2%Large Plastic Items 84 0.6% 0.9% 0.6% Drywall/Gypsum Board 6 0.0% 0.1% 0.0%Remainder/Composite Plastic 1,243 8.4% 5.2% 3.1% Remainder/Composite C&D 29 0.2% 0.2% 0.1%
Organic 5,327 35.9% Other 506 3.4%Vegetative Food Waste, Unpackaged 1,499 10.1% 5.7% 3.4% Tires - 0.0% 0.0% 0.0%Protein Food Waste, Unpackaged 554 3.7% 2.3% 1.4% Small Appliances - 0.0% 0.0% 0.0%Food Waste in Plastic Packaging 924 6.2% 3.7% 2.3% Large Electronics - 0.0% 0.0% 0.0%
Food Waste in Other Packaging 383 2.6% 2.0% 1.2% Other Small Consumer Electronics 16 0.1% 0.1% 0.1%Leaves, Grass, and Brush 552 3.7% 3.9% 2.3% Items with CRTs - 0.0% 0.0% 0.0%Branches and Stumps - 0.0% 0.0% 0.0% Other Larger Electronics - 0.0% 0.0% 0.0%Textiles 147 1.0% 0.6% 0.4% Other Haz. or Household Haz. Waste (HHW) 10 0.1% 0.0% 0.0%Rubber/Leather 140 0.9% 0.6% 0.4% All Other Wastes 481 3.2% 2.1% 1.3%Diapers and Sanitary Products 148 1.0% 1.0% 0.6%Carpet and Carpet Padding - 0.0% 0.0% 0.0% Hauler Collected MSW Tons 14,571 Remainder/Composite Organic 980 6.6% 5.0% 3.1% Tons of Non C&D Materials from Self-haul Customers 252
Totals 14,823 100%Sample Count 9
Confidence intervals calculated at a 90% confidence level.

Delaware Solid Waste Authority | Statewide Waste Characterization Study
| 21
Route 5 Transfer Station
Table 23. Overall Composition of MSW, Route 5 Transfer Station
Material Est. Tons Mean +/-
Stnd.
Dev. Material Est. Tons Mean +/-
Stnd.
Dev.
Paper 23,475 29.8% Metal 2,414 3.1%Newspaper and Inserts 2,409 3.1% 2.1% 1.3% Tin/Steel Containers 537 0.7% 0.2% 0.1%Corrugated Cardboard/Kraft Paper 6,388 8.1% 5.2% 3.2% Other Ferrous 899 1.1% 1.1% 0.7%High Grade Office Paper 672 0.9% 0.5% 0.3% Aluminum Beverage & Cat Food Containers 454 0.6% 0.2% 0.1%Mixed Recyclable Paper 2,743 3.5% 1.2% 0.8% Other Aluminum 178 0.2% 0.1% 0.0%Compostable Paper 9,840 12.5% 2.4% 1.5% Other Non-Ferrous 347 0.4% 0.4% 0.3%Aseptic Boxes and Gable Top Cartons 104 0.1% 0.1% 0.0%Remainder/Composite Paper 1,320 1.7% 0.7% 0.5% Glass 2,852 3.6%
Glass Bottles and Jars 2,174 2.8% 1.0% 0.6%Plastic 12,450 15.8% Remainder/Composite Glass 678 0.9% 0.7% 0.4%
PET #1 Bottles, Jars, or Containers 1,361 1.7% 0.4% 0.2%HDPE #2 Natural and Colored Bottles 915 1.2% 0.4% 0.2% C&D 6,714 8.5%Rigid HDPE #2 Containers 152 0.2% 0.2% 0.1% Pallets/Crates 302 0.4% 0.6% 0.4%#3 to #7 Bottles or Jars 59 0.1% 0.0% 0.0% Clean Lumber 2,384 3.0% 2.5% 1.5%Injection Molded Tubs #2, #4, #5, #6, & #7 223 0.3% 0.1% 0.1% Painted and Stained Wood 143 0.2% 0.1% 0.1%All Other Rigid Plastic Packaging 30 0.0% 0.1% 0.0% Other Engineered Wood 1,399 1.8% 1.7% 1.0%White Expanded Polystyrene (Styrofoam) 658 0.8% 0.3% 0.2% Wood Furniture 925 1.2% 1.3% 0.8%Recoverable Film 1,592 2.0% 1.6% 1.0% Other Wood 544 0.7% 0.7% 0.4%All Other Film 4,406 5.6% 0.8% 0.5% Asphalt Roofing - 0.0% 0.0% 0.0%Agricultural Film & Marine Shrink Wrap - 0.0% 0.0% 0.0% Asphalt, Brick, Concrete, and Rocks 40 0.1% 0.1% 0.0%Large Plastic Items 320 0.4% 0.4% 0.2% Drywall/Gypsum Board 773 1.0% 1.5% 0.9%Remainder/Composite Plastic 2,735 3.5% 1.3% 0.8% Remainder/Composite C&D 206 0.3% 0.2% 0.1%
Organic 28,334 36.0% Other 2,537 3.2%Vegetative Food Waste, Unpackaged 6,837 8.7% 3.3% 2.0% Tires - 0.0% 0.0% 0.0%Protein Food Waste, Unpackaged 4,166 5.3% 2.9% 1.8% Small Appliances - 0.0% 0.0% 0.0%Food Waste in Plastic Packaging 4,172 5.3% 1.4% 0.9% Large Electronics 1,024 1.3% 1.6% 0.9%
Food Waste in Other Packaging 330 0.4% 0.3% 0.2% Other Small Consumer Electronics 153 0.2% 0.2% 0.1%Leaves, Grass, and Brush 4,419 5.6% 3.8% 2.3% Items with CRTs - 0.0% 0.0% 0.0%Branches and Stumps - 0.0% 0.0% 0.0% Other Larger Electronics - 0.0% 0.0% 0.0%Textiles 2,843 3.6% 1.3% 0.8% Other Haz. or Household Haz. Waste (HHW) 439 0.6% 0.3% 0.2%Rubber/Leather 743 0.9% 0.7% 0.4% All Other Wastes 921 1.2% 0.5% 0.3%Diapers and Sanitary Products 2,368 3.0% 1.0% 0.6%Carpet and Carpet Padding 135 0.2% 0.2% 0.1% Hauler Collected MSW Tons 76,108 Remainder/Composite Organic 2,322 2.9% 1.1% 0.7% Tons of Non C&D Materials from Self-haul Customers 2,668
Totals 78,776 100%Sample Count 19
Confidence intervals calculated at a 90% confidence level.

Delaware Solid Waste Authority | Statewide Waste Characterization Study
| 22
Table 24. Composition of Residential MSW, Route 5 Transfer Station
Material Est. Tons Mean +/-
Stnd.
Dev. Material Est. Tons Mean +/-
Stnd.
Dev.
Paper 10,531 24.0% Metal 1,280 2.9%Newspaper and Inserts 1,455 3.3% 2.9% 1.8% Tin/Steel Containers 394 0.9% 0.3% 0.2%Corrugated Cardboard/Kraft Paper 748 1.7% 1.1% 0.7% Other Ferrous 218 0.5% 0.3% 0.2%High Grade Office Paper 324 0.7% 0.4% 0.3% Aluminum Beverage & Cat Food Containers 271 0.6% 0.2% 0.1%Mixed Recyclable Paper 1,570 3.6% 1.8% 1.1% Other Aluminum 128 0.3% 0.1% 0.0%Compostable Paper 5,859 13.3% 2.9% 1.8% Other Non-Ferrous 270 0.6% 0.7% 0.4%Aseptic Boxes and Gable Top Cartons 68 0.2% 0.1% 0.0%Remainder/Composite Paper 506 1.2% 0.6% 0.4% Glass 1,872 4.3%
Glass Bottles and Jars 1,245 2.8% 0.9% 0.5%Plastic 5,338 12.2% Remainder/Composite Glass 627 1.4% 1.2% 0.8%
PET #1 Bottles, Jars, or Containers 733 1.7% 0.4% 0.2%HDPE #2 Natural and Colored Bottles 497 1.1% 0.3% 0.2% C&D 3,260 7.4%Rigid HDPE #2 Containers 40 0.1% 0.2% 0.1% Pallets/Crates - 0.0% 0.0% 0.0%#3 to #7 Bottles or Jars 32 0.1% 0.1% 0.0% Clean Lumber 1,007 2.3% 3.7% 2.3%Injection Molded Tubs #2, #4, #5, #6, & #7 153 0.3% 0.2% 0.1% Painted and Stained Wood 129 0.3% 0.3% 0.2%All Other Rigid Plastic Packaging - 0.0% 0.0% 0.0% Other Engineered Wood 951 2.2% 2.5% 1.5%White Expanded Polystyrene (Styrofoam) 362 0.8% 0.2% 0.1% Wood Furniture 925 2.1% 2.3% 1.4%Recoverable Film 290 0.7% 0.2% 0.1% Other Wood 84 0.2% 0.2% 0.1%All Other Film 1,848 4.2% 0.6% 0.4% Asphalt Roofing - 0.0% 0.0% 0.0%Agricultural Film & Marine Shrink Wrap - 0.0% 0.0% 0.0% Asphalt, Brick, Concrete, and Rocks 14 0.0% 0.1% 0.0%Large Plastic Items 123 0.3% 0.5% 0.3% Drywall/Gypsum Board - 0.0% 0.0% 0.0%Remainder/Composite Plastic 1,259 2.9% 0.7% 0.4% Remainder/Composite C&D 150 0.3% 0.4% 0.2%
Organic 19,621 44.7% Other 2,009 4.6%Vegetative Food Waste, Unpackaged 3,855 8.8% 3.4% 2.1% Tires - 0.0% 0.0% 0.0%Protein Food Waste, Unpackaged 2,583 5.9% 3.9% 2.4% Small Appliances - 0.0% 0.0% 0.0%Food Waste in Plastic Packaging 2,550 5.8% 1.5% 0.9% Large Electronics 1,024 2.3% 2.8% 1.7%
Food Waste in Other Packaging 225 0.5% 0.4% 0.3% Other Small Consumer Electronics 100 0.2% 0.3% 0.2%Leaves, Grass, and Brush 4,299 9.8% 6.8% 4.2% Items with CRTs - 0.0% 0.0% 0.0%Branches and Stumps - 0.0% 0.0% 0.0% Other Larger Electronics - 0.0% 0.0% 0.0%Textiles 2,029 4.6% 1.7% 1.1% Other Haz. or Household Haz. Waste (HHW) 337 0.8% 0.5% 0.3%Rubber/Leather 451 1.0% 1.1% 0.7% All Other Wastes 548 1.2% 0.7% 0.4%Diapers and Sanitary Products 2,124 4.8% 1.7% 1.0%Carpet and Carpet Padding 11 0.0% 0.0% 0.0% Hauler Collected MSW Tons 41,392 Remainder/Composite Organic 1,494 3.4% 1.8% 1.1% Tons of Non C&D Materials from Self-haul Customers 2,519
Totals 43,910 100%Sample Count 9
Confidence intervals calculated at a 90% confidence level. Table 25. Composition of ICI MSW, Route 5 Transfer Station
Material Est. Tons Mean +/-
Stnd.
Dev. Material Est. Tons Mean +/-
Stnd.
Dev.
Paper 12,944 37.1% Metal 1,134 3.3%Newspaper and Inserts 954 2.7% 2.8% 1.7% Tin/Steel Containers 143 0.4% 0.3% 0.2%Corrugated Cardboard/Kraft Paper 5,639 16.2% 11.7% 7.1% Other Ferrous 681 2.0% 2.4% 1.5%High Grade Office Paper 348 1.0% 1.1% 0.7% Aluminum Beverage & Cat Food Containers 183 0.5% 0.2% 0.1%Mixed Recyclable Paper 1,172 3.4% 1.7% 1.0% Other Aluminum 49 0.1% 0.1% 0.1%Compostable Paper 3,981 11.4% 4.0% 2.4% Other Non-Ferrous 77 0.2% 0.3% 0.2%Aseptic Boxes and Gable Top Cartons 35 0.1% 0.1% 0.1%Remainder/Composite Paper 814 2.3% 1.5% 0.9% Glass 980 2.8%
Glass Bottles and Jars 929 2.7% 2.1% 1.3%Plastic 7,112 20.4% Remainder/Composite Glass 51 0.1% 0.2% 0.1%
PET #1 Bottles, Jars, or Containers 627 1.8% 0.7% 0.4%HDPE #2 Natural and Colored Bottles 418 1.2% 0.9% 0.5% C&D 3,454 9.9%Rigid HDPE #2 Containers 112 0.3% 0.3% 0.2% Pallets/Crates 302 0.9% 1.4% 0.9%#3 to #7 Bottles or Jars 27 0.1% 0.1% 0.0% Clean Lumber 1,376 3.9% 3.0% 1.8%Injection Molded Tubs #2, #4, #5, #6, & #7 70 0.2% 0.1% 0.1% Painted and Stained Wood 13 0.0% 0.1% 0.0%All Other Rigid Plastic Packaging 30 0.1% 0.1% 0.1% Other Engineered Wood 448 1.3% 2.1% 1.3%White Expanded Polystyrene (Styrofoam) 296 0.8% 0.6% 0.3% Wood Furniture - 0.0% 0.0% 0.0%Recoverable Film 1,302 3.7% 3.5% 2.2% Other Wood 460 1.3% 1.5% 0.9%All Other Film 2,557 7.3% 1.6% 1.0% Asphalt Roofing - 0.0% 0.0% 0.0%Agricultural Film & Marine Shrink Wrap - 0.0% 0.0% 0.0% Asphalt, Brick, Concrete, and Rocks 26 0.1% 0.1% 0.1%Large Plastic Items 197 0.6% 0.6% 0.4% Drywall/Gypsum Board 773 2.2% 3.4% 2.1%Remainder/Composite Plastic 1,476 4.2% 2.9% 1.8% Remainder/Composite C&D 56 0.2% 0.2% 0.1%
Organic 8,714 25.0% Other 528 1.5%Vegetative Food Waste, Unpackaged 2,982 8.6% 6.1% 3.7% Tires - 0.0% 0.0% 0.0%Protein Food Waste, Unpackaged 1,583 4.5% 4.4% 2.7% Small Appliances - 0.0% 0.0% 0.0%Food Waste in Plastic Packaging 1,622 4.7% 2.6% 1.6% Large Electronics - 0.0% 0.0% 0.0%
Food Waste in Other Packaging 105 0.3% 0.3% 0.2% Other Small Consumer Electronics 53 0.2% 0.1% 0.1%Leaves, Grass, and Brush 120 0.3% 0.3% 0.2% Items with CRTs - 0.0% 0.0% 0.0%Branches and Stumps - 0.0% 0.0% 0.0% Other Larger Electronics - 0.0% 0.0% 0.0%Textiles 814 2.3% 1.9% 1.1% Other Haz. or Household Haz. Waste (HHW) 102 0.3% 0.3% 0.2%Rubber/Leather 292 0.8% 0.8% 0.5% All Other Wastes 373 1.1% 0.7% 0.4%Diapers and Sanitary Products 244 0.7% 0.7% 0.4%Carpet and Carpet Padding 124 0.4% 0.4% 0.3% Hauler Collected MSW Tons 34,716 Remainder/Composite Organic 828 2.4% 1.1% 0.6% Tons of Non C&D Materials from Self-haul Customers 149
Totals 34,866 100%Sample Count 10
Confidence intervals calculated at a 90% confidence level.

Delaware Solid Waste Authority | Statewide Waste Characterization Study
| 23
Jones Crossroads Landfill
Table 26. Overall Composition of MSW, Jones Crossroads Landfill
Material Est. Tons Mean +/-
Stnd.
Dev. Material Est. Tons Mean +/-
Stnd.
Dev.
Paper 15,011 27.1% Metal 2,039 3.7%Newspaper and Inserts 400 0.7% 0.3% 0.2% Tin/Steel Containers 421 0.8% 0.3% 0.2%Corrugated Cardboard/Kraft Paper 6,694 12.1% 6.8% 4.1% Other Ferrous 1,157 2.1% 2.1% 1.3%High Grade Office Paper 153 0.3% 0.1% 0.1% Aluminum Beverage & Cat Food Containers 204 0.4% 0.1% 0.1%Mixed Recyclable Paper 2,322 4.2% 2.2% 1.3% Other Aluminum 128 0.2% 0.1% 0.1%Compostable Paper 4,664 8.4% 1.8% 1.1% Other Non-Ferrous 129 0.2% 0.1% 0.1%Aseptic Boxes and Gable Top Cartons 401 0.7% 1.1% 0.7%Remainder/Composite Paper 377 0.7% 0.4% 0.2% Glass 887 1.6%
Glass Bottles and Jars 826 1.5% 0.6% 0.4%Plastic 8,779 15.9% Remainder/Composite Glass 61 0.1% 0.1% 0.0%
PET #1 Bottles, Jars, or Containers 760 1.4% 0.5% 0.3%HDPE #2 Natural and Colored Bottles 284 0.5% 0.2% 0.1% C&D 6,030 10.9%Rigid HDPE #2 Containers 130 0.2% 0.2% 0.1% Pallets/Crates 500 0.9% 1.0% 0.6%#3 to #7 Bottles or Jars 79 0.1% 0.1% 0.1% Clean Lumber 513 0.9% 1.1% 0.7%Injection Molded Tubs #2, #4, #5, #6, & #7 78 0.1% 0.1% 0.0% Painted and Stained Wood 91 0.2% 0.2% 0.1%All Other Rigid Plastic Packaging 18 0.0% 0.0% 0.0% Other Engineered Wood 250 0.5% 0.3% 0.2%White Expanded Polystyrene (Styrofoam) 1,195 2.2% 1.5% 0.9% Wood Furniture 2,527 4.6% 4.3% 2.6%Recoverable Film 514 0.9% 0.7% 0.4% Other Wood 254 0.5% 0.4% 0.2%All Other Film 3,385 6.1% 1.6% 1.0% Asphalt Roofing - 0.0% 0.0% 0.0%Agricultural Film & Marine Shrink Wrap - 0.0% 0.0% 0.0% Asphalt, Brick, Concrete, and Rocks 138 0.2% 0.3% 0.2%Large Plastic Items 699 1.3% 1.6% 1.0% Drywall/Gypsum Board 19 0.0% 0.1% 0.0%Remainder/Composite Plastic 1,636 3.0% 1.0% 0.6% Remainder/Composite C&D 1,738 3.1% 3.6% 2.2%
Organic 17,575 31.8% Other 5,007 9.0%Vegetative Food Waste, Unpackaged 6,242 11.3% 4.4% 2.7% Tires - 0.0% 0.0% 0.0%Protein Food Waste, Unpackaged 837 1.5% 0.6% 0.4% Small Appliances 132 0.2% 0.3% 0.2%Food Waste in Plastic Packaging 1,620 2.9% 0.7% 0.4% Large Electronics 289 0.5% 0.8% 0.5%
Food Waste in Other Packaging 517 0.9% 0.3% 0.2% Other Small Consumer Electronics 105 0.2% 0.2% 0.1%Leaves, Grass, and Brush 977 1.8% 1.5% 0.9% Items with CRTs - 0.0% 0.0% 0.0%Branches and Stumps 271 0.5% 0.6% 0.4% Other Larger Electronics - 0.0% 0.0% 0.0%Textiles 2,279 4.1% 1.8% 1.1% Other Haz. or Household Haz. Waste (HHW) 1,175 2.1% 2.7% 1.6%Rubber/Leather 328 0.6% 0.5% 0.3% All Other Wastes 3,307 6.0% 2.8% 1.7%Diapers and Sanitary Products 1,415 2.6% 0.8% 0.5%Carpet and Carpet Padding 875 1.6% 1.5% 0.9% Hauler Collected MSW Tons 51,036 Remainder/Composite Organic 2,214 4.0% 4.0% 2.4% Tons of Non C&D Materials from Self-haul Customers 4,293
Totals 55,328 100%Sample Count 26
Confidence intervals calculated at a 90% confidence level.

Delaware Solid Waste Authority | Statewide Waste Characterization Study
| 24
Table 27. Composition of Residential MSW, Jones Crossroads Landfill
Material Est. Tons Mean +/-
Stnd.
Dev. Material Est. Tons Mean +/-
Stnd.
Dev.
Paper 4,376 18.4% Metal 1,062 4.5%Newspaper and Inserts 352 1.5% 0.8% 0.5% Tin/Steel Containers 256 1.1% 0.6% 0.4%Corrugated Cardboard/Kraft Paper 420 1.8% 1.0% 0.6% Other Ferrous 484 2.0% 1.9% 1.2%High Grade Office Paper 75 0.3% 0.2% 0.1% Aluminum Beverage & Cat Food Containers 121 0.5% 0.1% 0.1%Mixed Recyclable Paper 785 3.3% 1.5% 0.9% Other Aluminum 88 0.4% 0.2% 0.1%Compostable Paper 2,571 10.8% 2.0% 1.2% Other Non-Ferrous 113 0.5% 0.3% 0.2%Aseptic Boxes and Gable Top Cartons 16 0.1% 0.0% 0.0%Remainder/Composite Paper 158 0.7% 0.4% 0.2% Glass 501 2.1%
Glass Bottles and Jars 446 1.9% 0.9% 0.5%Plastic 3,049 12.8% Remainder/Composite Glass 56 0.2% 0.2% 0.1%
PET #1 Bottles, Jars, or Containers 318 1.3% 0.3% 0.2%HDPE #2 Natural and Colored Bottles 183 0.8% 0.3% 0.2% C&D 3,293 13.9%Rigid HDPE #2 Containers 124 0.5% 0.5% 0.3% Pallets/Crates 2 0.0% 0.0% 0.0%#3 to #7 Bottles or Jars 32 0.1% 0.1% 0.1% Clean Lumber 396 1.7% 2.4% 1.5%Injection Molded Tubs #2, #4, #5, #6, & #7 54 0.2% 0.1% 0.1% Painted and Stained Wood 90 0.4% 0.5% 0.3%All Other Rigid Plastic Packaging 8 0.0% 0.0% 0.0% Other Engineered Wood 91 0.4% 0.4% 0.2%White Expanded Polystyrene (Styrofoam) 138 0.6% 0.2% 0.1% Wood Furniture 839 3.5% 3.9% 2.4%Recoverable Film 212 0.9% 0.4% 0.3% Other Wood 112 0.5% 0.4% 0.2%All Other Film 1,317 5.5% 1.3% 0.8% Asphalt Roofing - 0.0% 0.0% 0.0%Agricultural Film & Marine Shrink Wrap - 0.0% 0.0% 0.0% Asphalt, Brick, Concrete, and Rocks 16 0.1% 0.1% 0.0%Large Plastic Items 83 0.3% 0.5% 0.3% Drywall/Gypsum Board 19 0.1% 0.1% 0.1%Remainder/Composite Plastic 581 2.4% 0.8% 0.5% Remainder/Composite C&D 1,728 7.3% 8.3% 5.1%
Organic 8,880 37.4% Other 2,581 10.9%Vegetative Food Waste, Unpackaged 2,398 10.1% 3.9% 2.3% Tires - 0.0% 0.0% 0.0%Protein Food Waste, Unpackaged 526 2.2% 1.1% 0.7% Small Appliances 132 0.6% 0.8% 0.5%Food Waste in Plastic Packaging 1,223 5.2% 1.4% 0.9% Large Electronics 289 1.2% 2.0% 1.2%
Food Waste in Other Packaging 390 1.6% 0.6% 0.4% Other Small Consumer Electronics 55 0.2% 0.2% 0.1%Leaves, Grass, and Brush 663 2.8% 2.6% 1.6% Items with CRTs - 0.0% 0.0% 0.0%Branches and Stumps 108 0.5% 0.7% 0.5% Other Larger Electronics - 0.0% 0.0% 0.0%Textiles 1,322 5.6% 2.4% 1.4% Other Haz. or Household Haz. Waste (HHW) 137 0.6% 0.4% 0.2%Rubber/Leather 238 1.0% 1.2% 0.8% All Other Wastes 1,969 8.3% 5.1% 3.1%Diapers and Sanitary Products 988 4.2% 1.5% 0.9%Carpet and Carpet Padding 461 1.9% 2.0% 1.2% Hauler Collected MSW Tons 21,274 Remainder/Composite Organic 562 2.4% 1.3% 0.8% Tons of Non C&D Materials from Self-haul Customers 2,468
Totals 23,741 100%Sample Count 12
Confidence intervals calculated at a 90% confidence level. Table 28. Composition of ICI MSW, Jones Crossroads Landfill
Material Est. Tons Mean +/-
Stnd.
Dev. Material Est. Tons Mean +/-
Stnd.
Dev.
Paper 10,635 33.7% Metal 977 3.1%Newspaper and Inserts 48 0.2% 0.1% 0.1% Tin/Steel Containers 165 0.5% 0.3% 0.2%Corrugated Cardboard/Kraft Paper 6,275 19.9% 11.8% 7.2% Other Ferrous 673 2.1% 3.4% 2.1%High Grade Office Paper 78 0.2% 0.2% 0.1% Aluminum Beverage & Cat Food Containers 83 0.3% 0.2% 0.1%Mixed Recyclable Paper 1,537 4.9% 3.6% 2.2% Other Aluminum 40 0.1% 0.1% 0.1%Compostable Paper 2,094 6.6% 2.7% 1.7% Other Non-Ferrous 16 0.1% 0.0% 0.0%Aseptic Boxes and Gable Top Cartons 385 1.2% 1.9% 1.2%Remainder/Composite Paper 219 0.7% 0.6% 0.3% Glass 386 1.2%
Glass Bottles and Jars 381 1.2% 0.8% 0.5%Plastic 5,730 18.1% Remainder/Composite Glass 6 0.0% 0.0% 0.0%
PET #1 Bottles, Jars, or Containers 442 1.4% 0.9% 0.5%HDPE #2 Natural and Colored Bottles 101 0.3% 0.2% 0.1% C&D 2,737 8.7%Rigid HDPE #2 Containers 6 0.0% 0.0% 0.0% Pallets/Crates 498 1.6% 1.8% 1.1%#3 to #7 Bottles or Jars 47 0.1% 0.2% 0.1% Clean Lumber 117 0.4% 0.5% 0.3%Injection Molded Tubs #2, #4, #5, #6, & #7 24 0.1% 0.1% 0.0% Painted and Stained Wood 1 0.0% 0.0% 0.0%All Other Rigid Plastic Packaging 11 0.0% 0.0% 0.0% Other Engineered Wood 159 0.5% 0.5% 0.3%White Expanded Polystyrene (Styrofoam) 1,057 3.3% 2.7% 1.6% Wood Furniture 1,688 5.3% 7.0% 4.2%Recoverable Film 303 1.0% 1.2% 0.7% Other Wood 142 0.4% 0.6% 0.3%All Other Film 2,068 6.5% 2.7% 1.6% Asphalt Roofing - 0.0% 0.0% 0.0%Agricultural Film & Marine Shrink Wrap - 0.0% 0.0% 0.0% Asphalt, Brick, Concrete, and Rocks 122 0.4% 0.6% 0.4%Large Plastic Items 616 2.0% 2.8% 1.7% Drywall/Gypsum Board - 0.0% 0.0% 0.0%Remainder/Composite Plastic 1,054 3.3% 1.7% 1.0% Remainder/Composite C&D 11 0.0% 0.0% 0.0%
Organic 8,695 27.5% Other 2,426 7.7%Vegetative Food Waste, Unpackaged 3,844 12.2% 7.2% 4.4% Tires - 0.0% 0.0% 0.0%Protein Food Waste, Unpackaged 311 1.0% 0.7% 0.4% Small Appliances - 0.0% 0.0% 0.0%Food Waste in Plastic Packaging 396 1.3% 0.6% 0.4% Large Electronics - 0.0% 0.0% 0.0%
Food Waste in Other Packaging 127 0.4% 0.3% 0.2% Other Small Consumer Electronics 50 0.2% 0.3% 0.2%Leaves, Grass, and Brush 314 1.0% 1.6% 1.0% Items with CRTs - 0.0% 0.0% 0.0%Branches and Stumps 164 0.5% 0.8% 0.5% Other Larger Electronics - 0.0% 0.0% 0.0%Textiles 956 3.0% 2.7% 1.6% Other Haz. or Household Haz. Waste (HHW) 1,038 3.3% 4.6% 2.8%Rubber/Leather 89 0.3% 0.1% 0.1% All Other Wastes 1,338 4.2% 3.0% 1.8%Diapers and Sanitary Products 427 1.4% 0.8% 0.5%Carpet and Carpet Padding 413 1.3% 2.1% 1.2% Hauler Collected MSW Tons 29,762 Remainder/Composite Organic 1,652 5.2% 7.0% 4.2% Tons of Non C&D Materials from Self-haul Customers 1,825
Totals 31,587 100%Sample Count 14
Confidence intervals calculated at a 90% confidence level.

Delaware Solid Waste Authority | Statewide Waste Characterization Study
| 25
Multi-Family MSW
The Project Team also obtained several loads of multi-family municipal solid waste over the two seasons. Table 29 presents the data. It should be noted that all multi-family MSW obtained for sampling was generated in New Castle County, and is typically delivered to the Cherry Island Landfill. Table 29. Composition of Multi-Family MSW
Material Mean +/-
Stnd.
Dev. Material Mean +/-
Stnd.
Dev.
Paper 24.0% Metal 3.2%Newspaper and Inserts 2.4% 1.2% 0.7% Tin/Steel Containers 1.1% 0.3% 0.2%Corrugated Cardboard/Kraft Paper 6.4% 2.3% 1.4% Other Ferrous 0.8% 0.7% 0.4%High Grade Office Paper 0.7% 0.4% 0.3% Aluminum Beverage & Cat Food Containers 0.4% 0.1% 0.1%Mixed Recyclable Paper 4.8% 1.2% 0.7% Other Aluminum 0.2% 0.1% 0.0%Compostable Paper 7.8% 1.5% 0.9% Other Non-Ferrous 0.6% 0.6% 0.4%Aseptic Boxes and Gable Top Cartons 0.2% 0.1% 0.0%Remainder/Composite Paper 1.7% 1.9% 1.1% Glass 5.4%
Glass Bottles and Jars 4.2% 1.3% 0.8%Plastic 13.0% Remainder/Composite Glass 1.2% 1.5% 0.9%
PET #1 Bottles, Jars, or Containers 1.9% 0.2% 0.1%HDPE #2 Natural and Colored Bottles 1.0% 0.2% 0.1% C&D 6.7%Rigid HDPE #2 Containers 0.0% 0.0% 0.0% Pallets/Crates 0.0% 0.0% 0.0%#3 to #7 Bottles or Jars 0.1% 0.0% 0.0% Clean Lumber 1.3% 1.4% 0.8%Injection Molded Tubs #2, #4, #5, #6, & #7 0.3% 0.1% 0.1% Painted and Stained Wood 1.2% 1.1% 0.7%All Other Rigid Plastic Packaging 0.2% 0.3% 0.2% Other Engineered Wood 1.5% 1.8% 1.1%White Expanded Polystyrene (Styrofoam) 0.5% 0.1% 0.1% Wood Furniture 2.0% 3.2% 1.9%Recoverable Film 0.8% 0.3% 0.2% Other Wood 0.0% 0.1% 0.0%All Other Film 3.9% 0.4% 0.3% Asphalt Roofing 0.0% 0.0% 0.0%Agricultural Film & Marine Shrink Wrap 0.0% 0.0% 0.0% Asphalt, Brick, Concrete, and Rocks 0.1% 0.1% 0.1%Large Plastic Items 0.9% 1.1% 0.7% Drywall/Gypsum Board 0.1% 0.2% 0.1%Remainder/Composite Plastic 3.4% 0.9% 0.6% Remainder/Composite C&D 0.3% 0.3% 0.2%
Organic 36.8% Other 11.0%Vegetative Food Waste, Unpackaged 6.7% 1.7% 1.1% Tires 1.9% 3.2% 1.9%Protein Food Waste, Unpackaged 3.2% 1.3% 0.8% Small Appliances 0.1% 0.1% 0.1%Food Waste in Plastic Packaging 10.0% 3.4% 2.1% Large Electronics 4.0% 3.6% 2.2%
Food Waste in Other Packaging 1.4% 0.8% 0.5% Other Small Consumer Electronics 0.3% 0.2% 0.1%Leaves, Grass, and Brush 0.2% 0.2% 0.2% Items with CRTs 1.5% 2.4% 1.5%Branches and Stumps 0.0% 0.0% 0.0% Other Larger Electronics 0.0% 0.0% 0.0%Textiles 6.4% 1.8% 1.1% Other Haz. or Household Haz. Waste (HHW) 0.1% 0.0% 0.0%Rubber/Leather 0.5% 0.3% 0.2% All Other Wastes 3.3% 2.2% 1.4%Diapers and Sanitary Products 4.9% 1.6% 1.0%Carpet and Carpet Padding 1.3% 1.1% 0.7% Totals 100%Remainder/Composite Organic 2.1% 0.7% 0.4% Sample Count 12
Confidence intervals calculated at a 90% confidence level.
Self-Haul Loads
In addition to hand sorting of Residential and ICI MSW delivered to each facility, the Project Team also conducted visual analysis of Self-Haul loads at each facility during both seasons. Tables 30 through 36 present the average of all observed Self-Haul loads, first as an overall weighted average of the six facilities, and then by individual facility.

Delaware Solid Waste Authority | Statewide Waste Characterization Study
| 26
Table 30. Overall Composition of Self-Haul MSW
Material Est. Tons Mean +/-
Stnd.
Dev. Material Est. Tons Mean +/-
Stnd.
Dev.
Paper 2,297 5.2% C&D 21,481 48.5%OCC/Kraft 2,224 5.0% 2.5% 1.5% Concrete/Brick/Rock 611 1.4% 1.1% 0.7%R/C and Other Paper 73 0.2% 0.2% 0.1% Asphalt Paving 39 0.1% 0.1% 0.1%
Asphalt Roofing 5,178 11.7% 7.9% 4.8%Plastic 876 2.0% Wood Roofing - 0.0% 0.0% 0.0%
HDPE Buckets 153 0.3% 0.3% 0.2% Ceiling Tiles 96 0.2% 0.3% 0.2%Clean Recoverable Film 84 0.2% 0.1% 0.1% Vinyl Siding 177 0.4% 0.3% 0.2%Foamed Insulation 11 0.0% 0.0% 0.0% Pallets and Crates 488 1.1% 0.8% 0.5%R/C and Other Plastic 628 1.4% 0.6% 0.4% Clean Lumber 2,497 5.6% 1.7% 1.0%
Plywood 1,515 3.4% 1.4% 0.8%Glass 1,262 2.8% Other Engineered Wood 1,469 3.3% 1.3% 0.8%
R/C and Other Glass 1,262 2.8% 2.2% 1.3% Wood Furniture 971 2.2% 0.9% 0.5%Painted/Stained Wood 2,612 5.9% 3.2% 1.9%
Organic 4,686 10.6% Treated Wood 1,245 2.8% 1.5% 0.9%Yard Waste 3,312 7.5% 9.0% 5.5% Clean Gypsum Board 923 2.1% 1.8% 1.1%Carpet 1,162 2.6% 1.1% 0.6% Painted/Papered Gypsum Board 867 2.0% 1.7% 1.0%Carpet Padding 160 0.4% 0.2% 0.1% Dirt, Sand, and Gravel 56 0.1% 0.2% 0.1%R/C and Other Organics 52 0.1% 0.2% 0.1% Fiberglass Insulation 41 0.1% 0.1% 0.0%
R/C and Other C&D 2,696 6.1% 2.4% 1.4%Metal 420 0.9%
HVAC Ducting 11 0.0% 0.0% 0.0% MSW 8,970 20.2%Wire Sheathing - 0.0% 0.0% 0.0% Mixed MSW 8,970 20.2% 3.9% 2.4%Other Ferrous 336 0.8% 0.3% 0.2%Non-Ferrous 73 0.2% 0.2% 0.1%
Special 4,334 9.8%Appliances 216 0.5% 0.3% 0.2%
Electronics 577 1.3% 0.5% 0.3%Items with CRTs 308 0.7% 0.4% 0.2%Bulky Items 2,953 6.7% 1.9% 1.2%Tires 114 0.3% 0.4% 0.3%Lead acid batteries - 0.0% 0.0% 0.0%Vehicle Fluids - 0.0% 0.0% 0.0%Paint - 0.0% 0.0% 0.0%Other Hazardous - 0.0% 0.0% 0.0% Totals 44,326 100%Fines/Mixed Residue 167 0.4% 0.5% 0.3% Sample Count 350
Confidence intervals calculated at a 90% confidence level.

Delaware Solid Waste Authority | Statewide Waste Characterization Study
| 27
Table 31. Composition of Self-Haul Loads, Cherry Island Landfill
Material Est. Tons Mean +/-
Stnd.
Dev. Material Est. Tons Mean +/-
Stnd.
Dev.
Paper 1,452 8.5% C&D 6,927 40.4%OCC/Kraft 1,441 8.4% 6.2% 3.8% Concrete/Brick/Rock 51 0.3% 0.5% 0.3%R/C and Other Paper 11 0.1% 0.1% 0.1% Asphalt Paving - 0.0% 0.0% 0.0%
Asphalt Roofing 1,526 8.9% 8.0% 4.9%Plastic 386 2.2% Wood Roofing - 0.0% 0.0% 0.0%
HDPE Buckets 62 0.4% 0.6% 0.4% Ceiling Tiles - 0.0% 0.0% 0.0%Clean Recoverable Film 21 0.1% 0.2% 0.1% Vinyl Siding 51 0.3% 0.3% 0.2%Foamed Insulation - 0.0% 0.0% 0.0% Pallets and Crates 199 1.2% 1.4% 0.9%R/C and Other Plastic 303 1.8% 1.4% 0.9% Clean Lumber 489 2.9% 1.6% 1.0%
Plywood 403 2.4% 1.6% 1.0%Glass 718 4.2% Other Engineered Wood 688 4.0% 2.3% 1.4%
R/C and Other Glass 718 4.2% 4.4% 2.6% Wood Furniture 303 1.8% 1.2% 0.7%Painted/Stained Wood 1,204 7.0% 7.1% 4.3%
Organic 3,635 21.2% Treated Wood 440 2.6% 2.1% 1.3%Yard Waste 3,051 17.8% 23.3% 14.2% Clean Gypsum Board 114 0.7% 0.6% 0.4%Carpet 484 2.8% 2.0% 1.2% Painted/Papered Gypsum Board 573 3.3% 4.1% 2.5%Carpet Padding 92 0.5% 0.4% 0.2% Dirt, Sand, and Gravel 56 0.3% 0.5% 0.3%R/C and Other Organics 8 0.0% 0.1% 0.0% Fiberglass Insulation 8 0.0% 0.1% 0.0%
R/C and Other C&D 821 4.8% 2.6% 1.6%Metal 77 0.5%
HVAC Ducting 5 0.0% 0.1% 0.0% MSW 2,869 16.7%Wire Sheathing - 0.0% 0.0% 0.0% Mixed MSW 2,869 16.7% 8.3% 5.0%Other Ferrous 52 0.3% 0.4% 0.2%Non-Ferrous 20 0.1% 0.1% 0.1%
Special 1,081 6.3%Appliances 59 0.3% 0.6% 0.4%
Electronics 64 0.4% 0.4% 0.2%Items with CRTs 70 0.4% 0.5% 0.3%Bulky Items 888 5.2% 2.6% 1.6%Tires - 0.0% 0.0% 0.0%Lead acid batteries - 0.0% 0.0% 0.0%Vehicle Fluids - 0.0% 0.0% 0.0%Paint - 0.0% 0.0% 0.0%Other Hazardous - 0.0% 0.0% 0.0% Totals 17,146 100%Fines/Mixed Residue - 0.0% 0.0% 0.0% Sample Count 78
Confidence intervals calculated at a 90% confidence level. Table 32. Composition of Self-Haul Loads, Pine Tree Corners Transfer Station
Material Est. Tons Mean +/-
Stnd.
Dev. Material Est. Tons Mean +/-
Stnd.
Dev.
Paper 182 5.0% C&D 1,681 46.5%OCC/Kraft 182 5.0% 5.0% 3.1% Concrete/Brick/Rock 267 7.4% 11.4% 6.9%R/C and Other Paper - 0.0% 0.0% 0.0% Asphalt Paving - 0.0% 0.0% 0.0%
Asphalt Roofing 154 4.3% 6.1% 3.7%Plastic 19 0.5% Wood Roofing - 0.0% 0.0% 0.0%
HDPE Buckets 4 0.1% 0.2% 0.1% Ceiling Tiles - 0.0% 0.0% 0.0%Clean Recoverable Film - 0.0% 0.0% 0.0% Vinyl Siding 57 1.6% 2.1% 1.3%Foamed Insulation - 0.0% 0.0% 0.0% Pallets and Crates - 0.0% 0.0% 0.0%R/C and Other Plastic 15 0.4% 0.6% 0.4% Clean Lumber - 0.0% 0.0% 0.0%
Plywood 73 2.0% 1.7% 1.0%Glass - 0.0% Other Engineered Wood 54 1.5% 1.2% 0.7%
R/C and Other Glass - 0.0% 0.0% 0.0% Wood Furniture 110 3.0% 2.1% 1.3%Painted/Stained Wood 495 13.7% 10.4% 6.3%
Organic 223 6.2% Treated Wood 91 2.5% 2.8% 1.7%Yard Waste 80 2.2% 3.0% 1.8% Clean Gypsum Board - 0.0% 0.0% 0.0%Carpet 119 3.3% 3.2% 2.0% Painted/Papered Gypsum Board 184 5.1% 4.8% 2.9%Carpet Padding 24 0.7% 0.8% 0.5% Dirt, Sand, and Gravel - 0.0% 0.0% 0.0%R/C and Other Organics - 0.0% 0.0% 0.0% Fiberglass Insulation 10 0.3% 0.3% 0.2%
R/C and Other C&D 186 5.1% 3.4% 2.0%Metal 37 1.0%
HVAC Ducting - 0.0% 0.0% 0.0% MSW 1,057 29.3%Wire Sheathing - 0.0% 0.0% 0.0% Mixed MSW 1,057 29.3% 11.5% 7.0%Other Ferrous 37 1.0% 0.9% 0.5%Non-Ferrous - 0.0% 0.0% 0.0%
Special 414 11.5%Appliances 12 0.3% 0.5% 0.3%
Electronics 91 2.5% 2.2% 1.3%Items with CRTs 54 1.5% 1.9% 1.1%Bulky Items 255 7.1% 5.3% 3.2%Tires 2 0.1% 0.1% 0.1%Lead acid batteries - 0.0% 0.0% 0.0%Vehicle Fluids - 0.0% 0.0% 0.0%Paint - 0.0% 0.0% 0.0%Other Hazardous - 0.0% 0.0% 0.0% Totals 3,612 100%Fines/Mixed Residue - 0.0% 0.0% 0.0% Sample Count 73
Confidence intervals calculated at a 90% confidence level.

Delaware Solid Waste Authority | Statewide Waste Characterization Study
| 28
Table 33. Composition of Self-Haul Loads, Sandtown Landfill
Material Est. Tons Mean +/-
Stnd.
Dev. Material Est. Tons Mean +/-
Stnd.
Dev.
Paper 231 5.5% C&D 1,022 24.5%OCC/Kraft 185 4.4% 2.6% 1.6% Concrete/Brick/Rock - 0.0% 0.0% 0.0%R/C and Other Paper 46 1.1% 1.5% 0.9% Asphalt Paving 39 0.9% 1.5% 0.9%
Asphalt Roofing 112 2.7% 4.0% 2.5%Plastic 111 2.7% Wood Roofing - 0.0% 0.0% 0.0%
HDPE Buckets - 0.0% 0.0% 0.0% Ceiling Tiles - 0.0% 0.0% 0.0%Clean Recoverable Film - 0.0% 0.0% 0.0% Vinyl Siding - 0.0% 0.0% 0.0%Foamed Insulation - 0.0% 0.0% 0.0% Pallets and Crates - 0.0% 0.0% 0.0%R/C and Other Plastic 111 2.7% 2.2% 1.4% Clean Lumber 249 5.9% 3.6% 2.2%
Plywood 91 2.2% 1.6% 0.9%Glass - 0.0% Other Engineered Wood 43 1.0% 1.5% 0.9%
R/C and Other Glass - 0.0% 0.0% 0.0% Wood Furniture 96 2.3% 2.2% 1.3%Painted/Stained Wood 136 3.2% 2.6% 1.6%
Organic 192 4.6% Treated Wood 226 5.4% 7.1% 4.3%Yard Waste 43 1.0% 1.3% 0.8% Clean Gypsum Board - 0.0% 0.0% 0.0%Carpet 150 3.6% 2.8% 1.7% Painted/Papered Gypsum Board - 0.0% 0.0% 0.0%Carpet Padding - 0.0% 0.0% 0.0% Dirt, Sand, and Gravel - 0.0% 0.0% 0.0%R/C and Other Organics - 0.0% 0.0% 0.0% Fiberglass Insulation 5 0.1% 0.2% 0.1%
R/C and Other C&D 25 0.6% 1.0% 0.6%Metal 56 1.3%
HVAC Ducting - 0.0% 0.0% 0.0% MSW 2,052 49.1%Wire Sheathing - 0.0% 0.0% 0.0% Mixed MSW 2,052 49.1% 9.3% 5.7%Other Ferrous 49 1.2% 1.1% 0.7%Non-Ferrous 7 0.2% 0.3% 0.2%
Special 512 12.3%Appliances 57 1.4% 1.2% 0.7%
Electronics 49 1.2% 1.2% 0.7%Items with CRTs 81 1.9% 1.7% 1.0%Bulky Items 325 7.8% 4.7% 2.9%Tires - 0.0% 0.0% 0.0%Lead acid batteries - 0.0% 0.0% 0.0%Vehicle Fluids - 0.0% 0.0% 0.0%Paint - 0.0% 0.0% 0.0%Other Hazardous - 0.0% 0.0% 0.0% Totals 4,177 100%Fines/Mixed Residue - 0.0% 0.0% 0.0% Sample Count 81
Confidence intervals calculated at a 90% confidence level. Table 34. Composition of Self-Haul Loads, Milford Transfer Station
Material Est. Tons Mean +/-
Stnd.
Dev. Material Mean Est. Tons +/-
Stnd.
Dev.
Paper 89 3.4% C&D 33.6% 887 OCC/Kraft 85 3.2% 2.4% 1.5% Concrete/Brick/Rock 0.0% - 0.0% 0.0%R/C and Other Paper 3 0.1% 0.2% 0.1% Asphalt Paving 0.0% - 0.0% 0.0%
Asphalt Roofing 2.4% 63 3.6% 2.2%Plastic 98 3.7% Wood Roofing 0.0% - 0.0% 0.0%
HDPE Buckets - 0.0% 0.0% 0.0% Ceiling Tiles 0.0% - 0.0% 0.0%Clean Recoverable Film 2 0.1% 0.1% 0.1% Vinyl Siding 0.3% 9 0.4% 0.2%Foamed Insulation - 0.0% 0.0% 0.0% Pallets and Crates 0.7% 19 1.2% 0.7%R/C and Other Plastic 96 3.6% 2.8% 1.7% Clean Lumber 8.6% 228 6.7% 4.1%
Plywood 4.7% 125 2.8% 1.7%Glass - 0.0% Other Engineered Wood 2.6% 68 2.7% 1.6%
R/C and Other Glass - 0.0% 0.0% 0.0% Wood Furniture 1.7% 44 1.3% 0.8%Painted/Stained Wood 3.0% 79 2.8% 1.7%
Organic 101 3.8% Treated Wood 1.1% 29 1.7% 1.1%Yard Waste 52 2.0% 2.5% 1.5% Clean Gypsum Board 0.0% - 0.0% 0.0%Carpet 43 1.6% 1.8% 1.1% Painted/Papered Gypsum Board 2.6% 69 4.3% 2.6%Carpet Padding 6 0.2% 0.4% 0.2% Dirt, Sand, and Gravel 0.0% - 0.0% 0.0%R/C and Other Organics - 0.0% 0.0% 0.0% Fiberglass Insulation 0.0% - 0.0% 0.0%
R/C and Other C&D 5.8% 153 4.0% 2.4%Metal 71 2.7%
HVAC Ducting - 0.0% 0.0% 0.0% MSW 37.9% 1,001 Wire Sheathing - 0.0% 0.0% 0.0% Mixed MSW 37.9% 1,001 11.8% 7.1%Other Ferrous 71 2.7% 2.7% 1.6%Non-Ferrous - 0.0% 0.0% 0.0%
Special 395 15.0%Appliances 48 1.8% 2.1% 1.3%
Electronics 9 0.3% 0.6% 0.3%Items with CRTs 46 1.7% 2.9% 1.7%Bulky Items 292 11.1% 5.5% 3.4%Tires - 0.0% 0.0% 0.0%Lead acid batteries - 0.0% 0.0% 0.0%Vehicle Fluids - 0.0% 0.0% 0.0%Paint - 0.0% 0.0% 0.0%Other Hazardous - 0.0% 0.0% 0.0% Totals 100% 2,643 Fines/Mixed Residue - 0.0% 0.0% 0.0% Sample Count 43
Confidence intervals calculated at a 90% confidence level.

Delaware Solid Waste Authority | Statewide Waste Characterization Study
| 29
Table 35. Composition of Self-Haul Loads, Route 5 Transfer Station
Material Est. Tons Mean +/-
Stnd.
Dev. Material Est. Tons Mean +/-
Stnd.
Dev.
Paper 127 2.8% C&D 1,967 43.9%OCC/Kraft 115 2.6% 2.4% 1.4% Concrete/Brick/Rock 116 2.6% 3.0% 1.9%R/C and Other Paper 12 0.3% 0.5% 0.3% Asphalt Paving - 0.0% 0.0% 0.0%
Asphalt Roofing 246 5.5% 6.6% 4.0%Plastic 173 3.9% Wood Roofing - 0.0% 0.0% 0.0%
HDPE Buckets 86 1.9% 1.6% 1.0% Ceiling Tiles 70 1.6% 2.5% 1.5%Clean Recoverable Film 21 0.5% 0.8% 0.5% Vinyl Siding 55 1.2% 1.7% 1.0%Foamed Insulation 11 0.2% 0.4% 0.2% Pallets and Crates - 0.0% 0.0% 0.0%R/C and Other Plastic 55 1.2% 1.2% 0.7% Clean Lumber 582 13.0% 6.8% 4.1%
Plywood 36 0.8% 0.9% 0.6%Glass 260 5.8% Other Engineered Wood 116 2.6% 2.8% 1.7%
R/C and Other Glass 260 5.8% 9.2% 5.6% Wood Furniture 24 0.5% 0.7% 0.4%Painted/Stained Wood 379 8.5% 11.0% 6.7%
Organic 236 5.3% Treated Wood 20 0.4% 0.7% 0.4%Yard Waste 27 0.6% 1.0% 0.6% Clean Gypsum Board 120 2.7% 3.4% 2.0%Carpet 157 3.5% 3.7% 2.2% Painted/Papered Gypsum Board - 0.0% 0.0% 0.0%Carpet Padding 7 0.2% 0.3% 0.2% Dirt, Sand, and Gravel - 0.0% 0.0% 0.0%R/C and Other Organics 44 1.0% 1.6% 1.0% Fiberglass Insulation 2 0.0% 0.1% 0.0%
R/C and Other C&D 200 4.5% 2.7% 1.7%Metal 105 2.3%
HVAC Ducting - 0.0% 0.0% 0.0% MSW 1,007 22.5%Wire Sheathing - 0.0% 0.0% 0.0% Mixed MSW 1,007 22.5% 9.5% 5.8%Other Ferrous 105 2.3% 1.7% 1.1%Non-Ferrous - 0.0% 0.0% 0.0%
Special 608 13.6%Appliances - 0.0% 0.0% 0.0%
Electronics 177 4.0% 3.0% 1.9%Items with CRTs - 0.0% 0.0% 0.0%Bulky Items 430 9.6% 5.9% 3.6%Tires - 0.0% 0.0% 0.0%Lead acid batteries - 0.0% 0.0% 0.0%Vehicle Fluids - 0.0% 0.0% 0.0%Paint - 0.0% 0.0% 0.0%Other Hazardous - 0.0% 0.0% 0.0% Totals 4,484 100%Fines/Mixed Residue - 0.0% 0.0% 0.0% Sample Count 40
Confidence intervals calculated at a 90% confidence level. Table 36. Composition of Self-Haul Loads, Jones Crossroads Landfill4
Material Est. Tons Mean +/-
Stnd.
Dev. Material Est. Tons Mean +/-
Stnd.
Dev.
Paper 216 1.8% C&D 8,997 73.4%OCC/Kraft 216 1.8% 1.8% 1.1% Concrete/Brick/Rock 176 1.4% 1.5% 0.9%R/C and Other Paper - 0.0% 0.0% 0.0% Asphalt Paving - 0.0% 0.0% 0.0%
Asphalt Roofing 3,077 25.1% 25.9% 15.7%Plastic 88 0.7% Wood Roofing - 0.0% 0.0% 0.0%
HDPE Buckets - 0.0% 0.0% 0.0% Ceiling Tiles 26 0.2% 0.4% 0.2%Clean Recoverable Film 40 0.3% 0.3% 0.2% Vinyl Siding 5 0.0% 0.1% 0.0%Foamed Insulation - 0.0% 0.0% 0.0% Pallets and Crates 270 2.2% 2.0% 1.2%R/C and Other Plastic 47 0.4% 0.5% 0.3% Clean Lumber 949 7.7% 4.7% 2.9%
Plywood 787 6.4% 4.3% 2.6%Glass 283 2.3% Other Engineered Wood 500 4.1% 3.2% 1.9%
R/C and Other Glass 283 2.3% 3.7% 2.3% Wood Furniture 393 3.2% 2.5% 1.5%Painted/Stained Wood 319 2.6% 2.3% 1.4%
Organic 299 2.4% Treated Wood 440 3.6% 3.8% 2.3%Yard Waste 59 0.5% 0.8% 0.5% Clean Gypsum Board 689 5.6% 6.2% 3.8%Carpet 209 1.7% 1.9% 1.1% Painted/Papered Gypsum Board 42 0.3% 0.6% 0.4%Carpet Padding 31 0.3% 0.4% 0.2% Dirt, Sand, and Gravel - 0.0% 0.0% 0.0%R/C and Other Organics - 0.0% 0.0% 0.0% Fiberglass Insulation 16 0.1% 0.2% 0.1%
R/C and Other C&D 1,310 10.7% 7.6% 4.6%Metal 73 0.6%
HVAC Ducting 6 0.0% 0.1% 0.0% MSW 985 8.0%Wire Sheathing - 0.0% 0.0% 0.0% Mixed MSW 985 8.0% 4.9% 3.0%Other Ferrous 22 0.2% 0.3% 0.2%Non-Ferrous 46 0.4% 0.6% 0.4%
Special 1,323 10.8%Appliances 40 0.3% 0.4% 0.2%
Electronics 185 1.5% 1.3% 0.8%Items with CRTs 57 0.5% 0.6% 0.3%Bulky Items 762 6.2% 4.8% 2.9%Tires 112 0.9% 1.5% 0.9%Lead acid batteries - 0.0% 0.0% 0.0%Vehicle Fluids - 0.0% 0.0% 0.0%Paint - 0.0% 0.0% 0.0%Other Hazardous - 0.0% 0.0% 0.0% Totals 12,264 100%Fines/Mixed Residue 167 1.4% 1.9% 1.2% Sample Count 35
Confidence intervals calculated at a 90% confidence level.
4 Note that unlike Cherry Island and Sandtown, Self-Haul loads delivered to the small load landfill face are excluded
because this material was analyzed in detail in an earlier report. We may have to revisit this tonnage data.

Delaware Solid Waste Authority | Statewide Waste Characterization Study
| 30
Targeted Generator Loads
The Project Team also hand sorted loads from targeted commercial generators. Tables 37 through 43 present the results of the two season hand sorts of these loads. Note that in this case percentages by material type are presented but not tonnages since data are not available on total tons by each of these targeted generator types. Table 37. Composition of Small Retail MSW
Material Mean +/-
Stnd.
Dev. Material Mean +/-
Stnd.
Dev.
Paper 34.5% Metal 2.2%Newspaper and Inserts 1.3% 1.3% 0.8% Tin/Steel Containers 0.7% 0.4% 0.2%Corrugated Cardboard/Kraft Paper 16.6% 5.2% 3.2% Other Ferrous 0.3% 0.2% 0.1%High Grade Office Paper 0.9% 0.7% 0.4% Aluminum Beverage & Cat Food Containers 0.2% 0.0% 0.0%Mixed Recyclable Paper 4.6% 2.4% 1.5% Other Aluminum 0.1% 0.1% 0.1%Compostable Paper 6.0% 1.9% 1.2% Other Non-Ferrous 0.9% 0.6% 0.4%Aseptic Boxes and Gable Top Cartons 0.1% 0.0% 0.0%Remainder/Composite Paper 5.0% 4.0% 2.4% Glass 6.4%
Glass Bottles and Jars 5.9% 5.1% 3.1%Plastic 11.0% Remainder/Composite Glass 0.5% 0.4% 0.2%
PET #1 Bottles, Jars, or Containers 0.7% 0.2% 0.1%HDPE #2 Natural and Colored Bottles 0.6% 0.4% 0.2% C&D 12.1%Rigid HDPE #2 Containers 0.0% 0.0% 0.0% Pallets/Crates 1.8% 1.9% 1.1%#3 to #7 Bottles or Jars 0.0% 0.0% 0.0% Clean Lumber 1.8% 1.8% 1.1%Injection Molded Tubs #2, #4, #5, #6, & #7 0.1% 0.1% 0.0% Painted and Stained Wood 0.9% 1.3% 0.8%All Other Rigid Plastic Packaging 0.1% 0.1% 0.1% Other Engineered Wood 3.1% 2.2% 1.3%White Expanded Polystyrene (Styrofoam) 1.3% 0.9% 0.5% Wood Furniture 1.2% 2.0% 1.2%Recoverable Film 1.5% 1.0% 0.6% Other Wood 0.5% 0.6% 0.4%All Other Film 4.4% 1.0% 0.6% Asphalt Roofing 0.0% 0.0% 0.0%Agricultural Film & Marine Shrink Wrap 0.0% 0.0% 0.0% Asphalt, Brick, Concrete, and Rocks 0.8% 1.1% 0.6%Large Plastic Items 0.3% 0.6% 0.3% Drywall/Gypsum Board 0.0% 0.0% 0.0%Remainder/Composite Plastic 1.8% 0.8% 0.5% Remainder/Composite C&D 2.1% 1.7% 1.1%
Organic 32.3% Other 1.5%Vegetative Food Waste, Unpackaged 13.6% 7.4% 4.5% Tires 0.0% 0.0% 0.0%Protein Food Waste, Unpackaged 2.0% 1.2% 0.8% Small Appliances 0.3% 0.3% 0.2%Food Waste in Plastic Packaging 3.7% 2.4% 1.5% Large Electronics 0.0% 0.0% 0.0%
Food Waste in Other Packaging 0.7% 0.3% 0.2% Other Small Consumer Electronics 0.0% 0.0% 0.0%Leaves, Grass, and Brush 0.4% 0.4% 0.3% Items with CRTs 0.0% 0.0% 0.0%Branches and Stumps 0.1% 0.2% 0.1% Other Larger Electronics 0.4% 0.7% 0.4%Textiles 2.2% 1.8% 1.1% Other Haz. or Household Haz. Waste (HHW) 0.1% 0.1% 0.1%Rubber/Leather 1.1% 1.0% 0.6% All Other Wastes 0.6% 0.4% 0.2%Diapers and Sanitary Products 0.6% 0.4% 0.3%Carpet and Carpet Padding 0.7% 1.2% 0.7% Totals 100%Remainder/Composite Organic 7.2% 4.3% 2.6% Sample Count 12
Confidence intervals calculated at a 90% confidence level.

Delaware Solid Waste Authority | Statewide Waste Characterization Study
| 31
Table 38. Composition of Large Retail MSW
Material Mean +/-
Stnd.
Dev. Material Mean +/-
Stnd.
Dev.
Paper 56.5% Metal 1.5%Newspaper and Inserts 0.3% 0.3% 0.2% Tin/Steel Containers 0.0% 0.0% 0.0%Corrugated Cardboard/Kraft Paper 43.6% 19.9% 12.1% Other Ferrous 1.1% 1.2% 0.7%High Grade Office Paper 0.3% 0.2% 0.1% Aluminum Beverage & Cat Food Containers 0.3% 0.2% 0.1%Mixed Recyclable Paper 2.2% 1.5% 0.9% Other Aluminum 0.0% 0.0% 0.0%Compostable Paper 4.7% 2.8% 1.7% Other Non-Ferrous 0.0% 0.1% 0.0%Aseptic Boxes and Gable Top Cartons 0.0% 0.0% 0.0%Remainder/Composite Paper 5.5% 4.4% 2.7% Glass 0.2%
Glass Bottles and Jars 0.2% 0.2% 0.1%Plastic 9.3% Remainder/Composite Glass 0.0% 0.0% 0.0%
PET #1 Bottles, Jars, or Containers 1.1% 0.8% 0.5%HDPE #2 Natural and Colored Bottles 0.1% 0.1% 0.1% C&D 15.7%Rigid HDPE #2 Containers 0.3% 0.4% 0.2% Pallets/Crates 3.2% 3.5% 2.1%#3 to #7 Bottles or Jars 0.0% 0.0% 0.0% Clean Lumber 2.5% 4.1% 2.5%Injection Molded Tubs #2, #4, #5, #6, & #7 0.1% 0.1% 0.1% Painted and Stained Wood 0.0% 0.0% 0.0%All Other Rigid Plastic Packaging 0.0% 0.0% 0.0% Other Engineered Wood 2.4% 3.5% 2.2%White Expanded Polystyrene (Styrofoam) 1.2% 1.8% 1.1% Wood Furniture 6.7% 11.0% 6.7%Recoverable Film 2.0% 1.8% 1.1% Other Wood 0.0% 0.0% 0.0%All Other Film 2.6% 1.4% 0.8% Asphalt Roofing 0.0% 0.0% 0.0%Agricultural Film & Marine Shrink Wrap 0.0% 0.0% 0.0% Asphalt, Brick, Concrete, and Rocks 0.0% 0.0% 0.0%Large Plastic Items 0.6% 1.0% 0.6% Drywall/Gypsum Board 0.0% 0.0% 0.0%Remainder/Composite Plastic 1.3% 1.4% 0.8% Remainder/Composite C&D 1.0% 1.5% 0.9%
Organic 13.9% Other 2.8%Vegetative Food Waste, Unpackaged 0.8% 0.6% 0.3% Tires 0.0% 0.0% 0.0%Protein Food Waste, Unpackaged 0.7% 1.1% 0.7% Small Appliances 0.0% 0.0% 0.0%Food Waste in Plastic Packaging 3.3% 4.7% 2.9% Large Electronics 0.0% 0.0% 0.0%
Food Waste in Other Packaging 2.7% 3.6% 2.2% Other Small Consumer Electronics 0.1% 0.1% 0.1%Leaves, Grass, and Brush 1.8% 3.0% 1.8% Items with CRTs 0.0% 0.0% 0.0%Branches and Stumps 0.0% 0.0% 0.0% Other Larger Electronics 0.0% 0.0% 0.0%Textiles 2.4% 2.3% 1.4% Other Haz. or Household Haz. Waste (HHW) 0.0% 0.0% 0.0%Rubber/Leather 0.1% 0.1% 0.0% All Other Wastes 2.7% 2.9% 1.7%Diapers and Sanitary Products 0.1% 0.1% 0.1%Carpet and Carpet Padding 1.3% 2.1% 1.2% Totals 100%Remainder/Composite Organic 0.7% 0.7% 0.4% Sample Count 9
Confidence intervals calculated at a 90% confidence level.

Delaware Solid Waste Authority | Statewide Waste Characterization Study
| 32
Table 39. Composition of Office MSW
Material Mean +/-
Stnd.
Dev. Material Mean +/-
Stnd.
Dev.
Paper 50.7% Metal 4.9%Newspaper and Inserts 2.7% 1.7% 1.0% Tin/Steel Containers 0.5% 0.4% 0.3%Corrugated Cardboard/Kraft Paper 6.2% 3.9% 2.4% Other Ferrous 0.9% 1.1% 0.7%High Grade Office Paper 6.1% 3.4% 2.1% Aluminum Beverage & Cat Food Containers 0.6% 0.3% 0.2%Mixed Recyclable Paper 4.2% 2.2% 1.4% Other Aluminum 0.3% 0.3% 0.2%Compostable Paper 13.1% 7.0% 4.2% Other Non-Ferrous 2.6% 3.5% 2.1%Aseptic Boxes and Gable Top Cartons 0.1% 0.0% 0.0%Remainder/Composite Paper 18.2% 8.0% 4.8% Glass 3.5%
Glass Bottles and Jars 3.5% 2.5% 1.5%Plastic 14.9% Remainder/Composite Glass 0.0% 0.0% 0.0%
PET #1 Bottles, Jars, or Containers 2.5% 1.0% 0.6%HDPE #2 Natural and Colored Bottles 0.4% 0.1% 0.1% C&D 7.6%Rigid HDPE #2 Containers 0.0% 0.0% 0.0% Pallets/Crates 3.1% 2.9% 1.8%#3 to #7 Bottles or Jars 0.1% 0.1% 0.0% Clean Lumber 0.0% 0.0% 0.0%Injection Molded Tubs #2, #4, #5, #6, & #7 0.4% 0.2% 0.1% Painted and Stained Wood 0.0% 0.0% 0.0%All Other Rigid Plastic Packaging 0.2% 0.2% 0.1% Other Engineered Wood 0.0% 0.0% 0.0%White Expanded Polystyrene (Styrofoam) 0.7% 0.6% 0.4% Wood Furniture 3.0% 3.4% 2.1%Recoverable Film 0.6% 0.3% 0.2% Other Wood 0.0% 0.0% 0.0%All Other Film 5.7% 1.8% 1.1% Asphalt Roofing 0.0% 0.0% 0.0%Agricultural Film & Marine Shrink Wrap 0.0% 0.0% 0.0% Asphalt, Brick, Concrete, and Rocks 1.4% 1.3% 0.8%Large Plastic Items 0.0% 0.0% 0.0% Drywall/Gypsum Board 0.0% 0.0% 0.0%Remainder/Composite Plastic 4.5% 1.5% 0.9% Remainder/Composite C&D 0.1% 0.2% 0.1%
Organic 14.3% Other 4.0%Vegetative Food Waste, Unpackaged 4.8% 1.2% 0.7% Tires 0.0% 0.0% 0.0%Protein Food Waste, Unpackaged 2.0% 1.0% 0.6% Small Appliances 0.0% 0.0% 0.0%Food Waste in Plastic Packaging 3.6% 1.6% 1.0% Large Electronics 3.2% 3.4% 2.1%
Food Waste in Other Packaging 0.8% 0.5% 0.3% Other Small Consumer Electronics 0.5% 0.5% 0.3%Leaves, Grass, and Brush 1.0% 1.6% 0.9% Items with CRTs 0.0% 0.0% 0.0%Branches and Stumps 0.0% 0.0% 0.0% Other Larger Electronics 0.0% 0.0% 0.0%Textiles 0.1% 0.1% 0.1% Other Haz. or Household Haz. Waste (HHW) 0.1% 0.1% 0.1%Rubber/Leather 0.2% 0.1% 0.1% All Other Wastes 0.2% 0.2% 0.1%Diapers and Sanitary Products 0.1% 0.2% 0.1%Carpet and Carpet Padding 0.0% 0.0% 0.0% Totals 100%Remainder/Composite Organic 1.6% 1.0% 0.6% Sample Count 8
Confidence intervals calculated at a 90% confidence level.

Delaware Solid Waste Authority | Statewide Waste Characterization Study
| 33
Table 40. Composition of Restaurant MSW
Material Mean +/-
Stnd.
Dev. Material Mean +/-
Stnd.
Dev.
Paper 25.7% Metal 2.1%Newspaper and Inserts 0.1% 0.1% 0.1% Tin/Steel Containers 1.3% 0.5% 0.3%Corrugated Cardboard/Kraft Paper 12.2% 4.5% 2.7% Other Ferrous 0.1% 0.1% 0.0%High Grade Office Paper 1.1% 1.0% 0.6% Aluminum Beverage & Cat Food Containers 0.1% 0.1% 0.0%Mixed Recyclable Paper 0.7% 0.3% 0.2% Other Aluminum 0.6% 0.5% 0.3%Compostable Paper 10.8% 1.7% 1.0% Other Non-Ferrous 0.0% 0.0% 0.0%Aseptic Boxes and Gable Top Cartons 0.3% 0.2% 0.1%Remainder/Composite Paper 0.5% 0.6% 0.4% Glass 5.3%
Glass Bottles and Jars 5.3% 3.0% 1.8%Plastic 12.1% Remainder/Composite Glass 0.0% 0.0% 0.0%
PET #1 Bottles, Jars, or Containers 0.6% 0.2% 0.1%HDPE #2 Natural and Colored Bottles 1.0% 0.2% 0.1% C&D 0.5%Rigid HDPE #2 Containers 0.0% 0.0% 0.0% Pallets/Crates 0.0% 0.0% 0.0%#3 to #7 Bottles or Jars 0.0% 0.0% 0.0% Clean Lumber 0.0% 0.0% 0.0%Injection Molded Tubs #2, #4, #5, #6, & #7 0.3% 0.2% 0.1% Painted and Stained Wood 0.3% 0.4% 0.3%All Other Rigid Plastic Packaging 0.0% 0.0% 0.0% Other Engineered Wood 0.1% 0.1% 0.1%White Expanded Polystyrene (Styrofoam) 0.3% 0.1% 0.1% Wood Furniture 0.0% 0.0% 0.0%Recoverable Film 0.2% 0.1% 0.1% Other Wood 0.1% 0.1% 0.1%All Other Film 7.3% 1.2% 0.7% Asphalt Roofing 0.0% 0.0% 0.0%Agricultural Film & Marine Shrink Wrap 0.0% 0.0% 0.0% Asphalt, Brick, Concrete, and Rocks 0.0% 0.0% 0.0%Large Plastic Items 0.2% 0.3% 0.2% Drywall/Gypsum Board 0.0% 0.0% 0.0%Remainder/Composite Plastic 2.0% 0.5% 0.3% Remainder/Composite C&D 0.0% 0.1% 0.0%
Organic 54.2% Other 0.1%Vegetative Food Waste, Unpackaged 28.3% 5.6% 3.4% Tires 0.0% 0.0% 0.0%Protein Food Waste, Unpackaged 13.3% 5.3% 3.2% Small Appliances 0.0% 0.0% 0.0%Food Waste in Plastic Packaging 5.1% 2.0% 1.2% Large Electronics 0.0% 0.0% 0.0%
Food Waste in Other Packaging 1.9% 1.5% 0.9% Other Small Consumer Electronics 0.0% 0.0% 0.0%Leaves, Grass, and Brush 0.6% 0.5% 0.3% Items with CRTs 0.0% 0.0% 0.0%Branches and Stumps 0.0% 0.0% 0.0% Other Larger Electronics 0.0% 0.0% 0.0%Textiles 0.6% 0.2% 0.1% Other Haz. or Household Haz. Waste (HHW) 0.0% 0.0% 0.0%Rubber/Leather 0.7% 0.3% 0.2% All Other Wastes 0.1% 0.1% 0.1%Diapers and Sanitary Products 0.1% 0.1% 0.1%Carpet and Carpet Padding 1.4% 1.5% 0.9% Totals 100%Remainder/Composite Organic 2.2% 1.0% 0.6% Sample Count 16
Confidence intervals calculated at a 90% confidence level.
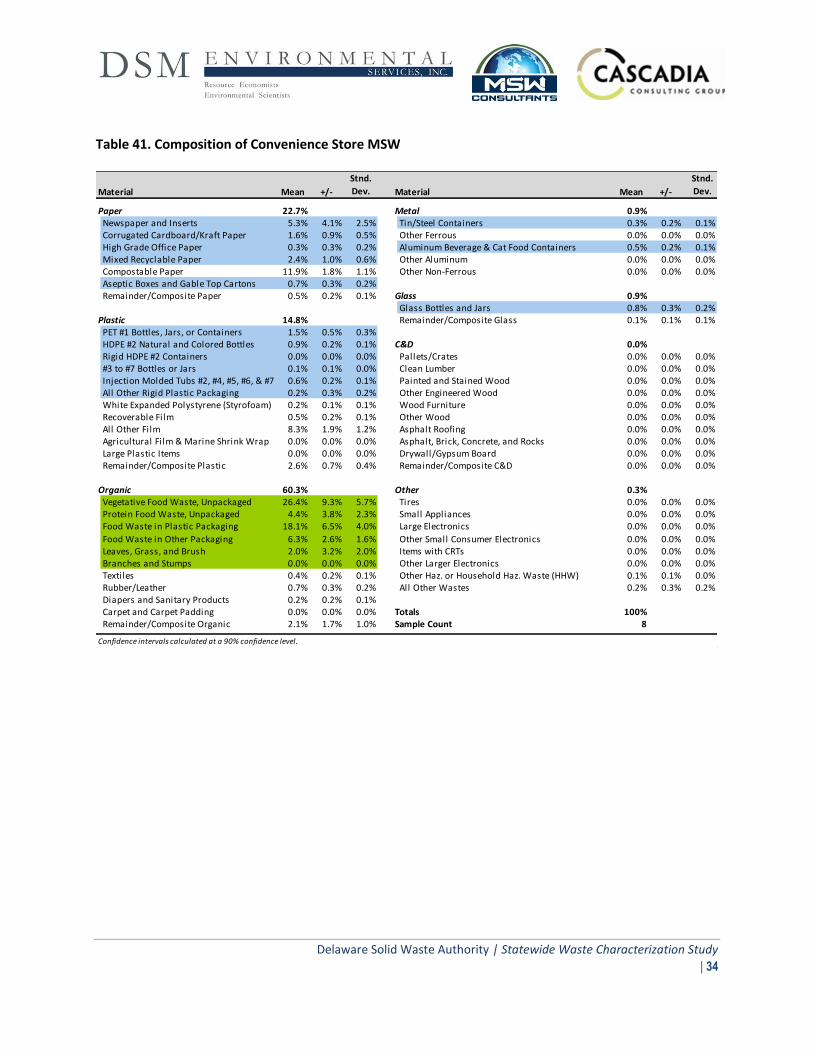
Delaware Solid Waste Authority | Statewide Waste Characterization Study
| 34
Table 41. Composition of Convenience Store MSW
Material Mean +/-
Stnd.
Dev. Material Mean +/-
Stnd.
Dev.
Paper 22.7% Metal 0.9%Newspaper and Inserts 5.3% 4.1% 2.5% Tin/Steel Containers 0.3% 0.2% 0.1%Corrugated Cardboard/Kraft Paper 1.6% 0.9% 0.5% Other Ferrous 0.0% 0.0% 0.0%High Grade Office Paper 0.3% 0.3% 0.2% Aluminum Beverage & Cat Food Containers 0.5% 0.2% 0.1%Mixed Recyclable Paper 2.4% 1.0% 0.6% Other Aluminum 0.0% 0.0% 0.0%Compostable Paper 11.9% 1.8% 1.1% Other Non-Ferrous 0.0% 0.0% 0.0%Aseptic Boxes and Gable Top Cartons 0.7% 0.3% 0.2%Remainder/Composite Paper 0.5% 0.2% 0.1% Glass 0.9%
Glass Bottles and Jars 0.8% 0.3% 0.2%Plastic 14.8% Remainder/Composite Glass 0.1% 0.1% 0.1%
PET #1 Bottles, Jars, or Containers 1.5% 0.5% 0.3%HDPE #2 Natural and Colored Bottles 0.9% 0.2% 0.1% C&D 0.0%Rigid HDPE #2 Containers 0.0% 0.0% 0.0% Pallets/Crates 0.0% 0.0% 0.0%#3 to #7 Bottles or Jars 0.1% 0.1% 0.0% Clean Lumber 0.0% 0.0% 0.0%Injection Molded Tubs #2, #4, #5, #6, & #7 0.6% 0.2% 0.1% Painted and Stained Wood 0.0% 0.0% 0.0%All Other Rigid Plastic Packaging 0.2% 0.3% 0.2% Other Engineered Wood 0.0% 0.0% 0.0%White Expanded Polystyrene (Styrofoam) 0.2% 0.1% 0.1% Wood Furniture 0.0% 0.0% 0.0%Recoverable Film 0.5% 0.2% 0.1% Other Wood 0.0% 0.0% 0.0%All Other Film 8.3% 1.9% 1.2% Asphalt Roofing 0.0% 0.0% 0.0%Agricultural Film & Marine Shrink Wrap 0.0% 0.0% 0.0% Asphalt, Brick, Concrete, and Rocks 0.0% 0.0% 0.0%Large Plastic Items 0.0% 0.0% 0.0% Drywall/Gypsum Board 0.0% 0.0% 0.0%Remainder/Composite Plastic 2.6% 0.7% 0.4% Remainder/Composite C&D 0.0% 0.0% 0.0%
Organic 60.3% Other 0.3%Vegetative Food Waste, Unpackaged 26.4% 9.3% 5.7% Tires 0.0% 0.0% 0.0%Protein Food Waste, Unpackaged 4.4% 3.8% 2.3% Small Appliances 0.0% 0.0% 0.0%Food Waste in Plastic Packaging 18.1% 6.5% 4.0% Large Electronics 0.0% 0.0% 0.0%
Food Waste in Other Packaging 6.3% 2.6% 1.6% Other Small Consumer Electronics 0.0% 0.0% 0.0%Leaves, Grass, and Brush 2.0% 3.2% 2.0% Items with CRTs 0.0% 0.0% 0.0%Branches and Stumps 0.0% 0.0% 0.0% Other Larger Electronics 0.0% 0.0% 0.0%Textiles 0.4% 0.2% 0.1% Other Haz. or Household Haz. Waste (HHW) 0.1% 0.1% 0.0%Rubber/Leather 0.7% 0.3% 0.2% All Other Wastes 0.2% 0.3% 0.2%Diapers and Sanitary Products 0.2% 0.2% 0.1%Carpet and Carpet Padding 0.0% 0.0% 0.0% Totals 100%Remainder/Composite Organic 2.1% 1.7% 1.0% Sample Count 8
Confidence intervals calculated at a 90% confidence level.

Delaware Solid Waste Authority | Statewide Waste Characterization Study
| 35
Table 42. Composition of Grocery MSW
Material Mean +/-
Stnd.
Dev. Material Mean +/-
Stnd.
Dev.
Paper 38.2% Metal 0.7%Newspaper and Inserts 1.0% 0.8% 0.5% Tin/Steel Containers 0.1% 0.1% 0.1%Corrugated Cardboard/Kraft Paper 19.3% 13.9% 8.4% Other Ferrous 0.3% 0.3% 0.2%High Grade Office Paper 1.7% 2.2% 1.3% Aluminum Beverage & Cat Food Containers 0.1% 0.0% 0.0%Mixed Recyclable Paper 2.6% 3.8% 2.3% Other Aluminum 0.2% 0.2% 0.1%Compostable Paper 6.1% 3.9% 2.4% Other Non-Ferrous 0.0% 0.0% 0.0%Aseptic Boxes and Gable Top Cartons 0.0% 0.0% 0.0%Remainder/Composite Paper 7.3% 9.3% 5.6% Glass 0.3%
Glass Bottles and Jars 0.3% 0.2% 0.1%Plastic 16.7% Remainder/Composite Glass 0.0% 0.1% 0.0%
PET #1 Bottles, Jars, or Containers 0.9% 0.4% 0.3%HDPE #2 Natural and Colored Bottles 1.3% 1.7% 1.0% C&D 11.6%Rigid HDPE #2 Containers 0.3% 0.5% 0.3% Pallets/Crates 3.7% 6.2% 3.7%#3 to #7 Bottles or Jars 0.1% 0.1% 0.1% Clean Lumber 0.0% 0.0% 0.0%Injection Molded Tubs #2, #4, #5, #6, & #7 0.3% 0.4% 0.3% Painted and Stained Wood 0.0% 0.0% 0.0%All Other Rigid Plastic Packaging 0.0% 0.0% 0.0% Other Engineered Wood 0.0% 0.1% 0.0%White Expanded Polystyrene (Styrofoam) 2.1% 1.7% 1.0% Wood Furniture 4.8% 7.9% 4.8%Recoverable Film 0.2% 0.1% 0.1% Other Wood 3.0% 3.9% 2.4%All Other Film 5.9% 3.6% 2.2% Asphalt Roofing 0.0% 0.0% 0.0%Agricultural Film & Marine Shrink Wrap 0.0% 0.0% 0.0% Asphalt, Brick, Concrete, and Rocks 0.0% 0.0% 0.0%Large Plastic Items 0.0% 0.0% 0.0% Drywall/Gypsum Board 0.0% 0.0% 0.0%Remainder/Composite Plastic 5.6% 5.5% 3.3% Remainder/Composite C&D 0.0% 0.0% 0.0%
Organic 31.7% Other 0.9%Vegetative Food Waste, Unpackaged 12.4% 8.3% 5.0% Tires 0.0% 0.0% 0.0%Protein Food Waste, Unpackaged 2.7% 1.9% 1.1% Small Appliances 0.0% 0.0% 0.0%Food Waste in Plastic Packaging 10.6% 4.1% 2.5% Large Electronics 0.0% 0.0% 0.0%
Food Waste in Other Packaging 3.0% 1.7% 1.0% Other Small Consumer Electronics 0.0% 0.0% 0.0%Leaves, Grass, and Brush 1.3% 1.6% 1.0% Items with CRTs 0.0% 0.0% 0.0%Branches and Stumps 0.0% 0.0% 0.0% Other Larger Electronics 0.0% 0.0% 0.0%Textiles 0.2% 0.3% 0.2% Other Haz. or Household Haz. Waste (HHW) 0.3% 0.4% 0.2%Rubber/Leather 0.5% 0.4% 0.2% All Other Wastes 0.6% 0.9% 0.5%Diapers and Sanitary Products 0.0% 0.1% 0.0%Carpet and Carpet Padding 0.0% 0.0% 0.0% Totals 100%Remainder/Composite Organic 1.0% 0.7% 0.4% Sample Count 5
Confidence intervals calculated at a 90% confidence level.

Delaware Solid Waste Authority | Statewide Waste Characterization Study
| 36
IV. ANALYSIS OF RESULTS
The Analysis of Results is divided into two parts. First, the 2015/16 results are compared against the 2006/07 waste characterization to assess the effectiveness of the diversion initiatives implemented subsequent to the last waste characterization. Second, general observations concerning the results of the hand sorts of residential and ICI generators, the targeted generator sorts, and the visual analysis of self-haul waste are outlined.
Change in Tons Disposed
It is important to note, when comparing the 2006/07 and 2015/16 results that there has been a significant decline in overall MSW tons disposed at DSWA facilities. As illustrated in Table 43, below, residential MSW deliveries have declined by 35 percent and ICI MSW tonnage by 31 percent. This obviously impacts the comparison of tons, by material type between the two waste characterization studies. This reduction in deliveries is due to the following factors:
Significant diversion efforts undertaken between 2006/2007 and 2015/16;
The “evolving ton” associated with continuous light-weighting of packaging and significant declines in paper use – especially newspaper; and
General reductions in waste generation by both household and ICI generators. In addition, as discussed in the Introduction to this report, this most recent characterization did not include characterization of C&D wastes, and therefore C&D wastes are not included in the presentation of material types by facility. As a consequence, one cannot compare percentages by material type between the two waste characterizations because the significant reduction in C&D materials in the 2015/16 analysis (due to excluding coded C&D loads from the characterization) increases the percentages (or share of the total) of all other materials that were characterized and are reported on in this study. Therefore, it is necessary to compare tonnages by material type across the two waste characterizations. Table 43 compares tonnages for residential and ICI MSW by facility received during both waste characterizations, and calculates the percentage reduction by facility for both residential and ICI waste for use in the comparison5.
5 Note that it was necessary to estimate the amount of Self-Haul tonnage that was residential versus ICI and C&D
for the 2007/08 analysis since that was not reported separately. Four purposes of comparison the percent allocation for 2015/16 was applied to Self-Haul tonnages by facility for 2007/08.

Delaware Solid Waste Authority | Statewide Waste Characterization Study
| 37
Table 43. Comparison of 2006/07 Tonnages by Facility to 2015/16
Facility
Res ICI Res ICI Res ICI
(tons) (tons) (tons) (tons) (tons) (tons)
Sandtown 84,989 44,757 36,516 39,229 57% 12%
Jones Crossroads 57,392 81,909 23,741 31,587 59% 61%
Cherry Island 253,275 232,401 153,927 161,737 39% 30%
Pine Tree 46,044 37,512 39,621 24,514 14% 35%
Milford 21,288 19,367 22,443 14,823 -5% 23%
Route 5 28,698 26,052 43,910 34,866 -53% -34%
Total 491,686 441,997 320,159 306,755 35% 31%
Total MSW FY 08 Total MSW FY 16 Percent Reduction
Success of Recent Diversion Efforts
Subsequent to the 2006/07 Waste Characterization analysis the State of Delaware enacted bans on disposal of yard waste, and implemented the Universal Recycling law (which included repeal of the deposit on glass and PET carbonated beverage containers). Both of these measures were meant to divert material from DSWA landfills to more productive uses. Tables 44 and 45 illustrate the results of these two measures on single stream recyclable materials and on yard waste disposal from the residential and ICI sectors, respectively. Table 44. Comparison of Residential Single Stream and Yard Waste Materials Disposed at DSWA Facilities, 2006/07 and 2015/16 Material 2006/07 2015/16 % Reduction
(tons) (tons)
Total Paper 90,822 33,066 64%
Newspaper and Inserts 22,578 5,922 74%
Corrugated Cardboard/Kraft Paper 28,581 11,560 60%
High Grade Office Paper 8,057 1,992 75%
Mixed Recyclable Paper 31606 13,147 58%
Aseptic Boxes and Gable Top Cartons 445
Total Plastic 8,705 5,189 40%
PET #1 Bottles, Jars, or Containers 5,890 5,467 7%
HDPE #2 Natural and Colored Bottles 4,510 3,243 28%
Rigid HDPE #2 Containers 332
#3 to #7 Bottles or Jars 756 372 51%
Injection Molded Tubs #2, #4, #5, #6, & #7 1,125 736 35%
All Other Rigid Plastic Packaging 2,314 505 78%
Total Metal Food & Beverage Containers 7,610 5,095 33%
Tin/Steel Containers 4,483 3,554 21%
Aluminum Beverage & Cat Food Containers 3,127 1,541 51%
Total Glass Containers 12,025 9,015 25%
Glass Bottles and Jars 12,025 9,015 25%
Total Single Stream Material 119,162 52,365 56%
Total Yard Waste 62,339 15,764 75%
Leaves, Grass, and Brush 60,807 14,709 76%
Branches and Stumps 1,532 1,056 31%

Delaware Solid Waste Authority | Statewide Waste Characterization Study
| 38
As illustrated by Table 44, total residential single stream material delivered to DSWA facilities has fallen by 56 percent between 2006/07 and 2015/16, and total yard waste by 75 percent. This decline occurred during an increase of 8.7 percent in total population of Delaware during this same time period. Calculated on a per capita disposal basis, single stream material disposed at DSWA facilities fell from 276 pounds per capita to 132 pounds per capita, or (roughly) from 726 pounds per household to 347 pounds per household. Similarly for yard waste, households have reduced the disposal of yard waste at DSWA facilities from 144 pounds per household to 33 pounds per household from 2007/08 to 2015/16. Based on DSM’s work in many other states, these declines represent very significant improvements in diversion and are likely to represent very high materials recovery rates. Table 45. Comparison of ICI Single Stream and Yard Waste Materials Disposed at DSWA Facilities, 2007/08 and 2015/16 Material 2006/07 2015/16 % Reduction
(tons) (tons)
Total Paper 99,137 44,139 55%
Newspaper and Inserts 8,952 4,395 51%
Corrugated Cardboard/Kraft Paper 61,222 25,347 59%
High Grade Office Paper 9,956 3,816 62%
Mixed Recyclable Paper 19,007 9,584 50%
Aseptic Boxes and Gable Top Cartons 996
Total Plastic 9,540 9,117 4%
PET #1 Bottles, Jars, or Containers 3,748 5,525 -47%
HDPE #2 Natural and Colored Bottles 2,435 2,109 13%
Rigid HDPE #2 Containers 178
#3 to #7 Bottles or Jars 270 150 44%
Injection Molded Tubs #2, #4, #5, #6, & #7 951 991 -4%
All Other Rigid Plastic Packaging 2,136 163 92%
Total Metal Food and Beverage Containers 4,986 2,958 41%
Tin/Steel Containers 3,737 1,779 52%
Aluminum Beverage & Cat Food Containers 1,249 1,179 6%
Total Glass Containers 6,163 4,421 28%
Glass Bottles and Jars 6,163 4,421 28%
Total Single Stream Material 119,826 60,635 49%
Total Yard Waste 8,053 11,806 -47%
Leaves, Grass, and Brush 7,855 10,981 -40%
Branches and Stumps 198 825 -317% As illustrated by Table 45, there has been a significant reduction in single stream material disposed at DSWA facilities from ICI generators. While there appears to be room for continued improvement, it should be recognized that ICI generators have been recycling large quantities of homogeneous materials

Delaware Solid Waste Authority | Statewide Waste Characterization Study
| 39
for a much longer time then residential generators, so recovery rates are typically more stable, and require sustained efforts to achieve relatively marginal increases. However, the ban on yard waste does not appear to have had much impact on disposal of yard waste from ICI generators.
Organic Waste Diversion
Tables 46 and 47 compare residential and ICI organic waste disposal from 2006/07 and 2015/16. Table 46. Disposal of Residential Organic Waste, 2006/07 and 2015/16 Organic 2006/07 2015/16 % ReductionFood Waste 50,516 64,913 -28%
Vegetative Food Waste, Unpackaged 24,342 Protein Food Waste, Unpackaged 11,184 Food Waste in Plastic Packaging 25,411 Food Waste in Other Packaging 3,976 Leaves, Grass, and Brush 60,807 14,709 76%Branches and Stumps 1,532 1,056 31%Compostable Paper 29,799 30,867 -4%
Total Organic Waste 112,855 80,677 29% As illustrated by Table 46, disposal of Residential Food Waste has increased by 28 percent since 2006/07, which is greater than the increase in population. As a result, annual per capita and per household food waste has also increased, from 117 to 137 pounds per capita, and from 308 to 361 pounds per household per year. While data are not available from the 2006/07 waste characterization, in 2015/16, approximately 55 percent of the food waste was uncontaminated by packaging (or 45 percent of food waste was contaminated by packaging) suggesting that any effort to divert significant amounts of food waste would require investment in de-packaging equipment. Table 47. Disposal of ICI Organic Waste, 2006/07 and 2015/16 Organic 2006/07 2015/16 % ReductionFood Waste 53,970 67,087 -24%
Vegetative Food Waste, Unpackaged 33,362 Protein Food Waste, Unpackaged 9,941 Food Waste in Plastic Packaging 18,339 Food Waste in Other Packaging 5,446 Leaves, Grass, and Brush 7,855 10,981 -40%Branches and Stumps 198 825 -317%Compostable Paper 32,167 30,867 4%
Total Organic Waste 94,190 109,760 -17% As illustrated by Table 47, as with Residential Organics, ICI Organics disposal has increased between 2006/07 and 2015/16, even as total deliveries of waste to DSWA landfills has fallen. And, similar to residential waste, the amount of uncontaminated food waste represents only about 60 percent of the ICI food waste.

Delaware Solid Waste Authority | Statewide Waste Characterization Study
| 40
General Observations
Per Capita and Per Household Disposal
There has been a relatively significant decline in total MSW disposal at DSWA landfills and transfer stations between 2007/08 and 2015/16. It is interesting to convert this decline into per capita and per household disposal, both overall and for residential waste only. Extrapolating from 2000, 2010, and 2015 census data it is estimated that the population of Delaware in 2007 was roughly 863,500 with approximately 328,300 (rounded, at 2.63 persons/household) households. This had increased to a population of 945,900 (rounded) by 2015 with 360,000 households. However, during this period of time total residential and ICI waste disposal has declined by 35 and 31 percent respectively. It is interesting to put this in perspective by dividing total, residential and ICI waste by population and households in both time periods to calculate a per capita and per household disposal rate, as illustrated in Table 48. Table 48. Comparison of Pounds Per Capita Per Year and Annual Per Household Disposal Rates, 2006/07 and 2015/16
2007/08 Unit Per Capita Per HH
Population 863,500
Households 328,327
Total MSW (tons) 933,683 2,163 5,688
Residential Tons 491,686 1,139 2,995
ICI Tons 441,997 1,024 2,692
2015/16
Population 945,934
Households 359,677
Total MSW (tons) 626,914 1,325 3,486
Residential Tons 320,159 677 1,780
ICI Tons 306,755 649 1,706 As illustrated by Table 48, there has been a significant decline in per capita or per household disposal over the nine years between the two waste characterization studies. As discussed above, this is due to a combination of light-weighting of materials and increased diversion for recycling and yard waste processing.
Comparison with Other Recent Waste Characterizations
The Project Team completed state-wide waste characterization studies in Rhode Island (2014/15) and Connecticut (2015). Table 49 below compares the state-wide results for the three states for all MSW, Residential MSW and ICI MSW. Only the major categories are included, with the exception that food waste has been broken out from all other organics in each case.

Delaware Solid Waste Authority | Statewide Waste Characterization Study
| 41
It should be noted when comparing the results that while the material categories are similar there are some differences in what are included in each major category, which can impact the overall comparison. An attempt has been made to combine categories where necessary to as closely as possible mimic the Delaware categories, but it is not exact. Despite these differences, an analysis of Table 49 illustrates that Delaware’s results are roughly similar to both Rhode Island and Connecticut, with no categories that stand out as an anomaly for Delaware. Table 49. Comparison of State-Wide Results, Delaware, Rhode Island and Connecticut
Material Delaware Rhode Isand Connecticut
All MSW (%) (%) (%) Paper 23.6% 23.9% 23.1% Plastic 14.9% 12.2% 11.8% Food Waste 21.1% 19.0% 22.3% Other Organic 19.1% 14.0% 11.1% Metal 3.1% 3.0% 3.5% Glass 2.6% 2.0% 2.5% C&D 10.5% 9.7% 11.9% Other 5.0% 16.3% 13.7%Residential Paper 21.4% 18.5% 20.0% Plastic 12.9% 11.8% 10.7% Food Waste 20.2% 20.0% 20.0% Other Organic 21.8% 17.5% 14.5% Metal 3.3% 3.1% 2.9% Glass 3.6% 1.6% 2.8% C&D 9.3% 8.7% 12.3% Other 7.5% 18.8% 16.7%ICI Paper 26.0% 31.2% 27.5% Plastic 16.9% 12.6% 13.3% Food Waste 21.9% 17.5% 25.5% Other Organic 16.4% 9.3% 6.3% Metal 2.9% 2.8% 4.4% Glass 1.7% 2.6% 2.1% C&D 11.9% 11.0% 11.3% Other 2.3% 12.9% 9.7%
Comparison of Residential and ICI MSW
As illustrated by Table 49, and by the detailed composition tables on state-wide Residential and ICI MSW, there is still an opportunity to increase paper recycling in general for the ICI sector. The result for Delaware is comparable to both Rhode Island and Connecticut illustrating the difficulty of outreach to the wide variety of commercial generators, and the potential increased cost to at least some of these generators associated with leasing separate containers and contracting for collection for recyclables over and above the cost of a single dumpster for MSW.

Delaware Solid Waste Authority | Statewide Waste Characterization Study
| 42
Multi-Family Residential
Table 50 compares the State-Wide Residential MSW composition against the targeted Multi-Family results. As illustrated by Table 50, while there is a slightly higher percent of paper and containers, the difference is not as significant as one would expect if there were no multi-family recycling. However, it should be noted here that the Project Team did not ride on the truck during collection of the multi-family MSW so we do not know if these buildings are “typical” of multi-family housing in Delaware both in terms of demographics and in terms of access to adequate recycling containers. Table 50. Comparison of Overall Residential MSW and Multi-Family Residential MSW
MaterialResidential
(%)
Multi-Family
(%)
Paper 21.4% 24.0%Plastic 12.9% 13.0%Food Waste 20.2% 21.3%Other Organics 21.8% 15.5%Metal 3.3% 3.2%Glass 3.6% 5.4%C&D 9.3% 6.7%Other 7.5% 11.0%
Targeted Commercial Generators
Table 51, on the next page, compares single stream and organic wastes across the six targeted generator categories. As illustrated by Table 51, there are relatively large quantities of corrugated containers potentially available from small and large retailers and from grocery stores. There is also some additional high grade office paper potentially available from offices. There also appears to be some capacity to increase PET, glass and aluminum container recycling from offices and restaurants. Finally, while one would anticipate that grocery stores would be the largest source of food waste, this was not the case, with restaurants, and surprisingly, convenience stores generating very high quantities of food waste6.
6 It should be noted that the convenience store loads came primarily from one of the largest convenience store
chains in Delaware and may or may not be indicative of other convenience stores in terms of their waste composition.

Delaware Solid Waste Authority | Statewide Waste Characterization Study
| 43
Table 51. Comparison of Single Stream and Organic Materials, Small Retail, Large Retail, Office, Grocery, Restaurant, and Convenience Stores
MaterialSmall
Retail (%)
Large
Retail (%)
Office
(%)
Grocery
(%)
Restauran
t (%)
Convenience
Stores (%)
Paper 23.5% 46.4% 19.4% 24.6% 14.4% 10.3%Newspaper and Inserts 1.3% 0.3% 2.7% 1.0% 0.1% 5.3%Corrugated Cardboard/Kraft Paper 16.6% 43.6% 6.2% 19.3% 12.2% 1.6%High Grade Office Paper 0.9% 0.3% 6.1% 1.7% 1.1% 0.3%Mixed Recyclable Paper 4.6% 2.2% 4.2% 2.6% 0.7% 2.4%Aseptic Boxes and Gable Top Cartons 0.1% 0.0% 0.1% 0.0% 0.3% 0.7%
Plastic 1.5% 1.6% 3.5% 2.9% 2.0% 3.3%PET #1 Bottles, Jars, or Containers 0.7% 1.1% 2.5% 0.9% 0.6% 1.5%HDPE #2 Natural and Colored Bottles 0.6% 0.1% 0.4% 1.3% 1.0% 0.9%Rigid HDPE #2 Containers 0.0% 0.3% 0.0% 0.3% 0.0% 0.0%#3 to #7 Bottles or Jars 0.0% 0.0% 0.1% 0.1% 0.0% 0.1%Injection Molded Tubs #2, #4, #5, #6, & #7 0.1% 0.1% 0.4% 0.3% 0.3% 0.6%All Other Rigid Plastic Packaging 0.1% 0.0% 0.2% 0.0% 0.0% 0.2%
Metal 0.9% 0.3% 1.1% 0.2% 1.4% 0.8%Tin/Steel Containers 0.7% 0.0% 0.5% 0.1% 1.3% 0.3%Aluminum Beverage & Cat Food Containers 0.2% 0.3% 0.6% 0.1% 0.1% 0.5%
Glass 5.9% 0.2% 3.5% 0.3% 5.3% 0.8%Glass Bottles and Jars 5.9% 0.2% 3.5% 0.3% 5.3% 0.8%
Organic 26.6% 14.0% 25.3% 36.1% 60.0% 69.0%Vegetative Food Waste, Unpackaged 13.6% 0.8% 4.8% 12.4% 28.3% 26.4%Protein Food Waste, Unpackaged 2.0% 0.7% 2.0% 2.7% 13.3% 4.4%Food Waste in Plastic Packaging 3.7% 3.3% 3.6% 10.6% 5.1% 18.1%Food Waste in Other Packaging 0.7% 2.7% 0.8% 3.0% 1.9% 6.3%Leaves, Grass, and Brush 0.4% 1.8% 1.0% 1.3% 0.6% 2.0%Branches and Stumps 0.1% 0.0% 0.0% 0.0% 0.0% 0.0%Compostable Paper 6.0% 4.7% 13.1% 6.1% 10.8% 11.9%

Delaware Solid Waste Authority | Statewide Waste Characterization Study
| 44
Appendix A: Material Sort Categories

Delaware Solid Waste Authority | Statewide Waste Characterization Study
| 45
2006 Proposed 2015 Notes
PAPER PAPER
1 Newspaper (incl. Inserts) Newspaper (incl. Inserts) 1
2 Magazines/Catalogs/Glossy
3 OCC (unwaxed)/Kraft OCC/Kraft 2 Both waxed and unwaxed and brown bags
4 Telephone Books
5 High Grade Paper High Grade Paper 3
6 Mixed (Recyclable Paper) (junk mail, molded pulp, paprbd) Mixed (Recyclable Paper) (junk mail, molded pulp, paprbd) 4
Incldes all other recyclable paper categories
separated in the 2006 study including magazines
and telephone bookds
7 Compostable Paper Compostable Paper 5
8 Other (Non-recyclable) Paper (incl R/C) Other (Non-recyclable) Paper (incl R/C) 6
Includes spiral bound note books, composite
papers, label backing, chinese cary out containers
Aeseptic Containers 7
PLASTICS PLASTICS
9 #1 PET Bottles/Jars #1 PET Bottles/Jars 8 Soda and food
10 #2 HDPE Bottles #2 HDPE Natural and Colored Bottles 9
Rigid HDPE containers (less than 5 gallons) 10 #2 Rigid plastic containers
11 #3-#7 Bottles #3-#7 Bottles 11
12 Injection Molded Tubs (primarily #2 and #5) Injection Moulded Tubs (#2,#4,#5,#6,#7) 12 yogurt and butter tubs
13 Clamshell/Thermoform/Press mold Plastic Packaging All other rigid plastic packaging 13 Clamshells, thermoforms, but not EPS clamshells
14 Expanded Polystyrene (includes food svc & pkgng) White Expanded Polystyrene (EPS) 14
Packaging and food service, but not peanuts, white
only
15 Recovarable Film Recovarable Film (clean retail bags, shrink wrap) 15
Excludes retail bags containing wastes, and all film
which is contaminated with dirt, water or other
wastes
16 Other Film All other film 16
Includes all contaminated film and all multi-laminate
pouches and film - such as potatoe chip bags and
candy wrappers
17 Other Rigid Plastic (incl food svc & misc rigids) Ag Film and Marine Shrink Wrap 17 Bale wrap, greenhouse covers, and boat covers
Large Plastic Items (5 gallon buckets and larger) 18
5 gallons and larger, including plastic toys
containing that may contain some metals
All other (R/C) plastic 19 All plastic not fitting into one of the categories above
ORGANIC ORGANIC
18 Food Wastes Vegatative Food Waste, Unpackaged 20
Protein Food Waste, Unpackaged 21
Vegatative and protein food waste in plastic 22 All vegatative and protein in plastic
Vegatative and protein food waste in metal, glass, boxboard 23 All other vegatative and protein in packaging
19 Leaves, Grass, Brush Leaves, Grass, Brush 24
20 Branches and Stumps Branches and Stumps 25
21 Textiles Textiles 26
22 Rubber/Leather Rubber/Leather 27
23 Diapers Diapers 28
24 Carpet/Carpet Padding Carpet/Carpet Padding 29
25 Manure (incl animal wastes)
26 Fines
27 Other Organic (R/C/ Organic) Other Organic (R/C/ Organic) 30
Includes manures, fines, and all other (R/C)
organics
METAL METAL
28 Ferrous/Bimetal Cans (incl empty Aerosols) Ferrous/Bimetal Cans (incl empty Aerosols) 31
29 Other Ferrous Other Ferrous 32
30 Aluminum Cans Aluminum Cans 33
31 Other Aluminum Other Aluminum 34
32 Other Non-Ferrous Other Non-Ferrous 35
GLASS GLASS
33 Clear Bottles/Jars Glass Bottles and Jars 36
34 Green Bottles/jars
35 Brown Bottles/Jars
36 Other Glass (R/C Glass) Other Glass (R/C Glass) 37
WOOD WOOD
37 Pallets/Crates Pallets/Crates 38
38 Clean Lumber Clean Lumber 39
39 Treated and Painted Wood Painted and Stained Wood 40
40 Other Engineered Wood Other Engineered Wood 41 Includes OSB and plywood
41 Plywood
42 Wood Furniture Wood Furniture 42
43 Oriented Strandboard (OSB)
44 Other Wood (R/C Wood) Other Wood (R/C Wood) 43
C&D INERT C&D INERT
45 Asphalt Roofing Material Asphalt Roofing Materials 44
46 Concrete/Brick/Rock Concrete/Brick/Rocks 45
47 Gypsum Board Gypsum Boards 46
48 Ceiling Tiles
49 Dirt/Dust
50 Other Inert (R/C Inert)
51 Other C&D (R/C C&D) Other C&D (R/C C&D)s 47
SPECIAL SPECIAL
52 Tires Tires 48
53 Appliances (large and small) Small Appliances 49 Excludes refrigerators, washers and dryers
54 Electronics (large and small) Large Electronics 50 Over 5 pounds
55 Items with CRTs Small Electronics 51
56 Lead Acid Batteries Items with CRT's 52
57 Other Batteries
58 Automotive (oil/filters/fluids)
59 Other HHW Other HHW 53
All OTHER WASTES All OTHER WASTES
All Other (R/C) Wastes 54

Delaware Solid Waste Authority | Statewide Waste Characterization Study
| 46
Appendix B: Season 2 Hand Sort Tables The following tables present the hand sort data for Season 2 (June 2016), only. These tables can be compared with the Season 1 data presented in the Interim Report, March 2016.
State-Wide
Table B.1. State-Wide Aggregated ICI Hand Sort Data, June 2016
Material Mean +/-
Stnd.
Dev. Material Mean +/-
Stnd.
Dev.
Paper 26.2% Metal 3.2%Newspaper and Inserts 1.8% 1.1% 0.7% Tin/Steel Containers 0.5% 0.2% 0.1%Corrugated Cardboard/Kraft Paper 10.6% 4.1% 2.5% Other Ferrous 2.0% 1.4% 0.8%High Grade Office Paper 1.4% 1.5% 0.9% Aluminum Beverage & Cat Food Containers 0.3% 0.1% 0.1%Mixed Recyclable Paper 2.2% 0.9% 0.5% Other Aluminum 0.2% 0.1% 0.0%Compostable Paper 8.4% 1.7% 1.0% Other Non-Ferrous 0.1% 0.1% 0.1%Aseptic Boxes and Gable Top Cartons 0.6% 0.7% 0.4%Remainder/Composite Paper 1.3% 0.7% 0.4% Glass 2.3%
Glass Bottles and Jars 2.1% 0.9% 0.5%Plastic 20.1% Remainder/Composite Glass 0.2% 0.1% 0.1%
PET #1 Bottles, Jars, or Containers 1.3% 0.4% 0.2%HDPE #2 Natural and Colored Bottles 0.6% 0.1% 0.1% C&D 10.7%Rigid HDPE #2 Containers 0.1% 0.1% 0.0% Pallets/Crates 1.5% 1.1% 0.7%#3 to #7 Bottles or Jars 0.1% 0.1% 0.0% Clean Lumber 1.8% 1.6% 1.0%Injection Molded Tubs #2, #4, #5, #6, & #7 0.3% 0.2% 0.1% Painted and Stained Wood 0.0% 0.1% 0.0%All Other Rigid Plastic Packaging 0.0% 0.0% 0.0% Other Engineered Wood 1.3% 1.7% 1.0%White Expanded Polystyrene (Styrofoam) 1.0% 0.9% 0.5% Wood Furniture 3.1% 2.8% 1.7%Recoverable Film 0.3% 0.2% 0.1% Other Wood 0.2% 0.2% 0.1%All Other Film 7.4% 2.0% 1.2% Asphalt Roofing 0.0% 0.0% 0.0%Agricultural Film & Marine Shrink Wrap 0.1% 0.1% 0.1% Asphalt, Brick, Concrete, and Rocks 2.4% 2.8% 1.7%Large Plastic Items 0.3% 0.3% 0.2% Drywall/Gypsum Board 0.1% 0.1% 0.1%Remainder/Composite Plastic 8.5% 4.9% 3.0% Remainder/Composite C&D 0.2% 0.1% 0.1%
Organic 34.7% Other 2.8%Vegetative Food Waste, Unpackaged 12.6% 3.9% 2.4% Tires 0.0% 0.0% 0.0%Protein Food Waste, Unpackaged 2.6% 1.2% 0.7% Small Appliances 0.0% 0.0% 0.0%Food Waste in Plastic Packaging 5.3% 1.7% 1.0% Large Electronics 0.1% 0.2% 0.1%
Food Waste in Other Packaging 1.7% 1.2% 0.8% Other Small Consumer Electronics 0.1% 0.1% 0.0%Leaves, Grass, and Brush 3.1% 1.8% 1.1% Items with CRTs 0.6% 0.9% 0.6%Branches and Stumps 0.2% 0.3% 0.2% Other Larger Electronics 0.0% 0.0% 0.0%Textiles 3.1% 1.5% 0.9% Other Haz. or Household Haz. Waste (HHW) 0.4% 0.2% 0.1%Rubber/Leather 0.6% 0.2% 0.1% All Other Wastes 1.7% 1.0% 0.6%Diapers and Sanitary Products 1.6% 0.6% 0.4%Carpet and Carpet Padding 1.1% 1.0% 0.6% Totals 100%Remainder/Composite Organic 2.9% 2.7% 1.7% Sample Count 39
Confidence intervals calculated at a 90% confidence level.

Delaware Solid Waste Authority | Statewide Waste Characterization Study
| 47
Table B.2. State-Wide Aggregated Residential Hand Sort Data, June 2016
Material Mean +/-
Stnd.
Dev. Material Mean +/-
Stnd.
Dev.
Paper 18.8% Metal 3.6%Newspaper and Inserts 1.3% 0.3% 0.2% Tin/Steel Containers 1.0% 0.2% 0.1%Corrugated Cardboard/Kraft Paper 2.7% 0.7% 0.4% Other Ferrous 1.2% 0.8% 0.5%High Grade Office Paper 0.6% 0.2% 0.1% Aluminum Beverage & Cat Food Containers 0.5% 0.1% 0.1%Mixed Recyclable Paper 2.2% 0.5% 0.3% Other Aluminum 0.4% 0.1% 0.1%Compostable Paper 10.2% 1.1% 0.7% Other Non-Ferrous 0.4% 0.3% 0.2%Aseptic Boxes and Gable Top Cartons 0.1% 0.1% 0.0%Remainder/Composite Paper 1.7% 0.8% 0.5% Glass 2.8%
Glass Bottles and Jars 2.2% 0.6% 0.3%Plastic 13.6% Remainder/Composite Glass 0.7% 0.5% 0.3%
PET #1 Bottles, Jars, or Containers 1.7% 0.2% 0.1%HDPE #2 Natural and Colored Bottles 1.0% 0.1% 0.1% C&D 6.4%Rigid HDPE #2 Containers 0.2% 0.2% 0.1% Pallets/Crates 0.1% 0.2% 0.1%#3 to #7 Bottles or Jars 0.1% 0.0% 0.0% Clean Lumber 2.6% 1.3% 0.8%Injection Molded Tubs #2, #4, #5, #6, & #7 0.3% 0.0% 0.0% Painted and Stained Wood 0.8% 0.4% 0.3%All Other Rigid Plastic Packaging 0.0% 0.0% 0.0% Other Engineered Wood 1.5% 0.9% 0.5%White Expanded Polystyrene (Styrofoam) 0.5% 0.1% 0.1% Wood Furniture 0.6% 0.6% 0.4%Recoverable Film 0.5% 0.1% 0.1% Other Wood 0.6% 0.3% 0.2%All Other Film 5.5% 0.5% 0.3% Asphalt Roofing 0.0% 0.0% 0.0%Agricultural Film & Marine Shrink Wrap 0.0% 0.0% 0.0% Asphalt, Brick, Concrete, and Rocks 0.0% 0.0% 0.0%Large Plastic Items 0.8% 0.6% 0.4% Drywall/Gypsum Board 0.2% 0.1% 0.1%Remainder/Composite Plastic 3.1% 0.4% 0.3% Remainder/Composite C&D 0.1% 0.1% 0.0%
Organic 46.5% Other 8.2%Vegetative Food Waste, Unpackaged 10.9% 1.8% 1.1% Tires 0.7% 1.0% 0.6%Protein Food Waste, Unpackaged 3.6% 1.1% 0.7% Small Appliances 0.0% 0.0% 0.0%Food Waste in Plastic Packaging 6.6% 1.2% 0.7% Large Electronics 0.7% 0.8% 0.5%
Food Waste in Other Packaging 1.3% 0.4% 0.2% Other Small Consumer Electronics 0.3% 0.1% 0.1%Leaves, Grass, and Brush 5.5% 2.4% 1.5% Items with CRTs 0.5% 0.8% 0.5%Branches and Stumps 1.1% 0.9% 0.5% Other Larger Electronics 0.0% 0.0% 0.0%Textiles 5.4% 1.3% 0.8% Other Haz. or Household Haz. Waste (HHW) 0.5% 0.2% 0.1%Rubber/Leather 1.2% 0.7% 0.4% All Other Wastes 5.5% 2.0% 1.2%Diapers and Sanitary Products 4.4% 0.8% 0.5%Carpet and Carpet Padding 3.5% 2.0% 1.2% Totals 100%Remainder/Composite Organic 3.1% 2.2% 1.3% Sample Count 37
Confidence intervals calculated at a 90% confidence level.

Delaware Solid Waste Authority | Statewide Waste Characterization Study
| 48
Cherry Island
Table B.3. Cherry Island ICI Hand Sort Data, June 2016
Material Mean +/-
Stnd.
Dev. Material Mean +/-
Stnd.
Dev.
Paper 19.9% Metal 3.1%Newspaper and Inserts 1.3% 0.8% 0.5% Tin/Steel Containers 0.8% 0.8% 0.5%Corrugated Cardboard/Kraft Paper 7.9% 3.6% 2.2% Other Ferrous 1.4% 1.6% 1.0%High Grade Office Paper 0.6% 0.7% 0.4% Aluminum Beverage & Cat Food Containers 0.5% 0.3% 0.2%Mixed Recyclable Paper 1.3% 0.4% 0.2% Other Aluminum 0.4% 0.3% 0.2%Compostable Paper 7.7% 2.3% 1.4% Other Non-Ferrous 0.0% 0.0% 0.0%Aseptic Boxes and Gable Top Cartons 0.2% 0.1% 0.1%Remainder/Composite Paper 1.0% 1.2% 0.8% Glass 0.8%
Glass Bottles and Jars 0.3% 0.4% 0.3%Plastic 14.7% Remainder/Composite Glass 0.4% 0.5% 0.3%
PET #1 Bottles, Jars, or Containers 1.4% 0.6% 0.4%HDPE #2 Natural and Colored Bottles 0.8% 0.3% 0.2% C&D 13.4%Rigid HDPE #2 Containers 0.0% 0.0% 0.0% Pallets/Crates 0.0% 0.0% 0.0%#3 to #7 Bottles or Jars 0.0% 0.0% 0.0% Clean Lumber 0.0% 0.0% 0.0%Injection Molded Tubs #2, #4, #5, #6, & #7 0.6% 0.4% 0.2% Painted and Stained Wood 0.3% 0.5% 0.3%All Other Rigid Plastic Packaging 0.0% 0.0% 0.0% Other Engineered Wood 0.1% 0.1% 0.1%White Expanded Polystyrene (Styrofoam) 0.4% 0.3% 0.2% Wood Furniture 0.0% 0.0% 0.0%Recoverable Film 0.1% 0.0% 0.0% Other Wood 0.2% 0.2% 0.1%All Other Film 7.3% 1.9% 1.1% Asphalt Roofing 0.0% 0.0% 0.0%Agricultural Film & Marine Shrink Wrap 0.1% 0.1% 0.1% Asphalt, Brick, Concrete, and Rocks 12.8% 21.1% 12.8%Large Plastic Items 0.5% 0.5% 0.3% Drywall/Gypsum Board 0.0% 0.0% 0.0%Remainder/Composite Plastic 3.6% 1.4% 0.9% Remainder/Composite C&D 0.0% 0.0% 0.0%
Organic 47.6% Other 0.5%Vegetative Food Waste, Unpackaged 18.7% 10.9% 6.6% Tires 0.0% 0.0% 0.0%Protein Food Waste, Unpackaged 4.8% 4.4% 2.7% Small Appliances 0.0% 0.0% 0.0%Food Waste in Plastic Packaging 7.6% 3.3% 2.0% Large Electronics 0.0% 0.0% 0.0%
Food Waste in Other Packaging 1.5% 1.9% 1.2% Other Small Consumer Electronics 0.0% 0.0% 0.0%Leaves, Grass, and Brush 7.9% 8.3% 5.1% Items with CRTs 0.0% 0.0% 0.0%Branches and Stumps 0.0% 0.0% 0.0% Other Larger Electronics 0.0% 0.0% 0.0%Textiles 2.1% 1.5% 0.9% Other Haz. or Household Haz. Waste (HHW) 0.2% 0.2% 0.1%Rubber/Leather 0.5% 0.4% 0.2% All Other Wastes 0.3% 0.2% 0.1%Diapers and Sanitary Products 2.1% 2.5% 1.5%Carpet and Carpet Padding 2.0% 3.3% 2.0% Totals 100%Remainder/Composite Organic 0.4% 0.4% 0.2% Sample Count 5
Confidence intervals calculated at a 90% confidence level.

Delaware Solid Waste Authority | Statewide Waste Characterization Study
| 49
Table B.4. Cherry Island Residential Hand Sort Data, June 2016
Material Mean +/-
Stnd.
Dev. Material Mean +/-
Stnd.
Dev.
Paper 17.4% Metal 3.0%Newspaper and Inserts 1.7% 1.0% 0.6% Tin/Steel Containers 1.2% 0.7% 0.4%Corrugated Cardboard/Kraft Paper 4.3% 2.4% 1.4% Other Ferrous 0.5% 0.5% 0.3%High Grade Office Paper 0.4% 0.4% 0.2% Aluminum Beverage & Cat Food Containers 0.4% 0.1% 0.1%Mixed Recyclable Paper 2.7% 0.8% 0.5% Other Aluminum 0.3% 0.2% 0.1%Compostable Paper 5.9% 0.5% 0.3% Other Non-Ferrous 0.5% 0.4% 0.2%Aseptic Boxes and Gable Top Cartons 0.1% 0.1% 0.0%Remainder/Composite Paper 2.5% 3.2% 2.0% Glass 4.0%
Glass Bottles and Jars 3.6% 1.7% 1.0%Plastic 15.0% Remainder/Composite Glass 0.4% 0.2% 0.1%
PET #1 Bottles, Jars, or Containers 2.1% 0.5% 0.3%HDPE #2 Natural and Colored Bottles 1.0% 0.3% 0.2% C&D 8.7%Rigid HDPE #2 Containers 0.0% 0.0% 0.0% Pallets/Crates 0.0% 0.0% 0.0%#3 to #7 Bottles or Jars 0.0% 0.0% 0.0% Clean Lumber 2.7% 2.9% 1.7%Injection Molded Tubs #2, #4, #5, #6, & #7 0.2% 0.0% 0.0% Painted and Stained Wood 2.2% 1.8% 1.1%All Other Rigid Plastic Packaging 0.0% 0.0% 0.0% Other Engineered Wood 2.7% 2.9% 1.8%White Expanded Polystyrene (Styrofoam) 0.4% 0.3% 0.2% Wood Furniture 0.0% 0.0% 0.0%Recoverable Film 0.4% 0.1% 0.1% Other Wood 0.5% 0.7% 0.4%All Other Film 5.1% 1.3% 0.8% Asphalt Roofing 0.0% 0.0% 0.0%Agricultural Film & Marine Shrink Wrap 0.0% 0.0% 0.0% Asphalt, Brick, Concrete, and Rocks 0.1% 0.1% 0.0%Large Plastic Items 2.2% 1.9% 1.1% Drywall/Gypsum Board 0.5% 0.4% 0.3%Remainder/Composite Plastic 3.5% 1.5% 0.9% Remainder/Composite C&D 0.1% 0.1% 0.1%
Organic 40.1% Other 11.9%Vegetative Food Waste, Unpackaged 10.2% 3.1% 1.9% Tires 3.3% 5.5% 3.3%Protein Food Waste, Unpackaged 3.3% 1.0% 0.6% Small Appliances 0.0% 0.0% 0.0%Food Waste in Plastic Packaging 5.2% 2.6% 1.6% Large Electronics 3.7% 3.9% 2.4%
Food Waste in Other Packaging 1.9% 1.3% 0.8% Other Small Consumer Electronics 0.4% 0.4% 0.2%Leaves, Grass, and Brush 2.1% 3.2% 1.9% Items with CRTs 2.5% 4.1% 2.5%Branches and Stumps 0.2% 0.3% 0.2% Other Larger Electronics 0.0% 0.0% 0.0%Textiles 6.1% 2.2% 1.3% Other Haz. or Household Haz. Waste (HHW) 0.1% 0.0% 0.0%Rubber/Leather 0.3% 0.2% 0.1% All Other Wastes 1.9% 1.4% 0.9%Diapers and Sanitary Products 5.4% 1.9% 1.2%Carpet and Carpet Padding 4.0% 5.1% 3.1% Totals 100%Remainder/Composite Organic 1.3% 1.3% 0.8% Sample Count 7
Confidence intervals calculated at a 90% confidence level.

Delaware Solid Waste Authority | Statewide Waste Characterization Study
| 50
Pine Tree Transfer Station
Table B.5. Pine Tree Transfer Station, ICI Hand Sort Data, June 2016
Material Mean +/-
Stnd.
Dev. Material Mean +/-
Stnd.
Dev.
Paper 30.3% Metal 3.2%Newspaper and Inserts 2.0% 2.5% 1.5% Tin/Steel Containers 0.8% 0.6% 0.4%Corrugated Cardboard/Kraft Paper 12.8% 11.7% 7.1% Other Ferrous 1.6% 2.4% 1.4%High Grade Office Paper 4.3% 5.9% 3.6% Aluminum Beverage & Cat Food Containers 0.2% 0.1% 0.1%Mixed Recyclable Paper 1.6% 1.0% 0.6% Other Aluminum 0.2% 0.2% 0.1%Compostable Paper 7.1% 2.3% 1.4% Other Non-Ferrous 0.2% 0.3% 0.2%Aseptic Boxes and Gable Top Cartons 0.4% 0.4% 0.2%Remainder/Composite Paper 2.1% 2.4% 1.4% Glass 1.8%
Glass Bottles and Jars 1.8% 1.3% 0.8%Plastic 9.6% Remainder/Composite Glass 0.0% 0.0% 0.0%
PET #1 Bottles, Jars, or Containers 0.8% 0.3% 0.2%HDPE #2 Natural and Colored Bottles 0.8% 0.2% 0.1% C&D 19.0%Rigid HDPE #2 Containers 0.0% 0.0% 0.0% Pallets/Crates 2.8% 3.1% 1.9%#3 to #7 Bottles or Jars 0.0% 0.1% 0.0% Clean Lumber 4.6% 5.4% 3.3%Injection Molded Tubs #2, #4, #5, #6, & #7 0.6% 0.6% 0.4% Painted and Stained Wood 0.0% 0.0% 0.0%All Other Rigid Plastic Packaging 0.0% 0.0% 0.0% Other Engineered Wood 4.8% 6.5% 4.0%White Expanded Polystyrene (Styrofoam) 0.4% 0.2% 0.1% Wood Furniture 5.3% 4.4% 2.7%Recoverable Film 0.7% 0.6% 0.4% Other Wood 0.2% 0.3% 0.2%All Other Film 4.5% 2.5% 1.5% Asphalt Roofing 0.0% 0.0% 0.0%Agricultural Film & Marine Shrink Wrap 0.0% 0.0% 0.0% Asphalt, Brick, Concrete, and Rocks 1.2% 1.9% 1.2%Large Plastic Items 0.0% 0.0% 0.0% Drywall/Gypsum Board 0.0% 0.0% 0.0%Remainder/Composite Plastic 1.8% 0.5% 0.3% Remainder/Composite C&D 0.2% 0.3% 0.2%
Organic 35.7% Other 0.4%Vegetative Food Waste, Unpackaged 14.7% 10.4% 6.3% Tires 0.0% 0.0% 0.0%Protein Food Waste, Unpackaged 4.2% 3.2% 1.9% Small Appliances 0.0% 0.0% 0.0%Food Waste in Plastic Packaging 5.9% 2.6% 1.6% Large Electronics 0.0% 0.0% 0.0%
Food Waste in Other Packaging 0.7% 0.5% 0.3% Other Small Consumer Electronics 0.2% 0.2% 0.1%Leaves, Grass, and Brush 0.7% 1.2% 0.7% Items with CRTs 0.0% 0.0% 0.0%Branches and Stumps 0.0% 0.0% 0.0% Other Larger Electronics 0.0% 0.0% 0.0%Textiles 4.9% 3.4% 2.1% Other Haz. or Household Haz. Waste (HHW) 0.1% 0.1% 0.1%Rubber/Leather 0.6% 0.3% 0.2% All Other Wastes 0.1% 0.0% 0.0%Diapers and Sanitary Products 2.3% 1.8% 1.1%Carpet and Carpet Padding 1.4% 2.2% 1.4% Totals 100%Remainder/Composite Organic 0.5% 0.4% 0.3% Sample Count 10
Confidence intervals calculated at a 90% confidence level.
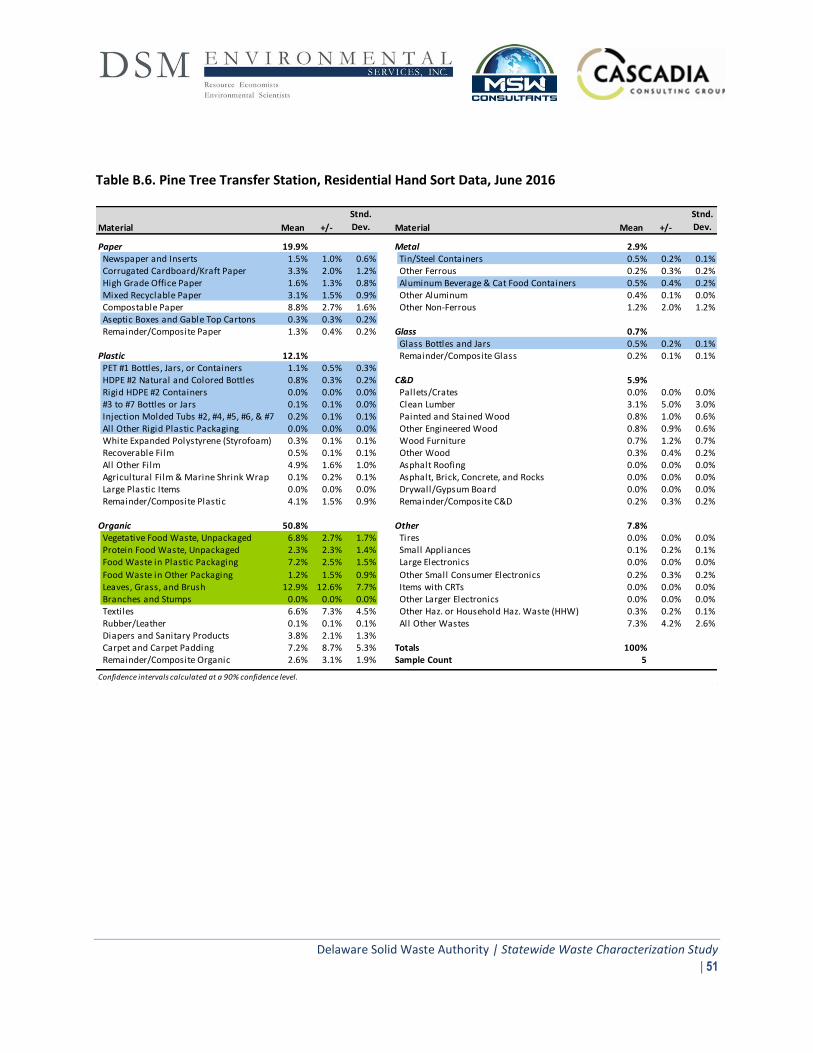
Delaware Solid Waste Authority | Statewide Waste Characterization Study
| 51
Table B.6. Pine Tree Transfer Station, Residential Hand Sort Data, June 2016
Material Mean +/-
Stnd.
Dev. Material Mean +/-
Stnd.
Dev.
Paper 19.9% Metal 2.9%Newspaper and Inserts 1.5% 1.0% 0.6% Tin/Steel Containers 0.5% 0.2% 0.1%Corrugated Cardboard/Kraft Paper 3.3% 2.0% 1.2% Other Ferrous 0.2% 0.3% 0.2%High Grade Office Paper 1.6% 1.3% 0.8% Aluminum Beverage & Cat Food Containers 0.5% 0.4% 0.2%Mixed Recyclable Paper 3.1% 1.5% 0.9% Other Aluminum 0.4% 0.1% 0.0%Compostable Paper 8.8% 2.7% 1.6% Other Non-Ferrous 1.2% 2.0% 1.2%Aseptic Boxes and Gable Top Cartons 0.3% 0.3% 0.2%Remainder/Composite Paper 1.3% 0.4% 0.2% Glass 0.7%
Glass Bottles and Jars 0.5% 0.2% 0.1%Plastic 12.1% Remainder/Composite Glass 0.2% 0.1% 0.1%
PET #1 Bottles, Jars, or Containers 1.1% 0.5% 0.3%HDPE #2 Natural and Colored Bottles 0.8% 0.3% 0.2% C&D 5.9%Rigid HDPE #2 Containers 0.0% 0.0% 0.0% Pallets/Crates 0.0% 0.0% 0.0%#3 to #7 Bottles or Jars 0.1% 0.1% 0.0% Clean Lumber 3.1% 5.0% 3.0%Injection Molded Tubs #2, #4, #5, #6, & #7 0.2% 0.1% 0.1% Painted and Stained Wood 0.8% 1.0% 0.6%All Other Rigid Plastic Packaging 0.0% 0.0% 0.0% Other Engineered Wood 0.8% 0.9% 0.6%White Expanded Polystyrene (Styrofoam) 0.3% 0.1% 0.1% Wood Furniture 0.7% 1.2% 0.7%Recoverable Film 0.5% 0.1% 0.1% Other Wood 0.3% 0.4% 0.2%All Other Film 4.9% 1.6% 1.0% Asphalt Roofing 0.0% 0.0% 0.0%Agricultural Film & Marine Shrink Wrap 0.1% 0.2% 0.1% Asphalt, Brick, Concrete, and Rocks 0.0% 0.0% 0.0%Large Plastic Items 0.0% 0.0% 0.0% Drywall/Gypsum Board 0.0% 0.0% 0.0%Remainder/Composite Plastic 4.1% 1.5% 0.9% Remainder/Composite C&D 0.2% 0.3% 0.2%
Organic 50.8% Other 7.8%Vegetative Food Waste, Unpackaged 6.8% 2.7% 1.7% Tires 0.0% 0.0% 0.0%Protein Food Waste, Unpackaged 2.3% 2.3% 1.4% Small Appliances 0.1% 0.2% 0.1%Food Waste in Plastic Packaging 7.2% 2.5% 1.5% Large Electronics 0.0% 0.0% 0.0%
Food Waste in Other Packaging 1.2% 1.5% 0.9% Other Small Consumer Electronics 0.2% 0.3% 0.2%Leaves, Grass, and Brush 12.9% 12.6% 7.7% Items with CRTs 0.0% 0.0% 0.0%Branches and Stumps 0.0% 0.0% 0.0% Other Larger Electronics 0.0% 0.0% 0.0%Textiles 6.6% 7.3% 4.5% Other Haz. or Household Haz. Waste (HHW) 0.3% 0.2% 0.1%Rubber/Leather 0.1% 0.1% 0.1% All Other Wastes 7.3% 4.2% 2.6%Diapers and Sanitary Products 3.8% 2.1% 1.3%Carpet and Carpet Padding 7.2% 8.7% 5.3% Totals 100%Remainder/Composite Organic 2.6% 3.1% 1.9% Sample Count 5
Confidence intervals calculated at a 90% confidence level.

Delaware Solid Waste Authority | Statewide Waste Characterization Study
| 52
Sandtown
Table B.7. Sandtown ICI Hand Sort Data, June 2016
Material Mean +/-
Stnd.
Dev. Material Mean +/-
Stnd.
Dev.
Paper 21.2% Metal 2.8%Newspaper and Inserts 2.6% 2.5% 1.5% Tin/Steel Containers 0.2% 0.2% 0.1%Corrugated Cardboard/Kraft Paper 6.0% 4.4% 2.7% Other Ferrous 2.4% 3.7% 2.3%High Grade Office Paper 0.4% 0.6% 0.4% Aluminum Beverage & Cat Food Containers 0.1% 0.0% 0.0%Mixed Recyclable Paper 3.9% 3.4% 2.1% Other Aluminum 0.1% 0.1% 0.0%Compostable Paper 7.5% 5.2% 3.2% Other Non-Ferrous 0.0% 0.1% 0.0%Aseptic Boxes and Gable Top Cartons 0.1% 0.1% 0.1%Remainder/Composite Paper 0.6% 0.5% 0.3% Glass 2.9%
Glass Bottles and Jars 2.6% 2.9% 1.7%Plastic 39.4% Remainder/Composite Glass 0.3% 0.4% 0.2%
PET #1 Bottles, Jars, or Containers 0.8% 0.4% 0.3%HDPE #2 Natural and Colored Bottles 0.6% 0.4% 0.3% C&D 1.3%Rigid HDPE #2 Containers 0.2% 0.3% 0.2% Pallets/Crates 0.0% 0.0% 0.0%#3 to #7 Bottles or Jars 0.0% 0.0% 0.0% Clean Lumber 0.5% 0.8% 0.5%Injection Molded Tubs #2, #4, #5, #6, & #7 0.1% 0.1% 0.0% Painted and Stained Wood 0.0% 0.0% 0.0%All Other Rigid Plastic Packaging 0.0% 0.0% 0.0% Other Engineered Wood 0.0% 0.0% 0.0%White Expanded Polystyrene (Styrofoam) 0.2% 0.3% 0.2% Wood Furniture 0.0% 0.0% 0.0%Recoverable Film 0.1% 0.1% 0.0% Other Wood 0.1% 0.1% 0.1%All Other Film 9.5% 8.4% 5.1% Asphalt Roofing 0.0% 0.0% 0.0%Agricultural Film & Marine Shrink Wrap 0.0% 0.0% 0.0% Asphalt, Brick, Concrete, and Rocks 0.0% 0.1% 0.0%Large Plastic Items 0.0% 0.0% 0.0% Drywall/Gypsum Board 0.2% 0.3% 0.2%Remainder/Composite Plastic 28.0% 19.9% 12.1% Remainder/Composite C&D 0.5% 0.5% 0.3%
Organic 28.9% Other 3.6%Vegetative Food Waste, Unpackaged 8.7% 8.2% 5.0% Tires 0.0% 0.0% 0.0%Protein Food Waste, Unpackaged 0.6% 0.7% 0.4% Small Appliances 0.0% 0.0% 0.0%Food Waste in Plastic Packaging 6.8% 6.2% 3.8% Large Electronics 0.5% 0.8% 0.5%
Food Waste in Other Packaging 3.4% 5.4% 3.3% Other Small Consumer Electronics 0.1% 0.1% 0.0%Leaves, Grass, and Brush 3.0% 4.9% 3.0% Items with CRTs 2.7% 4.4% 2.7%Branches and Stumps 0.0% 0.0% 0.0% Other Larger Electronics 0.0% 0.0% 0.0%Textiles 4.5% 5.5% 3.4% Other Haz. or Household Haz. Waste (HHW) 0.4% 0.4% 0.3%Rubber/Leather 0.9% 0.8% 0.5% All Other Wastes 0.0% 0.0% 0.0%Diapers and Sanitary Products 0.7% 0.6% 0.3%Carpet and Carpet Padding 0.0% 0.0% 0.0% Totals 100%Remainder/Composite Organic 0.4% 0.4% 0.2% Sample Count 8
Confidence intervals calculated at a 90% confidence level.

Delaware Solid Waste Authority | Statewide Waste Characterization Study
| 53
Table B.8. Sandtown Residential Hand Sort Data, June 2016
Material Mean +/-
Stnd.
Dev. Material Mean +/-
Stnd.
Dev.
Paper 19.1% Metal 4.2%Newspaper and Inserts 1.0% 0.4% 0.2% Tin/Steel Containers 1.4% 0.6% 0.4%Corrugated Cardboard/Kraft Paper 2.9% 1.3% 0.8% Other Ferrous 1.4% 1.5% 0.9%High Grade Office Paper 0.4% 0.4% 0.2% Aluminum Beverage & Cat Food Containers 0.8% 0.3% 0.2%Mixed Recyclable Paper 3.3% 1.6% 1.0% Other Aluminum 0.5% 0.3% 0.2%Compostable Paper 10.3% 1.6% 1.0% Other Non-Ferrous 0.1% 0.1% 0.1%Aseptic Boxes and Gable Top Cartons 0.2% 0.1% 0.0%Remainder/Composite Paper 1.1% 0.3% 0.2% Glass 2.4%
Glass Bottles and Jars 1.5% 0.5% 0.3%Plastic 16.0% Remainder/Composite Glass 0.9% 1.2% 0.7%
PET #1 Bottles, Jars, or Containers 1.8% 0.4% 0.3%HDPE #2 Natural and Colored Bottles 1.4% 0.3% 0.2% C&D 6.8%Rigid HDPE #2 Containers 0.0% 0.0% 0.0% Pallets/Crates 0.0% 0.0% 0.0%#3 to #7 Bottles or Jars 0.1% 0.0% 0.0% Clean Lumber 3.0% 2.1% 1.3%Injection Molded Tubs #2, #4, #5, #6, & #7 0.3% 0.1% 0.0% Painted and Stained Wood 0.3% 0.4% 0.2%All Other Rigid Plastic Packaging 0.0% 0.0% 0.0% Other Engineered Wood 2.2% 3.5% 2.1%White Expanded Polystyrene (Styrofoam) 0.6% 0.1% 0.1% Wood Furniture 0.0% 0.0% 0.0%Recoverable Film 0.4% 0.2% 0.1% Other Wood 0.7% 0.7% 0.4%All Other Film 6.5% 0.7% 0.4% Asphalt Roofing 0.0% 0.0% 0.0%Agricultural Film & Marine Shrink Wrap 0.1% 0.2% 0.1% Asphalt, Brick, Concrete, and Rocks 0.1% 0.1% 0.1%Large Plastic Items 1.6% 2.6% 1.6% Drywall/Gypsum Board 0.4% 0.5% 0.3%Remainder/Composite Plastic 3.2% 0.3% 0.2% Remainder/Composite C&D 0.1% 0.1% 0.0%
Organic 49.8% Other 1.8%Vegetative Food Waste, Unpackaged 8.7% 3.4% 2.1% Tires 0.3% 0.5% 0.3%Protein Food Waste, Unpackaged 4.2% 1.6% 1.0% Small Appliances 0.0% 0.0% 0.0%Food Waste in Plastic Packaging 7.9% 4.1% 2.5% Large Electronics 0.0% 0.0% 0.0%
Food Waste in Other Packaging 0.9% 0.5% 0.3% Other Small Consumer Electronics 0.1% 0.1% 0.0%Leaves, Grass, and Brush 2.1% 2.1% 1.3% Items with CRTs 0.0% 0.0% 0.0%Branches and Stumps 0.7% 0.8% 0.5% Other Larger Electronics 0.0% 0.0% 0.0%Textiles 6.2% 2.5% 1.5% Other Haz. or Household Haz. Waste (HHW) 0.6% 0.6% 0.3%Rubber/Leather 0.7% 0.6% 0.4% All Other Wastes 0.8% 1.1% 0.7%Diapers and Sanitary Products 3.8% 1.4% 0.9%Carpet and Carpet Padding 3.8% 4.5% 2.7% Totals 100%Remainder/Composite Organic 10.6% 10.3% 6.3% Sample Count 7
Confidence intervals calculated at a 90% confidence level.

Delaware Solid Waste Authority | Statewide Waste Characterization Study
| 54
Milford Transfer Station
Table B.9. Milford ICI Hand Sort Data, June 2016
Material Mean +/-
Stnd.
Dev. Material Mean +/-
Stnd.
Dev.
Paper 26.8% Metal 6.2%Newspaper and Inserts 0.7% 0.6% 0.4% Tin/Steel Containers 0.7% 0.6% 0.4%Corrugated Cardboard/Kraft Paper 12.3% 8.5% 5.2% Other Ferrous 4.8% 7.7% 4.7%High Grade Office Paper 0.3% 0.3% 0.2% Aluminum Beverage & Cat Food Containers 0.4% 0.2% 0.1%Mixed Recyclable Paper 2.5% 2.9% 1.7% Other Aluminum 0.3% 0.2% 0.1%Compostable Paper 9.2% 3.6% 2.2% Other Non-Ferrous 0.1% 0.1% 0.1%Aseptic Boxes and Gable Top Cartons 0.0% 0.0% 0.0%Remainder/Composite Paper 1.9% 1.4% 0.9% Glass 1.3%
Glass Bottles and Jars 1.3% 0.9% 0.6%Plastic 17.5% Remainder/Composite Glass 0.0% 0.0% 0.0%
PET #1 Bottles, Jars, or Containers 1.2% 0.2% 0.1%HDPE #2 Natural and Colored Bottles 0.3% 0.1% 0.0% C&D 3.6%Rigid HDPE #2 Containers 0.1% 0.1% 0.1% Pallets/Crates 0.0% 0.0% 0.0%#3 to #7 Bottles or Jars 0.0% 0.0% 0.0% Clean Lumber 0.3% 0.4% 0.3%Injection Molded Tubs #2, #4, #5, #6, & #7 0.4% 0.3% 0.2% Painted and Stained Wood 0.0% 0.0% 0.0%All Other Rigid Plastic Packaging 0.0% 0.0% 0.0% Other Engineered Wood 0.1% 0.1% 0.1%White Expanded Polystyrene (Styrofoam) 0.7% 1.0% 0.6% Wood Furniture 0.0% 0.0% 0.0%Recoverable Film 0.3% 0.1% 0.1% Other Wood 0.4% 0.4% 0.2%All Other Film 6.2% 2.2% 1.3% Asphalt Roofing 0.0% 0.0% 0.0%Agricultural Film & Marine Shrink Wrap 0.6% 0.9% 0.5% Asphalt, Brick, Concrete, and Rocks 2.7% 4.5% 2.7%Large Plastic Items 1.3% 2.2% 1.3% Drywall/Gypsum Board 0.1% 0.2% 0.1%Remainder/Composite Plastic 6.5% 5.2% 3.1% Remainder/Composite C&D 0.1% 0.1% 0.1%
Organic 40.6% Other 4.1%Vegetative Food Waste, Unpackaged 6.4% 7.2% 4.4% Tires 0.0% 0.0% 0.0%Protein Food Waste, Unpackaged 4.5% 5.0% 3.0% Small Appliances 0.0% 0.0% 0.0%Food Waste in Plastic Packaging 5.9% 6.8% 4.1% Large Electronics 0.0% 0.0% 0.0%
Food Waste in Other Packaging 4.0% 4.1% 2.5% Other Small Consumer Electronics 0.1% 0.2% 0.1%Leaves, Grass, and Brush 8.3% 7.8% 4.8% Items with CRTs 0.0% 0.0% 0.0%Branches and Stumps 0.0% 0.0% 0.0% Other Larger Electronics 0.0% 0.0% 0.0%Textiles 1.3% 0.8% 0.5% Other Haz. or Household Haz. Waste (HHW) 0.1% 0.1% 0.1%Rubber/Leather 0.7% 0.5% 0.3% All Other Wastes 3.8% 3.6% 2.2%Diapers and Sanitary Products 1.3% 2.0% 1.2%Carpet and Carpet Padding 0.0% 0.0% 0.0% Totals 100%Remainder/Composite Organic 8.3% 10.6% 6.4% Sample Count 4
Confidence intervals calculated at a 90% confidence level.

Delaware Solid Waste Authority | Statewide Waste Characterization Study
| 55
Table B.10 Milford Residential Hand Sort Data, June 2016
Material Mean +/-
Stnd.
Dev. Material Mean +/-
Stnd.
Dev.
Paper 20.0% Metal 3.1%Newspaper and Inserts 1.2% 0.6% 0.3% Tin/Steel Containers 1.0% 0.3% 0.2%Corrugated Cardboard/Kraft Paper 1.9% 1.4% 0.9% Other Ferrous 1.0% 1.4% 0.8%High Grade Office Paper 0.5% 0.2% 0.1% Aluminum Beverage & Cat Food Containers 0.4% 0.2% 0.1%Mixed Recyclable Paper 1.4% 1.0% 0.6% Other Aluminum 0.5% 0.3% 0.2%Compostable Paper 12.3% 2.6% 1.6% Other Non-Ferrous 0.2% 0.2% 0.1%Aseptic Boxes and Gable Top Cartons 0.1% 0.1% 0.0%Remainder/Composite Paper 2.6% 2.7% 1.6% Glass 2.9%
Glass Bottles and Jars 2.0% 1.3% 0.8%Plastic 10.1% Remainder/Composite Glass 0.9% 1.3% 0.8%
PET #1 Bottles, Jars, or Containers 1.4% 0.3% 0.2%HDPE #2 Natural and Colored Bottles 0.6% 0.2% 0.1% C&D 4.9%Rigid HDPE #2 Containers 0.3% 0.4% 0.3% Pallets/Crates 0.7% 0.7% 0.4%#3 to #7 Bottles or Jars 0.0% 0.0% 0.0% Clean Lumber 2.3% 1.8% 1.1%Injection Molded Tubs #2, #4, #5, #6, & #7 0.3% 0.1% 0.1% Painted and Stained Wood 0.2% 0.3% 0.2%All Other Rigid Plastic Packaging 0.0% 0.0% 0.0% Other Engineered Wood 0.7% 0.8% 0.5%White Expanded Polystyrene (Styrofoam) 0.4% 0.3% 0.2% Wood Furniture 0.0% 0.0% 0.0%Recoverable Film 0.3% 0.1% 0.1% Other Wood 0.8% 0.7% 0.4%All Other Film 4.1% 0.6% 0.4% Asphalt Roofing 0.0% 0.0% 0.0%Agricultural Film & Marine Shrink Wrap 0.0% 0.0% 0.0% Asphalt, Brick, Concrete, and Rocks 0.0% 0.0% 0.0%Large Plastic Items 0.0% 0.0% 0.0% Drywall/Gypsum Board 0.0% 0.0% 0.0%Remainder/Composite Plastic 2.5% 0.8% 0.5% Remainder/Composite C&D 0.2% 0.2% 0.1%
Organic 48.0% Other 11.0%Vegetative Food Waste, Unpackaged 10.4% 4.7% 2.8% Tires 0.0% 0.0% 0.0%Protein Food Waste, Unpackaged 3.1% 1.4% 0.9% Small Appliances 0.0% 0.0% 0.0%Food Waste in Plastic Packaging 6.7% 2.3% 1.4% Large Electronics 0.0% 0.0% 0.0%
Food Waste in Other Packaging 0.7% 0.4% 0.3% Other Small Consumer Electronics 0.3% 0.3% 0.2%Leaves, Grass, and Brush 8.7% 5.7% 3.5% Items with CRTs 0.0% 0.0% 0.0%Branches and Stumps 3.6% 3.7% 2.3% Other Larger Electronics 0.0% 0.0% 0.0%Textiles 3.6% 1.5% 0.9% Other Haz. or Household Haz. Waste (HHW) 0.6% 0.4% 0.2%Rubber/Leather 2.9% 2.2% 1.3% All Other Wastes 10.1% 4.4% 2.7%Diapers and Sanitary Products 4.4% 2.0% 1.2%Carpet and Carpet Padding 2.9% 4.7% 2.9% Totals 100%Remainder/Composite Organic 1.1% 0.7% 0.4% Sample Count 8
Confidence intervals calculated at a 90% confidence level.

Delaware Solid Waste Authority | Statewide Waste Characterization Study
| 56
Route 5 Transfer Station
Table B.11. Route 5 Transfer Station ICI Hand Sort Data, June 2016
Material Mean +/-
Stnd.
Dev. Material Mean +/-
Stnd.
Dev.
Paper 32.6% Metal 6.1%Newspaper and Inserts 5.1% 7.3% 4.5% Tin/Steel Containers 0.2% 0.1% 0.1%Corrugated Cardboard/Kraft Paper 5.6% 5.3% 3.2% Other Ferrous 4.2% 6.4% 3.9%High Grade Office Paper 0.5% 0.3% 0.2% Aluminum Beverage & Cat Food Containers 0.8% 0.4% 0.2%Mixed Recyclable Paper 2.4% 0.4% 0.2% Other Aluminum 0.3% 0.2% 0.1%Compostable Paper 16.8% 6.7% 4.1% Other Non-Ferrous 0.6% 0.9% 0.5%Aseptic Boxes and Gable Top Cartons 0.0% 0.0% 0.0%Remainder/Composite Paper 2.2% 2.3% 1.4% Glass 6.3%
Glass Bottles and Jars 6.0% 4.2% 2.6%Plastic 17.9% Remainder/Composite Glass 0.3% 0.5% 0.3%
PET #1 Bottles, Jars, or Containers 2.7% 1.1% 0.7%HDPE #2 Natural and Colored Bottles 0.9% 0.3% 0.2% C&D 9.1%Rigid HDPE #2 Containers 0.0% 0.0% 0.0% Pallets/Crates 2.2% 3.7% 2.2%#3 to #7 Bottles or Jars 0.0% 0.0% 0.0% Clean Lumber 5.0% 7.3% 4.5%Injection Molded Tubs #2, #4, #5, #6, & #7 0.4% 0.2% 0.1% Painted and Stained Wood 0.0% 0.0% 0.0%All Other Rigid Plastic Packaging 0.2% 0.4% 0.2% Other Engineered Wood 0.0% 0.0% 0.0%White Expanded Polystyrene (Styrofoam) 0.7% 0.3% 0.2% Wood Furniture 0.0% 0.0% 0.0%Recoverable Film 0.8% 0.3% 0.2% Other Wood 1.0% 1.6% 1.0%All Other Film 7.5% 2.1% 1.3% Asphalt Roofing 0.0% 0.0% 0.0%Agricultural Film & Marine Shrink Wrap 0.0% 0.0% 0.0% Asphalt, Brick, Concrete, and Rocks 0.2% 0.3% 0.2%Large Plastic Items 1.3% 1.4% 0.8% Drywall/Gypsum Board 0.3% 0.6% 0.3%Remainder/Composite Plastic 3.5% 1.8% 1.1% Remainder/Composite C&D 0.4% 0.6% 0.3%
Organic 25.0% Other 3.1%Vegetative Food Waste, Unpackaged 10.3% 5.9% 3.6% Tires 0.0% 0.0% 0.0%Protein Food Waste, Unpackaged 2.5% 1.5% 0.9% Small Appliances 0.0% 0.0% 0.0%Food Waste in Plastic Packaging 4.7% 2.1% 1.3% Large Electronics 0.0% 0.0% 0.0%
Food Waste in Other Packaging 0.3% 0.3% 0.2% Other Small Consumer Electronics 0.3% 0.3% 0.2%Leaves, Grass, and Brush 0.9% 0.7% 0.4% Items with CRTs 0.0% 0.0% 0.0%Branches and Stumps 0.0% 0.0% 0.0% Other Larger Electronics 0.0% 0.0% 0.0%Textiles 0.6% 0.5% 0.3% Other Haz. or Household Haz. Waste (HHW) 0.8% 0.8% 0.5%Rubber/Leather 0.9% 1.2% 0.7% All Other Wastes 2.0% 1.2% 0.7%Diapers and Sanitary Products 1.8% 1.3% 0.8%Carpet and Carpet Padding 0.2% 0.4% 0.2% Totals 100%Remainder/Composite Organic 2.9% 2.5% 1.5% Sample Count 4
Confidence intervals calculated at a 90% confidence level.

Delaware Solid Waste Authority | Statewide Waste Characterization Study
| 57
Table B.12. Route 5 Transfer Station, Residential Hand Sort Data, June 2016
Material Mean +/-
Stnd.
Dev. Material Mean +/-
Stnd.
Dev.
Paper 19.0% Metal 2.7%Newspaper and Inserts 1.5% 1.5% 0.9% Tin/Steel Containers 1.0% 0.7% 0.4%Corrugated Cardboard/Kraft Paper 0.5% 0.4% 0.2% Other Ferrous 0.2% 0.3% 0.2%High Grade Office Paper 0.6% 0.6% 0.4% Aluminum Beverage & Cat Food Containers 0.9% 0.4% 0.2%Mixed Recyclable Paper 1.5% 0.5% 0.3% Other Aluminum 0.3% 0.2% 0.1%Compostable Paper 13.9% 4.1% 2.5% Other Non-Ferrous 0.4% 0.5% 0.3%Aseptic Boxes and Gable Top Cartons 0.2% 0.1% 0.0%Remainder/Composite Paper 0.8% 0.6% 0.4% Glass 5.1%
Glass Bottles and Jars 3.2% 0.9% 0.5%Plastic 12.5% Remainder/Composite Glass 1.9% 2.9% 1.7%
PET #1 Bottles, Jars, or Containers 1.7% 0.2% 0.1%HDPE #2 Natural and Colored Bottles 1.2% 0.4% 0.2% C&D 12.3%Rigid HDPE #2 Containers 0.2% 0.3% 0.2% Pallets/Crates 0.0% 0.0% 0.0%#3 to #7 Bottles or Jars 0.1% 0.1% 0.0% Clean Lumber 5.2% 8.4% 5.1%Injection Molded Tubs #2, #4, #5, #6, & #7 0.4% 0.3% 0.2% Painted and Stained Wood 0.5% 0.5% 0.3%All Other Rigid Plastic Packaging 0.0% 0.0% 0.0% Other Engineered Wood 1.6% 2.3% 1.4%White Expanded Polystyrene (Styrofoam) 0.7% 0.4% 0.3% Wood Furniture 4.8% 4.6% 2.8%Recoverable Film 0.4% 0.2% 0.1% Other Wood 0.1% 0.2% 0.1%All Other Film 5.0% 0.4% 0.3% Asphalt Roofing 0.0% 0.0% 0.0%Agricultural Film & Marine Shrink Wrap 0.0% 0.0% 0.0% Asphalt, Brick, Concrete, and Rocks 0.1% 0.1% 0.1%Large Plastic Items 0.0% 0.0% 0.0% Drywall/Gypsum Board 0.0% 0.0% 0.0%Remainder/Composite Plastic 2.8% 1.3% 0.8% Remainder/Composite C&D 0.0% 0.1% 0.0%
Organic 45.6% Other 2.9%Vegetative Food Waste, Unpackaged 14.2% 4.3% 2.6% Tires 0.0% 0.0% 0.0%Protein Food Waste, Unpackaged 7.9% 9.1% 5.5% Small Appliances 0.0% 0.0% 0.0%Food Waste in Plastic Packaging 5.7% 2.9% 1.7% Large Electronics 0.0% 0.0% 0.0%
Food Waste in Other Packaging 1.0% 0.9% 0.5% Other Small Consumer Electronics 0.5% 0.6% 0.4%Leaves, Grass, and Brush 6.3% 5.7% 3.5% Items with CRTs 0.0% 0.0% 0.0%Branches and Stumps 0.0% 0.0% 0.0% Other Larger Electronics 0.0% 0.0% 0.0%Textiles 3.3% 2.6% 1.6% Other Haz. or Household Haz. Waste (HHW) 0.9% 0.8% 0.5%Rubber/Leather 0.4% 0.4% 0.2% All Other Wastes 1.5% 1.1% 0.6%Diapers and Sanitary Products 5.8% 2.5% 1.5%Carpet and Carpet Padding 0.1% 0.1% 0.1% Totals 100%Remainder/Composite Organic 1.0% 0.2% 0.1% Sample Count 4
Confidence intervals calculated at a 90% confidence level.

Delaware Solid Waste Authority | Statewide Waste Characterization Study
| 58
Jones Crossroads Landfill
Table B.13. Jones Crossroads ICI Hand Sort Data, June 2016
Material Mean +/-
Stnd.
Dev. Material Mean +/-
Stnd.
Dev.
Paper 27.2% Metal 1.0%Newspaper and Inserts 0.1% 0.1% 0.1% Tin/Steel Containers 0.4% 0.3% 0.2%Corrugated Cardboard/Kraft Paper 15.6% 12.7% 7.7% Other Ferrous 0.0% 0.0% 0.0%High Grade Office Paper 0.2% 0.3% 0.2% Aluminum Beverage & Cat Food Containers 0.3% 0.2% 0.1%Mixed Recyclable Paper 1.3% 1.1% 0.7% Other Aluminum 0.2% 0.1% 0.1%Compostable Paper 7.2% 3.5% 2.2% Other Non-Ferrous 0.1% 0.1% 0.0%Aseptic Boxes and Gable Top Cartons 2.1% 3.3% 2.0%Remainder/Composite Paper 0.6% 0.6% 0.4% Glass 1.6%
Glass Bottles and Jars 1.6% 1.3% 0.8%Plastic 18.7% Remainder/Composite Glass 0.0% 0.0% 0.0%
PET #1 Bottles, Jars, or Containers 1.8% 1.4% 0.9%HDPE #2 Natural and Colored Bottles 0.3% 0.3% 0.2% C&D 12.5%Rigid HDPE #2 Containers 0.0% 0.0% 0.0% Pallets/Crates 2.8% 3.0% 1.8%#3 to #7 Bottles or Jars 0.3% 0.3% 0.2% Clean Lumber 0.1% 0.1% 0.1%Injection Molded Tubs #2, #4, #5, #6, & #7 0.0% 0.1% 0.0% Painted and Stained Wood 0.0% 0.0% 0.0%All Other Rigid Plastic Packaging 0.1% 0.0% 0.0% Other Engineered Wood 0.2% 0.3% 0.2%White Expanded Polystyrene (Styrofoam) 3.3% 4.1% 2.5% Wood Furniture 8.7% 12.1% 7.4%Recoverable Film 0.1% 0.1% 0.0% Other Wood 0.1% 0.1% 0.1%All Other Film 9.6% 3.5% 2.2% Asphalt Roofing 0.0% 0.0% 0.0%Agricultural Film & Marine Shrink Wrap 0.0% 0.0% 0.0% Asphalt, Brick, Concrete, and Rocks 0.7% 1.0% 0.6%Large Plastic Items 0.0% 0.0% 0.0% Drywall/Gypsum Board 0.0% 0.0% 0.0%Remainder/Composite Plastic 3.1% 2.0% 1.2% Remainder/Composite C&D 0.0% 0.1% 0.0%
Organic 33.3% Other 5.8%Vegetative Food Waste, Unpackaged 14.5% 8.4% 5.1% Tires 0.0% 0.0% 0.0%Protein Food Waste, Unpackaged 0.7% 0.5% 0.3% Small Appliances 0.0% 0.0% 0.0%Food Waste in Plastic Packaging 1.3% 0.7% 0.5% Large Electronics 0.0% 0.0% 0.0%
Food Waste in Other Packaging 0.6% 0.5% 0.3% Other Small Consumer Electronics 0.0% 0.0% 0.0%Leaves, Grass, and Brush 1.7% 2.8% 1.7% Items with CRTs 0.0% 0.0% 0.0%Branches and Stumps 0.9% 1.5% 0.9% Other Larger Electronics 0.0% 0.0% 0.0%Textiles 2.3% 2.6% 1.6% Other Haz. or Household Haz. Waste (HHW) 0.8% 1.1% 0.6%Rubber/Leather 0.3% 0.2% 0.1% All Other Wastes 5.0% 4.2% 2.5%Diapers and Sanitary Products 1.2% 0.9% 0.5%Carpet and Carpet Padding 2.2% 3.6% 2.2% Totals 100%Remainder/Composite Organic 7.6% 12.3% 7.5% Sample Count 8
Confidence intervals calculated at a 90% confidence level.

Delaware Solid Waste Authority | Statewide Waste Characterization Study
| 59
Table B.14. Jones Crossroads Residential Hand Sort Data, June 2016
Material Mean +/-
Stnd.
Dev. Material Mean +/-
Stnd.
Dev.
Paper 17.5% Metal 5.6%Newspaper and Inserts 1.3% 1.1% 0.7% Tin/Steel Containers 0.8% 0.4% 0.2%Corrugated Cardboard/Kraft Paper 2.4% 1.9% 1.2% Other Ferrous 3.5% 3.9% 2.4%High Grade Office Paper 0.1% 0.1% 0.0% Aluminum Beverage & Cat Food Containers 0.4% 0.1% 0.1%Mixed Recyclable Paper 1.3% 0.4% 0.3% Other Aluminum 0.4% 0.2% 0.1%Compostable Paper 11.5% 2.9% 1.8% Other Non-Ferrous 0.5% 0.4% 0.2%Aseptic Boxes and Gable Top Cartons 0.0% 0.0% 0.0%Remainder/Composite Paper 1.0% 0.7% 0.4% Glass 2.3%
Glass Bottles and Jars 2.2% 1.7% 1.0%Plastic 16.0% Remainder/Composite Glass 0.1% 0.1% 0.0%
PET #1 Bottles, Jars, or Containers 1.7% 0.5% 0.3%HDPE #2 Natural and Colored Bottles 1.0% 0.6% 0.4% C&D 2.1%Rigid HDPE #2 Containers 1.0% 1.1% 0.6% Pallets/Crates 0.0% 0.0% 0.0%#3 to #7 Bottles or Jars 0.2% 0.2% 0.1% Clean Lumber 0.1% 0.1% 0.1%Injection Molded Tubs #2, #4, #5, #6, & #7 0.2% 0.2% 0.1% Painted and Stained Wood 0.5% 0.9% 0.5%All Other Rigid Plastic Packaging 0.1% 0.1% 0.0% Other Engineered Wood 0.8% 0.7% 0.4%White Expanded Polystyrene (Styrofoam) 0.7% 0.3% 0.2% Wood Furniture 0.0% 0.0% 0.0%Recoverable Film 0.8% 0.7% 0.4% Other Wood 0.6% 0.6% 0.4%All Other Film 7.2% 1.2% 0.7% Asphalt Roofing 0.0% 0.0% 0.0%Agricultural Film & Marine Shrink Wrap 0.0% 0.0% 0.0% Asphalt, Brick, Concrete, and Rocks 0.0% 0.0% 0.0%Large Plastic Items 0.6% 1.0% 0.6% Drywall/Gypsum Board 0.0% 0.0% 0.0%Remainder/Composite Plastic 2.5% 1.1% 0.6% Remainder/Composite C&D 0.0% 0.0% 0.0%
Organic 45.1% Other 11.5%Vegetative Food Waste, Unpackaged 16.3% 5.0% 3.0% Tires 0.0% 0.0% 0.0%Protein Food Waste, Unpackaged 2.3% 0.8% 0.5% Small Appliances 0.0% 0.0% 0.0%Food Waste in Plastic Packaging 6.3% 2.3% 1.4% Large Electronics 0.0% 0.0% 0.0%
Food Waste in Other Packaging 2.1% 0.9% 0.5% Other Small Consumer Electronics 0.4% 0.5% 0.3%Leaves, Grass, and Brush 2.6% 3.0% 1.8% Items with CRTs 0.0% 0.0% 0.0%Branches and Stumps 0.9% 1.5% 0.9% Other Larger Electronics 0.0% 0.0% 0.0%Textiles 6.2% 3.7% 2.2% Other Haz. or Household Haz. Waste (HHW) 0.6% 0.6% 0.3%Rubber/Leather 1.7% 2.5% 1.5% All Other Wastes 10.4% 8.2% 5.0%Diapers and Sanitary Products 3.6% 1.3% 0.8%Carpet and Carpet Padding 2.6% 3.6% 2.2% Totals 100%Remainder/Composite Organic 0.5% 0.5% 0.3% Sample Count 6
Confidence intervals calculated at a 90% confidence level.