Degrees Awarded - Communication
35
Communication Data Booklet Fall Term 2015 Quality Enhancement Review Prepared by the Office of Institutional Research
Transcript of Degrees Awarded - Communication

Communication Data Booklet
Fall Term 2015
Quality Enhancement Review
Prepared by the Office of Institutional Research

CommunicationFALL TERM 2015
Most recent available statisticsReport
Page No(s)Degrees Offered 21 1
Faculty 40 2-3
Majors (Fall 2014 Headcount) 4-15Undergraduate 1,137 Graduate - Masters 148 Graduate - Specialist - Graduate - Doctorate 32 Total 1,317
2014-2015 Degrees Awarded 16-17Bachelors 282 Masters 87 Specialist - Doctorate 7 Total 376
Average Class Size (Fall 2014) 18Undergraduate
Lower - classroom 19.4Upper - classroom 46.6
Graduate - classroom 15.6
Credit Hours - Annual (2014-2015)Fundable 36,304 19Non-fundable 2,376 20Total 38,680 21University (fundable) 1,063,479 SIF*2014-2015 Department Fundable Hours As Percent of University Fundable Hours 3.4% calculated
Student FTE's- Annual (state fundable 2014-2015) 19Lower 280.4 Upper 543.3 Grad I 88.0 Grad II 16.9 Total 928.6
Credit Hours Percentages by Instructor Type (Fall 2013) 22Faculty 73.3% calculatedOPS Regular Faculty 0.0% calculatedOPS Faculty Adjuncts 8.7% calculatedGraduate Assistants 18.0% calculatedA&P/USPS 0.0% calculatedPhased Retirement 0.0% calculatedOthers 0.0% calculated
Average Total Credit Hours Taught per Faculty FTE (All Hours, 2013-2014) 22Fall Term 471.4 Spring Term 436.2 Academic Year 907.6 calculated
Annual Student FTE's Taught by all Faculty (Fall & Spring total hrs converted to annual FTE's, 2013-2014) 26Undergraduate (academic year hours/40) 452.5 calculatedGraduate (academic year hours/32) 69.1 calculatedTotal 521.6 calculated
Note: most statistics are based on the Communication accounts 181xxx and 182xxx. Related accounts may not be included
in expenditures and in faculty courses and hours taught. *SIF=Student Information File (Summer and Fall Final, Spring Preliminary)

Communication Fall Term 2015
Table of Contents
Page Degree Programs ...............................................................................1 The Faculty ....................................................................................... 2 Enrollment by major ......................................................................... 4 Degrees Awarded ........................................................................... 16 Average Class Size ........................................................................ 18 Credit Hours by Semester/Fall & Spring/Annual
Fundable ................................................................................... 19 Non-fundable ............................................................................. 20 Total .......................................................................................... 21
Credit Hours and Courses by Instructor Type ...................................... E&G Detail 2009-10 to 2013-14 ................................................ 22
Faculty Courses and Hours 2009-10 and 2013-14 (Individual Faculty Summary) 2009-10 ...................................................................................... 23 2013-14 ...................................................................................... 25 E&G Budgeted Faculty and Staff Lines .......................................... 27 E&G Expenditures by Summary Object Code ............................... 29 Graduate Admissions ..................................................................... 31

College of Communication and InformationSchool of CommunicationDegree Programs
Major Name Major Code Academic Plan Code CIP Code Degree OfferedCommunication Theory and Research 410114 COMMTHRYPD 090199 Doctorate
Major Name Major Code Academic Plan Code CIP Code Degree OfferedAdvertising 410140 COMMADVRBA 090900 Bachelor of ArtAdvertising 410140 COMMADVRBS 090900 Bachelor of ScienceAdvertising 410105 reorganized above 090199 Bachelors
Major Name Major Code Academic Plan Code CIP Code Degree OfferedPublic Relations 410141 COMMPUBRBA 090900 Bachelor of ArtPublic Relations 410141 COMMPUBRBS 090900 Bachelor of SciencePublic Relations 410120 reorganized above 090199 Bachelors
Major Name Major Code Academic Plan Code CIP Code Degree OfferedIntegrated Marketing & Mgmt Communication 410142 COMMMARKMA 090900 Master of ArtIntegrated Marketing & Mgmt Communication 410142 COMMMARKMS 090900 Master of ScienceIntegrated Marketing & Mgmt Communication 410142 COMMMARKMB 090900 Master of Art/ThesisIntegrated Marketing & Mgmt Communication 410142 COMMMARKMT 090900 Master of Science/ThesisIntegrated Marketing & Mgmt Communication 410133 reorganized above 090199 Masters
Major Name Major Code Academic Plan Code CIP Code Degree OfferedMedia/Communication Studies 410151 COMMCOMSBA 090702 Bachelor of ArtMedia/Communication Studies 410151 COMMCOMSBS 090702 Bachelor of ScienceMedia/Communication Studies 410115 reorganized above 090199 Bachelor of ScienceMedia and Communication Studies 410152 COMMCOMSMA 090702 Master of ArtMedia and Communication Studies 410152 COMMCOMSMS 090702 Master of ScienceMedia and Communication Studies 410152 COMMCOMSMB 090702 Master of Art/ThesisMedia and Communication Studies 410152 COMMCOMSMT 090702 Master of Science/ThesisMedia and Communication Studies 410136 reorganized above 090199 Master's
Major Name Major Code Academic Plan Code CIP Code Degree OfferedDigital Media Production 410153 COMMMEDABA 090702 Bachelor of ArtDigital Media Production 410153 COMMMEDABS 090702 Bachelor of ScienceDigital Media Production 410137 reorganized above 090199 Bachelors
Panama City CampusMajor Name Major Code Academic Plan Code CIP Code Degree OfferedProfessional Communication 463001 COMMPROFBA 090900 Bachelor of ArtProfessional Communication 463001 COMMPROFBS 090900 Bachelor of ScienceProfessional Communication 410125 reorganized above 090199 Bachelors
Major Name Major Code Academic Plan Code CIP Code Degree OfferedCorporate and Public Communication 463002 COMMCORPMS 090900 Master of ScienceCorporate and Public Communication 410135 reorganized above 090199 Masters
Pending DeletionMajor Name Major Code Academic Plan Code CIP Code Degree OfferedMedia Production 410103 pending deletion 090199 Bachelors
Not PublishedMajor Name Major Code Academic Plan Code CIP Code Degree OfferedMass Communication 410111 COMMMASSMS 090199 MastersMass Communication 410111 COMMMASSPD 090199 Doctorate
Major Name Major Code Academic Plan Code CIP Code Degree OfferedSpeech Communication 410112 COMMSPCHPD 090199 Doctorate
Effective Fall 2015Major Name Major Code Academic Plan Code CIP Code Degree OfferedPublic Interest Media and Communication 410154 090702 Masters
Source: Degree Program Inventory, FSU and SUS
1

College of Communication and Information
School of Communication
Faculty Demographics
Ranked Faculty
Job Description Comment
Adams Jonathan Ed.D. Boston University 99 Professor 9 Mo SAL 1 8/8/2001 Male White
Arpan Laura Ph.D. University of Alabama 99 Professor 9 Mo SAL 1 8/9/1999 Female White
Bruker Malia MFA Temple University 99 Asst Professor 9 Mo SAL 2 8/8/2014 Female White
Chapa Sindy Ph.D. Univ. of Texas-Pan American 99 Asst Professor 9 Mo SAL 2 8/8/2013 Female Hispanic
Clayton Russell Ph.D. New in Fall 2015
Cortese Juliann Ph.D. Ohio State University 99 Asoc Professor 9 Mo SAL 1 8/9/2005 Female White
Dennis Lawrence Ph.D. University of Virginia D1 Professor 12 Mo SAL 1 9/5/1980 Male White
Graves Brian Ph.D. University of North Carolina 99 Asst Professor 9 Mo SAL 2 8/8/2014 Male White
Harlow Summer Ph.D. University of Texas 99 Asst Professor 9 Mo SAL 2 8/8/2014 Female White
Hou Jove Ph.D. New in Fall 2015
Houck Davis Ph.D. Penn State University 99 Professor 9 Mo SAL 1 12/22/1999 Male White
Jordan Felecia Ed.D. West Virginia University 99 Asoc Professor 9 Mo SAL 1 8/8/1995 Female Black
Lee Jaejin Ph.D. University of Florida 99 Asst Professor 9 Mo SAL 2 8/17/2012 Female Asian
MacNamara Stephen J.D. Florida State University 99 Asoc Professor 9 Mo SAL 1 8/1/1990 Male White
McDowell Stephen Ph.D. York University 99 Professor 9 Mo SAL 1 8/7/1996 Male White
Merle Patrick Ph.D. Texas Tech University 99 Asst Professor 9 Mo SAL 2 8/8/2013 Male White
Nudd Donna Ph.D. University of Texas 99 Professor 9 Mo SAL 1 8/7/1986 Female White
Opel Andrew Ph.D. University of North Carolina 99 Professor 9 Mo SAL 1 8/8/2001 Male White
Proffitt Jennifer Ph.D. Penn State University 99 Asoc Professor 9 Mo SAL 1 8/9/2005 Female White
Raney Arthur Ph.D. University of Alabama 99 Professor 9 Mo SAL 1 8/9/1999 Male White
Rayburn Jay Ph.D. Florida State University 99 Asoc Professor 9 Mo SAL 1 6/18/1985 Male White
Sypher Ulla Ph.D. University of Kansas G2 Asoc Professor 9 Mo SAL 1 8/9/2005 Female White
last updated on 6/24/15 by the School of Communication
Administrative Codes: Tenure Codes:
D1 - Dean 1 - Tenured
C1 - Chair 2 - Tenure-Earning
G1 - Program Director 3 - Non-Tenured
G2 - Associate Program Director
99 - No Administrative Duties
FSU Hire Gender RaceLast Name First Name Degree Degree University
Admin.
Code Tenure
2

College of Communication and Information
School of Communication
Faculty Demographics
Additional Faculty and Instructors
Job Description
Bartlett Zachary Mast. New adjunct in Fall 2015
Clark Joseph Ph.D. New adjunct in Fall 2015
Dubard John Ph.D. Florida State University 99 Teaching Faculty II 9 Mo SAL 3 8/8/2003 Male White
Fordyce Timothy Bach. 99 Teaching Faculty I Adjunct 3 1/7/2015 Male White
Garbarino James New adjunct in Fall 2015
Gunter Benjamin Ph.D. 99 Teaching Faculty I Adjunct 3 12/23/2014 Male White
Heald Gary Ph.D. Michigan State University C1 Teaching Faculty I 9 Mo SAL 3 3/11/2009 Male White
Jones Faye New adjunct in Fall 2015
Kander Kirby Bach. 99 Teaching Faculty I Adjunct 3 1/7/2015 Male White
Knight LaShonda Bach. 99 Teaching Faculty I Adjunct 3 8/9/2010 Female Black
Laurents Michelle Ph.D. Florida State University 99 Teaching Faculty III 9 Mo SAL3 8/9/2005 Female White
Levine Robert H.S. 99 Teaching Faculty I Adjunct 3 1/4/2012 Male White
McGavock Holly Bach. 99 Teaching Faculty I V. in Lieu 3 12/22/2006 Female White New adjunct in Fall 2015
Rodin Mark Bach. Florida State University 99 Teaching Faculty II 12 Mo SAL3 10/13/1989 Male White
Solomon Barry Mast. Florida State University 99 Teaching Faculty III 9 Mo SAL3 8/8/1988 Male White
Tootle Jerry
Williams Benjamin Mast. 99 Teaching Faculty I V. in Lieu 3 8/9/2007 Male White New adjunct in Fall 2015
Zeigler Mark Mast. Florida State University 99 Teaching Faculty III 9 Mo SAL3 12/22/1993 Male White
last updated on 6/24/15 by the School of Communication
Administrative Codes: Tenure Codes:
D1 - Dean 1 - Tenured
C1 - Chair 2 - Tenure-Earning
G1 - Program Director 3 - Non-Tenured
G2 - Associate Program Director
99 - No Administrative Duties
Gender RaceLast Name First Name Degree Degree University
Admin.
Code Tenure FSU Hire
3

College of Communication and InformationSchool of CommunicationEnrollment by Fall Semester
UG G UG G UG G UG G UG G
School of Communication 1,166 203 1,080 209 1,053 203 1,091 192 1,137 180
Female 862 129 797 135 788 147 826 136 859 125American Indian/Native Alaskan 6 0 8 0 6 0 5 0 0 0Asian 16 4 16 4 16 3 15 2 14 0Black 48 14 47 16 42 15 51 12 52 10Hispanic 135 10 139 8 144 7 156 12 177 14Native Hawaiian or Pacific Islander 0 0 0 0 0 0 1 0 2 0White 629 60 552 65 555 77 574 59 574 56Non-Resident Alien 5 40 3 40 2 41 1 45 7 42Two or More Races 11 0 16 1 15 2 16 2 23 0Not Reported 12 1 16 1 8 2 7 4 10 3
Male 304 74 283 74 265 56 265 56 278 55American Indian/Native Alaskan 1 0 0 0 1 0 0 0 0 0Asian/Pacific Islander 8 0 6 1 4 2 4 1 4 0Black 21 11 17 9 14 7 18 3 22 2Hispanic 46 4 44 7 47 1 47 3 52 5Native Hawaiian or Pacific Islander 0 0 0 0 0 0 0 0 0 0White 219 46 205 42 189 31 186 30 190 32Non-Resident Alien 0 10 1 14 1 13 2 14 2 13Two or More Races 5 3 8 1 7 1 3 3 5 2Not Reported 4 0 2 0 2 1 5 2 3 1
UG = Undergraduate; G = GraduateSource: Fall Preliminary Student Instruction Files (SIFP)
2010 2011 2012 2013 2014Fall Fall Fall Fall Fall
862 797 788 826 859
129135 147 136 125
304283 265 265 278
7474 56 56 55
0
200
400
600
800
1,000
1,200
1,400
1,600
2010 2011 2012 2013 2014Undergraduate Female Graduate Female Undergraduate Male Graduate Male
4

College of Communication and InformationSchool of CommunicationEnrollment by Fall SemesterMajor Description: Advertising
Fall Fall Fall Fall Fall2010 2011 2012 2013 2014
Undergraduate 71 78 78 72 72Freshman 0 0 0 2 0Sophomore 6 10 5 4 8Junior 29 29 30 31 27Senior 36 39 43 35 37
Graduate 0 0 0 0 0Graduate - Masters 0 0 0 0 0Graduate - Doctorate 0 0 0 0 0
Total for Major 71 78 78 72 72
Source: Fall Preliminary Student Instruction Files (SIFP)
Advertising
0 0 0 2 06
105 4 8
2929
30 31 27
36
3943
35 37
0
10
20
30
40
50
60
70
80
90
2010 2011 2012 2013 2014
Freshman Sophomore Junior Senior
5

College of Communication and InformationSchool of CommunicationEnrollment by Fall SemesterMajor Description: Communication Theory & Research
Fall Fall Fall Fall Fall2010 2011 2012 2013 2014
Undergraduate 0 0 0 0 0Freshman 0 0 0 0 0Sophomore 0 0 0 0 0Junior 0 0 0 0 0Senior 0 0 0 0 0
Graduate 4 3 1 5 13Graduate - Masters 0 0 0 0 0Graduate - Doctorate 4 3 1 5 13
Total for Major 4 3 1 5 13
Source: Fall Preliminary Student Instruction Files (SIFP)
Communication Theory & Research
43
1
5
13
0
2
4
6
8
10
12
14
2010 2011 2012 2013 2014
Graduate
6

College of Communication and InformationSchool of CommunicationEnrollment by Fall SemesterMajor Description: Public Relations
Fall Fall Fall Fall Fall2010 2011 2012 2013 2014
Undergraduate 76 80 78 80 74Freshman 0 0 0 0 1Sophomore 10 16 11 13 6Junior 31 30 33 27 30Senior 35 34 34 40 37
Graduate 0 0 0 0 0Graduate - Masters 0 0 0 0 0Graduate - Doctorate 0 0 0 0 0
Total for Major 76 80 78 80 74
Source: Fall Preliminary Student Instruction Files (SIFP)
Public Relations
0 0 0 0 1
1016
11 136
31
3033 27
30
35
3434 40
37
0
10
20
30
40
50
60
70
80
90
2010 2011 2012 2013 2014
Freshman Sophomore Junior Senior
7

College of Communication and InformationSchool of CommunicationEnrollment by Fall SemesterMajor Description: Integrated Marketing & Mgmt Communication
Fall Fall Fall Fall Fall2010 2011 2012 2013 2014
Undergraduate 0 0 0 0 0Freshman 0 0 0 0 0Sophomore 0 0 0 0 0Junior 0 0 0 0 0Senior 0 0 0 0 0
Graduate 106 112 107 107 102Graduate - Masters 106 112 107 106 102Graduate - Doctorate 0 0 0 1 0
Total for Major 106 112 107 107 102
Source: Fall Preliminary Student Instruction Files (SIFP)
Integrated Marketing & Mgmt Communication
106
112
107 107
102
96
98
100
102
104
106
108
110
112
114
2010 2011 2012 2013 2014
Graduate
8

College of Communication and InformationSchool of CommunicationEnrollment by Fall SemesterMajor Description: Media & Communication Studies
Fall Fall Fall Fall Fall2010 2011 2012 2013 2014
Undergraduate 296 327 312 309 314Freshman 0 0 0 8 1Sophomore 24 43 41 35 28Junior 131 127 127 127 130Senior 141 157 144 139 155
Graduate 48 43 36 40 36Graduate - Masters 48 43 36 40 36Graduate - Doctorate 0 0 0 0 0
Total for Major 344 370 348 349 350
Source: Fall Preliminary Student Instruction Files (SIFP)
Media & Communication Studies
0 0 0 8 124
43 41 3528
131127 127 127
130
141
157144 139 155
48
4336 40 36
0
50
100
150
200
250
300
350
400
2010 2011 2012 2013 2014
Freshman Sophomore Junior Senior Graduate
9

College of Communication and InformationSchool of CommunicationEnrollment by Fall SemesterMajor Description: Professional Communication
Fall Fall Fall Fall Fall2010 2011 2012 2013 2014
Undergraduate 106 101 99 100 105Freshman 0 0 0 8 6Sophomore 0 0 0 3 7Junior 54 47 46 46 38Senior 52 54 53 43 54
Graduate 0 0 0 0 0Graduate - Masters 0 0 0 0 0Graduate - Doctorate 0 0 0 0 0
Total for Major 106 101 99 100 105
Source: Fall Preliminary Student Instruction Files (SIFP)
Professional Communication
0 0 08 6
0 0 0
3 7
5447 46
46 38
52
54 53
43 54
0
20
40
60
80
100
120
2010 2011 2012 2013 2014
Freshman Sophomore Junior Senior
10

College of Communication and InformationSchool of CommunicationEnrollment by Fall SemesterMajor Description: Corporate & Public Communication
Fall Fall Fall Fall Fall2010 2011 2012 2013 2014
Undergraduate 0 0 0 0 0Freshman 0 0 0 0 0Sophomore 0 0 0 0 0Junior 0 0 0 0 0Senior 0 0 0 0 0
Graduate 9 13 20 12 10Graduate - Masters 9 13 20 12 10Graduate - Doctorate 0 0 0 0 0
Total for Major 9 13 20 12 10
Source: Fall Preliminary Student Instruction Files (SIFP)
Corporate & Public Communication
9
13
20
1210
0
5
10
15
20
25
2010 2011 2012 2013 2014
Graduate
11

College of Communication and InformationSchool of CommunicationEnrollment by Fall SemesterMajor Description: Digital Media Production
Fall Fall Fall Fall Fall2010 2011 2012 2013 2014
Undergraduate 84 83 96 90 81Freshman 0 0 0 2 0Sophomore 18 13 10 9 8Junior 24 39 48 31 29Senior 42 31 38 48 44
Graduate 0 0 0 0 0Graduate - Masters 0 0 0 0 0Graduate - Doctorate 0 0 0 0 0
Total for Major 84 83 96 90 81
Source: Fall Preliminary Student Instruction Files (SIFP)
Digital Media Production
0 0 0 2 0
1813 10 9
8
2439 48
3129
4231
38
48
44
0
20
40
60
80
100
120
2010 2011 2012 2013 2014
Freshman Sophomore Junior Senior
12

College of Communication and InformationSchool of CommunicationEnrollment by Fall SemesterMajor Description: Mass Communication
Fall Fall Fall Fall Fall2010 2011 2012 2013 2014
Undergraduate 0 0 0 0 0Freshman 0 0 0 0 0Sophomore 0 0 0 0 0Junior 0 0 0 0 0Senior 0 0 0 0 0
Graduate 30 30 30 22 14Graduate - Masters 0 2 0 0 0Graduate - Doctorate 30 28 30 22 14
Total for Major 30 30 30 22 14
Source: Fall Preliminary Student Instruction Files (SIFP)
Mass Communication
30 30 30
22
14
0
5
10
15
20
25
30
35
2010 2011 2012 2013 2014
Graduate
13

College of Communication and InformationSchool of CommunicationEnrollment by Fall SemesterMajor Description: Speech Communication
Fall Fall Fall Fall Fall2010 2011 2012 2013 2014
Undergraduate 0 0 0 0 0Freshman 0 0 0 0 0Sophomore 0 0 0 0 0Junior 0 0 0 0 0Senior 0 0 0 0 0
Graduate 6 8 9 6 5Graduate - Masters 0 0 0 0 0Graduate - Doctorate 6 8 9 6 5
Total for Major 6 8 9 6 5
Source: Fall Preliminary Student Instruction Files (SIFP)
Speech Communication
6
8
9
6
5
0
1
2
3
4
5
6
7
8
9
10
2010 2011 2012 2013 2014
Graduate
14

College of Communication and InformationSchool of CommunicationEnrollment by Fall SemesterMajor Description: Communication NFA
Fall Fall Fall Fall Fall2010 2011 2012 2013 2014
Undergraduate 533 411 390 440 491Freshman 309 228 216 247 257Sophomore 214 174 163 181 224Junior 8 8 6 11 10Senior 2 1 5 1 0
Graduate 0 0 0 0 0Graduate - Masters 0 0 0 0 0Graduate - Doctorate 0 0 0 0 0
Total for Major 533 411 390 440 491
Source: Fall Preliminary Student Instruction Files (SIFP)
Communication NFA
309
228 216247 257
214
174163
181
224
8
86
11
10
2
15
1
0
0
100
200
300
400
500
600
2010 2011 2012 2013 2014
Freshman Sophomore Junior Senior
15

College of Communication and InformationSchool of CommunicationDegrees Awarded by SemesterCIP Code: 090900
Bachelors Masters Doctorate Total2010-11 Summer '10 0 0 0 0
Fall '10 0 0 0 0Spring '11 0 0 0 0
2010-11 Total 0 0 0 0
2011-12 Summer '11 0 0 0 0Fall '11 0 0 0 0Spring '12 0 0 0 0
2011-12 Total 0 0 0 0
2012-13 Summer '12 0 0 0 0Fall '12 0 0 0 0Spring '13 0 0 0 0
2012-13 Total 0 0 0 0
2013-14 Summer '13 0 0 0 0Fall '13 4 2 0 6Spring '14 20 2 0 22
2013-14 Total 24 4 0 28
2014-15 Summer '14 7 16 0 23Fall '14 23 25 0 48Spring '15 63 27 0 90
2014-15 Total 93 68 0 161
Source: Final Student Instruction Files (SIF)
0 0 0
24
93
0 0 0
4
68
0
20
40
60
80
100
120
140
160
180
2010-11 2011-12 2012-13 2013-14 2014-15
Bachelors Masters
16

College of Communication and InformationSchool of CommunicationDegrees Awarded by SemesterCIP Code: 090199
Bachelors Masters Doctorate Total2010-11 Summer '10 33 30 2 65
Fall '10 38 32 1 71Spring '11 190 27 2 219
2010-11 Total 261 89 5 355
2011-12 Summer '11 39 15 2 56Fall '11 54 28 0 82Spring '12 201 44 2 247
2011-12 Total 294 87 4 385
2012-13 Summer '12 39 20 1 60Fall '12 46 29 2 77Spring '13 187 37 1 225
2012-13 Total 272 86 4 362
2013-14 Summer '13 49 15 4 68Fall '13 42 26 4 72Spring '14 176 30 2 208
2013-14 Total 267 71 10 348
2014-15 Summer '14 35 4 2 41Fall '14 35 4 2 41Spring '15 119 11 3 133
2014-15 Total 189 19 7 215
Source: Final Student Instruction Files (SIF)
261294 272 267
189
89
8786
71
19
5
44
10
7
0
50
100
150
200
250
300
350
400
450
2010-11 2011-12 2012-13 2013-14 2014-15
Bachelors Masters Doctorate
17
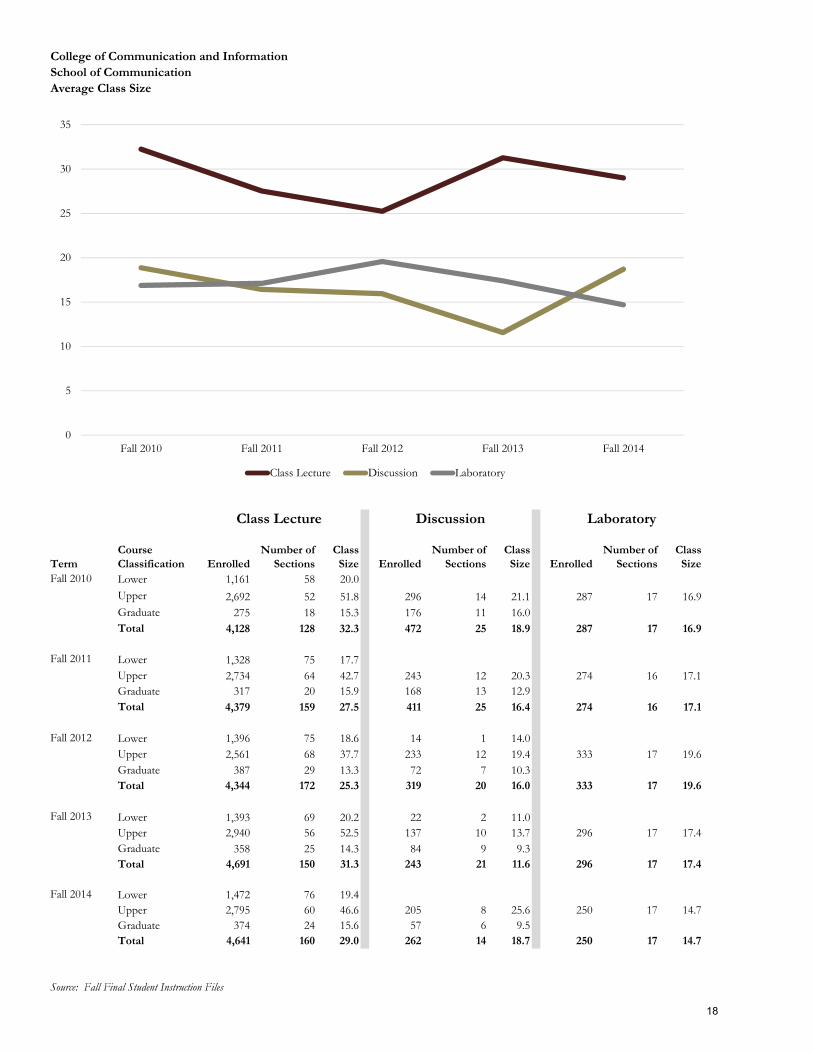
College of Communication and InformationSchool of CommunicationAverage Class Size
TermCourse Classification Enrolled
Number of Sections
Class Size Enrolled
Number of Sections
Class Size Enrolled
Number of Sections
Class Size
Fall 2010 Lower 1,161 58 20.0
Upper 2,692 52 51.8 296 14 21.1 287 17 16.9Graduate 275 18 15.3 176 11 16.0Total 4,128 128 32.3 472 25 18.9 287 17 16.9
Fall 2011 Lower 1,328 75 17.7Upper 2,734 64 42.7 243 12 20.3 274 16 17.1Graduate 317 20 15.9 168 13 12.9Total 4,379 159 27.5 411 25 16.4 274 16 17.1
Fall 2012 Lower 1,396 75 18.6 14 1 14.0Upper 2,561 68 37.7 233 12 19.4 333 17 19.6Graduate 387 29 13.3 72 7 10.3Total 4,344 172 25.3 319 20 16.0 333 17 19.6
Fall 2013 Lower 1,393 69 20.2 22 2 11.0Upper 2,940 56 52.5 137 10 13.7 296 17 17.4Graduate 358 25 14.3 84 9 9.3Total 4,691 150 31.3 243 21 11.6 296 17 17.4
Fall 2014 Lower 1,472 76 19.4Upper 2,795 60 46.6 205 8 25.6 250 17 14.7Graduate 374 24 15.6 57 6 9.5Total 4,641 160 29.0 262 14 18.7 250 17 14.7
Source: Fall Final Student Instruction Files
Class Lecture Discussion Laboratory
0
5
10
15
20
25
30
35
Fall 2010 Fall 2011 Fall 2012 Fall 2013 Fall 2014
Class Lecture Discussion Laboratory
18

College of Communication and InformationSchool of CommunicationFundable Student Credit Hours and FTE
Fundable SCH Produced Annual Fundable FTE Contribution
Summer 2010 2011 2012 2013 2014 Summer 2010 2011 2012 2013 2014Lower 2,976 3,285 3,156 2,790 3,207 Lower 74.4 82.1 78.9 69.8 80.2Upper 2,990 3,605 2,988 3,087 2,827 Upper 74.8 90.1 74.7 77.2 70.7Grad I 646 512 568 523 465 Grad I 20.2 16.0 17.8 16.3 14.5Grad II 158 158 190 142 148 Grad II 4.9 4.9 5.9 4.4 4.6Total 6,770 7,560 6,902 6,542 6,647 Total 174.3 193.2 177.3 167.7 170.0
Fall 2010 2011 2012 2013 2014 Fall 2010 2011 2012 2013 2014Lower 3,408 3,783 3,981 3,933 4,143 Lower 85.2 94.6 99.5 98.3 103.6Upper 9,325 9,373 9,423 9,634 9,411 Upper 233.1 234.3 235.6 240.9 235.3Grad I 1,323 1,362 1,306 1,259 1,219 Grad I 41.3 42.6 40.8 39.3 38.1Grad II 238 260 202 163 226 Grad II 7.4 8.1 6.3 5.1 7.1Total 14,294 14,778 14,912 14,989 14,999 Total 367.1 379.6 382.2 383.6 384.0
Spring 2011 2012 2013 2014 2015 Spring 2011 2012 2013 2014 2015Lower 4,224 3,801 4,182 3,498 3,864 Lower 105.6 95.0 104.6 87.5 96.6Upper 9,461 8,997 9,345 9,781 9,495 Upper 236.5 224.9 233.6 244.5 237.4Grad I 1192 1192 1221 1147 1131 Grad I 37.3 37.3 38.2 35.8 35.3Grad II 262 274 262 200 168 Grad II 8.2 8.6 8.2 6.3 5.3Total 15,139 14,264 15,010 14,626 14,658 Total 387.6 365.8 384.5 374.1 374.6
Annual 2010-11 2011-12 2012-13 2013-14 2014-15 Annual 2010-11 2011-12 2012-13 2013-14 2014-15Lower 10,608 10,869 11,319 10,221 11,214 Lower 265.2 271.7 283.0 255.5 280.4Upper 21,776 21,975 21,756 22,502 21,733 Upper 544.4 549.4 543.9 562.6 543.3Grad I 3,161 3,066 3,095 2,929 2,815 Grad I 98.8 95.8 96.7 91.5 88.0Grad II 658 692 654 505 542 Grad II 20.6 21.6 20.4 15.8 16.9Total 36,203 36,602 36,824 36,157 36,304 Total 928.9 938.5 944.0 925.4 928.6
Note: Lower and Upper hours are divided by 40 to obtain annual FTE; for all Graduate, hours are divided by 32Source: Final Student Instruction Files (SIF)
265.2 271.7 283.0 255.5 280.4
544.4 549.4 543.9 562.6 543.3
119.3 117.4 117.2 107.3 104.9
0
100
200
300
400
500
600
700
800
900
1,000
2010-11 2011-12 2012-13 2013-14 2014-15
An
nu
al F
un
dab
le F
TE
Lower Upper Graduate
19

College of Communication and InformationSchool of CommunicationNon-Fundable Student Credit Hours and FTE
Non-Fundable SCH Produced Annual Non-Fundable FTE Contribution
Summer 2010 2011 2012 2013 2014 Summer 2010 2011 2012 2013 2014Lower 63 312 267 138 147 Lower 1.6 7.8 6.7 3.5 3.7Upper 522 612 590 439 459 Upper 13.1 15.3 14.8 11.0 11.5Grad I 15 24 15 21 21 Grad I 0.5 0.8 0.5 0.7 0.7Grad II 0 0 0 3 3 Grad II 0.0 0.0 0.0 0.1 0.1Total 600 948 872 601 630 Total 15.1 23.9 21.9 15.2 15.9
Fall 2010 2011 2012 2013 2014 Fall 2010 2011 2012 2013 2014Lower 75 201 249 312 273 Lower 1.9 5.0 6.2 7.8 6.8Upper 1,389 1,959 1,182 1,096 1,161 Upper 34.7 49.0 29.6 27.4 29.0Grad I 24 27 48 72 3 Grad I 0.8 0.8 1.5 2.3 0.1Grad II 0 0 3 3 6 Grad II 0.0 0.0 0.1 0.1 0.2Total 1,488 2,187 1,482 1,483 1,443 Total 37.4 54.8 37.4 37.5 36.1
Spring 2011 2012 2013 2014 2015 Spring 2011 2012 2013 2014 2015Lower 81 174 264 138 111 Lower 2.0 4.4 6.6 3.5 2.8Upper 236 309 294 234 186 Upper 5.9 7.7 7.4 5.9 4.7Grad I 48 33 57 60 6 Grad I 1.5 1.0 1.8 1.9 0.2Grad II 0 0 3 3 0 Grad II 0.0 0.0 0.1 0.1 0.0Total 365 516 618 435 303 Total 9.4 13.1 15.8 11.3 7.6
Annual 2010-11 2011-12 2012-13 2013-14 2014-15 Annual 2010-11 2011-12 2012-13 2013-14 2014-15Lower 219 687 780 588 531 Lower 5.5 17.2 19.5 14.7 13.3Upper 2,147 2,880 2,066 1,769 1,806 Upper 53.7 72.0 51.7 44.2 45.2Grad I 87 84 120 153 30 Grad I 2.7 2.6 3.8 4.8 0.9Grad II 0 0 6 9 9 Grad II 0.0 0.0 0.2 0.3 0.3Total 2,453 3,651 2,972 2,519 2,376 Total 61.9 91.8 75.1 64.0 59.6
Note: Lower and Upper hours are divided by 40 to obtain annual FTE; for all Graduate, hours are divided by 32Source: Final Student Instruction Files (SIF)
5.517.2 19.5 14.7 13.3
53.7
72.0
51.7
44.2 45.2
2.7
2.6
3.9
5.1
1.2
0
10
20
30
40
50
60
70
80
90
100
2010-11 2011-12 2012-13 2013-14 2014-15
An
nu
al N
on-F
un
dab
le F
TE
Lower Upper Graduate
20

College of Communication and InformationSchool of CommunicationTotal Student Credit Hours and FTE
Total SCH Produced Annual Total FTE Contribution
Summer 2010 2011 2012 2013 2014 Summer 2010 2011 2012 2013 2014Lower 3,039 3,597 3,423 2,928 3,354 Lower 76.0 89.9 85.6 73.2 83.9Upper 3,512 4,217 3,578 3,526 3,286 Upper 87.8 105.4 89.5 88.2 82.1Grad I 661 536 583 544 486 Grad I 20.7 16.8 18.2 17.0 15.2Grad II 158 158 190 145 151 Grad II 4.9 4.9 5.9 4.5 4.7Total 7,370 8,508 7,774 7,143 7,277 Total 189.4 217.0 199.2 182.9 185.9
Fall 2010 2011 2012 2013 2014 Fall 2010 2011 2012 2013 2014Lower 3,483 3,984 4,230 4,245 4,416 Lower 87.1 99.6 105.8 106.1 110.4Upper 10,714 11,332 10,605 10,730 10,572 Upper 267.9 283.3 265.1 268.3 264.3Grad I 1,347 1,389 1,354 1,331 1,222 Grad I 42.1 43.4 42.3 41.6 38.2Grad II 238 260 205 166 232 Grad II 7.4 8.1 6.4 5.2 7.3Total 15,782 16,965 16,394 16,472 16,442 Total 404.5 434.4 419.6 421.2 420.1
Spring 2011 2012 2013 2014 2015 Spring 2011 2012 2013 2014 2015Lower 4,305 3,975 4,446 3,636 3,975 Lower 107.6 99.4 111.2 90.9 99.4Upper 9,697 9,306 9,639 10,015 9,681 Upper 242.4 232.7 241.0 250.4 242.0Grad I 1,240 1,225 1,278 1,207 1,137 Grad I 38.8 38.3 39.9 37.7 35.5Grad II 262 274 265 203 168 Grad II 8.2 8.6 8.3 6.3 5.3Total 15,504 14,780 15,628 15,061 14,961 Total 397.0 378.9 400.3 385.3 382.2
Annual 2010-11 2011-12 2012-13 2013-14 2014-15 Annual 2010-11 2011-12 2012-13 2013-14 2014-15Lower 10,827 11,556 12,099 10,809 11,745 Lower 270.7 288.9 302.5 270.2 293.6Upper 23,923 24,855 23,822 24,271 23,539 Upper 598.1 621.4 595.6 606.8 588.5Grad I 3,248 3,150 3,215 3,082 2,845 Grad I 101.5 98.4 100.5 96.3 88.9Grad II 658 692 660 514 551 Grad II 20.6 21.6 20.6 16.1 17.2Total 38,656 40,253 39,796 38,676 38,680 Total 990.8 1,030.3 1,019.1 989.4 988.2
Note: Lower and Upper hours are divided by 40 to obtain annual FTE; for all Graduate, hours are divided by 32Source: Final Student Instruction Files (SIF)
270.7 288.9 302.5 270.2 293.6
598.1 621.4 595.6 606.8 588.5
122.1120.1 121.1 112.4 106.1
0
200
400
600
800
1,000
1,200
2010-11 2011-12 2012-13 2013-14 2014-15
An
nu
al T
otal
FT
E
Lower Upper Graduate
21

Source: Instruction Research Data Files.
Department of CommunicationE & G Student Credit Hours and Headcount Productivity
By Instructor Type
Student Headcount/ Student Headcount/FTE Credit Hrs SCH/FTE Headcount FTE FTE Credit Hrs SCH/FTE Headcount FTE
Fall 2009 Spring 2010Faculty 24.4362 10,475.3 428.7 3,703.0 151.5 Faculty 24.4821 10,505.3 429.1 3,614 147.6OPS Regular Faculty 0 0.0 0.0 0.0 0.0 OPS Regular Faculty 0 0.0 0.0 0 0.0OPS Faculty Adjuncts 3.6039 1,332.0 369.6 472.0 131.0 OPS Faculty Adjuncts 4.2746 978.0 228.8 332 77.7Graduate Assistants 15.8428 1,001.0 63.2 510.0 32.2 Graduate Assistants 13.7455 1,500.0 109.1 506 36.8A & P / USPS 0 0.0 0.0 0.0 0.0 A & P / USPS 0 0.0 0.0 0 0.0Others 0 0.0 0.0 0.0 0.0 Others 0 0.0 0.0 0 0.0
43.8829 12,808.3 291.9 4,685 106.8 42.5022 12,983.3 305.5 4,452 104.7
Fall 2010 Spring 2011Faculty 23.39 9,242.0 395.2 3,210.0 137.3 Faculty 22.4751 7,875.8 350.4 2,727 121.3OPS Regular Faculty 0 0.0 0.0 0.0 0.0 OPS Regular Faculty 0 0.0 0.0 0 0.0OPS Faculty Adjuncts 4.7948 2,514.7 524.5 932.0 194.4 OPS Faculty Adjuncts 5.3026 2,231.0 420.7 782 147.5Graduate Assistants 12.8961 944.0 73.2 316.0 24.5 Graduate Assistants 14.1427 1,522.0 107.6 510 36.1A & P / USPS 0 0.0 0.0 0.0 0.0 A & P / USPS 0 0.0 0.0 0 0.0Others 0 0.0 0.0 0.0 0.0 Others 0 0.0 0.0 0 0.0
41.08 12,700.7 309.2 4,458 108.5 41.9204 11,628.8 277.4 4,019 95.9
Fall 2011 Spring 2012Faculty 19.9909 9,082.0 454.3 3,248 162.5 Faculty 23.6611 8,441.5 356.8 2,983 126.1OPS Regular Faculty 0 0.0 0.0 0 0.0 OPS Regular Faculty 0 0.0 0.0 0 0.0OPS Faculty Adjuncts 5.2488 2,376.0 452.7 809 154.1 OPS Faculty Adjuncts 6.6299 1,954.0 294.7 688 103.8Graduate Assistants 11.2673 1,968.0 174.7 658 58.4 Graduate Assistants 15.6472 2,702.0 172.7 902 57.6A & P / USPS 0 0.0 0.0 0 0.0 A & P / USPS 0 0.0 0.0 0 0.0Others 0 0.0 0.0 0 0.0 Others 0 0.0 0.0 0 0.0
36.507 13,426.0 367.8 4,715 129.2 45.9382 13,097.5 285.1 4,573 99.5
Fall 2012 Spring 2013Faculty 24.1416 9,029.1 374.0 3,422.0 141.7 Faculty 23.8644 9,160.3 383.8 3,236 135.6OPS Regular Faculty 0 0.0 0.0 0.0 0.0 OPS Regular Faculty 0 0.0 0.0 0 0.0OPS Faculty Adjuncts 4.2907 1,745.0 0.0 616.0 0.0 OPS Faculty Adjuncts 5.2255 1,951.0 373.4 685 131.1Graduate Assistants 12.3294 3,055.3 0.0 1,064.0 0.0 Graduate Assistants 10.9137 2,584.6 236.8 909 83.3A & P / USPS 0 0.0 0.0 0.0 0.0 A & P / USPS 0 0.0 0.0 0 0.0Others 0 0.0 0.0 0.0 0.0 Others 0 0.0 0.0 0 0.0
40.7617 13,829.4 339.3 5,102 125.2 40.0036 13,695.9 342.4 4,830 120.7
Fall 2013 Spring 2014Faculty 21.922 10,335.1 471.4 3,617.0 165.0 Faculty 22.8739 9,977.1 436.2 3,467 151.6OPS Regular Faculty 0 0.0 0.0 0.0 0.0 OPS Regular Faculty 0 0.0 0.0 0 0.0OPS Faculty Adjuncts 5.0335 1,221.0 242.6 469.0 93.2 OPS Faculty Adjuncts 4.3358 1,159.0 267.3 421 97.1Graduate Assistants 9.7026 2,539.0 261.7 857.0 88.3 Graduate Assistants 9.9116 2,632.0 265.5 878 88.6A & P / USPS 0 0.0 0.0 0.0 0.0 A & P / USPS 0 0.0 0.0 0 0.0Others 0 0.0 0.0 0.0 0.0 Others 0.3112 0.0 0.0 0 0.0
36.6581 14,095.1 384.5 4,943 134.8 37.4325 13,768.1 367.8 4,766 127.3
22

Communication - Faculty Courses & Hours
Fall 2009 - Spring 2010 Organized Classes (C,D,L)
SCH Total Headcount Total Sections Total
E&G Faculty Member Class FTE UGrad Grad SCH UGrad Grad HC UGrad Grad #Sec.ADAMS 9002 1.99 105.0 126.0 231.0 35.0 84.0 119.0 2.0 2.0 4.0 ARPAN 9002 1.00 156.0 165.0 321.0 52.0 107.0 159.0 2.0 3.0 5.0 BUNZ 9002 1.99 1,152.0 48.0 1,200.0 384.0 32.0 416.0 4.0 1.0 5.0 CASTILLO 9003 1.99 150.0 96.0 246.0 50.0 64.0 114.0 3.0 2.0 5.0 CORTESE 9003 1.99 177.0 54.0 231.0 59.0 18.0 77.0 3.0 1.0 4.0 DUBARD 9161 0.50 - 150.0 150.0 - 50.0 50.0 - 2.0 2.0 GILMER 9120 1.99 1,296.0 - 1,296.0 432.0 - 432.0 6.0 - 6.0 GRISE 9161 0.49 - 213.0 213.0 - 142.0 142.0 - 2.0 2.0 HEALD 9001 1.99 - 381.0 381.0 - 188.0 188.0 - 4.0 4.0 HOUCK 9002 1.99 186.0 57.0 243.0 62.0 33.0 95.0 4.0 3.0 7.0 JORDAN 9002 1.99 687.0 33.0 720.0 229.0 22.0 251.0 5.0 1.0 6.0 LAURENTS 9120 1.99 2,912.0 - 2,912.0 985.0 - 985.0 59.0 - 59.0 MACNAMARA 9002 1.99 2,418.0 - 2,418.0 806.0 - 806.0 6.0 - 6.0 MCDOWELL 9001 1.99 39.0 39.0 78.0 13.0 19.0 32.0 2.0 2.0 4.0 OPEL 9002 1.99 402.0 93.0 495.0 134.0 42.0 176.0 4.0 2.0 6.0 PERKURNY 9002 1.99 201.0 60.0 261.0 67.0 39.0 106.0 6.0 2.0 8.0 PROFFITT 9003 1.99 168.0 93.0 261.0 56.0 62.0 118.0 2.0 2.0 4.0 RANEY 9002 1.99 261.0 140.0 401.0 87.0 116.0 203.0 2.0 4.0 6.0 RAYBURN 9002 1.99 1,188.0 66.0 1,254.0 420.0 44.0 464.0 4.0 1.0 5.0 ROBINSON 9120 1.00 180.0 - 180.0 60.0 - 60.0 1.0 - 1.0 RODIN 9126 2.00 240.0 - 240.0 100.0 - 100.0 8.0 - 8.0 SOLOMON 9120 1.99 2,475.0 - 2,475.0 825.0 - 825.0 6.0 - 6.0 ZEIGLER 9120 1.99 2,754.0 - 2,754.0 918.0 - 918.0 46.0 - 46.0 TOTALS 17,147.0 1,814.0 18,961.0 5,774.0 1,062.0 6,836.0 175.0 34.0 209.0
AVERAGE PER FACULTY 857.4 113.4 824.4 288.7 66.4 297.2 8.8 2.1 9.1
Communication - Faculty Courses & HoursFall 2009 - Spring 2010 Individualized (G,T,I,O,P,R,S,Z)
SCH Total Headcount Total Sections Total
E&G Faculty Member Class FTE UGrad Grad SCH UGrad Grad HC UGrad #Sec.ADAMS 9002 1.99 - 15.0 15.0 - 5.0 5.0 - 3.0 3.0 ARPAN 9002 1.00 30.0 11.0 41.0 5.0 3.0 8.0 3.0 3.0 6.0 BUNZ 9002 1.99 26.0 - 26.0 8.0 - 8.0 4.0 - 4.0 CASTILLO 9003 1.99 16.0 - 16.0 6.0 - 6.0 2.0 - 2.0 CORTESE 9003 1.99 - - - - - - - - - DUBARD 9161 0.50 - 3.0 3.0 - 1.0 1.0 - 1.0 1.0 GILMER 9120 1.99 105.0 3.0 108.0 24.0 1.0 25.0 8.0 1.0 9.0 GRISE 9161 0.49 - 9.0 9.0 - 3.0 3.0 - 3.0 3.0 HEALD 9001 1.99 - 92.0 92.0 - 12.0 12.0 - 7.0 7.0 HOUCK 9002 1.99 87.0 21.0 108.0 20.0 3.0 23.0 4.0 3.0 7.0 JORDAN 9002 1.99 11.0 14.0 25.0 4.0 9.0 13.0 1.0 2.0 3.0 LAURENTS 9120 1.99 57.0 - 57.0 13.0 - 13.0 4.0 - 4.0 MACNAMARA 9002 1.99 21.0 - 21.0 6.0 - 6.0 4.0 - 4.0 MCDOWELL 9001 1.99 829.0 65.0 894.0 187.0 20.0 207.0 16.0 13.0 29.0 OPEL 9002 1.99 25.0 13.6 38.6 8.0 4.3 12.3 4.0 4.3 8.3 PERKURNY 9002 1.99 33.0 - 33.0 12.0 - 12.0 4.0 - 4.0 PROFFITT 9003 1.99 52.0 39.0 91.0 9.0 8.0 17.0 3.0 6.0 9.0 RANEY 9002 1.99 34.0 74.0 108.0 8.0 11.0 19.0 3.0 9.0 12.0 RAYBURN 9002 1.99 90.0 77.0 167.0 20.0 25.0 45.0 6.0 4.0 10.0 ROBINSON 9120 1.00 3.0 - 3.0 1.0 - 1.0 1.0 - 1.0 RODIN 9126 2.00 31.0 - 31.0 12.0 - 12.0 5.0 - 5.0 SOLOMON 9120 1.99 105.0 - 105.0 27.0 - 27.0 7.0 - 7.0 ZEIGLER 9120 1.99 28.0 - 28.0 4.0 - 4.0 1.0 - 1.0
TOTALS 1,583.0 436.6 2,019.6 374.0 105.3 479.3 80.0 59.3 139.3
AVERAGE PER FACULTY 87.9 33.6 91.8 20.8 8.1 21.8 4.4 4.6 6.3 23

Communication - Faculty Courses & HoursFall 2009 - Spring 2010 All Types
SCH TOTAL Headcount TOTAL Sections TOTAL
E&G Faculty Member Class FTE UGrad Grad SCH UGrad Grad HC UGrad Grad #Sec.ADAMS 9002 1.99 105.0 141.0 246.0 35.0 89.0 124.0 2.0 5.0 7.0 ARPAN 9002 1.00 186.0 176.0 362.0 57.0 110.0 167.0 5.0 6.0 11.0 BUNZ 9002 1.99 1,178.0 48.0 1,226.0 392.0 32.0 424.0 8.0 1.0 9.0 CASTILLO 9003 1.99 166.0 96.0 262.0 56.0 64.0 120.0 5.0 2.0 7.0 CORTESE 9003 1.99 177.0 54.0 231.0 59.0 18.0 77.0 3.0 1.0 4.0 DUBARD 9161 0.50 - 153.0 153.0 - 51.0 51.0 - 3.0 3.0 GILMER 9120 1.99 1,401.0 3.0 1,404.0 456.0 1.0 457.0 14.0 1.0 15.0 GRISE 9161 0.49 - 222.0 222.0 - 145.0 145.0 - 5.0 5.0 HEALD 9001 1.99 - 473.0 473.0 - 200.0 200.0 - 11.0 11.0 HOUCK 9002 1.99 273.0 78.0 351.0 82.0 36.0 118.0 8.0 6.0 14.0 JORDAN 9002 1.99 698.0 47.0 745.0 233.0 31.0 264.0 6.0 3.0 9.0 LAURENTS 9120 1.99 2,969.0 - 2,969.0 998.0 - 998.0 63.0 - 63.0 MACNAMARA 9002 1.99 2,439.0 - 2,439.0 812.0 - 812.0 10.0 - 10.0 MCDOWELL 9001 1.99 868.0 104.0 972.0 200.0 39.0 239.0 18.0 15.0 33.0 OPEL 9002 1.99 427.0 106.6 533.6 142.0 46.3 188.3 8.0 6.3 14.3 PERKURNY 9002 1.99 234.0 60.0 294.0 79.0 39.0 118.0 10.0 2.0 12.0 PROFFITT 9003 1.99 220.0 132.0 352.0 65.0 70.0 135.0 5.0 8.0 13.0 RANEY 9002 1.99 295.0 214.0 509.0 95.0 127.0 222.0 5.0 13.0 18.0 RAYBURN 9002 1.99 1,278.0 143.0 1,421.0 440.0 69.0 509.0 10.0 5.0 15.0 ROBINSON 9120 1.00 183.0 - 183.0 61.0 - 61.0 2.0 - 2.0 RODIN 9126 2.00SOLOMON 9120 1.99 345.0 - 345.0 127.0 - 127.0 15.0 - 15.0 ZEIGLER 9120 1.99 2,782.0 - 2,782.0 922.0 - 922.0 47.0 - 47.0 TOTALS 16,224.0 2,250.6 18,474.6 5,311.0 1,167.3 6,478.3 244.0 93.3 337.3 AVERAGE PER FACULTY 853.9 132.4 839.8 279.5 68.7 294.5 12.8 5.5 15.3
24

Communication - Faculty Courses & Hours
Fall 2013 - Spring 2014 Organized Classes (C,D,L)
SCH Total Headcount Total Sections Total
E&G Faculty Member Class FTE UGrad Grad SCH UGrad Grad HC UGrad Grad #Sec.ADAMS 9002 1.08 186.0 123.0 309.0 62.0 57.0 119.0 3.0 3.0 6.0 ARPAN 9001 1.99 177.0 132.0 309.0 59.0 87.0 146.0 2.0 3.0 5.0 CHAPA 9003 1.88 210.0 78.0 288.0 70.0 26.0 96.0 3.0 1.0 4.0 CORTESE 9002 1.99 180.0 207.0 387.0 60.0 86.0 146.0 3.0 3.0 6.0 DENNIS 9001 1.76 312.0 - 312.0 104.0 - 104.0 3.0 - 3.0 DUBARD 9061 0.98 - 231.1 231.1 - 119.0 119.0 - 4.0 4.0 HEALD 9060 0.76 - 186.0 186.0 - 88.0 88.0 - 2.0 2.0 HOUCK 9001 1.99 345.0 33.0 378.0 115.0 18.0 133.0 5.0 2.0 7.0 JORDAN 9002 1.99 258.0 102.0 360.0 86.0 60.0 146.0 3.0 2.0 5.0 JORGENSEN 9071 1.37 84.0 66.0 150.0 28.0 44.0 72.0 1.0 1.0 2.0 KORZENNY 9001 0.99 - 93.0 93.0 - 31.0 31.0 - 2.0 2.0 LAURENTS 9062 1.96 2,790.0 - 2,790.0 937.0 - 937.0 60.0 - 60.0 LEE 9003 1.99 111.0 144.0 255.0 37.0 48.0 85.0 2.0 2.0 4.0 MACNAMARA 9002 1.98 1,998.0 - 1,998.0 666.0 - 666.0 9.0 - 9.0 MCDOWELL 9001 1.60 207.0 - 207.0 69.0 - 69.0 2.0 - 2.0 MERLE 9003 1.99 180.0 30.0 210.0 60.0 20.0 80.0 2.0 1.0 3.0 NUDD 9001 1.99 306.0 45.1 351.1 102.0 30.0 132.0 7.0 1.0 8.0 OPEL 9001 1.99 102.0 132.0 234.0 34.0 61.0 95.0 6.0 4.0 10.0 PARKER 9003 1.99 321.0 81.0 402.0 107.0 54.0 161.0 3.0 1.0 4.0 PROFFITT 9002 1.99 123.0 24.0 147.0 41.0 16.0 57.0 2.0 1.0 3.0 RANDEREE 9071 1.95 528.0 - 528.0 176.0 - 176.0 4.0 - 4.0 RANEY 9001 1.91 1,455.0 3.0 1,458.0 485.0 14.0 499.0 4.0 3.0 7.0 RAYBURN 9002 1.90 1,258.0 42.0 1,300.0 444.0 28.0 472.0 4.0 1.0 5.0 RODIN 9060 1.44 215.0 - 215.0 87.0 - 87.0 6.0 - 6.0 SOLOMON 9062 1.74 2,400.0 - 2,400.0 800.0 - 800.0 6.0 - 6.0 SYPHER 9002 1.49 519.0 - 519.0 173.0 - 173.0 7.0 - 7.0 ZEIGLER 9062 1.98 3,090.0 - 3,090.0 1,030.0 - 1,030.0 46.0 - 46.0 TOTALS 17,355.0 1,752.2 19,107.2 5,832.0 887.0 6,719.0 193.0 37.0 230.0
AVERAGE PER FACULTY 723.1 97.3 707.7 243.0 49.3 248.9 8.0 2.1 8.5
Communication - Faculty Courses & HoursFall 2013 - Spring 2014 Individualized (G,T,I,O,P,R,S,Z)
SCH Total Headcount Total Sections Total
E&G Faculty Member Class FTE UGrad Grad SCH UGrad Grad HC UGrad Grad #Sec.ADAMS 9002 1.08 - 10.0 10.0 - 4.0 4.0 - 3.0 3.0 ARPAN 9001 1.99 20.0 25.0 45.0 8.0 8.0 16.0 3.0 5.0 8.0 CHAPA 9003 1.88 4.0 12.0 16.0 2.0 4.0 6.0 2.0 3.0 5.0 CORTESE 9002 1.99 46.0 8.0 54.0 9.0 3.0 12.0 4.0 3.0 7.0 DENNIS 9001 1.76 4.0 - 4.0 2.0 - 2.0 2.0 - 2.0 DUBARD 9061 0.98 - - - - - - - - - HEALD 9060 0.76 - 4.0 4.0 - 4.0 4.0 - 1.0 1.0 HOUCK 9001 1.99 24.0 39.0 63.0 6.0 9.0 15.0 2.0 7.0 9.0 JORDAN 9002 1.99 30.0 13.0 43.0 9.0 4.0 13.0 2.0 4.0 6.0 JORGENSEN 9071 1.37 - 2.0 2.0 - 1.0 1.0 - 1.0 1.0 KORZENNY 9001 0.99 7.0 - 7.0 2.0 - 2.0 1.0 - 1.0 LAURENTS 9062 1.96 32.0 - 32.0 10.0 - 10.0 6.0 - 6.0 LEE 9003 1.99 3.0 7.0 10.0 1.0 3.0 4.0 1.0 2.0 3.0 MACNAMARA 9002 1.98 9.0 - 9.0 3.0 - 3.0 1.0 - 1.0 MCDOWELL 9001 1.60 39.0 67.0 106.0 10.0 20.0 30.0 4.0 7.0 11.0 MERLE 9003 1.99 6.0 9.0 15.0 2.0 6.0 8.0 2.0 1.0 3.0 NUDD 9001 1.99 28.0 24.0 52.0 6.0 4.0 10.0 2.0 4.0 6.0 OPEL 9001 1.99 105.0 9.0 114.0 30.0 4.0 34.0 4.5 4.0 8.5 PARKER 9003 1.99 3.0 - 3.0 1.0 - 1.0 1.0 - 1.0 PROFFITT 9002 1.99 22.0 63.0 85.0 8.0 10.0 18.0 2.0 5.0 7.0 RANDEREE 9071 1.95 15.0 - 15.0 5.0 - 5.0 4.0 - 4.0 RANEY 9001 1.91 30.0 36.0 66.0 8.0 11.0 19.0 3.0 5.0 8.0 RAYBURN 9002 1.90 110.0 111.0 221.0 28.0 36.0 64.0 7.0 9.0 16.0 RODIN 9060 1.44 36.0 - 36.0 14.0 - 14.0 7.0 - 7.0 SOLOMON 9062 1.74 90.0 - 90.0 26.0 - 26.0 6.0 - 6.0 SYPHER 9002 1.49 56.0 20.0 76.0 18.0 11.0 29.0 7.0 5.0 12.0 ZEIGLER 9062 1.98 27.0 - 27.0 5.0 - 5.0 2.0 - 2.0
TOTALS 746.0 459.0 1,205.0 213.0 142.0 355.0 75.5 69.0 144.5
AVERAGE PER FACULTY 32.4 27.0 46.3 9.3 8.4 13.7 3.3 4.1 5.6
25

Communication - Faculty Courses & HoursFall 2013 - Spring 2014 All Types
SCH TOTAL Headcount TOTAL Sections TOTAL
E&G Faculty Member Class FTE UGrad Grad SCH UGrad Grad HC UGrad Grad #Sec.ADAMS 9002 1.08 186.0 133.0 319.0 62.0 61.0 123.0 3.0 6.0 9.0 ARPAN 9001 1.99 197.0 157.0 354.0 67.0 95.0 162.0 5.0 8.0 13.0 CHAPA 9003 1.88 214.0 90.0 304.0 72.0 30.0 102.0 5.0 4.0 9.0 CORTESE 9002 1.99 226.0 215.0 441.0 69.0 89.0 158.0 7.0 6.0 13.0 DENNIS 9001 1.76 316.0 - 316.0 106.0 - 106.0 5.0 - 5.0 DUBARD 9061 0.98 - 231.1 231.1 - 119.0 119.0 - 4.0 4.0 HEALD 9060 0.76 - 190.0 190.0 - 92.0 92.0 - 3.0 3.0 HOUCK 9001 1.99 369.0 72.0 441.0 121.0 27.0 148.0 7.0 9.0 16.0 JORDAN 9002 1.99 288.0 115.0 403.0 95.0 64.0 159.0 5.0 6.0 11.0 JORGENSEN 9071 1.37 84.0 68.0 152.0 28.0 45.0 73.0 1.0 2.0 3.0 KORZENNY 9001 0.99 7.0 93.0 100.0 2.0 31.0 33.0 1.0 2.0 3.0 LAURENTS 9062 1.96 2,822.0 - 2,822.0 947.0 - 947.0 66.0 - 66.0 LEE 9003 1.99 114.0 151.0 265.0 38.0 51.0 89.0 3.0 4.0 7.0 MACNAMARA 9002 1.98 2,007.0 - 2,007.0 669.0 - 669.0 10.0 - 10.0 MCDOWELL 9001 1.60 246.0 67.0 313.0 79.0 20.0 99.0 6.0 7.0 13.0 MERLE 9003 1.99 186.0 39.0 225.0 62.0 26.0 88.0 4.0 2.0 6.0 NUDD 9001 1.99 334.0 69.1 403.1 108.0 34.0 142.0 9.0 5.0 14.0 OPEL 9001 1.99 207.0 141.0 348.0 64.0 65.0 129.0 10.5 8.0 18.5 PARKER 9003 1.99 324.0 81.0 405.0 108.0 54.0 162.0 4.0 1.0 5.0 PROFFITT 9002 1.99 145.0 87.0 232.0 49.0 26.0 75.0 4.0 6.0 10.0 RANDEREE 9071 1.95 543.0 - 543.0 181.0 - 181.0 8.0 - 8.0 RANEY 9001 1.91 1,485.0 39.0 1,524.0 493.0 25.0 518.0 7.0 8.0 15.0 RAYBURN 9002 1.90 1,368.0 153.0 1,521.0 472.0 64.0 536.0 11.0 10.0 21.0 RODIN 9060 1.44 251.0 - 251.0 101.0 - 101.0 13.0 - 13.0 SOLOMON 9062 1.74 2,490.0 - 2,490.0 826.0 - 826.0 12.0 - 12.0 SYPHER 9002 1.49 575.0 20.0 595.0 191.0 11.0 202.0 14.0 5.0 19.0 ZEIGLER 9062 1.98 3,117.0 - 3,117.0 1,035.0 - 1,035.0 48.0 - 48.0 TOTALS 18,101.0 2,211.2 20,312.2 6,045.0 1,029.0 7,074.0 268.5 106.0 374.5 AVERAGE PER FACULTY 724.0 110.6 752.3 241.8 51.5 262.0 10.7 5.3 13.9
26

Operating Budget E & G Position FTE and Rate Totals by Pay Plan and Filled/Vacant
College of Communication & Information
Communication
2010-11 2011-12 2012-13 2013-14 2014-15Filled 9 and 12 Month Faculty
Sum of FTE 23.25 22.81 22.00 21.00 24.81Sum of PersonYr 17.37 17.17 16.56 16.07 18.64Sum of Rate $ 1,591,789 $ 1,619,544 $ 1,552,693 $ 1,559,554 $ 1,905,943
Filled Staff SupportSum of FTE 5.00 4.00 4.00 4.00 3.32Sum of PersonYr 5.00 4.00 4.00 4.00 3.32Sum of Rate $ 162,495 $ 132,035 $ 132,035 $ 137,635 $ 106,945
Summer FacultySum of FTE 9.15 9.28 8.07 7.01 5.17Sum of PersonYr 0.95 0.92 0.77 0.64 0.53Sum of Rate $ 83,005 $ 75,956 $ 67,519 $ 56,246 $ 51,891
Vacant & Reserve FacultySum of FTE 2.25 2.50 2.00 4.00 2.00Sum of PersonYr 1.68 1.87 1.49 2.99 1.49Sum of Rate $ 107,693 $ 134,192 $ 95,446 $ 252,228 $ 75,779
Total Sum of FTE 39.65 38.59 36.07 36.01 35.30Total Sum of PersonYr 25.00 23.96 22.83 23.70 23.99Total Sum of Rate $ 1,944,982 $ 1,961,727 $ 1,847,693 $ 2,005,663 $ 2,140,558
27

Operating Budget E & G Position FTE and Rate Totals by Pay Plan and Filled/Vacant
College of Communication & Information
Dean College of Communication
2010-11 2011-12 2012-13 2013-14 2014-15Filled 9 and 12 Month Faculty
Sum of FTE 1.92 1.00 3.52 3.52 4.00Sum of PersonYr 1.92 1.00 3.12 2.86 3.49Sum of Rate $ 236,049 $ 84,967 $ 406,429 $ 383,559 $ 455,906
Filled Staff SupportSum of FTE 4.00 4.85 4.85 7.29 10.29Sum of PersonYr 4.00 4.85 4.85 7.29 10.29Sum of Rate $ 176,022 $ 210,419 $ 190,324 $ 307,294 $ 399,564
Summer FacultySum of FTE 1.93 2.98 1.65Sum of PersonYr 0.18 0.29 0.17Sum of Rate $ 22,709 $ 29,972 $ 19,491
Vacant & Reserve FacultySum of FTE 2.25 2.25 0.92 2.00 1.00Sum of PersonYr 1.68 1.68 0.92 2.00 1.00Sum of Rate $ 71,669 $ 53,083 $ 99,860 $ 179,043 $ 98,327
Vacant & Reserve Staff SupporSum of FTE 1.00 1.00 3.00 1.00Sum of PersonYr 1.00 1.00 3.00 1.00Sum of Rate 34000 41697 168816 1770
Total Sum of FTE 9.17 9.10 14.22 16.79 16.94Total Sum of PersonYr 8.60 8.53 12.07 13.44 14.95Total Sum of Rate $ 517,741 $ 390,166 $ 888,138 $ 901,638 $ 973,288
28

E & G Expenditures by Budget Category, By Oject Code, Department within Colleges
Coll of Communication & Inform Department of Communication
2009-10 2010-11 2011-12 2012-13 2013-14SALARY FACULTY 1,678,748$ 1,651,237$ 1,551,197$ 1,548,324$ 1,734,252$
FRINGE BENEFITS 552,590$ 554,902$ 464,581$ 436,145$ 511,612$ OTHER SALARY 1,101$ 3,115$ USPS 152,571$ 137,737$ 127,255$ 125,847$ 105,788$ SALARY Total 2,383,909$ 2,343,876$ 2,143,033$ 2,111,417$ 2,354,767$
EXPENSE CONSTRUCTION SUPPLIES 22$ 29$ CONSULTING & OTHER 14,970$ 12,900$ 24,612$ 16,966$ 10,705$ EDUCATIONAL SUPPLIES 298$ 142$ EQUIPMENT & BOOKS 1,416$ 1,999$ 8,031$ 4,293$ 4,667$ EXPENSE OTHER 3,722$ 900$ MAINT & HEATING SUPPLIES 343$ 219$ 360$ 30$ MOTOR FUELS & LUBRICANTS 30$ MOVING EXPENSES 866$ 3,914$ OFFICE SUPPLIES 5,618$ 3,308$ 3,807$ 5,544$ 3,926$ OTHER CURRENT CHARGES 2,989$ 1,563$ 3,395$ 2,162$ 1,165$ OTHER MATERIALS & SUPPLIES 7,720$ 2,865$ 1,277$ 1,887$ 1,921$ POSTAGE 8,134$ 1,282$ 1,191$ PRINTING 1,083$ 1,164$ 916$ 1,540$ 851$ RENTAL OF BUILDINGS 156$ 32$ 60$ RENTAL OF EQUIPMENT 1,469$ 490$ 5,140$ 5,044$ 3,733$ REPAIRS & MAINTENANCE 1,892$ 2,010$ 2,048$ 1,225$ TELEPHONE 15,813$ 16,357$ 16,691$ 17,018$ 14,274$ TRAVEL 57,175$ 31,608$ 50,269$ 59,089$ 45,054$ EXPENSE Total 118,942$ 75,936$ 117,893$ 118,223$ 92,395$
OPS ADJUNCT FACULTY 72,141$ 106,472$ 90,836$ FACULTY ADJUNCTS 135,475$ 159,446$ FRINGE BENEFITS 2,343$ 3,412$ GRAD ASST 448,644$ 450,687$ 375,202$ 317,706$ 341,023$ OPS FACULTY 41,720$ 69,881$ 55,369$ OPS FRINGE BENEFITS 3,103$ 4,557$ 3,306$ OPS OTHER 30,668$ 45,331$ 14,267$ 3,871$ 9,585$ STUDENT ASST 2,860$ 4,810$ 10,870$ 15,829$ 12,643$ OPS Total 599,136$ 681,738$ 549,850$ 475,224$ 526,109$
OCO DATA PROCESSING EQUIPMENT 1,167$ 1,199$ EDUCATIONAL EQUIPMENT 3,935$ OCO Total 1,167$ 1,199$ 3,935$
Grand Total 3,103,154$ 3,102,749$ 2,810,776$ 2,704,864$ 2,977,206$
29

E & G Expenditures by Budget Category, By Oject Code, Department within Colleges
Coll of Communication & Inform Dean College of Communication
2009-10 2010-11 2011-12 2012-13 2013-14SALARY A&P 101,087$ 129,181$ 160,112$ 192,095$ 266,604$
FACULTY 108,319$ 91,202$ 329,418$ 434,042$ 489,754$ FRINGE BENEFITS 111,017$ 117,941$ 162,303$ 159,781$ 213,522$ OTHER SALARY 2,263$ 6,882$ USPS 108,106$ 77,063$ 78,653$ 51,202$ 59,993$ SALARY Total 428,529$ 415,387$ 730,486$ 839,383$ 1,036,755$
EXPENSE CONSTRUCTION SUPPLIES 55$ CONSULTING & OTHER 37$ 76$ 8,328$ EDUCATIONAL SUPPLIES 19$ EQUIPMENT & BOOKS 3,855$ 8,905$ 19,998$ 28,608$ 46,349$ EXPENSE OTHER 4,538$ 7,053$ MAINT & HEATING SUPPLIES 58$ 38$ 145$ 218$ 479$ MOVING EXPENSES 3,698$ 536$ OFFICE SUPPLIES 4,226$ 3,671$ 5,927$ 7,052$ 10,009$ OTHER CURRENT CHARGES 5,188$ 34$ 550$ 5,000$ OTHER MATERIALS & SUPPLI 8,403$ 39,196$ 6,161$ 12,751$ 11,238$ POSTAGE 1,834$ 2,731$ 2,611$ PRINTING 1,474$ 2,150$ 978$ 1,679$ 6,269$ RENTAL OF BUILDINGS 7$ 446$ 87$ REPAIRS & MAINTENANCE 570$ 602$ 5,056$ 7,035$ 4,351$ TELEPHONE 9,300$ 11,709$ 13,471$ 10,585$ 10,179$ TRAVEL 10,307$ 9,872$ 6,719$ 16,626$ 18,426$ EXPENSE Total 45,215$ 78,945$ 61,623$ 98,312$ 123,378$
OPS FACULTY ADJUNCTS 6,299$ FRINGE BENEFITS 975$ 842$ GRAD ASST 27,909$ 64,834$ 90,203$ 14,199$ OPS FRINGE BENEFITS 2$ 111$ 69$ OPS OTHER 168$ 408$ 55,789$ 55,118$ STUDENT ASST 2,843$ 8,411$ 7,643$ 7,619$ OPS Total 3,013$ 36,839$ 64,903$ 160,909$ 77,778$
OCO DATA PROCESSING EQUIPME 13,449$ 45,671$ 145,996$ 6,352$ EDUCATIONAL EQUIPMENT 3,935$ OCO OTHER 12,656$ VEHICLES 6,550$ OCO Total 13,449$ 45,671$ 165,202$ 10,287$
Grand Total 490,206$ 576,842$ 857,012$ 1,263,806$ 1,248,198$
30

College of Communication and InformationSchool of CommunicationGraduate Admissions - Average GRE and College GPA
Enrolled New Graduate Students
Major YearNumber of
GRE ScoresQuantitative
AverageVerbal
AverageTotal
AverageNumber of GPAs
Average GPA
2010-11 95 597 459 1056 95 3.4
2011-12 76 613 492 1105 89 3.5
2012-13* 77 149 150 298 95 3.5
2013-14* 75 151 150 301 83 3.4
2014-15* 48 149 154 303 52 3.6
Major YearNumber of
GRE ScoresQuantitative
AverageVerbal
AverageTotal
AverageNumber of GPAs
Average GPA
2010-11
2011-12
2012-13*
2013-14* 4 141 149 290 4 3.5
2014-15* 18 150 149 299 19 3.4
Source: Admissions Files
CIP: 090199
CIP: 090900
*FSU began using GRE 2 scores in 2012-13. Some students took the GRE 1 in a prior year, and are are not included in the averages. For 2012-13, 16 students had a GRE 1 as their test of record, 2013-14: 5 students, and 2014-15: 4 students.
*FSU began using GRE 2 scores in 2012-13. Some students took the GRE 1 in a prior year, and are are not included in the averages. For 2014-15, 1 student had a GRE 1 as their test of record.
31

College of Communication and InformationSchool of CommunicationGraduate Admissions
Level Gender Citizenship Ap
plie
d
Acc
epte
d
En
rolle
d
Ap
plie
d
Acc
epte
d
En
rolle
d
Ap
plie
d
Acc
epte
d
En
rolle
d
Ap
plie
d
Acc
epte
d
En
rolle
d
Ap
plie
d
Acc
epte
d
En
rolle
d
Domestic 94 71 39 88 74 44 88 79 54 60 48 33 47 40 32International 90 40 16 92 46 13 99 47 18 88 51 21 79 27 7Domestic 42 35 24 34 28 20 30 24 17 28 25 17 23 19 9International 17 7 3 18 7 2 20 8 3 23 10 6 20 6 1
243 153 82 232 155 79 237 158 92 199 134 77 169 92 49
Domestic 17 6 3 15 9 2 12 2 2 8 4 3 4 1 0International 18 12 6 14 5 2 18 5 1 21 7 1 18 2 1Domestic 11 7 2 11 7 4 7 0 0 9 1 1 14 5 3International 12 7 2 16 6 2 10 1 0 11 5 1 8 1 0
58 32 13 56 27 10 47 8 3 49 17 6 44 9 4
301 185 95 288 182 89 284 166 95 248 151 83 213 101 53
Level Gender Citizenship Ap
plie
d
Acc
epte
d
En
rolle
d
Ap
plie
d
Acc
epte
d
En
rolle
d
Ap
plie
d
Acc
epte
d
En
rolle
d
Ap
plie
d
Acc
epte
d
En
rolle
d
Ap
plie
d
Acc
epte
d
En
rolle
d
Domestic 8 6 3 20 16 14International 0 0 0 6 1 0Domestic 3 2 1 9 5 5International 0 0 0 1 0 0
0 0 0 0 0 0 0 0 0 11 8 4 36 22 19
Source: Admissions Files
Male
Master's Total
Male
Doctorate Total
Grand Total
CIP: 090900 2010-11
DoctorateFemale
2014-15
Master'sFemale
Male
Master's Total
CIP: 090199 2010-11 2011-12 2012-13 2013-14
2011-12 2012-13 2013-14 2014-15
Master'sFemale
32