Degraded Performance Analysis of Phased Mission System · system which operates throughout several...
6
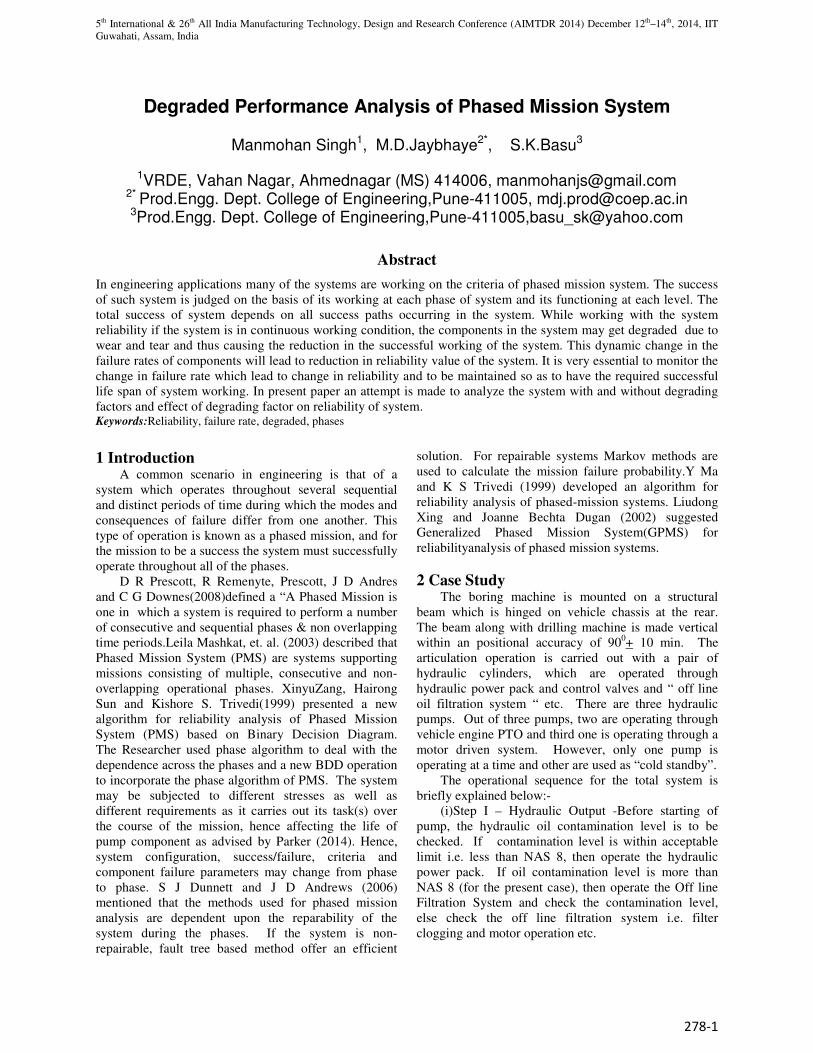
5 th International & 26 th All India Manufacturing Technology, Design and Research Conference (AIMTDR 2014) December 12 th –14 th , 2014, IIT Guwahati, Assam, India 278-1 Degraded Performance Analysis of Phased Mission System Manmohan Singh 1 , M.D.Jaybhaye 2* , S.K.Basu 3 1 VRDE, Vahan Nagar, Ahmednagar (MS) 414006, [email protected] 2* Prod.Engg. Dept. College of Engineering,Pune-411005, [email protected] 3 Prod.Engg. Dept. College of Engineering,Pune-411005,[email protected] Abstract In engineering applications many of the systems are working on the criteria of phased mission system. The success of such system is judged on the basis of its working at each phase of system and its functioning at each level. The total success of system depends on all success paths occurring in the system. While working with the system reliability if the system is in continuous working condition, the components in the system may get degraded due to wear and tear and thus causing the reduction in the successful working of the system. This dynamic change in the failure rates of components will lead to reduction in reliability value of the system. It is very essential to monitor the change in failure rate which lead to change in reliability and to be maintained so as to have the required successful life span of system working. In present paper an attempt is made to analyze the system with and without degrading factors and effect of degrading factor on reliability of system. Keywords:Reliability, failure rate, degraded, phases 1 Introduction A common scenario in engineering is that of a system which operates throughout several sequential and distinct periods of time during which the modes and consequences of failure differ from one another. This type of operation is known as a phased mission, and for the mission to be a success the system must successfully operate throughout all of the phases. D R Prescott, R Remenyte, Prescott, J D Andres and C G Downes(2008)defined a “A Phased Mission is one in which a system is required to perform a number of consecutive and sequential phases & non overlapping time periods.Leila Mashkat, et. al. (2003) described that Phased Mission System (PMS) are systems supporting missions consisting of multiple, consecutive and non- overlapping operational phases. XinyuZang, Hairong Sun and Kishore S. Trivedi(1999) presented a new algorithm for reliability analysis of Phased Mission System (PMS) based on Binary Decision Diagram. The Researcher used phase algorithm to deal with the dependence across the phases and a new BDD operation to incorporate the phase algorithm of PMS. The system may be subjected to different stresses as well as different requirements as it carries out its task(s) over the course of the mission, hence affecting the life of pump component as advised by Parker (2014). Hence, system configuration, success/failure, criteria and component failure parameters may change from phase to phase. S J Dunnett and J D Andrews (2006) mentioned that the methods used for phased mission analysis are dependent upon the reparability of the system during the phases. If the system is non- repairable, fault tree based method offer an efficient solution. For repairable systems Markov methods are used to calculate the mission failure probability.Y Ma and K S Trivedi (1999) developed an algorithm for reliability analysis of phased-mission systems. Liudong Xing and Joanne Bechta Dugan (2002) suggested Generalized Phased Mission System(GPMS) for reliabilityanalysis of phased mission systems. 2 Case Study The boring machine is mounted on a structural beam which is hinged on vehicle chassis at the rear. The beam along with drilling machine is made vertical within an positional accuracy of 90 0 + 10 min. The articulation operation is carried out with a pair of hydraulic cylinders, which are operated through hydraulic power pack and control valves and “ off line oil filtration system “ etc. There are three hydraulic pumps. Out of three pumps, two are operating through vehicle engine PTO and third one is operating through a motor driven system. However, only one pump is operating at a time and other are used as “cold standby”. The operational sequence for the total system is briefly explained below:- (i)Step I – Hydraulic Output -Before starting of pump, the hydraulic oil contamination level is to be checked. If contamination level is within acceptable limit i.e. less than NAS 8, then operate the hydraulic power pack. If oil contamination level is more than NAS 8 (for the present case), then operate the Off line Filtration System and check the contamination level, else check the off line filtration system i.e. filter clogging and motor operation etc.
Transcript of Degraded Performance Analysis of Phased Mission System · system which operates throughout several...
5th International & 26th All India Manufacturing Technology, Design and Research Conference (AIMTDR 2014) December 12th–14th, 2014, IIT
Guwahati, Assam, India
278-1
Degraded Performance Analysis of Phased Mission System
Manmohan Singh1, M.D.Jaybhaye2*, S.K.Basu3
1VRDE, Vahan Nagar, Ahmednagar (MS) 414006, [email protected]
2* Prod.Engg. Dept. College of Engineering,Pune-411005, [email protected] 3Prod.Engg. Dept. College of Engineering,Pune-411005,[email protected]
Abstract
In engineering applications many of the systems are working on the criteria of phased mission system. The success
of such system is judged on the basis of its working at each phase of system and its functioning at each level. The
total success of system depends on all success paths occurring in the system. While working with the system
reliability if the system is in continuous working condition, the components in the system may get degraded due to
wear and tear and thus causing the reduction in the successful working of the system. This dynamic change in the
failure rates of components will lead to reduction in reliability value of the system. It is very essential to monitor the
change in failure rate which lead to change in reliability and to be maintained so as to have the required successful
life span of system working. In present paper an attempt is made to analyze the system with and without degrading
factors and effect of degrading factor on reliability of system. Keywords:Reliability, failure rate, degraded, phases
1 Introduction A common scenario in engineering is that of a
system which operates throughout several sequential
and distinct periods of time during which the modes and
consequences of failure differ from one another. This
type of operation is known as a phased mission, and for
the mission to be a success the system must successfully
operate throughout all of the phases.
D R Prescott, R Remenyte, Prescott, J D Andres
and C G Downes(2008)defined a “A Phased Mission is
one in which a system is required to perform a number
of consecutive and sequential phases & non overlapping
time periods.Leila Mashkat, et. al. (2003) described that
Phased Mission System (PMS) are systems supporting
missions consisting of multiple, consecutive and non-
overlapping operational phases. XinyuZang, Hairong
Sun and Kishore S. Trivedi(1999) presented a new
algorithm for reliability analysis of Phased Mission
System (PMS) based on Binary Decision Diagram.
The Researcher used phase algorithm to deal with the
dependence across the phases and a new BDD operation
to incorporate the phase algorithm of PMS. The system
may be subjected to different stresses as well as
different requirements as it carries out its task(s) over
the course of the mission, hence affecting the life of
pump component as advised by Parker (2014). Hence,
system configuration, success/failure, criteria and
component failure parameters may change from phase
to phase. S J Dunnett and J D Andrews (2006)
mentioned that the methods used for phased mission
analysis are dependent upon the reparability of the
system during the phases. If the system is non-
repairable, fault tree based method offer an efficient
solution. For repairable systems Markov methods are
used to calculate the mission failure probability.Y Ma
and K S Trivedi (1999) developed an algorithm for
reliability analysis of phased-mission systems. Liudong
Xing and Joanne Bechta Dugan (2002) suggested
Generalized Phased Mission System(GPMS) for
reliabilityanalysis of phased mission systems.
2 Case Study The boring machine is mounted on a structural
beam which is hinged on vehicle chassis at the rear.
The beam along with drilling machine is made vertical
within an positional accuracy of 900+ 10 min. The
articulation operation is carried out with a pair of
hydraulic cylinders, which are operated through
hydraulic power pack and control valves and “ off line
oil filtration system “ etc. There are three hydraulic
pumps. Out of three pumps, two are operating through
vehicle engine PTO and third one is operating through a
motor driven system. However, only one pump is
operating at a time and other are used as “cold standby”.
The operational sequence for the total system is
briefly explained below:-
(i)Step I – Hydraulic Output -Before starting of
pump, the hydraulic oil contamination level is to be
checked. If contamination level is within acceptable
limit i.e. less than NAS 8, then operate the hydraulic
power pack. If oil contamination level is more than
NAS 8 (for the present case), then operate the Off line
Filtration System and check the contamination level,
else check the off line filtration system i.e. filter
clogging and motor operation etc.

Degraded Performance Analysis of Phased Mission System
(ii)Step II – Auto Leveling of Vehicle Platform
Once the hydraulic output is available from step I, than
operate the Auto Leveling system and check the
leveling of platform. If the platform level is within
specified level limits i.e. + 10 min then lock the
outriggers movement by operating the outriggers
Else rectify the leveling system. Check again the
platform leveling and go to Step III.
(iii)Step III – Articulation of Beam along with
Boring Machine - Once the platform is made leveled
and stabilized, then articulate the tilt beam along with
drilling machine, through a pair of hydraulic cylinders
and hydraulic power pack. Check the verticality of the
tilt beam to the desired accuracy i.e.
rectify the system.
Figure 1 (a) Reliability Block Diagram
Figure 2 Fault Tree Diagram for Phased Mission System
Degraded Performance Analysis of Phased Mission System
Auto Leveling of Vehicle Platform -
Once the hydraulic output is available from step I, than
operate the Auto Leveling system and check the
leveling of platform. If the platform level is within
10 min then lock the
outriggers movement by operating the outriggers sleeve.
Else rectify the leveling system. Check again the
Articulation of Beam along with
Once the platform is made leveled
the tilt beam along with
drilling machine, through a pair of hydraulic cylinders
and hydraulic power pack. Check the verticality of the
tilt beam to the desired accuracy i.e. + 10 min, else
The study considered is for Vertical Borer
having following three phases for final operation.
(i) Phase I: Hydraulic output
(PA, PB, PC,) are operating in parallel.
(ii) Phase II: Auto leveling system
addition to hydraulic pumps (3 Nos.) outrigger cylinders
(OC) and Outrigger cylinder direction control valves
(CVO) are also operating.
Phase III: Articulation operation -
hydraulic pumps (3 Nos.), tilt Cylinders (TC) and tilt
Cylinder direction control valves (CVT) are also
operating. The Reliability Block Diagram for three
phases of the system is shown in Fig. 1
Boring Machine is shown in Fig. 1(b)
Reliability Block DiagramFig. 1(b) Boring Machine
Figure 2 Fault Tree Diagram for Phased Mission System
278-2
The study considered is for Vertical Borer Machine
having following three phases for final operation.
Phase I: Hydraulic output - Here the pumps
,) are operating in parallel.
Phase II: Auto leveling system - Here, in
addition to hydraulic pumps (3 Nos.) outrigger cylinders
trigger cylinder direction control valves
- Here, in addition to
3 Nos.), tilt Cylinders (TC) and tilt
Cylinder direction control valves (CVT) are also
Block Diagram for three
phases of the system is shown in Fig. 1(a) and the
Boring Machine is shown in Fig. 1(b).

5th International & 26th All India Manufacturing Technology, Design and Research Conference (AIMTDR 2014) December 12th–14th, 2014, IIT
Guwahati, Assam, India
278-3
3 Reliability Analysis of Fault Tree
Diagram with conventional method From the reliability block diagram shown in Fig. 1
the “fault tree diagram” (FTA) is constructed using the
“event” and “gates” as shown in Fig. 2.
The detailed calculations for above along with FTA
diagram are given below:-
Probability of Failure for major component
i. Hydraulic Pump:Failure Rate λ = 10 x 10-6
/hr ,
Reliability (R) = e - λ.t
, Considering time (t) for 100
hrs
R = e -10 x 10-6 x 100
= 0.999000499
Q = Failure probability (Unreliability) = QPump=10-3
ii. Outrigger Cylinder (OC): Failure rate =1 x 10⁻⁸
/hr, R=0.999999 (For 100 hours)
Qoc =1 – 0.999999= 10-6
iii. Similarly, Outrigger cylinder valve :λ =1 x 10⁻⁶
/hr,
QCVO =10-4
iv. Tilt Cylinder (TC) :λ=0.5 x 10⁻⁸
/hr (Being
multistage), QTC=1 x 10⁻⁶
v. Tilt Cylinder Valve (CVT) :λ=1 x 10⁻⁶
,QCVT=1 x
10-4
4 Reliability Analysis of FTA under study
using Phased Mission Technique The conventional method for calculating the
reliability which is obtained by the multiplication of the
reliabilities of each of the individual phases cannot be
used for the Phased Mission System since in the
conventional system reliability analysis involves the
false assumption that the phases are independent and all
components are in the working system at the beginning
of each phase and so results obtained give an
appreciable over prediction of system reliability.
R A La Band and J D Andrews (2004) mentioned
that for phased mission system the component failure
event in each phase of the fault tree are to be replaced
by an OR combination of the failure events that end all
preceding phases. For example the pump A in phase II
would be represented by the OR of failure of component
in phase I ,A1 and in phase II, A2 since the component
are not repairable. Similarly in phase III the PA is
having OR gate with three event of failures i.e A3. The
same method is applied for other two pumps also. This
transforms the original multi phase mission into an
equivalent single phase mission as shown in Fig. 3.
The overall mission failure in phased mission of
FTA is calculated as follows :-
(i) Probability of Pumps failure in Phase Mission for
Phase II=(PA1 U PA2) x (PB1 U PB2) x (PC1 U PC2)
Here, PA1 U PA2 =PA1+ PA2 - PA1 x PA2
Considering same value of failure rate initially,
PA1= PA2 = 10-3
PA1 U PA2 =10-3
+ 10-3
- 10-3
x 10-3
=2 x 10⁻³
- 10-6
PA1 U PA2=1.999 x 10⁻³
Similarly, PB1 U PB2 = PC1 U PC2 = 1.999 x 10⁻³
Overall probability of Pumps Failure Q2
Q2=1.999 x 10-3
x 1.999 x 10-3
x 1.999 x 10-3
Q2=7.988 x 10⁻⁹
(ii)Probability of Pumps failure in Phased Mission Q3
for Phase III
Overall probability of Pumps failure Q3 = PA1 U PA2 U
PA3
Q3= PA1+ PA2+ PA3- PA1x PA2- PA1x PA3- PA2x PA3+PA1x
PA2xPA3
Considering - PA1 = PA2 =PA3 = 10-3
Q3=2.996999 x 10⁻³
Similarly, PB1 U PB2 U PB3 = PC1 U PC2 U PC3 =2.996999
x 10-3
Overall probability of Pumps failure Q3
Q3=2.996999 x 10-3
x 2.996999 x 10-3
x 2.996999 x10-3
Q3=2.691 x 10⁻⁸
Overall Mission Failure of Phased Mission
QMssion= P(QPhIU QPhII UQPhIII)
PA1=P(QPhI)+P(QPhII)+P(QPhIII)–P(QPhI)xP(QPhII)–
P(QPhI)xP(QPhIII)–P(QPhIIxQPhIII) + P(QPhIx QPhIIx QPhIII)
WhereP (QPhI)=10-3
x 10-3
x 10-3
=10-9
,P(QPhII)= 7.988 x
10-9
, P(QPhIII)=2.691 x 10⁻⁸
QMission= 3.5898 x 10⁻⁸
– 2.498 x 10⁻¹⁶
+ 2.489 x 10⁻²⁵
QMission = 3.589 x 10⁻⁸
5 Reliability Analysis using Phased Mission
Techniques and considering derating of
pumps
In this section efforts are made to demonstrate, how
the reliability is reduced due to derating of major
components in the system here, an example of hydraulic
pump is considered.
The hydraulic pump is selected based on pressure,
flow rate and environmental conditions etc. However,
the life of the pump, hence reliability of the pump, is
effected with duty cycle and many other parameters like
fluid conditions, temperature and pressure peaks etc.
“Parker” (2014)who is a leading manufacturer of the
pump has given the details of pump life in various
ranges (4)
. Following details are given:-
(i) As the operating pressure is increased the
pump life is decreased.
(ii) An average displacement reduction of 15%
increase the bearing life by approximately 50%
(iii) As the operating rpm is increased the pump life
is decreased.
In the present case study, following derating of
pumps have been considered, based on hydraulic
loading of pumps in phase II (Auto Leveling) and phase
III (Articulation operation). Derating of pump is
summarized as follows :-
Phase I -No derating since hydraulic output is at no
load
Phase II -10% ( Failure rate is 110% )

Degraded Performance Analysis of Phased Mission System
278-4
Phase III -20% ( Failure rate is 120% )
Hence, Reliability of pump failure in phase I
remains same as 10-3
Reliability of pumps failure Q2’
Probability of Pumps failure (Q2’ ) for Phase II -
With De-rating of 10%
Consideringλ= 1.1 (10 x 10-6
) (failure rate of each
pump), λλλλ= 1.1 x 10⁻⁵
Reliability of pump failure for 100 bar mission time
P=���.�������� =0.998900604
QPA1=1 - 0.998900604
QPA1=1.0993 x 10⁻³≈ 1.1 x 10
-3
QPA2=1.1 X 10⁻³
PA1 U PA2 =QPA1 + QPA2 - QPA1 x QPA2
PA1 U PA2 =10-3
+ 1.1 X 10⁻³
– 10-3
x 1.1 X 10-3
PA1 U PA2=2.0989 x 10⁻³
Overall probability of Pumps failure
Q2’ = 2.0989x 10-3
x 2.0989 x 10-3
x 2.0989 x 10-3
Q2’=9.246 x 10⁻⁹
Probability of pump failure in Phase III
Probability of Pumps Failure Q3’ in Phase Mission
Phase III
λλλλ =1.2 x 10 x 10-6
=1.2 x 10⁻⁵
R=���.�������
R=0.998800719
QPA3=1 - 0.998800719
QPA3=1.19928 x 10⁻³≈1.2 x 10
-3
Considering De-rating of Pumps
>10% in Phase II
>20% in Phase III
PA2 = 110% (10-3
) = 1.1 x 10⁻³
PA3 = 120% (10-3
) = 1.2 x 10⁻³
Overall probability of Pumps failure Q3’
QPA=QPA1 + QPA2 + QPA3 - QPA1 x QPA2 - QPA1 x
QPA3- QPA2 xQPA3 – QPA1 x QPA2 x QPA3
Here, QPA1= 10-3
QPA = 10-3
+ 1.1 x 10⁻³
+ 1.2 x 10⁻³
– (10-3
x 1.1 x 10-3
) –
(10-3
x 1.2 x 10-3
) – (10-3
x 1.1 x 10-3
x 1.2 x 10-3
)
QPA= 3.2963 x 10⁻³
Q3’ = QPA x QPB x QPC = 3.2963x10-3
x3.2963 x10-
3x3.2963x10
-3
Q3’ = 35.806 x 10⁻⁹
Acomputer program has been prepared to
demonstrate relationship between pump derating and
failure probability/reliability. The details of program in
Excel are given below:-
Considering the derating of the pumps varying from
5% to 40% in different phases following formulae are
used in Excel sheet for preparation of final result &
graph
PA - Derating % of Pump A in Phase I & Phase II (from
5% to 40%)
PA1=0.00100
PA2=PA1 + (Value of derating % of pump / 100) x PA1
PA3=PA1 + (Value of derating % of pump / 100) x PA1
PA=(PA1 + PA2 + PA3) – (PA1 x PA2 ) - (PA1 x PA3 ) - (PA2 x
PA3 ) - (PA1 x PA2 x PA3)
PB = Derating % of Pump B in Phase I & Phase II (from
5% to 40%)
PB1=0.00100
PB2=P B1 + (Value of derating % of pump / 100) x P B1
PB3=P B1 + (Value of derating % of pump / 100) x P B1
PB = (PB1 + PB2 + PB3) – (PBB1 x PB2 ) - (PB1 x PB3 ) - (PB2
x PB3 ) – (PB1 x PB2 x PB3)
PC = Derating % of Pump C in Phase I & Phase II (from
5% to 40%)
PC1=0.00100
PC2=P C1 + (Value of derating % of pump / 100) x P C1
PC3=P C1 + (Value of derating % of pump / 100) x P C1
PC = (PC1 + PC2 + PC3) – (PBC1 x PC2 ) - (PC1 x PC3 ) - (PC2
x PC3 ) – (PC1 x PC2 x PC3)
Q3’= (PA x PB x PC)
R= 1- Q3’
Considering the derating of the pumps varying from
10% to 40% in different phases the corresponding
failure probability is shown in Table 1. The
corresponding graph is shown in Fig. 4. It is seen
probability is increasing and hence, the reliability is
decreasing as the derating of pump is increased.
6 Comparison of Failure probability Values
The failure probability values based on
Conventional Technique of FTA,Phased Mission
Technique & Phased Mission with derating of hydraulic
pump as discussed and obtained from section 3, 4 & 5
have been summarized and presented in Table.2
Table 2 Comparison of Failure probability for FTA Sr
No
Failure probability of overall system
Simple
FTA
Technique
FTA with Phased
Mission
Technique
without pump
derating
FTA with Phased
Mission and
pump derating
into
consideration
1. 2.0199 x
10-4 3.589 x 10⁻⁸ 4.6051 x 10⁻⁸

5th International & 26th All India Manufacturing Technology, Design and Research Conference (AIMTDR 2014) December 12th–14th, 2014, IIT Guwahati, Assam, India
278-5
Table 1 The details of Pumps deratingVs Failure Probability & Reliability
Parameter PA1 PA2 PA3 PB1 PB2 PB3 PC1 PC2 PC3 PA PB PC Q3' R
Without Derating 0.001 0.001 0.001 0.001 0.001 0.001 0.001 0.001 0.001 0.002997 0.002997 0.002997 2.69E-08 0.999999973
Derating
5% PH1 10% PH2 0.001 0.00105 0.0011 0.001 0.00105 0.0011 0.001 0.00105 0.0011 0.003147 0.003147 0.003147 3.12E-08 0.999999969
Derating 10% PH1
15% PH2 0.001 0.0011 0.00115 0.001 0.0011 0.00115 0.001 0.0011 0.00115 0.003246 0.003246 0.003246 3.42E-08 0.999999966
Derating 15% PH1
20% PH2 0.001 0.00115 0.0012 0.001 0.00115 0.0012 0.001 0.00115 0.0012 0.003346 0.003346 0.003346 3.75E-08 0.999999963
Derating 20% PH1
25% PH2 0.001 0.0012 0.00125 0.001 0.0012 0.00125 0.001 0.0012 0.00125 0.003446 0.003446 0.003446 4.09E-08 0.999999959
Derating 25% PH1
30% PH2 0.001 0.00125 0.0013 0.001 0.00125 0.0013 0.001 0.00125 0.0013 0.003546 0.003546 0.003546 4.46E-08 0.999999955
Derating 30% PH1
35% PH2 0.001 0.0013 0.00135 0.001 0.0013 0.00135 0.001 0.0013 0.00135 0.003646 0.003646 0.003646 4.85E-08 0.999999952
Derating 35% PH1
40% PH3 0.001 0.00135 0.0014 0.001 0.00135 0.0014 0.001 0.00135 0.0014 0.003745 0.003745 0.003745 5.25E-08 0.999999947
Figure 3 Equivalent Single Phase Mission Fault Tree Diagram
Figure 4 Derating of Pumps Vs failure probability & reliability

Degraded Performance Analysis of Phased Mission System
278-6
7 Conclusions In this work an attempt is made to analyze the
system using three methods and results are discussed.
(i) In the conventional fault tree method, the
probability of the system failure is observed
overestimated as 2.0199 x 10⁻⁴ and found very
high. This may be referred for safe design
without interdependency of functioning.
(ii) After modification of conventional fault tree with
phased mission technique the assessment is more
realistic and hence probability of failure is
comparatively lowi.e.3.589 x 10-8.
(iii) Further, with incorporation of “derating concept”
the probability of the system failure is observed
little high (28.3%).
References
DR Prescott, RRemenyte, Prescott, S.Reed, JD Andrews
and CG Downes; “A Reliability Analysis Method using
Binary Decision Diagrams in Phased Mission
planning,Proc. I MechE ,J. Risk and Reliability, Vol.
223 Part O, Dec. 2008 , pp 133 – 143.
Leila Meshkat, Liudong Xing; Susan K. Donohue; and
Yong Ou, An Overview of the Phase-Modular Fault
Tree Approach to Phased Mission System Analysis,
Proceedings of the 1stInternational Conference on
Space Mission Challenges for Information Technology
(SMC-IT), Pasadena, California, July 2003, pp. 393-
398.
XinyuZang, Hairong Sun and Kishore S. Trivedi,“A
BDD-Based Algorithm for Reliability Analysis of
Phased-Mission Systems,IEEE Transactionson
Reliability Vol. 48, No. 1 March 1999, pp 50–60.
Parker Hydraulic Pumps & Motors catalog,Parker
Hannifin Corp 2014 .
S J Dunnett and J D Andrews ,“A Binary Decision
Diagram Method for Phased Mission Analysis Of Non-
repairable Systems,Journal of Risk and Reliability,
Proc. IMechE Vol. 220 Part O: 2006, pp 93 – 104.
Y Ma and K S Trivedi, An algorithm for reliability
analysis of phased-mission systems, Reliability
Engineering & System Safety, Vol. 66 , 1999, pp 157-
170.
Liudong Xing and Joanne Bechta Dugan,” Analysis of
generalized Phased Mission System Reliability,
Performance and Sensitivity, IEEE Transactions on
Reliability , Vol. 51, No.2, June 2002, pp 199-211.
R A La Band and J D Andrews,“Phased Mission
Modelling using fault tree analysis”,J Process
Mechanical Engineering, Proc. Instn Mech. Engrs Vol.
218 Part E , Feb. 2004, pp 1-9.