Degradation of sodium isobutyl xanthate (SIBX) in marine ...
17
IFE/F-2020/ Degradation of sodium isobutyl xanthate (SIBX) in marine water.
Transcript of Degradation of sodium isobutyl xanthate (SIBX) in marine ...
IFE/F-2020/
Degradation of sodium isobutyl xanthate (SIBX) in marine water.
ii
Report number
IFE/F-2020/ Availability:
Limited
Date: 2020.02.24
Revision:
DOCUS ID:
Number of pages: 22
Client: Nordic Mining AS
Title: Degradation of sodium isobutyl xanthate (SIBX) in marine water.
Summary: The present document reports the findings from experiments performed to evaluate the kinetics of degradation of the flotation collector sodium isobutyl xanthate (SIBX) in marine water. Both, the decay of the target compound SIBX and the production of carbon disulphide (CS2) have been tracked in time-course experiments during 28 days. In order to distinguish between two anticipated degradation pathways, hydrolysis and biological degradation, the decay of SIBX in marine water has been tracked through experiments in sterile and non-sterile water from Førdefjorden area. The experiments are inconclusive about the primary mechanism governing the decay of SIBX due to the surface-active nature of the compound. Apart from CS2 one other potential transformation product was found and tentatively identified.
Prepared by (digitally signed):
Laura Ferrando Climent
Reviewed by (digitally signed):
Mario Silva Sissel Opsahl Viig
Authorised by (digitally signed):
Christian Dye
Institute for Energy Technology
P.O. Box 40, NO-2027 Kjeller, Norway / P.O. Box 173, NO-1751 Halden Telephone: +47 63 80 60 00/ +47 69 21 22 00
http://www.ife.no / [email protected]

iii
Contents 1 Introduction .................................................................................................................................... 4
2 Methods and Experimental set-up ............................................................................................. 5
2.1 Experimental set-up ............................................................................................................. 5
2.2 Analytical methods ............................................................................................................... 7
3 Results and Discussion ............................................................................................................... 9
4 Conclusions ................................................................................................................................. 16
5 References .................................................................................................................................. 17
4
1 Introduction Mining chemicals are applied worldwide, and their use is, in general, subject to a legal framework of environmental regulations, just as most chemicals used in other industries. The application of chemicals in mining processes in the Nordic region may be subject to specific environmental requirements adapted to the naturally low temperature conditions. The Nordic environment is particularly sensitive to contaminants and in the cold climate, many natural process rates are slower [1, 2]. Marine species may exhibit slower growth and mature at a later age; thus, the accumulation of chemicals within the organisms may take place over a longer time span. Furthermore, many Nordic species contain more fatty tissue than species from temperate climate zones. All these factors combined result in a higher potential for bioaccumulation of lipophilic contaminants [1]. Chemicals may degrade more slowly at the low temperatures (below 10ºC). Consequently, the standard tests for mining chemicals performed under temperate climate conditions may need adjustment when applied for environmental assessment under Nordic conditions, for example, by use of extra sensitivity factors [3]. Xanthate compounds are well-known low-cost and efficient collectors for the flotation beneficiation of sulphide ores bearing Cu, Pb, Ni, Zn, Ti and Mo as well as precious metals[2]. The decomposition of xanthates originates toxic compounds, such as carbon disulphide (regulative permissible limit up to 1ppm). Prior studies focused on the evaluation of the decomposition of xanthate were mostly performed in aqueous solutions at mild-medium temperatures (20 up to 50ºC). Understanding the chemical fate of mining reagents in the Nordic region is of critical importance, however not much information has been made available about the decomposition of xanthate at low temperatures [2]. Several authors report that the decrease of the amount of xanthate in a solution may not be exclusively due to decomposition itself [2, 4]. Reports noted that oxygen only had negligible effect on the decomposition of xanthate, which allows for the degradation study to be conducted in ambient atmosphere. The effect of temperature on the decomposition kinetics was demonstrated via the Arrhenius Law [2, 4]. These results differ from the thermal decomposition studies of xanthate as solid, as the types of decomposition products generated from xanthate in aqueous solutions are fewer at various temperatures [2, 4]. The major product from the decomposition of xanthate in aqueous solutions at various temperatures is carbon disulphide (CS2), although no study has been reported at temperatures below 20ºC. The effect of pH on the decomposition of xanthate in aqueous solutions has also been investigated relatively more than any other factor in literature [2, 4-7]. It was generally thought that the decomposition is much stronger under acidic conditions than that under alkaline conditions [2], however, multiple reactions were believed to be associated with the decomposition process in alkaline solutions as opposed to the dominance of a single step reaction in acidic solutions. It is under acidic conditions that xanthate decomposed to CS2, whereas under alkaline conditions it could also form dixanthogen, per xanthate, monothio- and dithio- carbonates, and trithiocarbonate. Therefore, xanthates decompose in aqueous solution by dissociation, oxidation and hydrolysis. Hydrolytic decomposition is the main reaction in alkaline solutions while the other two reactions occur in acidic solutions [2] These are the three decomposition pathways of xanthates described in ECHA database for aqueous solutions: A. Xanthates dissociate forming alkali metal cations and xanthate anions. The solution undergoes further hydrolysis to xanthic acid which decomposes into carbon disulphide and alcohol. Reaction A) Dissociation into xanthic acid:
ROCS2Na + H2O → ROCS2H + NaOH ROCS2H → CS2 + ROH
B. Xanthate is oxidised to dixanthogen. The extent of this reaction is very small and dependent on the pH. Equilibrium is reached after about 5–10% of the xanthate is oxidised, and the reaction increases with a fall in the pH.
5
Reaction B) Oxidation to dixanthogen:
2ROCS2 − + H2O + 1/2O2 → (ROCS2)2 + 2 OH−
C. In neutral and alkaline media, xanthates decompose by hydrolytic decomposition. Reaction C) Hydrolytic decomposition:
6ROCS2 − + 3H2O → 6ROH + CO3 2− + 3CS2 + 2CS3 2− Further hydrolysis of sodium trithiocarbonate to sodium carbonate and hydrogen sulphide, as well as carbon disulphide to carbon dioxide and hydrogensulphide may occur. The reaction is catalysed by the alcohol formed from the xanthic acid and is self-accelerating. Reaction C is the main reaction in alkaline solutions while A and B occur at acidic conditions. In mining processes, reaction C is expected to be the principal decomposition pathway and carbon disulphide the principal decomposition product. Part of the carbon disulphide formed may decompose further to carbonate and thiocarbonate salts, some of it may evaporate and some may build up in the xanthate solution. Once the solubility of carbon disulphide is exceeded it forms a separate layer below the sodium isobutyl xanthate solution. Reactions A and B are minor and require acidic conditions. Reaction C proceeds in neutral or alkaline pH and is self-accelerating, being catalysed by the alcohol formed as a product. Its rate increases with concentration of the reagents and with temperature, from 1.1%/day at 20 °C to 4.6%/day at 40 °C for a 10% solution at pH=10. A decrease in pH from 10 to 6.5 increases the decomposition rate from 1.1%/day to 16%/day. Decomposition is also accelerated by the presence of metals, such as copper, iron, lead or zinc, which act as a catalyst. The rate of decomposition of xanthate was reported to follow first order kinetics regardless of pH [2, 4]. It has been shown that multiple reactions in parallel or in sequence accompany the reaction of decomposition, but the generation of CS2 still followed first order kinetics. It is, however, unclear whether the reaction of decomposition is unimolecular or bimolecular. It remains uncertain as to whether a maximum decomposition degree existed. Other authors derived a maximum level when pH reached a certain low level while others did not [2, 4]. Under alkaline conditions, Tipman et al. found that the decomposition remained almost constant [8], while Finkelstein observed that it still decreased with pH [5]. Despite the findings listed above, further research is necessary to provide more comprehensive understanding of decomposition under the control condition as well as to clarify the confusions and contradictions. The goal of the present report is to provide information about the degradation of the flotation reagent SIBX (isobutyl xanthate) in marine water at simulated Nordic climate conditions. This improves the quality of the environmental risk assessment of the chemical that will potentially be used in the mining industry in Norway.
2 Methods and Experimental set-up
2.1 Experimental set-up An experimental setup to explore the degradation of SIBX has been developed. The technical product Sodium Isobutyl Xanthate (SIBX) from Redox ® (90% purity from the material datasheet) was provided by Nordic Mining AS. The seawater employed in the study was sampled in Førdefjorden area at 20 meters of distance from the coast. Samples were collected in PET bottles without air gap and kept at 5ºC.
6
All the experiments were performed simultaneously in a thermostatic cabinet set at 9.5 ± 1 ºC, darkness, using seawater from Førdefjorden, 28 days of exposure, and SIBX initial concentration of approximately 10 mg/L. All the assays were performed in the dark and under smooth orbital stirring. The selection of these conditions was based on the absence of light expected at the bottom of the fjord where the submarine tailing disposal (STD) is going to take place and the low-turbulence stirring intends to simulate the water renovation in the interface layer between the sediments and the water.
The setup was designed with the overall goal of avoiding sample manipulation to minimize eventual errors due to manipulation of different reactors. Such a process becomes of crucial importance because CS2 is a highly volatile gas and therefore the reactors where its release takes place should not be opened.
Three parent solutions were prepared for the experiments A (sterile marine water), B (marine water) and C (ultrapure water). To reach sterile conditions in experiment A, the marine water was heated up to 90 ºC for 5 minutes prior to its use. Afterwards, these parent solutions were split in single small-scale experiments (40 vials for A, for B and for C), with the same concentration and the same volume inside the vials (same air gap volume). The 40 vials were subject to the same experimental conditions (thermostatic cabinet at 9.5 ± 1 ºC, darkness and orbital shaking). This strategy was employed to incorporate the uncertainty in the experiments but at the same time reduce the errors in the collection of samples. Therefore, small vials (size 1.5 mL) and medium vials (size 10 mL) with hermetic septum were used for experiments to be analysed by LC-MS and GC-MS respectively. For the SIBX degradation analysis: every small vial taken from the cabinet was directly injected in the LC-MS for SIBX identification as well as the transformation products (TPs). For the CS2 measurements: every medium vial taken from the cabinet was exposed to a solid phase microextraction (SPME) fibre (method described in section 2.2.).
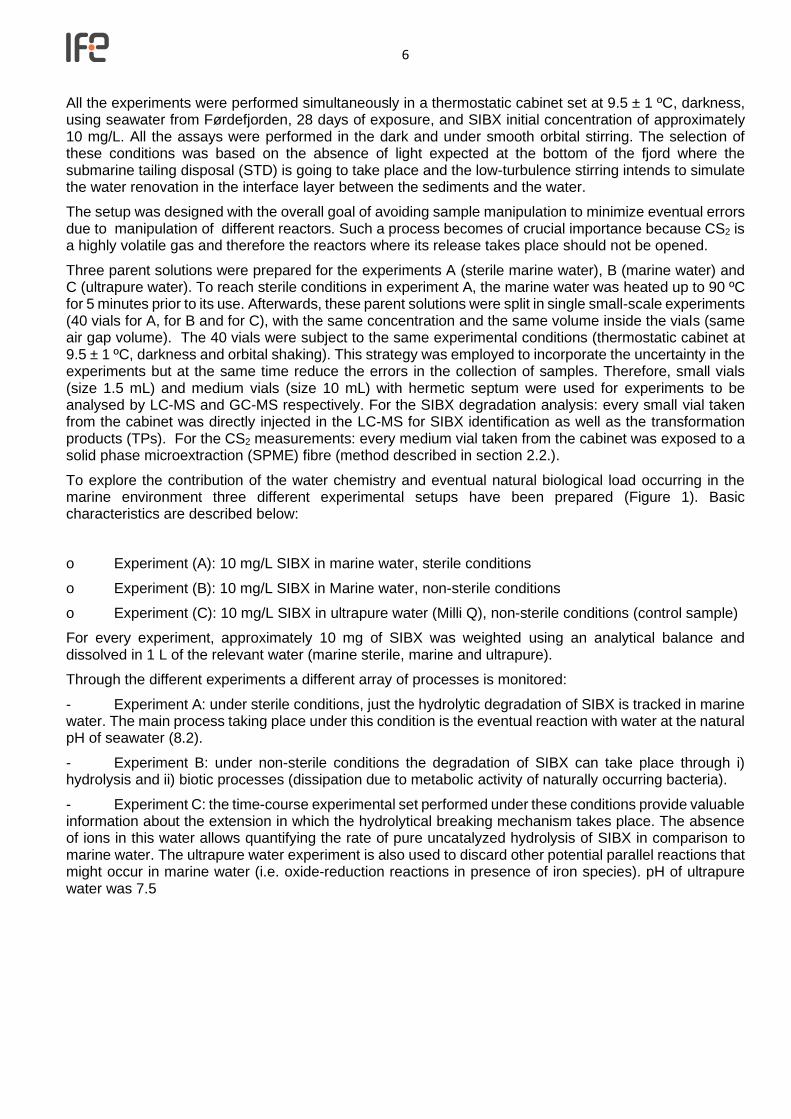
To explore the contribution of the water chemistry and eventual natural biological load occurring in the marine environment three different experimental setups have been prepared (Figure 1). Basic characteristics are described below:
o Experiment (A): 10 mg/L SIBX in marine water, sterile conditions
o Experiment (B): 10 mg/L SIBX in Marine water, non-sterile conditions
o Experiment (C): 10 mg/L SIBX in ultrapure water (Milli Q), non-sterile conditions (control sample)
For every experiment, approximately 10 mg of SIBX was weighted using an analytical balance and dissolved in 1 L of the relevant water (marine sterile, marine and ultrapure).
Through the different experiments a different array of processes is monitored:
- Experiment A: under sterile conditions, just the hydrolytic degradation of SIBX is tracked in marine water. The main process taking place under this condition is the eventual reaction with water at the natural pH of seawater (8.2).
- Experiment B: under non-sterile conditions the degradation of SIBX can take place through i) hydrolysis and ii) biotic processes (dissipation due to metabolic activity of naturally occurring bacteria).
- Experiment C: the time-course experimental set performed under these conditions provide valuable information about the extension in which the hydrolytical breaking mechanism takes place. The absence of ions in this water allows quantifying the rate of pure uncatalyzed hydrolysis of SIBX in comparison to marine water. The ultrapure water experiment is also used to discard other potential parallel reactions that might occur in marine water (i.e. oxide-reduction reactions in presence of iron species). pH of ultrapure water was 7.5
7
Figure 1. Sketch of the experimental set-up.
2.2 Analytical methods The characterization of the decomposition of SIBX was performed using three complementary approaches based on: i) tracking of the SIBX degradation in the solution through matrix-match calibration using UPLC-HRMS (Orbitrap®), ii) tracking of the formation of CS2 through matrix-match calibration using SPME-GC-MS, and iii) identification of the transformation products (TPs) from SIBX in the solution using UPLC-HRMS (Orbitrap®). SIBX analysis and TPs All collected samples were analysed in a liquid-chromatography system coupled to a high-resolution mass spectrometer Orbitrap-QExactiveTM (Thermo Fisher Scientific). Briefly, 10 µL of sample were injected in a SM-C18 column (150 mm × 4.6, 2.0 mm ID, 5 µm Sherzo, Imtakt) at 5 ºC. The mobile phases used were: (A) 10 mM ammonium formate in water at pH 9.5 and (B) acetonitrile. The optimized chromatographic gradient was performed at a flow rate of 0.5 mL/min as follows: initial mobile phase composition (95% A) held for 1 min, followed by a decrease in composition A to 5% within 9 min, then to 0% in 3 min, held for 2 min, and up to 95% in 1 min and held for 1 min. The high-resolution mass spectrometer was equipped with a heated electrospray ionization source (HESI-II). Samples were acquired in negative ionization mode, using full scan data acquisition from m/z 50 to 150 range at a resolving power of 70,000 FWHM. For structural elucidation of TPs, ion fragmentation was performed using another method in data dependent (DD) acquisition mode MS/DD-MS2 (TOP 3) at 35,000 FWHM from m/z 50 to 150 range. The conditions for HESI-II were designed as follows: spray voltage at 3.5 kV, source heater temperature at 300 ˚C, capillary temperature at 350 ˚C, sheath gas flow at 40 and auxiliary gas flow at 20 (arbitrary units). Fragmentation was performed in higher-energy collisional dissociation (HCD) at a normalized collision energy of 55 eV, dynamic exclusion of 10 s and an isolation window of 2.0 m/z. The entire system was controlled via Xcalibur 3.0 software.
8
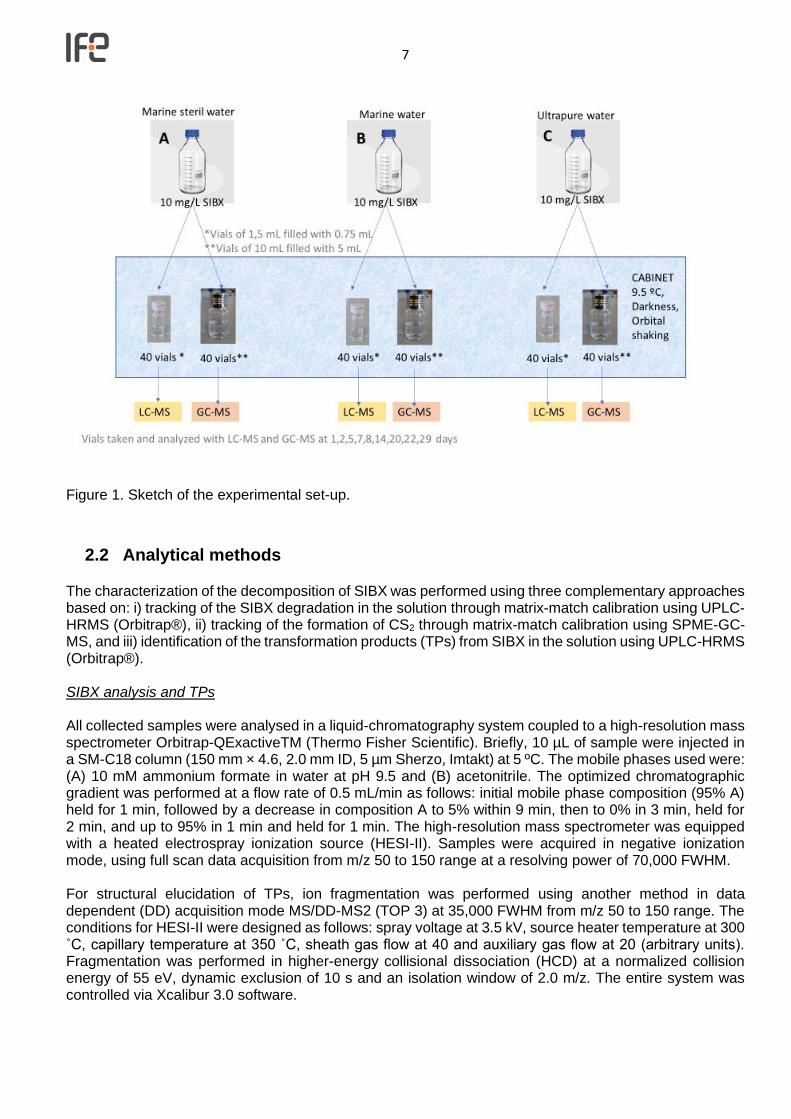
Data collected (chromatograms and mass spectra files) was processed through Compound Discoverer 2.1 software (Thermo Scientific) using an adapted methodology previously published [9]. Briefly, input files were loaded together with the chemical structure of the isobutyl xanthate and the chemical reactions to automatically generated a list of predicted TP exact masses to be found in samples. Automatic data processing started by filtering MS data between 100 and 150 Da and from 1 to 12 min with a S/N ratio of 3. To compensate small differences in retention times, chromatographic alignment was performed by using a mass tolerance error of ± 5 ppm and a maximum retention time shift of 0.3 min. Immediately after, the list of predicted TP exact masses was matched with the chromatographic peaks filtered in experimental data files. CS2 analysis Prior to sample injection two different analytical techniques were tested in order to find the most selective and sensitive method of analysing the CS2: Conventional Headspace (HS) and Solid-Phase Micro extraction (SPME). In HS analysis, a sample is sealed inside a HS vial, and the CS2 in the sample is allowed to reach equilibrium between the gas and liquid phases using temperature, agitation, and time. The vial is pressurized, and a portion of the headspace is sampled for analysis (figure 2).
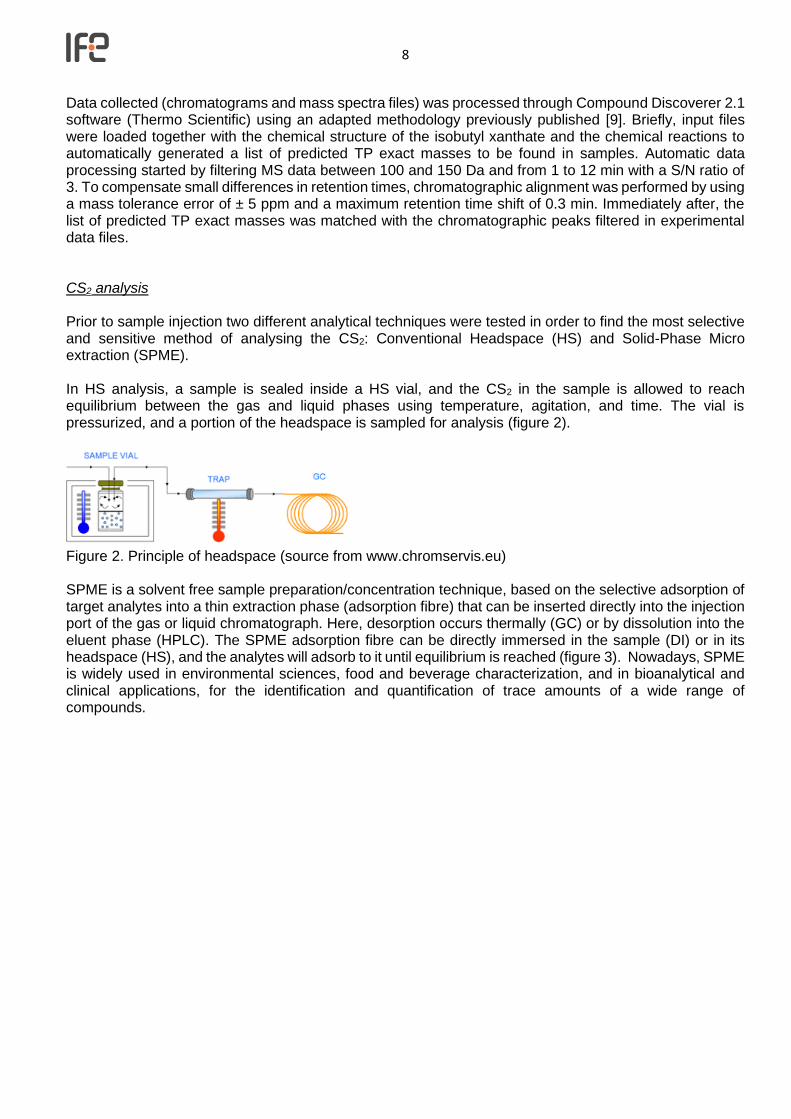
Figure 2. Principle of headspace (source from www.chromservis.eu) SPME is a solvent free sample preparation/concentration technique, based on the selective adsorption of target analytes into a thin extraction phase (adsorption fibre) that can be inserted directly into the injection port of the gas or liquid chromatograph. Here, desorption occurs thermally (GC) or by dissolution into the eluent phase (HPLC). The SPME adsorption fibre can be directly immersed in the sample (DI) or in its headspace (HS), and the analytes will adsorb to it until equilibrium is reached (figure 3). Nowadays, SPME is widely used in environmental sciences, food and beverage characterization, and in bioanalytical and clinical applications, for the identification and quantification of trace amounts of a wide range of compounds.
9
Figure 3. Principle of SPME (source from omicsonline.org) The amount of analyte extracted depends on its partitioning coefficient in relation to the fibre/matrix, the temperature of the system, time of exposure and initial concentration in the sample. Since the experiments were studying the degradation of SIBX with the consequent release of CS2, the temperature of the sample during the analysis played a key role. The temperature during HS may provoke unwanted release of CS2 during the analysis, making it difficult to identified how much CS2 is actually generated by the process of SIBX degradation and not due to the increase of temperature during the analysis. Therefore, HS showed some potential drawbacks in the analysis of CS2, and the preferred method for this study was SPME. In the SPME, the CS2 was adsorbed in the fibre and immediately analysed by manual injection in the GC-MS. Every medium vial was taken from the cabinet and exposed to the SMPE fibre (assembly Carboxen/Polydimethylsiloxane (CAR/PDMS) 75 µm Supelco ® purchased from Sigma-Aldrich Norway). for 10 minutes inside of the same cabinet (temperature 10ºC and darkness). The fibre exposed to the vapor phase in the vial was injected manually in the GC-MS to monitor the CS2 generated. The calibration was performed by spiking marine and ultrapure water with CS2 and allowing the system to reach equilibrium in the same cabinet that was used in the experiments with SIBX. Through this calibration it was possible to correlate the amount of CS2 generated. All collected samples using SPME were analysed on a Thermo Scientific Trace 1310 gas chromatograph equipped with the column Restek Rtx-5MS (30 m X 0.25 mm X 0.25 µm ID) and coupled to a triple quadrupole mass spectrometer Thermo Scientific TSQ 8000. The oven used a temperature program as follows: 50 ºC initial temperature maintained for 2 minutes, followed by a ramp of 15 ºC/min to 290 ºC, kept at this value for 7 min. The carrier gas was helium at a constant flow of 1 mL/min. The sample was injected at 250 ºC. The MS was operated in electron impact (EI) ionization mode (+70 eV) and the signals recorded in selected ion monitoring (SIM) mode. The temperatures of the ion transfer line and ion source of the MS were 250 ºC and 240 ºC, respectively.
3 Results and Discussion Accuracy of the method was expressed by [(mean observed concentration)/(spiked concentration)]×100 and was determined at the 1 mg/L of standard solution by duplicate. The precision of the method was evaluated from three repeated injections of 1 mg/L standard mixture during the same day, which is defined as the intra-day precision (repeatability), and during three successive days that corresponds to the inter-
10
day precision (reproducibility). Detection limits (LOD) and quantification limits (LOQ) were determined as the minimum detectable amount of the analyte with a signal-to-noise of 3 and 10, respectively (table 1). Table 1. Quality parameters for the LC-MS method.
Compound Exactitude (%) ± SD
Precision Intra-day (RSD%, n=2)
Precision Inter-day (RSD %, n=3)
LOD (ng/L)
LOQ (ng/L)
SIBX 100.7 ± 9.7 0.5 9.53 3 10
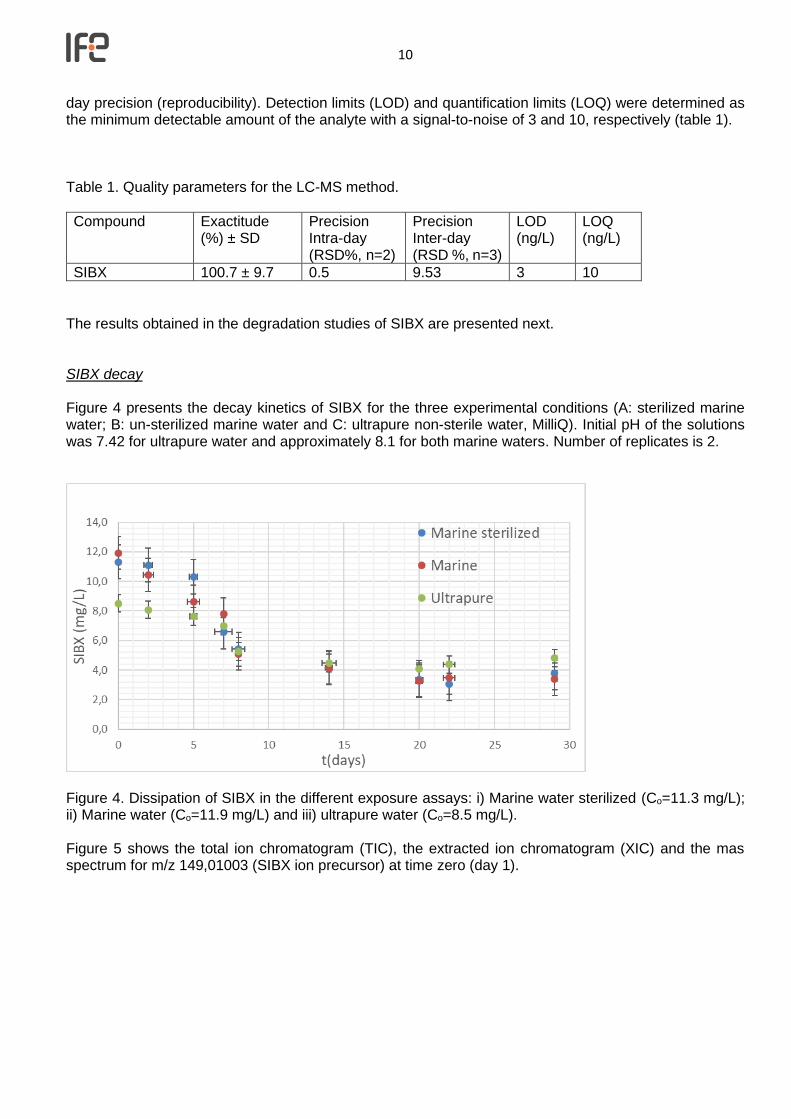
The results obtained in the degradation studies of SIBX are presented next. SIBX decay Figure 4 presents the decay kinetics of SIBX for the three experimental conditions (A: sterilized marine water; B: un-sterilized marine water and C: ultrapure non-sterile water, MilliQ). Initial pH of the solutions was 7.42 for ultrapure water and approximately 8.1 for both marine waters. Number of replicates is 2.
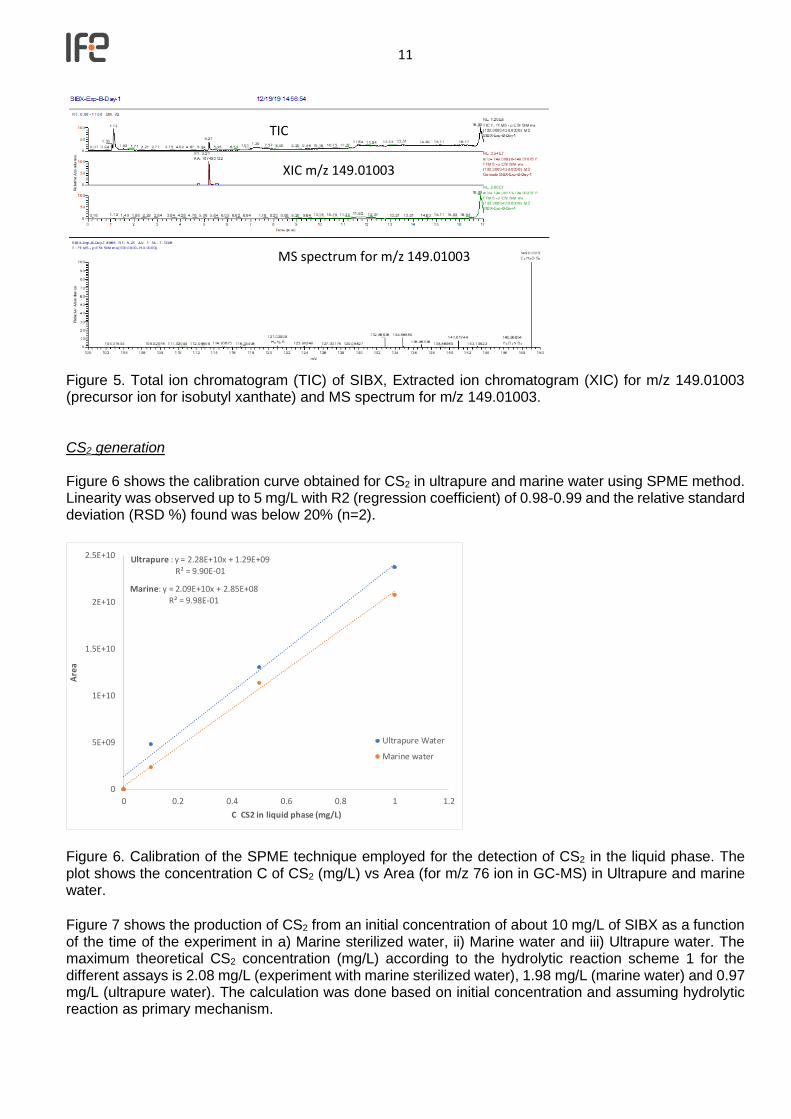
Figure 4. Dissipation of SIBX in the different exposure assays: i) Marine water sterilized (Co=11.3 mg/L); ii) Marine water (Co=11.9 mg/L) and iii) ultrapure water (Co=8.5 mg/L). Figure 5 shows the total ion chromatogram (TIC), the extracted ion chromatogram (XIC) and the mas spectrum for m/z 149,01003 (SIBX ion precursor) at time zero (day 1).
11
Figure 5. Total ion chromatogram (TIC) of SIBX, Extracted ion chromatogram (XIC) for m/z 149.01003 (precursor ion for isobutyl xanthate) and MS spectrum for m/z 149.01003. CS2 generation Figure 6 shows the calibration curve obtained for CS2 in ultrapure and marine water using SPME method. Linearity was observed up to 5 mg/L with R2 (regression coefficient) of 0.98-0.99 and the relative standard deviation (RSD %) found was below 20% (n=2).
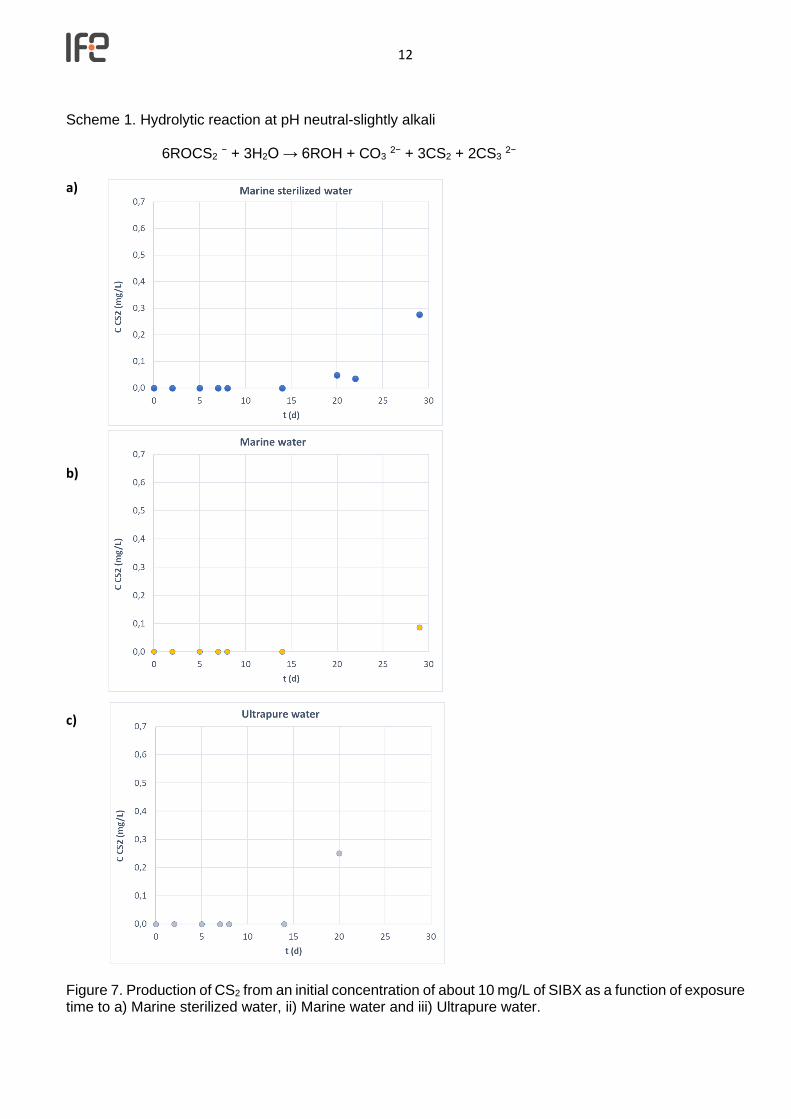
Figure 6. Calibration of the SPME technique employed for the detection of CS2 in the liquid phase. The plot shows the concentration C of CS2 (mg/L) vs Area (for m/z 76 ion in GC-MS) in Ultrapure and marine water. Figure 7 shows the production of CS2 from an initial concentration of about 10 mg/L of SIBX as a function of the time of the experiment in a) Marine sterilized water, ii) Marine water and iii) Ultrapure water. The maximum theoretical CS2 concentration (mg/L) according to the hydrolytic reaction scheme 1 for the different assays is 2.08 mg/L (experiment with marine sterilized water), 1.98 mg/L (marine water) and 0.97 mg/L (ultrapure water). The calculation was done based on initial concentration and assuming hydrolytic reaction as primary mechanism.
Ultrapure : y = 2.28E+10x + 1.29E+09R² = 9.90E-01
Marine: y = 2.09E+10x + 2.85E+08R² = 9.98E-01
0
5E+09
1E+10
1.5E+10
2E+10
2.5E+10
0 0.2 0.4 0.6 0.8 1 1.2
Are
a
C CS2 in liquid phase (mg/L)
Ultrapure Water
Marine water
TIC
XIC m/z 149.01003
MS spectrum for m/z 149.01003
12
Scheme 1. Hydrolytic reaction at pH neutral-slightly alkali
6ROCS2 − + 3H2O → 6ROH + CO3 2− + 3CS2 + 2CS3 2−
a)
b)
c) Figure 7. Production of CS2 from an initial concentration of about 10 mg/L of SIBX as a function of exposure time to a) Marine sterilized water, ii) Marine water and iii) Ultrapure water.
13
Slow degradation of SIBX was observed at investigated conditions. The concentrations of CS2 found are below the theorical concentration (around 1.8 mg/L) expected for the degradation observed in the solution with initial concentration of 10 mg/L of SIBX. The evolution observed in the concentration of SIBX and the CS2 during the 28 days period might be explained as follows:
i) SIBX is a surface-active compound, therefore, an adsorption onto the walls of the glass vials may have happened during the first two weeks. The polar sulphur end of the molecule may connect with the polar sites on the glass wall and thus protect this part of the molecule from hydrolysis reactions. This is supported by the lack of observed degradation products during this period despite that strong non-target analytical methods have been used and it therefore should be possible to identify ongoing SIBX-degradation or other reactions. Adsorption onto the glass walls of the vials will be the main reason for the dissipation of SIBX in the experiments without detection of CS2 during the first two weeks of the experiments. This explanation is supported by the CS2 concentrations depicted in figure 7. After two weeks most of the active sites on the glass walls may be coated with a mono layer of SIBX and hydrolysis is thus more likely to occur. However, due to the observed concentrations in figure 4 and figure 7 the hydrolysis rate may be interpreted as low. The explanation is also supported by the fact that the adsorption is higher in vials with ultrapure water as shown in figure 4. In seawater the naturally occurring ions act as a deactivation or protecting agent for the active sites on the glass walls that are connecting with the SIBX. Therefore, a separate study should be conducted to explore which type of material the laboratory vials should be made of in future SIBX degradation experiments. ii) Other parallel degradation mechanisms might happen. The intermediates generated would be unnoticed since the GC-MS analysis was only focusing in the CS2 measurements. After several days of SIBX exposure, the microbial community naturally present in marine water might adapt to the media and lead to reducing conditions in the sample. This effect has previously been described in literature for the xanthate family [10], however, presence of marine reductor bacteria has not been confirmed (it was not the object of this study).
Transformation products Other transformation products (TPs) were screened. One TP has tentatively been identified under marine water conditions from day 22. This compound was not found at the initial conditions neither at background conditions (marine water, ultrapure water neither SIBX). The new compound generated has been named TP124.
14
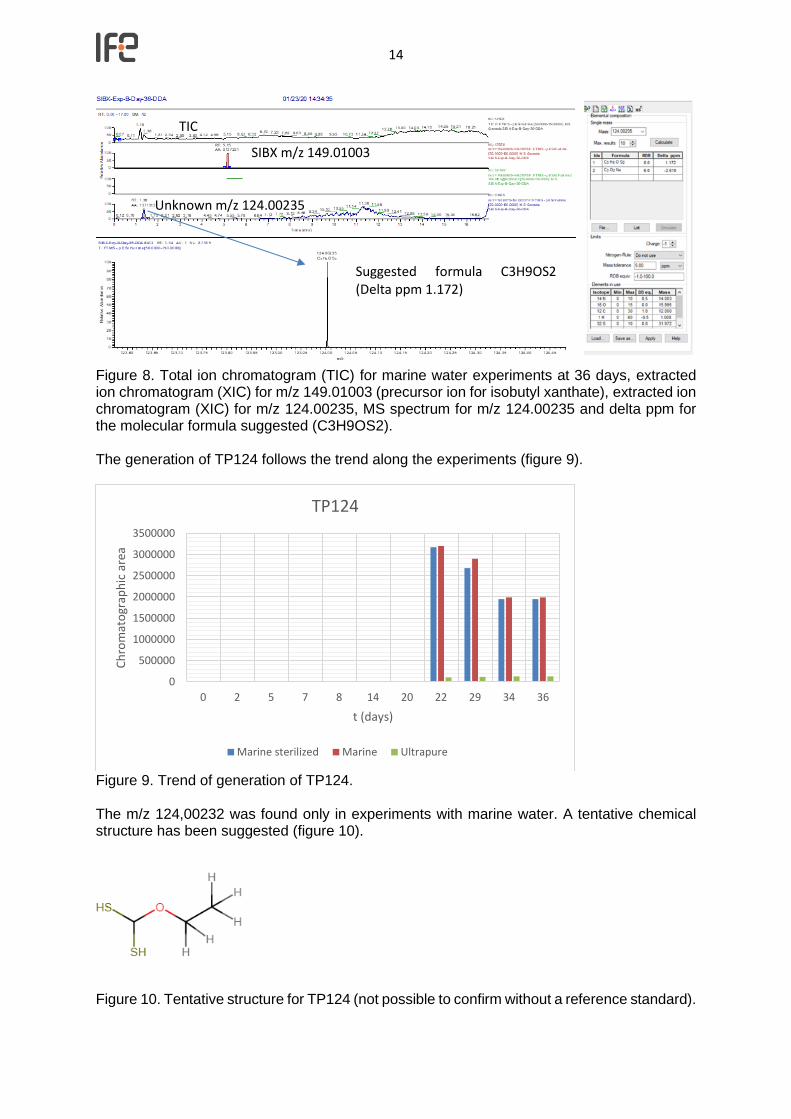
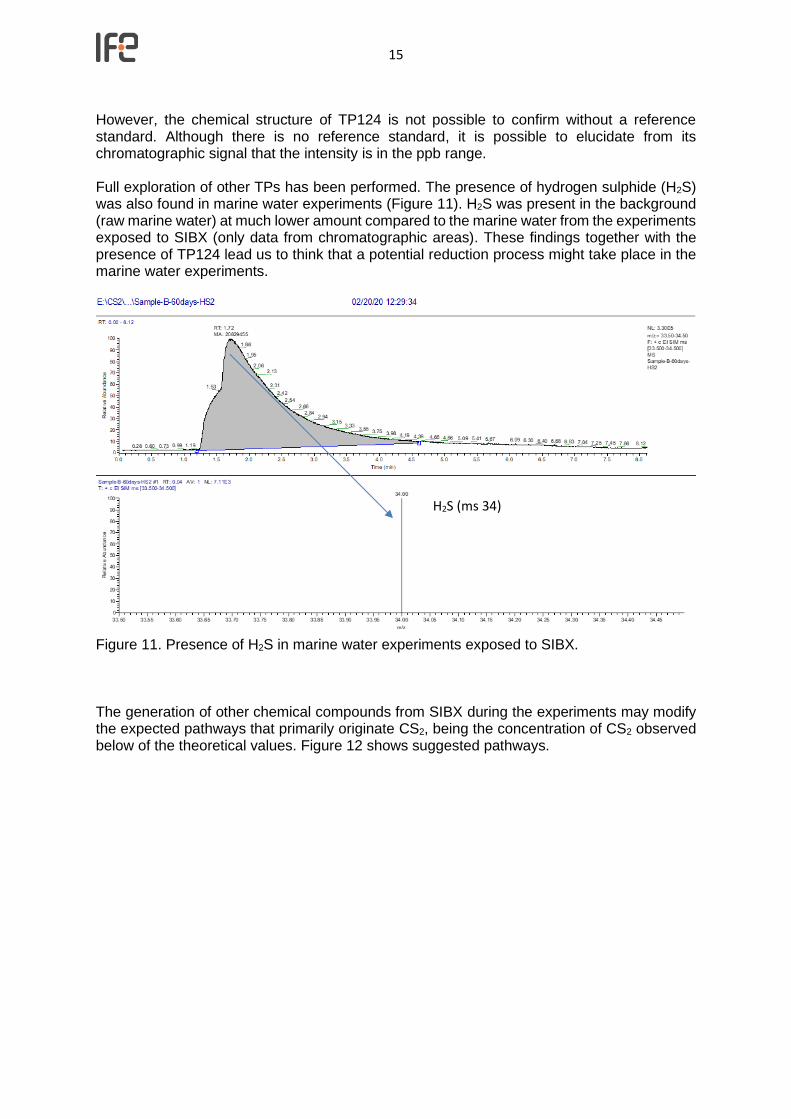
Figure 8. Total ion chromatogram (TIC) for marine water experiments at 36 days, extracted ion chromatogram (XIC) for m/z 149.01003 (precursor ion for isobutyl xanthate), extracted ion chromatogram (XIC) for m/z 124.00235, MS spectrum for m/z 124.00235 and delta ppm for the molecular formula suggested (C3H9OS2). The generation of TP124 follows the trend along the experiments (figure 9).
Figure 9. Trend of generation of TP124. The m/z 124,00232 was found only in experiments with marine water. A tentative chemical structure has been suggested (figure 10).
Figure 10. Tentative structure for TP124 (not possible to confirm without a reference standard).
0
500000
1000000
1500000
2000000
2500000
3000000
3500000
0 2 5 7 8 14 20 22 29 34 36
Ch
rom
ato
grap
hic
are
a
t (days)
TP124
Marine sterilized Marine Ultrapure
TIC
SIBX m/z 149.01003
Unknown m/z 124.00235
Suggested formula C3H9OS2 (Delta ppm 1.172)
15
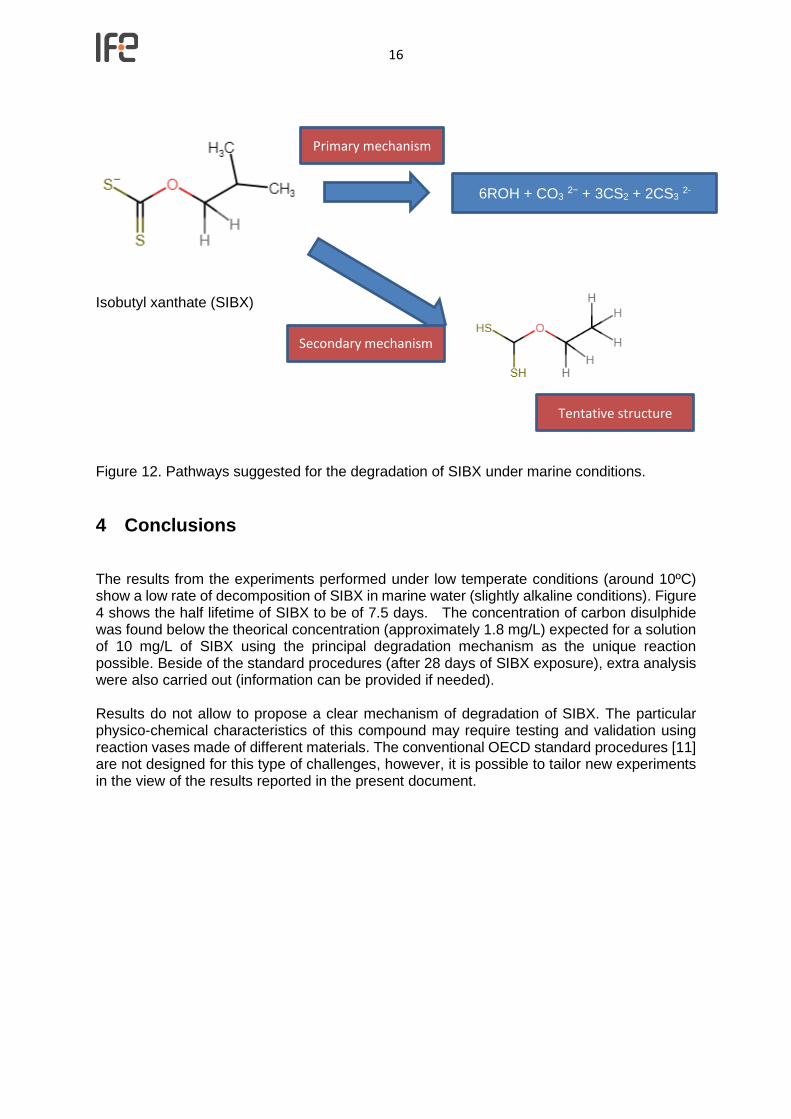
However, the chemical structure of TP124 is not possible to confirm without a reference standard. Although there is no reference standard, it is possible to elucidate from its chromatographic signal that the intensity is in the ppb range. Full exploration of other TPs has been performed. The presence of hydrogen sulphide (H2S) was also found in marine water experiments (Figure 11). H2S was present in the background (raw marine water) at much lower amount compared to the marine water from the experiments exposed to SIBX (only data from chromatographic areas). These findings together with the presence of TP124 lead us to think that a potential reduction process might take place in the marine water experiments.
Figure 11. Presence of H2S in marine water experiments exposed to SIBX.
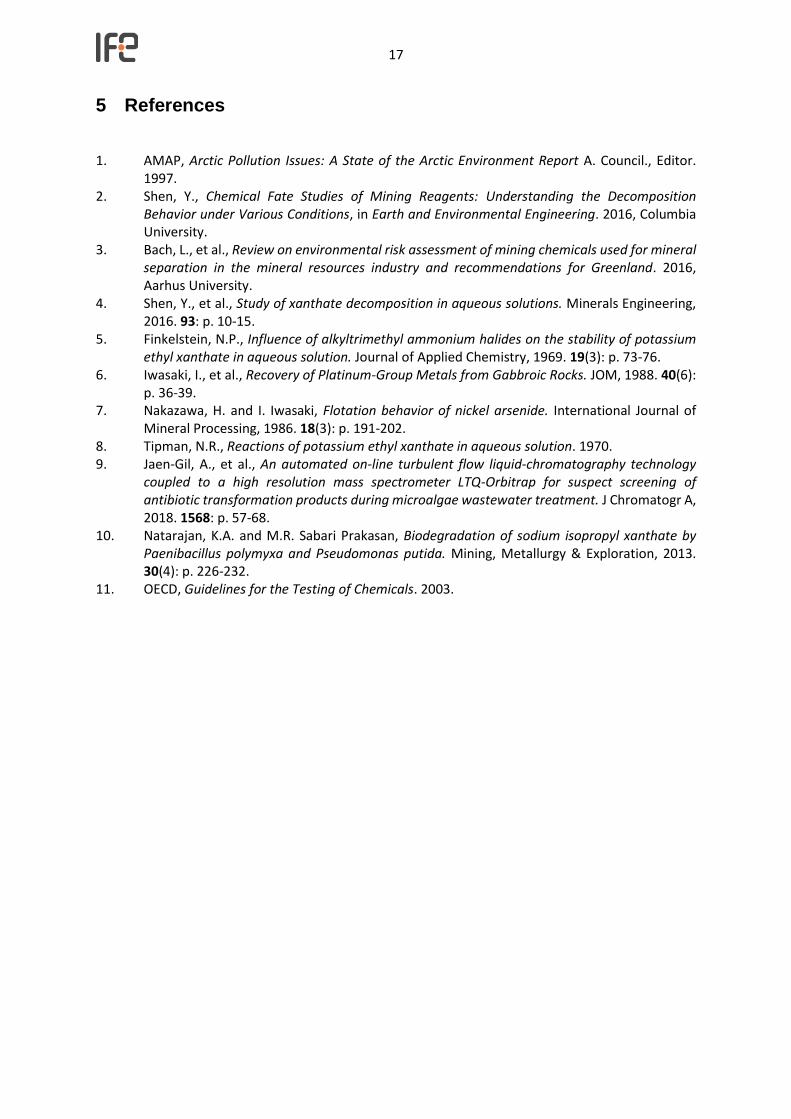
The generation of other chemical compounds from SIBX during the experiments may modify the expected pathways that primarily originate CS2, being the concentration of CS2 observed below of the theoretical values. Figure 12 shows suggested pathways.
H2S (ms 34)
16
Isobutyl xanthate (SIBX)
Figure 12. Pathways suggested for the degradation of SIBX under marine conditions.
4 Conclusions The results from the experiments performed under low temperate conditions (around 10ºC) show a low rate of decomposition of SIBX in marine water (slightly alkaline conditions). Figure 4 shows the half lifetime of SIBX to be of 7.5 days. The concentration of carbon disulphide was found below the theorical concentration (approximately 1.8 mg/L) expected for a solution of 10 mg/L of SIBX using the principal degradation mechanism as the unique reaction possible. Beside of the standard procedures (after 28 days of SIBX exposure), extra analysis were also carried out (information can be provided if needed). Results do not allow to propose a clear mechanism of degradation of SIBX. The particular physico-chemical characteristics of this compound may require testing and validation using reaction vases made of different materials. The conventional OECD standard procedures [11] are not designed for this type of challenges, however, it is possible to tailor new experiments in the view of the results reported in the present document.
6ROH + CO3 2− + 3CS2 + 2CS3 2-
Primary mechanism
Secondary mechanism
Tentative structure
17
5 References 1. AMAP, Arctic Pollution Issues: A State of the Arctic Environment Report A. Council., Editor.
1997. 2. Shen, Y., Chemical Fate Studies of Mining Reagents: Understanding the Decomposition
Behavior under Various Conditions, in Earth and Environmental Engineering. 2016, Columbia University.
3. Bach, L., et al., Review on environmental risk assessment of mining chemicals used for mineral separation in the mineral resources industry and recommendations for Greenland. 2016, Aarhus University.
4. Shen, Y., et al., Study of xanthate decomposition in aqueous solutions. Minerals Engineering, 2016. 93: p. 10-15.
5. Finkelstein, N.P., Influence of alkyltrimethyl ammonium halides on the stability of potassium ethyl xanthate in aqueous solution. Journal of Applied Chemistry, 1969. 19(3): p. 73-76.
6. Iwasaki, I., et al., Recovery of Platinum-Group Metals from Gabbroic Rocks. JOM, 1988. 40(6): p. 36-39.
7. Nakazawa, H. and I. Iwasaki, Flotation behavior of nickel arsenide. International Journal of Mineral Processing, 1986. 18(3): p. 191-202.
8. Tipman, N.R., Reactions of potassium ethyl xanthate in aqueous solution. 1970. 9. Jaen-Gil, A., et al., An automated on-line turbulent flow liquid-chromatography technology
coupled to a high resolution mass spectrometer LTQ-Orbitrap for suspect screening of antibiotic transformation products during microalgae wastewater treatment. J Chromatogr A, 2018. 1568: p. 57-68.
10. Natarajan, K.A. and M.R. Sabari Prakasan, Biodegradation of sodium isopropyl xanthate by Paenibacillus polymyxa and Pseudomonas putida. Mining, Metallurgy & Exploration, 2013. 30(4): p. 226-232.
11. OECD, Guidelines for the Testing of Chemicals. 2003.


![Sodium Phytate Presentation.pptx [Read-Only]formulatorsampleshop.com/v/reference/Sodium Phytate Presentation.pdfLaurate (Skin Conditioning Agent), Sodium Benzoate (Preservative), Sodium](https://static.fdocuments.in/doc/165x107/5eb52012fb0f3e0d55767ea6/sodium-phytate-read-onlyformulatorsampleshopcomvreferencesodium-phytate-presentationpdf.jpg)