DEGRADACIÓN FOTOCATALÍTICA DEL COLORANTE ORANGE II ...±ez.2016.pdf · degradaciÓn...
118
DEGRADACIÓN FOTOCATALÍTICA DEL COLORANTE ORANGE II USANDO ZEOLITA X, SINTETIZADA A PARTIR DE CENIZAS VOLANTES, COMO SOPORTE CATALÍTICO María Margarita Guerra Núñez Universidad Nacional de Colombia Facultad de ingeniería Departamento de Ingeniería Química Bogotá, Colombia 2016
Transcript of DEGRADACIÓN FOTOCATALÍTICA DEL COLORANTE ORANGE II ...±ez.2016.pdf · degradaciÓn...
DEGRADACIÓN FOTOCATALÍTICA DEL COLORANTE ORANGE II
USANDO ZEOLITA X, SINTETIZADA A PARTIR DE CENIZAS VOLANTES,
COMO SOPORTE CATALÍTICO
María Margarita Guerra Núñez
Universidad Nacional de Colombia
Facultad de ingeniería
Departamento de Ingeniería Química
Bogotá, Colombia
2016

II Photocatalytic degradation of Orange II dye using zeolite X - Fe catalyst synthesized
from coal fly ash
III
PHOTOCATALYTIC DEGRADATION OF ORANGE II DYE USING ZEOLITE
X - Fe CATALYST SYNTHESIZED FROM COAL FLY ASH
María Margarita Guerra Núñez
Universidad Nacional de Colombia
Facultad de ingeniería
Departamento de Ingeniería Química
Bogotá, Colombia
2016

PHOTOCATALYTIC DEGRADATION OF ORANGE II DYE USING ZEOLITE
X - Fe CATALYST SYNTHESIZED FROM COAL FLY ASH
María Margarita Guerra Núñez
Tesis de investigación presentada como requisito parcial para optar al título de:
Magister en Ingeniería Química
Director:
Ph.D. José Herney Ramírez Franco
Línea de Investigación:
Materiales y Tratamiento de residuos acuosos
Grupo de Investigación:
Materiales, Catálisis y Medio Ambiente
Universidad Nacional de Colombia
Facultad de ingeniería
Departamento de Ingeniería Química
Bogotá, Colombia
2016


To my grandmother, Sandiego, who with her courage
shows me how big and powerful is the soul force.
VIII Photocatalytic degradation of Orange II dye using zeolite X - Fe catalyst synthesized
from coal fly ash
Acknowledgments
I want to express my thanks for the support in the realization of this master's thesis to:
Universidad Nacional de Colombia for the academic and financial support during the master
and the research.
Logistica, Cuidado y Ambiente Ltda. for providing fly ash and the economic support for the
materials characterization.
Stevens Institute of Technology for Scanning Electron Microscopy training, especially to
Tsengming Chou for the support in the catalysts characterization.
My thesis director, José Herney Ramirez Franco for letting me know zeolites, for his
confidence in my work, his scientist advice and encouragement to direct the research toward
achievements.
Hugo Ramirez Zea for his academic support.
Alis Pataquiva, who provided me the tools for the Total Organic Carbon quantification.
Hernán Yanguatin, who with his research allowed me to continue in the way.
Jhon Anderson Aragón Quiroz for his help in analyzing materials by adsorption/desorption
of N2.
Francisco Quintero and Pedro Arias by the companionship, the advice and supervision of
the document.
The operators of Chemical Engineering Laboratory especially to Ricardo Cortés and Edgar
Martinez.
My parents, siblings, grandparents and Julio for their love, support and patience.

IX

Abstract and Resumen XI
Abstract
The degradation of Orange II dye (OII) by a heterogeneous photoFenton process using Fe
catalysts supported on zeolite was studied. Zeolite X was synthesized by hydrothermal
treatment from fly ash, which is a solid waste from the thermoelectric company,
Termotasajero S.A, located in Norte de Santander. The reported synthesis methodology
was optimized, evaluating aging and time of hydrothermal treatment. The synthetic zeolite,
with high BET surface area, was modified by a impregnation process to deposite different
amounts of iron. Iron nitrate nonahydrated, Fe(NO3)3.9H2O, was the precursor salt and the
prepared catalyst had 8.1 wt% y 10.3 wt% of Fe. The support and catalysts were
characterized by Xray diffraction (XRD), N2 adsorption/desorption, X-ray fluorescence
(XRF), Thermogravimetric analysis (TGA) and Scanning Electron Microscopy (SEM). The
effect of the initial concentrations of OII and H2O2, and the iron load in the support on the
degradation rate of OII was investigated by carrying out experiments in a batch reactor and
to a fixed pH value. The experiments were carried out according to an experimental
response surface design and the OII concentration histories (i.e., concentration evolution
along reaction time) were studied by UV spectrophotometry at a wavelength of 486 nm. The
dye photodegradation was described by a simple semi-empirical kinetic model, based on
the Fermi’s equation. The model was fitted to the dye concentration histories, being the
kinetic parameters determined by nonlinear regression. The catalysts showed very good
catalytic performances, with color degradations degrees as high as 90% after 3 hours. The
initial concentration of OII was the most influential variable in the dye degradation and the
iron leaching from the support was negligible, allowing the use of the catalyst in consecutive
reaction cycles. The contribution in color photodegradation due to the presence of 1 wt%
TiO2 was investigated.
Keywords: PhotoFenton, Orange II, Zeolite X-Fe catalysts, H2O2, Box Behnken design,
Fermi´s equation

XII Photocatalytic degradation of Orange II dye using zeolite X - Fe catalyst synthesized
from coal fly ash
Resumen
Se estudió la degradación del colorante industrial Naranja ácido 7 mediante el proceso
fotocatalítico fotoFenton usando catalizadores soportados en una zeolita con diferentes
cargas de hierro. La zeolita X se sintetizó por medio de un tratamiento hidrotérmico a partir
de cenizas volantes de carbón que constituye un residuo mineral de la Termoeléctrica
Termotasajero S.A. La metodología de síntesis reportada en la literatura se optimizó con la
evaluación de los tiempos de tratamiento hidrotérmico y añejamiento. La zeolita sintética,
de alta área superficial BET, fue modificada mediante un proceso de impregnación húmeda
con el fin de depositar diferentes cantidades de hierro. Nitrato de hierro nonahidratado,
Fe(NO3)3.9H2O, constituyó la sal precursora y los catalizadors preparados tuvieron 8.1 wt%
y 10.3 wt% of Fe. Tanto el soporte como los catalizadores se caracterizaron por varias
técnicas como difracción de rayos X (XRD), adsorción/desorción de N2, fluorescencia de
rayos X (XRF), análisis termogravimétrico (TGA) y microscopia electrónica de barrido
(SEM). Durante la degradación del colorante se investigaron los efectos de las
concentraciones iniciales del colorante y H2O2 en la velocidad de degradación del colorante,
así como de la carga de Fe en un reactor por lotes y a un pH fijo. Se utilizó un diseño
experimental de superficie de respuesta para medir la acción de las variables en la
evolución de la concentración del contaminante a través del tiempo, la cual fue seguida por
espectrofotometría UV a una longitud de onda de 486nm que corresponde a la longitud de
onda característica del colorante estudiado. La fotodegradación del colorante fue descrita
por un modelo cinético semi-empirico basado en la ecuación de Fermi. Los catalizadores
preparados mostraron buen rendimiento catalítico en la degradación de color obteniendo
degradaciones mayores al 90% en 3 horas. Según la respuesta del diseño, la concentración
inicial del colorante naranja ácido 7 fue la variable de mayor influencia y además la
lixiaviación de hierro fue despreciable, lo que demuestra la estabilidad de los catalizadores.
Se investigó el aporte que tiene la presencia de 1 wt% de TiO2 en la degradación del color.
Palabras clave: FotoFenton, Naranja ácido 7, catalizadores Zeolita-Fe, H2O2, diseño Box
Behnken, ecuación de Fermi

XIII


Content XV
Content
Abstract .......................................................................................................................... XI
Resumen ........................................................................................................................ XII
Introduction ..................................................................................................................... 1 1. Theorical concepts ........................................................................................................ 7
1.1 Advanced Oxidation Processes, AOPs ............................................................ 7 1.1.1 PhotoFenton Process ............................................................................... 8 1.1.2 Heterogeneous photocatalysis ................................................................. 9
1.2 Acid Orange 7 dye (Orange II): characteristics and risks ................................ 10 1.3 Zeolites .......................................................................................................... 11
1.3.2 Nature, structure and properties of zeolites ............................................ 11 1.3.2 Zeolites synthesis................................................................................... 13
1.4 Zeolite X ......................................................................................................... 17 1.4.2 Structure, chemical composition and properties ..................................... 17 1.4.2 Zeolite X synthesis ................................................................................. 17
2. Synthesis and characterization of zeolite X from coal fly ash ....................................... 19
Abstract ......................................................................................................................... 19
Introduction ................................................................................................................... 19 2.1 Experimental .................................................................................................. 21
2.1.1 Materials and characterization................................................................ 21 2.1.2 Zeolite synthesis .................................................................................... 22
2.2 Results and discussion ................................................................................... 22 2.2.2 Physical and Chemical properties of fly ash ........................................... 22 2.2.3 Effects of time of hydrothermal treatment ............................................... 26 2.2.4 Effect of gel aging .................................................................................. 30
Conclusions .................................................................................................................. 34 3. Catalyst preparation .................................................................................................... 37
Abstract ......................................................................................................................... 37
Introduction ................................................................................................................... 37 3.1 Experimental .................................................................................................. 38
3.1.1 Catalyst preparation ............................................................................... 38 3.1.2 Catalyst characterization ........................................................................ 39
3.2 Results and discussion ................................................................................... 39

XVI Photocatalytic degradation of Orange II dye using zeolite X - Fe catalyst
synthesized from coal fly ash
3.2.2 Physical and Chemical properties of catalysts ........................................ 39
Conclusions .................................................................................................................. 46 4. Photocatalytic degradation of Orange II dye ................................................................ 48
Abstract ......................................................................................................................... 48
Introduction ................................................................................................................... 48 4.1 Experimental .................................................................................................. 50
4.1.1 Apparatus and photocatalytic tests ......................................................... 50 4.1.2 Experimental design ............................................................................... 51
4.2 Results and discussion ................................................................................... 53 4.2.1 Analysis of experimental design ............................................................. 54 4.2.2 Effect of initial Orange II concentration ................................................... 58 4.2.3 Effect of initial H2O2 concentration .......................................................... 60 4.2.4 Effect of Fe load onto support ................................................................ 61 4.2.5 Effect of initial pH ................................................................................... 63 4.2.6 Catalyst stability ..................................................................................... 63 4.2.7 Kinetic model ......................................................................................... 65
Conclusions .................................................................................................................. 71 5. Degradation of wastewater from a clinical laboratory ................................................... 75
Abstract ......................................................................................................................... 75
Introduction ................................................................................................................... 75 5.1 Experimental .................................................................................................. 76 5.2 Results and discussion ................................................................................... 76
Conclusions .................................................................................................................. 78 6. Conclusions and Recommendations ........................................................................... 81
References .................................................................................................................... 87

Content XVII
List of figures
Page Figure 1.1 Chemical structure of Acid Orange 7 dye (Orange II) ..................................... 11
Figure 1.2 Secondary structural units [30] ....................................................................... 12
Figure 1.3 Construction of 4 different zeolite structures from sodalite (Payra P, Dutta, 2003).
....................................................................................................................................... 14
Figure 2.1 XRD analysis of fly ash. ................................................................................. 24
Figure 2.2 SEM micrographs of as-received fly ash, a. Plerospheres and b. spherical
particles that occur in fly ash collected in electrostatic precipitators or other dust collecting
equipment [70]. ............................................................................................................... 25
Figure 2.3 Zeolites XRD patterns for 6, 8 and 10 hours of hydrothermal treatment (X: zeolite
X and A: zeolite A peaks). ............................................................................................... 26
Figure 2.4 SEM images for the samples obtained at different synthesis times: a. 6 h (200
nm), b. 8 h (2 ɥm) and c. 10 h (2 ɥm). ............................................................................. 27
Figure 2.5 Zeolites XRD patterns for 0, 12 and 24 hours of aging and 8 hours of hydrothermal
treatment; (X: zeolite X and A: zeolite A peaks). ............................................................. 30
Figure 2.6 SEM images for samples obtained at different aging time: a. 0 h (200 nm), b. 12
h (200 nm) and c. 24 h (200 nm) for 8h of hydrothermal time. ......................................... 32
Figure 2.7 TGA curve for fly ash and zeolite X. ............................................................... 33
Figure 3.1 XRD profiles for support (Zeolite X) and the catalysts. ................................... 41
Figure 3.2 N2 adsorption/desorption isotherms at -196ºC. (a) Zeolite, (b) Catalyst 1 and (c)
Catalyst 2. ....................................................................................................................... 42
Figure 3.3 SEM images for: a. Catalyst 1 (200 nm) and b. Catalyst 2 (200 nm). ............. 44
Figure 3.4 XRD analysis for the catalyst prepared with an addition of 24% of iron oxide (16.5
wt% of Fe load). .............................................................................................................. 45
Figure 3.5 SEM image for the catalyst prepared with an addition of 24% of iron oxide (16.5
wt% of Fe load). .............................................................................................................. 45

XVI
II
Photocatalytic degradation of Orange II dye using zeolite X - Fe catalyst
synthesized from coal fly ash
Figure 4.1 Color degradation of Orange II at pH=3 and 0.1g/L of catalyst, A. Fe ions alone
(catalyst 2); B. H2O2 alone (10mM); C. Fenton (Catalyst 2 + H2O2 (10mM)); D. H2O2 (10mM)
+ UVA (10 lamps). .......................................................................................................... 53
Figure 4.2 Response surface showing the reaction rate (1/h) of the Orange II solution as a
function of: a. X1 and X2 (for X3: 10mM), b. X1 and X3 (for catalyst 2), c. X2 and X3 (for X1
0.05mM). ........................................................................................................................ 59
Figure 4.3 Effect of the initial dye concentration on the degradation histories (T =20ºC, H2O2
10 mM, initial pH 3, catalyst 2 load 0.1 g/L, 10 UVA lights). The lines represent the fitting by
the model (Equation. (20) with data reported in Table 4.2). ............................................. 60
Figure 4.4 Effect of the initial H2O2 concentration on the degradation histories (T =20ºC, OII
0.05 mM, initial pH 3, catalyst 2 load 0.1 g/L, 10 UVA lights). The lines represent the fitting
by the model (Equation. (20) with data reported in Table 4.2). ........................................ 61
Figure 4.5 Effect of the iron load on the degradation histories (T =20ºC, OII 0.05 mM, initial
pH 3, catalyst load 0.1 g/L, 10 UVA lights). The lines represent the fitting by the model
(Equation. (20) with data reported in Table 4.2). ............................................................. 62
Figure 4.6. Effect of the pH values on the degradation histories (T =20ºC, OII 0.05 mM, H2O2
of 10 mM, catalyst 2 load 0.1 g/L, 10 UVA lights). The lines represent the fitting by the model
(Equation. (20) with data reported in Table 4.2). ............................................................. 64
Figure 4.7 Effect of the pH recycling on the degradation histories (T =20ºC, OII 0.05 mM,
H2O2 of 10 mM, catalyst 2 load 0.1 g/L, 10 UVA lights). The lines represent the fitting by the
model (Equation. (20) with data reported in Table 4.2). ................................................... 64
Figure 5.1 Color removal for a clinical laboratory wastewater evaluating two catalyst load,
0.1 and 0.7 g/L. The Y axis corresponds to the absorbance (A) values normalized……..77
Figure 7.1 Pictures showing the parts of the reactor. All the experiments reported in this
thesis used quartz reactor irradiated by 10 UVA lamps incorporated into a cabin [95]…. 85

XIX
List of tables
Pág. Table 1.1 Redox potentials of some oxidising agents [5] .................................................. 8
Table 2.1 Proximate analysis for the fly ash sample........................................................ 23
Table 2.2 Elemental bulk composition of the fly ash, as determined by XRF (major elements).
....................................................................................................................................... 24
Table 2.3 Textural properties for different times of hydrothermal treatment. .................... 29
Table 2.4 Textural properties for different times of gel aging. .......................................... 31
Table 3.1 Chemical composition of support and catalysts. .............................................. 40
Table 3.2 Textural properties of catalysts and support .................................................... 43
Table 4.1 Order and conditions employed in each run, pH:3 and catalyst load: 0.1g L-1. . 52
Table 4.2 Conditions employed in the runs performed, and kinetic parameters obtained after
regression using Equation. (20) (CCat= 100 mg L−1). ........................................................ 55
Table 4.3 Summary of the effects after the response surface regression with 5% of
significance. Data from analysis in Minitab 17 software. ................................................. 56
Table 4.4 Conditions and kinetic parameters obtained for different Fe loads after regression
using Equation. (20) (CCat= 100 mg L−1). ......................................................................... 68
Table 4.5 Conditions and kinetic parameters obtained for different H2O2 concentrations after
regression using Equation. (20) (CCat= 100 mg L−1). ........................................................ 69
Table 4.6 Conditions and kinetic parameters obtained for different initial Orange II
concentrations after regression using Equation. (20) (CCat= 100 mg L−1). ........................ 69
Table 4.7 Conditions and kinetic parameters obtained for different pH after regression using
Equation. (20) (CCat= 100 mg L−1). .................................................................................. 70
Table 4.8 Condition and kinetic parameters for Orange II degradation by Fenton and
photoFenton processes using different Fe-catalysts. ...................................................... 70
Table 5.1 Physical and chemical parameters measured for clinical laboratory wastewater.
....................................................................................................................................... 77

Content XX
Introduction
In textile, leather, paint and printing processes a wide variety of synthetic dyes are used
because of their unique bright shades and production methods relatively simple and
inexpensive. Inks used in these industries can easily reach water streams, contaminating
them and causing a serious environmental problem. In the textile industry a lot of dyed
effluents are generated and between 10 and 15% of these compounds are lost due to
inefficiencies in the dyeing process, posing a major threat in ecosystem health [1]. Likewise,
disposal of wastewater from industries dedicated to the production and use of inks, can have
negative effects on human health as a result of teratogenic and mutagenic nature of this
type of compounds. In Colombia, Medellin River has been the most affected by the presence
of these contaminants and repeatedly has been painted in various colors as a result of
improper disposal of wastewater generated in these industrial activities.
The azo dyes are the most important family among industrial dyes, within which is the
Orange II. This group is characterized by having a double bond -N = N- (azo), together with
carbon atoms with sp2 hybridized and two aromatic rings. Azo dyes have a high color
strength and good technical properties such as light, heat, water and other solvents
fastness. Its great structural diversity, stability, recalcitrance and resistance, even to
microbial degradation, make it a chemical compound that tend to accumulate and remain
for a long time in water sources. In some cases, presence of less than 1 ppm of dye is clearly
evident and generates visual and environmental impacts in water sources such as rivers
and lakes.
The solution to the environmental problems caused by the dyes is a major challenge for
industry and environmental organizations. Some chemicals [1], biological [2], physical [3]
and electrochemical [4] processes have been used in treatment of different kinds of dyes.
Despite how efficient they may be, in many cases the chemical nature of the dyes, the cost
of the process and the production of secondary pollutants limit its uses. Advanced Oxidation
Processes, AOPs, have proven to be an effective solution for treating contaminants with
characteristics of stability and strength. These physicochemical processes involve the
generation and use of powerful oxidizing species which oxidize the organic matter and cause
degradation of contaminants highly refractory and biologically toxic.

2 Introduction
Photofenton process is one of the most studied AOPs comprising peroxides reactions,
usually hydrogen peroxide (H2O2), with iron ions to form active oxygen species which
degrade organic or inorganic compounds in presence of UV light. Currently the photofenton
heterogeneous process has an advantage in the need for fewer Fe ions compared to the
homogeneous process. This results in reduced processing costs, besides the ease in waste
disposal after treatment and the possibility of catalyst recovery. Another important PAO is
heterogeneous photocatalysis which involves the absorption of ligh radiation on a catalytst
and the formation of a oxidative and reductive spacies (electron-hole pair). Electron-hole
formation is due to the electron movement from the valance band to the conduction band
upon light excitation. The most used catalysts are Al2O3, ZnO, Fe2O3 and TiO2. In the
nanosecond range, the whole electron-hole migrates to the surface to react with adsorbed
species, often water, and form the radical HO•, responsible for attacking organic matter
species. Failure to achieve this, the electron-hole pair, with a half life of 30ps, recombines
and energy dissipates [5].
Photofenton heterogeneous treatment has been an effective process in degradation of
various contaminants [6], [7], including organic compounds such as inks or dyes [8]–[10]. It
has been used in treatment of recalcitrant compounds because their specific action, the
possibility of achieving contaminant mineralization, facility in waste disposal after treatment
and the possibility of catalyst recovery. The catalysts used in the photofenton heterogeneous
process vary according to the type of support on which the iron is impregnated. Several
different supporting material have been used in the oxidation of dyes, including clays [8],
[10], [11], carbon [8], [12], zeolites [13], [14] and other porous materials such as silica and
alumina [15]. In particular, zeolites are the catalyst supports most widely used because of
their physical and catalytic properties as high surface area and porosity [16].
Zeolites are a group of hydrated aluminosilicate formed by tetrahedra with O2-, Si4+ and Al3+,
in the central positions to form open porous structures, highly crystalline, constituted of pores
of molecular dimensions. Generally, zeolite synthesis is performed by hydrothermal
treatment from sources of silicon and aluminum in an alkaline medium, caused by a
hidroxide such as NaOH or KOH, which ensures the presence of exchangeable ions within
structure.
Introduction 3
The possibility of obtaining zeolites from mineral residues such as fly ash, offers economic
and environmental benefits. The use of coal as fuel for thermal power production generates
large quantities of solid waste known as fly ash, which is mostly discharged into tailings
constituting a source of contamination [17]. At 2015 in Colombia there were 9 power plants
that used coal as fuel (excluding boilers of medium and large industry) and to mention one,
only Termotasajero, a thermoelectric located in Cucuta, produces 120 tons of fly ashes a
day. Thus, the high volume of this mineral residue and its significant environmental impact,
motivate the research on alternative uses for the fly ash, including its use in the production
of products with added value and usable in the removal of other pollutants in the
environment. Zeolites, either as adsorbents or as catalyst supports, are taking part in
environmental applications such as water treatment, and thermoelectric industries have
found in this product a possible solution to the disposal or treatment problems associated
with the ashes.
In that sense, this research presented here aims to make the photocatalytic oxidation of dye
Orange II using zeolite X obtained from fly ash from the colombian thermoelectric company
Termotasajero S.A. The method comprises the synthesis of the zeolite X by a hydrothermal
treatment reported in literature, after the alkali fusion with NaOH (donor of exchangeable
ions). After synthesis of the zeolite X, iron was deposited by impregnation method, which
allows the use of the zeolite in photofenton processes. Finally, photocatalytic tests were
perform to evaluate the catalytst effectiveness and the main variables involved in the
photofenton process. The OII concentration histories were described by a simple semi-
empirical kinetic model, based on the Fermi’s equation, which captures simultaneously the
influence of all the reaction conditions with a few adjustable parameters. The research
results allowed to corroborate the effectiveness of the supported catalysts in the dye
degradation with photofenton process. Further, ensures the zeolitic material synthesis from
valuable mineral residue as coal fly ash. Also, was evaluated whether an additional
contribution of heterogeneous photocatalysis exits due to the presence of TiO2 in the used
materials.
The research results are presented in the following 6 chapters. The first chapter contains
theoretical foundations for photofenton process and degradation of the dye Orange II using
this methodology. The structural characteristics and properties of zeolites are also
discussed, emphasizing in the zeolite X. In the second chapter the synthesis of zeolite X

4 Introduction
from fly ash and characterization results from fly ash and synthetic zeolite are established.
The third chapter comprises photocatalysts preparation from the synthesized zeolite and an
iron salt, and the catalyst characterization. The fourth chapter includes photocatalytic tests,
the experimental design with the parameters influencing the reaction rate during the Orange
II photodegradation and the fit of the experimental values to the model based on the Fermi´s
equation. Chapter number five consist in the evaluation of the photoFenton process in the
degradation of a wastewater from the Compensar clinical laboratory using the synthetic
catalyst, where the color removal was studied. And the final chapter compiles the
conclusions and the recommendations about the previos chapter.

Introduction 5


7
1. Theorical concepts
This first chapter presents the results of a literature review about Advanced Oxidation
Processes (AOPs), including photofenton and heterogeneous photocatalysis processes
their characteristics and advantages for the photocatalytic treatment of dyes. It will be further
discussed the nature, structure and applications of zeolites and their use as catalytic
support. In particular, characteristics, physical and chemical properties of zeolite X, as well
as the synthesis mechanism and sources used for this purpose are presented.
1.1 Advanced Oxidation Processes, AOPs
AOPs are based on physical and chemical processes involving the generation and use of
powerful transient species, mainly the hydroxyl radical (HO•), which is generated by
photochemical process or other forms of energy. Hydroxyl radical is more effective for the
oxidation of organic matter compared to alternative oxidants such as O3 [5]. Table 1.1 shows
the oxidation capacity for radical HO• and another species.
PAOs have been widely used in water treatment application in the degradation of
contaminants highly refractory and biologically toxic [18]–[20]. A combination of different
PAOs can improve the performance of water treatment to the extent that minimizes costs, it
generates little secondary pollutants and water is obtained with sufficient quality to be
discharged into water bodies. Among the advanced oxidation technologies frequently used
are Fenton and photoFenton processes, ozone treatment and heterogeneous
photocatalysis.
Different advance oxidation processes have been used in the degradation of dyes, including
ozone, ozone / UV, hydrogen peroxide / UV, Fenton and heterogeneous photocatalysis and
their combinations like photocatalysis and electrolytic oxidation. However, the Fenton
process and its variations have been studied extensively in dyes oxidation.

8 Photocatalytic degradation of Orange II dye using zeolite X - Fe catalyst
synthesized from coal fly ash
Table 1.1 Redox potentials of some oxidising agents [5]
Especie E0 a 25°C (eV)
Fluorine 3.03
Hydroxyl radical 2.80
Atomic oxigen 2.42
Ozone 2.07
H2O2 1.78
Perhydroxyl radical 1.70
Permanganate 1.68
Chlorine dioxide 1.57
Hypochlorous acid 1.49
Chlorine 1.36
1.1.1 PhotoFenton Process
PhotoFenton process and related reactions comprise reactions of peroxides (usually
hydrogen peroxide, H2O2) with iron ions to form active oxygen species that oxidize organic
or inorganic compounds in presence of UV light. In recent decades, it has been recognized
the importance of reactions with HO●, which is able to mineralize completely refractory
pollutants. Therefore they are tabulated 1700 rate constants for these reactions with organic
and inorganic compounds in aqueous solution [18]. The photoFenton process takes place
in acid medium (pH 3-5) and although the mechanism of the decomposition of H2O2
molecule in such heterogeneous systems is not well established, some authors suggest an
initial stage of rapid adsorption of H2O2 in the Fe sites, and other adsorption of organic
compounds. However, it seems to be general agreement on the participation of two crucial
steps corresponding to the reduction of Fe3+ with the generation of HO2● followed by Fe3+

9
regeneration with the formation of hydroxyl radicals (reactions Fenton type), as it is shown
in the following two reactions [21]:
X − Fe3+ + H2O2 → X − Fe2+ + HO2● + H+ (1)
X − Fe2+ + H2O2 → X − Fe3+ + OH● + OH− (2)
Where X represents the catalyst surface.
PhotoFenton process is a combination of Fenton reagents (H2O2 and Fe2+) and UV–vis
radiation (λ < 600 nm) that gives extra OH● radicals by two additional reactions: (i)
photoreduction of Fe3+ to Fe2+ ions and (ii) peroxide photolysis via shorter wavelengths:
Fe(OH)2+ + hv → Fe2+ + OH● λ < 580nm (3)
H2O2 + hv → 2OH λ < 310nm (4)
The photogenerated ferrous ions enter Fenton reaction to produce supplemental hydroxyl
radicals. Consequently, the oxidation rate is accelerated compared to Fenton process [22].
PhotoFenton process remains one of the PAOs most commonly used in water
decontamination because it is effective in the treatment of persistent or recalcitrant
contaminants. In the case of heterogeneous process, less iron is needed in the reaction
medium and exist the possibility of catalyst recovery, which are important advantages over
homogeneous process. For this reason, the preparation of iron supported catalysts is a very
widespread and studied process [23]–[25] . Zeolites have been used in the preparation of
new materials including iron supported on zeolites type Y [14] and ZSM-5 [26].
1.1.2 Heterogeneous photocatalysis
Heterogeneous photocatalysis is a process based on direct or indirect absorption of radiant
energy (visible or UV) by a solid, which is typically a broadband semiconductor. In the
interfacial region between the excited solid and solution, reactions of destruction or removal
of contaminants undergoes without chemical changes in catalyst. Excitation of the
semiconductor may originate by direct excitation of the semiconductor, so that it is absorbing

10 Photocatalytic degradation of Orange II dye using zeolite X - Fe catalyst
synthesized from coal fly ash
photons used in the process or for initial excitation of molecules adsorbed on the catalyst
surface, which in turn are able to inject charges (electrons) in the semiconductor [5].
When the photons energy (hv) is greater than or equal to the energy bandgap of TiO2 (for
this study case), usually 3.2 eV (anatase) or 3.0 eV (rutile), the photoexcited lone electron
passes to the conduction band in femttosegundos, leaving in the valence band a positive
charged hole. The wavelength of the photon energy corresponds to 280< λ <400 nm. The
number redox reactions produced in the photon active surface are postulated as follows:
Photo-excitation: TiO2 + hv → e− + h+ (5)
Load for capture of e-: eCB− → eTR
− (6)
Load for capture of H+: hVB+ → hTR
+ (7)
Eletron-hole recombination: eTR− + hVB
+ (hTR+ ) → eCB
− + heat (2)
Scanning of photoexxited electrons: (O2)ads + e− → O2− (9)
Hydroxyls oxidation: OH− + h+ → OH. (10)
Photodegradation: R − H + OH → R. + H2O (11)
where subscript cb and vb correspond to conduction and valence bands, respectively.
1.2 Acid Orange 7 dye (Orange II): characteristics and risks
Often wastewaters polluded with dyes are easily recognized because of the color. Dyes are
defined as substances that are capable of imparting color to other substances and
encompass both dyes as pigments [27]. The Orange II dye belongs to the family of azo dyes
which is the most important family among industrial dyes. They are characterized by having
an azo functional group, consisting of a double bond -N = N-, bonded sp2 hybridized carbon
atoms and two aromatic rings, such as shown in Figure 1.1.

11
Figure 1.1 Chemical structure of Acid Orange 7 dye (Orange II)
Azo dyes have important color properties, which provide for a complete range of shades
and high color strength. Besides they have good technical properties: fastness to light, heat,
water and other solvents.
As for the Orange II impact, the first effect that causes its discharge into water is the visual
and occurs at very low concentrations of the dye due to its striking color. The use of these
waters is limited, not being fit for human consumption. In addition, it was found that certain
azo dyes pose a potential carcinogenic nature character, and at least 3000 commercial azo
dyes have been classified as carcinogenic. Some aromatic amines used in the dyes
manufacture are known carcinogens [28].
1.3 Zeolites
1.3.2 Nature, structure and properties of zeolites
Zeolites comprise a group of crystalline hydrated aluminosilicates and porous structure with
defined homogeneous cavities, which general chemical formula
Ay/mm+ [(SiO2)x(AlO2−)y]zH2O (12)
where A is the exchangeable cation with valence m, (x + y) is the number of tetrahedral units
per crystallographic cell, x/y is the Si/Al ratio and z is the number of water molecules
associated with the cell unit of zeolite. The x/y ratio usually ranges from 1 to 5, but can go
up to infinite values.

12 Photocatalytic degradation of Orange II dye using zeolite X - Fe catalyst
synthesized from coal fly ash
Considering the Si/Al ratio, has been proposed a zeolites classification into four main groups
[29]. The first, with low Si/Al ratio (1 to 1.5) as zeolites A and X; Intermediate Si/Al ratio (2
to 5) as erionite, chabazite, mordenite, Y, L and Ω; high Si/Al ratio (10-100) as ZSM-5 and
β and finally, molecular sieves, as silicalite.
The zeolite structure consists of tetrahedral units represented by TO4, where T can be silicon
or aluminum atoms, so that dimensional SiO4 and AlO4- frames are formed. These tetrahedra
are linked by oxygen atoms originating polyhedral structures which form secondary
structures (Figure 1.2). Finally, these polyhedra are joined together in more or less complex
tertiary structures. Different forms of tetrahedral coordination as well as the Si/Al ratio
originate different types of zeolites through the formation of cavities or channels of different
sizes, where cations and water molecules are accommodated. Each silicon atom is
isomorphically replaced by one aluminum atom providing a negative charge, which is
neutralized with positive charges provide by cations [30].
Figure 1.2 Secondary structural units [30]
Industrial applications of zeolites result from their physicochemical properties, which have
led to their use in many industrial processes. The adsorption capacity is the common
characteristic of zeolites, to be heated to a vacuum or gas stream (N2, He, air) lose water of

13
hydration harboring in their cavities, without modifying their structure. In this state of
dehydration, and given the large internal surface created (300-800 m2/g), zeolites have a
high capacity for the selective adsorption of any molecule that can penetrate into the cavities
[30].
The crystalline nature of the zeolite structure ensures that the pore size is uniform throughout
the crystal resulting in a structural framework known as molecular sieves. The internal
volume of zeolites consists of interconnected channels or cages. Pore sizes in zeolites may
vary from 0.2 to 0.8 nm and the pore volume between 0.10 and 0.35 cm3/g. The structure
can have some flexibility to changes in the temperature and the interaction with a guest
molecule, as is the case of monoclinic orthorhombic-transformations in the ZSM-5 zeolite
[29].
Another important property is the thermal stability of zeolites, which varies in a wide
temperature range. The decomposition temperature of the zeolites of low silica is 700°C and
besides exhibit instability in acid medium. Siliceous zeolites such as silicalite, are stable up
to 1300°C and in presence of mineral acids, although unstable in basic solution. As for the
reaction in water presence, zeolites with low silica are hydrophilic, while high silica zeolites
are hydrophobic and the transition occurs around Si/Al ratios of about 10.
Cation concentration and selectivity in exchange zeolites vary significantly with Si/Al ratio,
which plays an important role in adsorption applications, catalysis, and ion exchange.
Although the acid sites concentration decreases with increasing Si/Al ratio, acid strength
and proton activity coefficients increase with decreasing aluminum content. Zeolites are also
characterized by the unique property that the inner surface is very accessible and can form
more than 98% of the total area. The surfaces areas typically of the order of 300 to 700 m2/g
[29].
1.3.2 Zeolites synthesis
Zeolites are typically synthesized under hydrothermal conditions from alkaline aqueous
solutions and reaction of silicon and aluminum gels, at temperatures between 60°C and
200°C. A typical hydrothermal synthesis can be described as a sequence of steps, starting
with a mixture of reactive amorphous solids containing silicon and aluminum, and a cation
source, usually in a basic medium. Such aqueous reaction mixture (for reaction

14 Photocatalytic degradation of Orange II dye using zeolite X - Fe catalyst
synthesized from coal fly ash
temperatures above 100°C) is heated, often by autoclaving. During a first period to synthesis
temperature, the reagents are amorphous and gradually the formation of crystalline zeolite
products is given. Finally, replacement of amorphous materials occurs by a mass
approximately equal to the mass of the crystalline zeolite [31]. Figure 1.3 shows the
formation of four different structures of zeolites starting from the sodalite.
The formation of a specific zeolite phase requires the use of specific precursor materials.
However, these precursor materials are common in many cases. Most sources of silicon
used in conventional synthesis are aqueous colloidal sílica [32], silica foam [33], sodium
silicate, tetraethylorthosilicate, and a mixture of there [34]]. Sodium aluminate [33]–[35] or a
mixture of sodium aluminate, aluminum sulfate, alumina, aluminum hydroxide and aluminum
isopropoxide [32] have been used as sources of aluminum. The cation source, usually is
sodium hydroxide [32]–[34], although potassium hydroxide has also been used to provide
the exchangeable cations [36], [37].
Figure 1.3 Construction of 4 different zeolite structures from sodalite (Payra P, Dutta, 2003).
In recent decades, the requirement of environmental protection has encouraged the
redesign of important industrial processes that used hazardous substances or consumed
large amounts of pure water, generating significant volumes of wastewater. In this context,

15
zeolite synthesis has been investigated in order that the reagents and process conditions
are environmentally friendly. In addition, the cost and availability associated with the
chemicals used in conventional synthesis, have promoted the search and use of other
materials as a source of aluminum and silicon, being the most studied ashes and clays [38]–
[40].
The use of fly ash as a raw material in various processes is widespread. Lower costs by
handling and disposal, and the benefits offered by fly ash, are two of the reasons why its
use has been increasing. Among the applications, in addition to zeolite synthesis, the use
of fly ash as an adsorbent and water treatment [41], concrete additive and cement [42] and
improvement of crop and soil are included [43].
For the zeolites synthesis, the hydrothermal treatment applied to the coal fly ash has allowed
obtaining a variety of zeolites such as type A [44], X [45], Na-P1 [46] and MCM 41 [47]. Fly
ash is the finely divided residue resulting from the coal combustión which is transported from
the combustion chamber by the exhaust gases. Mineralogical, chemical and physical
propertiesof fly ash depend on the nature and properties of coal, the techniques used for
handling and storage, and the conditions under which they occurred. Coal fly ash consist of
very fine particles having an average diameter of less than 10 microns, added in spherical
particles with average diameter about 0.01 to 100 microns, which are hollow spheres
(cenospheres) filled with smaller particles, amorphous or crystalline (pelospheres) [43]. Fly
ash has a hydrophilic and extremely porous surface [48].
In addition to the fly ash, other unconventional materials rich in silicon and aluminum have
been used as starting material for the zeolites synthesis. Ash rice husk [49], [50], [47] and
bagasse [51], natural clay [52], wastewater generated in the manganese leaching process
[53], are some of the recently sources used obtaining different types of zeolites. For these
sources, the synthesis is also performed by hydrothermal treatment.
Synthesis Method
The zeolites synthesis, as we know it today, originated in the work of Richard Barrer and
Robert Milton around 1940. Since then, synthetic zeolites have had unprecedented growth,
to the extent several patents relating to the synthesis of these materials are known today.
The first synthetic zeolite was produced in 1950 by Union Carbide Linde Corporation in the
United States, to be used as ion exchanger [54].
16 Photocatalytic degradation of Orange II dye using zeolite X - Fe catalyst
synthesized from coal fly ash
The Si and Al elements constituting the microporous structure of zeolites are imported as
oxides. These amorphous oxides contain Si-O and Al-O bonds. During the hydrothermal
reaction in presence of an ''agent mineralizer", commonly an alkali metal, the zeolitic product
crystallizes and the Si-O-Al bonds are formed. The global change of free energy for this
synthesis reaction is usually very small, because the product bond is similar to precursor
oxides.
When synthesis reagents are mixed, a gel is formed known as primary amorphous phase.
In some cases this primary phase is colloidal, therefore invisible to the naked eye, and
represents the initial product of the reagents.
The most likely route for the zeolite formation comprises a sequence of steps: induction
period, nucleation and crystal growth. The induction period is the time between the start of
reaction and the time which is observed for the first time the crystalline product. Therefore,
this time depends on the time which reactants reach reaction temperature and the
distribution of ions and silicate aluminate.
After some time at rest or with stirring, and on reaching the reaction temperature, the mixture
undergoes changes due to the balance of the reactions, which allows the formation of the
secondary amorphous phase. Changes in the amorphous phase involve an increase in the
structure order without the establishment of the zeolitic phase. Zeolitic phase is produced
only during nucleation process.
In nucleation the nuclear size is reached, so that crystal growth starts. This step can be
carried out in two ways: the primary nucleation which can be homogeneous (from a solution)
or heterogeneous (induced by foreign particles); and secondary nucleation (induced
crystals) can be considered as a special case of heterogeneous nucleation, in which
nucleation particles are crystals of the same phase.
In the last stage of the synthesis mechanism, the crystal growth is the first evidence of a
successful reaction, where the appearance of product crystals is given.
Zeolite crystals grow slowly, compared to the ionic crystals (such as sodium) or molecular
crystals (such as sugar). The reason for this is in the need to build a three-dimensional semi-
covalent network: a polymer of ''TO2''. The predominant mode of growth is the type of
adsorption layer, where the overall rate is controlled by the surface integration and the

17
nucleation of a new layer. Unfortunately, synthetic zeolite crystals are usually too small (<1
to 20 microns) [31].
1.4 Zeolite X
1.4.2 Structure, chemical composition and properties
Zeolite X belongs to the faujasites group (FAU), which are zeolites of low and medium ratio
Si/Al (1-5) and large pore size (6-8 A) with a very stable and rigid structure. The crystals of
zeolite X show Si/Al in the structure in the range of 1.14 and 1.45. Structure of faujasite X
consists of elementary cells of 192 SiO44- and AlO4
5- tetrahedra. In this case the tetrahedra
are joined forming a cuboctahedron, known as sodalite unit (Figure 3), which is the basis
structural of the mineral [30].
1.4.2 Zeolite X synthesis
Zeolite X synthesis is a crystallization process from an amorphous gel which is
depolymerized and solubilized releasing aluminate and silicate components to be
rearranged to form crystalline zeolite X. The synthesis from chemical compounds [26], [55]
comprises the steps mentioned previously, where the sources of aluminum, silicon and
exchangeable cation, and the temperature of hydrothermal reaction are perfectly defined. In
synthesis from certain minerals and waste containing Si and Al, hydrothermal treatment
comprises an additional step previously to gelation, alkaline fusion [56], [57]. This
pretreatment consists in alkaline fusión between a base that provides exchangeable cations,
usually sodium hydroxide, and the source of aluminum and silicon in a mass ratio of 1.2.
During synthesis, zeolite X can easily be transformed into zeolite P if higher synthesis times
or too high synthesis temperatures are used. Furthermore, in reaction systems with elevated
temperatures may produce zeolite A or hydroxysodalite besides X. Zeolite A (~ 4A) and
hydroxysodalite (~ 2.5 A) are closed structures and therefore more stable than the zeolite X
so they are impurities difficult to remove [30].

18 Photocatalytic degradation of Orange II dye using zeolite X - Fe catalyst
synthesized from coal fly ash

19
2. Synthesis and characterization of zeolite X from coal fly ash
Abstract
Fly ash is a solid waste from coal combustion for thermal power production. Zeolites were
prepared from coal fly ash, rich in SiO2–Al2O3, by hydrothermal treatment at different
conditions and reaction times. In this study, fly ash collected from Termotasajero Power
Plant was used as feedstock material for the synthesis of zeolite X. Conventional alkaline
hydrothermal treatment of the starting material was preceded by a fusion step with NaOH to
improve the solubility of aluminium and silicon. Aging and time of hydrothermal treatment
were evaluated, seeking to optimize this synthesis conditions. Fly ash and synthesized
zeolites were characterized by X-ray diffraction (XRD), Scanning Electron Microscopy
(SEM), thermogravimetric analysis (TGA) and physisorption by N2 adsorption/desorption.
The results showed that zeolite X can be synthesized from the fly ash produced in the
Termotasajero company, forming a zeolitic mixture with Zeolite A and without addition of
silicon or aluminum.
Introduction
For energy production, coal is the major source (29.6% of global energy consumption) and
has had the fastest global growth since 2003 [38]. In this process, coal combustion
generates large amounts of solid wastes, within which fly as is one of the most important.,
Fly ash have an annual production about 500 million tones at 75–80% of the total ash
produced [58]. Fly ash particles are considered to be highly contaminating, due to their
enrichment in potentially toxic trace elements which condense from the flue gas. Thus, the
large amount of fly ash generated during combustion has become a serious environmental

20 Photocatalytic degradation of Orange II dye using zeolite X - Fe catalyst
synthesized from coal fly ash
problem and increased costs for storage and/or disposal. The compositional similarity of fly
ash to some volcanic material, precursor of natural zeolites, have encouraged studies to
experiment the synthesis of zeolites from this waste material [59].
Zeolites are microporous and crystalline aluminosilicate minerals composed of tetrahedra
with O2-, Si4+ and Al3+ in the central positions to form highly stable structures. Zeolites are
important catalyst supports due to their variable industrial use, which is derived from
molecular sieving, ion exchange and catalytic properties [16]. These materials have
attracted great interest because of their unique structures, uniform pores and channels, high
surface area, thermal stability and excellent adsorption properties. These features have
positioned zeolites as an important resource used in heavy metal removal processes [38],
[60], as catalytic support [61] and as fertilizer propeller in agricultural industry [62].
The zeolite synthesis consist in a mechanism for transforming amorphous silicon and
aluminum on crystalline materials called hydrothermal treatment. Thermal activation impacts
significantly the crystallization behavior of the activated product and the properties of the
resulting zeolitic and composite materials namely their nature, morphology, pore structure,
molar SiO2/Al2O3 ratio and hydrothermal stability [63]. Hydrothermal synthesis offers
advantages such as high reactivity of reactants, low energy consumption, low air pollution,
easy control of the solution, formation of metastable phases and unique condensed phases
[64].
In recent decades, particular aspects of the zeolite synthesis like reactants and process
conditions have been investigated, as they are thought as friendly to the environment. Ashes
and clays are the most investigated [45], [57], [65]. Zeolite synthesis from alternative raw
materials includes the single step and two step methods.
The single step method aims to utilize the whole part of the silica contained in the solid
material for zeolite production without any separation. Usually this method employs
hydrothermal treatment in a single pot for all preparation sequences, dissolution of silica and
alumina from the bulk solid in alkali solution and then recrystallization of the two components
into zeolites. On the other hand, the two step method requires solid residues separation after
most of the silica and alumina content have been dissolved in the alkali solution. The residue
21
removal increases the possibility of producing a desired type of zeolite with high purity and
particle regularity (shapes and sizes) but leaving a new solid waste along with very low
production yield [66].
Zeolite X is a faujasite-type zeolite. It is the most porous structure but the most difficult to be
prepared in high purity due to the thermodynamically metastable characteristic of highly
porous faujasite [66] and to the large number of variables influencing the hydrothermal
process, such as reactant sources, Si/Al ratio, alkalinity, inorganic cations, aging, stirring
among others [67]. In the case of zeolite NaX, the low Si/Al ratio promotes a hydrophilic
surface, which can facilitate hydroxyl radical formation [61].
In this chapter, coal fly ash has been used to synthesis zeolite NaX by hydrothermal
treatment method in a single pot for all preparation sequence. This research demonstrates
the potential of fly ash to be used as reliable silica and alumina sources for preparing zeolitic
material and evaluate some conditions (aging and crystallization time) to optimal synthesis.
2.1 Experimental
2.1.1 Materials and characterization
Coal fly ash was obtained from Termotasajero S.A, a power plant located in San Cayetano
(Norte de Santander, Colombia) and was stored in a sealed bag before its use to preserve
its compositional integrity. Fly ash (without pretreatment) and produced zeolite samples
were characterized by by proximate analysis, X-ray fluorescence (XRF, Magix Pro PW –
Philips apparatus equipped with a rhodium tube of 4 kW of maximum power), Scanning
Electron Microscopy (SEM, Zeiss Auriga Small Dual-Beam FIB-SEM and TESCAN VEGA 3
microscop) and X-ray Diffraction (XRD, Panalytical X’Pert PRO MPD diffractometer)
analysis. The phases were identified using X'PertHighscore plus
software.Thermogravimetric analysis (TGA) was carried out in a thermobalance Mettler
Toledo Stare System model and 10 g of each simple was placed on an alumina pan and
heated in air at 10 ºC/min up to 1000ºC. Samples were also analyized by nitrogen
adsorption/desorption (Quantachrome Coulter apparatus) and the Brumauer–Emmett–
Teller method (BET) was utilized to calculate the specific surface area after previous
degassing of the samples under strictly control conditions at temperature of 120ºC by 12 h

22 Photocatalytic degradation of Orange II dye using zeolite X - Fe catalyst
synthesized from coal fly ash
and reduced pressure. BET surface area was determinated at p/p0 between 0.06 y 0.25 (p,
p0 - equilibrium and saturation pressure of nitrogen, respectively). NaOH pellets from Merck
was provided by the Catalysis Laboratory of the National University of Colombia.
2.1.2 Zeolite synthesis
Zeolite X was prepared by modifying the procedure reported by Shigemoto and Hayashi
[68], which comprises the usual procedure of hydrothermal treatment, after an alkaline
fusion between coal fly ash and sodium hydroxide lents (NaOH). Fly ash was thoroughly
mixed with NaOH, previously crushed, in a 1:1.2 mass ratio to obtain a homogeneous
mixture. Then, during the alkaline fusion the mixture was heated in a ceramic crucible into
oven to a temperature of 773 K and held for 1 h. The resultant fused mixture was cooled to
room temperature, ground and suspended in deionized water (1g:5mL ratio) in order to
control the NaOH concentration and to form the synthesis gel.
With the porpuse to determine the effect of time of hydrothermal treatment, the synthesis
gel was subjected to 100ºC during different times (6, 8 and 10 hours). After this treatment
the samples were filtered, washed repeatedly with deionized water and dried overnight at
343 K. On the other hand, to evaluate the aging effect, the synthesis gel was kept at rest for
0, 12 and 24 hours, prior to the hydrothermal treatment. After these times, each mixture was
stirred for 12 hours and heated at 373 K for 6 hours during the thermal treatment. The
precipitates were also filtered, washed and dried.
2.2 Results and discussion
2.2.2 Physical and Chemical properties of fly ash
Proximate analysis of coal fly ash determinated the content of moisture, ash, volatile matter
and sulfur. The results in Table 2.1, showed that the sample was mostly coal fly ash with
small contents of moisture, sulfur and volatile matter. The remaining fly ash content
corresponds to fixed carbon (with volatile matter form unburned) and other elements such
as hydrogen and nitrogen found in smaller amounts.

23
Table 2.1 Proximate analysis for the fly ash sample.
ASTM Method As
determined
Moisture, 60
Mesh %
D7662-12/D3173-11 0.40
Ash %
D7662-12/D3174-12 89.83
Volatile
Matter %
D7662-12/D3175-11
0.98
Sulfur % D4239-12 Method A 0.13
Main elemental composition, expressed as equivalent wt%, of fly ash was analyzed by X-
ray fluorescence and the results are presented in Table 2.2. Chemical composition is typical
of a class F coal fly ash according to the specification of ASTM C618-84 [43] and the
relatively high loss on ignition value (LOI) could indicate a low efficiency in the combustion
process. The loss on ignition (LOI) was determined by roasting the sample at 1000 °C for at
least 3 h until a constant weight was obtained. Feedstock SiO2/Al2O3 ratio is an important
parameter since it governs the type and framework of zeolite to be synthesized. For the
starting fly ash, this ratio was 1.95 which indicated that it was possible to synthetize low
silica zeolites as zeolite X. Besides, fly ash was found to contain oxides of exchangeable
cations such as Ca, Mg, Fe and K.
XRD analysis by X'PertHighscore plus software (Figure 2.1) determined that the fly ash
sample was predominantly composed of an amorphous alumina silica glass phase (55.8%).
The glassy amorphous material was identified as the broad hump in the XRD spectra which
was observed to occur between 20° and 40°. The three main crystalline phases were mullite
(31.5%), quartz (9.7%) and iron oxide (2.3%), as identified by the sharp peaks. In the fly
ash, mullite's presence confers chemical stability, mechanical and thermal resistance, low
elongation at high temperatures and mechanical abrasion and corrosion resistance.

24 Photocatalytic degradation of Orange II dye using zeolite X - Fe catalyst
synthesized from coal fly ash
Table 2.2 Elemental bulk composition of the fly ash, as determined by XRF (major elements).
Name Compound Composition %
Silicon SiO2 51.49
Titanium TiO2 1.08
Aluminium Al2O3 26.37
Iron Fe2O3 9.37
Manganese Mn3O4 N.D
Magnesium MgO 0.32
Calcium CaO 0.63
Sodium Na2O N.D
Potassium K2O 1.05
Phosphorus P2O5 0.13
Sulfur SO3 0.298
Barium BaO 0.14
Unburned LOI 8.93
The SEM micrographs that were obtained for the as-received fly ash are shown in Figure
2.2. In general, fly ash consists of spherical particles and irregular particles corresponding
to unburned material.
Figure 2.1 XRD analysis of fly ash.
0
20
40
60
80
100
120
0 10 20 30 40 50 60 70 80 90
I/I0
(a.u
)
2ϴ/Degree
Mullite 31.5% Quartz 9.7% Iron oxide 2.3% Amorphous 55.8%

25
Figure 2.2(a) shows plerospheres containing inside spherical particles of different sizes and
figure 2.2(b) shows the unburned morphology. The spherical shaped particles are mostly
related to the cooling effect since fly ash particles solidify while suspended in the flue gases
[69].
Figure 2.2 SEM micrographs of as-received fly ash, a. Plerospheres (2 ɥm) and b.
spherical particles (1 ɥm) that occur in fly ash collected in electrostatic precipitators or
other dust collecting equipment [70].
a
b

26 Photocatalytic degradation of Orange II dye using zeolite X - Fe catalyst
synthesized from coal fly ash
2.2.3 Effects of time of hydrothermal treatment
An increase in the reaction time tends to promote a better crystallization of the phases
formed [71]. The effect of crystallization time on zeolite synthesis is shown in diffractograms
from XRD analysis (Figure 2.3). Several peaks were detected in the hydrothermal treated
samples, while most of the peaks showed in Figure 2.1 for fly ash disappeared. Results
indicate that a mixture of zeolite X and zeolite A was obtained for each time of hydrothermal
treatment. NaX zeolite exhibited greatest intensity peak located at an angle (2ϴ) of 6.2,
which is typical of structural ordering (111). With increasing crystallization time during
synthesis, peaks in the diffraction pattern slightly intensify, as it reported in some studies
[34]. However there is no a significant difference between the patterns of 8 and 10 hours of
crystallization time, suggesting that zeolite crystallization was almost complete within 8 h.
Figure 2.3 Zeolites XRD patterns for 6, 8 and 10 hours of hydrothermal treatment (X: zeolite X and A: zeolite A peaks).
The structural formation of NaX zeolite, as unique phase, requires longer crystallization time
due to its more complex and larger polymeric silicate units (D6R) and sparser structure [44].
Thus, NaX zeolite was the main crystalline phase during crystallization.
0 10 20 30 40 50 60 70 80
2ϴ/Degree
6 hours 8 hours 10 hours
XX
X
XX
X X XX
X XX
X X XX
AA
I/I0
(a.u
)

27
Figure 2.4 SEM images for the samples obtained at different synthesis times: a. 6 h (200 nm), b. 8 h (2 ɥm) and c. 10 h (2 ɥm).
a
c
b
2 µm
2 µm


29 Photocatalytic degradation of Orange II dye using zeolite X - Fe catalyst
synthesized from coal fly ash
SEM photographs in Figure 2.4 depict the transformation of fly ash into zeolitic material,
under different times of hydrothermal synthesis. SEM micrograph for 6 hours (Figure 2.4 a)
shows an incipient grown crystals of octahedral morphology which is typical of the type
zeolite X and has been reported before [59].
Further prolongation of crystallization time up to 8 and 10 hours (Figure 2.4 (b and c)) allows
to obtain for larger crystals. Morphology exhibit difference and well-developed products with
smooth and uniform surface are observed, which are consistent with the XRD results. All
samples contain a small cluster of zeolite A and X crystals as it has been reported in another
work where zeolite X was synthesized from fly ash [72], being noticeable in the case of
zeolite synthesized in 6 hours.
The N2 adsorption/desorption allowed to know the textural properties of the synthetic
zeolites, including the specific surface area, area and volume of micropores (Table 2.3). For
fly ash the found area by BET method is under 5 m2/g that is not significant. The specific
surface area of the zeolite synthesized in 6 hours corresponds to a little more than 200 m2/g.
With the increase of the hydrothermal treatment time, also increase the specific surface
area. However there is not a significant change between zeolites synthesized in 8 to 10 h,
which have areas of 301.2 and 330.8 m2/g, respectively. These values are significant
considering that most of zeolites synthesized from pure chemical compounds have areas
around 500 m2/g [34]. Increase of the N2-BET surface area clearly depends on the
development of microporous texture [73]. Volume and area of micropore agree with the
values reported for zeolites with a low Si/Al ratio [34]. Both, increased slightly over time of
crystallization, but as with the BET area, there is no a noticeable difference between 8 and
10 h.
Table 2.3 Textural properties for different times of hydrothermal treatment.
Sample Porosity
SBET
(m2/g)
Smicro
(m2/g)
Vmicro
(cm3/g)
Fly ash 1.9 - -
Zeolite 6 h 207.4 182.1 0.08
Zeolite 8 h 301.2 253.2 0.11
Zeolita 10 h 330.8 283.8 0.12

30 Photocatalytic degradation of Orange II dye using zeolite X - Fe catalyst
synthesized from coal fly ash
2.2.4 Effect of gel aging
Aging refers to the period between the formation of aluminosilicate gel and crystallization
and has an important effect on gel chemistry, which affects nucleation and crystal growth
kinetics of zeolites [67]. The XRD patterns of zeolite samples obtained after different aging
times at room temperature and for 8 hours of hydrothermal treatment, are compared in
Figure 2.5. Quartz and mullite peaks found in the diffractograms of fly ash, disappeeared
completely during the hydrothermal synthesis. From all three systems, crystalline zeolitic
material samples were obtained. The increase of gel aging time do not reveal the
appearance of new peaks, however it is noted that existing peaks are intensified. A further
prolongation of the aging time results in an increase of the sample crystallinity and for 12
hours of aging the intensity peak corresponding to zeolite A tends to disappear, indicating a
slight increase in the purity of zeolite X. The results obtained in this study are consistent with
the observations of other authors [74].
Figure 2.5 Zeolites XRD patterns for 0, 12 and 24 hours of aging and 8 hours of hydrothermal treatment; (X: zeolite X and A: zeolite A peaks).
0
0,2
0,4
0,6
0,8
1
1,2
1,4
1,6
0 10 20 30 40 50 60 70 80
I/I0
(a.u
)
2ϴ/Degree
24 Hours
12 Hours
0 hours
X
X X
X
X
X
X X
A
X
X X
X
31
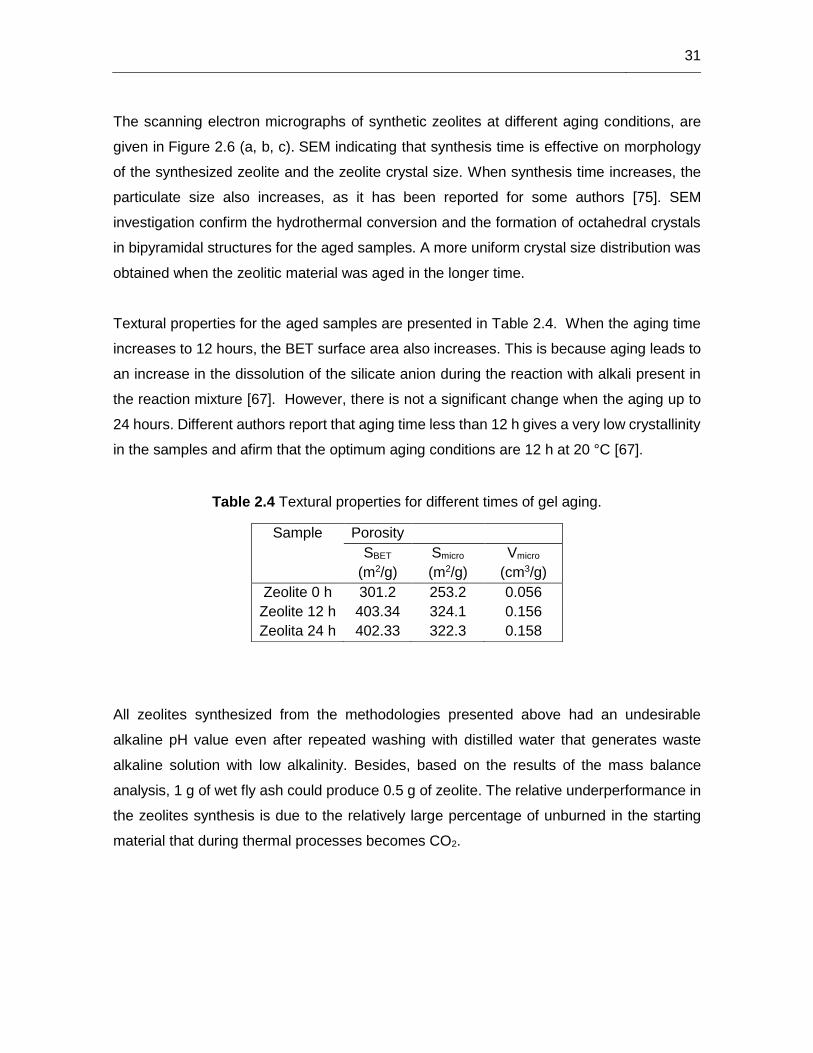
The scanning electron micrographs of synthetic zeolites at different aging conditions, are
given in Figure 2.6 (a, b, c). SEM indicating that synthesis time is effective on morphology
of the synthesized zeolite and the zeolite crystal size. When synthesis time increases, the
particulate size also increases, as it has been reported for some authors [75]. SEM
investigation confirm the hydrothermal conversion and the formation of octahedral crystals
in bipyramidal structures for the aged samples. A more uniform crystal size distribution was
obtained when the zeolitic material was aged in the longer time.
Textural properties for the aged samples are presented in Table 2.4. When the aging time
increases to 12 hours, the BET surface area also increases. This is because aging leads to
an increase in the dissolution of the silicate anion during the reaction with alkali present in
the reaction mixture [67]. However, there is not a significant change when the aging up to
24 hours. Different authors report that aging time less than 12 h gives a very low crystallinity
in the samples and afirm that the optimum aging conditions are 12 h at 20 °C [67].
Table 2.4 Textural properties for different times of gel aging.
Sample Porosity
SBET
(m2/g)
Smicro
(m2/g)
Vmicro
(cm3/g)
Zeolite 0 h 301.2 253.2 0.056
Zeolite 12 h 403.34 324.1 0.156
Zeolita 24 h 402.33 322.3 0.158
All zeolites synthesized from the methodologies presented above had an undesirable
alkaline pH value even after repeated washing with distilled water that generates waste
alkaline solution with low alkalinity. Besides, based on the results of the mass balance
analysis, 1 g of wet fly ash could produce 0.5 g of zeolite. The relative underperformance in
the zeolites synthesis is due to the relatively large percentage of unburned in the starting
material that during thermal processes becomes CO2.

32 Photocatalytic degradation of Orange II dye using zeolite X - Fe catalyst
synthesized from coal fly ash
Figure 2.6 SEM images for samples obtained at different aging time: a. 0 h (200 nm), b.
12 h (200 nm) and c. 24 h (200 nm) for 8h of hydrothermal time.
a
b
c
33
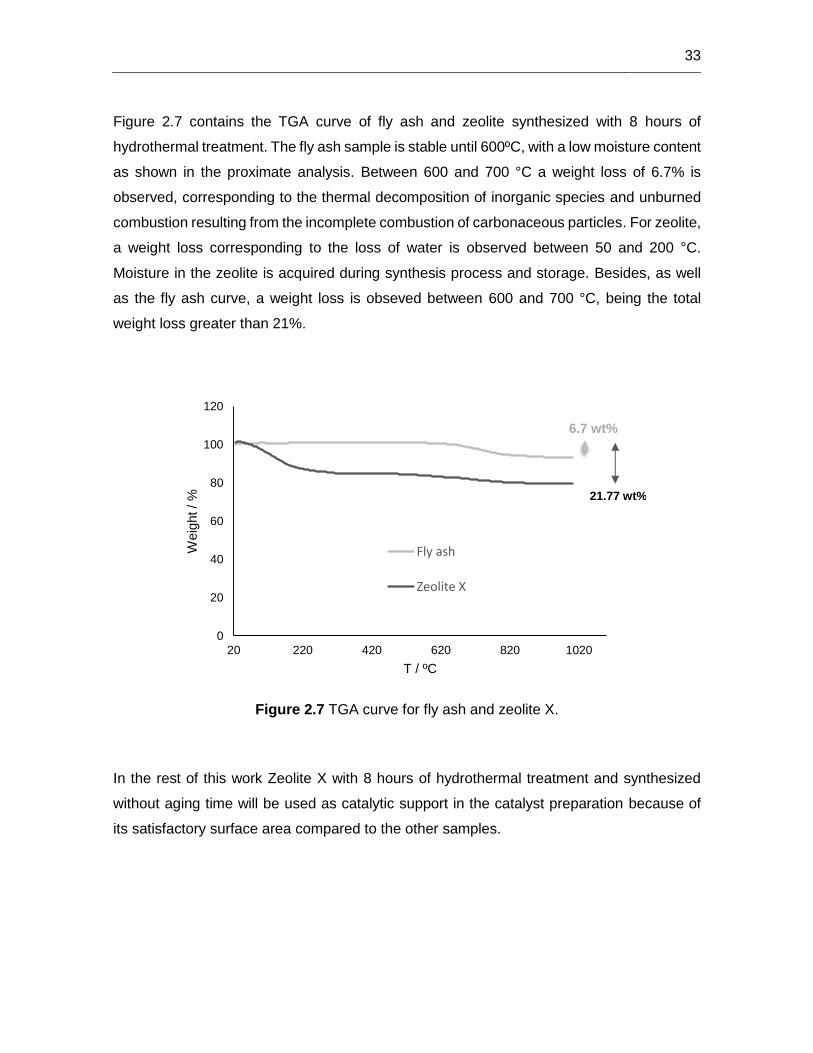
Figure 2.7 contains the TGA curve of fly ash and zeolite synthesized with 8 hours of
hydrothermal treatment. The fly ash sample is stable until 600ºC, with a low moisture content
as shown in the proximate analysis. Between 600 and 700 °C a weight loss of 6.7% is
observed, corresponding to the thermal decomposition of inorganic species and unburned
combustion resulting from the incomplete combustion of carbonaceous particles. For zeolite,
a weight loss corresponding to the loss of water is observed between 50 and 200 °C.
Moisture in the zeolite is acquired during synthesis process and storage. Besides, as well
as the fly ash curve, a weight loss is obseved between 600 and 700 °C, being the total
weight loss greater than 21%.
Figure 2.7 TGA curve for fly ash and zeolite X.
In the rest of this work Zeolite X with 8 hours of hydrothermal treatment and synthesized
without aging time will be used as catalytic support in the catalyst preparation because of
its satisfactory surface area compared to the other samples.
0
20
40
60
80
100
120
20 220 420 620 820 1020
Weig
ht /
%
T / ºC
Fly ash
Zeolite X
21.77 wt%
6.7 wt%

34 Photocatalytic degradation of Orange II dye using zeolite X - Fe catalyst
synthesized from coal fly ash
Conclusions
A reported procedure was used to synthesized zeolite X from fly ash without any adittional
source of silicon and aluminum. Experiments were performed in order to study the effects
of time of hydrothermal treatment and the aging time in the synthetic zeolite.
For the established synthesis method in this paper, is possible to synthesize a mixture of
zeolitic material, NaX and NaA zeolites, from fly ash in an economical way. The effects of
aging and crystallization time were investigated. Well-developed zeolite could be obtained
after 6 h of hydrothermal treatment at 100 °C. Crystallization at 8 hours allowed to get a BET
specific surface area of 301.2 m2/g for the zeolitic material. This value is high considering
the raw material from which the zeolite was synthesized. Respect to the aging time results
indicated an increase of zeolite crystallinity when the aging (at room temperature) is
considered. There is also an increase of specific surface area for the aged samples, but is
not sigficative the difference between 12 and 24 hours of aging. However for the catalysts
preparation zeolite prepared during 8 hours of hydrothermal treatment without aging was
selected. The additional cost generated by the aging time is not substantially justified by the
increase in the BET specific area for the application in this work.

35


37 Photocatalytic degradation of Orange II dye using zeolite X - Fe catalyst
synthesized from coal fly ash
3. Catalyst preparation
Abstract
Porous materials have received significant attention in photocatalytic processes due to their
photocatalytic activity resulting from oxide impregnation. This process transform materials
in useful catalysts for a vast range of applications including the photodegradation of
pollutants. An impregnation method was used to increase the amount of iron in the synthetic
zeolite and preparing catalysts with 12 and 15% of iron oxide. The precursor salt was iron
nitrate nonahydrated. The catalysts were characterized by Xray diffraction (XRD), N2
adsorption/desorption, Scanning Electron Microscopy (SEM) and X-ray fluorescence (XRF).
Characterization results showed a loss of crystallinity of the catalysts with increased loading
of iron oxide and no iron characteristic peak was observed in diffractograms.
Introduction
As recently reported, the transition metal-based zeolites are active in many catalytic
reactions including the destruction of a large number of hazardous organic pollutants [61],
[76]. In particular, zeolites containing iron ions have been shown to be promising solid-phase
catalysts in Fenton process for the oxidation of a series of organic pollutants with hydrogen
peroxide [7], [21], [25], [77], [78].
Fenton and Fenton-related process are used to treat industrial wastewaters and have
proven to be a promising treatment methods for the effective decolorization and degradation
of dyes [1], [14], [79]. This process includes reactions between hydrogen peroxide with
ferrous (Fe2+) and with ferric (Fe3+) ions. In the homogeneous case, catalyzed reactions

38 Photocatalytic degradation of Orange II dye using zeolite X - Fe catalyst
synthesized from coal fly ash
need up to 50–80 ppm of Fe ions in solution, which is well above the European Union
directives that allow only 2 ppm of Fe ions in treated water to dump directly into the
environment. In addition, the removal/treatment of the sludge-containing Fe ions at the end
of the wastewater treatment is expensive and needs large amount of chemicals and
manpower [80]. For these reasons the development of heterogeneous catalysts containing
iron has grown in recent years, being zeolites the most studied catalytic iron supports and
the heterogeneous Fenton process the most used.
The ideal heterogeneous catalyst should be cheap and stable, as well as have good catalytic
activity and photosensitivity. Heterogeneous catalyst containing Fe should also be suitable
for wide range of pH and with a negligible Fe leaching. Besides, the catalyst loaded with
irons should be stable over time, so it can be used for several runs.
Some works can be found that include incorporation of Fe ions or Fe oxides into porous
zeolites [14], [26], [81]. Various preparation procedures have been proposed in order to
prepare Fe-zeolites catalyst. Liquid and solid ion exchange or chemical vapour deposition
to introduce extra framework iron into zeolites and wet impregnation to deposit iron on the
external zeolite surface are the most employed. In most cases, depending on preparation
method and Fe content, various coexisting iron species are produced. However, some of
them include a calcination step for to turn iron into iron oxide.
In this chapter two Fe-zeolites catalyst, with two different amounts of iron, were prepared
from the zeolite previously synthesized. Iron nitrate in its nonahydrate form, Fe(NO3)3·9H2O,
was used as precursor salt for the preparation and the iron was deposited by wet
impregnation onto the zeolite surface.
3.1 Experimental
3.1.1 Catalyst preparation
Zeolite X with 8 hours of hydrothermal treatment, prepared in agreement with the procedure
described above, was subjected to a wet impregnation procedure with iron nitrate
nonahydrate (Fe(NO3)3·9H2O – Merck) in order to deposite iron on the zeolite surface.
39
A certain amount of zeolite was used to prepare two catalysts with different amounts of Fe.
Considering that prepared zeolite X contains 9 wt% of iron oxide (6.3% of iron content
approximately), the catalysts were prepared using the classical impregnation method with
the amount of (Fe(NO3)3·9H2O needed for obtaining 8.4 and 10.5 wt% of iron (12 wt% and
15 wt% of iron oxide) in the final catalyst, respectively. These amounts were selected
considering the catalysts prepared had no significant morphologic and textural changes after
impregnation. The precursor salt was dissolved in a minimum amount of water and added
drop by drop on the corresponding zeolite support, which was continuously shaked to ensure
that the entire surface of the zeolite was in contact with the iron salt. After impregnation, the
samples were dried overnight at 100ºC and finally calcined in air from room temperature up
to 400ºC at a heating rate of 1º/min and kept at 400ºC for 5 h. The calcination step was
necessary to turn iron into iron oxide.
3.1.2 Catalyst characterization
Textural characterization was carried out by N2 adsorption/desorption at –196ºC in
Quantachrome Coulter apparatus. The BET surface areas were calculated from the
corresponding nitrogen adsorption/desorption isotherms.
The morphology of the catalysts was analyzed by scanning electron microscopy (SEM).
Experiments were carried out with a Zeiss Auriga Small Dual-Beam FIB-SEM microscope.
Chemical composition was analysed by X-ray fluorescence in a Magix Pro PW – Philips
apparatus equipped with a rhodium tube of 4 kW of maximum power. Finally, X-ray
Diffraction (XRD) measurements were performed using a Panalytical X’Pert PRO MPD
diffractometer.
3.2 Results and discussion
3.2.2 Physical and Chemical properties of catalysts
The chemical compositions of the materials, expressed as equivalent wt%, were analyzed
by XRF and results are shown in Table 3.1. The most abundant components in the catalysts
were found to be the oxides SiO2 and Al2O3 which are the constituents of zeolite framework.
There is also, the presence of small amounts of other metallic oxides. The most important
changes in catalysts are the increase in the amount of iron compared to the zeolite. The wet

40 Photocatalytic degradation of Orange II dye using zeolite X - Fe catalyst
synthesized from coal fly ash
impregnation process resulted in two catalysts with 8.1 and 10.3 wt% of iron (11.53 and
14.79% of iron oxide), being 8.4 and 10.5% the desired values. Based on this an
impregnating yields of nearly 96 and 98 wt%, respectively, were reached. The catalysts were
namely Catalyst 1 and Catalyst 2, respectively. P2O5, SO3 and BaO probably appear as
impurities diring the medition.
Table 3.1 Chemical composition of support and catalysts.
Compound Zeolite X Catalyst 1 Catalyst 2
SiO2 43.621 40.670 39.412
Al2O3 25.975 24.501 23.652
Na2O 18.224 19.840 18.726
Fe2O3 8.948 11.531 14.789
TiO2 1.198 1.097 1.137
MgO 0.401 0.509 0.454
CaO 0.771 0.729 0.717
K2O 0.408 0.400 0.419
P2O5 N.D 0.129 0.021
SO3 N.D 0.250 0.303
BaO N.D 0.127 0.184
The supported iron photocatalysts were characterized by XRD. The X-ray diffraction
patterns of catalysts 1 and 2 are shown in Figure 3.1. The XRD profiles show that the
crystalline structure of the impregnated zeolite changed and a loss of crystallinity is observed
being more noticeable when the amount of iron is increased. In the case of exchange
process, some authors relating this loss of crystallinity to the effect of the charge on the ion-
exchanging cation in the zeolite structure [14], which suggests that it is possible that during
the impregnation process some iron ions were exchanged by sodium ions present in the
structure of sodium synthetic zeolite. To quantify this effect leaching test was performed in
modified zeolites by contacting them with a HCl solution of pH = 2.0 for 24 h in order to
remove the Fe which were not incorporated into the structure, and to exchange the Fe that
could be occupying compensation sites. The result of atomic absorption analysis showed
that the amount of iron in solution corresponds to the 60 wt% (0.64 mg) of the total amount
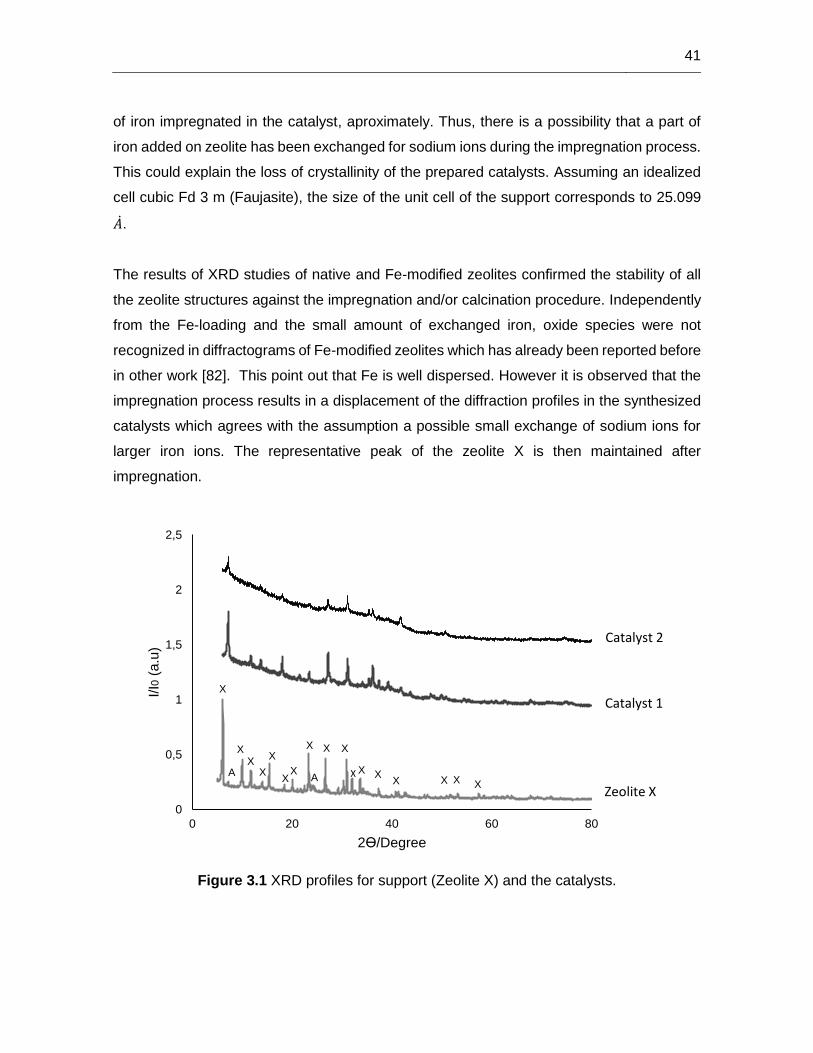
41
of iron impregnated in the catalyst, aproximately. Thus, there is a possibility that a part of
iron added on zeolite has been exchanged for sodium ions during the impregnation process.
This could explain the loss of crystallinity of the prepared catalysts. Assuming an idealized
cell cubic Fd 3 m (Faujasite), the size of the unit cell of the support corresponds to 25.099
��.
The results of XRD studies of native and Fe-modified zeolites confirmed the stability of all
the zeolite structures against the impregnation and/or calcination procedure. Independently
from the Fe-loading and the small amount of exchanged iron, oxide species were not
recognized in diffractograms of Fe-modified zeolites which has already been reported before
in other work [82]. This point out that Fe is well dispersed. However it is observed that the
impregnation process results in a displacement of the diffraction profiles in the synthesized
catalysts which agrees with the assumption a possible small exchange of sodium ions for
larger iron ions. The representative peak of the zeolite X is then maintained after
impregnation.
Figure 3.1 XRD profiles for support (Zeolite X) and the catalysts.
0
0,5
1
1,5
2
2,5
0 20 40 60 80
I/I0
(a.u
)
2ϴ/Degree
X
AX
X
X
X
XX
X X X
X X XX X X X
A
Zeolite X
Catalyst 1
Catalyst 2
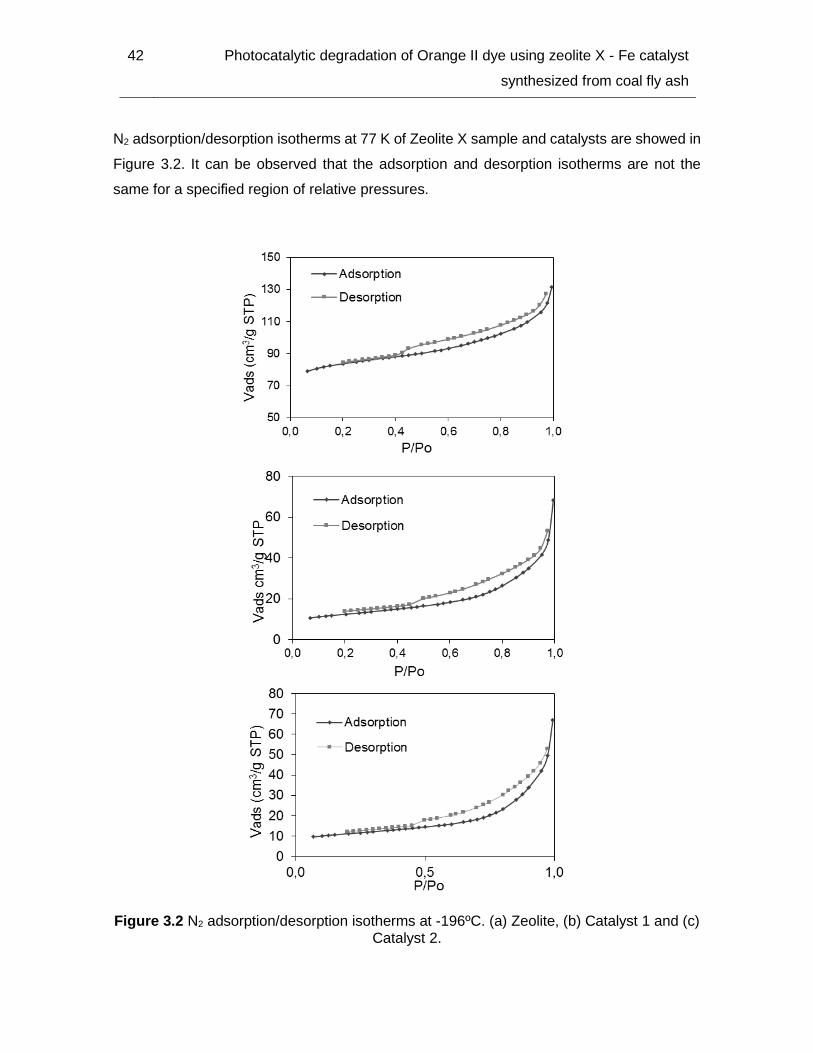
42 Photocatalytic degradation of Orange II dye using zeolite X - Fe catalyst
synthesized from coal fly ash
N2 adsorption/desorption isotherms at 77 K of Zeolite X sample and catalysts are showed in
Figure 3.2. It can be observed that the adsorption and desorption isotherms are not the
same for a specified region of relative pressures.
Figure 3.2 N2 adsorption/desorption isotherms at -196ºC. (a) Zeolite, (b) Catalyst 1 and (c) Catalyst 2.
43
This phenomenon is known as a hysteresis loop and is commonly exhibited in mesoporous
adsorbents such as zeolite particles used in this study. However, the studied isotherms show
a combination of micropores and mesopores. As observed in figure 3.2 (a and b), after the
iron impregnation the volume of adsorbed N2 at low values of P/P decreased, suggesting a
reduction in the available microporosity.
Table 3.2 Textural properties of catalysts and support
Sample Porosity
SBET
(m2/g)
Smicro
(m2/g)
Vmicro
(cm3/g)
Zeolite 8 h 301.2 253.2 0.056
Catalyst 1 56.4 47.4 0.010
Catalyst 2 39.2 33.0 0.007
The results of the textural analysis and the BET surface areas are shown in Table 3.2. As
can be observed, iron impregnation considerably decreases the surface area, micropore
area, and the micropore volume of the zeolite. This is probably the result of partial
obstruction of the pores by small oxide clusters generated during calcination, as it has
happened in the case of Zn [61], and the partial plaguing of the micropore system due to
accommodation of Fe-species [82]. As the zeolite has small pores, the size of the oxide
crystallites must be very small, in the order of nanometers. The decrease in the surface area
was more significant for catalyst 2 (87% reduction) than catalyst 1 (81% reduction). There
was no change in the average pore diameter (about 15A), because the impregnation was
not done on the mesoporous zeolites that were generated during the zeolite agglomeration
process.
The morphology of the catalysts was analyzed by SEM. From the previous chapter, synthetic
zeolite X had well defined octahedral crystals. This is consistent with the cubic morphology
characteristic of faujasite zeolites and its regular prismatic type. Figure 3.3 (a and b) shows
the microscopy for the impregnated zeolites. The iron inclusion produced a dramatic change
in the morphology of the structure.

44 Photocatalytic degradation of Orange II dye using zeolite X - Fe catalyst
synthesized from coal fly ash
Figure 3.3 SEM images for: a. Catalyst 1 (200 nm) and b. Catalyst 2 (200 nm).
When the Fe load onto the support is increased to 16.5 wt% (24 wt% of iron oxide), there is
a total loss of structure and crystallinity of the zeolite. In addition, the value of the BET
surface area decreases from 301.2 m2/g to 2 m2/g, reflecting that the textural properties are
affected by an increase in the amount of iron greater than 10 wt%. These findings are
demonstrated in the SEM and XRD analysis (Figures 14 and 15).
a
b
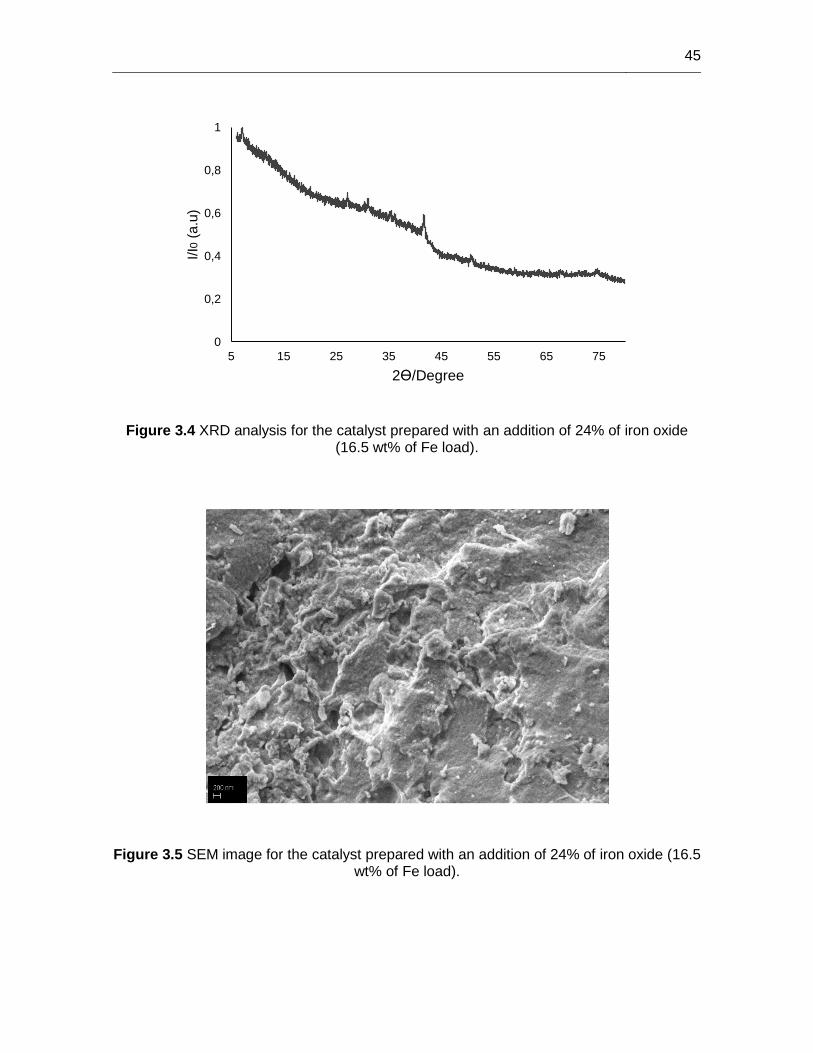
45
Figure 3.4 XRD analysis for the catalyst prepared with an addition of 24% of iron oxide (16.5 wt% of Fe load).
Figure 3.5 SEM image for the catalyst prepared with an addition of 24% of iron oxide (16.5 wt% of Fe load).
0
0,2
0,4
0,6
0,8
1
5 15 25 35 45 55 65 75
I/I0
(a.u
)
2ϴ/Degree
46 Photocatalytic degradation of Orange II dye using zeolite X - Fe catalyst
synthesized from coal fly ash
Conclusions
Synthetic zeolite X have been employed as support for iron particles with the aim of using it
in PhotoFenton process. A conventional impregnation process was used as a method for
incorporate iron in zeolite surface from iron nitrate. The characterization analysis showed a
good Fe dispersion onto the surface. X ray diffractograms and SEM images reveal the
crystallinity loss of the catalysts when the amount of impregnated iron increases. Likewise
according the BET area, the surface area of the zeolite decreases 81% in the case of the
catalyst with 12% iron oxide and 87% in the catalyst 2 having 15% iron oxide.

47

48 Photocatalytic degradation of Orange II dye using zeolite X - Fe catalyst
synthesized from coal fly ash
4. Photocatalytic degradation of Orange II dye
Abstract
The main variables during Orange II photodegradation were investigated. An experimental
design was raised to optimize the reaction rate in the oxidation of the dye. Effects of the
initial concentrations of contaminants and hydrogen peroxide, and the iron load in the used
catalysts were determined. A semi-empirical model based on the Fermi´s equation to
describe the rate of degradation of Orange II was used. The multivariate experimental
design allowed to develop a quadratic models for the reaction rate, with adequate predict
responses within the experimental range. It was found that both initial H2O2 and OII
concentration have an important effect in the organic matter degradation efficiency. The
TOC removal at the optimal conditions was closed to 50% after 180 minutes. The TiO2
presence in zeolite and catalysts was evaluated in the Orange II photodegradation.
Introduction
The wastewater toxicity from textile industry is the result of the presence of salts such as
NaCl and Na2SO4, surfactants such as phenols, heavy metals in the dyes, organic
compounds such as chlorinated solvents (from the washing and cleaning machines),
biocides as pentachlorophenol (from contaminated wool fiber) and toxic anions such as
sulfide (present in some dyes), among others (Bae et al., 2005). However, dyes have the
most attention in wastewaters of textile industry because are designed to be highly resistant,
even to microbial degradation, that is why they are difficult to remove in conventional
wastewater treatment plants.
Orange II, sodium salt of 4- (2-hydroxy-1-naphthalene) azo benzene sulfonic acid, it is a
monosulfated acid colorant, monoazo type, much studied. Has a high solubility in water due

49
to the group -SO3- and its color is due mainly to the azo group (-N = N-), common to most
dyes. Degradation and mineralization of this dye has been developed by many technologies
and chemical, physical and biological treatments.
Considering the AOPs technologies, the photofenton heterogeneous process has used a
different variety of catalysts and many variables have been studied. Iron species supported
onto carbon, zeolites, ashes and others has been used in Orange II photodegradation. As
to the variables, the pH is the most important variable because it limits the use and
effectiveness of the photocatalytic process for the pollutant treatment. Many works have
studied Orange II degradation and have ensured that 3 is the optimal value to initite the
oxidation reactions needed. Likewise, the effect of the initial pollutant concentration, as it is
of importance in any process of wastewater treatment, has also been investigated. In
general, the higher the initial dye concentration, the higher is the time required to degrade
and decolorise it completely. The dye concentration histories can be affected by the
hydrogen peroxide concentration. Usually, when the initial load of H2O2 is high, degradation
occurs very quickly. But when the initial dosage change from a narrow range, although
differences between dye concentration histories exist, they are small.
Meanwhile, another AOPs, heterogeneous photocatalysis, commonly uses titanium dioxide
(TiO2) in anatase crystalline form, to generate hydroxyl radicals and oxidize contaminants.
In this regard many works studying the degradation of some pollutants with heterogeneous
photocatalysis from TiO2 have been published [20], [83], [84].
In this chapter photodegradation of acid Orange II was studied in detail using solid Fe-zeolite
as a heterogeneous catalyst. An experimental design based on a Box Behnken with 3 central
points design will be employed to study the effects of the initial dye concentration, initial
H2O2 load and the iron load supported on the color degradation rate. The photodegradation
was described by a simple semi-empirical kinetic model, based on the Fermi’s equation. The
TiO2 contribution in the photocatalytic process was also investigated.
50 Photocatalytic degradation of Orange II dye using zeolite X - Fe catalyst
synthesized from coal fly ash
4.1 Experimental
4.1.1 Apparatus and photocatalytic tests
Photocatalytic experiments for photoFenton degradation of an aqueous solution of the
commercial azo dye Orange II was conducted in a stirred quarz batch reactor, with 0.3 L
capacity, being the temperature controlled through two fans incorporated in a cabin within
which the reactor was. The reactor was equipped with a Falc F30ST magnetic stirrer for
continuous stirring of the reaction mixture and was irradiated with 10 fluorescent tube UVA
T-5 8W/dL. The lamps irradiance was measured with a UVA sensor Anaheim Scientifif
model H117. For the 10 UVA lamps, the irradiance value was 430 ɥW/cm2. The absorbance
was continuously monitored using a Genesis 20 UV/VIS spectrophotometer from Thermo
Scientific and the measurements were taken at λ= 486 nm, which is the characteristic
wavelength of the azo bond in the dye. The UV-vis spectrum of Orange II has been reported
in the literature, showing the maximum absorption peak at 486 nm.
The azo dye, commercial Orange II (C16H11N2NaOS), was used as received. This dye was
chosen as refractory model pollutant since their molecular structure is exactly known and is
frequently being applied for the dyeing of cotton, woolen and nylon (polyamide) fabrics
worldwide. In all experiments a reaction volume of 0.1 L was used and the runs were carried
out at initial pH 3.0. This pH value was set based on previous experimental results and
agrees with literature findings, as it is usually accepted that acidic pH levels near 3 are
usually optimum for Fenton oxidation [10]–[12], [14], [19], [85]. The initial pH was adjusted
through addition of 1 Mm NaOH or 0.1 Mm H2SO4 solutions. H2O2 30 wt% from Merck was
used and additioned together with the catalyst. The starting point was treated as the time
when the UVA light was turned on and H2O2 and catalyst were added to the Orange II
solution. Temperature was monitored during the whole experiment and did not had a
significant increase, average solution temperatura was 20°C. All the experiments were run
up to 180 min.
In this work, three OII concentrations between 0.03 and 0.1 mM were used (corresponding
to total organic carbon contents in the range of 5.76–19.2 mg L−1), which are in the range of
typical OII concentrations found in industrial effluents (between 10 and 50 mg L).The pH

51
value for the 0.1 mM Orange II solution is 6.0. For the calibration a concentration curve of
the dye was elaborated according to the absorbance medition in a range of Orange II
concentration between 0.005-0.1 mM. Samples were withdrawn from the reactor at several
times, for the absorbance monitoring, filtered and the reaction was stopped by adding
excess Na2SO3 (from Merck), which instantaneously consumes the remaining hydrogen
peroxide. At the end of each run, the iron leaching from the support, for catalyst 1 and 2,
was quantified by atomic absorption using a Thermo Electron Corporation spectrometer, S
series. Total organic carbon was measured by catalytic oxidation using a Shimadzu
analyzer, model TOC.L. TOC values represent the average of three measurements.
The contribution of heterogeneous photocatalysis in the dye photodegradation due to the
content of TiO2 in the catalysts was investigated.
4.1.2 Experimental design
The experimental design studies how to vary the usual process conditions to increase the
likelihood of detecting significant changes in the response; thus a better understanding of
the process behavior is obtained. For this case, the objective is to maximize the decolorizing
rate with the best arrangement of the studied variables.
Box Behnken experimental design was used to obtain response surfaces while minimizing
the number of experiments. Given a normal distribution in the response variable, its possible
to ensure that the standard deviation of the experiments at the centre point is representative
of the standard deviation of the entire model, even beyond the design limits. This
experimental design was selected because is an independent quadratic design in that it
does not contain an embedded factorial or fractional factorial design. The treatment
combinations are at the midpoints of edges of the process space and at the center. Box
Behnken have fewer design points, they can be less expensive to do than central composite
designs with the same number of factors. However, because they do not have an embedded
factorial design, they are not suited for sequential experiments. Therefore the higher the
number of repetitions of experiments in the centre point, greater reliability in the standard
deviation, as representative of the entire design [86].

52 Photocatalytic degradation of Orange II dye using zeolite X - Fe catalyst
synthesized from coal fly ash
A Box Behnken experimental design was used to model and optimize the process
conditions. The response surface design considered 3 centre points and the Minitab 17
software was used to describe the run order and the data analysis calculated from the
experimental responses. The model considered to describe the data was a second-order
polynomial, and the corresponding coefficients were calculated from the experimental
responses by means of least squares regression. Table 4.1 summarizes the conditions of
all experiments performed. Runs were conducted by varying the initial concentration of the
dye (0.03, 0.05 and 0.1 mM), the H2O2 dosage (5, 10 and 15 mM) and the iron oxide load in
catalysts (9, 12, 15 wt% of iron oxide). In such experiments the catalyst dose (load of Fe-
zeolite in the batch reactor) was always 100 mg L−1.
Table 4.1 Order and conditions employed in each run, pH:3 and catalyst load: 0.1g L-1.
RunOrder [OII] (mM)
Iron oxide
load (%)
[H2O2]
(mM)
1 0.03 15 10
2 0.03 12 15
3 0.1 12 15
4 0.05 15 15
5 0.05 9 5
6 0.05 15 5
7 0.05 12 10
8 0.05 12 10
9 0.05 9 15
10 0.03 9 10
11 0.05 12 10
12 0.1 15 10
13 0.1 12 5
14 0.03 12 5
15 0.1 9 10
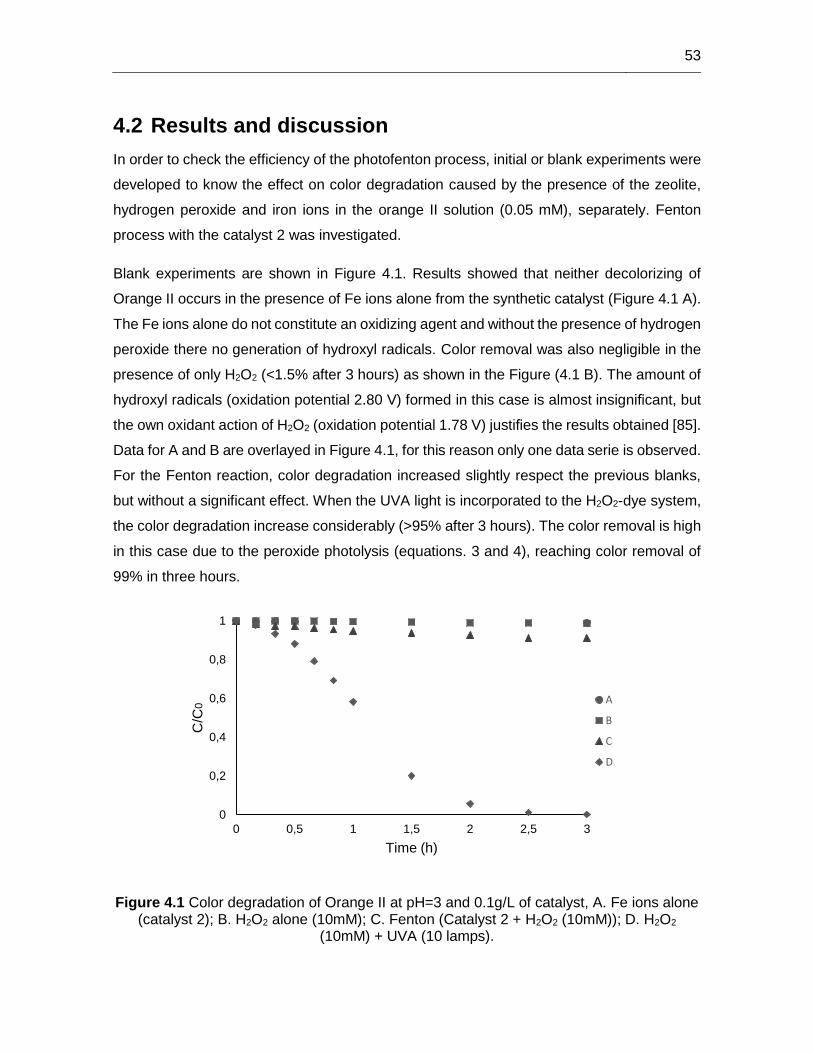
53
4.2 Results and discussion
In order to check the efficiency of the photofenton process, initial or blank experiments were
developed to know the effect on color degradation caused by the presence of the zeolite,
hydrogen peroxide and iron ions in the orange II solution (0.05 mM), separately. Fenton
process with the catalyst 2 was investigated.
Blank experiments are shown in Figure 4.1. Results showed that neither decolorizing of
Orange II occurs in the presence of Fe ions alone from the synthetic catalyst (Figure 4.1 A).
The Fe ions alone do not constitute an oxidizing agent and without the presence of hydrogen
peroxide there no generation of hydroxyl radicals. Color removal was also negligible in the
presence of only H2O2 (<1.5% after 3 hours) as shown in the Figure (4.1 B). The amount of
hydroxyl radicals (oxidation potential 2.80 V) formed in this case is almost insignificant, but
the own oxidant action of H2O2 (oxidation potential 1.78 V) justifies the results obtained [85].
Data for A and B are overlayed in Figure 4.1, for this reason only one data serie is observed.
For the Fenton reaction, color degradation increased slightly respect the previous blanks,
but without a significant effect. When the UVA light is incorporated to the H2O2-dye system,
the color degradation increase considerably (>95% after 3 hours). The color removal is high
in this case due to the peroxide photolysis (equations. 3 and 4), reaching color removal of
99% in three hours.
Figure 4.1 Color degradation of Orange II at pH=3 and 0.1g/L of catalyst, A. Fe ions alone (catalyst 2); B. H2O2 alone (10mM); C. Fenton (Catalyst 2 + H2O2 (10mM)); D. H2O2
(10mM) + UVA (10 lamps).
0
0,2
0,4
0,6
0,8
1
0 0,5 1 1,5 2 2,5 3
C/C
0
Time (h)
A
B
C
D
54 Photocatalytic degradation of Orange II dye using zeolite X - Fe catalyst
synthesized from coal fly ash
The Orange II adsorption on synthetic zeolite was also studied. 30 mg of zeolite were added
in 100 ml of Orange II solution (0.1 mM) at pH 3, and the absorbance medition was made
during 24 hours. After three hours, the Orange II concentration had decreased 13.96% and
21 hours later 19%. The amount of Orange II adsorbed by zeolite was calculated by using
the following formula:
Qt =(C0 − Ct)V/1000
W
(13)
where 𝑄𝑡 is the amount of Orange II adsorbed on the zeolite at time t (mg/g), 𝐶0 and 𝐶𝑡 are
initial and concentration at time t of Orange II (mg/L), respectively, V is the volume of Orange
II solution (mL), and W is the weight of the zeolite (g). Quantities of Orange II absorbed at 3
and 24 hours were 0.83 mg/g and 2.17 mg/g, respectively. These amounts are low when
compared with results in other zeolites, wherein the amount of dye may be 8.13 mg/g in 1
hour [87]. But since the zeolitic material is a mixture of zeolites, despite the valuable sorption
characteristics provided by the combination of ion exchange and molecular-sieve properties
in zeolite X, the presence of a more closed structure, as zeolite A, make the adsorption
capacity decrease, as has been shown in another study [88]. It is not posible to ensure if
this adsorption is an advantage or not. While most authors consider positive the
preconcentration of the organic substrates to be oxidized in the vicinity of reactive centres,
others affirm to be a disadvantage to consider that the predominant degradation pathway is
the attack of HO. species on the organic contaminants fraction that is freely dissolved in the
aqueous pore volumen and the adsorbed fraction is nearly unreactive [8].
Fenton process showed poor performance with respect to the photocatalytic process. This
means that H2O2 photolysis plays an important role in the degradation of Orange II. However
the combination of the two processes allows degradation at the highest reaction rate, as will
be shown next.
4.2.1 Analysis of experimental design
As above-mentioned, the objective function to maximize is the reaction rate. A Box Behnken
design (response surface design) was carried out considering three variables: initial
concentration of H2O2, initial concentration of Orange II solution and Fe load in catalyst. The

55
ranges considered for the operating variables were chosen based on literature findings [11],
[12], [25], [89]. In the case of Orange II, concentrations found in industrial effluents are
between 0.02 and 0.15 mM [14].
The 15 experiments indicated in Table 4.1 include the experiments needed to evaluate the
cross-effects between variables and three centre points. The minitab software provided the
order of the experiments in order to minimize systematic errors. The reaction rates were
calculated according to the semi-empirical kinetic model, based on the Fermi’s equation.
The model development and the algorithm used for the experimental data fitting are
presented in section 4.2.7. But in the Table 4.2, data of reaction rate constants obtained for
the 15 runs (experimental design) are presented.
Table 4.2 Conditions employed in the runs performed, and kinetic parameters obtained
after regression using Equation. (20) (CCat= 100 mg L−1).
Run
order
Fe Load
(%)
[OII]
mM
[H2O2]
mM
k (h-1) kcv
(%)
t* (h) t*cv
(%)
r2
Run 1 12 0.03 15 4.716 10.05 0.49 4.78 0.979
Run 2 12 0.1 5 1.866 4.18 1.35 1.98 0.990
Run 3 12 0.1 15 3.252 4.24 0.83 1.61 0.995
Run 4 15 0.05 15 4.464 6.45 0.60 2.52 0.992
Run 5 9 0.1 10 1.410 4.68 1.66 2.11 0.980
Run 6 9 0.05 5 2.472 7.28 0.80 3.53 0.980
Run 7 15 0.03 10 4.026 8.35 0.54 4.01 0.980
Run 8 9 0.03 10 5.892 7.03 0.41 3.14 0.990
Run 9 12 0.05 10 5.568 7.44 0.45 3.30 0.990
Run 10 12 0.03 5 4.980 14.46 0.43 6.92 0.962
Run 11 12 0.05 10 7.416 5.42 0.37 2.27 0.995
Run 12 15 0.1 10 1.812 4.30 1.33 2.01 0.990
Run 13 12 0.05 10 7.554 7.70 0.36 3.27 0.994
Run 14 9 0.05 15 4.980 6.02 0.54 2.37 0.990
Run 15 15 0.05 5 2.844 8.86 0.66 4.57 0.971

56 Photocatalytic degradation of Orange II dye using zeolite X - Fe catalyst
synthesized from coal fly ash
Analysis of response surface design, specifically the analysis of variance, allowed to know
the contribution of each variable in the model. The model includes the two main effects and
the 2-way interaction.
For the linear, square and 2-way interaction model, the p-values are 0.027, 0.015 and 0.534,
respectively. Considering effects are statistically significant when their p-values are less than
0.05, the 2-way interactios effects are negligible respect to the others, being the square the
most significant effects, as shown in the Table 4.3.
Considering just the first-order effects (Linear) the main factor that affects the reaction rate
is the initial Orange II concentration (p-value: 0.008). The effect of Fe load is not significant
having a p-value of 0.57. However, when the square contribution is considerated, all
variables are very important, being the Fe load the greatest effect variable with a p-value of
0.014.
Table 4.3 Summary of the effects after the response surface regression with 5% of significance. Data from analysis in Minitab 17 software.
Term Effect 95% CI T-
Value* P-
Value*
Constant ( 5.459; 8.233) 12.69 0
[OII] -
2.819 (-2.259; -
0.560) -4.26 0.008
Fe load -
0.402 (-1.050; 0.648) -0.61 0.57
[H2O2] 1.313 (-0.193; 1.506) 1.99 0.104
[OII]*[OII] -
3.548 (-3.024; -
0.523) -3.65 0.015
Fe load*Fe load -
3.575 (-3.038; -
0.537) -3.67 0.014
[H2O2]*[H2O2] -
2.738 (-2.619; -
0.118) -2.81 0.037
[OII]*Fe load 1.134 (-0.634; 1.768) 1.21 0.279
[OII]*[H2O2] 0.825 (-0.789; 1.614) 0.88 0.418
Fe load*[H2O2] -
0.444 (-1.423; 0.979) -0.48 0.655
* The t-value is a test statistic for t-tests that measures the difference between an observed sample statistic
and its hypothesized population parameter in units of standard error. The p-value determine whether the results
are statistically significant. A p-value of 0.05 is often used.

57
The coefficients of the quadratic model in the polynomial expression were then calculated
by multiple regression analysis, using Minitab software. Coefficients in the expression
represent the weight of each variable by itself, the weight of the quadratic effect and the
weight of the first-order interactions between the variables. The reaction rate is expressed
in (h-1), Orange II and hydrogen peroxide concentrations in (mM) and the Fe load as (%):
Reaction rate (h-1) = -27.27 + 59.6 X1 + 4.50 X2 + 1.251 X3 – 1448 X12 - 0.1986 X2
2
- 0,0548 X32 + 5.40 X1 X2 + 2,36 X1 X3 - 0,0148 X2 X3 (14)
Where X1, X2 and X3 represent the initial concentration of Orange II in mM, iron oxide
content in wt% and initial concentration of H2O2 in mM.
Analysis of variance and the second order model showed a reasonably fit of the values
predicted by the model and experimental data (R2= 91.7%) for reaction rate of dye oxidation
with 95% confidence level, indicating a good correspondence between the model prediction
and the experiments. For reaction rate the relative errors are always below 8.3%.
Figure 4.2 presents the response surface modeling in a three dimensional representation to
put into evidence the effects of initial Orange II, initial H2O2 concentration and Fe load on
the reaction rate after 3 h of oxidation reaction. The reaction rate decreases as the initial
concentration of Orange II increases, even when the greater load of Fe is used in the
reaction medium (Figure 4.2. (a). Indeed, for low Orange II, initial H2O2 concentration and
Fe load parameters seem to affect positively the final performance. As a general trend,
optimum values exist for each parameter and the range studied for each variable were
appropriately selected. The fact that in some conditions very high H2O2 concentration values
lead to a decrease in the reaction rate is possibly due to the competition between these
species for hydroxyl radicals. Indeed, OH• radicals are quite non-selective, reacting with the
organic matter present but also with other species, as in shown in the next reaction [8]:
H2O2 + OH• → H2O + HO2• (15)

58 Photocatalytic degradation of Orange II dye using zeolite X - Fe catalyst
synthesized from coal fly ash
Moreover an increase in the Fe load, increases the amount of available Fe2+ and therefore
an increase of OH• radicals. Excess of catalyst may however lead to a loss of OH• species
by the following scavenging reaction [85]:
Fe2+ + OH• → Fe2+ + OH− (16)
From the analysis of the response surface the optimal conditions for the Orange II
degradation are closed to the studied centre point. The response optimization, with 95%
confidence level, showed the predicted values for the studied variables. The values for the
inital H2O2 concentration, Initial Orange II concentration and Fe load should be 10.96 mM,
0.051 mM and 11.6 wt% of Fe oxide (8.1 wt% of Fe), respectively.
Following the study of the variables effects during the Orange II photodegradation is
presented. In figures, the data fitting according to the Fermi´s equation is represented by a
solid line.
4.2.2 Effect of initial Orange II concentration
In the implementation of advanced oxidation processes it is important to know the
effectiveness of the process with respect to the initial concentration of the contaminant. This
prior knowledge will allow not only optimize the reactors design but also to know if the use
of a pretreatment is necessary.
Figure 4.3 shows the concentration histories normalized by the initial concentration, C0. The
initial OII concentration showed a negative effect on its reaction rate, i.e., the higher the
initial dye concentration, the lower the oxidation rate was. The reported negative effect at
higher OII concentrations results from the fact that for smaller dye concentrations, the molar
ratio oxidant/parent organic compound is higher (because the amount of hydrogen peroxide
molecules initially present in the reactor is the same). The same inhibiting effect of the
organic initial concentration on the oxidation rate was observed by several authors [21].

59
Figure 4.2 Response surface showing the reaction rate (1/h) of the Orange II solution as a function of: a. X1 and X2 (for X3: 10mM), b. X1 and X3 (for catalyst 2), c. X2 and X3 (for X1
0.05mM).
[H2O2] (mM) 10
Hold Values
2
4
0 0, 406,0
80,0
01
01,0
41
12
01
414
6
Reactio rn )h/1( eta
)%( daol norI
OII] (m[ M)
urface Plot of Reaction raS e (1t h) vs Iron load (%); [OII] (mM)/
a
Iron load (%) 12
Hold Values
2
4
6
40,00,06
0,08 50,10
10
15
6
8
Reacti n ro )h/1( eta
)Mm( ]2O2H[
OII] ([ mM)
urface Plot of Reaction rate ( ;/h) vs [H2O2] (mM)S [OII] (mM)1
b
[OII] (mM) 0,065
Hold Values
10
03,
54,
06,
510
14
21
01
51
06,
5,7
(1/h) etar noitcaeR
)%( daol norI
]2O2H (mM[ )
urface Plot of Reaction rate (1/hS vs Iron load (%); [H2O2] (mM))
c

60 Photocatalytic degradation of Orange II dye using zeolite X - Fe catalyst
synthesized from coal fly ash
Figure 4.3 Effect of the initial dye concentration on the degradation histories (T =20ºC, H2O2 10 mM, initial pH 3, catalyst 2 load 0.1 g/L, 10 UVA lights). The lines represent the
fitting by the model (Equation. (20) with data reported in Table 4.2).
4.2.3 Effect of initial H2O2 concentration
The initial H2O2 concentration has an important role in the organics degradation, because
its directly related to the number of hydroxyl radicals generated. The effect of this variable
was analysed by varying the initial H2O2 dosage (5, 10, 15 mM) keeping the others
parameters constant (Figure 4.4). The initial dye concentration was 0.05 mM and the catalyst
used was the catalyst 2 (8.1 wt% of Fe load). This studied range agrees to the stoichiometric
ratio for a complete mineralization of the dye according to the reaction reported, where 42
moles of H2O2 are needed to completely degrade 1 mol of dye [14]:
0
0,2
0,4
0,6
0,8
1
0 0,5 1 1,5 2 2,5 3
C/C
0
Time (h)
0.03 mM
0.05 mM
0.1 mM
Model

61
Figure 4.4 Effect of the initial H2O2 concentration on the degradation histories (T =20ºC, OII 0.05 mM, initial pH 3, catalyst 2 load 0.1 g/L, 10 UVA lights). The lines represent the
fitting by the model (Equation. (20) with data reported in Table 4.2).
The reaction rate is enhanced with increasing H2O2 concentration of 5 to 10 mm, due to the
formation of hydroxyl radicals. However, when the concentration of H2O2 in solution is 15
mM the reaction rate decreases due to the well-known hydroxyl radicals scavenging effect,
reported in equation (15).
Such reaction reduces the probability of attack of organic molecules by hydroxyl radicals,
and causes the oxidation rate to drop. Although other radicals (HO2•) are produced, their
oxidation potential is much smaller than that of the HO• species. Therefore, in the
subsequent runs, 10 mM of H2O2 will be used [8].
4.2.4 Effect of Fe load onto support
Effect on the reaction rate for different Fe loads was evaluated with a concentration of 0.1
g/L of catalyst and results are presented in Figure 4.5. From previous chapters is known that
zeolite synthesized by hydrothermal treatment from fly ash contains 6.3 wt% of Fe. Catalysts
prepared, catalysts 1 and 2, have additionally 3 wt% and 6 wt%, respectively.
0
0,2
0,4
0,6
0,8
1
0 0,5 1 1,5 2 2,5 3
C/C
0
Time (h)
5 mM
10 mM
15 mM
Model

62 Photocatalytic degradation of Orange II dye using zeolite X - Fe catalyst
synthesized from coal fly ash
Figure 4.5 Effect of the iron load on the degradation histories (T =20ºC, OII 0.05 mM, initial pH 3, catalyst load 0.1 g/L, 10 UVA lights). The lines represent the fitting by the
model (Equation. (20) with data reported in Table 4.2).
With the lowest value of iron, corresponding to the zeolite, there is a color removal, but the
reaction rate is slow. When the amount of Fe available increases, the reaction rate increases
significantly, being higher for the catalyst 1 and having no significant differences between
the two catalysts. This increment occurs because when the amount of Fe2+ increases, more
OH• species are produced and are thus available for the oxidation reaction.
In addition, the difference in the reaction rate for 8.4 to 6.3 wt% Fe loads, also can be
explained from the source of iron. In the case of the prepared catalyst, the iron should be
more accessible for H2O2 (during the forming of hydroxyl radicals) because the iron excess
is due to an impregnation process onto the zeolite structure.
Therefore, high Fe load corresponds to high oxidant loads and scavenging effect becomes
more significant, which leads to the non-productive decomposition of hydrogen peroxide and
limits the yield of hydroxylated (oxidized) organic compounds. Although other radicals (HO2•)
are produced, their oxidation potential is much smaller than that of the OH• species, as
discused above. This result is according with the experimental design. When is considered
only the quadratic effect of iron load, the equation takes the form y = -ax2, suggesting the
0
0,2
0,4
0,6
0,8
1
0 0,5 1 1,5 2 2,5 3
C/C
0
Time (h)
9% Iron oxide
12% Iron Oxide
15% Iron oxide
Model

63
existence of an optimal amount of iron in the reaction medium to maximize the reaction rate.
Besides, an increase of iron content causes a loss of the structure crystallinity and a
significant decrease in BET surface area, as discussed in chapter 3.
4.2.5 Effect of initial pH
The effect of initial solution pH (in the range of 2-4) on the discoloration of 0.05 mM Orange
II was studied in the presence of 10 mM H2O2, 0,1 g/L catalyst 1 and 10 UVA light. Results
are shown in Figure 4.6. The reaction rate increases with an increase in pH values from 2
to 3. In both cases, the reaction is substantially completed after 2 hours and the final
concentration of dye is the same. Moreover, when the pH increases to 4, the reaction rate
decreases considerably.
The first behavior can be explained from the decrease in the generation of hydroxyl radicals
at pH 2 decreases. In this case, the hydrogen peroxide forms the hydroperoxonium ion
(H3O2+) by proton solvation, and therefore does not react with Fe2+. The slow reaction rate
at pH 4 can be ascribed to the stability of H2O2, which starts to rapidly decompose into
molecular oxygen without formation of appreciable amounts of hydroxyl radicals, which is
not capable to efficiently oxidize the organic material. These observations agree well with
typical published results where the optimal pH value for Fenton, Fenton-like and
photoFenton is 3 [8], [10], [11], [14], [21].
4.2.6 Catalyst stability
In heterogeneous photocatalytic processes it is very important to evaluate the stability of the
catalyst and ensure that processes do not have any contribution of homogeneous reactions.
This also facilitates the implementation of large-scale heterogeneous treatments. For this
reason, the iron leaching was estudied for the three pH values. Atomic absorption
measurements at the end of each run, showed that to pH 3 and 4 the iron concentration in
solution was below the detection limit of the equipment (1 mg/L). In the case of pH 2, the
concentration of iron in solution was 3 mg/L that corresponds to 35 wt% of the Fe load in the
catalyst (refereed to the total Fe initially present in the catalyst). This result can be attributed
to the dissolution of iron oxide at very acidic conditions and is an important advantage
because it allows using less acid to acidify the medium. For photoFenton process the optimal
pH value is 3.

64 Photocatalytic degradation of Orange II dye using zeolite X - Fe catalyst
synthesized from coal fly ash
Figure 4.6. Effect of the pH values on the degradation histories (T =20ºC, OII 0.05 mM, H2O2 of 10 mM, catalyst 2 load 0.1 g/L, 10 UVA lights). The lines represent the fitting by
the model (Equation. (20) with data reported in Table 4.2).
Figure 4.7 Effect of the pH recycling on the degradation histories (T =20ºC, OII 0.05 mM, H2O2 of 10 mM, catalyst 2 load 0.1 g/L, 10 UVA lights). The lines represent the fitting by
the model (Equation. (20) with data reported in Table 4.2).
0
0,2
0,4
0,6
0,8
1
0 0,5 1 1,5 2 2,5 3
C/C
0
Time (h)
pH:2
pH:3
pH:4
Model
0
0,2
0,4
0,6
0,8
1
0 0,5 1 1,5 2 2,5 3
C/C
0
Time (h)
Run 1
Run 2
Model
65
Catalyst stability was also evaluated by recycling of the catalyst 2. After the first run, the
catalyst was recovered by filtration and dried overnight at 100 °C. The material was reused
in photodegradation of the dye using the same conditions that in the first run. In Figure 4.6
the slight decrease in reaction rate is observed without affecting the end result.
The contribution of TiO2 content in the color removal was studied. An experiment was
performed using the same content of TiO2 (Aeroxide p25 from Acros organics) present in
the prepared catalysts (about 1 wt% of the catalyst load). The conditions were established:
solution volume 100 mL, initial OII concentration 0.05 mM, initial pH 3, catalyst concentration
0.1 gL-1 and 10 UVA lamps (430 ɥW/cm2) at continuos stirring. The result showed that the
TiO2 content is not enough to make a significant contribution in the dye degradation. Color
removal was less than 1% during the first 15 minutes. After this time there was no change
in the contaminant concentration. The low color removal is associated with the small amount
of catalyst used, which is 1 wt% of the total catalyst charge employed in each run (0.1 gL-1).
Although this result is important to note that despite the small amount of catalyst used was
possible to achieve color degradations higher than 90%.
4.2.7 Kinetic model
Kinetic and mathematical models obtained at laboratorial scale are crucial for further design
of catalytic reactors, their scaling-up and also to predict their performance. A kinetic model
based on Fermi’s function (the mirror image of the logistic function), equation (20), has been
used to describe the kinetic behavior for the Orange II concentration histories [14], [21], [90],
[91]. This function associate only a few adjustable parameters with intuitive meaning.
The mass balance in a slurry batch reactor yields:
dn
dt= −(−r)W
(17)
where n represents the number of moles of the Orange II dye present in the reactor at the
instant t; (−r) is the reaction rate and W stands for the mass of catalyst. Kinetic studies
usually suggest first-order reactions to describe the degradation of pollutants by AOPs [9]–
[11], [92]. For a first-order kinetics ((−r)=kC), and for a constant reaction volume V (liquid
66 Photocatalytic degradation of Orange II dye using zeolite X - Fe catalyst
synthesized from coal fly ash
phase), integration of equation (17) provides an exponential decay of the concentration
along time:
C
C0= exp [−k´ (
W
V) t]
(18)
In this equation k´ represents the pseudo first-order rate constant and the term (W/V)
denotes the catalyst dosage employed, referred as catalyst concentration.
Usually a two-step pseudo-first-order model has been widely employed to describe the
Fenton process characterized by two stages. An induction period where an initial slow
degradation has been often observed and a rapid decay in the pollutant concentracion. This
behavior is represented by an inverse S-shape profile (as shown in Figures. 4.3-4.7), when
the normalized concentration vs. time is graphed.
In the present case such period can be attributed to the time needed for activation of the
surface iron species, because dissolution of the metal for the homogeneous Fenton reaction
is almost negligible. Considering that the concentration decay of the pollutant exhibits two
linear regions (in semi-logarithmic scale), the respective rate constants are determined by
two separate regression analysis. However, the two-step pseudo-first-order approach has
some limitations: the transient period between each linear region is not considered in the
model, the choice of each region is somehow subjective, and the behavior during the
induction period is not exactly linear. Due to these limitations it would be safer to describe
the dye concentration histories in the intermediate regime by a single semi-empirical function
that also accounts simultaneously the influence of all the reaction parameters.
The Fermi’s function has been selected for describe the effect of the main reaction
conditions on the treatment of Orange II by the heterogeneous photocatalytic wet hydrogen
peroxide oxidation process using a Fe-zeolite catalyst. This function is the mirror image of
the logistic function and has been commonly used to describe microbial decay in a closed
habitat as a result of exposure to lethal agents, such as high temperature, radiation or ozone
[21]:
R(t) =1
1 + exp[k´(t − tcl)]

67
(19)
where R(t) is the survival ratio, k´ and tcl a decline or lethality rate constant the time to reach
50% survival. k´ and tcl depend on different parameters, including the chemical and physical
conditions of the medium and environment (e.g., the type of nutrients present, temperature,
pH, and oxygen availability).
The selection of Fermi´s model at these conditions should be based on mathematical
simplicity and because the effect of such factor on the model’s parameters can be
determined experimentally and incorporated in the model. In the study case, the Fermi’s
function can be used in the following form:
C
C0=
1
1 + exp[k(t − t∗)]
(20)
where k stands for the equivalent apparent first-order rate constant but includes the catalyst
dosage (W/V), and t* is the transition time which determines the location of the concentration
curve’s inflection point.
In addition, it is important to remark that all decolorization curves shown previously, exhibit
a profile that is characteristic of the Fermi’s equation (i.e., nearly sigmoid shape, in terms of
dye conversion), which is typical for autocatalytic or radical reactions. In this context, a single
and practical expression, with few adjustable parameters is desired because determination
of large number of parameters by statistical methods does not necessarily yield a unique or
correct solution.
The Marquardt–Levenberg algorithm was employed to find the coefficients (parameters k
and t*) of the independent variables (k and t*) that give the best fit between the equation
and the data, after the Orange II concentration histories were normalized. This algorithm
seeks the values of the parameters that minimize the sum of the squared differences
between observed and predicted values of the dependent variable. The parameters were
obtained after a regression and are gathered in Table 4.2. This table contains the coefficients
of variation (CV) expressed as a percentage (kCV and t*cv, for k and t*, respectively). The
asymptotic standard errors of the parameter measure the uncertainties in the estimates of

68 Photocatalytic degradation of Orange II dye using zeolite X - Fe catalyst
synthesized from coal fly ash
the regression coefficient (analogous to the standard error of the mean). CV(%) is the
normalized version of this error (CV( %)= standard error ×100/parameter value) [91].
In general, the fitting of the model presented in Figures. 4.3-4.7, as well as the respective
kCV (4.2–14.5%), t*CV (1.6–6.9%) and r2 (0.8800–0.9900) shown in Table 4.2, demonstrate
the very good agreement of the model to all experimental data.
To observe the effect of each studied variable in the reaction rate during the oxidation of
Orange II, additional experiments were carried out keeping the conditions at the centre point
values and to pH 3. The effect of the Fe load onto the catalyst was analyzed from the fitted
parameters shown below (Table 4.4). Experiments in italics correspond to additional runs.
Table 4.4 Conditions and kinetic parameters obtained for different Fe loads after regression using Equation. (20) (CCat= 100 mg L−1).
Fe
Load
[OII]
mM
[H2O2]
mM
k (h-1) kcv (%) t* (h) t*cv (%) r2
6.3 0.05 10 2.406 6.230 0.892 2.800 0.983
8.4 0.05 10 7.416 5.420 0.367 2.270 0.996
10.5 0.05 10 6.468 5.380 0.433 2.150 0.996
It was noticed that the rate constant substantially increases when the Fe load is increased
to 8.4 wt%. The reaction rate increases from 2.4 ah 7.4 h-1 which is reflected by the shorter
times required for reaching a 50% conversion level. Data also show that the transition time
(t*) obtained after regression decreased from 0.89 h to 0.37 h with this Fe load increase. A
slight decrease in the rate constant is observed when the iron load is 10.5, confirming the
existence of an optimal Fe load near to the centre point. The model fit is shown in Figure
4.5, where r2 values increase with the Fe load.
Regarding the effect of the initial hydrogen peroxide concentration, additional run was
performed (italics) and the results are compile in Table 4.5. The Fe load and the intial dye
concentration were 10.5 wt% and 0.05 mM, respectively at pH 3.

69
Table 4.5 Conditions and kinetic parameters obtained for different H2O2 concentrations
after regression using Equation. (20) (CCat= 100 mg L−1).
Fe
Load
[OII]
mM
[H2O2]
mM
k (h-1) kcv (%) t* (h) t*cv (%) r2
10.5 0.05 5 2.844 8.860 0.655 4.570 0.971
10.5 0.05 10 6.468 5.380 0.433 2.150 0.996
10.5 0.05 15 4.464 6.450 0.594 2.520 0.992
The k values had the same behavior as in the case of Fe load. The reaction constant
increased for the central point (10 mM) and decreased in the case of the highest initial H2O2
concentration. However the variation between them was less significant than in the previous
study, which could mean less influence of this variable respect to the iron load. In general,
the central oxidant dose had the smaller t* value (Table 4.5), which is associated with the
increase of the Orange II degradation rate reported previously (Figure. 4.4).
From the kinetic analysis it was noticed that the initial dye concentration has a negative
effect on k and an increase in t*, as is shown in Table 4.6.
Table 4.6 Conditions and kinetic parameters obtained for different initial Orange II
concentrations after regression using Equation. (20) (CCat= 100 mg L−1).
Fe
Load
[OII]
mM
[H2O2]
mM
k (h-1) kcv (%) t* (h) t*cv (%) r2
10.5 0.03 10 4.026 8.350 0.540 4.010 0.983
10.5 0.05 10 3.318 5.790 0.744 2.240 0.991
10.5 0.1 10 1.812 4.300 1.330 2.010 0.987
Apparently, when increasing the Orange II concentration, the overall process slows down,
leading to a decrease in the reaction rate and inherently an increase in the transition time.
This is in agreement with Figure. 4.3, where the model is again compared with the
experimental data, revealing a very good adherence.

70 Photocatalytic degradation of Orange II dye using zeolite X - Fe catalyst
synthesized from coal fly ash
Finally, the effect of the initial pH was also evaluated. For this case, the optimal conditions
obtained previously were used to study the influence of this variable. The pH values studied
were 2, 3 and 4. Table 4.7 shows the kinetic parameters for the three cases.
Table 4.7 Conditions and kinetic parameters obtained for different pH after regression using Equation. (20) (CCat= 100 mg L−1).
pH Fe
Load
[OII]
mM
[H2O2]
mM
k (h-1) kcv (%) t* (h) t*cv (%) r2
2 8.4 0.05 10 5.064 6.640 0.727 1.920 0.992
3 8.4 0.05 10 7.554 7.700 0.357 3.270 0.994
4 8.4 0.05 10 0.630 8.570 3.800 4.820 0.880
The rate constant increased slightly when the pH increased from 2 to 3. However, when the
pH increased to 4, the reation rate drastically decreased. This result agrees with the findings
of other studies in which states that pH 3 is the optimal value in processes involving Fenton
reactions. At pH 4, the model fit to the experimental data was not the best, having the lowest
r2 (0.88). This is due to the low reaction rate which relieves the behavior of known profile
data, represented by an inverse S-shape profile (as shown in Figure 4.6).
Comparing the values of the rate constants for the Orange II degradation obtained in this
work (Fermi´s model) with those obtained in previous studies using the same model or the
commonly used pseudo first order model. The result is shown in Table 4.8, where the values
of various rate constants are compiled.
Table 4.8 Condition and kinetic parameters for Orange II degradation by Fenton and photoFenton processes using different Fe-catalysts.
Catalyst
(concentration)
Conditions Kinetic
Model
k (h-1) r2 References
Fe-Bentonite clay
(1 g/L)
[OII]: 0.2 mM
[H2O2]: 10 mM
pH: 3
UVC light
Pseudo
first-order
11.58 0.993 [10]

71
Fe-Zeolite Y (0.2
g/L)
[OII]: 0.1 mM
[H2O2]: 10 mM
pH: 3
without light
(T:30ºC)
Fermi´s
equation
7.43 0.993 [14]
Hydroxyl Fe-
pillared Bentonite
(1 g/L)
[OII]: 0.15 mM
[H2O2]: 10 mM
pH: 3
UV light
Pseudo
first-order
2.46 0.990 [11]
Fe-zeolite X (0.1
g/L)
[OII]: 0.05 mM
[H2O2]: 10 mM
pH: 3
UVA light
Fermi´s
equation
7.42 0.995 This work
The kinetic constants obtained in this work are in the same magnitude order compared with
constants reported in literature for the Orange degradation by Fenton or photoFenton
process. Its difficult to make a comparison between them (different processes and
conditions) but both reported model had a good fit of the eperimental data. In particular, the
kinetic constant value shown in Table 4.8 for this work could be considered appropriate for
the used conditions. This reaction rate is higher than the constant reported for the third case
(initial OII concentration is high. 0.15 mM) but is lower than the first constant, reported when
the UVC light is used (more radiant energy).
Conclusions
In this chapter zeolite X and Fe-Zeolite X catalysts were used in the Orange II degradation
by photoFenton process revealing ability to degrade the dye (>90%) in less than 3 hours.
Among all studied parameters during the dye degradation, the initial Orange II concentration
had a dominant effect. The conversion was in general proportional to the diminution of the
initial dye concentration, according to an inverse proportionality between pollutants

72 Photocatalytic degradation of Orange II dye using zeolite X - Fe catalyst
synthesized from coal fly ash
concentration and oxidation efficiency, typically reported for the catalytic degradation of
many organic compounds.
The response surface analysis revealed the existence of optimal condition for the studied
variables and the high influence of the quadratic effects in the reaction rates constants. The
dye concentration histories obtained from the experimental data were well described by a
semi-empirical equation, based on the Fermi’s distribution function.
The effect of the operating conditions on the transition time is the opposite. When the
apparent rate constant increases the time corresponding to the concentration curve’s
inflection point decreases, and vice-versa. Besides, in general the catalysts exhibit low
leaching levels at pH 3 but when the pH is 2, the iron leaching is important.

73


5. Degradation of wastewater from a clinical laboratory
Abstract
Violet wastewater from a clinical laboratory was treated by PhotoFenton process using the
best conditions resulting of the treatment of the main variables of influence were studied in
the previous chapter. Experiments were carried out to know if was possible to degrade and
mineralize the mixture of pollutants. The amount of catalyst in the reaction medium was
studied in order to determine the influence of this variable on the percentage of discoloration
of the wastewater.
Introduction
Hospitals, health centers and clinical laboratories are establishments of high risk of
contamination, not only within their physical infrastructure, but also outside it, because
through the disposal and management of waste produced in them, pollutants can be
transported to the environment.
In particular, the clinical laboratory is where determinations of human biological properties
that contribute to the study, prevention, diagnosis and treatment of health problems are
made. In addition, in this kind of place is obtained and studied clinical samples such as
blood, urine, stool, synovial fluid, cerebrospinal fluid, throat and vaginal exudates, among
others.
Processes in these laboratories mostly include the use of chemicals that allow the
pathogens identification, such as dyes in staining processes, as well as for fixation and
preservation of tissues such as formaldehyde.
In this chapter, the color degradation of a liquid residue from the clinical laboratory of Family
Compensation Fund, Compensar, in Bogota is studied. The wastewater is generated from

76 Photocatalytic degradation of Orange II dye using zeolite X - Fe catalyst
synthesized from coal fly ash
the Gram stain and Ziehl-Neelsen stain processes used to identify pathogens in the urine of
patients. The composition is a mixture of derivatives of triphenylmethane dye.
5.1 Experimental
Photocatalytic experiments for degradation of an violet aqueous solution of the wastewater
from clinical laboratory was conducted in the same reactor described previously. The violet
color comes from the main component, the crystal violet, additionally basic and acid fuchsins
can be found. In a typical run the reactor was loaded with 100 ml of the wastewater solution
diluited to 5% v/v from a stock solution, which have a Chemical Oxygen Demand (COD) of
27400 mg L-1. The pH of the diluted solution is 3.8, and this value was maintained at the
start of each experiment in order to avoid increasing costs and considering the use of
photoFenton process in the treating of this wastewater at pilot scale. The total organic
carbon content of the diluited solution correspond to 96.93 mg L-1. The initial load of H2O2
was fixed to 10 mM and the beginning of the reaction was considered when H2O2 and the
catalyst 1 (12 wt% iron oxide) were added together. Two differents catalyst load were
evaluated 0.1 and 0.7 g L-1. The clinical waste absorbance histories were follow by a UV–
vis Spectrophotometer for three hours at λ = 525 nm, according to the recommendations of
the Ministerio de Ambiente y Desarrollo Sostenible of Colombia in the 631 resolution of 2015
and to know the percentage of colour degradation considering the change in the measured
absorbance. The total organic carbon (TOC) was measured for the two resultant wastewater
after treatment and the iron leaching from the support was quantified in the both cases and
using the same equipment as in the previous chapter.
5.2 Results and discussion
It is quite possible to stain different tissue components in different colours with different acid
dyes. For the study case, three dyes are recognized in the wastewater. Crystal Violet is a
triarylmethane dye, used as a histological stain and in Gram’s method of classifying bacteria.
Crystal Violet has antibacterial, anti fungal, and anthelmintic properties and was formerly
important as a topical antiseptic [93]. The other dyes, acid and basic fuchsin possess other
chemical characteristics that are useful in revealing certain cell and tissue constituents [94].
Table 5.1 shows the evaluation results of certain parameters for the wastewater containing
the three dyes, as obtained in the clinical laboratory.
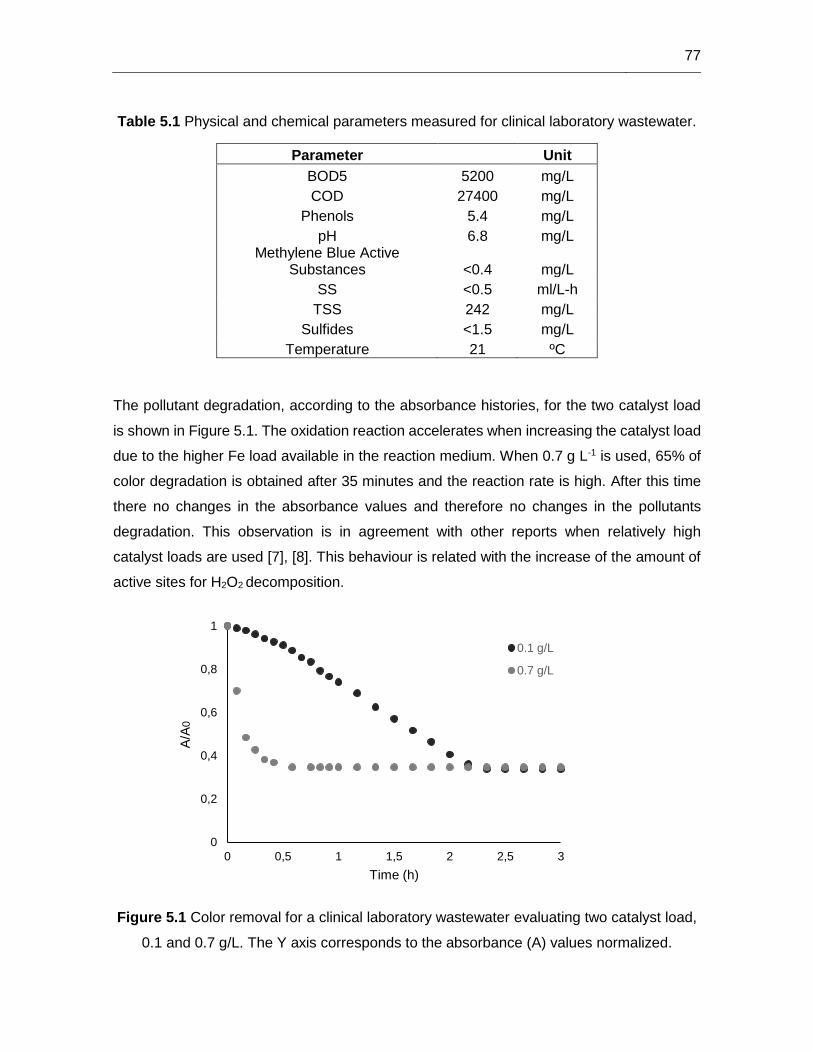
77
Table 5.1 Physical and chemical parameters measured for clinical laboratory wastewater.
Parameter Unit
BOD5 5200 mg/L
COD 27400 mg/L
Phenols 5.4 mg/L
pH 6.8 mg/L Methylene Blue Active
Substances <0.4 mg/L
SS <0.5 ml/L-h
TSS 242 mg/L
Sulfides <1.5 mg/L
Temperature 21 ºC
The pollutant degradation, according to the absorbance histories, for the two catalyst load
is shown in Figure 5.1. The oxidation reaction accelerates when increasing the catalyst load
due to the higher Fe load available in the reaction medium. When 0.7 g L-1 is used, 65% of
color degradation is obtained after 35 minutes and the reaction rate is high. After this time
there no changes in the absorbance values and therefore no changes in the pollutants
degradation. This observation is in agreement with other reports when relatively high
catalyst loads are used [7], [8]. This behaviour is related with the increase of the amount of
active sites for H2O2 decomposition.
Figure 5.1 Color removal for a clinical laboratory wastewater evaluating two catalyst load,
0.1 and 0.7 g/L. The Y axis corresponds to the absorbance (A) values normalized.
0
0,2
0,4
0,6
0,8
1
0 0,5 1 1,5 2 2,5 3
A/A
0
Time (h)
0.1 g/L
0.7 g/L

78 Photocatalytic degradation of Orange II dye using zeolite X - Fe catalyst
synthesized from coal fly ash
The color removal rate, when the catalyst load is 0.1 g L-1, is very slow. At the first 35 minutes
the color degradation is 11%. However after 180 minutes its possible to obtain a color
degradation closed to 80%, which is above of the value obtained with a catalyst load of 0.7
g L-1. The iron leaching measured by atomic absorption was negligible, being below the
detection limit of the equipment. Respect to the total organic carbon measurement, results
revealed no representative decline, although it was relatively greater in the case of larger
catalyst charge. The decrease in the organic loading was 3.7% and 5.8% for loads of 0.1 g
L-1 and 0.7 g L-1 catalyst respectively. The low removal of TOC is possibly due to the lower
oxidation rate of reaction products and the development of parallel reactions between
excess ferrous iron and hydroxyl radicals (see Equation. (21)), or to the scavenging of those
or other radicals by present iron species (equations 22-24):
Fe2+ + OH● → OH− + Fe3+ (21)
FeOH+ + OH● → Fe3+ + 2OH− (22)
Fe2+ + HO2● → Fe3+ + HO2
− (23)
Fe3+ + HO2● → Fe2+ + O2 + H+ (24)
Conclusions
In general dyes are known to resist conventional physicochemical and biological treatment
due to their high degree of polarity and complex molecular structure. This chapter studied
aimed at treating a mixture of dyes, derivatives of triphenylmethane with photoFenton
process, using two different loads of Fe-zeolite catalyst. Results have demonstrated that
during photoFenton treatment decolorization was above of 60% for both cases during 180
minutes but was not possible appreciable TOC removals.

79
Nevertheless, photoFenton process can be recommended for oxidative color and partial
organic carbon removal. The results could be improved if the pH is reduced to 3 and another
treatment process is used previously, thinking about the economic viability of the process.

80 Photocatalytic degradation of Orange II dye using zeolite X - Fe catalyst
synthesized from coal fly ash

81
6. Conclusions and Recommendations
The research allowed achieving the proposed objectives. The objectives in the initial
propose were: 1. to synthesize zeolite X from a solid waste (fly ash) by a reported method
2. To prepare heterogeneous catalysts supporting iron on the synthetic zeolite, 3. To
characterize the catalysts prepared and 4. to measure, by spectrophotometry, the
photocatalytic degradation of the Orange II dye using the synthetic catalysts in photoFenton
process. All of them were completed and additionally was possible to study two important
variables in the synthesis of the zeolite.
In chapter 2, the effectiveness of the hydrothermal treatment in the zeolitic material
synthesis from an industrial waste, as is the coal fly ash, was evident and a product of higher
added value was obtained. Alkaline fusion of an ash: NaOH mixture with 1: 1.2 ratio
previously to the hydrothermal treatment allowed the extraction of silicon and aluminum for
obtaining the zeolitic material. After 6 hours of hydrothermal treatment, it was possible to
obtain zeolitic material with an important specific area, but with 8 hours, this material was
obtained with a specific surface area much higher than the area of the starting fly ash. The
SEM micrographs reflect an increase in crystal size with increasing time of hydrothermal
treatment. Higher crystallinity and purity of the material was also observed. The aging time
effect was important. The zeolite crystallinity increased when the aging time increased from
0 to 24 hours. BET area also increased, but not enough to mitigate the economic cost arises
from the additional time required for the aged zeolite synthesis. In none of the studied cases
was possible to obtain a pure zeolitic material. Zeolite X was synthesized with zeolite A.
A wet impregnation method for the catalysts preparation was used in chapter 3. Iron was
deposited on the synthetic zeolite for a later use in the photoFenton process. With this
methodology two catalysts with different amounts of supported iron on the zeolite were
synthesized, 12 and 15 wt% of iron oxide. The XRD analysis showed the crystallinity loss of
the catalysts structure with increasing the iron load on the zeolite. The surface area also
decreased by 5 and 7.5 times with respect to the zeolite area for Catalyst 1 and Catalyst 2,
respectively. It was possible to find the maximun iron load, impregnated on the zeolite,

82 Photocatalytic degradation of Orange II dye using zeolite X - Fe catalyst
synthesized from coal fly ash
without the structure, morphology and textural properties of the catalyst were greatly
affected.
The fourth chapter includes the results of the Orange II photodegradation using synthetic
zeolite and catalysts prepared in Chapters 2 and 3, respectively. Effects of the initial
concentrations of contaminants and hydrogen peroxide, and the iron load were determined
by a Box Behnken design from 15 experiments. According to the analysis of variance, the
variable with more influence on the reaction rate constant was the initial concentration of
Orange II. However when the quadratic effects are considered, all variables had an
important role in the pollutant concentration histories, especially iron load. Cross-effects
were not significatives. Response surfaces confirmed the existence of optimum values that
promote the reaction rate. The response optimization showed the optimum conditions for
Orange II degradation by the photoFenton process and from the synthesized material: the
optimal values for the inital H2O2 concentration, initial Orange II concentration and Fe load
should be 10.96 mM, 0.051 mM and 11.6 wt% of Fe oxide (8.1 wt% of Fe), respectively.
A semi-empirical model based on the Fermi´s equation to describe the rate of degradation
of Orange II was used. The concentration histories of the pollutant were characterized by an
inverse S-shape profile . It was found that the initial OII concentration showed a negative
effect on its reaction rate. The reaction rate was enhanced with increasing H2O2
concentration of 5 to 10 mm, but when the concentration of H2O2 in solution was 15 mM the
reaction rate decreases. The effect of iron load in the catalyst had the same behavior,
confirming the existence of optimal conditions as shown in response surface analysis. The
used model had a good parameters fitting. The TOC removal at the optimal conditions was
closed to 50% after 180 minutes. Prepared catalysts showed a good stability at pH 3. Iron
leaching was observed in experiment at pH 2.
The optimal conditions in Chapter were employed in the degradation of a wastewater from
a clinical laboratory. Photodegradation was performed to pH 3.8 (sample pH) in order to
evaluate the process effectiveness with the smaller sample processing. Two different iron
loads were evaluated. Results have demonstrated that during photoFenton treatment
decolorization was above of 60% for both cases durin 180 minutes but was not possible
appreciable TOC removals.
83
Further research and characterization can be performed to enrich the analysis presented in
this thesis. It would be useful to optimize the conditions of zeolite synthesis to obtain a pure
zeolite X. The fly ash/NaOH ratio and the stirring time of the synthesis gel could be studied.
Respect to the preparation and characterization of the synthetic catalysts contained in the
chapter 3, would be important to quantify the amount of iron that was exchanged for sodium
ions during the impregnation process by another technique. Besides, the oxidation state of
iron species forming the prepared catalysts could be studied by X-ray photoelectron
spectroscopy (XPS) in order to obtain greater reliability of the reaction mechanism for the
photofenton process in the Orange II degradation.
In this work, low catalyst loading was used compared with other studies reporting catalyst
concentrations 10 times higher. This definitely is an advantage because color degradations
higher than 90% were obtained with a small catalyst amount. It would be important to study
this parameter in order to see whether it is possible to increase the TOC removal and
achieve complete mineralization of the pollutant. Similarly it could assess whether the TiO2
content in zeolite and catalysts has a significant contribution in the photodegradación of
studied dye.
Finally, It would be interesting to investigate the influence of pH to values higher than those
used in this work. Many studies have reported the efficiency of photocatalytic process even
at neutral pH.

84 Photocatalytic degradation of Orange II dye using zeolite X - Fe catalyst
synthesized from coal fly ash

7. Annex: Photocatalytic reactor
Figure 7.1 Pictures showing the parts of the reactor. All the experiments reported in this thesis used quartz reactor irradiated by 10 UVA lamps incorporated into a cabin [95].

86 Photocatalytic degradation of Orange II dye using zeolite X - Fe catalyst
synthesized from coal fly ash
References 87
References
[1] I. Arslan-Alaton, B. H. Gursoy, and J.-E. Schmidt, “Advanced oxidation of acid and
reactive dyes: Effect of Fenton treatment on aerobic, anoxic and anaerobic
processes,” Dye. Pigment., vol. 78, no. 2, pp. 117–130, Aug. 2008.
[2] E. J. R. Almeida and C. R. Corso, “Comparative study of toxicity of azo dye Procion
Red MX-5B following biosorption and biodegradation treatments with the fungi
Aspergillus niger and Aspergillus terreus.,” Chemosphere, vol. 112, pp. 317–22, Oct.
2014.
[3] A. Georgi and F.-D. Kopinke, “Interaction of adsorption and catalytic reactions in
water decontamination processes,” Appl. Catal. B Environ., vol. 58, no. 1–2, pp. 9–
18, Jun. 2005.
[4] B. Bakheet, S. Yuan, Z. Li, H. Wang, J. Zuo, S. Komarneni, and Y. Wang, “Electro-
peroxone treatment of Orange II dye wastewater.,” Water Res., vol. 47, no. 16, pp.
6234–43, Oct. 2013.
[5] X. Doménech, W. Jardim, and M. Litter, “Procesos Avanzados de Oxidación para la
eliminación de contaminantes,” in CYTED, 2001.
[6] P. S. M. Santos and A. C. Duarte, “Chemosphere Fenton-like oxidation of small
aromatic acids from biomass burning in water and in the absence of light : Implications
for atmospheric chemistry,” vol. 119, pp. 786–793, 2015.
[7] R. S. Karale, B. Manu, and S. Shrihari, “Fenton and Photo-fenton Oxidation
Processes for Degradation of 3-Aminopyridine from Water,” APCBEE Procedia, vol.
9, no. Icbee 2013, pp. 25–29, 2014.
[8] J. H. Ramirez, F. J. Maldonado-Hódar, a. F. Pérez-Cadenas, C. Moreno-Castilla, C.
a. Costa, and L. M. Madeira, “Azo-dye Orange II degradation by heterogeneous
88 Photocatalytic degradation of Orange II dye using zeolite X - Fe catalyst
synthesized from coal fly ash
Fenton-like reaction using carbon-Fe catalysts,” Appl. Catal. B Environ., vol. 75, no.
3–4, pp. 312–323, Sep. 2007.
[9] S. Kourdali, A. Badis, and A. Boucherit, “Degradation of direct yellow 9 by electro-
Fenton: Process study and optimization and, monitoring of treated water toxicity using
catalase.,” Ecotoxicol. Environ. Saf., vol. 110, pp. 110–20, Dec. 2014.
[10] J. Feng, X. Hu, and P. L. Yue, “Effect of initial solution pH on the degradation of
Orange II using clay-based Fe nanocomposites as heterogeneous photo-Fenton
catalyst.,” Water Res., vol. 40, no. 4, pp. 641–6, Feb. 2006.
[11] J. Chen and L. Zhu, “Catalytic degradation of Orange II by UV-Fenton with hydroxyl-
Fe-pillared bentonite in water.,” Chemosphere, vol. 65, no. 7, pp. 1249–55, Nov.
2006.
[12] T. L. P. Dantas, V. P. Mendonça, H. J. José, a. E. Rodrigues, and R. F. P. M. Moreira,
“Treatment of textile wastewater by heterogeneous Fenton process using a new
composite Fe2O3/carbon,” Chem. Eng. J., vol. 118, pp. 77–82, 2006.
[13] M. Neamţu, C. Zaharia, C. Catrinescu, A. Yediler, M. Macoveanu, and A. Kettrup,
“Fe-exchanged Y zeolite as catalyst for wet peroxide oxidation of reactive azo dye
Procion Marine H-EXL,” Appl. Catal. B Environ., vol. 48, pp. 287–294, 2004.
[14] M. L. Rache, A. R. García, H. R. Zea, A. M. T. Silva, L. M. Madeira, and J. H. Ramírez,
“Azo-dye orange II degradation by the heterogeneous Fenton-like process using a
zeolite Y-Fe catalyst-Kinetics with a model based on the Fermi’s equation,” Appl.
Catal. B Environ., vol. 146, pp. 192–200, Mar. 2014.
[15] A. H. Gemeay, I. a. Mansour, R. G. El-Sharkawy, and A. B. Zaki, “Kinetics and
mechanism of the heterogeneous catalyzed oxidative degradation of indigo carmine,”
J. Mol. Catal. A Chem., vol. 193, pp. 109–120, 2003.

References 89
[16] N. M. Musyoka, R. Missengue, M. Kusisakana, and L. F. Petrik, “Conversion of South
African clays into high quality zeolites,” Appl. Clay Sci., vol. 97–98, pp. 182–186, Aug.
2014.
[17] A. Ruiz-Román, J., Santos, C. A., Cambronero, L., Corpas, F., Alfonso, M., & Moraño,
“Aprovechamiento de las cenizas volantes, clase F, de centrales térmicas para la
fabricación de materiales cerámicos,” Boletín la Soc. Española Cerámica y Vidr., vol.
39, pp. 229–331, 2000.
[18] A. Babuponnusami and K. Muthukumar, “A review on Fenton and improvements to
the Fenton process for wastewater treatment,” J. Environ. Chem. Eng., vol. 2, no. 1,
pp. 557–572, 2014.
[19] F. Gozzi, A. Machulek, V. S. Ferreira, M. E. Osugi, A. P. F. Santos, J. A. Nogueira,
R. F. Dantas, S. Esplugas, and S. C. de Oliveira, “Investigation of chlorimuron-ethyl
degradation by Fenton, photo-Fenton and ozonation processes,” Chem. Eng. J., vol.
210, pp. 444–450, 2012.
[20] C. M. Teh and A. R. Mohamed, “Roles of titanium dioxide and ion-doped titanium
dioxide on photocatalytic degradation of organic pollutants (phenolic compounds and
dyes) in aqueous solutions: A review,” J. Alloys Compd., vol. 509, no. 5, pp. 1648–
1660, 2011.
[21] J. Herney-Ramirez, A. M. T. Silva, M. a. Vicente, C. a. Costa, and L. M. Madeira,
“Degradation of Acid Orange 7 using a saponite-based catalyst in wet hydrogen
peroxide oxidation: Kinetic study with the Fermi’s equation,” Appl. Catal. B Environ.,
vol. 101, pp. 197–205, 2011.
[22] S. Rahim Pouran, a. R. Abdul Aziz, and W. M. A. Wan Daud, “Review on the main
advances in photo-Fenton oxidation system for recalcitrant wastewaters,” J. Ind. Eng.
Chem., vol. 21, pp. 53–69, 2015.
90 Photocatalytic degradation of Orange II dye using zeolite X - Fe catalyst
synthesized from coal fly ash
[23] G. Feng, Z.-H. Lu, D. Yang, D. Kong, and J. Liu, “A first principle study on Fe
incorporated MTW-type zeolite,” Microporous Mesoporous Mater., vol. 199, pp. 83–
92, Nov. 2014.
[24] R. Gonzalez-Olmos, F. Holzer, F.-D. Kopinke, and a. Georgi, “Indications of the
reactive species in a heterogeneous Fenton-like reaction using Fe-containing
zeolites,” Appl. Catal. A Gen., vol. 398, no. 1–2, pp. 44–53, May 2011.
[25] S. H. Tian, Y. T. Tu, D. S. Chen, X. Chen, and Y. Xiong, “Degradation of Acid Orange
II at neutral pH using Fe2(MoO4)3 as a heterogeneous Fenton-like catalyst,” Chem.
Eng. J., vol. 169, no. 1–3, pp. 31–37, May 2011.
[26] Y. Yan, S. Jiang, H. Zhang, and X. Zhang, “Preparation of novel Fe-ZSM-5 zeolite
membrane catalysts for catalytic wet peroxide oxidation of phenol in a membrane
reactor,” Chem. Eng. J., vol. 259, pp. 243–251, Jan. 2015.
[27] V. K. Gupta and Suhas, “Application of low-cost adsorbents for dye removal--a
review.,” J. Environ. Manage., vol. 90, no. 8, pp. 2313–42, Jun. 2009.
[28] C. López, “Oxidación del tinte azo Orange II mediante MnP en\nreactores
enzimáticos operados en continuo,” 2005.
[29] P. Payra P, Dutta, “Zeolites: A Primer,” 2003.
[30] J. M. Martín, “Síntesis, caracterización y aplicaciones catalíticas de zeolitas básicas,”
2001.
[31] C. S. Cundy and P. a. Cox, “The hydrothermal synthesis of zeolites: Precursors,
intermediates and reaction mechanism,” Microporous Mesoporous Mater., vol. 82,
no. 1–2, pp. 1–78, Jul. 2005.
[32] X. Zhang, D. Tang, and G. Jiang, “Synthesis of zeolite NaA at room temperature: The
effect of synthesis parameters on crystal size and its size distribution,” Adv. Powder
Technol., vol. 24, no. 3, pp. 689–696, May 2013.
References 91
[33] M. S. Nabavi, T. Mohammadi, and M. Kazemimoghadam, “Hydrothermal synthesis of
hydroxy sodalite zeolite membrane: Separation of H2/CH4,” Ceram. Int., vol. 40, no.
4, pp. 5889–5896, May 2014.
[34] X. Zhang, D. Tang, M. Zhang, and R. Yang, “Synthesis of NaX zeolite: Influence of
crystallization time, temperature and batch molar ratio SiO2/Al2O3 on the particulate
properties of zeolite crystals,” Powder Technol., vol. 235, pp. 322–328, Feb. 2013.
[35] X. Zhang, D. Tang, and G. Jiang, “Synthesis of zeolite NaA at room temperature: The
effect of synthesis parameters on crystal size and its size distribution,” Adv. Powder
Technol., vol. 24, no. 3, pp. 689–696, May 2013.
[36] D. Vuono, L. Pasqua, F. Testa, R. Aiello, A. Fonseca, T. I. Korányi, and J. B. Nagy,
“Influence of NaOH and KOH on the synthesis of MCM-22 and MCM-49 zeolites,”
Microporous Mesoporous Mater., vol. 97, no. 1–3, pp. 78–87, 2006.
[37] R. Das, S. Ghosh, and M. Kanti Naskar, “Effect of secondary and tertiary alkylamines
for the synthesis of Zeolite L,” Mater. Lett., vol. 143, pp. 94–97, 2015.
[38] J. D. C. Izidoro, D. a. Fungaro, J. E. Abbott, and S. Wang, “Synthesis of zeolites X
and A from fly ashes for cadmium and zinc removal from aqueous solutions in single
and binary ion systems,” Fuel, vol. 103, pp. 827–834, Jan. 2013.
[39] J.-Q. Wang, Y.-X. Huang, Y. Pan, and J.-X. Mi, “Hydrothermal synthesis of high purity
zeolite A from natural kaolin without calcination,” Microporous Mesoporous Mater.,
vol. 199, pp. 50–56, Nov. 2014.
[40] J. Xie, Z. Wang, D. Wu, and H. Kong, “Synthesis and properties of zeolite/hydrated
iron oxide composite from coal fly ash as efficient adsorbent to simultaneously retain
cationic and anionic pollutants from water,” Fuel, vol. 116, pp. 71–76, Jan. 2014.
[41] E. P. Kuncoro and M. Z. Fahmi, “Removal of Hg and Pb in Aqueous Solution using
Coal Fly Ash Adsorbent,” Procedia Earth Planet. Sci., vol. 6, pp. 377–382, 2013.

92 Photocatalytic degradation of Orange II dye using zeolite X - Fe catalyst
synthesized from coal fly ash
[42] C. Hu, “Microstructure and mechanical properties of fly ash blended cement pastes,”
Constr. Build. Mater., vol. 73, pp. 618–625, 2014.
[43] S. M. Shaheen, P. S. Hooda, and C. D. Tsadilas, “Opportunities and challenges in
the use of coal fly ash for soil improvements - A review,” J. Environ. Manage., vol.
145, pp. 249–267, 2014.
[44] C. F. Wang, J. S. Li, L. J. Wang, and X. Y. Sun, “Influence of NaOH concentrations
on synthesis of pure-form zeolite A from fly ash using two-stage method,” J. Hazard.
Mater., vol. 155, no. 1–2, pp. 58–64, 2008.
[45] W. Franus, “Characterization of X-type zeolite prepared from coal fly ash,” Polish J.
Environ. Stud., vol. 21, no. 2, pp. 337–343, 2012.
[46] A. M. Cardoso, A. Paprocki, L. S. Ferret, C. M. N. Azevedo, and M. Pires, “Synthesis
of zeolite Na-P1 under mild conditions using Brazilian coal fly ash and its application
in wastewater treatment,” Fuel, vol. 139, pp. 59–67, 2015.
[47] D. Li, H. Min, X. Jiang, X. Ran, L. Zou, and J. Fan, “One-pot synthesis of Aluminum-
containing ordered mesoporous silica MCM-41 using coal fly ash for phosphate
adsorption.,” J. Colloid Interface Sci., vol. 404, pp. 42–8, 2013.
[48] R. S. Iyer and J. a. Scott, “Power station fly ash - A review of value-added utilization
outside of the construction industry,” Resour. Conserv. Recycl., vol. 31, pp. 217–228,
2001.
[49] W. Panpa and S. Jinawath, “Synthesis of ZSM-5 zeolite and silicalite from rice husk
ash,” Appl. Catal. B Environ., vol. 90, no. 3–4, pp. 389–394, 2009.
[50] C. Santasnachok, W. Kurniawan, and H. Hinode, “Journal of Environmental Chemical
Engineering The use of synthesized zeolites from power plant rice husk ash obtained
from Thailand as adsorbent for cadmium contamination removal from zinc mining,”
Biochem. Pharmacol., vol. 3, no. 3, pp. 2115–2126, 2015.

References 93
[51] M. P. Moisés, C. T. P. Da Silva, J. G. Meneguin, E. M. Girotto, and E. Radovanovic,
“Synthesis of zeolite NaA from sugarcane bagasse ash,” Mater. Lett., vol. 108, pp.
243–246, 2013.
[52] L. Ayele, J. Pérez-Pariente, Y. Chebude, and I. Díaz, “Synthesis of zeolite A from
Ethiopian kaolin,” Microporous Mesoporous Mater., vol. 215, pp. 29–36, 2015.
[53] C. Li, H. Zhong, S. Wang, J. Xue, and Z. Zhang, “A novel conversion process for
waste residue: Synthesis of zeolite from electrolytic manganese residue and its
application to the removal of heavy metals,” Colloids Surfaces A Physicochem. Eng.
Asp., vol. 470, pp. 258–267, 2015.
[54] C. . Rios, C. . Williams, and O. . Castellanos, “Síntesis y caracterización de zeolitas
a partir de la activación alcalina de caolinita y subproductos industriales (cenizas
volantes y clinker natural) en soluciones alcalinas,” BISTUA, vol. 4, no. 2, pp. 60–71,
2006.
[55] F. Azzolina Jury, I. Polaert, L. Estel, and L. B. Pierella, “Enhancement of synthesis of
ZSM-11 zeolite by microwave irradiation,” Microporous Mesoporous Mater., vol. 198,
pp. 22–28, Nov. 2014.
[56] A. Pérez, M. Montes, R. Molina, and S. Moreno, “Modified clays as catalysts for the
catalytic oxidation of ethanol,” Appl. Clay Sci., vol. 95, pp. 18–24, 2014.
[57] N. M. Musyoka, L. F. Petrik, E. Hums, H. Baser, and W. Schwieger, “In situ ultrasonic
diagnostic of zeolite X crystallization with novel (hierarchical) morphology from coal
fly ash.,” Ultrasonics, vol. 54, no. 2, pp. 537–43, Feb. 2014.
[58] M. Ahmaruzzaman, “A review on the utilization of fly ash,” Prog. Energy Combust.
Sci., vol. 36, no. 3, pp. 327–363, 2010.
[59] M. R. El-Naggar, a M. El-Kamash, M. I. El-Dessouky, and a K. Ghonaim, “Two-step
method for preparation of NaA-X zeolite blend from fly ash for removal of cesium
ions.,” J. Hazard. Mater., vol. 154, no. 1–3, pp. 963–72, 2008.
94 Photocatalytic degradation of Orange II dye using zeolite X - Fe catalyst
synthesized from coal fly ash
[60] M. Visa and A. M. Chelaru, “Hydrothermally modified fly ash for heavy metals and
dyes removal in advanced wastewater treatment,” Appl. Surf. Sci., vol. 303, pp. 14–
22, Jun. 2014.
[61] F. F. Brites-Nóbrega, I. a. Lacerda, S. V. Santos, C. C. Amorim, V. S. Santana, N. R.
C. Fernandes-Machado, J. D. Ardisson, A. B. Henriques, and M. M. D. Leão,
“Synthesis and characterization of new NaX zeolite-supported Nb, Zn, and Fe
photocatalysts activated by visible radiation for application in wastewater treatment,”
Catal. Today, vol. 240, pp. 168–175, Feb. 2015.
[62] N. Zwingmann, I. D. R. Mackinnon, and R. J. Gilkes, “Use of a zeolite synthesised
from alkali treated kaolin as a K fertiliser: Glasshouse experiments on leaching and
uptake of K by wheat plants in sandy soil,” Appl. Clay Sci., vol. 53, no. 4, pp. 684–
690, 2011.
[63] H. Liu, T. Shen, T. Li, P. Yuan, G. Shi, and X. Bao, “Green synthesis of zeolites from
a natural aluminosilicate mineral rectorite: Effects of thermal treatment temperature,”
Appl. Clay Sci., vol. 90, pp. 53–60, Mar. 2014.
[64] E. B. G. Johnson and S. E. Arshad, “Hydrothermally synthesized zeolites based on
kaolinite: A review,” Appl. Clay Sci., vol. 97–98, pp. 215–221, Aug. 2014.
[65] E. M. van der Merwe, C. L. Mathebula, and L. C. Prinsloo, “Characterization of the
surface and physical properties of South African coal fly ash modified by sodium lauryl
sulphate (SLS) for applications in PVC composites,” Powder Technol., vol. 266, pp.
70–78, Nov. 2014.
[66] C. W. Purnomo, C. Salim, and H. Hinode, “Synthesis of pure Na–X and Na–A zeolite
from bagasse fly ash,” Microporous Mesoporous Mater., vol. 162, pp. 6–13, Nov.
2012.
[67] E. B. G. Johnson and S. E. Arshad, “Hydrothermally synthesized zeolites based on
kaolinite: A review,” Appl. Clay Sci., vol. 97–98, pp. 215–221, Aug. 2014.

References 95
[68] N. Shigemoto, H. Hayashi, and K. Miyaura, “Selective formation of Na-X zeolite from
coal fly ash by fusion with sodium hydroxide prior to hydrothermal reaction,” J. Mater.
Sci., vol. 28, no. 17, pp. 4781–4786, 1993.
[69] N. M. Musyoka, L. F. Petrik, O. O. Fatoba, and E. Hums, “Synthesis of zeolites from
coal fly ash using mine waters,” Miner. Eng., vol. 53, pp. 9–15, Nov. 2013.
[70] F. Goodarzi and H. Sanei, “Plerosphere and its role in reduction of emitted fine fly ash
particles from pulverized coal-fired power plants,” Fuel, vol. 88, no. 2, pp. 382–386,
2009.
[71] M. Nascimento, P. S. M. Soares, and V. P. De Souza, “Adsorption of heavy metal
cations using coal fly ash modified by hydrothermal method,” Fuel, vol. 88, no. 9, pp.
1714–1719, Sep. 2009.
[72] C. Wang, J. Li, L. Wang, X. Sun, and J. Huang, “Adsorption of Dye from Wastewater
by Zeolites Synthesized from Fly Ash: Kinetic and Equilibrium Studies,” Chinese J.
Chem. Eng., vol. 17, no. 3, pp. 513–521, 2009.
[73] A. Derkowski, W. Franus, H. Waniak-Nowicka, and A. Czímerová, “Textural
properties vs. CEC and EGME retention of Na–X zeolite prepared from fly ash at
room temperature,” Int. J. Miner. Process., vol. 82, no. 2, pp. 57–68, Mar. 2007.
[74] S. Alfaro, C. Rodríguez, M. a. Valenzuela, and P. Bosch, “194_Aging time effect on
the synthesis of small crystal LTA zeolites in the absence of organic template,” Mater.
Lett., vol. 61, pp. 4655–4658, 2007.
[75] S. Rayalu, S. U. Meshram, and M. Z. Hasan, “Highly crystalline faujasitic zeolites from
flyash,” J. Hazard. Mater., vol. 77, no. 1–3, pp. 123–131, 2000.
[76] Q. Li, X. Zhang, M. Xiao, and Y. Liu, “Alumina incorporated with mesoporous carbon
as a novel support of Pt catalyst for asymmetric hydrogenation,” Catal. Commun., vol.
42, pp. 68–72, 2013.
96 Photocatalytic degradation of Orange II dye using zeolite X - Fe catalyst
synthesized from coal fly ash
[77] F. G. E. Nogueira, J. H. Lopes, A. C. Silva, R. M. Lago, J. D. Fabris, and L. C. a
Oliveira, “Catalysts based on clay and iron oxide for oxidation of toluene,” Appl. Clay
Sci., vol. 51, no. 3, pp. 385–389, 2011.
[78] N. H. M. Azmi, O. B. Ayodele, V. M. Vadivelu, M. Asif, and B. H. Hameed, “Fe-
modified local clay as effective and reusable heterogeneous photo-Fenton catalyst
for the decolorization of Acid Green 25,” J. Taiwan Inst. Chem. Eng., vol. 45, no. 4,
pp. 1459–1467, 2014.
[79] E. Basturk and M. Karatas, “Advanced oxidation of Reactive Blue 181 solution: a
comparison between Fenton and Sono-Fenton process.,” Ultrason. Sonochem., vol.
21, no. 5, pp. 1881–5, Sep. 2014.
[80] J. H. Ramirez, C. a. Costa, L. M. Madeira, G. Mata, M. a. Vicente, M. L. Rojas-
Cervantes, a. J. López-Peinado, and R. M. Martín-Aranda, “Fenton-like oxidation of
Orange II solutions using heterogeneous catalysts based on saponite clay,” Appl.
Catal. B Environ., vol. 71, pp. 44–56, 2007.
[81] J. a. van Bokhoven and C. Lamberti, “Structure of aluminum, iron, and other
heteroatoms in zeolites by X-ray absorption spectroscopy,” Coord. Chem. Rev., vol.
277–278, pp. 275–290, Oct. 2014.
[82] K. Góra-marek, K. Brylewska, K. A. Tarach, M. Rutkowska, M. Jabło, M. Choi, and L.
Chmielarz, “Applied Catalysis B : Environmental IR studies of Fe modified ZSM-5
zeolites of diverse mesopore topologies in the terms of their catalytic performance in
NH 3 -SCR and NH 3 -SCO processes,” vol. 179, pp. 589–598, 2015.
[83] B. Garza-Campos, E. Brillas, A. Hernández-Ramírez, A. El-Ghenymy, J. L. Guzmán-
Mar, and E. J. Ruiz-Ruiz, “Salicylic acid degradation by advanced oxidation
processes. Coupling of solar photoelectro-Fenton and solar heterogeneous
photocatalysis,” J. Hazard. Mater., 2015.

References 97
[84] E. Diaz, M. Cebrian, A. Bahamonde, M. Faraldos, A. F. Mohedano, J. a. Casas, and
J. J. Rodriguez, “Degradation of organochlorinated pollutants in water by catalytic
hydrodechlorination and photocatalysis,” Catal. Today, vol. 266, pp. 168–174, 2015.
[85] J. H. Ramirez, C. a. Costa, and L. M. Madeira, “Experimental design to optimize the
degradation of the synthetic dye Orange II using Fenton’s reagent,” Catal. Today, vol.
107–108, pp. 68–76, 2005.
[86] O. Perincek and M. Colak, “Use of Experimental Box-Behnken Design for the
Estimation of Interactions Between Harmonic Currents Produced by Single Phase
Loads,” Int. J. Eng. Res. Appl., vol. 3, no. 2, pp. 158–165, 2013.
[87] X. Jin, B. Yu, Z. Chen, J. M. Arocena, and R. W. Thring, “Adsorption of Orange II dye
in aqueous solution onto surfactant-coated zeolite: Characterization, kinetic and
thermodynamic studies,” J. Colloid Interface Sci., vol. 435, pp. 15–20, 2014.
[88] V. K. Jha, M. Nagae, M. Matsuda, and M. Miyake, “Zeolite formation from coal fly ash
and heavy metal ion removal characteristics of thus-obtained Zeolite X in multi-metal
systems.,” J. Environ. Manage., vol. 90, no. 8, pp. 2507–14, Jun. 2009.
[89] R. Gonzalez-Olmos, U. Roland, H. Toufar, F.-D. Kopinke, and a. Georgi, “Fe-zeolites
as catalysts for chemical oxidation of MTBE in water with H2O2,” Appl. Catal. B
Environ., vol. 89, no. 3–4, pp. 356–364, Jul. 2009.
[90] A. M. T. Silva, J. Herney-Ramirez, U. Söylemez, and L. M. Madeira, “A lumped kinetic
model based on the Fermi’s equation applied to the catalytic wet hydrogen peroxide
oxidation of Acid Orange 7,” Appl. Catal. B Environ., vol. 121–122, pp. 10–19, 2012.
[91] J. Herney-Ramirez, A. M. T. Silva, M. a. Vicente, C. a. Costa, and L. M. Madeira,
“Degradation of Acid Orange 7 using a saponite-based catalyst in wet hydrogen
peroxide oxidation: Kinetic study with the Fermi’s equation,” Appl. Catal. B Environ.,
vol. 101, no. 3–4, pp. 197–205, 2011.
98 Photocatalytic degradation of Orange II dye using zeolite X - Fe catalyst
synthesized from coal fly ash
[92] M. D. G. de Luna, J. I. Colades, C.-C. Su, and M.-C. Lu, “Comparison of dimethyl
sulfoxide degradation by different Fenton processes,” Chem. Eng. J., vol. 232, pp.
418–424, Oct. 2013.
[93] T. C. R. Bertolini, J. C. Izidoro, C. P. Magdalena, and D. a Fungaro, “Full Paper
Adsorption of Crystal Violet Dye from Aqueous Solution onto Zeolites from Coal Fly
and Bottom Ashes,” vol. 5, no. 3, 2013.
[94] E. Kalkan, H. Nadaroglu, N. Celebi, H. Celik, and E. Tasgin, “Experimental study to
remediate acid fuchsin dye using laccase-modified zeolite from aqueous solutions,”
Polish J. Environ. Stud., vol. 24, no. 1, pp. 115–124, 2015.
[95] D. J. Varela, “Evaluación de la viabilidad técnica y de costos de la aplicación de un
proceso avanzado de oxidación fotocatalìtico en el tratamiento de aguas residuales
del sector textil de Bogotá,” Universidad Nacional de Colombia, 2013.