Deger Chala, National University, Gazipur Sadar, Gazipur.
122
ENVIRONMENTAL MANAGEMENT PLAN REPORT of Indesore Sweater Ltd. Deger Chala, National University, Gazipur Sadar, Gazipur. Conducted By ITS Labtest Bangladesh Ltd. Intertek House Bangladesh, Phoenix Tower (2 nd - 3 rd Floor), 407, Tejgaon Industrial Area, Dhaka-1208, Bangladesh. Telephone. +880 2 815 6226-28, +880 2 815 6579-80, Facsimile. + 880 2 912 5866 www.intertek.com
Transcript of Deger Chala, National University, Gazipur Sadar, Gazipur.

ENVIRONMENTAL MANAGEMENT PLAN REPORT
of
Indesore Sweater Ltd.
Deger Chala, National University, Gazipur Sadar, Gazipur.
Conducted By
ITS Labtest Bangladesh Ltd.
Intertek House Bangladesh,
Phoenix Tower (2nd- 3rd Floor), 407, Tejgaon Industrial Area,
Dhaka-1208, Bangladesh.
Telephone. +880 2 815 6226-28, +880 2 815 6579-80, Facsimile. + 880 2 912 5866
www.intertek.com

EMP Report No.: EMP/17/1019
ii
CONTENTS
List of tables vi
List of figures vii
Abbreviation viii
Lexicon x
Executive Summary xiii
Chapter One: Introduction 1
1.1 Background 2
1.2 What is EMP? 3
1.3 Objective of EMP 4
1.4 Purpose of this Report 4
1.5 Methodology 5
1.6 Acknowledgement 5
1.7 Report Structure 5
1.8 Summary 6
Chapter Two: Policy and Legal Consideration 7
2.1 Background 8
2.2 Policies 8
2.2.1 Industrial Policy 1991 8
2.2.2 National Environmental Policy 1992 8
2.2.3 National Conservation Strategy 9
2.2.4 National Environnemental Management Action Plan (NEMAP), 1995 9
2.3 National Legislation 10
2.3.1 Environment Conservation Act 1995 (ECA 1995) 10
2.3.2 Environment Conservation Rules, 1997 11
(Subsequent amendments in 2002 and 2003)
2.4 Environmental Clearance 12
2.5 Environment court Act 2010 12
2.6 Bangladesh Energy Regulatory Commission Act, 2003 (Act No. 13 of 2003). 12
2.7 National 3R Strategy for Waste Management 13

EMP Report No.: EMP/17/1019
iii
2.8 Noise Pollution Rules 2006 13
2.9 National Water Policy, 1999 13
2.10 National Water Management Plan, 2001 (approved in 2004) 14
2.11 Bangladesh Labor Act, 2006 15
Chapter Three: Project description 16
3.1 Introduction 17
3.2 Location and access ways 17
3.3 Type 23
3.4 Layout of the factory 23
3.5 Transport requirements and their modes for incoming and 25
Outgoing materials
3.6 Labor force during operational phase 25
Chapter Four: Production- Processes Description 27
4.1 Production Capacity 28
4.2 Raw Materials 28
4.3 Generator & Boiler Specification 29
4.4 Processes and operations involved in the manufacture 30
Chapter Five: Wastage Disposal 32
5.1 Generation of wastes 33
5.2 Liquid Waste 33
5.3 Effluent Treatment Plant 33
Chapter Six: Existing Environment: Physical 36
6.1 Introduction 37
6.2 Climate 37
6.2.1 Ambient Air Temperature 37
6.2.2 Rainfall 39
6.2.3 Wind Speed 40
6.2.4 Relative Humidity 42
6.3 Geology and Soil 42
6.3.1 Soil 42
6.3.2 Seismicity 47
6.4 Ambient Air Quality 58

EMP Report No.: EMP/17/1019
iv
6.5 Noise 61
6.6 Water Quality 62
Chapter Seven: Environmental Impacts and Mitigations 64
7.1 Land acquisition 65
7.2 Traffic 65
7.3 Drinking Water and Sanitation 65
7.4 Accidents or Occupational Health Hazard 65
7.5 Impact due to Solid Waste 65
7.6 Impact on Air quality 66
7.7 Impact due to Liquid Discharge 72
7.8 Noise and Vibration Impacts 75
Chapter Eight: Environmental Management Plan 79
8.1 Introduction 80
8.2 Management in operation phase 80
8.3 Environmental Monitoring Plan 82
8.3.1 Overview of Impacts and Mitigation Measures 82
8.3.2 Atmospheric Emission Management 83
8.3.3 Management of Solid Wastes 84
8.3.4 Liquid Waste Management 84
8.3.5 Noise and Vibration Level Management 85
8.3.6 Greening Program 85
8.3.7 Monitoring requirement 85
8.3.8 Monitoring Parameters for Operational Phase 86
8.4 Occupational Health and Safety 87
8.4.1 General Requirements 87
8.4.2 Remedial measures 89
8.5 Safety Mitigation Plan 89
8.5.1 Safety Management System 89
8.5.2 Company Safety Policy 90
8.5.3 Safety Responsibilities 90
8.5.4 Management Communication 90
8.5.5 Inspections 90

EMP Report No.: EMP/17/1019
v
8.5.6 Personnel Protective Equipment (PPE) 91
8.5.7 Standard Work Procedure 91
8.5.8 Emergency Procedures 91
8.5.9 Safety 92
8.5.10 Training 92
8.5.11 Record Keeping and Reporting 93
8.6 Applicable laws & considerations 93
Chapter Nine: Risk Assessment and Management 95
9.1 Introduction 96
9.2 Factory Risks Assessment 96
9.3 Managing the Risks 97
9.4 Emergency Response Plan 98
9.4.1 Emergency Response Cell 98
9.4.2 Emergency Preparedness 98
9.4.3 Fire Fighting Services 99
9.4.4 Emergency Medical Services 100
9.4.5 Rescue Services 100
9.4.6 Security Services 100
9.4.7 Public Relations Services 101
9.5 Conclusion 101
Chapter Ten: Conclusion 102
References 104
Disclaimer 105
EMP Report No.: EMP/17/1019
vi
List of tables
Table 1.1: Structure of the report 6
Table 3.1: List of transport 25
Table 3.2: Work Force 26
Table 4.1: List of the equipment of the factory 28
Table 4.2: List of raw materials and chemicals used in production process 28
Table 4.3: List of chemicals used in the facility 29
Table 4.4: Generator & Compressor specification of the factory 29
Table 6.1: Monthly ambient temperature of the factory area in 2012 38
Table 6.2: Monthly ambient temperature of the factory area in 2013 38
Table 6.3: Monthly ambient temperature of the factory area in 2014 38
Table 6.4: Monthly ambient temperature of the factory area in 2015 39
Table 6.5: Monthly ambient temperature of the factory area in 2016 39
Table 6.6: Rainfall statistics in Dhaka in between 2011 to 2015 40
Table 6.7: Rainfall statistics in Gazipur in 2016 40
Table 6.8: Monthly prevailing wind speed of Gazipur for the period of 2012-2016 40
Table 6.9: Average Monthly Relative Humidity of the Project Area in last 5 years 42
Table 6.10: Seismic zone of Bangladesh 50
Table 6.11: Ambient Air Quality 58
Table 6.12: Indoor Air Quality 59
Table 6.13: The test result for noise level assessment 61
Table 8.1: Potentially significant environmental impact during operation phase and 90
Mitigation measures
Table 7.1: Evaluation matrix showing various impacts from the facility 76
Table 8.2: Monitoring plan during operational phase of the factory 92
Table 8.3: General requirements for workers’ health and safety 96

EMP Report No.: EMP/17/1019
vii
List of figures
Figure 3.1: Satellite image of 0.5 km radius of the factory 19
Figure 3.2: Satellite image of 2 km radius of the factory 19
Figure 3.3: Satellite image of 5 kM radius of the factory 20
Figure 3.4: Satellite image of 10 km radius of the factory 20
Figure 3.5: Map of Gazipur District, Bangladesh 21
Figure 3.6: Map of Gazipur Sadar Upazila, Dhaka 22
Figure 5.1: Layout plan for liquid discharge in the facility 35
Figure 6.1: Physiographic map of Bangladesh 45
Figure 6.2: Digital elevation model of Bangladesh 46
Figure 6.3: Regional tectonic setup of Bangladesh with respect to plate configuration 47
Figure 6.4: Digital Elevation Model (DEM) of Bangladesh and surroundings showing 48
Geological faults – potential sources of major earthquakes in Bangladesh
Figure 6.5: Earthquake Zoning Map of Bangladesh 49
Figure 6.6: Seismic Activity of Bangladesh 50
Figure 6.7: Noise level at different areas of the factory 62
Figure 6.8: Ground Water Zoning Map of Bangladesh 63

EMP Report No.: EMP/17/1019
viii
ABBREVIATION

EMP Report No.: EMP/17/1019
ix
ADB Asian Development Bank
BBS Bangladesh Bureau of Statistics
BMD Bangladesh Meteorological Department
CO2 Carbon Dioxide
DOE Department of Environment
ECA Environment Conservation Act 1995
ECR Environment Conservation Rules 1997
EIA Environmental Impact Assessment
EMP Environmental Management Plan
EMS Environmental Management System
IEE Initial Environmental Examination
IFC International Finance Corporation
MoEF Ministry of Environment and Forests
NEMAP National Environmental Management Action Plan
NGO Non-Government Organization
NOx Oxides of Nitrogen
PM2.5 Particulate Matter < 2.5µm
PM10 Particulate Matter < 10µm
SOx Oxides of Sulfur
SPM Suspended Particulate Matter
TSS Total Suspended Solids

EMP Report No.: EMP/17/1019
x
LEXICON

EMP Report No.: EMP/17/1019
xi
Adverse impact: An impact that is considered undesirable.
Ambient air: Surrounding air.
Aquatic: Growing or living in or near water.
Baseline (or existing) conditions: The “baseline” essentially comprises the factual understanding and interpretation of existing environmental, social and health conditions of where the business activity is proposed. Understanding the baseline shall also include those trends present within it, and especially how changes could occur regardless of the presence of the project, i.e. the “No-development Option”.
Bazar: Market.
Beneficial impacts: Impacts, which are considered to be desirable and useful.
Biological diversity: The variety of life forms, the different plants, animals and microorganisms, genes they contain and the ecosystems they form. It is usually considered at three levels: genetic diversity, species diversity and ecological diversity.
Ecosystem: A dynamic complex of plant, animal, fungal and microorganism communities and associated non-living environment interacting as an ecological unit.
Emission: The total amount of solid, liquid or gaseous pollutant emitted into the atmosphere from a given source within a given time, as indicated, for e.g., in grams per cubic meter of gas or by a relative measure, upon discharge from the source.
Endangered species: Species in danger of extinction and whose survival is unlikely if the existing conditions continue to operate. Included among those are species whose numbers have been reduced to a critical level or whose habitats have been so drastically reduced that they are deemed to suffer from immediate danger of extinction.
Environmental effects: The measurable changes, in the natural system of productivity and environmental quality, resulting from a development activity.
Environmental impact assessment (EIA) / Environmental assessment: The systematic, reproducible and interdisciplinary identification, prediction and evaluation, mitigation and management of impacts from a proposed development and its reasonable alternatives, sometimes known as environmental assessment.
Environmental Impact: An estimate or judgment of the significance and value of environmental effects for natural, socio-economic and human receptors.
Environment Management Plan (EMP): A Plan to undertake an array of follow-up activities which provide for the sound environmental management of a project/ intervention so that adverse environmental impacts are minimized and mitigated; beneficial environmental effects are maximized; and sustainable development is ensured.

EMP Report No.: EMP/17/1019
xii
Environmental Management: Managing the productive use of natural resources without reducing their productivity and quality.
Erosion: Process in which wind and water removes materials from their original place; for instance, soil washed away from an agricultural field.
Evaluation: The process of looking back at what has been really done or accomplished.
Fauna: A collective term denoting the animals occurring in a particular region or period.
Field Reconnaissance: A field activity that confirms the information gathered through secondary sources. This field study is essentially a rapid appraisal.
Flora: All of the plants found in a given area.
Habitat: The natural home or environment for a plant or animal.
Household: A household is identified as a dwelling unit where one or more persons live and eat together with common cooking arrangement. Persons living in the same dwelling unit having separate cooking arrangements constitute separate household.
Important Environmental Component: These are environmental components of biophysical or socio-economic importance to one or more interested parties. The use of important environmental components helps to focus the environmental assessment.
Initial Environmental Assessment / Evaluation: Preliminary analysis undertaken to ascertain whether there are sufficient likely significant adverse impacts to warrant a „full‟ EIA. In some countries, use of initial assessment forms a meaning of “screening” proposed projects.
Land use: Types include agriculture, horticulture, settlement, pisciculture and industries.
Mitigation: An action, which may prevent or minimize adverse impacts and enhance beneficial impacts.
Negative Impact: Negative change from the existing situation due to the project. Public involvement / Public consultation: A range of techniques that can be used to inform, consult or interact with stakeholders affected / to be affected by a proposal.
Reversible impact: An environmental impact that recovers either through natural process or with human assistance (e.g. Cutting off fish migration by an embankment might be reversible at a later stage if a proper regulator is built).
Taka: Unit of Bangladeshi currency.
Terrestrial: Living on land.
Thana: Sub-district level of government administration, comprising several unions under district.
Union: Smallest unit of local self-government comprising several villages.
Upazila: Sub-district name. Upazila introduced in 1982.
Zila: Bengali word of district.

EMP Report No.: EMP/17/1019
xiii
EXECUTIVE SUMMARY
The tremendous success of readymade garment exports from Bangladesh over the last two decades has
surpassed the most optimistic expectations. Today the readymade garment sector is a multi-billion-
dollar manufacturing and export industry in the country. The overall impact of the readymade garment
exports is certainly one of the most significant social and economic developments in contemporary
Bangladesh. With over two million women workers employed in semi-skilled and skilled jobs producing
clothing for exports, the development of the apparel export industry has had far-reaching implications
for the society and economy of Bangladesh.
In terms of Bangladeshi garments about half of the firms are woven garments, while knitwear and
sweaters together make up the other half of the industry. Like other industries of Bangladesh, Indesore
Sweater Ltd. is a factory of 100% local investment and export oriented. As a part of complying all the
required national and international guideline Indesore Sweater Ltd. is committed to find out it’s all
possible ways for sustainable development. Finding out its environmental impact is also a process for
that sustainable development along with the requirement from Department of Environment (DoE) of
Bangladesh Government. The Environmental Management Plan (EMP) study report has been prepared
for this project based on baseline environmental quality data in the project area. Identification &
prediction of significant environmental impacts due to existing factory along with Environmental Impact
Statement followed by delineation of appropriate Environmental Management Plan are included in
Report. Indesore Sweater Ltd. has retained INTERTEK to conduct Environmental Management Plan study
for the existing factory.
For this study, the impact zone shall confine within a radius of 5 km from the center of the development
site since the nature of the factory is such that most of the potential impacts are likely to occur within
this area. However, a buffer area extending to 10 km radius from the site has also been studied for any
likely impacts. The methodology for EMP is to establish the baseline environmental setting in the 10 km
radius area, assess the potential impacts of the proposed project components on different
environmental components, develop adequate and feasible mitigation measures (via revising working
practices, adopting cleaner development mechanism or to mitigate where appropriate) so as to keep
residual impacts within acceptable limits and develop monitoring and other measures as necessary to
ensure successful implementation.
The Executive Summary summarizes the findings of the EMP study undertaken in accordance with the
EMP guidelines on similar developed projects. The summary is intended to provide an overview of the
prevailing baseline conditions, key environmental issues and their likely impacts and also list the major
recommended mitigation measures to attenuate the impacts.
The report comprises 12 Sections. 1st Section of the report gives a background and objective of this
study. The scope of work and methodology of the factory followed by EMP process and EMP Team
members are also described in this section. Section 2 describes the different policy and legal
requirements. In section 3 the factory is being described with a detail factory’s description, project
location and traffic zones. Production process, raw material, sources of raw materials & chemicals used

EMP Report No.: EMP/17/1019
xiv
is described in section 4. The description of wastage including solid & liquid with consumption is
described in section 5. Existing physical and biological conditions of the area where the factory is
situated is described in section 6. It has been found that the air (in terms of SPM) & water (in terms of
solid concentration) quality of that area is good like typical urban areas of Bangladesh. The
meteorological condition of that area is tropical monsoon. Noise, air and water quality of this area is
measured and showed in this section.
Prediction and evaluation of impacts are done in section 7. Simple checklists used to identify the impacts
due to installation of the factory. Impact evaluation matrix also provided for easy understanding of
impact in process wise & location wise in Indesore Sweater Ltd.
As the factories uses Diesel as fuel for its power generation, the pollutants of potential concern are
Oxides of Nitrogen (NOx), Suspended Particulate Matter (PM 2.5 & 10), Carbon Dioxide (CO₂) and
Carbon Monoxide (CO), Oxides of Sulfur (SO2). Each of these pollutants is examined to ensure the
Bangladesh emission limit standard, where appropriate, the required emission control techniques would
be incorporated into the mitigation measures. Also this EMP has considered other standards
requirements for all these pollutant content such as USEPA, IFC/World Bank and WHO.
Environmental Management Plan, Disaster Management Plan and Alternative Analysis are also
presented in Section 8 elaborately.
Overview of the baseline environment:
The specific objectives of the baseline study were to gather information on the existing physical
environment, biological-ecological environment, and socio-economic environment of the areas in and
around the factory site to gather and assess peoples ‘perception on different aspects of the factory. This
factory is situated in a tropical, with monsoons, characterized by a change of four season’s area. The
ambient maximum average temperature of 35 degree Celsius was observed where average minimum
temperature was 6.2 degree Celsius during the baseline study. Its annual rainfall is about 2000 mm and
approximately 80% of it occurs during the monsoon. Average monthly rainfall during monsoon period
varies between 300 mm to 450 mm. Maximum daily rainfalls during this period recorded 13 September
2004 is 341 mm. As would be expected, relative humidity during the wet season is significantly higher
than those occurring at other period of the year. General soil types of this area are: non-calcareous grey
floodplain soils, acid basin clays, non-calcareous dark grey floodplain soils, shallow red-brown terrace
soils, deep red-brown terrace soils, brown mottled terrace soils, shallow grey terrace soils & deep grey
terrace soils.
The ambient air quality in the factory area was found complying with the standard from Department of
Environment and IFC/World Bank guideline. The ambient sound quality of the factory mostly found
fulfilling the standards from national and international authorities. The factory is using the water from
the ground water sources. The factory is in a mix industrial & rural setting with greenery. This includes
homesteads, horticulture, roadside plantation, natural vegetation, and agricultural crops. Besides
highland (elevated) forestation and homesteads, the remaining area is mostly lowland and generally
interconnected with certain manmade barriers and kacha roads here and there. But no main river was

EMP Report No.: EMP/17/1019
xv
not in the adjacent area of the factory. Indesore Sweater Ltd. has total land area of 0.92 acre, located in
23.9630714 north latitudes and in 90.39626320000002 east longitudes. It is bounded by forest,
residential area, low laying and crop land in all side of the facility.
Potential Environmental Impact:
The main potential environmental problems, which may arise as a result of construction of
infrastructure, can be grouped as follows-
Atmospheric emissions and Air quality
Water pollution and waste water disposal
Noise
Solid waste generation
All these aspects have been examined and the findings are as follows:
Atmospheric Emission and Air Quality: The factory produced its power from the generator that runs on
Natural gas. Apart from generation of power and steam factory uses natural gas for its boiler machine.
Emission of sulfur dioxide and particulates from the emission of the generator would be insignificant as
the Bangladeshi indigenous natural gas is almost free of Sulphur and particles. Emission of NOx will also
be very low as the air-fuel ratio is high. For NOx reduction, the gas engines will be equipped with low
NOx combustion chambers. As per the emission dispersion modeling, the NOx emission from all the
stacks would be within the WB/IFC standard. Apart from the air emission from Generator and boiler,
factory also has the production process included knit compositing. In knit compositing production
process there is huge potentiality of producing particulate matter like small yarn particles. Also that has
been considered in Ambient Air quality assessment.
Liquid Discharge: The factory produce wastewater from washing section in the production. That waste
water is treated by Effluent Treatment Plant. Apart from that domestic liquid wastes are produced from
the factory by the use of worker.
Noise: The noise impact would be produced by power generator and boiler. The results will be used to
specify noise abatement measurers. Appropriate noise controls have been installed to keep the
neighborhood impact due to noise within the limit of DoE and international standards by using 10 inch
thick wall surrounded by the generator room as it is the main source of noise. PPE for all sections of the
factory has been advised accordingly.
Solid waste Generation: This factory has a small amount of production of solid waste. This solid waste is
basically paper and food waste, chemical container etc. Apart from that food waste is being disposed
according to the govt. legislations.
Apart from all these negative impact, there is a positive impact also for the establishment of this factory.
As it has been evidenced that factory has been established on forest land that was less potential farm
land. Also this land didn’t have any residence before construction of this factory. So, establishing this

EMP Report No.: EMP/17/1019
xvi
factory increased efficiency in term of economical scale of production as well as created employment
opportunity for adjacent community.
It is obvious from noting that many environmental, safety and social requirements outlined in this report
that a comprehensive documents is needed which incorporates these requirements, in order to guide
and track the projects performance from factory operation. That is the essential purpose of this
Environmental Management Plan (EMP) Report.
This EMP report finds that though there are certain adverse environmental impacts associated with the
industrial unit under consideration, those are however manageable. Given the location, proponent’s
commitments, measures undertaken and commitment for further measures to be adopted in due
course of time if needed, Indesore Sweater Ltd. is going to be a nationally important and
environmentally compatible industrial venture.
Last but not least, we would like to express our special gratitude and heartfelt thanks to the factory
personnel for giving us such attention and time maintaining their tight production schedules; we could
not but mentioning the following name:
Akter Ali (Assistant manager-HR & Compliance Officer)
The whole facility was observed, inspected & reviewed by the member of following Environmental
Assessment Team of Intertek Bangladesh.
1. Wadud Ahmed Chowdhury
B.Sc. Engineer (in EEE)
Lead Auditor: ISO 9001:2015; ISO 14001:2004; OHSAS: 18001:2007
2. Shibshankar Dey
Auditor (Environmental & Social)
M. Sc. In Environmental Science 3. Suzan Chandra Deb
M.Sc. in Genetic Engineering & Biotechnology
(Major-Biotechnology, Microbiology & Environmental Science)
Reviewed by:
4. Tamal Kumar Saha
B.Sc. Engineer (in EEE)
Lead Auditor: ISO 9001:2015; ISO 14001:2015; OHSAS: 18001:2007.

EMP Report No.: EMP/17/1019
1
Chapter One Introduction

EMP Report No.: EMP/17/1019
2
1.1 Background
Bangladesh is going to be an industrialized country. Once upon a time agriculture was the main sector of
the country's economy and tea and jute were the main export items. Things have changed in the last 10-
15 years and Bangladesh has switched to second gear from the agricultural sector to the manufacturing
sector. Tea or jute is no more the main export; ready-made garments (RMG) have replaced them. About
3.0 million people are directly related while another 20 million people are indirectly involved in the RMG
sector. Undoubtedly, the garment industry has a significant impact on the economy and image of
Bangladesh. The garment industry is one of the two major foreign exchange generating sources, the
other being remittance from expatriates. The garment industry is providing employment to a huge
number of people especially women who account for 90 per cent of the work force in this industry. Due
to conservative norms and values that exist in the country, women are not able to work in all kinds of
industries. The RMG has provided an excellent opportunity for them to get employment, bringing a
significant change in the demographics of the work force of the country. The success of RMG has given a
positive image to Bangladesh worldwide. Many brand name apparel items are now 'Made in
Bangladesh'. In shopping centers across the USA and Europe, clothes 'Made in Bangladesh' can be
found. People leaving abroad identify Bangladesh as a place where their dresses come from.
Whatever industrial growth that has been achieved in the country, most of the portion has come from
garment sector. Garment sector of Bangladesh is a booming sector and it is increasing day by day with
higher percentages. Sweater industry is doing well. Total 730 industries are in operation now. The
industry fetched $2.83 billion foreign currency in the fiscal 2014-15, out of total apparel export of $31
billion, meaning the sub-sector shares 9 percent of total RMG exports. The sweater industry has aimed
at reaching $8.0 billion export milestone in the year 2020 to fulfill the target of fetching $50 billion from
ready-made garment sector. But the industry people alone cannot make the dream come true. The
nation as a whole should act together in meeting this target. Especially, the government should shoulder
the leading role in taking the sector ahead through adopting a sustained policy and providing necessary
logistic supports including infrastructure and utilities. On the other hand, most of the garment factories
are running without considering environmental issues which are having an adverse impact on our
country. Bangladesh is passing transition period to transform into an industrialized country. The
government fully recognized that it is the high time to think about environmental issues. In the
meantime, buyers and consumers are more conscious about environmental facts before past time. At
present they all together are pushing onto more environmentally friendly products for which
Environmental Management Plan report becomes mandatory for all the factories.
Indesore Sweater Ltd. is running sweater factory. Indesore Sweater Ltd. started its operation in 2014.
The factory is located in Degerchala, National University, Gazipur Sadar, Gazipur. The Project falls under
the "RED" category as per the Environmental Conservation Rules of 1997, which requires submission of
an Environmental Management Plan (EMP) report. The factory has already got no objection certificate
from the Local authority DoE. The EMP report will show the path of the impact of the project in an
environmentally sound manner. In compliance with these requirements, INTERTEK has been assigned by
the Indesore Sweater Ltd. to conduct the Environment Management Plan study and prepare the Report
accordingly.

EMP Report No.: EMP/17/1019
3
1.2 What is EMP?
The city of today is a major performer for the secondary sector of the economy. Manufacturing and
processing facilities not only provide the city with the essential commodity inputs but also provide the
means of living for the populace. Of late, ad-hoc decisions for industrial development have led to an
adverse impact on the local environment at costs which are much higher than the benefits actually
accrued. In view of the deteriorating environmental conditions in and around industrial townships, it has
become necessary to account for the environment while planning for such areas.
An Environmental Management Plan is an implementation plan for mitigation, protection and/or
enhancement measures. The EMP presents in detail how these measures should be operated, the
resources required and the schedule for implementation. It is intended that in the EMP, the
implementation status of protection measures will be elevated to a level suitable for incorporation in
design phase of the proposed project. The project measures which require formulation of detailed
implementation plan.
The EMP document should contain an implementation plan for each of the selected mitigation,
protection and enhancement measures.
In the process of planning, every project should ensure that resources are used with minimum
efficiency, waste generation is minimized, residuals are treated adequately and products are recovered
and recycled to the maximum extent possible. This overall strategy will not only cut down pollution
control costs but also result in savings in the cost of production.
The best strategy for minimizing waste generation at the source is to use minimum sources with
maximum efficiency. For example, the volume of wastewater generated from an industry could be
reduced by improving the efficiency of combustion process. Efforts should be made to conserve water
and energy and to use renewable resources to the greatest extent possible.
Further reduction in waste generation could be achieved through the use of non-waste technologies.
Several non-waste technology operations; such as alternative raw materials and production processes,
equipment redesign, product reformation, by product recovery and recycle, etc. have been developed in
the recent years and these should be used wherever applicable.
Focus must turn to pollution control only after adequate measures have been taken to minimize waste
generation at the source. Here also, the stress should be on by product recovery and recycle rather than
treatment per se. It must be realized that waste is a misplaced resource and its proper management
could result in profitable propositions for the industry in the otherwise deemed non-productive activity
of pollution control.
The total production cycle should be subjected to pollution audit for identification of the points where
the pollutions could be best tackled. A suitable waste treatment scheme should accordingly be
designed. In the operation phase, pollution audit should also involve testing of performance standards
of equipment.
EMP Report No.: EMP/17/1019
4
The ultimate objective of waste management is to meet the stipulated standards at the least cost. The
project proponent should also formulate a suitable scheme for disposal of treated effluent, solid wastes,
and toxic/hazardous material, if any.
The waste residuals subsequent to pollution control measures should be further attenuated by the
development of a green belt around the industry. Green belts not only absorb air and water pollutants
but also help in arresting noise and soil erosion and creating favorable aesthetic conditions. Thus, the
EMP may consist of one or several implementation plans. Each of these should include the following:
1.3 Objective of EMP
The general objectives of this management plan are to study the existing environmental status of the
facility area and to prescribe the steps to upgrade both industrial production and environmental
stability. The specific objectives of the study are given below:
1. To find out how the existing activities may impact environmental factors
2. To study the air and water quality status at different points of industry
3. To study the arrangement of the industries in case an emergency takes place
4. To study the occupational health and safety of the workers
5. To compare the existing level of different environmental parameters and to compare them with
local or international standards (whichever is available/feasible)
Based on the comparison, a set of recommendations will be listed for future planning of the
environmental management of the area under study.
1.4 Purpose of this Report
The purpose of this report is to provide an environmental management plan to demonstrate that there
is no insurmountable environmental problem associated with the Indesore Sweater Ltd.
Environmental Management Plan considered in this report includes:
• Air quality impact;
• Noise impact;
• Water quality impact;
• Sediment contamination;
• Sewerage and sewage treatment implications;
• Waste management implications;
• Land contamination impact;
• Hazard to life;
• Ecological impact;

EMP Report No.: EMP/17/1019
5
• Fisheries impact;
• Heritage impact; and
• Landscape and visual impact
1.5 Methodology
Based on the scope of work as defined earlier, the following steps were followed during the EMP
process:
Undertaking a rapid field survey toward collection of existing Environmental information and data
pertaining to the project area.
Collection of Secondary data from different government and non-government organizations.
Understanding the technical and environmental aspects of the existing facilities;
Identification of potential environmental impacts (along with residual impacts and cumulative
impacts, if any) and evaluation of socio impacts.
Multiple data collection techniques were adopted to collect primary as well as secondary information
required the preparation of overall management plan. Detailed information about the project were
gathered from published literature by BLPGL and from key individuals involved in the project. Several
field visits was carried out by the EMP Team to gather firsthand information on the surrounding
environment of the project site. During this field visit, formal and informal discussions were carried out
with people in and around the project site. Climatic data of the project area was collected from the
Department.
On the basis of collected relevant data, identification of possible impacts has been done using checklists
method. This was followed by evaluation of likely impacts along with the impacts origin and extent. The
possible impacts have been suggested during (EMP).
1.6 Acknowledgement
The EMP Report has been prepared basically with the support of Indesore Sweater Ltd. and also from
various government agencies including Bangladesh Meteorological Department (BMD), Soil
Resource Development Institute (SRDI), Bangladesh Bureau of Statistics (BBS), Bangladesh Water
Development Board (BWDB), Department of Environment (DOE) and Department of Agriculture
Extension (DAE), etc. We would like to say thanks to each organization and its employees for their
contribution in conducting the study.
1.7 Report Structure
The issue and the Corresponding section of the report where it has been addressed is summarized in the
following table.

EMP Report No.: EMP/17/1019
6
Table 1.1: Structure of the report
Sl. No EMP Review Issues
Sections where
Addressed
01 Introduction Chapter One
02 Policy and Legal Consideration Chapter Two
03 Project Description Chapter Three
04 Production-Process Description Chapter Four
05 Waste Disposal Chapter Five
06 Existing Environment: Physical Chapter Six
07 Environmental Impacts and Mitigations Chapter Seven
08 Description on Environmental Management Plan Chapter Eight
09 Risk Assessment and Management Chapter Nine
10 Conclusion Chapter Ten
1.8 Summary
In a nut shell EMP is just an information gathering exercise carried out by the developer and other
bodies which enables a Local Planning Authority to understand the environmental effects of a
development before deciding whether or not it should go ahead. The really important thing about
environmental assessments is the emphasis on using the best available sources of objective information
and in carrying out a systematic and holistic process which should be bias free and allow the local
authority and the whole community to properly understand the impact of the proposed development.
EMP should lead to better standards of development and in some cases development not happening at
all. Where developments do go ahead environmental assessments should help to propose proper
mitigation measures. EMP is meant to be a systematic process which leads to a final product, the
Environmental Statement (ES).
EMP Report No.: EMP/17/1019
7
Chapter Two Policy and Legal Consideration

EMP Report No.: EMP/17/1019
8
2.1 Background
The emerging environmental scenario calls for attention on conservation and judicious use of natural
resources. There is a need to integrate the environmental consequences of the development activities
and for planning suitable measures in order to ensure sustainable development. The environmental
considerations in any development process have become necessary for achieving sustainable
development. To achieve such goals the basic principles to be adopted are:
To enhance the quality of environment in and around the project area by adopting proper
measures for conservation of natural resources;
Prevention of adverse environmental and social impact to the maximum possible extent;
To mitigate the possible adverse environmental and socio-economic impact on the project-
affected areas.
2.2 Policies
2.2.1 Industrial Policy 1991
The Industrial policy of 1991 contains the following clauses in respect of environmental protection
To conserve ecological balance and prevent pollution during industrialization
To take effective steps for pollution control and conservation of environment during
industrialization
To ensure embodying of necessary pollution control and preventive measures by industrial investment
project endangering environment.
2.2.2 National Environmental Policy 1992
Bangladesh National Environmental Policy (GoB, 1992) was approved in May 1992 and sets out the basic
framework for environmental action, together with a set of broad sect oral action guidelines. Key
elements of the policy are:
Maintenance of the ecological balance and overall progress and development of the country
through protection and improvement of the environment.
Protection of the country against natural disasters
Identification the regulation of all types of activities which pollute and degrade the
environment
Ensuring sustainable utilization of all natural resources
Active association with all environmentally-related international initiatives
Environmental policy contains the following specific objectives with respect to the industrial sector:
To adopt corrective measures in phases in industries that causes pollution.
To conduct Environmental Impact Assessments for all new public & private industries.
To ban the establishment of any industry that produces goods cause environmental pollution,
closure of such existing industries in phases and discouragement of the use of such goods
through the development and/or introduction of environmentally sound substitutes.
To ensure sustainable use of raw materials in the industries to prevent their wastage.

EMP Report No.: EMP/17/1019
9
2.2.3 National Conservation Strategy
National Conservation Strategy (GoB/IUCN, 1992) was drafted in late 1991 and submitted to the
Government in early 1992. This was approved in principle; however the final approval of the document
is yet to be made by the cabinet. It underwent a number of modifications over the last five years, and is
waiting to be placed before the cabinet finally sometime in late September 1997. For sustainable
development in industrial sector, the report offered various recommendations; some of those are as
follows:
Industries based on nonrenewable resources should be made to adopt technology which
conserves raw materials, and existing industries should be given incentives to install technical
fixes to reduce wastage rate.
All industries, especially those based on imported raw materials, should be subjected to EMP
and adoption of pollution prevention/control technologies should be enforced.
No hazardous or toxic materials/wastes should be imported for use as raw material.
Import of appropriate and environmentally sound technology should be ensured.
Complete dependence on imported technology & machinery for industrial development
should gradually be reduced so that industrial development is sustainable with local skills
and resources.
2.2.4 National Environnemental Management Action Plan (NEMAP), 1995
National Environmental Management Action Plan, also referred to as NEMAP (GoB, 1995) is a wide-
ranging and multi-faceted plan, which builds on and extends the statements set out in the
National Environmental Policy. NEMAP was developed to address issues and management
requirements during the period 1995 to 2005, and sets out the framework within which the
recommendations of the National Conservation Strategy are to be implemented.
NEMAP has the broad objectives of:
Identification of key environmental issues affecting Bangladesh;
Identification of actions necessary to halt or reduce the rate of environmental
degradation;
Improvement of the natural and built environment;
Conservation of habitats and biodiversity;
Promotion of sustainable development;
Improvement in the quality of life of the people.
One of the key elements of NEMAP is that sectoral environmental concerns are identified. In
outline, the environmental issues of the industrial sector include the following:
Pollution arising from various industrial processes and plants throughout the country
causing varying degrees of degradation of the receiving environment (Air, Water, and Land).
There is a general absence of pollution abatement in terms of waste minimization and
treatment.
Low level of environmental awareness amongst industrialists and entrepreneurs.
Lack of technology, appropriate to efficient use of resources and waste minimization
leading to unnecessary pollution loading in the environment.

EMP Report No.: EMP/17/1019
10
Economic constraints on pollution abatement and waste minimization such as the cost of new
technology, the competitiveness of labor, and intensive production methods as compared to
more modern methods.
Concentration of industry and hence pollution in specific areas which exacerbate localized
environmental degradation and exceed the carrying capacity of the receiving bodies.
Unplanned industrial development has resulted in several industries located within or
close to residential areas, which adversely affects human health and quality of human
environment.
Establishment of industries at the cost of good agricultural lands and in the residential
areas.
Lack of incentives to industrialists to incorporate emission/discharge treatment plant in their
industries.
2.3 National Legislation
2.3.1 Environment Conservation Act 1995 (ECA 1995)
Formal concern at the national level, for the state of environment in Bangladesh can be traced back to
at least Independence and passing of the Water Pollution Control Act in 1973. Under this a small unit
was established in the Directorate of Public Health Engineering (DPHE) to monitor pollution of
ground water and surface water.
In order to expand the scope of environmental management and to strengthen the powers for
achieving it, the Government issued the Environmental Pollution Control Ordinance in 1977. The
ordinance provided for the establishment of an Environmental Pollution Control Board, which was
charged with formulating policies and proposing measures for their implementation. In 1982, the
board was renamed as Department of Environmental Pollution Control (DEPC). Four divisional offices
were established in Dhaka, Chittagong, Khulna and Bogra. A special presidential order again renamed
the DEPC to the Department of Environment (DOE) and placed under newly formed ministry of
Environment and Forest (MoEF) in 1989.
The national environmental legislation known as Environmental Conservation Act, 1995 (ECA'95) is
currently the main legislative document relating to environmental protection in Bangladesh, which
repealed the earlier environment pollution control ordinance of 1997 and has been promulgated in
1995. The main objectives of ECA 1995 are:
Conservation and improvement of environment, and
Control and mitigation of pollution of environment.
The main strategies of the act can be summarized as:
Declaration of ecologically critical areas, and restriction on the operation and process, which can
be carried, out or cannot be initiated in the ecologically critical areas.
Regulation in respect of vehicles emitting smoke harmful for the environment.
Environmental clearance
Regulation of the industries and other development activities - discharge permit.
Promulgation of standards for quality of air, water, noise and soil for different areas for different
purposes.

EMP Report No.: EMP/17/1019
11
Promulgation of standard limit for discharging and emitting waste.
Formulation and declaration of environmental guidelines.
2.3.2 Environment Conservation Rules, 1997 (subsequent amendments in 2002 and 2003)
A set of the relevant rules to implement the ECA‟ 95 has been promulgated (August
1997). the rules mainly consist of:
The national Environmental Quality Standards (EQS) for ambient air, surface water,
groundwater, drinking water, industrial effluents, emissions, noise and vehicular exhaust;
Categorization of industries, development projects and other activities on the basis of
pollution activities of the existing or proposed industries/development projects/activities.
Procedure for obtaining environmental clearance;
Requirement for undertaking & formulating EMP according to categories of
industries/development projects/activities;
Procedure for damage-claim by persons affected or likely to be affected due to polluting
activities or activities causing hindrance to normal civic life.
The Rules incorporate "inclusion lists" of projects requiring varying degrees of environmental
investigation.
Green: Industries/development projects/activities are considered relatively pollution-free and therefore
no require of an environmental clearance certificate from the DOE and no environmental study.
Orange: Industries/development projects/activities fall into two categories. Orange “A” are less
polluted and Orange “B” are moderately polluted required to submit general information, a
process flow diagram and schematic diagrams of waste treatment facilities along with their
application to DOE for obtaining environmental site clearance and environmental clearance.
Red: Industries/development projects/activities are those which may cause significant adverse‟
environmental impacts and are therefore required to submit an EMP report. It should be noted that
they might obtain an environmental site clearance on the basis of an IEE report, and subsequently
submit an EMP report for obtaining environmental clearance along with other necessary papers.
Environmental standards in operation in Bangladesh also Promulgated under the Environment
Conservation Rules 1997. There are standards prescribed for varying water sources, ambient air,
noise, odor, industrial effluent and emission discharges, vehicular emission etc.
The Bangladesh standards intend to impose restrictions on the volume and concentrations of
wastewater/solid waste/gaseous emission etc. discharged into the environment. In addition a
number of surrogate pollution parameters like Biochemical Oxygen Demand, or Chemical Oxygen
Demand; Total Suspended Solids, etc. are specified in terms of concentration and/or total allowable
quality discharged in case of waste water/solid waste. Additionally specific parameters depending on
the manufacturing process are specified such as phenol, cyanide, copper, zinc, chromium etc. Air
emission quality standards refer mostly to concentration of mass emission of various types of
particulate, sulfur dioxide, and oxides of nitrogen and in some cases Volatile organic compounds and

EMP Report No.: EMP/17/1019
12
other substances. The Bangladesh standards in general are less stringent compared to the
developed countries. This is in view to promote and encourage industrialization in the country. The
Bangladesh standards are not for any specific period of time. There is no provision for partial compliance
too.
2.4 Environmental Clearance
Formal DoE guidelines in Bangladesh are set out in “Rules and Regulations under the 1995
Environmental Protection Acts” as published in the official Gazette on August 27, 1997. Any proponent
planning an industrial project is currently required under Paragraph 12 of the Environmental
Protection Acts, 1995 to obtain “environmental clearance letter:” from the Department of
Environment.
The first to obtain environmental clearance is for the project proponent to complete & submit
an application form which may be obtained from the appropriate DoE regional offices as per the
category. The application is accompanied by other supporting documents (i.e. project profile, lay-out
plan, NOC from local authority, Government fees etc.) reviewed by the divisional and district offices of
DOE who has the authority to request supporting documents as applicable. The divisional office has
the power to take decision on Green and Amber-A & B category projects and the Red category projects
are forwarded to head office for approval. The proposed projects receive an environmental site
clearance at the beginning and the environmental clearance subject to the implementation of the
project activities and all mitigation measures suggested in the EMP report or in the application. In
case of Red category, the client needs to submit an EMP report for site clearance and EMP to obtain
EMP approval and environmental clearance.
2.5 Environment court Act 2010
This Act was enacted to provide for the establishment of environment courts. These courts have the
power to impose whatever actions/restrictions/penalties they deem necessary for compliance with the
objectives of the ECA. Further, any offence under the Act is treated in accordance with the Criminal
Procedure Code, and the environment courts would be deemed to be criminal courts. However, in cases
relating to compensation, the courts would follow the Civil Procedure Code and consequently, be
deemed as civil courts. The environment courts also have the ability to convert fines into compensation.
2.6 Bangladesh Energy Regulatory Commission Act, 2003 (Act No. 13 of 2003).
This is An Act to make provisions for the establishment of an independent and impartial regulatory
commission for the energy sector. The Act consists of 14 Chapters divided into 66 sections. This Act
provides for the establishment of the Bangladesh Energy Regulatory Commission to encourage private
investment in the generation of electricity, and transmission, transportation and marketing of gas
resources and petroleum products, etc. (Chapter 2). In chapters 3 and 4 deal with financial matters of
the Commission and with its functions, powers and proceedings. The Government shall have the power
to give policy directives for the development and overall planning in the energy sector (Chapter 5).
Licenses shall be issued by the Commission for the following activities: power generation; energy
transmission; distribution and marketing of energy; supply of energy; and, storage of energy (Chapter 6).
Tariffs on power generation and on supply of energy shall be determined by the Commission in

EMP Report No.: EMP/17/1019
13
consultation with the Government (Chapter 7). The remaining chapters deal with the following: flow of
information; settlements and appeals; offences and penalties; and, provisions of miscellaneous nature.
2.7 National 3R Strategy for Waste Management
What is 3R?
The principle of reducing waste, reusing and recycling resources and products is often called the
"3Rs."
• Reducing means choosing to use items with care to reduce the amount of waste generated.
• Reusing involves the repeated use of items or parts of items which still have usable aspects.
• Recycling means the use of waste itself as resources.
Waste minimization can be achieved in an efficient way by focusing primarily on the first of the 3Rs,
"reduce," followed by "reuse" and then "recycle." The waste hierarchy refers to the "3Rs" i.e., reduce,
reuse and recycle, which classify waste management strategies according to their desirability. The 3Rs
are meant to be a hierarchy, in order of importance. The waste hierarchy has taken many forms over the
past decade, but the basic concept has remained the cornerstone of most waste minimization
strategies. The aim of the waste hierarchy is to extract the maximum practical benefits from products
and to generate the minimum amount of waste.
2.8 Noise Pollution Rules 2006
As per the provision of the existing Environment Conservation Act 1995 which has set limit on noise
pollution, the government has formulated the Noise Pollution (Control) Rules 2006. Under 229 these
rules, it will be easier for the government to control noise pollution particularly the use of microphone
and high level horn. The Ministry of Environment and Forest has fixed the target to reduce the level of
sound pollution of Dhaka City form 90-110 decibel to 45-55 decibel by 2009-10.
Recently Dhaka Metropolitan Police (DMP) has prohibited the use of horns on several city streets to
check sound pollution.
Whereas, the increasing ambient noise in public places from various sources, inter-alia, industrial
activity, construction activity, generators sets, loud speakers, public address systems, vehicular horns
and other mechanical devices have deleterious effect on human health and the psychological wellbeing
of the people. It is considered necessary to regulate and control of noise producing and generating
sources with the objective of maintaining the ambient air quality standards in respect of noise.
2.9 National Water Policy, 1999
As water is essential for human survival, socio-economic development of the country and preservation
of its natural environment, it is the policy of the Government of Bangladesh that all necessary means
and measures will be taken to manage the water resources of the country in a comprehensive,
integrated and equitable manner. The policies enunciated herein are designed to ensure continued
progress towards fulfilling the national goals of economic development, poverty alleviation, food
security, public health and safety, decent standard of living for the people and protection of the natural
environment.
EMP Report No.: EMP/17/1019
14
The water policy of the government aims to provide direction to all agencies working with the water
sector, and institutions that relate to the water sector in one form or another, for achievement of
specified objectives. These objectives are broadly:
a. To address issues related to the harnessing and development of all forms of surface water and
ground water and management of these resources in an efficient and equitable manner
b. To ensure the availability of water to all elements of the society including the poor and the
underprivileged, and to take into account the particular needs of women and children
c. To accelerate the development of sustainable public and private water delivery systems with
appropriate legal and financial measures and incentives, including delineation of water rights and
water pricing
d. To bring institutional changes that will help decentralize the management of water resources and
enhance the role of women in water management
e. To develop a legal and regulatory environment that will help the process of decentralization,
sound environmental management, and improve the investment climate for the private sector in
water development and management
f. To develop a state of knowledge and capability that will enable the country to design future water
resources management plans by itself with economic efficiency, gender equity, social justice and
environmental awareness to facilitate achievement of the water management objectives through
broad public participation
Excessive water salinity in the southwest region is a major deterrent to industrial growth. Also, pollution
of both surface and groundwater around various industrial centers of the country by untreated effluent
discharge into water bodies is a critical water management issue. The policy of the Government in this
regard is that:
a. Zoning regulations will be established for location of new industries in consideration of fresh and
safe water availability and effluent discharge possibilities.
b. Effluent disposal will be monitored by relevant Government agencies to prevent water pollution.
c. Standards of effluent disposal into common watercourses will be set by WARPO in consultation with
DOE.
d. Industrial polluters will be required under law to pay for the cleanup of water- body polluted by
them.
2.10 National Water Management Plan, 2001 (approved in 2004)
The central objectives of the National Water Management Plan are consistent with Policy aims and
national goals. These objectives are:
Rational management and wise-use of Bangladesh’s water resources
People’s quality of life improved by the equitable, safe and reliable access to water for
production, health and hygiene
Clean water in sufficient and timely quantities for multi-purpose use and preservation of the
aquatic and water dependent ecosystems.

EMP Report No.: EMP/17/1019
15
The National Water Management Plan provides a framework within which all concerned with the
development, management and use of water resources and water services in Bangladesh can plan and
implement their own activities in a coordinated and integrated manner, confident that in doing so they
are contributing to achievement of the national goals.
The Plan’s conceptual framework is founded on an assessment of needs, opportunities and constraints
throughout the sector. The assessments made during Plan preparation have highlighted the spatial and
sub-sectoral diversity of the water sector. To facilitate a fully integrated approach, both the analyses
undertaken and the presentation of the Plan are based on eight distinct and defined hydrological
regions.
The planned activity program has been presented in the following eight sub-sectoral clusters:
Industrial Development
Enabling Environment
Main Rivers
Towns and Rural Areas
Major Cities
Disaster Management
Agriculture and Water Management
Environment and Aquatic Resources
2.11 Bangladesh Labor Act, 2006
An Act to amend and consolidate the laws relating to employment of workers, relations between
workers and employers, determination of minimum rates of wages, payment of wages, compensation
for injuries to workers during working hours, formation of trade unions, raising and settlement of
industrial disputes, health, safety, welfare and working conditions and environment of workers and
apprenticeship and matters ancillary thereto.

EMP Report No.: EMP/17/1019
16
Chapter Three Project Description

EMP Report No.: EMP/17/1019
17
3.1 Introduction:
Indesore Sweater Ltd. is a 100% export oriented sweater factory situated in Degerchala, National
University,Gazipur Sadar,Gazipur. Indesore Sweater Ltd. started its journey since 2014, present work
force 3126, total land area of the facility is 40000 sq. feet where area covered by facility building 300000
sq. feet and 2000 sq. feet of land of the facility is covered by green trees & flowers.. Monthly production
capacity is 300000 pieces. This Factory own founded industry. The name of the owner of the facility is-
Mr. Mohammad Rokunzzaman, Chairman. Total investment in this facility is approximately 30000000
BDT only. In this chapter the location, type, materials and utilization and other facilities of the factory is
described.
3.2 Location and access ways
Indesore Sweater Ltd. has total land area of 0.92 acre, located in 23.9630714 north latitudes and in
90.39626320000002 east longitudes. In east side of the facility Dhaka city bypass and in west side of the
facility Matrix style ltd. is situated. In north side and south side of the facility low lying land is occupied.
East Side of the Facility West Side of the facility
North Side of the facility South Side of the Facility

EMP Report No.: EMP/17/1019
18
The 500 m radius satellite map, the 2 km radius satellite map, the 5 km radius satellite map and 10km
radius satellite map of the factory as well as the Gazipur District and Gazipur Sadar Upazilla map are
shown in figure 3.1, 3.2, 3.3, 3.4, 3.5 and 3.6 respectively.
The access way of the factory is very simple. The convenient route of the factory is Dhaka city bypass
which is situated in east side of the factory.
Indesore Sweater Ltd. is just 200 m from Matrix style ltd. & 2.2 km distance from Vogra bypass & and
12.93 km distance from Hazrat Shahjalal International Airport.
Sl. No. Distance from Indesore Sweater Ltd. Important Facilities, Markets & Places
01. Within 0.5 km Matrix Style Ltd., Iris Design Ltd. etc.
02. Within 2 km Deger Chala road, TNZ Apparels etc.
03. Within 5 km Bangladesh National University, Open University,
Rumana fashion Ltd. etc.
04. Within 10 km Tongi Police station, East-West Medical College etc.

EMP Report No.: EMP/17/1019
19
Figure 3.1: Satellite image of 0.5 km radius of the factory
Figure 3.2: Satellite image of 2 km radius of the factory

EMP Report No.: EMP/17/1019
20
Figure 3.3: Satellite image of 5 km radius of the factory
Figure 3.4: Satellite image of 10 km radius of the factory

EMP Report No.: EMP/17/1019
21
Figure 3.5: Map of Gazipur District, Bangladesh

EMP Report No.: EMP/17/1019
22
Figure 3.6: Map of Gazipur Sadar Upazila, Bangladesh.

EMP Report No.: EMP/17/1019
23
3.3 Type
According to the Environmental conservation rules 1997 the industries of Bangladesh are divided in
three types:
Green: Industries/development projects/activities are considered relatively pollution-free and therefore
no require of an environmental clearance certificate from the DOE and no environmental study.
Orange: Industries/development projects/activities fall into two categories. Orange “A” are less
polluted and Orange “B” are moderately polluted required to submit general information, a
process flow diagram and schematic diagrams of waste treatment facilities along with their
application to DOE for obtaining environmental site clearance and environmental clearance.
Red: Industries/development projects/activities are those which may cause significant adverse
environmental impacts and are therefore required to submit an EMP report. It should be noted that
they might obtain an environmental site clearance on the basis of an IEE report, and subsequently
submit an EMP report for obtaining environmental clearance along with other necessary papers.
According to the criteria of the DoE, Indesore Sweater Ltd. falls in RED Category. For this reason,
process flow diagram and schematic diagrams of waste treatment facilities as well as environmental
management plan along with their application to DOE for obtaining environmental clearance is
necessary.
3.4 Layout of the factory:
As Indesore Sweater Ltd. is a sweater factory, maximum equipments are related to make sweater. Unit
wise production layout given below:
Floor name Floor number Floor area (sq. feet)
Administration/Office 5th Floor 15000 Sqft (Approx)
Production unit Ground,1st,2nd,3rd, 4th, 5th ,6th ,7th , 278000 Sqft (Approx)
Storage of raw materials Ground Floor 5000 Sqft (Approx)
Storage of Chemical substances Ground Floor 400 Sqft (Approx)
Rest room/ Day care Ground Floor 300 Sqft (Approx)
Toilet facility Ground,1st,2nd,3rd, 4th, 5th ,6th ,7th, 8th 300000 Sqft (Approx)
Generator Basement 700 Sqft (Approx)
Boiler Ground 600 Sqft (Approx)
Sewing, packing, finishing, trimming and mending section are common in 1st and 3rd floor. Manual
knitting section are common in 4th and 6th floor. In 5th and 7th floor Jacquard section are common. Office
area is also in the 5th floor. Second floor is occupied with winding, linking and sample section.
Treatment related infrastructure Area (sq. feet)
Waste treatment plant 1500 (Approx)
Water treatment plant 500 (Approx)
Hazardous waste storage 450 (Approx)

EMP Report No.: EMP/17/1019
24
Solid waste & sludge storage 350(Approx)
Production areas:
Sewing section Manual knitting section
Jacquard section Trimming & Mending section
Winding section Linking section

EMP Report No.: EMP/17/1019
25
Washing section Finishing section
Land
Indesore Sweater Ltd. has total land area 0.92 acre, located in located in 23.9630714 north latitudes and
in 90.39626320000002 east longitudes. Total 0.92 acre land area & Industries building won by Indesore
Sweater Ltd. authority.
3.5 Transport requirements and their modes for incoming and outgoing materials
Indesore Sweater Ltd. is used their own vehicle for the incoming of the raw materials and the outgoing
of the finishing product. The mode of the transportation use by the factory is small covered van. As the
factory is situated not so far from the highway, for that reason the route for transportation is easy and
convenient.
Table-3.1: List of Transport
Sl. No. Transport Name Quantity
1 Micro Bus 3
2 Car 13
3 Cover Van 01
4 Refrigerator VAN 0
5 Pickup 0
3.6 Labor force during operational phase
Operating time of the facility is average 9.30 hours per day and maximum 10 hours per day. Total 3126
employees engaged in the operation & production, 240 nos. employees engaged in administration &
2880 nos. employees engaged in production process.

EMP Report No.: EMP/17/1019
26
Table-3.2: Work Force of the Facility
Sl. No. Work force No. of Employee
1 Administration 240
2 Production 2880
3 Environmental management 6
Total 3126

EMP Report No.: EMP/17/1019
27
Chapter Four Production- Process Description
EMP Report No.: EMP/17/1019
28
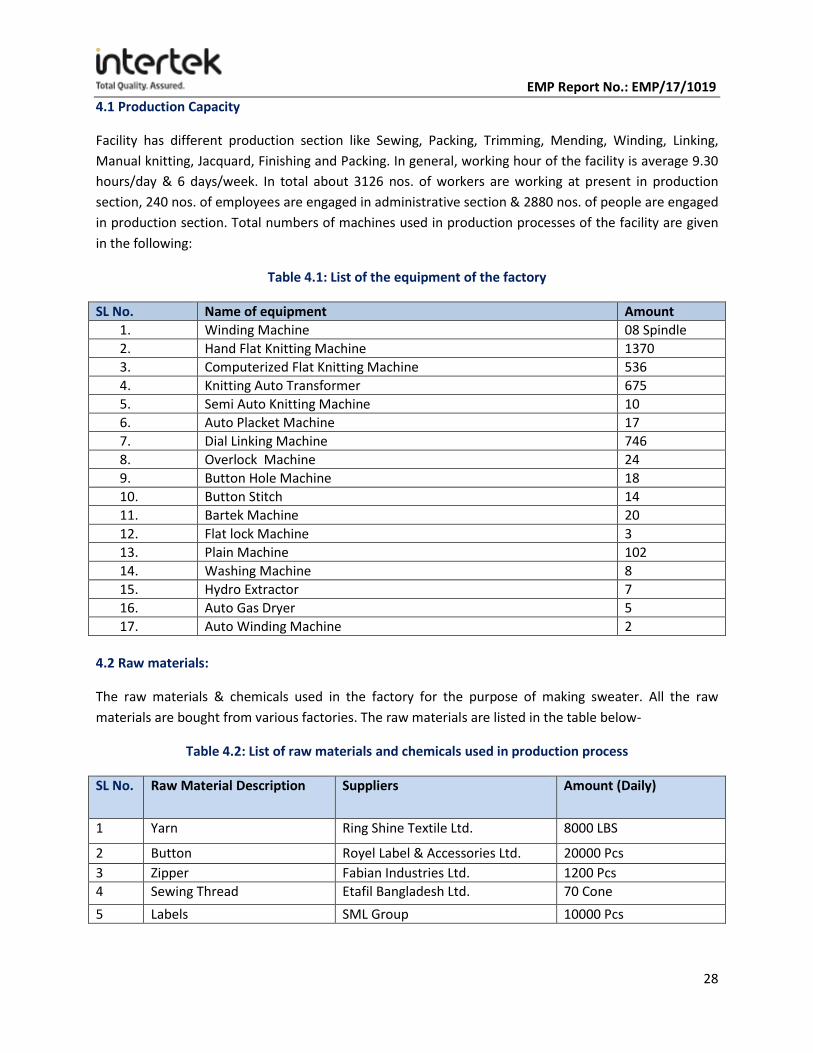
4.1 Production Capacity
Facility has different production section like Sewing, Packing, Trimming, Mending, Winding, Linking,
Manual knitting, Jacquard, Finishing and Packing. In general, working hour of the facility is average 9.30
hours/day & 6 days/week. In total about 3126 nos. of workers are working at present in production
section, 240 nos. of employees are engaged in administrative section & 2880 nos. of people are engaged
in production section. Total numbers of machines used in production processes of the facility are given
in the following:
Table 4.1: List of the equipment of the factory
SL No. Name of equipment Amount
1. Winding Machine 08 Spindle
2. Hand Flat Knitting Machine 1370
3. Computerized Flat Knitting Machine 536
4. Knitting Auto Transformer 675
5. Semi Auto Knitting Machine 10
6. Auto Placket Machine 17
7. Dial Linking Machine 746
8. Overlock Machine 24
9. Button Hole Machine 18
10. Button Stitch 14
11. Bartek Machine 20
12. Flat lock Machine 3
13. Plain Machine 102
14. Washing Machine 8
15. Hydro Extractor 7
16. Auto Gas Dryer 5
17. Auto Winding Machine 2
4.2 Raw materials:
The raw materials & chemicals used in the factory for the purpose of making sweater. All the raw
materials are bought from various factories. The raw materials are listed in the table below-
Table 4.2: List of raw materials and chemicals used in production process
SL No. Raw Material Description Suppliers Amount (Daily)
1 Yarn Ring Shine Textile Ltd. 8000 LBS
2 Button Royel Label & Accessories Ltd. 20000 Pcs
3 Zipper Fabian Industries Ltd. 1200 Pcs
4 Sewing Thread Etafil Bangladesh Ltd. 70 Cone
5 Labels SML Group 10000 Pcs

EMP Report No.: EMP/17/1019
29
Table 4.3: List of chemicals used in the factory
SL No. Chemicals (Non-hazardous)
1. Silicon
2. Softener
3. Detergent
4. F-808
5. TM-50
6. Wash sol-ft-20
4.3 Generator & Compressor Specification
Total two generators and two boilers used in Indesore sweater Ltd. The specification of the total two
generators and two boilers are listed in the table below.
Generator room Boiler room
Table 4.4: Generator & Boiler Specification of the factory
SL No. Description of the Generator Technical Data
1 Generator no. 01
Generator, Brand F.G. WILSON
Capacity 660 KVA
Model P660-1
Origin UK
Fuel Diesel
2 Generator no. 02
Compressor Brand F.G. WILSON
Capacity 660 KVA
Model P660-1
Origin UK
Fuel Diesel
3 Boiler no. 01
Capacity 01 ton
Model 107936
Origin USA

EMP Report No.: EMP/17/1019
30
Boiler no. 02
4 Boiler no. 02
Capacity 01 ton
Model 107937
Origin USA
4.4 Processes and operations involved in the manufacture
The processes of the operation of the factory are very easy. The process flow diagram along with
environmental aspect & impact analysis is provided below:
Production Flow Chart of Packaging Unit
Environmental Aspect Environmental Impact
Dust, Use of electricity
Winding Air, GHG emission
Yarn Dust, Waste generation and making noise
Manual knitting Climate Change, pollution of atmosphere
Use of electricity, Dust
Linking Air, GHG emission
Solid waste generation, Dust
Trimming Air
Solid waste generation, Dust
Mending Air
Use of Electricity and Making Noise, Fabric dust
Sewing Climate Change, pollution of atmosphere, Contamination of
air & Soil
Liquid wastes, Use of electricity
Washing Water, Air & Soil
Electricity Consumption
Iron GHG emission
Use of Electricity, Dust Finishing/PQC Not so much significant
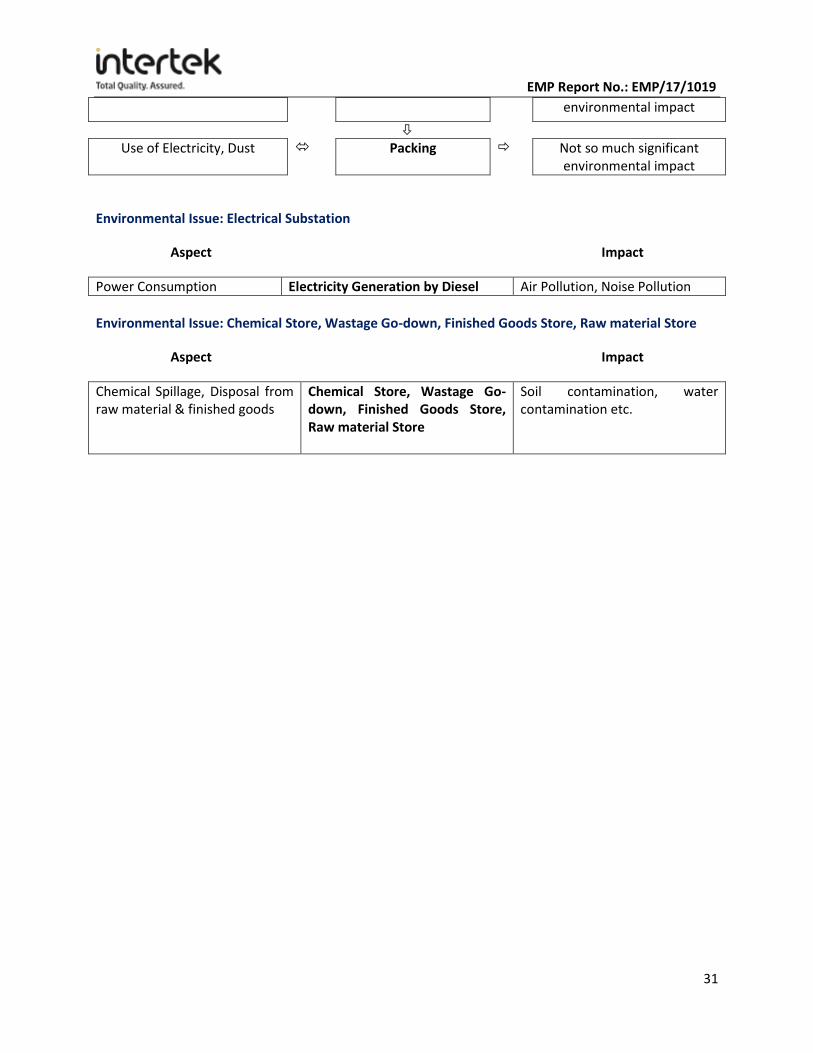
EMP Report No.: EMP/17/1019
31
environmental impact
Use of Electricity, Dust
Packing Not so much significant
environmental impact
Environmental Issue: Electrical Substation
Aspect Impact
Power Consumption Electricity Generation by Diesel Air Pollution, Noise Pollution
Environmental Issue: Chemical Store, Wastage Go-down, Finished Goods Store, Raw material Store
Aspect Impact
Chemical Spillage, Disposal from raw material & finished goods
Chemical Store, Wastage Go-down, Finished Goods Store, Raw material Store
Soil contamination, water contamination etc.

EMP Report No.: EMP/17/1019
32
Chapter Five Wastage Disposal

EMP Report No.: EMP/17/1019
33
5.1Generation of wastes
As the factory has washing process, so the scope of the generation of liquid waste is high and gaseous
waste generated from process and generator, boiler and production machines like jacquard is also
significantly considerable. In the factory also solid waste is generated. The greater portion of the
composition of the solid waste of the factory is chemical container and other rejected accessories.
5.2 Liquid Waste
Waste water generated from the following sections-
Sources Daily amount (Liter) Nature of pollutant
Poisonous Normal
Production process 0 0 0
Washing/Cleaning 98000 liter 0 98000 liter
Domestic sewerage 131000 liter 0 131000 liter
Total 229000 liter
5.3 Effluent Treatment Plant
Liquid waste treated through an effluent treatment plant (ETP) whose capacity is described below-
The capacity of the ETP 100 m3/day The area of the existing ETP 512 sq. meter
The Units of the ETP
Metal Screening Equalization Greet Removal
Oil-water separator Sedimentation Others
Chemical Adsorption-√ Disinfection-√ Neutralization Process (if necessary)
Flocculation-√ Chemical Oxidation-√ Others
Biological .Sequencing Batch Reactor Activated sludge Aerated lagoon
Biological contactor Trickling Filter Aeration tank
Stabilization Pond Anaerobic tank Others
Sludge Treatment
Thickening Dry with heat Fried in the Brick field
Digestion De-watering Others
Others Ion exchange Membrane filtration Reverse Osmosis
Activated carbon Adsorption Septic Tank & Soak oil
a. Chemical used in ETP
Sl. # Name of Chemicals Daily Use (kg)
1. Pharous Sulphate 800 gm
2. Polyelectrolyte 1200 gm
3. Caustic 500 gm

EMP Report No.: EMP/17/1019
34
b. Required electricity demand for Existing ETP
Running time of ETP
10 Hours/ day
Amount of treated liquid waste
100 m3/day
Electricity cost for ETP/month (11700 BDT) in 2016
Month Jan Feb Mar Apr May Jun Jul Aug Sep Oct Nov Dec
Unit (KWh)
1820 1830 1850 1780 1820 1890 1898 1920 1851 1750 1728 1750
ETP Inlet ETP- Section
Sludge ETP Outlet

EMP Report No.: EMP/17/1019
35
Figure 5.1: Layout plan for liquid discharge in the facility

EMP Report No.: EMP/17/1019
36
Chapter Six Existing Environment: Physical

EMP Report No.: EMP/17/1019
37
6.1 Introduction
As part of the Environmental Management Plan (EMP) of Indesore sweater Ltd., an environmental
baseline study was carried out in areas surrounding the project site. The specific objectives of the
baseline study were to gather information on the existing physical environment, biological-ecological
environment, and socio-economic environment of the areas in and around the project site. The data and
information gathered during the baseline study provide a detailed description of the existing conditions
of physical, biological as well as socio-economic environment in and around the project area.
This Chapter describes the existing physical environment of areas in and around the factory, based on
the baseline survey and other studies (e.g., water quality, air and noise level measurements) carried out
as a part of the present study. Relevant information on climate, topography and drainage, geology and
soils, hydrology and water resources, air quality, noise level, and water quality have been described in
this Chapter. The possible environmental impacts of the project activities will be evaluated against these
baseline environmental conditions.
6.2 Climate
The climate of this region is tropical, with monsoons, characterized by a change of four seasons: pre-
monsoon (March to May), monsoon (June to September), post-monsoon (October to November) and
dry season (December to February). High air temperature is observed all throughout the year; daily air
temperature variations are insignificant; air humidity is high with abounding rains. Typical parameters of
the weather elements, as recorded for the period of last few years of observations (2012-2016) at
Gazipur (Facility area), from the world weather online website are presented in table below.
6.2.1 Ambient Air Temperature
The temperature of the country has the relationship with the period of rainfall. In general cool seasons
coincide with the period of lowest rainfall. Table 4.6 - Table 4.10 respectively shows the monthly
average maximum and minimum temperature at Gazipur area for the period 2012 -2016. During this
period maximum average temperature of 37.6 degree Celsius was observed in April, 2014 where
average minimum temperature was 17.06 degree Celsius in January, 2013. Rainfall pattern in the
project area likely to be more or less similar that of Gazipur.

EMP Report No.: EMP/17/1019
38
Table 6.1: Monthly ambient temperature of the factory area in 2012
MONTH Max. Temp(◦C) Min. Temp(◦C) Mean Temp(◦C)
Jan 26.32 17.81 22.06
Feb 30.79 20.43 25.61
Mar 32.74 23.45 28.10
Apr 33.67 25.97 29.82
May 35.13 28.06 31.60
Jun 34.03 28.53 31.28
Jul 31.68 27.16 29.42
Aug 31.00 26.71 28.85
Sep 31.40 26.50 28.95
Oct 32.00 23.68 27.84
Nov 29.23 20.77 25.00
Dec 27.58 18.00 22.79
(Source: http://www.worldweatheronline.com)
Table 6.2: Monthly ambient temperature of the factory area in 2013
MONTH Max. Temp(◦C) Min. Temp(◦C) Mean Temp(◦C)
Jan 27.19 17.06 22.13
Feb 31.00 20.29 25.64
Mar 34.42 23.48 28.95
Apr 35.10 26.20 30.65
May 31.65 27.29 29.47
Jun 32.53 27.23 29.88
Jul 31.77 27.23 29.50
Aug 31.90 26.87 29.39
Sep 33.70 26.57 30.13
Oct 32.10 24.55 28.32
Nov 31.77 20.43 26.10
Dec 29.58 19.65 24.61
(Source: http://www.worldweatheronline.com)
Table 6.3: Monthly ambient temperature of the factory area in 2014
MONTH Max. Temp(◦C) Min. Temp(◦C) Mean Temp(◦C)
Jan 29.35 18.06 23.71
Feb 31.21 20.25 25.73
Mar 34.87 23.61 29.24
Apr 37.60 26.90 32.25
May 36.32 28.45 32.39
Jun 35.57 28.70 32.13
Jul 33.39 27.94 30.66
Aug 32.84 27.13 29.98
Sep 33.43 26.63 30.03

EMP Report No.: EMP/17/1019
39
Oct 34.26 24.45 29.35
Nov 33.20 22.13 27.67
Dec 30.00 19.10 24.55
(Source: http://www.worldweatheronline.com)
Table 6.4: Monthly ambient temperature of the factory area in 2015
MONTH Max. Temp(◦C) Min. Temp(◦C) Mean Temp(◦C)
Jan 29.10 19.26 24.18
Feb 31.04 21.21 26.13
Mar 35.71 24.94 30.32
Apr 35.77 26.73 31.25
May 37.00 28.39 32.69
Jun 35.67 28.37 32.02
Jul 33.87 27.00 30.44
Aug 34.55 27.71 31.13
Sep 35.50 27.53 31.52
Oct 34.81 25.29 30.05
Nov 32.87 22.63 27.75
Dec 29.52 20.16 24.84
(Source: http://www.worldweatheronline.com)
Table 6.5: Monthly ambient temperature of the factory area in 2016
MONTH Max Temp(◦C) Min Temp(◦C) Mean Temp(◦C)
Jan 29.13 19.48 24.31
Feb 32.57 22.89 27.73
Mar 36.45 25.74 31.10
Apr 36.17 27.53 31.85
May 36.55 28.10 32.32
Jun 35.20 27.57 31.38
Jul 34.55 27.06 30.81
Aug 34.55 27.00 30.77
Sep 34.73 27.27 31.00
Oct 34.90 25.45 30.18
Nov 32.63 21.93 27.28
Dec 31.71 20.26 25.98
(Source: http://www.worldweatheronline.com)
6.2.2 Rainfall
Its annual rainfall is about 2000mm and approximately 80% of it occurs during the monsoon. Average
monthly rainfall during monsoon period varies between 300mm to 450mm. Maximum daily rainfalls
during this period recorded 13 May 2016 is 209 mm & maximum monthly rainfalls recorded May 2016 is
745 mm.

EMP Report No.: EMP/17/1019
40
The rainfall follows the general climate pattern with the highest rainfall in the summer month of June to
September and minimum rainfall in the cooler and drier months of November to March. Table presents
average monthly rainfall for Dhaka & Gazipur, average number of rainy days per month and average
number of days per month when rainfall is greater than 10 mm. It is evident that extreme rainfall events
occurred during the monsoon (April-September) in Gazipur. On May to September, 2016 almost every
day of the month it is raining in Gazipur District.
Table 6.6: Rainfall statistics in Dhaka in between 2011 to 2015
Year Jan Feb Mar Apr May Jun Jul Aug Sep Oct Nov Dec Yearly Total
In millimeter
2011 0 0 20 123 235 314 356 409 207 112 0 0 1776
2012 10 1 37 269 137 175 226 282 81 38 68 5 1329
2013 0 8 26 32 378 325 302 212 172 131 0 4 1590
2014 0 12 10 80 147 342 212 391 156 49 0 0 1399
2015 3 17 4 166 185 375 623 395 346 51 0 1 2166
(Source: BMD)
Table 6.7: Rainfall Statistics in Gazipur in 2016
Month Rainfall(mm) Total No. of rain days/month
Jan 0.7 1
Feb 14.5 8
Mar 50.1 11
Apr 202.9 22
May 744.7 31
Jun 183 28
Jul 230.3 31
Aug 174.7 30
Sep 239.5 30
Oct 91.4 20
Nov 43.2 8
Dec 0 0
Annual 1975 220
(Source: http://www.worldweatheronline.com)
6.2.3 Wind Speed
Table 6.8: Monthly Prevailing Wind Speed of Gazipur for the period of 2012-2016
Year Month Speed (mph)
2012
Jan 6.63
Feb 5.21
March 7.90
April 10.80
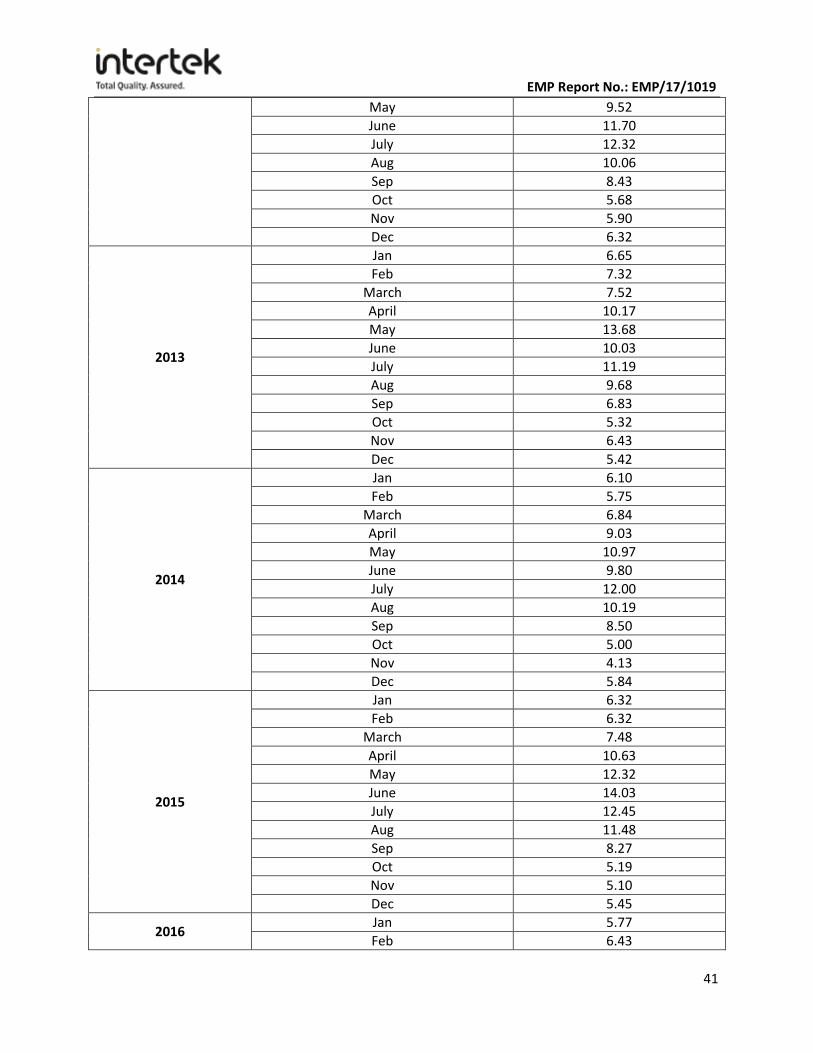
EMP Report No.: EMP/17/1019
41
May 9.52
June 11.70
July 12.32
Aug 10.06
Sep 8.43
Oct 5.68
Nov 5.90
Dec 6.32
2013
Jan 6.65
Feb 7.32
March 7.52
April 10.17
May 13.68
June 10.03
July 11.19
Aug 9.68
Sep 6.83
Oct 5.32
Nov 6.43
Dec 5.42
2014
Jan 6.10
Feb 5.75
March 6.84
April 9.03
May 10.97
June 9.80
July 12.00
Aug 10.19
Sep 8.50
Oct 5.00
Nov 4.13
Dec 5.84
2015
Jan 6.32
Feb 6.32
March 7.48
April 10.63
May 12.32
June 14.03
July 12.45
Aug 11.48
Sep 8.27
Oct 5.19
Nov 5.10
Dec 5.45
2016 Jan 5.77
Feb 6.43

EMP Report No.: EMP/17/1019
42
March 8.45
April 15.57
May 11.29
June 10.77
July 12.03
Aug 11.61
Sep 8.30
Oct 6.13
Nov 5.07
Dec 5.39
(Source: http://www.worldweatheronline.com)
6.2.4 Relative Humidity
As would be expected, relative humidity during the wet season is significantly higher than those
occurring at other period of the year. This is well depicted by the data as shown in the Table - 4.8 for
relative humidity of Dhaka during the period 2012 – 2016.
Table 6.9: Average Monthly Relative Humidity of the Project Area in last 5 years
Humidity in %
Monthly Mean Humidity
Year Jan Feb. Mar. Apr. May Jun. Jul. Aug. Sep. Oct. Nov. Dec. Annual
2012 58 45 66 74 73 76 80 83 82 80 69 57 70
2013 47 40 58 67 81 80 80 81 80 83 73 62 69
2014 53 53 53 62 70 74 79 81 80 77 67 59 67
2015 55 52 44 67 71 71 79 77 75 74 67 59 66
2016 53 57 58 72 73 77 78 79 78 77 74 62 70
(Source: http://www.worldweatheronline.com) 6.3 Geology and Soil
6.3.1 Soil
Most of the area of Bangladesh is a vast, low-lying alluvial plain, sloping gently to the south and
southeast. According to Bangladesh Agricultural research council‘s Agro-Ecological Zoning map of
Bangladesh, The project area occupies on northern side of Gazipur district and standing right side of
Dhaka-Tangail highway road.
General soil types of this area are: non-calcareous grey floodplain soils, acid basin clays, non-calcareous
dark grey floodplain soils, shallow red-brown terrace soils, deep red-brown terrace soils, brown mottled
terrace soils, shallow grey terrace soils & deep grey terrace soils.
According to Soil Resource Development Institute (SRDI), govt. republic of Bangladesh, Soil description
of the project area is described below:

EMP Report No.: EMP/17/1019
43
The project area represents soil series like: Tejgaon, Belabo, Gerua, Bhatpara, Salna, Noadda, Chandra,
Chiata occupying on terrace area & Chalna, Khilgao, Demra and karaill on Baid area/valley.
Tejgaon, Belabo & Gerua is moderately deep to deep red clay soil occurring on almost level terrace
developed on Madhupur clay. Soil reaction is generally moderately acid to acidic (PH value lies between
4.5 to 5.5 having drainage condition moderately well drained to well drained.
Its cropping pattern generally varied from double to triple; Rabi vegetables is followed by kharif
vegetables; fruit trees, pine apple, guava, forest trees etc.
Bhatpara, Salna and Noaddais generally light yellowish to brown clayey soil; slightly acidic to acidic,
moderately well drained compact soil. Its cropping pattern is generally fruit trees, forest trees, forest
planted rice in kharif-2 season, and crop suitability is comparatively poor.
Chandra, Chiata: Yowlish brown/strong brown clayey, moderately well drained soil and soil reaction is
slightly acidic to moderately acidic (PH value lies between 4.5 to 5.5).
Chalna, Khilgao, derma & karail is occupied on poorly drained grey clay soil on baid area. Cropping
pattern is generally is single cropped. Suitability of transplanted rice crop is in kharif-2 season.
Soil properties of Gazipur Sadar Upazilla thana:
This area represents another type of soil which is named as “Old Bemhaputra alluvium”. This soilseries
comprises Nokla, sherpur, sonatola, silmondi, lokdeo, tarakanda occupying on ridge and ghatail,
ghereargao, belna and mohanganj of basin area. Sonatola, sherpur&nokla is generally mixed brown and
grey, silt loam, friable soil. Silmondi, lokdeo & tarakanda is mixed brown and grey, silty clay loam to silty
clay, slightly acidic to neutral (PH value lies between 5.6 to 6.5).
Ghatail, glorargao and mohanganj occur on basin area, shallowly flooded to moderately deep flooding,
poorly drained, silty clay to clay soils.
Cropping Pattern: Overall ridge soils is double crop to triple cropped; lands, rabi crops followed by
kharif-1 & 2 crops; Mastered, khesari, mosur, followed by kharif vegetables; transplanted rice
crops.Basins area is double cropped land; mainly boro followed transplanted rice crops.
The analytical figures for these nutrients in these soils are below the standard of the Bangladesh
average.
The total cultivated land at Gazipur is 88%, where 38% is high land(HL), 18% is medium high land(MHL),
14% is medium low land(MLL), 12 % is low land(LL), 6% is very low land(VLL) and rest of 12 % is used as
miscellaneous land. Total 46162.71 acres of land occupied as forest according to the data of department
of forest, 2013. But the total cultivated land at Gazipur Sadar upazilla is 41,633 hector, where HL is
20,406 hector, MHL is 6652 hector, MLL is 1,197 hector, LL is 7,229 hector & VLL is 1,827 hector.
(Source: SRDI)

EMP Report No.: EMP/17/1019
44
Drainage classes of this Sadar upazilla are stated below:
Well drained
Moderately well drained
Imperfectly drained
Poorly drained
Very poorly drained
Miscellaneous Total
Hector (Ha)
3234 8151 10322 10427 5177 4322 41633
Source: SRDI
Textural classes of the soil of the Gazipur Sadar Upazila are described below:
Sand Sandyloam Loam Clay Loam Clay Miscellaneous Total
Hector (Ha)
29 242 8355 16741 11944 4322 41633
Source: SRDI

EMP Report No.: EMP/17/1019
45
Figure 6.1: Physiographic Map of Bangladesh

EMP Report No.: EMP/17/1019
46
Figure 6.2: Digital Elevation Model of Bangladesh

EMP Report No.: EMP/17/1019
47
6.3.2 Seismicity
Bangladesh, a densely populated country in South Asia, is located in the north-eastern part of the Indian
sub-continent at the head of the Bay of Bengal. Tectonically, Bangladesh lies in the north-eastern Indian
plate near the edge of the Indian carton and at the junction of three tectonic plates – the Indian plate,
the Eurasian plate and the Burmese micro plate. These form two boundaries where plates converge–
the India-Eurasia plate boundary to the north forming the Himalaya Arc and the India-Burma plate
boundary to the east forming the Burma Arc.
Active faults of regional scale capable of generating moderate to great earthquakes are present in and
around Bangladesh. These include the Dauki fault, about 300km long trending east-west and located
along the southern edge of Shillong Plateau (Meghalaya- Bangladesh border), the 150 km long
Madhupur fault trending north-south situated between Madhupur Tract and Jamuna flood plain, Assam-
Sylhet fault, about 300 km long trending north east southwest located in the southern Surma basin and
the Chittagong-Myanmar plate boundary fault, about 800 km long runs parallel to Chittagong-Myanmar
coast.
Figure 6.3: Regional tectonic setup of Bangladesh with respect to plate configuration
The Chittagong- Myanmar plate boundary continues south to Sumatra where it ruptured in the
disastrous 26 December 2004 Mw 9.3 earthquake (Sticklers et al 2008.) )). These faults are the surface
expression of fault systems that underlie the northern and eastern parts of Bangladesh. Another
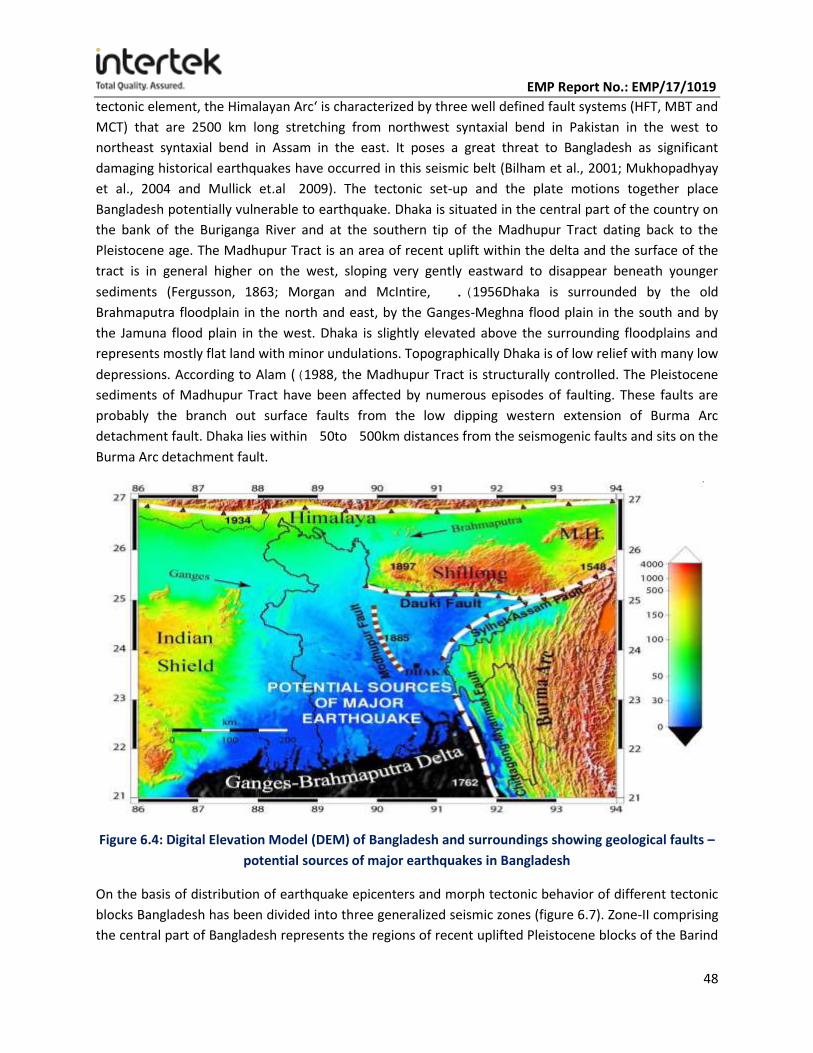
EMP Report No.: EMP/17/1019
48
tectonic element, the Himalayan Arc‘ is characterized by three well defined fault systems (HFT, MBT and
MCT) that are 2500 km long stretching from northwest syntaxial bend in Pakistan in the west to
northeast syntaxial bend in Assam in the east. It poses a great threat to Bangladesh as significant
damaging historical earthquakes have occurred in this seismic belt (Bilham et al., 2001; Mukhopadhyay
et al., 2004 and Mullick et.al 2009 ). The tectonic set-up and the plate motions together place
Bangladesh potentially vulnerable to earthquake. Dhaka is situated in the central part of the country on
the bank of the Buriganga River and at the southern tip of the Madhupur Tract dating back to the
Pleistocene age. The Madhupur Tract is an area of recent uplift within the delta and the surface of the
tract is in general higher on the west, sloping very gently eastward to disappear beneath younger
sediments (Fergusson, 1863; Morgan and McIntire, 1956 .) Dhaka is surrounded by the old
Brahmaputra floodplain in the north and east, by the Ganges-Meghna flood plain in the south and by
the Jamuna flood plain in the west. Dhaka is slightly elevated above the surrounding floodplains and
represents mostly flat land with minor undulations. Topographically Dhaka is of low relief with many low
depressions. According to Alam ( 1988) , the Madhupur Tract is structurally controlled. The Pleistocene
sediments of Madhupur Tract have been affected by numerous episodes of faulting. These faults are
probably the branch out surface faults from the low dipping western extension of Burma Arc
detachment fault. Dhaka lies within 50 to 500 km distances from the seismogenic faults and sits on the
Burma Arc detachment fault.
Figure 6.4: Digital Elevation Model (DEM) of Bangladesh and surroundings showing geological faults –
potential sources of major earthquakes in Bangladesh
On the basis of distribution of earthquake epicenters and morph tectonic behavior of different tectonic
blocks Bangladesh has been divided into three generalized seismic zones (figure 6.7). Zone-II comprising
the central part of Bangladesh represents the regions of recent uplifted Pleistocene blocks of the Barind

EMP Report No.: EMP/17/1019
49
and Madhupur Tracts, and the western extension of the folded belt. The zone II consists of the regions
of recent uplifted Pleistocene blocks of the Barind and Madhupur and the western extension of the
folded belt and the Bask coefficient for this zone is 0.05. Narshingdi area within the vicinity of Dhaka
falls in seismic zone II of the seismic zoning map of Bangladesh.
Figure 6.5: Earthquake Zoning Map of Bangladesh

EMP Report No.: EMP/17/1019
50
Table 6.10: Seismic Zone of Bangladesh
Zoning Area Mercalli Scale Modified
I North and eastern regions of Bangladesh (Seismically most active) IX
II Lalmai, Barind, Madhupur Tracts, Dhaka, Comilla, Noakhali and
western part of Chittagong Folded belt.
VIII
Figure 6.6: Seismic Activity of Bangladesh
Dhaka suffered ground shaking of the order III to VIII on the Modified Marcella (MM) scale from both
tele seismic (distant) and local earthquakes during historic and recent times. Among all the earthquakes
that Dhaka has suffered from, the earthquakes of 1762, 1812, 1865, 1885 and 1897 were the most

EMP Report No.: EMP/17/1019
51
severe earthquakes in recent recorded history. The following descriptions summarize the earthquake
history that affected Dhaka.
Major earthquake affect in Dhaka Division:
1548 Earthquake – Assam
The first known earthquake in Bangladesh was a ―terrible one‖ and destroyed both Sylhet and
Chittagong in 1548 (Rizvi, 1970; Iyengar, et al., 1999; Banglapedia , 2003), The details of the earthquake
and the damage are not available but it opened numerous ground fissures and caused liquefaction in
Assam, Sylhet, Tripura and in the Meghna floodplains. It is assumed from the descriptions in the reports
that the 1548 earthquake epicenter was somewhere in Assam or Nagaland. Though no reports were
made on the effect of this earthquake in Dhaka, it can nevertheless be well imagined that the intensity
was V to VI in Dhaka.
1642 Earthquake – Assam
This earthquake was more severe than the 1548 earthquake (Rizvi, 1970). It probably occurred in the
Assam-Sylhet region, but might have shaken Dhaka with moderate intensity.
1762 Earthquake – Chittagong
The earthquake of 1762 was very destructive and violent. It was felt all over Bengal and Arakan and it
originated somewhere along the Chittagong-Myanmar coast on 2 April. It damaged vast areas of Dhaka,
Chittagong and Myanmar (Oldham, 1883: Rizvi, 1969: Martin and Szeliga, 2010). Rizvi (1969) writes:
―The earthquake on April 2, 1762 proved very violent at Dhaka and along the eastern bank of Meghna
as far as Chittagong. At Dhaka the rivers and jhils were agitated, and raised high above their usual levels,
leaving, when they receded, their banks were strewn with dead fish. The shocks were accompanied by
subterranean hollow noises and were so severe that a number of houses were thrown down by which
500 persons, it is said, lost their lives‖. Based on the degree of damage of the ground surface, its aerial
extent and comparing with the 2004 Sumatra earthquake, the magnitude of the 1762 earthquake was
8.5+ on the Richter scale. The intensity of this earthquake in Dhaka was MM VI.
1775 Earthquake
Very little is known about this earthquake. This earthquake was severe in Dhaka with no loss of life
(Rizvi, 1969, Banglapedia, 2003).
1787 Earthquake – Sirajganj
The earthquake of 1787 changed the course of the rivers and the ground shaking at the epicentral
region was probably MM X. No report was available of the effect of this earthquake in Dhaka. However,
from the level of physiographic changes at Sirajganj and Dhaka being 100 km away to the southeast, it
may be said that the ground shaking intensity in Dhaka was MM VI to VII.

EMP Report No.: EMP/17/1019
52
1812 Earthquake – Dhaka
In 1812 two earthquakes visited Dhaka—on 10April and 11 May. The epicenters of these earthquakes
are unknown, but might have been close to Dhaka. The earthquakes jolted Dhaka violently and damaged
a number of houses and several buildings at Tejgoan (Rizvi, 1969). The degree of ground shaking had a
MM intensity of VIII.
1822 Earthquake – Kishoreganj
An earthquake of magnitude 7.1 on the Richter scale jolted Dhaka and other parts of Bangladesh on 3
April 1822 at approximately 10:30 local time with severe damage reports coming in from Mymensingh
(Martin and Szeliga, 2010). The epicenter of the earthquake was located about 70 km northeast of
Dhaka near Kishoreganj. The tremor was followed by three minor aftershocks. The ground shaking in
Dhaka was believed to be VI on MM intensity scale.
1842 Earthquake – Rajshahi
A major earthquake occurred on 11 November 1842 with magnitude Mw 7.3 shook most of Bangladesh,
including Dhaka (Martin and Szeliga, 2010). The maximum damage was reported from Pabna. The
epicenter of the earthquake was located 190 km west-northwest of Dhaka near Rajshahi. The intensity
of ground shaking in Dhaka was MM V.
1845 Earthquake – Sirajganj
Dhaka experienced three strong earthquakes on 23 July, 26 July and 6 August 1845. All three tremors
were felt strongly in Bengal and lower Assam (Martin and Szeliga, 2010). The first quake occurred at
approximately 4:30 am local time on 23 July and had a magnitude of 5.9. This was followed by a second
tremor at approximately 2:00 am local time on 26 July that had a magnitude of 6.1. The third one was
the strongest (Mw 7.1) and it occurred on 6 August at approximately 11:30 pm local time. The
epicenters of the first two were centered on Sirajganj about 100 km northwest of Dhaka. The third
quake was 265 km north of Dhaka located in lower Assam. No damaged at Dhaka was reported from
these earthquakes. The ground shaking intensity at Dhaka was MM V to VI.
1846 Earthquake – Mymensingh
A strong earthquake was felt in Dhaka on 18 October 1846 at 2:00 pm local time. The earthquake was
preceded by three foreshocks on 16 October (11:10 am) and 17 October (6:10 am, 11:20 am). Buildings
were destroyed in Muktagacha and Sherpur while in Mymensingh many structures, including the
mosque, the church and many government buildings were damaged. Several prisoners were injured by
falling debris at the jail in Mymensingh (Martin and Szeliga, 2010). The epicenter of the tremor was
located 150 km north of Dhaka near Phulpur of Mymensingh. The earthquake had a magnitude of 6.2 on
the Richter scale. Though no reports of damage were available for Dhaka, it shook the city with MM
intensity VI.

EMP Report No.: EMP/17/1019
53
1865 Earthquake – Chittagong
Dhaka was strongly jolted and plaster was reported to be dislodged from buildings from the earthquake
of 1865 that occurred on 14 December at approximately at 6:45 pm local time (Martin and Szeliga,
2010). Reports of damage published in the print media (Bengal Hurkaru, 1865, December 18- December
22; Englishman, 1865, December 16- January 4) suggest the epicenter was probably in Chittagong.
Several aftershocks were felt until 18 December. Another earthquake, triggered in north Bengal on 19
December at approximately 9:30 pm local time, also shook Dhaka severely. An eyewitness in Dhaka
noted, ―It nearly threw us off our editorial chair‖ (Englishman, 1865, December 16- January 4). The MM
intensity for both the earthquakes was believed to be VI to VII.
1885 Earthquake – Bengal
This earthquake, known as the Bengal Earthquake, occurred on 14 July 1885, and is one of the most
seven earthquakes. The earthquake was followed by eleven aftershocks during the period 21 July to 5
September 1885 (Middlemiss, 1885). Though no exact figures for the casualties in Dhaka caused by this
earthquake are available, it was truly one of the major earthquakes in Bangladesh. The quake hit at 6:25
am local time and was centered just 50 km northwest of Dhaka near Manikganj. It is believed to have
occurred on the Madhupur fault. The earthquake had a magnitude 7 on the Richter scale. Middlemiss
(1885) notes, ―Taking its rise in Bengal, this earthquake of the 14th July was felt with violence
throughout the province. It extended westwards into Chota Nagpur and Behar, northwards into Sikkim
and Bhutan, and eastwards into Assam, Manipur and Myanmar. The area over which it was sensibly felt
may be roughly laid down as 2, 30,400 square miles. An irregular ellipse drawn through Daltongunge (in
Palamow), Durbhanga (in Behar), Darjeeling, Sibsagar, Manipur and Chittagong will give the external
boundary of that area. Within this, again, another irregular figure may be drawn through Calcutta,
Sitarampur, Monghir, Purnea, Siligori, the Garo hills, Chattack and Barisal, which will enclose an area
over which the shock was felt with such considerable violence as to shake loose objects, rattle windows,
and produce small cracks in double-storied houses. Finally, we have another figure within thisbounded
by Rampur, Bogra, Sherpur (Maimensing district), Mymensingh, Dhaka and Pabna, where destruction to
buildings is greatest and loss of life occurred.
1897 Earthquake – Great Indian
This earthquake is known as the Great Indian Earthquake and was triggered on 12 June 1897 at 17:11
BST. It is one of the most powerful and destructive earthquakes in recorded history. The quake was
located in the western part of the Shillong Plateau about 200 km north of Dhaka. It probably originated
from the reactivation of Dauki fault, (Szeliga et al., 2010), although Bilham and England (2001) place it
on the Oldham fault on the north side of the Shillong Plateau. The magnitude is estimated from its
surface effects and their spatial distribution suggests it was 8.7 on the Richter scale. The shock was
preceded by a rumbling underground noise which lasted for about 3 minutes (Johnson, 1988). The
actual earthquake lasted about two and a half minutes in Shillong. This noise was compared with the
tremendous rumbling noise like a thousand ships' engines thumping away in the midst of a storm at sea.
The shocks were so severe and prolonged that most buildings were leveled to the ground (Moore,

EMP Report No.: EMP/17/1019
54
1910). The earthquake left an area of 3, 90,000 sq.km. In ruins and was felt over 6, 50,000 sq.km. From
the Myanmar to Delhi, A large number of ground fissures and vents were observed. The epicentral area,
including parts of Bangladesh, witnessed many secondary effects like ejection of water and sand,
rotation of pillars, rise in river height, and liquefaction of soils and sinking of houses. Hundreds of
aftershocks—some very heavy and some light—were felt in Dhaka over a period of two months. At
Browder tea estate, a week after the great shock, the surface of a glass of water standing on a table was
in a constant state of tremor. At Tura, a hanging lamp was kept constantly on the swing for three days.
At least 1,626 people were killed. Extensive damage from shaking and liquefaction occurred in Assam,
Meghalaya and Bangladesh (Oldham, 1899; Ambrose’s and Balham, 2003). The great earthquake of
1897 did much damage in Dhaka city, but luckily it caused comparatively little loss of life. Ground
fissures and sand veins were also occurred at many places in the city. The earthquake intensity at Dhaka
was VIII+ on MM scale. Sheehan Medical Hall, a temple known as Nazir‘s Math, Shahbagh, and the
house occupied by Mrs. Sainsbury – all collapsed and five persons were killed, including two foreigners,
beneath the ruins, while nine other houses, including the residences of the Commissioner, the Collector,
the Judge, and the Civil Surgeon, were rendered uninhabitable. The amount of damage to buildings
published in the print media was different from the government statement.
1918 Earthquake – Srimangal
Often referred to as the Srimangal earthquake, this massive quake was centered 70 km southeast of
Mymensingh and 100 km northeast of Dhaka near Kishorganj. It was preceded by a series of light to
moderate foreshocks. The earthquake occurred at 4:22:07 pm local time and had a magnitude 7.6 on
the Richter scale. Its depth of focus was 14 km. The earthquake was strongly felt throughout Bangladesh
and the degree of ground shaking in Dhaka was MM VII. The earthquake caused considerable damage to
buildings in Dhaka.
1923 Earthquake – Meghalaya
A major earthquake with magnitude Ms 7.1 occurred on 9 September 1923 at 22:33:42 BST. The
epicenter was located 180 km north-northeast of Dhaka in southern Meghalaya near the Bangladesh-
India border. The earthquake causes heavy damage at Mymensingh and was felt all over Bangladesh
with a MM intensity VI at Dhaka. At least 50 people were killed in the Mymensingh district in northern
Bangladesh. Damage occurred in Mymensingh and to a lesser extent at Agartala, Guwahati and Kolkata.
1930 Earthquake – Dubri
This earthquake is known as the Dubri earthquake. It was triggered on the early morning of 2 July 1930
at 03:53:34.4 BST with aftershocks of magnitude 6. The epicenter was located 230 km north of Dhaka in
northwestern Shillong Plateau near Dabigiri, Meghalaya. The earthquake was felt widely in Bangladesh
with MM intensity V+ at Dhaka.

EMP Report No.: EMP/17/1019
55
1934 Earthquake – Bihar-Nepal
This is a well-known Bihar-Nepal earthquake that occurred on 15 January 1934 at 14:43:25 BST and
caused widespread damage in Bihar and Nepal. At least 8,519 people were killed in Nepal (Pandey and
Molnar, 1988) and 7,253 deaths were reported in adjoining parts of India (Dunn et al., 1939). The
epicenter was in eastern Nepal close to Bihar-Nepal border and had magnitude 8.4 on the Richter scale.
The epicenter distance was 500 km northwest of Dhaka. The tremor was felt all over Bangladesh with
MM intensity VI in Dhaka.
1935 Earthquake – Pabna
An earthquake of magnitude 5.9 on the Richter scale occurred on 21 March 1935 shook Dhaka
moderately. The epicenter was centered in Pabna, 130 km west-northwest of Dhaka. It was widely felt in
Bangladesh with MM intensity VI in Dhaka.
1943 Earthquake – Assam
This earthquake occurred on 10 October 1943 at 23:23:17 BST. A major earthquake shook northeast
India and had a magnitude of 7.2 on the Richter scale. The epicenter was centered in Hojai, Assam, 365
km northeast of Dhaka. Little is known about this tremor as it occurred during World War II when the
threat of Japanese aggression on the eastern border of British India was extremely high. It was widely
felt in Bangladesh and northeastern India. Also moderately felt in Nepal, southern Tibet and in parts of
Myanmar (Ambrose’s and Douglas, 2004). The felt intensity at Dhaka was believed to be MM V to VI.
1950 Earthquake – Assam
This tremor is often referred to as the 1950Assam Earthquake and was the sixth largest earthquake of
the 20th century. It had a magnitude of 8.4 on the Richter scale and struck a relatively sparsely
populated region in Arunachal Pradesh near the Indo- Chinese border. The epicenter distance from
Dhaka was 800 km northeast. The earthquake triggered on 15 August 1950 at 20:09:28.5 BST and felt all
over Bangladesh with MM intensity IV at Dhaka. Water bodies in Dhaka remained in a state of agitation
for an hour due to the effect of long period seismic waves from this distant earthquake.
1954 Earthquake – Monipur-Myanmar Border
Dhaka experienced shock from a major earthquake that occurred on 22 March 1954 at 00:12:17 BST.
The epicenter of the tremor was centered in northern Myanmar near Monipur-Myanmar border, 480
km east-northeast of Dhaka. The earthquake had a magnitude estimated Ms 7.7. It was felt widely in
Bangladesh with MM intensity V in Dhaka. Many city dwellers awoke and ran out in panic. No damages
were reported but seismic seiches were observed in water bodies at Dhaka.
1977 Earthquake – Bangladesh-Myanmar Border
A moderate earthquake occurred on 12May 1977 at 18:20:00 BST with magnitude of 5.7 on the Richter
scale that jolted Dhaka with MM intensity III. The epicenter of the quake was located 340 km southeast

EMP Report No.: EMP/17/1019
56
of Dhaka near Bangladesh-Myanmar border with focal depth of 40 km. It was strongly felt at Bandarban
where people attending a political rally rushed outdoors in panic. Many buildings in Chittagong
developed cracks and numerous people were injured, some after jumping from buildings.
1988 Earthquake – Bihar-Nepal
Many people in Dhaka were awakened in the early hours of 21 August 1988 at 05:09:09.56 BST by the
shaking of high rise buildings from a strong earthquake. This earthquake occurred in eastern Nepal
bordering Bihar, about 510 km northwest of Dhaka. The earthquake had a magnitude of 7.8 with focal
depth of 57 km that killed 998 people and caused severe damage to buildings in Nepal and Bihar. The
tremor was felt in most parts of Bangladesh. Seismic seiches were also observed in many water bodies
that capsized numerous boats including a ferry on the Jamuna River killing two people and leaving
nearly thirty missing (Bangladesh Observer, August 22, 1988). The felt intensity at Dhaka was MMV.
2001 Earthquake – Dhaka
The residents of Dhaka city experienced two consecutive shocks in a second. The first shock was due to
the arrival of P-wave followed by the arrival of S-wave as second shock. This was an earthquake
triggered at the southern periphery of the city. The earthquake occurred on 19 December 2001 at
1:54:07 pm local time. The epicenter was centred 11 km south of Curzon Hall across the Burigonga River
at Kalakandi. The earthquake had magnitude estimated 4.5 on the Richter scale and had hypocentral
depth of about 10 km. The duration of shaking was 21 seconds. The earthquake was felt at Narayanganj,
Munshiganj, Chittagong, Comilla, Dhaka, Laxmipur, Rajshahi and as far as Rangpur. Strong tremors were
felt (MM V-VI) in Dhaka city, and many people rushed out of their homes and offices in panic.
2003 Earthquake – Borkol
It is known as the Borkol earthquake, occurred in the early morning of 27 July 2003 at 5:18:17 am local
time. This quake killed three people, injured 25 people and damaged about 500 buildings in Chittagong
and the Chittagong Hill Tracts. Power supply to some areas was cut as a transformer exploded at the
Modunaghat Grid Sub-station in Hathazari, Chittagong. The epicenter was situated 217 km southeast of
Dhaka at the eastern bank of Kaptai reservoir. It had a magnitude measured Mw 5.7. Dhaka shook with
MM intensity IV. Many people were awakened, especially residents of upper floors of high rise buildings.
2004 Earthquake – Sumatra
Known as the Sumatra earthquake that initiated on the morning of 26 December 2004 at 06:58:53 BST
off the west coast of north Sumatra. It had a magnitude measured Mw 9.3 with focal depth of 30 km. It
was one of the deadliest natural disasters in recorded history, having generated devastating tsunamis
that struck along the coasts of most landmasses bordering the Indian Ocean, killed about 2, 30,000
people in fourteen countries including 2 people in coastal Bangladesh. The epicentral distance was 2,350
km south of Dhaka, but the rupture propagated northward for 1,200 km reaching much closer to
Bangladesh. The tremor was felt all over Bangladesh.

EMP Report No.: EMP/17/1019
57
2008 Earthquake – Manikganj
A minor earthquake jolted Dhaka and surroundings on the evening of 20 March 2008 at 7:15:51.35 pm
local time and created considerable panic among the city dwellers. The earthquake had a magnitude
measured 3.8 on the Richter scale with focal depth of 35 km (NEIC, DUEO). The epicenter was situated in
Manikganj 41 km west-northwest of DUEO. It was believed to be originated from the Madhupur fault.
The Bengal Earthquake of 1885 had also occurred in the same region.
2008 Earthquake – Mymensingh
Known as Mymensingh earthquake, this temblor occurred in the middle of the night of 27 July 2008. The
epicenter was located 12 km northeast of Mymensingh city and 120 km north of Dhaka. It had a
magnitude estimated 5.1 on the Richter scale and a focal depth of 17 km (NEIC). Apart from
Mymensingh where the earthquake caused panic, tremors from this earthquake were felt in many parts
of the Dhaka. The ground shaking was MM V at Dhaka.
2008 Earthquake – Chandpur
A light earthquake with couple of aftershocks jolted Dhaka on the evening of 20 September 2008 just
before Iftar. It caused tremendous panic among the city dwellers. The epicenter was 50 km southeast of
Dhaka near Kachua of Chandpur. The magnitude was 4.5 on the Richter scale with a focal depth of 10
km (NEIC, DUEO). The tremor was strongly felt in Dhaka with MM intensity V.
2009 Earthquake – Bhutan
This is known as eastern Bhutan earthquake. A strong earthquake occurred on the day of Eid-ul-Fitr, 21
September 2009 at 14:53:06 BST. The epicenter was situated in eastern Bhutan, 410 km northeast of
Dhaka. It originated from the Main Central Thrust (MCT). This distant quake had a magnitude Mw 6.1,
but shook most of Bangladesh including Dhaka while people were celebrating Eid-ul-Fitr. The ground
shaking at Dhaka was MM V. People at upper floors of high rise buildings were panicked; some came out
of their houses and offices in fear. Small and light objects fell down.
2009 Earthquake – Bay of Bengal
The residents of Dhaka woke up at midnight of 10 August 2009 and many ran out of their houses in fear.
A major earthquake that occurred on early 11 August 2009 at 01:55:35.61 BST rocked Bangladesh. The
epicenter was located in Bay of Bengal between north Andaman Island and Myanmar coast, 1100 km
south southeast of Dhaka. The earthquake was originated from a 300 km long seismic gap of active
seduction zone of Indian and Burmese plates between the locations of the 2004 Sumatra and 1762
Chittagong earthquakes. It had a magnitude Mw 7.5 with focal depth of 4 km (NEIC). The quake was
strongly felt in most parts of Bangladesh including Dhaka. Residents of upper floors in high rise buildings
woke up. Many people panicked and ran out of their houses for safety (The New Nation, 12August 2009;
The Independent, 12 August 2009). A tsunami warning was issued for Bangladesh coast but withdrawn
after few hours (The Independent, 12 August 2009). However, no casualty or damage was reported. The
intensity of ground shaking at Dhaka was MM V.
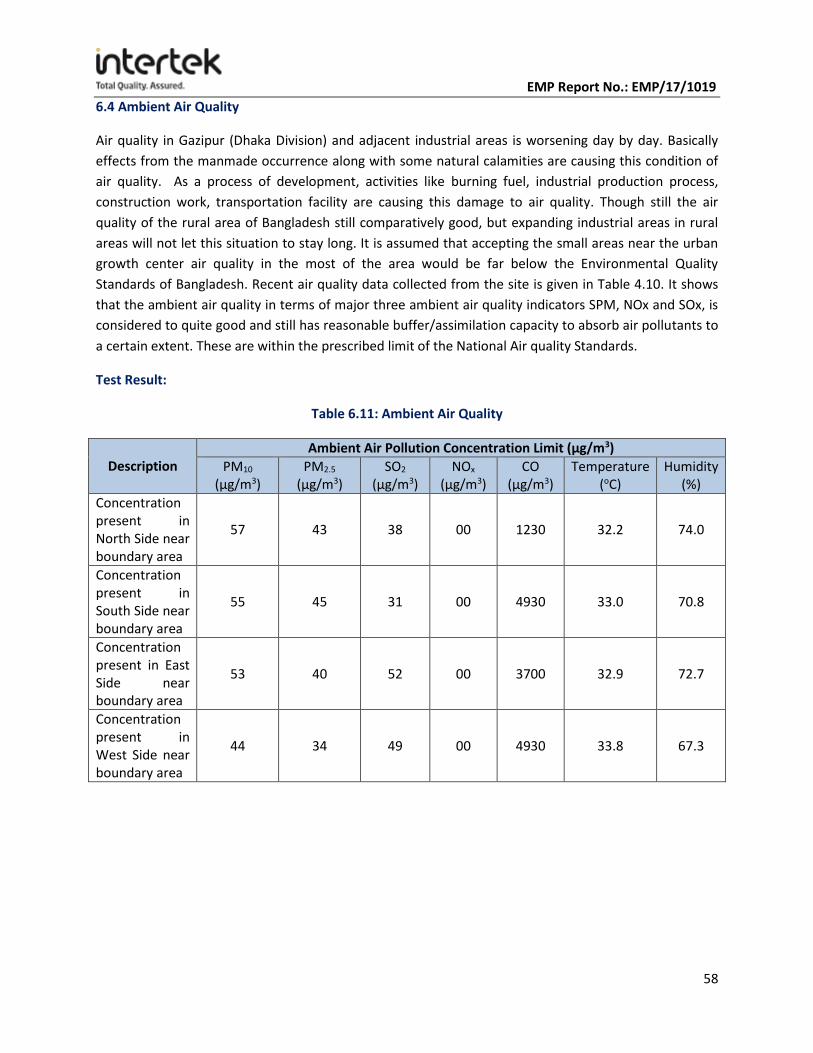
EMP Report No.: EMP/17/1019
58
6.4 Ambient Air Quality
Air quality in Gazipur (Dhaka Division) and adjacent industrial areas is worsening day by day. Basically
effects from the manmade occurrence along with some natural calamities are causing this condition of
air quality. As a process of development, activities like burning fuel, industrial production process,
construction work, transportation facility are causing this damage to air quality. Though still the air
quality of the rural area of Bangladesh still comparatively good, but expanding industrial areas in rural
areas will not let this situation to stay long. It is assumed that accepting the small areas near the urban
growth center air quality in the most of the area would be far below the Environmental Quality
Standards of Bangladesh. Recent air quality data collected from the site is given in Table 4.10. It shows
that the ambient air quality in terms of major three ambient air quality indicators SPM, NOx and SOx, is
considered to quite good and still has reasonable buffer/assimilation capacity to absorb air pollutants to
a certain extent. These are within the prescribed limit of the National Air quality Standards.
Test Result:
Table 6.11: Ambient Air Quality
Description Ambient Air Pollution Concentration Limit (µg/m3)
PM10
(µg/m3) PM2.5
(µg/m3) SO2
(µg/m3) NOx
(µg/m3) CO
(µg/m3) Temperature
(oC) Humidity
(%)
Concentration present in North Side near boundary area
57 43 38 00 1230 32.2 74.0
Concentration present in South Side near boundary area
55 45 31 00 4930 33.0 70.8
Concentration present in East Side near boundary area
53 40 52 00 3700 32.9 72.7
Concentration present in West Side near boundary area
44 34 49 00 4930 33.8 67.3

EMP Report No.: EMP/17/1019
59
Standard Requirement:
Description
Ambient Air Pollution Concentration Limit (µg/m3)
PM10
(µg/m3) PM2.5
(µg/m3) SO2
(µg/m3) NOx
(µg/m3) CO
(µg/m3) Temperature
(oC) Humidity
(%)
Air Quality Standard, (Bangladesh Gazette
from the department of Environment & Forest,
2005)
150 65 365 100 10000 NF NF
IFC/World Bank Standard 50 25 150 NF NF NF NF
World Health Organization (WHO)
150 75 500 200 NF NF NF
EPA Standard 150 35 100 100 10000 NF NF
Abbreviation : SPM (Suspended Particulate Matter), PM10 (Respirable Dust Content), PM2.5 (Fine Particulate Matter), SO2 (Sulphur-Di-Oxide), NOx (Oxides of Nitrogen), CO (Carbon Monoxide), DoE (Department of Environment), WB (World Bank), NF (Not Found). Main building
Recent indoor air quality data collected from the main building of the factory and the data given in Table
6.11 which shows that the indoor air quality. In terms of air quality parameter it is considered to quite
good in every section of the factory.
Test Result:
Table 6.12: Indoor Air Quality
Description Indoor Air Pollution Concentration Limit (µg/m3)
PM2.5
(µg/m3) PM10
(µg/m3) SO2
(µg/m3) NOx
(µg/m3) CO
(µg/m3) Temperature
(oC) Humidity
(%)
Sewing section (1st floor)
36 49 10 13 2470 32.7 65.0
Packing section (1st floor)
37 51 14 09 3015 32.8 64.1
Trimming & Mending section
(1st floor) 34 45 17 07 3920 32.5 65.6
Iron section (1st floor)
36 50 13 11 4110 33.1 65.6
Finishing section (1st floor)
35 51 15 08 3075 32.6 62.9

EMP Report No.: EMP/17/1019
60
Sample section (2nd floor)
29 42 11 16 2804 33.2 63.9
Winding section (2nd floor)
35 60 19 13 3170 32.4 62.6
Linking section (2nd floor)
32 40 21 14 4286 32.4 64.2
Sewing section (3rd floor)
37 61 14 13 2938 32.2 64.0
Packing section (3rd floor)
34 46 16 10 2810 31.7 67.1
Trimming & Mending section
(3rd floor) 36 48 11 07 3659 31.4 64.5
Iron section (3rd floor)
41 59 19 11 3795 32.6 68.3
Finishing section (3rd floor)
32 47 13 08 3355 31.8 66.4
Manual Knitting section (4th floor)
32 44 21 14 4270 30.6 72.7
Office room (5th floor)
25 47 14 00 2451 29.2 53.4
Jacquard section (5th floor)
27 54 11 06 2980 30.0 58.5
Manual Knitting section (6th floor)
40 54 14 00 00 29.7 69.6
Jacquard section (7th floor)
26 46 22 00 2230 29.7 57.9
Ground floor
Washing section 32 43 16 20 4208 33.5 63.4
ETP section 41 53 09 05 2870 30.7 70.5
Boiler room 32 44 12 15 3286 33.7 60.6
Generator room 53 105 15 13 4689 32.0 65.7
Fabric store 35 48 13 10 2658 32.8 63.6
Chemical store 36 47 14 11 2640 33.8 61.1
Medical room 24 31 00 00 2017 30.9 50.3
Standard Requirement:
Description
Indoor Air Pollution Concentration Limit (µg/m3)
PM10
(µg/m3) PM2.5
(µg/m3) SO2
(µg/m3) NOx
(µg/m3) CO
(µg/m3) Temperature
(oC) Humidity
(%)
Air Quality Standard, (Bangladesh Gazette
from the department of Environment & Forest,
2005)
150 65 365 100 10000 NF NF

EMP Report No.: EMP/17/1019
61
IFC/World Bank Standard 50 25 150 NF NF NF NF
World Health Organization (WHO)
150 75 500 200 NF NF NF
EPA Standard 150 35 100 100 10000 NF NF
Abbreviation : SPM (Suspended Particulate Matter), PM10 (Respirable Dust Content), PM2.5
(Fine Particulate Matter), NOx (Oxides of Nitrogen), DoE (Department of Environment), WB (World Bank), NF (Not Found). 6.5 Noise
Noise is an important part of the environment. The World Bank and Bangladesh has different
recommended value for noise standard.
Table 6.13: The test result for noise level assessment
Sl. No. Sample Location Concentration Present (LAeq) dBA
1. Sewing section (1st floor) 71.2
2. Packing section (1st floor) 66.9
3. Trimming & Mending section (1st floor) 63.5
4. Iron section (1st floor) 66.3
5. Finishing section (1st floor) 65.0
6. Sample section (2nd floor) 68.7
7. Winding section (2nd floor) 64.7
8. Linking section (2nd floor) 67.6
9. Sewing section (3rd floor) 69.4
10. Packing section (3rd floor) 61.5
11. Trimming & Mending section (3rd floor) 62.4
12. Iron section (3rd floor) 64.6
13. Finishing section (3rd floor) 62.3
14. Manual Knitting section (4th floor) 67.5
15. Office room (5th floor) 54.2
16. Jacquard section (5th floor) 70.1
17. Manual Knitting section (6th floor) 68.8
18. Jacquard section (7th floor) 69.2
19. Washing section 71.0
20. ETP section 72.8
21. Boiler room 84.9
22. Generator room 102.55

EMP Report No.: EMP/17/1019
62
Figure 6.7: Noise level at different areas of the factory
Standard Requirement:
According to the Environment Conservation Rules 1997 in industrial area noise level should be 75 dBA at
day time and 70 dBA at night time. World Health Organization (WHO) standard is 85 dBA for indoor
workplace area.
World Bank Reported value (dBA) for 8 hours exposure = 85 dBA (Day & Night) DoE recommended value
(dBA) for 8 hours exposure= 75 dBA (Day) and 70 dBA (Night).
6.6 Water Quality
As Indesore sweater Ltd. basically a sweater factory therefore it uses water mainly for washing purpose.
For this purpose water is collected from the ground water. Indesore sweater Ltd. use ground water
sources for this purpose. Ground water level exists at a moderate (Generally below 8.0 m) depth, which
is being recharged mainly by infiltration of rainwater. According to Bangladesh Water Development
Board the ground water level of Dhaka is about 35.5 m. The ground water zoning map is shown in Figure
6.9. Ground water is the source of water for domestic use in this area. Water from underground source,
which is assumed to be available as because most of the period of the year the area remains under
water and there is a canal passing by the side of the site. That means the recharge capacity of the
ground water level seems to be adequate.
0
20
40
60
80
100
120N
OIS
E LE
VEL
SAMPLE LOCATION

EMP Report No.: EMP/17/1019
63
Figure 6.8: Ground Water Zoning Map of Bangladesh

EMP Report No.: EMP/17/1019
64
Chapter Seven Environmental Impacts and Mitigations

EMP Report No.: EMP/17/1019
65
7.1 Land acquisition
Indesore sweater Ltd. has total land area 0.92 acre, located in 23.9630714 north latitudes and in
90.39626320000002 east longitudes. Total 0.92 acre land area & Industries building won by Indesore
sweater Ltd. authority.
7.2 Traffic
The access way of the factory is very simple. The convenient route of the factory is Dhaka city bypass
which is situated in east side of the factory. Indesore sweater Ltd. is just 12.93 km distance from Dhaka
International Airport.
Hence, no new road has been required for the factory and per day a huge amount of traffic moves by
the highway, so the transport of the factory has no significant impact on traffic.
7.3 Drinking Water and Sanitation
As the factory is an export oriented sweater factory, water is used mainly in the washing and domestic
purposes. The water is collected from the underground. And the waste water is treated by ETP before
discharged. So, there is no scope of ground water pollution by the factory. Water is tested by the factory
in regular interval and the test report is found satisfactory. Sanitation system is well equipped and
monitored by the administration. All the human waste are stored in the septic tank and treated there.
Mitigation measures
For the generation of waste water the factory has installed an Effluent treatment Plant and the design
for treating the waste water has been set according to the regulation of ECR’ 97. The waste water has
been tested regularly from different laboratories and found satisfactory. But these measures should be
maintained continuously. If any deviation found from the accepted value, the design and treatment
process should be revised.
7.4 Accidents or Occupational Health Hazard
Impact Origin
Under controlled situation, accident is not expected. However, occasionally it occurs during operational
works. Accident may occur during chemical use, manual knitting, finishing works and many others
machineries works. The protection of head, eye, ear, and hand, foot of the workers, laborers and
office personnel could be affected if proper and adequate arrangement is not ensured.
Mitigation Measures
The workers should wear Personal Protective Equipment (PPE) and other necessaries.
7.5 Impact due to Solid Waste
Impact Origin
Factory is producing a small amount of solid waste like plastic barrel, plastic drum, plastic jar, metallic,
plastic, light, paper waste, medical waste, sludge and many more. Waste is stored in organized way in
the store.
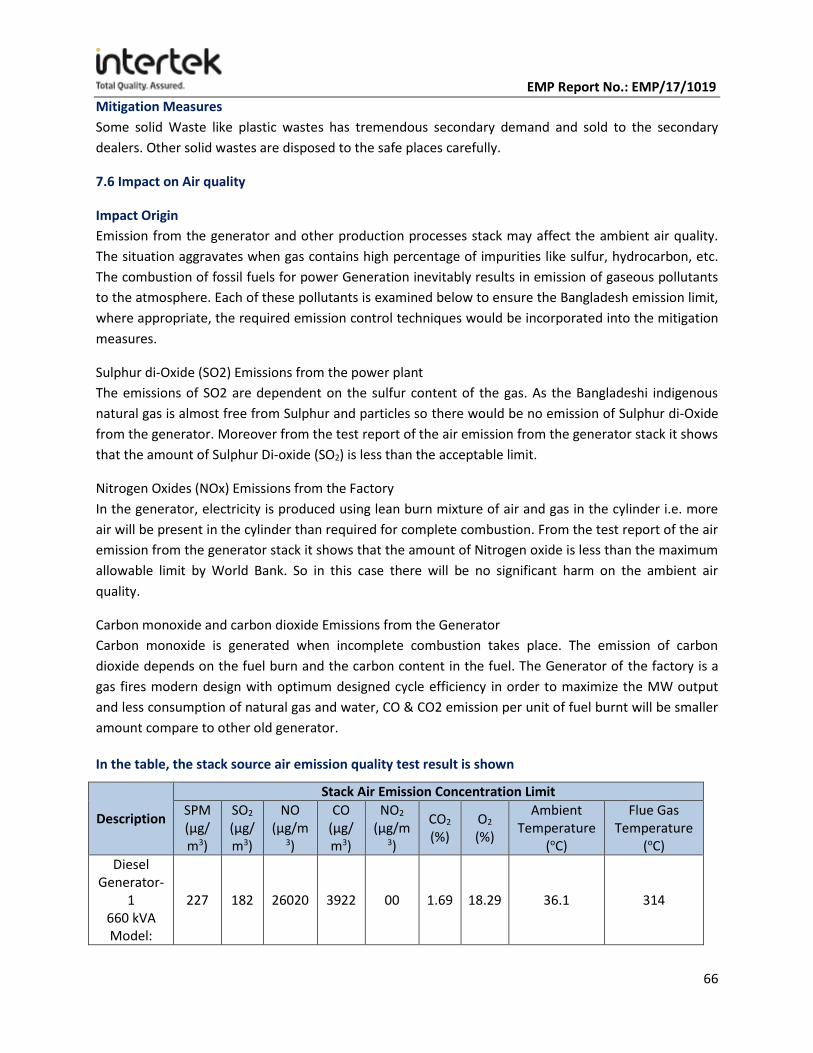
EMP Report No.: EMP/17/1019
66
Mitigation Measures
Some solid Waste like plastic wastes has tremendous secondary demand and sold to the secondary
dealers. Other solid wastes are disposed to the safe places carefully.
7.6 Impact on Air quality
Impact Origin
Emission from the generator and other production processes stack may affect the ambient air quality.
The situation aggravates when gas contains high percentage of impurities like sulfur, hydrocarbon, etc.
The combustion of fossil fuels for power Generation inevitably results in emission of gaseous pollutants
to the atmosphere. Each of these pollutants is examined below to ensure the Bangladesh emission limit,
where appropriate, the required emission control techniques would be incorporated into the mitigation
measures.
Sulphur di-Oxide (SO2) Emissions from the power plant
The emissions of SO2 are dependent on the sulfur content of the gas. As the Bangladeshi indigenous
natural gas is almost free from Sulphur and particles so there would be no emission of Sulphur di-Oxide
from the generator. Moreover from the test report of the air emission from the generator stack it shows
that the amount of Sulphur Di-oxide (SO2) is less than the acceptable limit.
Nitrogen Oxides (NOx) Emissions from the Factory
In the generator, electricity is produced using lean burn mixture of air and gas in the cylinder i.e. more
air will be present in the cylinder than required for complete combustion. From the test report of the air
emission from the generator stack it shows that the amount of Nitrogen oxide is less than the maximum
allowable limit by World Bank. So in this case there will be no significant harm on the ambient air
quality.
Carbon monoxide and carbon dioxide Emissions from the Generator
Carbon monoxide is generated when incomplete combustion takes place. The emission of carbon
dioxide depends on the fuel burn and the carbon content in the fuel. The Generator of the factory is a
gas fires modern design with optimum designed cycle efficiency in order to maximize the MW output
and less consumption of natural gas and water, CO & CO2 emission per unit of fuel burnt will be smaller
amount compare to other old generator.
In the table, the stack source air emission quality test result is shown
Description
Stack Air Emission Concentration Limit
SPM (µg/m3)
SO2
(µg/m3)
NO
(µg/m3)
CO (µg/m3)
NO2
(µg/m3)
CO2 (%)
O2 (%)
Ambient Temperature
(oC)
Flue Gas Temperature
(oC)
Diesel Generator-
1 660 kVA Model:
227 182 26020 3922 00 1.69 18.29 36.1 314

EMP Report No.: EMP/17/1019
67
P660-1 Brand: FG
Wilson
Diesel Generator-
2 660 kVA Model: P660-1
214 165 22660 4176 00 1.74 18.23 34.8 250
Gas Boiler-1
Model: 107936
Capacity: 1 ton
Origin: USA
126 00 14830 6464 00 9.38 2.07 33.8 328
Gas Boiler-2
Model: 107937
Capacity: 1 ton
Origin: USA
118 00 16650 5130 00 8.40 2.11 33.3 298
Standard Requirement :
Description
Stack Air Pollution Concentration Limit (µg/m3)
SPM (µg/m3)
SO2
(µg/m3)
NO
(µg/m3)
CO (µg/m3)
NO2
(µg/m3)
CO2 (%)
O2 (%)
Ambient Temperature
(oC)
Flue Gas Temperature
(oC)
Department of Environment
(DoE)/Environment Conservation
Rules, 1997
350 NF NF NF NF NF NF NF NF
1. Suspended Particulate Matter (SPM), PM2.5, PM10
The most common pollutant involved in fugitive emissions is dust or particulate matter (PM). This is
released during certain operations, such as transport and open storage of solid materials, and from
exposed soil surfaces, including unpaved roads.
Particulate matter," also known as particle pollution or PM, is a complex mixture of extremely small
particles and liquid droplets. Particle pollution is made up of a number of components, including acids
(such as nitrates and sulfates), organic chemicals, metals, and soil or dust particles.
The size of particles is directly linked to their potential for causing health problems. USEPA, EHO and DoE
are concerned about particles that are 10 micrometers in diameter or smaller because those are the

EMP Report No.: EMP/17/1019
68
particles that generally pass through the throat and nose and enter the lungs. Once inhaled, these
particles can affect the heart and lungs and cause serious health effects. Particle pollution has been
grouped into two categories:
"Inhalable coarse particles," such as those found near roadways and dusty industries, are larger than 2.5
micrometers and smaller than 10 micrometers in diameter.
"Fine particles," such as those found in smoke and haze, are 2.5 micrometers in diameter and smaller.
These particles can be directly emitted from sources such as forest fires, or they can form when gases
emitted from power plants, industries and automobiles react in the air.
2. Oxygen (O2)
Many major classes of organic molecules in living organisms, such as proteins, nucleic acids,
carbohydrates, and fats, contain oxygen, as do the major inorganic compounds that are constituents of
animal shells, teeth, and bone. Most of the mass of living organisms is oxygen as it is a part of water, the
major constituent of life forms (for example, about two-thirds of human body mass). Elemental oxygen
is produced by cyanobacteria, algae and plants, and is used in cellular respiration for all complex life.
Oxygen is an important part of the atmosphere, and is necessary to sustain most terrestrial life as it is
used in respiration. However, it is too chemically reactive to remain a free element in Earth's
atmosphere without being continuously replenished by the photosynthetic action of living organisms,
which use the energy of sunlight to produce elemental oxygen from water.
The combustion of a carbon-based fuel consumes oxygen. The 21% oxygen content present in the
combustion air that is fed to a furnace will be depleted to some lower level in the exhaust gas. The
interpretation clause of IPPC licenses typically require emission data to be reported at reference oxygen
conditions that are defined according the fuel type, for example:
Gas and liquid fuels 3% ref O2
Solid fuels 6% ref O2
Waste incineration 11% ref O2
Other fuels (e.g. fume thermal oxidizer):- The application of reference oxygen conditions will be
determined on a case-by-case basis.
Emissions from all sources: Temperature 273.15K, Pressure 101.325kPa (no correction for
oxygen or water content). May apply to the wood panel industry, which have combustion plants
as an integral part of the drying process and necessarily dilute with ambient air to affect control
of the drying process.
3. Carbon Monoxide (CO)
Nature and Sources of the Pollutant
Carbon monoxide is a colorless, odorless, poisonous gas formed when carbon in fuels is not burned
completely. It is a byproduct of highway vehicle exhaust, which contributes about 60 percent of all CO
emissions nationwide. In cities, automobile exhaust can cause as much as 95 percent of all CO emissions.

EMP Report No.: EMP/17/1019
69
These emissions can result in high concentrations of CO, particularly in local areas with heavy traffic
congestion. Other sources of CO emissions include industrial processes and fuel combustion in sources
such as Boiler/Generator s and incinerators. Despite an overall downward trend in concentrations and
emissions of CO, some metropolitan areas still experience high levels of CO.
Health and Environmental Effects
Carbon monoxide enters the bloodstream and reduces oxygen delivery to the body's organs and tissues.
The health threat from exposure to CO is most serious for those who suffer from cardiovascular disease.
Healthy individuals are also affected, but only at higher levels of exposure. Exposure to elevated CO
levels is associated with visual impairment, reduced work capacity, and reduced manual dexterity, poor
learning ability, and difficulty in performing complex tasks. EPA's health-based national air quality
standard for CO is 9 parts per million (ppm) measured as an annual second-maximum 8-hour average
concentration.
4. Nitrogen Dioxide (NO2)
Nature and Sources of the Pollutant
Nitrogen dioxide belongs to a family of highly reactive gases called nitrogen oxides (NOx). These gases
form when fuel is burned at high temperatures, and come principally from motor vehicle exhaust and
stationary sources such as electric utilities and industrial Boiler/Generator s. A suffocating, brownish gas,
nitrogen dioxide is a strong oxidizing agent that reacts in the air to form corrosive nitric acid, as well as
toxic organic nitrates. It also plays a major role in the atmospheric reactions that produce ground-level
ozone (or smog).
Health and Environmental Effects
Nitrogen dioxide can irritate the lungs and lower resistance to respiratory infections such as influenza.
The effects of short-term exposure are still unclear, but continued or frequent exposure to
concentrations that are typically much higher than those normally found in the ambient air may cause
increased incidence of acute respiratory illness in children. EPA's health-based national air quality
standard for NO2 is 0.053 ppm (measured as an annual arithmetic mean concentration). Nitrogen oxides
contribute to ozone formation and can have adverse effects on both terrestrial and aquatic ecosystems.
Nitrogen oxides in the air can significantly contribute to a number of environmental effects such as acid
rain and eutrophication in coastal waters like the Chesapeake Bay. Eutrophication occurs when a body of
water suffers an increase in nutrients that leads to a reduction in the amount of oxygen in the water,
producing an environment that is destructive to fish and other animal life.
5. Carbon Dioxide (CO2)
Nature and source of pollutant
Carbon dioxide (CO2) is the primary greenhouse gas emitted through human activities. In 2012, CO2
accounted for about 82% of all U.S. greenhouse gas emissions from human activities. Carbon dioxide is
naturally present in the atmosphere as part of the Earth's carbon cycle (the natural circulation of carbon
among the atmosphere, oceans, soil, plants, and animals). Human activities are altering the carbon
cycle—both by adding more CO2 to the atmosphere and by influencing the ability of natural sinks, like

EMP Report No.: EMP/17/1019
70
forests, to remove CO2 from the atmosphere. While CO2 emissions come from a variety of natural
sources, human-related emissions are responsible for the increase that has occurred in the atmosphere
since the industrial revolution.
The main human activity that emits CO2 is the combustion of fossil fuels (coal, natural gas, and oil) for
energy and transportation, although certain industrial processes and land-use changes also emit CO2.
Health and Environmental Effects
Since the industrial revolution in 1850 began, human processes have been causing emissions of
greenhouse gasses, such as CFC's and carbon dioxide. This has caused an environmental problem: the
amounts of greenhouse gasses grew so extensively, that the earth's climate is changing because the
temperatures are rising. This unnatural addition to the greenhouse effect is known as global warming. It
is suspected that global warming may cause increases in storm activity, melting of ice caps on the poles,
which will cause flooding of the inhabited continents, and other environmental problems.
Together with hydrogen, carbon dioxide is the main greenhouse gas. However, hydrogen is not emitted
during industrial processes. Humans do not contribute to the hydrogen amount in the air, this is only
changing naturally during the hydrological cycle, and as a result it is not a cause of global warming.
Increasing carbon dioxide emissions cause about 50-60% of the global warming. Carbon dioxide
emissions have risen from 280 ppm in 1850 to 364 ppm in the 1990s.
6. Nitric Oxide (NO)
Nitric oxide, or nitrogen oxide, also known as nitrogen monoxide, is a molecule with chemical formula
NO. It is a free radical and is an important intermediate in the chemical industry. Nitric oxide is a by-
product of combustion of substances in the air, as in automobile engines, fossil fuel power plants, and is
produced naturally during the electrical discharges of lightning in thunderstorms.
Nitric oxide in the air may convert to nitric acid, which has been implicated in acid rain. However, it is an
important source of nutrition for plant life in the form of nitrates. Furthermore, both NO and NO2
participate in ozone layer depletion. Nitric oxide is a small highly diffusible gas and a ubiquitous
bioactive molecule.
7. Nitrogen Oxides (NOx)
Nature and Source of pollutant
NOx is a generic term for the mono-nitrogen oxides NO and NO2 (nitric oxide and nitrogen dioxide).
They are produced from the reaction of nitrogen and oxygen gases in the air during combustion,
especially at high temperatures. In areas of high motor vehicle traffic, such as in large cities, the amount
of nitrogen oxides emitted into the atmosphere as air pollution can be significant. NOx gases are formed
whenever combustion occurs in the presence of nitrogen – as in an air-breathing engine; they also are
produced naturally by lightning. In atmospheric chemistry, the term means the total concentration of

EMP Report No.: EMP/17/1019
71
NO and NO2. NOx gases react to form smog and acid rain as well as being central to the formation of
tropospheric ozone.
Health and Environmental Effects
NOx reacts with ammonia, moisture, and other compounds to form nitric acid vapor and related
particles. Small particles can penetrate deeply into sensitive lung tissue and damage it, causing
premature death in extreme cases. Inhalation of such particles may cause or worsen respiratory
diseases, such as emphysema or bronchitis, or may also aggravate existing heart disease.
NOx reacts with volatile organic compounds in the presence of sunlight to form ozone. Ozone can cause
adverse effects such as damage to lung tissue and reduction in lung function mostly in susceptible
populations (children, elderly and asthmatics). Ozone can be transported by wind currents and cause
health impacts far from the original sources.
NOx destroys ozone in the stratosphere. Ozone in the stratosphere absorbs ultraviolet light, which is
potentially damaging to life on earth. NOx from combustion sources does not reach the stratosphere;
instead, NOx is formed in the stratosphere from photolysis of nitrous oxide.
NOx also readily reacts with common organic chemicals, and even ozone, to form a wide variety of toxic
products: nitroarenes, nitrosamines and also the nitrate radical some of which may cause biological
mutations. Recently another pathway, via NOx, to ozone has been found that predominantly occurs in
coastal areas via formation of nitric chloride when NOx comes into contact with salt mist.
8. Sulfur Dioxides (SO2)
Nature and Sources of the Pollutant
Sulfur dioxide belongs to the family of gases called sulfur oxides (SOx). These gases are formed when
fuel containing sulfur (mainly coal and oil) is burned, and during metal smelting and other industrial
processes.
Health and Environmental Effects
The major health concerns associated with exposure to high concentrations of SO2 include effects on
breathing, respiratory illness, alterations in pulmonary defenses, and aggravation of existing
cardiovascular disease. Children, the elderly, and people with asthma, cardiovascular disease or chronic
lung disease (such as bronchitis or emphysema), are most susceptible to adverse health effects
associated with exposure to SO2. EPA's health-based national air quality standard for SO2 is 0.03 ppm
(measured on an annual arithmetic mean concentration) and 0.14 ppm (measured over 24 hours). SO2 is
a precursor to sulfates, which are associated with acidification of lakes and streams, accelerated
corrosion of buildings and monuments, reduced visibility, and adverse health effects.
Discussion and Recommendation
Indesore sweater Ltd. has two generators and two boilers in running condition. INTERTEK has tested all
required air quality parameter according to the Department of Environment (DoE), EPA and World
Health Organization (WHO). According to the test result the findings are given below:

EMP Report No.: EMP/17/1019
72
1. Suspended Particulate Matter (SPM), PM2.5, and PM10 present in the stack found within the
acceptable limit for Generator and boiler.
2. The amount of Oxygen, CO, CO2, NO2, NO, SO2 for indoor air quality and ambient air quality found
within the acceptable limit according to the DoE and other international standards.
3. Noise level in different location of the facility and different production processes found within
acceptable limit. Only in generator and boiler room noise level was found in high concentration.
For obtaining above result the recommendation are given below:
1. Factory has to maintain proper Stack Height.
2. Factory has to check Air emission quality regularly.
3. Facility should ensure ear muff for the boiler and generator operator.
Factory is suggested to assess the Air emission Quality every six month interval at least if all other set up
are constant.
Mitigation measures
From the air emission test report it is clearly shown that the effect from the generator, production
machines and others of Indesore sweater Ltd. is significant in context of air pollution. Most of the
parameter for all emitted gases is under the maximum allowable limit from Department of Environment
Bangladesh and International and World Bank except CO & NO. Factory has to check the quality of the
emitted gasses after regular interval, to monitor the performance of generator. If in any case the result
found that the emitted air doesn’t comply with the any standard mitigation measures has to be taken
according to the situation.
Residual Impact
It is clear from above study that the factory already meets the most of the national standards. Adoption
of measures set out above is not expected to provide total mitigation, because no machine works at
100% efficiency. After adopting proper mitigation measures while it will be deviated from
national/international standards, Indesore sweater Ltd. will emit some residual pollutants, which can
affect the environment in the long run. On the other hand, if other industries located in the area, emits
air meeting the national requirement as Indesore sweater Ltd. the cumulative residual pollutants will
create an adverse situation in the ambient air quality. So, this situation can be overcome by determining
the exact level of treatment and maintaining it by following the management plan properly, which is
required to maintain the normal ambient air quality of the area.
7.7 Impact due to Liquid Discharge
Indesore sweater Ltd. use water for different purposes. So the waste water discharge from washing
process, and for domestic purposes which has some significant impact for this factory. This wash water
contain significant amount of pollution, which may impact the surface water quality. Therefore, this will
have to be treated by effluent treatment plant.

EMP Report No.: EMP/17/1019
73
Test result from BUREAU VERITAS Laboratory
Sample Location Date pH TSS
(mg/L) BOD
(mg/L) COD
(mg/L)
Outlet of ETP 14.05.2017 7.3 7.0 27 76
Bangladesh Standard for Waste Water From industrial units, discharge to inland surface water as per ECR
1997 6.5-9.0 NF ≤50 ≤200.0
Biochemical Oxygen demand (BOD)
The strength of the wastewater is often determined by measuring the amount of oxygen consumed by
microorganism like bacteria in biodegrading the organic matter. The measurement is known as the
Biochemical Oxygen Demand (BOD). Microorganisms such as bacteria are responsible for decomposing
organic waste. When organic matter such as dead plants, leaves, grass clippings, cellulose components,
manure, sewage, organic waste like dyes, fats and oils, or even food waste is present in a water supply,
the bacteria will begin the process of breaking down this waste. When this happens, bacteria in aerobic
process, robbing other aquatic organisms of the oxygen they need to live, consume much of the
available dissolved oxygen.
If there is a large quantity of organic waste in the water supply, there will also be a lot of bacteria
present working to decompose this waste. In this case, the demand for oxygen will be high (due to all
the bacteria) so the BOD level will be high. As the waste is consumed or dispersed through the water,
BOD levels will begin to decline.
Nitrogen and phosphates in a body of water can also contribute to high BOD levels. Nitrates and
phosphates are plant nutrients and can cause plant life and algae to grow quickly. When plants grow
quickly, they also die quickly. This contributes to the organic waste in the water, which is then
decomposed by bacteria. This results in a high BOD level. The temperature of the water can also
contribute to high BOD levels. For example, warmer water usually will have a higher BOD level than
colder water. As water temperature increases, the rate of photosynthesis by algae and other plant life in
the water also increases. When this happens, plants grow faster and also die faster. When the plants
die, they fall to the bottom where they are decomposed by bacteria. The bacteria require oxygen for this
process so the BOD is high at this location. Therefore, increased water temperatures will speed up
bacterial decomposition and result in higher BOD levels.
When BOD levels are high, dissolved oxygen (DO) levels decrease because the bacteria are consuming
the oxygen that is available in the water. Since less dissolved oxygen is available in the water, fish and
other aquatic organisms may not survive. Textile mill wastewater possesses a very high BOD like 400 –
600 mg/l. It is necessary to reduce this BOD value up to a level less than 30 mg/l before discharging
them into the environment like canals or rivers. If a water body of high BOD is discharged into the sea or
very large river then off course the concentration of BOD decreases due to dilution and has little or no
harmful effect on the aquatic life or environment. Therefore if it is possible to discharge a highly toxic
effluent in sea or large river no treatment is necessary.
Note: - BOD5 temperature at 200c.

EMP Report No.: EMP/17/1019
74
Though it was not mentioned, the dissolved oxygen (DO) is a highly significant parameter to define the
BOD or COD of a wastewater. The amount of oxygen present in a certain amount of water in dissolved
state is known as DO. It is normally expressed as mg/l. Water may contain DO ranging from 0 to 18 mg/l
but in most cases of normal waters, DO lies between 7-9 mg/l. Aquatic lives require certain level of DO
to survive in the water. In case of wastewater the microorganisms require oxygen to consume the
organic wastes. As a result the DO of water decreases tremendously and becomes a threat to the life of
aquatic species. Textile effluents possess very low DO, which is unsuitable for discharging to the
environment. During treatment of wastewater air is blown through the effluent when oxygen is
dissolved in the effluent as a result DO level raises and as the DO increases the BOD/COD decreases.
Chemical Oxygen Demand (COD)
This is a means of measuring the ability of wastewater to sustain aquatic life, essential for the
preservation of the environment. It also enables proper assessment of treatment plant performance.
Aquatic organisms and animals require dissolved oxygen to flourish. The Chemical Oxygen Demand
(COD) test gives an indication of the impact of discharge waters on aquatic life by measuring the oxygen
depleting nature of the discharge water.
COD is based on the fact that nearly all-organic compounds can be fully oxidized to carbon dioxide with
a strong oxidizing agent under acidic condition. COD is another common measure of water-borne
organic substances — the process of measuring COD causes the conversion of all organic matter into
carbon dioxide. For this reason, one limitation of COD is that it cannot differentiate between biologically
active and those which biologically inactive. One major advantage of COD over BOD is that COD can be
measured in just three hours whereas BOD measurement takes at least five days. The value of COD is
always higher than BOD, this is because BOD accounts for only biodegradable organic compounds while
COD accounts for all organic compounds e.g. biodegradable as well as no biodegradable but chemically
ox disable.
Sludge
The settable solids separated from the liquid during sedimentation (clarification). The sludge is very
toxic in nature and needs to be dealt with very carefully. Under no circumstances it should be mix with
the environment again.
Mitigation Measures
The domestic liquid waste is disposed through a septic tank with a soak pit. The factory has a planned
drainage system to discharge the surface runoff. The surface drainage network is connected with an
interceptor prior to discharge through natural water. The interceptor traps all oily matter present in the
water. Apart from that the waste water from production floor has to be treated through Effluent
Treatment Plant.
Residual Impact
Provided that the mitigation measure indicated above is fully implemented, residual impact to be very
insignificant.

EMP Report No.: EMP/17/1019
75
7.8 Noise and Vibration Impacts
Impact Origin
Noise level must has to be less than 85 dBA because working under a condition more than 85 dBA is
harmful for health in short and long term. Mainly personnel working at the Generator and Compressor
section is at high risk because the noise level found higher than the acceptable limit of both Department
of Environment Bangladesh (DoE) and World Health Organization. So the following recommendations
are suggested to reduce the adverse effect:
Mitigation measures
To reduce the noise from generator& boiler, Indesore sweater Ltd. has built separate room for
generator which has been constructed with 150mm thick wall which will reduce the noise level 60 dBA.
So, the noise level will be reduced to 60 dBA. So it will be within the standard limit of World Bank and
DoE. Moreover INTERTEK team also measured the noise level of the outside of generator room in
different distance. The test result was found high in the generator and boiler room. Therefore, facility
should aware the operators to wear ear muff in running condition.
Residual Impact
Provided that the mitigation measure indicated above is fully implemented, residual impact to be very
insignificant.

EMP Report No.: EMP/16/1015
76
Table 7.1: Evaluation matrix showing various impacts from the facility P
RO
BA
BIL
ITY
SEVERITY
1x1=1 1x2=2 1x3=3
2x1=2 2x2=4 2x3=6
3x1=3 3x2=6 3x3=9
Impact Level Based on Impact Priority Number (IPN)
IPN=PxS
Minor= A 1 - 3 Moderate= B 4 - 6
Major= C 8- 9
Process/
Location Environmental Aspect Environmental Impact
Probability
(P)
Severity
(S)
IPN
(PxS)
Impact
Level
Existing
Mitigation
Measures
Responsible
Person for
Implementing
Control
Measures
Raw Materials
from Supply
Yarn
Use of
Chemicals
Water pollution
Air pollution 1 2 2 A
Careful
planning &
design
Store
Supervisor

EMP Report No.: EMP/16/1015
77
Chemical store
& wastage
go-down
Chemical
Spillage
Water pollution
Soil contamination 2 3 6 B
Proper health &
safety
management
system & Proper
emergency
management
system,
Chemical
Store
Supervisor/
Compliance
dept.
Knitting
Section
Waste
generation
Making Noise
Climate Change
Atmospheric pollution 2 2 4 B
Mandatory ear
Protection,
Proper
maintenance
of machineries
Knitting
machine
operator/
Compliance
dept.
Washing
Section
Electricity
consumption
Making Noise
Liquid wastes
Climate Change
Contamination of Air,
Soil& Water
2 3 6 B
Proper Design
of ETP and
Septic Tank
Washing
machine
operator/
Compliance
dept.
Finished
Fabrics Store
Electricity
consumption
Dust particles
No significant impact 1 1 1 A
Ensure proper
Solid waste
management
facility
Store
Supervisor

EMP Report No.: EMP/16/1015
78
Sewing
section
Electricity
consumption
Fabric dust
Making noise
Contamination of air
& Soil 2 2 4 B
Mandatory ear
Protection,
Proper
maintenance
of machineries
Sewing
machine
operator/
Compliance
dept.
Finishing
section
Electricity
consumption
Dust particles
No significant impact 1 2 2 A
Ensure proper
Solid waste
management
facility
Finishing store
Supervisor/
Compliance
dept.
Packing
Electricity
consumption
Dust particles
No significant impact 1 2 2 A
Ensure proper
Solid waste
management
facility
Packing store
Supervisor/
Compliance
dept.
Gaseous Emissions
Dust particles
Making high noise
Atmospheric pollution 2 3 6 B
Mandatory ear
Protection,
Proper
maintenance
of machineries
Generator and Boiler
operator/ Compliance
dept.

EMP Report No.: EMP/17/1019
79
Chapter Eight Environmental Management Plan

EMP Report No.: EMP/17/1019
80
8.1 Introduction
In the context of a project, Environmental Management Plan (EMP) is concerned with the
implementation of the measures necessary to minimize or offset adverse impacts and to enhance
beneficial impacts. All the measures are said to be successful when they comply with the Environmental
Quality Standard (EQS) of the host country in this case Bangladesh. Thus the objectives of EMP for the
present project would be.
Propose Mitigation measures to reduce or eliminate negative impacts
Propose Enhancement measures to maximize positive impacts
Define Monitoring requirement and Monitoring indicators
Propose budgeting and allocation of funds for environmental management system
The EMP should clearly lay out: (a) the measures to be taken during both construction and operation
phases of the project to eliminate or offset adverse environmental impacts, or reduce them to
acceptable levels; (b) the actions needed to implement these measures; and (c) a monitoring plan to
assess the effectiveness of the mitigation measures employed. Environmental management and
monitoring activities for Indesore sweater Ltd. could be divided into management and monitoring: (a)
during construction phase, and (b) during operation phase. As the factory is now on operation phase
only management and monitoring during operation phase will be discussed here.
8.2 Management in operation phase
Most of the environmental parameters will experience beneficial effects during the operation phase.
Efforts should be made to enhance these beneficial impacts, which may include incentives for proper
growth of industries in the area. The factory authority should be responsible for overall environmental
management during operation phase of the factory. The environmental management during the
operation phase should primarily be focused on addressing the following issues:
(a) Air quality
(b) Generation of noise
(c) Waste generation at the factory
Table 8.1 summarizes the potentially significant environmental impacts during operation phase, the
measures needed to eliminate or offset adverse impacts and enhance positive impacts. Most of the
mitigation and enhancement measures identified for operation phase.

EMP Report No.: EMP/17/1019
81
Table 8.1: Potentially significant environmental impact during operation phase and mitigation
measures for Indesore sweater Ltd.
Potential impacts Risk Label Proposed Mitigation and Enhancement Measures
H M L
On Neighbor & surrounding people
√ Install adequate buffer zone.
Ensure adequate plantation in the buffer zone.
Ai pollution from
dust & stack
emission quality
(Ref.: DoE,1997 &
Environmental Court
Act-2010)
√ Proper stack height has to be maintained for
generator.
Factory has to check air quality parameter regularly.
Ensure wearing of mask at printing, color mixing,
finishing, generator etc.
Generation of noise
(Ref.: Bangladesh
Noise Pollution,
2006)
√ Provision of silencers for generators
Planting of trees around the factory site
Regular maintenance
Regular noise monitoring
Use of ear-muffs and ear-plugs by factory personnel
working in the generator facilities of the factory.
Built 150mm thick wall to separate generator room
to reduce the impact of noise.
Provide proper PPE for the worker adjacent to Noise
creating machine.
Waste
Generation-Liquid &
Solid
(Ref.:National-3R
Strategy for Waste
Management &
DoE,1997)
√ Good housekeeping
Ensuring proper storage with separation, treatment,
and disposal of all solid waste
Monitoring of waste management system
periodically.
Train employees for proper waste management.
Lead acid battery should be back to the dealer.
Ensure proper dumpsite or sanitary landfill to
dispose solid wastage.
Test the waste water from outlet and inlet of ETP
regularly and maintain an inventory.
Odor (Ref.: DoE,1997)
√ Ensure sealed container in the chemical store.
Wear proper mask, where necessary.
Traffic congestion √ Avoid carrying of materials in peak hour of road traffic
Employment
(Ref.: Bangladesh
Labor Law-2006 &
√ Employ local people wherever possible to mitigate the diverse effect on their livelihood for using their land.

EMP Report No.: EMP/17/1019
82
Rules-2015)
Impact on health
and Safety
(Ref.: Bangladesh
Labor Law-2006 &
Rules 2015)
√ Set up warning signs, signals and provide helmets for workers in accordance with relevant accident prevention and work safety procedure
Supply good quality drinking water to the workers
Provide well-planned sanitary facilities
Provide regular health inspection among workers
Promote health education campaign among workers
Impact on surface
water quality
(Ref.: ECR,1997)
√ Dispose all domestic waste water through septic
tank
Surface drainage should be disposed through an
interceptor.
8.3 Environmental Monitoring Plan
8.3.1 Overview of Impacts and Mitigation Measures:
Indesore sweater Ltd. invariably has potential for environmental impacts during the operation of the
factory. The following impacts are normally of most significant:
Impacts on air quality;
Impact on Water body
Noise and vibration impacts
Socio-economic impacts;
Over viewing of mitigation measures due to impacts arises from the operation of Indesore sweater Ltd.
is atmospheric pollutant emissions, which are being controlled at source by the following mitigation
measures:
Sulfur dioxide- Very low concentration of sulfur in the gas fuel will ensure that the Bangladesh
emission limits will be met.
Nitrogen dioxide & Nitric oxide- Significant impact according to the National air quality limits.
Carbon mono oxide-Significant impact according to the National air quality limits.
A septic tank will be provided to ensure that waste water from domestic uses is treated
properly.
Environmental noise from generator, boiler will be controlled through separate room with thick
wall and noise from a specific machine will be controlled by using PPE.
Generated solid waste will be supplied to recycler and rest will be disposed properly.
Generated Liquid waste will be treated by effluent treatment plant.

EMP Report No.: EMP/17/1019
83
Table 8.2: Monitoring plan during operational phase of the factory
Issue Monitoring Place Monitoring
Parameters
Monitoring
Frequency
Responsibility
Solid Wastes Production processes- Finishing, store, wastage go-down, chemical go-down etc.
Finishing material, weight etc.
Daily. Process owners, EHS Team, Admin.
Meteorological
measurements
All the corners of the facility area, inside production area
Wind direction
and speed,
temperature,
humidity and
precipitation.
Yearly EHS Team, admin, external.
Ambient air in
the work place
All the production processes. Quality CO, NOx,
PM10, PM2.5,
SO2,
Quarterly EHS Team, Admin., External
Groundwater From underground source pH, Color,
Turbidity, TDS,
Ammonia, Nitrate,
Phosphate, As, Fe ,
Mn and Coli
forms;
Yearly EHS Team, Admin. External
Industrial Waste water
Production processes- Printing, Washing etc.
pH, BOD, COD, TDS, TSS, DO
Quarterly EHS Team, Admin., External
Noise level Working place Noise at different
locations
Quarterly EHS Team, Admin., External
Occupational
health and
safety
Production processes, maintenance work, chemical process,
Health status and
safety
Yearly. EHS Team, Admin.
8.3.2 Atmospheric Emission Management
The combustion of fossil fuels for power generation of the factory inevitably results in emission of
gaseous pollutants to the atmosphere. As the power generator of the factory is fired with Diesel, the
pollutants of potential concern are only oxides of nitrogen (NO & NO2) and carbon dioxide (CO2). The
exhaust gas extraction and analysis facilities as well as the data acquisition and processing facilities is
designed in accordance with the requirements of Bangladesh Legislation. When the generator starts
operation, gaseous emissions are released to the atmosphere through the stacks. The proponent will
take necessary step to minimize the emission level to meet the national standards of Bangladesh-
a) Indesore sweater Ltd. should take appropriate measure to mitigate the impact by maintaining proper
stack height, for generator this could be determined applying the thumb rule that, the stack height is

EMP Report No.: EMP/17/1019
84
taken as height of the building where generator is installed plus 0.2 times of square root value of
generator capacity in kVA. (H=h+0.2√kVA).
b) Ensure BERC license are updated & kept in place in the facility.
c) Develop renewable energy source to reduce GHG emission.
d) Long term Plan: Verify efficiency level for generator by conducting energy efficiency audit as per the
guideline of BERC.
e) Long term plan: Install renewable energy of 10% of the total electricity consumption of the facility
may introduce for using power for emergency lighting system as per guide line of energy regulatory
commission.(Ref.: BERC, 2006)
8.3.3 Management of Solid Wastes
The Indesore sweater Ltd. authority will have their solid waste collection and disposal system in place to
abate the pollution from the solid waste. The solid waste which has secondary demand will be sold to
the local traders after inspection and other waste will be properly managed and disposed of off-site.
Therefore, no significant ecological impacts arising from solid waste management are anticipated.
a. Indesore sweater Ltd. should take an effective care to mitigate significant impact from chemical
warehouse. (ECR 1997).
b. Indesore sweater Ltd. should take appropriate measure in segregation & disposal of wastes and
conducting agreement with third party.
c. Contractor assigned in disposal activities must bear license from the concern authority for handling all
wastages of Medical, Battery, Plastic container, printing wastages etc.
d. Indesore sweater Ltd. should monitor activities of the third party while performing disposal activities.
(National 3R Strategy Clause 2.2 & 2.3).
e. Long term Plan- Indesore sweater Ltd. should consider recycling of wastage by installing recycle plant
to meet National 3R strategy, 2006.
8.3.4 Liquid Waste Management
All domestic sewage will be treated in a septic tank. The treated water will be discharged through soak
pit. Other than, all waste water from production process has to be treated through Effluent treatment
plant and the parameters of the inlet and outlet of ETP has to be checked in a periodical basis.
a. Indesore sweater Ltd. need to check industrial waste water at inlet & outlet quarterly.
b. The operators those are involved in the operations of effluent treatment plant need to be certified,
trained.
c. Indesore sweater Ltd. should recycle outlet water of the ETP to reduce ground water depletion.

EMP Report No.: EMP/17/1019
85
d. The sludge generated from the effluent treatment plant should be accumulated/ exposed/ discharged
properly.
8.3.5 Noise and Vibration Level Management
Adequate measures have been proposed for the control of noise and vibration from the power
generator and other production related machine. Noise level monitoring would be performed
periodically and the workers exposed to noise would have adequate protective device. Vibration
protecting pad (shoe) would be provided under the generator to protect the vibration during operation.
An inlet silencer shall be incorporated to reduce the noise level to the specified level. The silencer shall
consist of individual noise absorbing exchangeable elements filled with mineral wool. Significant impact
of noise found in generator and compressor room. Therefore, Indesore sweater Ltd. should ensure
wearing proper PPE for assigned person in this section and monitor noise level quarterly. (Ref.:
Bangladesh Labor Rules 2015, Chapter-5.)
8.3.6 Greening Program
A green belt development program with different kinds of trees has been undertaken. The vegetation
would purify the air, reduce noise level, maintain ecological balance and generally contribute to the
scenic beauty of the air. Soil in and around the plan site is fertile and plenty of water is available. Hence,
the green belt as an environmentally sound and friendly project with a buffer zone surrounding the
plant area may be created in a short time and therefore green area will be increased and reduce the
environmental impacts.
8.3.7 Monitoring requirement
The environmental monitoring program includes a schedule of monitoring and institutional
arrangements. The environmental monitoring program will show the path for taking precautions during
and after the construction of the transmission line and substations so that necessary steps can be taken
to rectify defects or deficiencies. The prime objectives of monitoring are-
To check on whether mitigation and benefit enhancement measures are actually being adopted
and are providing effective in practice
To provide a means whereby impacts which were subject to uncertainty at the time of
preparation of EMP, or which were unforeseen, can be identified, and steps to be taken to
adopt appropriate control measures.
To provide information on the actual nature and extent of key impacts and the effectiveness of
the mitigation measures which, through a feedback mechanism, can be taken into account in
the planning and execution of similar projects in future
There are two basic forms of monitoring:
Visual observation or checking, coupled with inquiries

EMP Report No.: EMP/17/1019
86
Physical measurement of selected parameters In the case of industrial projects in general,
monitoring is done by physical measurement of some selected parameters like air, water, noise
etc. It should be mentioned here that the monitoring program should be such so that it can
ensure compliance with national environmental standards. The importance of this monitoring
program is also for ensuring that the factory does not create adverse environmental changes in
the area and providing a database of operations and maintenance, which can be utilized if
unwarranted complaints are made.
Environmental monitoring requires a set of indicators that could be conveniently measured, assessed
and evaluated periodically to establish trends of impacts. The indicators may be independent or may be
functionally related. The physic-chemical, ecological and human interest including socio-economic
indicators should be well understood. The monitoring program, in view of the possible impacts as
assessed earlier, should consider the indicators for the impact assessment related to following issues is
presented in Table.
It is desirable that the mitigation measures for the negative impacts and environmental enhancement
for positive impacts are implemented according to the suggestions presented in this report. There are
two types of environmental monitoring activities associated with the project, during construction and
during operation of the project. Each of the components is to be dealt with according to the
requirement of suggested measures.
Monitoring indicators is limited to a number of impact parameters to see the actual performance of the
factory. Environmental monitoring requires set of indicators that could be conveniently measured,
assessed and evaluated periodically to observe the trends of change in base line environmental quality.
The factory management authority of Indesore sweater Ltd. should be responsible for overall
environmental monitoring of the factory. The environment monitoring of the factory should primarily be
focused on addressing the following issues:
(a) Emission from the power generator
(b) Generation of noise
(c) Waste generation at the factory
8.3.8 Monitoring Parameters for Operational Phase
Meteorological measurements: Meteorological monitoring should be conducted to monitor the wind
direction and speed, temperature& humidity.
Ambient air quality monitoring: Continuous and/or periodic measurement of the air quality indicators
e.g., SOx, CO, NOx, PM10, PM2.5, and temperature needs to be carried out.

EMP Report No.: EMP/17/1019
87
Groundwater monitoring: The groundwater level along with the selected drinking water quality
parameters (e.g., pH, Color, Turbidity, TDS, Ammonia, Nitrate, Phosphate, As, Fe, Mn and Coli forms)
may be monitored.
Noise level monitoring: Indoor noise levels in the generator facilities along with the outdoor need to be
monitored regularly.
8.4 Occupational Health and Safety
Occupational health and safety means preventing accidents and work related ill health. Improved health
and safety management can bring significant benefits to the business. It reduces individual and human
costs of accidents and ill health, direct and indirect cost to the business, improves customer perception
and company profile and workers’ morale.
Under occupational health hazards, one can group several categories of working conditions impairing
the health conditions of workers, though this impairment is slow. Safety relates more to health hazards
that results from accidents and can cause instantaneous impairment of the workers’ health.
8.4.1 General Requirements
In Bangladesh the main law related to occupational health and safety is Labor Law 2006 and its updated
specific revision in 2015. The law has provisions on occupational hygiene, occupational diseases,
industrial accidents, protection of women and young persons in dangerous occupation. The salient
features of the general requirements for the workers’ health and safety stated in this law is presented in
Table 8.3.
Table 8.3: General requirements for workers’ health and safety
Issues Precautionary measures Action taken after incident
Precautions in
case of
Fire
Shall be provided with means of escape in
case of fire
● Effective measures shall be taken to
ensure that all the workers are familiar with
the means of escape
Firefighting apparatus should be provide and maintained
Storage water source
Fire hydrant
Emergency light/PA System
Organize regular fire drill.
Emergency evacuation of the employee
Provide medical services to a safe place.
Call fire brigades, hospital, and civil defense for emergency.
Precautions in case of Explosion
Inspect equipment regularly.
Install automatic emergency controls in the equipment.
Develop emergency SOPs & organize training
Shut down all the operations
Evacuate all the employees in a safe place.
Provide first aid in a safe place.
Contact with the hospitals/ civil

EMP Report No.: EMP/17/1019
88
Fix rescue area
Ensure first aid
defense.
Health and
Hygiene with
emergency
accidental case
● Cleanliness
● Ventilation and temperature
● Disposal of wastes and effluents
● Latrines and urinals
● Spittoons and dustbins
Provide medical services to a safe place.
Call hospital, civil defense for emergency.
Owner’s responsibility for compensation
● Amount of compensation
● Report on fatal accident and
treatment
● Compensation on contract and
contract registration
● Appeal
Other Safety
● Safety for building and equipment
● Floor, stair and passage way
● Work on or near machinery in motion
● Carrying of excessive weights
Latrines and
urinals
● Sufficient latrines and urinals shall be
provided
● Shall be maintained in clean and sanitary
condition
● Shall be adequately lighted and
ventilated
First aid
● Provided and maintained first aid facility
● One for every one hundred and fifty
workers
● Shall be kept with a responsible trained
person who shall be available during the
working hours
● In every facility where five hundred or
more workers are employed, a dispensary
shall be provided and maintained
Disposal of
wastes and
effluents
● Provide with proper disposal system for
solid waste and effluents.
● In case of a factory where no public
sewerage system exists, prior approval of
the arrangements should be made for the
disposal of wastes and effluents.
If personal injury is caused to workmen
by accident arising in the course of
employment, employer shall be liable to
pay compensation
● 36 occupational diseases for
compensation payable
● Monthly payment as compensation
for temporary disablement are
1. Compensation should be paid for the
period of disablement or for one year
whichever period is shorter
2. Such compensation shall be paid at
the rate of full monthly wages for the
first two months
3. Two thirds of the monthly wages for

EMP Report No.: EMP/17/1019
89
the next two months and at the rate of
the half of the monthly wages for the
subsequent months
4. In case of chronic occupational diseases , half of the monthly wages during the period of disablement for a maximum period of two years shall be paid
8.4.2 Remedial measures
To minimize the hazards arising from the activities at different phases of plant construction and
operation, the following measures should be taken:
● Employees should be informed of the potential health impacts they are facing
● Employer should inform his employees of these potential hazards, arrange proper medical
examination prior to and during employment, as well as tests and analyses necessary for the detection
of diseases
● Works with volatile toxic chemicals should be undertaken in a well-ventilated place
● Laborers handling offensive toxic chemicals should be provided with and forced to use protective
clothing
● Workers exposed to an excessive amount of noise should be provided with protective gear and be
relieved frequently from their post
● Workers exposed to large amounts of dust should be provided with adequate protective gear
● Frequent spraying of water should be undertaken to minimize dust pollution
● Persons undertaking construction and installation works should have access to amenities for their
welfare and personal hygiene needs such as sanitary toilets, potable drinking water, washing facilities,
shelter sheds etc.
● Proper disposal of waste and silage should be arranged
● Health education and information on hygiene should be provided to the workers
● Regular checks on food quality should be arranged within the work site
8.5 Safety Mitigation Plan
8.5.1 Safety Management System
Safety is an integral part of the company’s work. It is part of the company’s operations and there to
protect employees, clients, property, the environment and the public. There are many costs to accidents
and unsafe work practices. The greatest costs are human cost. Protecting employees also protects
their friends, families, fellow workers, management, the public and the environment from the far-
reaching effects of serious accidents. In addition to protecting lives, a safety program contributes
to employee morale and pride because employees participate in identifying safety needs and
developing safe work procedures.

EMP Report No.: EMP/17/1019
90
Visitors to the worksite may also face legal action if they knowingly disobey safety rules. In addition, the
company may face legal action and fines for violations of regulatory requirements. Those
individuals who do not fulfill their safety responsibilities will become accountable for any problems their
negligence creates and may be liable under the law. Everyone employed by a company is responsible
for maintaining the safety program. Managers and supervisors are responsible for identifying
safety needs, communicating safety hazards, investigating hazardous conditions and accidents,
providing training, supply or wearing appropriate safety and personal protective equipment, and
ensuring all equipment is properly maintained and meets legislated safety standards. Their role is
supported by input from all employees.
All company employees are responsible for obeying all safety rules, following recommended safe
work procedures, wearing and using personal protective equipment when required, participating in
safety training programs and informing supervisors of any unsafe work conditions. Everyone has the
right and responsibility to refuse to do work when unsafe conditions exist. By fulfilling safety
responsibilities, workers will share the benefits of a safety place.
The company must have its own safety management and mitigation plan and policy. Listed below
are the important features that need proper attention of company management.
8.5.2 Company Safety Policy
The company must have its own safety policy. The safety policy should be updated from time to time.
The policy should be signed and dated by the chief safety officer. The policy should be discussed with all
personnel. The chief safety officer should periodically review the policy and re-issue the policy.
8.5.3 Safety Responsibilities
All personnel should have safety responsibilities assigned to them. The documented responsibility
should be included in the program manual. Compliance with the responsibilities should be monitored
and if these are not carried out for some good reason, corrective measures should be taken.
8.5.4 Management Communication
The management should decide how it communicates periodically with the personnel regarding
safety. A site schedule for conducting site tasks should be developed; this should be included in
the safety program manual. Documentation of site tours should be retained for verification.
8.5.5 Inspections
A list of all work sheets, equipment, vehicles and work practices requiring inspection should be
developed. Checklists and schedules should be developed as part of the inspection program. A
system for correcting deficiencies noted during the inspection process must be developed. The
system should prioritize deficiencies noted so that serious hazards are dealt with immediately.

EMP Report No.: EMP/17/1019
91
8.5.6 Personnel Protective Equipment (PPE)
The work site should be assessed to determine what personal protective and safety equipment is
needed and the equipment must be available. A maintenance schedule must be developed for PPE and
records for maintenance retained on file. Employees must be trained in fitting, care, maintenance and
use of PPE. Detailed rules and procedures identifying company and legislative requirements and
expectations must be communicated to all employees and contractors. They serve as a reference and
describe the minimum standard by which business is conducted. Most important rules and
procedures ensure consistency in the performance of tasks by all employees. The current rules
should be reviewed and assessed as to whether they are appropriate for the
operation/facility/employees. The formulated rules must be communicated to the workers effectively,
and workers must ensure that they understand the rules and have no difficulty to comply with the rules.
8.5.7 Standard Work Procedure
The intent of standard work procedures is to ensure consistency in the performance of hazardous
work and it must form the minimum standards by which specific tasks are performed. Workers
must have clear understanding of the procedures they are required to follow. A system for periodic
review of procedures must be developed. The employees involved in the work will be given an
opportunity to suggest steps that would provide for continuous improvement to the procedures. The
work procedures shall also ensure that all hazardous tasks have been accounted for. Procedures and
codes of practice have to be developed for hazardous work. To determine compliance with safety and
hazard issues while performing a task by a worker, efforts should be made to ensure the following:
Confirm that employees affected by these tasks participate in the development of safe work
procedures,
Confirm that the employees are involved in the maintenance of safe work procedures,
Interview workers to determine if they know what tasks have work procedures, where
these procedures are located and generally what makes up to content,
Review records to ensure that employees receive training on hazardous work procedures
and codes and practices,
Where practical, observe employees performing critical tasks to confirm use of standard
work procedures and codes of standards.
8.5.8 Emergency Procedures
Emergency procedures will identify who does what and when in the event of an emergency.
Responsibility for who is in charge of the co-ordination of emergency actions shall be identified. The
procedures shall be easily referenced, concise and understandable. All employees shall be aware of
the content and location of the procedures. The content lists associated with the procedures will be
current. The procedures will be updated and tested on a regular basis. The training record and level of
training gained by an employee shall be verified so as to ensure his first aid training.

EMP Report No.: EMP/17/1019
92
Subcontractor employees will also be trained in first aid. The following are the important events that
need emergency procedures.
Fire
Injury/death
Electrical injuries
Natural disasters
8.5.9 Safety
Safety implies the reduction of risk of accidents at the work site. Accident prevention is more valuable
than any mediatory or compensatory measures. This may be achieved through strict rules and
procedures for the execution of specific tasks, enforcement of the rules, and discipline amongst
workers, maintenance of machineries used and by providing all necessary gear or equipment that may
enhance the safety of the workers.
The following guidelines should be followed to maintain the safety of the workers:
Workers have to be informed about the possible damage or hazards related to their respective
jobs
Must ensure that electrical installations materials, equipment and apparatus are designed,
Installed, used, maintained and tested to eliminate the risk of electrical shock, burns, fire Or
explosion.
Factory site should be kept orderly and tidy. Access ways should be kept clear of Materials and
debris and maintained in a non-slippery condition. Materials should be Stored in an orderly
manner so that it does not pose any risk to the health or safety of any Person
Arrangements of first aid facility should me made accessible when work is being undertaken.
8.5.10 Training
Training is an integral part of a preventive strategy. The target groups requiring training should be
managers, supervisors, and technicians and related staff who may be exposed to risk at work. The
following issues should be addressed in training of the managers, staff and workers:
Workers should be trained to use the engineering controls where installed
Arrange workplace consultation on noise control
Workers should participate in training and contribute to the noise management strategy
Employee representatives should represent the views of workers to management about
occupational health and safety and report to workers about management policy
Persons likely to be exposed to risks should be provided with information and instruction in
safety procedures associated with the plant at the work place.
Information on emergency procedures relating to the plant should be displayed in a manner
that can be readily observed by persons who may be affected by the operation of the factory.
Training should be provided to use firefighting equipment when necessary.

EMP Report No.: EMP/17/1019
93
Facility staff needs to be trained in the safety procedures that are to be implemented during
unloading, transfer and storage of hazardous materials.
8.5.11 Record Keeping and Reporting
Record keeping and reporting is one of the requirements of any QA/QC system and essentially of a good
management tool. Properly maintained records of construction, installation, training, equipment
maintenance, operation, fault detection and remedy can help in reducing risks of accidents, legal costs
and thereby overall cost of operation of a plant. Records also help in identifying causes of any accident
and elimination of the same accident in future. Records may be maintained for the proposed plant as
follows.
Noise
Audiometric test records of employees should be kept during the employee's period of employment and
longer as necessary, as they may provide a useful reference for workers' compensation. The records
should be kept in a safe, secure place and held as confidential documents.
Hazardous Substances
Assessment reports which indicate a need for monitoring and/or health surveillance together with the
results of monitoring and/or health surveillance shall be kept as records in a suitable form for at least 30
years from the date of the last entry made. Retention for a period of at least 30 years is necessary
because some health effects, such as cancers, may take a long time to become evident. The information
kept will be valuable in epidemiological studies and for developing effective control strategies.
All other records, including assessment reports not indicating a need for monitoring and/or health
surveillance and records of induction and training, shall be maintained for at least five years in a suitable
form.
8.6 Environmental Management Systems (EMS)
An EMS is a tool designed to enable organizations to target, achieve and demonstrate continuous
improvement in environmental performance. It is one integrated management process with a number
of stages, which includes an environmental audit. There are a number of standards (e.g. the British
Standard BS7750 (BS11992), the European Eco-Management and Audit Scheme for Industry (CEC,
1993)). These consist of most or all of the following elements depending on the standard, to:
1. Adopt an environmental policy to confirm and promote commitment to continual improvement in
environmental performance;
2. Undertake an environmental review to identify significant environmental issues and effects;
3. Setup environmental programs of objectives, targets and actions;
4. Establish an environmental management system to ensure the implementation of the necessary
actions to achieve these objectives;
EMP Report No.: EMP/17/1019
94
5. Undertake periodic environmental audits to assess the performance of such components;
6. Prepare an environmental statement on environmental performance; and
7. Obtain independent verification of the environmental statement.
Also there is ISO 14001 which is a voluntary international standard for environmental management
systems ("EMS"). ISO 14001:2015 provides the requirements for an EMS and ISO 14004:2015 gives
general EMS guidelines. An EMS meeting the requirements of ISO 14001:2015 is a management tool
enabling an organization of any size or type to:
(1) Identify and control the environmental impact of its activities, products or services;
(2) Improve its environmental performance continually, and
(3) Implement a systematic approach to setting environmental objectives and targets, to achieving
these and to demonstrating that they have been achieved.

EMP Report No.: EMP/17/1019
95
Chapter Nine Risk Assessment and Management

EMP Report No.: EMP/17/1019
96
9.1 Introduction
The problem of protecting human health and the environment may best be defined as the management
of risk. The failure to manage risk effectively and to establish priorities rationally translates ultimately
into a failure to protect health, safety, and the environment. Through the use of risk assessment,
concerned authorities can estimate the relative level of risks posed by different substances, products
and activities and can establish priorities in determining whether, and how, to regulate.
The risk assessment should constitute an organization’s best effort to employ advanced scientific and
technical methods to predict accurately the sizes of the risks. Once the relevant risks are estimated
accurately and objectively through the risk assessment process, it can then be decided how best that
risks could be addressed in the risk management phase.
Risk assessment is the technical process for estimating the level of risks posed by operational processes
or products, i.e. the probability that a given harm will occur as a result of the processes or products. Risk
assessment is applied to a substance, proceeds in four major steps:
Hazard identification: determining what kinds of adverse health effects a substance, product or
activity can cause
Dose – response assessment: predicting the degree of adverse effects at a given exposure level
Exposure assessment: estimating the amount of exposure, and
Risk characterization: combining the foregoing into a numerical range of predicted deaths or
injuries associated with actual exposure event
Risk management options are then evaluated in a proposed solution to provide reduction of risk to the
exposed population. Specific actions that are identified and selected may include consideration of
engineering constraints as well as regulatory, social, political and economic issues related to the
exposure. Quantitative assessment of risks associated with hazard identification, dose-response
assessment, exposure estimation and risk characterization were beyond the scope of the present study.
However, this study takes a qualitative approach to identify common hazards within the factory and
recommends measures for managing these risks with accidents and external threats.
9.2 Factory Risks Assessment
Apart from risks associated with emissions, noise generation, solid waste, hazardous waste and
wastewater disposal as a result of construction and operation, the factory put human beings and the
environment inside and outside of the factory to a certain degree of risk of accident and sometime loss
of life. It is therefore essential that a risk management plan be devised in order to both reduce risk of
accident and to take the correct action during accidents. Important risks of accidents in garment factory
leading to disasters or emergency situations may occur during following events:
Risks during emergency
Fire
Explosion

EMP Report No.: EMP/17/1019
97
Electrocution
Risks due to natural disasters
Cyclone
Earthquake
Storm
Lightning
Risks due to external threats
Sabotage
War situation
Water/food poisoning
Several strategic areas within the factory can be identified as places of potential risks during factory
operation:
Areas prone to explosion are:
Generator area
Chemical store
Premises prone to fire and electrocution are:
Electrical rooms
Transformer area
Cable tunnel
In garment factory accidents can occur at two different levels. First, these may occur due to fires,
explosions. In such events, operators working inside the factory and at various strategic hazard locations
will be affected.
Second, risks are also associated with external threats of sabotage.
9.3 Managing the Risks
As mentioned earlier, in order to reduce the risks associated with accidents, internal and external
threats, and natural disasters, a risk management program is essential. Risk management planning can
be done during design and planning stage as well as during operation. While risk management is mainly
preventive in nature during the operation stage, the design and planning stage can incorporate changes
in basic engineering to include safety design for all processes, safety margins for equipment, and factory
layout. The following steps among others are important in managing the risks mentioned:
The factory layout should provide roads of adequate width and service corridors so that no
undue problems arise in the event of fires or other hazards (Chapter six, Bangladesh Labor Rules
2015).

EMP Report No.: EMP/17/1019
98
With respect to factory operation, safe operating procedures should be laid down and followed
to ensure safety, optimum operation and economy.
A firefighting group with adequate manpower and facilities such as water tank of sufficient
capacity, CO2 tank, foam tank, portable fire extinguishers should be provided and facilities
located at strategic locations e.g. generator area, control rooms.
Regular checks on safe operating practices should be performed.
In order to achieve the objective of minimizing risks at the Indesore sweater Ltd., in addition to
Environmental Management Unit for the complex, a disaster management unit with adequate
manpower and facilities for each plant within the complex must be in place. The unit will be trained to
act in a very short time in a pre-determined sequence to deal effectively and efficiently with any
disaster, emergency or major accident to keep the loss of life, human injury, material, plant machineries,
and impacts on the environment to the minimum (Chapter six, Bangladesh Labor Rules 2015).
9.4 Emergency Response Plan
Emergency response plans are developed to address a range of plausible risk scenarios and emphasize
the tasks required to respond to a physical event. The emergency response plan (ERP) for the proposed
factory has been developed listing various actions to be performed in a very short period of time in a
pre-determined sequence if it is to deal effectively and efficiently with any emergency, major accident
or natural disaster. The primary objective of the plan is to keep the loss of life, material,
machinery/equipment damage, and impacts on the environment to minimum.
9.4.1 Emergency Response Cell
It is highly recommended that an Emergency Response Cell (ERC) adequately equipped with highly
trained manpower and appropriate gears is established within the factory complex in order to
effectively implement the emergency response plan. The main functions of the emergency response cell
should include the following:
Identification of various types of emergencies
Identification of groups, communities, and areas those are vulnerable to different kinds of
emergencies
Preparing service teams for various operations within the organization through extensive
training
Establishment of early detection system for emergencies
Developing reliable, instant information communication system
Mobilizing all units in the complex within a very short time to address any emergency
9.4.2 Emergency Preparedness
The ERC headed by a trained Manager should establish an Emergency Control Room with links to all
plant control rooms and all other services. The ERC shall work as a team of the following officials:

EMP Report No.: EMP/17/1019
99
Emergency Manager (Team Leader),
Fire Officer,
Safety Officer,
Chief Security Officer,
Chief Medical Officer,
Rescue Officer, and
Public Relations Officer
The Senior Environmental Specialist of the proposed Environmental Management Unit for the Indesore
sweater Ltd. with adequate skills of facing emergency situation can act as the Emergency Manager of
ERC. The Emergency Manager shall have the prerogative of shutting down the relevant units or the
complete plant, which are affected or may further deteriorate damages, in case of an emergency. The
EM however, shall have to report to the Chief Engineer of the complex of such an event without any
delay.
The team will be responsible for preparing and executing a specific emergency response plan for the
factory. The team should meet at regular intervals to update the plan, based on plant emergency data
and changes in support agencies.
The team should undertake some trial runs, e.g. fire drill, in order to be fully prepared and to improve
upon the communication links, response time, availability and workability of emergency gears and other
critical factors.
Upon receiving information about an accident, the ERC team will assemble in the Emergency Control
Room within the shortest possible time and formulate emergency control procedure.
9.4.3 Fire Fighting Services
The Fire Officer will be the commanding officer of the firefighting services. The FO will head a
fire fighting team of trained officers and workers.
Adequate firefighting equipment e.g. fire extinguishers of different types appropriate for
different strategic locations must be planned according to requirements of existing factory.
Depending on the scale of emergency, the firefighting team will work in close association with
security and maintenance personnel of the complex. Additional assistance may also be sought
from outside fire stations when required.
Preparedness is extremely important for efficient and effective firefighting services at the time
of emergency. This can be better achieved by organizing fire drills at regular intervals, e.g. once
every two weeks during dry summer months and once every two months during wet months
involving all team members, all other service groups, all staff of the factory complex, and
utilizing all firefighting gears.

EMP Report No.: EMP/17/1019
100
9.4.4 Emergency Medical Services
The Chief Medical Officer will be responsible for providing medical services within the Indesore
sweater Ltd. at the time of any emergency. The services should also be rendered to people living
in the close vicinity of the complex and affected by any accident within the plant complex.
The existing Medical Center of the Indesore sweater Ltd. must be equipped with adequate
medical personnel and equipment for providing emergency services in addition to normal
Medicare services to population of the complex.
A team of well-trained Medical Officers specializing in burn injury, orthopedics, electrocution,
chemical toxicity or poisoning, and shock treatment must be available at the factory Medical
Center. The number of officers may be determined considering the total number of staff and
their family members in the complex. Special attention must be given to child injury treatment.
The following services must be on alert at all times in the factory.
First aid services for attending patients on the spot. The Medical Center should provide training
on first aid services to some designated staffs of important areas of operation, e.g. boiler area,
transformer area, electrical rooms, and chemical storage facilities, for immediate attention to
the injured.
Ambulance services for transport of casualties from spot to Medical Center of the factory and
from Medical Center to outside hospital, as necessary. Facilities for transportation of fatalities to
appropriate hospital or to relatives or to the police following prescribed procedure should be
available.
All potential areas for emergency/ accidents in the plant complex must have an information
chart including contact phone numbers of relevant services.
9.4.5 Rescue Services
Without going for additional manpower, the rescue team can be formed with potential staffs of the
Factory, e.g. from medical services, security services and firefighting services, for conducting rescue
operations following an emergency. A senior member can be designated Rescue Officer who will be
responsible for formulating rescue plan and guiding the team. Important functions include:
Cut-off electricity, gas or water supply to accident spots
Rescue people from debris of collapsed structures
Demolish damaged structures that may endanger human lives
Rescue people from fire areas with adequate protection
Assist other services promptly to save human lives
Isolate damaged equipment or machineries that may endanger human lives
Provide repair services as appropriate to restore operations
9.4.6 Security Services
The Indesore sweater Ltd. will have a strong independent security team headed by the Chief Security
Officer and will be responsible for the overall security of the factory, its equipment, machineries,
EMP Report No.: EMP/17/1019
101
buildings, utilities, and the community living within the complex. The security office shall maintain
liaison with other emergency services at the time of emergency and during normal hours.
The Chief Security Officer shall communicate with local police and other law enforcing agencies and seek
assistance as may be needed during an emergency. The security team will also regulate vehicular traffic
inside the complex. In particular they will ensure that all roads are unobstructed during emergencies.
9.4.7 Public Relations Services
The Public Relations Officer (PRO) of the factory will be responsible for communicating
emergency related information to concerned officials within the complex. The PRO however,
will consult the Emergency Manager before communication with outside agencies.
The PRO will be responsible for warning people in and around the factory against potential fire
hazards, or other emergencies.
The PRO will keep close contact with outside local community and provide direction, and
participate along with management team in the welfare services for the affected peoples.
9.5 Conclusion
Apart from the services mentioned above, the Environmental Management Unit and the Emergency
Response Cell must ensure that all staffs working within the factory are oriented, through orientation
programs, about the do’s and don’ts during emergencies as well as overall environmental aspects and
issues related to factory operations.
It is however, to be emphasized that the emergency response plan (ERP) outlined above is to be used as
guide only and that the Environmental Management Unit and the Emergency Response Cell shall
develop their own environmental management system (EMS) following ISO 14001.

EMP Report No.: EMP/17/1019
102
Chapter Ten Conclusion

EMP Report No.: EMP/17/1019
103
Bangladesh’s export earnings are mostly determined by the export of readymade garments (RMG) to
North American and European countries with 75% of total export earning coming from this sector. So
with the improvement of the sector, the business became huge and industries started to set up in large
scale. As an obvious result of that the effect of these industries on environment increased day by day. In
some cases the situation became worse. For a sustainable development a lot of initiative has been taken
by the regulatory bodies, buyers of the garments and manufacturing industries. As a process of
protecting environment it is essential to know the impact on the environment by any specific industry.
So being one of the leading companies in sweater making track, Indesore sweater Ltd. found the
necessity of an Environmental Management Plan (EMP) study for their company. The EMP report has
been prepared through identifying the potential impacts, assessing them and recommendation possible
mitigating and enhancing measures for negative and positive impacts, respectively.
From the EMP report it was found that the effect of the factory on environment is minimal. The reason
of being the effect so negligible is because the facility uses ETP for waste water treatment and air
pollution is from the power generator and the noise level found satisfactory in most of the places.
So the potential impacts from the factory can be divided into three major sections:
1. Atmospheric emissions and Air quality
2. Water pollution and waste water discharge
3. Noise
All these aspects have been examined and the findings are as follows:
Atmospheric Emission and Air Quality
The factory power generator is operated on diesel. Emission of sulfur dioxide and particulates would be
insignificant as the Bangladeshi indigenous natural gas is almost free of Sulphur and particles. Emission
of NOx will also be very low as the air-fuel ratio is high. From the test report we found the emission of
NOx is within the limit of DoE, IFC/World Bank and other Bangladesh national regulation.
Liquid Discharge
The factory will produce wastewater from production process since it has mainly process in the
production. That waste water will be treated by Effluent Treatment Plant. Apart from that domestic
liquid wastes will be produced from the factory by the use of worker in the factory. This liquid waste
would be disposed through septic tank.
Noise
The noise impact generated by operation of the power generator is the main source of noise pollution.
Appropriate noise controls will be installed to keep the neighborhood impact due to noise emissions
within the limit of DoE and international standards. In that case personal protection has to be taken for
the worker working adjacent to the machine.
Having reviewed all the potential environmental impacts, and following our proposed mitigation
measures the factory is expected to proceed without having unacceptable environment.

EMP Report No.: EMP/17/1019
104
However no development can be expected without any adverse impact on the environment. The
beneficial impacts on the nation as well as human beings would only be meaningful and sustainable
development would only be possible if adverse impacts are minimized through strict maintenance and
control measures as mentioned for this factory. All this would need vigilant care and cost money, and
the factory authority should take these into consideration.
References
1. Peavy & Rowe (1985), “Environmental Engineering”, McGraw-Hill Inc., Singapore.
2. BBS (2006), "The Statistical Yearbook of Bangladesh." Bangladesh Bureau of Statistics, July
2007, Dhaka, Bangladesh.
3. DoE (1997) "Environmental Conservation Rules”, Department of Environment, Govt. of
Bangladesh.
4. DoE (1995) "Environmental Conservation Act", Department of Environment, Govt. of
Bangladesh.
5. DoE (2002) "A Compilation of Environmental Laws", Department of Environment, October, 2002,
Govt. of Bangladesh.
6. GoB, (1992), “Bangladesh Environmental Policy”.
7. GoB, (1995), “National Environmental Management Action Plan (NEMAP)”.
8. GoB (1997a), EA Guidelines for Industries, Department of Environment, Ministry of
Environment and Forest, Government of the People’s Republic of Bangladesh, June 1997.
9. GoB (2005), SRO No. 220-Rule/2005, Revision of the Environment Conservation Rules 1997,
Ministry of Environment and Forest, Government of the People’s Republic of Bangladesh,
Dhaka.
10. IFC (2002), Occupational Health and Safety Guidelines, International Finance Corporation, World
Bank Group.
11. http://www.worldweatheronline.com

EMP Report No.: EMP/17/1019
105
Disclaimer

EMP Report No.: EMP/17/1019
106
Disclaimer
This report is for the exclusive use of the client of Intertek named in this report and is provided pursuant
to an agreement for services between Intertek and Client. No other person may rely on the term of this
report. This report provides a summary of the findings and other applicable information found/provided
during the audit, which includes review of environmental impact approval and permits, other relevant
documents, facility tour, employee interviews and management interviews at the specified facilities on
the specified date only. Limiting to the information observed, revealed and provided during the audit,
the report makes no warranties or representation either expressed or implied with respect to the
compliance of the environmental as per the requirement of department of environment of Bangladesh.
Intertek assumes no liability to the authenticity and legality of documents provided. This report shall
not be used as the sole and final report to determine safety of the electrical system. The responsibility
of ensuring amendment and correction of the non-compliant issues lies with the Client. Further, as the
audit process used by Intertek is a sampling exercise only, Intertek accepts no responsibility for any non-
compliant issues that may be revealed related to the operations of the identified facility at any other
date. Intertek’s responsibility and liability are also limited in accordance to the terms and conditions of
the Client Agreement. Intertek assumes no liability to any party, for any loss, expense or damage
occasioned by the use of this information other than to the Client and in accordance with the Client
Agreement and these disclaimers. In case there is any conflict between this disclaimer stated herein and
the applicable terms and conditions of Intertek incorporated into the Client Agreement, then these
disclaimers shall prevail.