Degenerate quantum gases of...
256
Degenerate quantum gases of strontium dissertation by Simon Stellmer submitted to the Faculty of Mathematics, Computer Science and Physics of the University of Innsbruck in partial fulfillment of the requirements for the degree of doctor of science advisors: Univ. Prof. Dr. Rudolf Grimm, Institute of Experimental Physics, University of Innsbruck, Institute for Quantum Optics and Quantum Information of the Austrian Academy of Sciences Dr. Florian Schreck, Institute for Quantum Optics and Quantum Information of the Austrian Academy of Sciences Innsbruck, January 2013
Transcript of Degenerate quantum gases of...

Degenerate quantum gases of strontium
dissertation
by
Simon Stellmer
submitted to the Faculty of Mathematics, ComputerScience and Physics of the University of Innsbruck
in partial fulfillment of the requirementsfor the degree of doctor of science
advisors:Univ. Prof. Dr. Rudolf Grimm,
Institute of Experimental Physics, University of Innsbruck,Institute for Quantum Optics and Quantum Information
of the Austrian Academy of Sciences
Dr. Florian Schreck,Institute for Quantum Optics and Quantum Information
of the Austrian Academy of Sciences
Innsbruck, January 2013

ii
ATTENTION: This is not the original version of the thesis! Changes have been made to the originalversion to correct a number of spelling and formatting errors. The contents, however, has remainedentirely untouched. The original version can be obtained directly from the author, or through theUniversity of Innsbruck.

Summary
The exploration of the quantum world is a fascinating and very active field of current re-search. Experiments with gases of ultracold atoms are building on a long history of precisionmeasurements and have been particularly successful in reaching ever lower temperatures.The first Bose-Einstein condensate was created about two decades ago and ignited the inves-tigation of quantum-degenerate samples. But for a few exceptions, these experiments haveutilized alkali atoms, which have a relatively simple electronic structure.
Alkaline-earth atoms, on the other hand, carry two valence electrons and exhibit a richelectronic structure of singlet and triplet states, connected by narrow intercombination lines.Such transitions of mHz-width are driven in optical clock experiments, which are outperform-ing microwave clocks by orders of magnitude. The unique properties of these elements are atthe basis of recently proposed schemes of quantum simulation, targeted at the investigationof quantum magnetism and spin models. The proposed experiments rely on the availabilityof quantum-degenerate gases, and require a supreme control over all relevant parameters.
This thesis is aimed to provide a solid foundation for such experiments, choosing stron-tium as the atomic species. We report on the first Bose-Einstein condensation of this element,choosing the isotope 84Sr for its favorable scattering properties. This achievement receivedwidespread recognition, and we are able to attain condensates of the two other bosonicisotopes, 86Sr and 88Sr, as well.
The proposed schemes of quantum simulation require isotopes with nonzero nuclear spin,sparking considerable interest in the fermionic isotope 87Sr, which has a large nuclear spinof I = 9/2. We develop a set of experimental techniques to control the spin composition ofan atomic sample, and we present deeply-degenerate Fermi gases with a variable number ofspin states.
Dipolar quantum gases are another active field of research. Diatomic molecules in theirinternal ground state, made up of an alkali and an alkaline-earth atom, possess both anelectric and a magnetic dipole moment. Magnetic Feshbach resonances, which are com-monly used to associate bi-alkali molecules, are absent or very weak in bi-alkaline-earth andalkali/alkaline-earth systems. We develop a novel technique of molecule association, demon-strated for the homonuclear case of Sr2. This approach uses atoms on doubly-occupied sitesof an optical lattice as the starting point for a coherent optical transfer into the molecularstate.
Finally, we expand the capabilities of laser cooling to reach a long-standing goal: Bose-Einstein condensation without evaporative cooling, purely by laser cooling and thermaliza-tion within the atomic gas. This work holds prospects for the generation of a continuousatom laser.
iii

Zusammenfassung
Die Untersuchung von Systemen, deren Verhalten von den Gesetzen der Quantenmechanikbestimmt wird, ist ein faszinierendes und lebendiges Gebiet aktueller Forschung. Experi-mente mit Gasen von ultrakalten Atomen sind dabei ausgesprochen erfolgreich und blickenzuruck auf eine lange Geschichte von Prazisionsmessungen, bei denen immer tiefere Tempe-raturen erreicht wurden. Die ersten Bose-Einstein Kondensate (BECs) wurden vor etwa 20Jahren erzeugt und eroffneten die Moglichkeit, quantenentartete Materie zu studieren. Bisauf wenige Ausnahmen wurden diese Versuche mit Alkaliatomen durchgefuhrt, da diese einerelativ einfache elektronische Struktur aufweisen.
Die elektronische Struktur von Erdalkaliatomen hingegen ist dank ihrer zwei Valenzelek-tronen sehr viel reichhaltiger und zeichnet sich durch Singlett- und Triplettzustande sowieschmale Interkombinationsubergange aus. Solche Ubergange werden etwa in optischen Uhrenverwendet; diese erreichen eine um Großenordnungen bessere Genauigkeit als Atomuhren, de-ren Funktionsweise auf einem Mikrowellenubergang beruht. Die einzigartigen Eigenschaftender Erdalkaliatome ermoglichen neuartige Verfahren fur Quantensimulationen. Die hierzuvorgeschlagenen experimentellen Studien, etwa von Quantenmagnetismus und Spinmodel-len, erfordern sowohl quantenentartete Gase von Erdalkaliatomen, als auch eine sehr genaueKontrolle aller relevanten Parameter.
Das Ziel dieser Dissertation ist es, eine experimentelle Grundlage fur diese Untersu-chungen zu schaffen. Als Atomsorte wurde dazu das Element Strontium ausgewahlt. Wirprasentieren die erste Bose-Einstein Kondensation dieses Elementes, wobei hierfur das Iso-top 84Sr auf Grund seiner gunstigen Eigenschaften ausgewahlt wurde. Dieser Erfolg sorgtefur weltweite Anerkennung, und bald darauf konnten auch BECs der beiden anderen boso-nischen Isotope, 86Sr und 88Sr, erzeugt werden.
Die angesprochenen Vorschlage zur Quantensimulation basieren auf einem Isotop mitvon Null verschiedenem Kernspin und wecken daher Interesse am fermionischen Isotop 87Sr,welches einen vergleichsweise großen Kernspin von I = 9/2 besitzt. Wir demonstrieren eineReihe experimenteller Techniken, mit Hilfe derer sich die Besetzung der Spinzustande ineinem atomaren Ensemble kontrollieren lasst, und erreichen tiefentartete Fermigase mit einerfrei einstellbaren Anzahl von Spinkomponenten.
Dipolare Quantengase sind ein weiteres hochaktuelles Forschungsthema. ZweiatomigeMolekule, bestehend aus einem Alkali- und einem Erdalkaliatom, besitzen in ihrem Grundzu-stand sowohl ein elektrisches als auch ein magnetisches Dipolmoment. Magnetische Feshbach-Resonanzen, wie sie ublicherweise zur Assoziation von Bialkali-Molekulen verwendet werden,sind in Bi-Erdalkali- oder Alkali-Erdalkali-Systemen jedoch nicht vorhanden oder ausgespro-chen schwach. Aus diesem Grunde haben wir eine neuartige Methode der Molekulassoziation
iv

v
entwickelt und dokumentieren diese am Beispiel des homonuklearen Molekuls Sr2. UnsereHerangehensweise nutzt als Ausgangspunkt zwei Atome auf einem doppelt besetzten Platzeines optische Gitters, um diese durch einen koharenten optischen Transfer in einen moleku-laren Bindungszustand zu uberfuhren.
Abschließend wenden wir uns einem seit langem bestehenden Ziel zu: der Erzeugungvon Bose-Einstein Kondensaten nicht durch Verdampfungskuhlung, sondern nur durch La-serkuhlung und gleichzeitiger Thermalisierung zwischen den Atomen. Wir erreichen diesesZiel mit Hilfe fein abgestimmter, raumlich strukturierter Dipolpotentiale. Dieses Verfahrenkonnte fur die Erzeugung eines kontinuierlichen, koharenten Atomstrahls verwendet werden.

vi

Contents
Summary iii
Zusammenfassung iv
1 Introduction 11.1 Quantum simulation . . . . . . . . . . . . . . . . . . . . . . . . . . . . . . . 21.2 Polar open-shell molecules . . . . . . . . . . . . . . . . . . . . . . . . . . . . 61.3 Quantum degeneracy in atomic gases . . . . . . . . . . . . . . . . . . . . . . 8
1.3.1 Bose-Einstein condensation . . . . . . . . . . . . . . . . . . . . . . . 91.3.2 Degenerate Fermi gases . . . . . . . . . . . . . . . . . . . . . . . . . . 11
1.4 Thesis overview . . . . . . . . . . . . . . . . . . . . . . . . . . . . . . . . . . 13
2 Strontium: an alkaline-earth element 172.1 The discovery of strontium . . . . . . . . . . . . . . . . . . . . . . . . . . . . 172.2 Nuclear properties . . . . . . . . . . . . . . . . . . . . . . . . . . . . . . . . 192.3 Electronic properties . . . . . . . . . . . . . . . . . . . . . . . . . . . . . . . 19
2.3.1 Optical transitions . . . . . . . . . . . . . . . . . . . . . . . . . . . . 202.3.2 Metastable states . . . . . . . . . . . . . . . . . . . . . . . . . . . . . 222.3.3 Nuclear and electron spin . . . . . . . . . . . . . . . . . . . . . . . . 23
2.4 Scattering properties . . . . . . . . . . . . . . . . . . . . . . . . . . . . . . . 252.5 Other two-electron systems . . . . . . . . . . . . . . . . . . . . . . . . . . . . 292.6 Experiments with thermal gases of strontium . . . . . . . . . . . . . . . . . . 352.7 Optical cooling procedure . . . . . . . . . . . . . . . . . . . . . . . . . . . . 36
2.7.1 The blue MOT . . . . . . . . . . . . . . . . . . . . . . . . . . . . . . 362.7.2 Repumping . . . . . . . . . . . . . . . . . . . . . . . . . . . . . . . . 382.7.3 The red MOT . . . . . . . . . . . . . . . . . . . . . . . . . . . . . . . 412.7.4 Loading of the dipole trap . . . . . . . . . . . . . . . . . . . . . . . . 52
3 Experimental setup 573.1 Vacuum system . . . . . . . . . . . . . . . . . . . . . . . . . . . . . . . . . . 583.2 Magnetic field coils . . . . . . . . . . . . . . . . . . . . . . . . . . . . . . . . 603.3 Control system . . . . . . . . . . . . . . . . . . . . . . . . . . . . . . . . . . 643.4 Optical access . . . . . . . . . . . . . . . . . . . . . . . . . . . . . . . . . . . 643.5 Laser systems . . . . . . . . . . . . . . . . . . . . . . . . . . . . . . . . . . . 65
3.5.1 The blue laser system . . . . . . . . . . . . . . . . . . . . . . . . . . . 65
vii

viii Contents
3.5.2 The green laser system . . . . . . . . . . . . . . . . . . . . . . . . . . 703.5.3 The red laser system . . . . . . . . . . . . . . . . . . . . . . . . . . . 723.5.4 The optical dipole trap . . . . . . . . . . . . . . . . . . . . . . . . . . 773.5.5 The lattice . . . . . . . . . . . . . . . . . . . . . . . . . . . . . . . . . 80
4 Publication: Bose-Einstein condensation of strontium 83
5 Publication: Double-degenerate Bose-Fermi mixture of strontium 91
6 Publication: Bose-Einstein condensation of 86Sr 99
7 Publication: Detection and manipulation of nuclear spin states in fermionicstrontium 1057.1 Introduction . . . . . . . . . . . . . . . . . . . . . . . . . . . . . . . . . . . . 1057.2 Optical Stern-Gerlach separation . . . . . . . . . . . . . . . . . . . . . . . . 1067.3 Spin-state dependent absorption imaging . . . . . . . . . . . . . . . . . . . . 1137.4 Preparation of spin-state mixtures . . . . . . . . . . . . . . . . . . . . . . . . 1157.5 Determination of an upper bound of the spin-relaxation rate . . . . . . . . . 1157.6 Conclusion . . . . . . . . . . . . . . . . . . . . . . . . . . . . . . . . . . . . . 117
8 Improved production of degenerate quantum gases of strontium 1198.1 Introduction . . . . . . . . . . . . . . . . . . . . . . . . . . . . . . . . . . . . 1198.2 Fifty-fold increase in 84Sr BEC atom number . . . . . . . . . . . . . . . . . . 1208.3 Generation of BEC with a cycle time of 2 seconds . . . . . . . . . . . . . . . 1228.4 Five-fold increase in 86Sr BEC atom number . . . . . . . . . . . . . . . . . . 1248.5 Reliable generation of an attractive 88Sr BEC . . . . . . . . . . . . . . . . . 1258.6 Double-degenerate Bose-Bose mixtures of Sr . . . . . . . . . . . . . . . . . . 1268.7 Deeply-degenerate Fermi gases of 87Sr . . . . . . . . . . . . . . . . . . . . . . 1298.8 Degenerate Bose-Fermi mixtures of Sr . . . . . . . . . . . . . . . . . . . . . . 1318.9 Conclusion . . . . . . . . . . . . . . . . . . . . . . . . . . . . . . . . . . . . . 133
9 Reservoir spectroscopy of the 5s5p 3P2 − 5s5d 3D1,2,3 transitions in Sr 1359.1 Introduction . . . . . . . . . . . . . . . . . . . . . . . . . . . . . . . . . . . . 1359.2 Experimental procedure . . . . . . . . . . . . . . . . . . . . . . . . . . . . . 1379.3 Characterization of the spectroscopy scheme . . . . . . . . . . . . . . . . . . 1389.4 Spectroscopy data . . . . . . . . . . . . . . . . . . . . . . . . . . . . . . . . . 1409.5 Is the 5s5p 3P2 − 5s5d 3D3 transition cycling? . . . . . . . . . . . . . . . . . . 1429.6 Conclusion . . . . . . . . . . . . . . . . . . . . . . . . . . . . . . . . . . . . . 1459.7 Error analysis . . . . . . . . . . . . . . . . . . . . . . . . . . . . . . . . . . . 145
10 The lattice 14710.1 Experimental techniques . . . . . . . . . . . . . . . . . . . . . . . . . . . . . 14710.2 Mott-insulator transition . . . . . . . . . . . . . . . . . . . . . . . . . . . . . 15010.3 Fermions on a lattice . . . . . . . . . . . . . . . . . . . . . . . . . . . . . . . 15210.4 Spatial Pauli blocking . . . . . . . . . . . . . . . . . . . . . . . . . . . . . . 153

Contents ix
10.5 Momentum state crystals revisited . . . . . . . . . . . . . . . . . . . . . . . 154
11 Publication: Creation of ultracold Sr2 molecules in the electronic groundstate 15711.1 Supplemental material . . . . . . . . . . . . . . . . . . . . . . . . . . . . . . 164
11.1.1 One-color PA spectroscopy . . . . . . . . . . . . . . . . . . . . . . . . 16411.1.2 Two-color PA spectroscopy . . . . . . . . . . . . . . . . . . . . . . . . 165
12 Laser cooling to quantum degeneracy 16912.1 Laser cooling to quantum degeneracy . . . . . . . . . . . . . . . . . . . . . . 16912.2 Experimental sequence . . . . . . . . . . . . . . . . . . . . . . . . . . . . . . 176
12.2.1 Sample preparation . . . . . . . . . . . . . . . . . . . . . . . . . . . . 17612.2.2 Transparency beam . . . . . . . . . . . . . . . . . . . . . . . . . . . . 18012.2.3 Cooling light . . . . . . . . . . . . . . . . . . . . . . . . . . . . . . . 18112.2.4 Dimple . . . . . . . . . . . . . . . . . . . . . . . . . . . . . . . . . . . 18112.2.5 Absorption imaging and data analysis . . . . . . . . . . . . . . . . . . 181
12.3 Characterization of laser-cooled BECs . . . . . . . . . . . . . . . . . . . . . . 18312.3.1 BEC atom number . . . . . . . . . . . . . . . . . . . . . . . . . . . . 18312.3.2 Transparency beam . . . . . . . . . . . . . . . . . . . . . . . . . . . . 18312.3.3 Timescales . . . . . . . . . . . . . . . . . . . . . . . . . . . . . . . . . 184
12.4 Absence of evaporation . . . . . . . . . . . . . . . . . . . . . . . . . . . . . . 18612.5 Shifting atomic and molecular transitions . . . . . . . . . . . . . . . . . . . . 188
12.5.1 Introduction . . . . . . . . . . . . . . . . . . . . . . . . . . . . . . . . 18812.5.2 Shifting of resonances . . . . . . . . . . . . . . . . . . . . . . . . . . . 18912.5.3 Polarization dependence . . . . . . . . . . . . . . . . . . . . . . . . . 18912.5.4 Conclusion . . . . . . . . . . . . . . . . . . . . . . . . . . . . . . . . . 190
12.6 Density distribution models . . . . . . . . . . . . . . . . . . . . . . . . . . . 19212.6.1 Self-consistent mean-field equations . . . . . . . . . . . . . . . . . . . 19212.6.2 Numerical model . . . . . . . . . . . . . . . . . . . . . . . . . . . . . 19212.6.3 Analytical model . . . . . . . . . . . . . . . . . . . . . . . . . . . . . 19312.6.4 Comparison to the experiment . . . . . . . . . . . . . . . . . . . . . . 194
13 Outlook: On and behind the horizon 19913.1 Further investigation of strontium . . . . . . . . . . . . . . . . . . . . . . . . 19913.2 Quantum simulation . . . . . . . . . . . . . . . . . . . . . . . . . . . . . . . 20013.3 Rb-Sr mixtures and molecules . . . . . . . . . . . . . . . . . . . . . . . . . . 201
A Construction of a simple high-finesse cavity 203
B Construction of a spectroscopy cell for the 1S0 − 3P1 transition 209
C Construction of an oven for strontium 215
Acknowledgements 245

x Contents

Chapter 1
Introduction
The condensation of particles into a single macroscopic quantum state at low enough tem-peratures was predicted by S. Bose and A. Einstein some 90 years ago. This work, basedon a purely statistical argument, awaited experimental realization for 70 years, and it wasnot until the 1990’s that both the required technology and the experience in the cooling ofatoms had matured to a degree that allowed for the creation of Bose-Einstein condensatesin atomic vapors [Ing99]. Today, the study of ultracold gases has evolved into a large anddiverse field of research that continues to expand at a breathtaking pace.
The early experiments explored the coherence properties and superfluidity of the con-densate, demonstrating the interference of matter waves, the nucleation of vortices, and theatom laser. Ground-breaking studies on the mean-field behavior, collective excitations, andsuperradiance have been performed. In the past ten years, studies have moved from theinvestigation of the degenerate matter itself towards the creation of novel and more involvedsystems, using degenerate gases as building blocks. These studies include the realization ofthe famous Bose-Hubbard model in optical lattices and the demonstration of the metal toMott-insulator transition, the study of dipolar and magnetic systems, the investigation ofone- and two-dimensional systems, the observation of Anderson localization, and the explo-ration of few-body phenomena, such as the Efimov-effect, and of many-body systems, suchas strongly interacting gases.
The first creation of degenerate Fermi gases in 1999 extended the coherence propertiesand supreme control to the realms of fermionic systems. The building blocks of matter arefermions, and the behaviors of many important physical systems, such as the one of electronsin a metal, of quarks in a plasma, or of neutrons in dense stars, are of fermionic character.Quantum gas experiments have realized the Fermi-Hubbard model, studied the BEC-BCScrossover, and reached the strongly interacting regime [Ing08].
Today, we witness an ambitious development: quantum-degenerate gases are no longerthe object of study themselves, but lend their capabilities to the exploration of other fieldsof research. One of two prominent examples is the connection to chemistry through thecreation of diatomic molecules in the rovibrational ground state, starting from ultracoldatoms. The other one is the quantum simulation of various solid state systems in generaland of quantum magnetism in particular, using atoms confined in an optical lattice.
The reason for the tremendous success of this research lies in the extraordinary degree
1

2 Chapter 1. Introduction
of control and large tunability of all relevant properties of the system, such as the samplesize, its temperature and density, spin composition, interaction strength, dimensionality,and coherence time. Nonetheless, the range of possible experiments is constrained by theproperties of the atomic species used. Reversely, the availability of degenerate samples ofa new species has triggered proposals and subsequent experiments that employ the uniquecharacteristics that this element brings about. The broad Feshbach resonance in Cs and thedipolar character of Cr serve as beautiful examples.
Almost all quantum gas experiments to date work with alkali atoms, which have a com-paratively simple electronic structure. Alkaline-earth elements however, atomic species withtwo valence electrons, feature a handful of remarkable properties not found in the alkalis:metastable states, narrow intercombination lines, and ground states free of any magneticmoment. These properties have encouraged a wealth of proposals for experiments thatreach beyond of what is feasible with alkali systems. These proposals, mainly addressingschemes of quantum simulation, either require or could greatly benefit from the availabilityof (fermionic) degenerate gases.
The first of these proposals appeared about four years ago and triggered an avalancheof further theoretical work. At that time, quantum degeneracy in Yb had already beenachieved. Optical clock experiments had gathered extensive knowledge about optical coolingtechniques and scattering properties of Ca and Sr, bringing degeneracy in these two elementsinto reach. It seemed like a good starting time for the present thesis.
The aim of this thesis is the creation and investigation of bosonic and fermionic degenerategases of Sr, and to establish the foundations necessary for the realization of unique quantumsimulation experiments with strontium. Some of the proposed experiments are describedin the following, namely those headed into the direction of quantum simulation using thenuclear spin of the fermionic isotope (Sec. 1.1) and those targeted at the creation and use ofpolar open-shell molecules (Sec. 1.2). Afterwards, we will briefly glance at the basic conceptsof bosonic and fermionic degeneracy and introduce the relevant terminology used throughoutthis thesis (Sec. 1.3). An outline of this thesis is given in Sec. 1.4.
1.1 Quantum simulation
Many-body systems are ubiquitous in Nature, and the description and understanding of theirproperties is an essential topic in many areas of physics, most prominently in solid statephysics. Let us consider a system of N spin one-half particles. The quantum descriptionof this system requires 2N complex amplitudes, a number that grows exponentially withsystem size and rises beyond all comprehensible values for about 300 particles. Computationof larger systems on a classical computer is fundamentally impossible. A solution to thisdilemma was proposed by R. Feynman in 1981: artificial, fully controlled quantum systemsare to be used to simulate the quantum system of interest, rather than to compute itsproperties and dynamics [Fey82, Llo96]. It is the degree of control and the specific propertiesof this quantum simulator (also called “special task quantum computer”) that determine thescope of problems that can be investigated. Quantum simulation might address problemsin systems that are experimentally hard to investigate, such as distant neutron stars, hard

1.1. Quantum simulation 3
to tune, such as solid state systems, or continue to resist a theoretic description, such asthe phenomenon of high-temperature superconductivity. The modeling of phenomena thathave not yet been observed in Nature, such as topological insulators or non-abelian anyons,seems intriguing as well. The simulation might be implemented on various platforms, suchas ultracold atoms or trapped ions, photons, superconducting circuits, and possibly more;see Ref. [TE12] for a recent review.
Ultracold gases of neutral atoms are a natural choice to simulate many-body systems[Blo12], such as the bosonic [Blo08] and fermionic [Ess10] Hubbard models. Here, an opticallattice can be used to mimic the periodic structure of an ion crystal in a solid material.The defect-free lattice potential is formed by the interference of laser beams, where theatoms are confined to individual lattice wells to assume the role of electrons in the solidstate analogue [Gre02, Blo05]. Many experiments are performed on such a lattice geometry,emulating solid state phenomena (e.g. [End12, Tar12]) or probing classical and quantummagnetism (e.g. [Tro08, Str11]). A number of sophisticated techniques have been developedto achieve supreme control over the quantum system, the precise tuning of the interac-tion strength [Chi10] being a prominent example. Diagnostic tools such as band mapping[Gre01], measurement of the doublon fraction [Jor08] and of noise correlations [Fol05], andfluorescence imaging of individual lattice sites [Bak09, She10] are now available, while alsocomplex lattice structures have been implemented, such as spin-dependent [Man03], non-cubic [Bec10, Jo12], and double-well lattices [Fol07]. The minimum entropy reached in mostexperiments today is just on the edge of allowing for antiferromagnetic ordering, and tech-niques of entropy removal or re-distribution are currently developed both theoretically endexperimentally (e.g. [Med11, McK11, Bon12]). As a last aspect, we mention an apparentdrawback of neutral gases: the absence of an electric charge, which would be necessary forthe generation of the Lorentz forces found in quantum Hall systems. Recent experimentshave used carefully designed laser fields to generate artificial magnetic fields, in which theneutral atom experiences a Lorentz-like force [Lin09, Dal11], thereby successfully simulatingan entirely different system.
To date, all of such experiments have been performed with alkali atoms (but for [Tai12]).Alkaline-earth systems, such as Sr, possess unique properties that allow for new types ofexperiments. Besides practical advantages, the properties are (i) the existence of long-lived metastable states, and (ii) the almost perfect decoupling of the nuclear spin from theelectronic structure in the 1S0 and
3P0 states [Boy07c]. These two properties have stimulateda number of proposals relevant for quantum simulation [Caz09, Gor10, Man11, Wu03, Wu06,FF10, Her09, Xu10, Hun11, Ger10, Coo11b, Ber11, Gor11a, Dal08, Gor09], some of whichwill be discussed in the following.
SU(N) magnetism
The decoupling of the nuclear spin from the electronic structure renders the scattering be-tween atoms independent of their nuclear spin, aside from constraints imposed by Fermistatistics. This increases the symmetry of the underlying Hubbard model from SO(N), com-mon to alkali systems, to SU(N) [Wu03], where N is the number of spin states involvedand can be chosen to be as high as 2I + 1 = 10 in strontium. This increased symmetry

4 Chapter 1. Introduction
leads to a highly degenerate energy spectrum, and the nature of the ground state of sucha spin system is a subject of active theoretical investigation [Caz09, Gor10, Man11, Wu03,Wu06, FF10, Her09, Xu10, Hun11, Ber11]. The ground state will be increasingly frustratedfor N > 2 and might take the form of exotic quantum phases such as a chiral spin liquid ora valence bond solid, depending on the value of N ; see Ref. [Gor10] and references therein.Such phases might possess topological order, a property studied in only very few quantumsystems so far.
Alkaline-earth systems are envisioned to simulate a vast number of different SU(N) spinHamiltonians, among them the Kugel-Khomskii model, which includes orbital degrees offreedom and is relevant for the description of transition-metal oxides, as well as the Kondolattice model, used to describe heavy-fermion materials [Gor10]. Magnetic ordering usuallyrequires the entropy of the lattice system to be on the superexchange scale (t2/U , wheret is the tunneling energy and U is the onsite interaction energy in the well-known FermiHubbard Hamiltonian), which is challenging to access experimentally. Theoretical studieshave elucidated the N -dependence of the sample temperature T/t after adiabatic loadinginto the lattice [Haz12, Bon12]. Quite surprisingly, the temperature in the lattice becomessignificantly smaller for increased value of N [Tai12], reaching a difference of around tenbetween the extreme cases of N = 2 and N = 10 for typical initial temperatures. Thisbehavior is encouraging for the experimental investigation of SU(N) quantum magnetism.
Artificial gauge fields
It seems tempting to expand the capabilities of cold gases to the simulation of quantummany-body systems of charged particles, such as a two-dimensional electron gas. The uniqueproperties of this system arise from the Lorentz force acting on the charged particles andare manifest in the fractional quantum Hall effect. The realms of quantum Hall physics stillhold unchartered territory, and a simple connection to ultracold gases is hindered by theobvious absence of electric charge. Alluring to the conceptual equivalence of the Lorentzand the Coriolis force, pioneering experiments have imparted angular momentum to a BECand observed the nucleation of vortices [Mat99, Mad00]. To reach quantum Hall physics,however, the number of vortices must be on the order of the number of atoms. This istechnically challenging in the experiment, as the centrifugal force has to be balanced by theconfinement [Sch04].
More recent experiments [Lin09] have taken a new approach: instead of using rotation,synthetic magnetic fields are realized by properly designed optical fields, which couple theatoms’ ground- and excited states. Atoms moving adiabatically through the spatial varia-tions of the field acquire a phase, very similar to the Berry’s phase. The phase expresses itselfin the formation of vortices. This scheme can be extended to include spin-orbit coupling[Lin11]. These approaches rely on the scattering of many photons in rather intense lightfields, leading to considerable heating rates.
The imprinted phase can be increased substantially by operating on a lattice geometry[Jak03, Ger10, Gor11a, Blo12]. This approach requires two long-lived states |g〉 and |e〉(hyperfine states or ideally the clock states of alkaline-earth atoms), which can be trappedin species-selective optical potentials. For simplicity, we will consider a 2D geometry. One

1.1. Quantum simulation 5
lattice axis is formed by light on the magic wavelength, and atoms can tunnel along thisdirection in a standard way. The orthogonal axis holds light on the anti-magic wavelength,such that atoms in the |g〉 and |e〉 states are trapped on alternating sites. A so-called couplinglaser (operated on the clock transition for the case of alkaline-earth atoms) drives transitions|g〉 ↔ |e〉 and allows atoms to interchange between adjacent sites of the anti-magic lattice.The phase accumulated by an atom moving in a loop around one plaquette is then comprisedof four contributions: two from the tunneling along the magic-wavelength lattice, which areidentically zero, and two from the interchange along the anti-magic wavelength lattice, whichadd up to a nonzero phase. The amplitude of the phase can be adjusted through the angleof the coupling beam with respect to the 2D plane. This phase is then analogous to thephase experienced by a charged particle moving in a magnetic field. The simulated flux,however, is staggered, as atoms moving around adjacent plaquettes accumulate phases ofopposite sign [Aid11]. Rectification of the flux yields a scenario identical to the one of thefamous Hofstadter’s butterfly [Hof76].
The above proposal considers lattice-confined atoms in the tight-binding limit and requirean intricate rectification of the flux. By contrast, recently proposed “optical flux lattices”imprint a periodic magnetic flux density with nonzero mean [Coo11b, Coo11a], and do sowith a rather shallow lattice. These proposals are particularly well suited for alkaline-earthatoms and generate sufficient flux to reach the fractional quantum Hall regime.
Quantum computation
Closely related to the field of quantum simulation is the field of quantum information pro-cessing. In alkali atoms, two hyperfine states of the ground state manifold are usually usedas qubit states, connected by an RF transition. The straightforward adaptation in alkaline-earth systems would be the use of the 1S0 and
3P0 clock states of bosonic isotopes. Theseparation between these two qubit states is in the optical domain, which might have tech-nical advantages [Haf08] and allows for faster operations [Sto08].
The real beauty of alkaline-earth systems, however, rests in the possibility to encode thequbit in the nuclear spin of the fermionic isotopes. Given the decoupling between nuclearand electronic structure, optical transitions can be employed for very well-controlled manip-ulation of the atom without influencing the qubit. In addition, the nuclear magnetic momentis about three orders of magnitude smaller than the electron magnetic moment, such that thequantum information is well-protected from decoherence induced by collisions or magneticfield noise.
The 1S0 − 3P0 clock transition would be used to coherently transfer atoms betweenthe 1S0 and
3P0 states. Two state-dependent lattices would be used for storage (1S0) andtransportation (3P0) of the atoms, e.g. to perform phase gates via the interaction of twoatoms on a common lattice site. Single-site addressing can be achieved by transfer of atomsinto the 3P2 state via a coherent Raman transition from the 3P0 state, or directly from the1S0 state. The
3P2 state exhibits a large Zeeman-shift, and a sufficiently strong magneticfield gradient ramped across the sample splits the energy of atoms on neighboring latticesites to enable site-selective transfer. Fluorescence read-out could then be performed on a(quasi-) cycling 3P2−3D3 transition [Dal08]. Generally, site-selectivity could also be achieved
6 Chapter 1. Introduction
by use of a quantum gas microscope with sufficient resolution.
Further proposals elaborate on the implementation of scalable quantum networks usingregisters and a suitable coupling between lattice sites [Gor09], gate operations [Hay07], andsub-wavelength lattices [Yi08]. All of these proposals on quantum information processingappeared about four years ago and evoked a wealth of further theoretical studies. The ex-perimental realization, however, is technically challenging as it involves a number of delicatelattices, precisely-tuned Raman and clock lasers, and well-controlled magnetic fields. Cer-tain issues, such as the stability of two atoms on a common lattice site or the feasibility offluorescence read-out, still await experimental verification.
1.2 Polar open-shell molecules
The usual s-wave interaction between ultracold atoms is isotropic and short-range. Muchricher systems can be created by introducing dipolar interactions, which are anisotropicand long-range, allowing for the study of a variety of novel quantum phases, among themcrystalline structures, checker-board phases, topological phases, spin liquids, and supersolids[Gor02, Bar02, Yi07, Bar08]. The orientation of the dipoles can be influenced by an externalfield. Dipolar interactions come in two flavors: magnetic and electric.
The magnetic dipole-dipole interaction (DDI) is induced by the magnetic moment of theatoms, which is 1μB for alkali atoms and can be larger for atoms with partially filled shells,e.g. 6μB for Cr, 7μB for Er, and 10μB for Dy. Here, 1μB is the Bohr magneton. Quantumdegeneracy of these species has been achieved [Gri05, Lu11a, Aik12], and impressive dipolareffects such as the anisotropic d-wave collapse have been observed [Lah08]. These systems,however, are just on the edge of the strongly dipolar regime, in which the DDI dominatesover the spherical s-wave interactions.
Electric dipole moments are found in heteronuclear molecules in their rovibrationalground state, where the difference in electronegativity between the two constituting atomsinduces an asymmetric charge distribution within the molecule. The interaction betweensuch molecules can be influenced by the trapping geometry, static electric fields, and mi-crowave fields, forming a rich system that has been proposed to be used for the generation ofnovel quantum phases [Pup, San00, Buc07, Mic07, Gor08, Coo09] and quantum informationapplications [DeM02, And06, Yel06]. There are two concepts to create such molecules: directlaser [Shu10] and evaporative [Stu12] cooling of thermal molecules, or assembly from ultra-cold atoms. The latter approach relies on magneto- or photoassociation of weakly boundmolecules from two free atoms, and a subsequent fully coherent transfer into the rovibronicground state using a technique called stimulated Raman adiabatic passage (STIRAP). Suchmolecules have been produced in KRb [Ni08], and dipolar effects have been investigated.Heteronuclear molecules have dipole moments of up to a few Debye, e.g. ∼ 0.6D in KRb.
The DDI of such dipolar molecules can be much stronger than that of magnetic atoms:The dipole potential induced from an electric dipole of 1D equals that of a hypotheticalmagnetic dipole moment of 108μB. Molecules of 1D are therefore a factor of about 10-timesmore dipolar than the most magnetic atom, dysprosium, and a factor of 100-times moredipolar than alkali atoms. The strength of the DDI scales as μ2, rendering dipolar effects in

1.2. Polar open-shell molecules 7
heteronuclear molecules 100-times stronger than in the most magnetic atoms.Heteronuclear bi-alkali molecules have a strong electric, but no magnetic dipole moment
due to the pairing of the two valence electrons1. This is different for molecules comprising onealkali and one alkaline-earth atom, which have one unpaired electron and a magnetic momentof 1μB. These molecules combine both flavors of DDI, and they can be influenced by bothelectric and magnetic fields. The additional spin degree of freedom leads to a spin-dependentDDI, a valuable ingredient that allows for quantum simulation of lattice spin models [Mic06,Bre07]. In short, molecules are placed into a 2D lattice, where nearest-neighbor coupling isprovided by the DDI, and the spin originates from the single valence electron. The rotationalground state can be coupled to an excited rotational state using microwave fields, and theinteraction between molecules in such excited states is strongly spin-dependent in strength,direction, and range. This versatile coupling between spins allows for the simulation ofa large variety of lattice spin models, some of which have topological order. In this way,research with polar molecules connects to the simulation of spin systems discussed in theprevious section. Recently, simulations of spin-lattice models using pseudo-spins in bi-alkaliground-state molecules have also been proposed [Gor11b], but the control via both electricand magnetic fields is unique to molecules with an unpaired electron, which are often referredto as open-shell molecules.
Now, which specific alkali/alkaline-earth molecule would be suited for these experiments?The electric dipole moments of all ASr molecules have been calculated, A being an alkalielement [Gue10]. The dipole moment is largest for A being heavy: 1.9D for CsSr and 1.5Dfor RbSr [Zuc10]. The ASr molecules are radicals from a chemistry point of view, and noneof them is stable against decay of the form 2ASr → A2 + Sr2. The well-established andcomparably simple technique to create BECs of Rb makes RbSr the straightforward choice.Another advantage of Rb over Cs is the availability of two bosonic isotopes, which assuresthe existence of an isotopic Rb-Sr pair for each Sr isotope with non-diverging backgroundscattering length [Zuc]. In addition, it is quite simple to switch the laser systems to K, whichhas three isotopes, one of them fermionic.
The route towards ground-state molecules might be simplified by the use of A-Sr magneticFeshbach resonances. A suitable coupling mechanism has recently been identified [Zuc10],but such resonances might be challenging to access experimentally due to their minute width.As we will see later, molecules can also be created without the use of Feshbach resonances.Current experiments with the alkali/alkaline-earth pair Rb-Yb are working towards polarmolecules [Nem09]. Similar experiments with the pair Li-Yb are motivated by the large massimbalance and have succeeded to create double-degenerate mixtures [Har11, Han11], but theelectric dipole moment of LiYb is almost zero, and the strongly dipolar regime cannot beaccessed.
In conclusion, polar open-shell molecules constitute a very versatile platform, as theycan be influenced by both electric and magnetic fields while at the same time allowing forinteraction tuning through inter-molecular Feshbach resonances. The prospects of Rb-Srmixtures are certainly not limited to the investigation of the spin models discussed above.Relating to proposals mentioned in the previous section, degenerate Rb in the superfluid bulk
1This is true for molecules in the singlet ground state. Molecules in the triplet ground state do have amagnetic moment, but their electric moment is reduced by a factor of about ten.

8 Chapter 1. Introduction
(a) (b)
�� EF
bosons fermions
Figure 1.1: Bose and Fermi statistics. A quantum state, e.g. an oscillator state of a harmonicpotential, can be occupied by any number of identical bosons (a), while for identical fermions,the occupation is limited to one (b).
phase could be used to remove entropy from a sample of Sr trapped in a species-selectivelattice [Dal04, Die08]. Further applications of RbSr molecules include precision experiments[San67, Hud06] and the study of ultracold chemistry [Kre08].
1.3 Quantum degeneracy in atomic gases
All elementary and composite particles possess an extensive property called spin. This spin,which is the intrinsic angular momentum of the particle given in units of �, can have eitheran integer or a half-integer value. Particles with integer spin are named bosons, and particleswith half-integer spin are named fermions. This property is imperceptible in our everydaylife, but it comes to life with a vengeance at temperatures approaching absolute zero, or,equivalently, at tremendously high densities.
The spin of a particle is related to its ensemble properties via the spin-statistics theorem,which rests on relativistic quantum mechanics. It demands that the wavefunctions of twoparticles be symmetric under the exchange of particles for the case of bosons, and anti-symmetric for the case of fermions. The implications for identical fermions are severe: Thewavefunction Ψ(r) describing two identical fermions with wavefunctions ψ(r1) and ψ(r2)reads Ψ(r) = (ψ(r1)ψ(r2)− ψ(r2)ψ(r1))/
√2 and vanishes for particles at the same position
r. Its non-existence is reflected in the Pauli exclusion principle: two identical fermions maynever occupy the same quantum state.
The particles’ spin also determines their scattering behavior: identical bosons can scatteronly in the odd (s-, d-, g-, ...) partial waves, identical fermions only in the even (p-, f -, h-,...) partial waves. Going to lower temperatures, the higher partial waves are gradually frozenout, and scattering occurs only in the lowest partial wave. This has again implications forgases of identical fermions. The centrifugal barrier of the interatomic potential, which needsto be overcome in a p-wave scattering event, has a height corresponding to a temperature inthe range of a few 10μK. Identical fermions below this temperature would need to tunnelthrough this p-wave barrier, and effectively do not scatter at all for T → 0.
We consider a trapped gas of identical particles at a temperature T = 0. If the particlesare bosonic, they will all occupy the lowest energy state, depicted in Fig. 1.1(a). In a

1.3. Quantum degeneracy in atomic gases 9
fermionic gas, however, the Pauli exclusion principle demands that every quantum state beoccupied by at most one particle of a kind. The resulting distribution, shown in Fig. 1.1(b),is markedly different to the bosonic case: fermionic particles fill up all energy states up tothe Fermi energy EF . The regime, in which the behavior of an ideal gas is dominated by itsspin nature rather than its temperature, is referred to as quantum degenerate. The deviationfrom thermal behavior is observed around a critical temperature
TC ∼ �2n2/3
kBm, (1.1)
where n is the density and m the mass of the particles. This temperature is very similar forbosonic and fermionic gases, but the implications of quantum degeneracy are very different.
There exists extensive literature on the theoretical description of degenerate quantumgases, to be found in review articles (e.g. [Ing99, Dal99] for bosonic and [Ing08, Gio08] forfermionic gases) and in a myriad of PhD theses that have appeared in the past 15 years (seee.g. [Sch02] for an excellent and coherent treatment of bosonic and fermionic gases). Here,we will only sketch the basic concepts and introduce a handful of quantities used throughoutthis thesis.
1.3.1 Bose-Einstein condensation
Bose-Einstein condensation (BEC) is the macroscopic occupation of a single-particle stateat finite temperatures. The underlying formalism for photons was introduced by N. Bose in1924 [Bos24], subsequently extended to massive particles by A. Einstein [Ein24, Ein25], andexperimentally realized in 1995 [And95, Dav95].
BEC in a trapped gas
Let us consider a trapped Bose gas with energy states i. The average occupancy of such astate i with energy εi is
ni =1
eβ(εi−μ) − 1, (1.2)
where β = 1/kBT is the inverse temperature and μ is the chemical potential. For a giventemperature, the maximum occupation nmax of each state i > 0 is finite and given by the
temperature T . Adding more than Nmax =∞∑i=1
nmax,i particles to the system leads to a
sudden macroscopic occupation of the i = 0 state. As the total atom number N increases,more and more particles condense into this state and into one single macroscopic wavefunc-tion, called the Bose-Einstein condensate. The growth of the ground-state population N0
is discontinuous as N is increased past Nmax, constituting a phase transition. Note thatthis situation of kBT � ε0 is dramatically different to the case of kBT � ε0, where themacroscopic occupation of the ground state is trivial.
For a non-interacting, homogeneous gas, the transition occurs at
λ3dBn = ζ(3/2) = 2.612, (1.3)

10 Chapter 1. Introduction
where λdB = h/√2πmkBT is the thermal deBroglie wavelength and n is the density. The
quantity λ3dBn is called phase-space density. At a phase-space density of order unity, the
deBroglie wavelength λdB is of the same size as the interparticle spacing n−3, indicating anoverlap of the single-particle wavefunctions. In a harmonic trap of mean trap frequency ω,the phase transition occurs at a critical temperature
TC = 0.94�ω
kB
N1/3. (1.4)
The condensate fraction N0/N is directly related to the critical temperature:
N0
N= 1−
(T
TC
)3
. (1.5)
The Gross-Pitaevskii equation
For a valid description of the BEC, we need to take into account the external trappingpotential Vext(r), as well as interactions. The Hamiltonian for an inhomogeneous, interactingBEC can be written as
H =
∫dr Ψ†(r)
(−�
2∇2
2m+ Vext(r)
)Ψ(r)+
1
2
∫drdr′ Ψ†(r)Ψ†(r′)V (r−r′)Ψ(r′)Ψ(r). (1.6)
Here, V (r − r′) is the interparticle potential, which can be replaced by a pseudo-potentialV (r) = gδ(r) assuming only isotropic, short-range interactions. The coupling constantg = 4π�
2a/m is set solely by the s-wave scattering length a and the atomic mass m.The emerging Schrodinger equation with the nonlinear mean-field term is called the Gross-Pitaevskii equation (GPE) of the order parameter ψ(r, t)
i�∂
∂tψ(r, t) =
(−�
2∇2
2m+ Vext(r) + g |ψ(r, t)|2
)ψ(r, t). (1.7)
For a stationary gas in thermal equilibrium, the time dependence can be removed by aseparation ψ(r, t) = e−iμt/� ψ(r) to yield the time-independent GPE(
−�2∇2
2m+ Vext(r) + g |ψ(r)|2
)ψ(r) = μ ψ(r). (1.8)
The Thomas-Fermi approximation
The terms on the left side of Eqn. 1.8 reflect the kinetic energy, the external potential, andthe interaction energy, also called mean-field energy. In most BEC experiments, the kineticenergy is dominated by the mean-field energy and can be neglected. This is called theThomas-Fermi approximation, which is valid for the case Na/aho � 1, where aho =
√�/mω
is the harmonic oscillator length of the trapping potential. The trapping potential is oftenapproximated as
Vext(r) =∑
i=x,y,z
1
2mr2
i ω2i (1.9)

1.3. Quantum degeneracy in atomic gases 11
in all three spatial directions, and ω = (ωxωyωz)1/3 is the geometric mean of the three trap
frequencies. Identifying |ψ(r)|2 with the condensate density n(r), Eqn. 1.8 reduces to
n(r) = max
(μ − Vext(r)
g, 0
). (1.10)
The density distribution n(r) thus takes the form of the inverted trapping potential (aninverted parabola), which extends to the Thomas-Fermi radius
RTF,i =
√2μ
mω2i
(1.11)
along the trap axis i. The size of the BEC is thus much larger than the harmonic oscillatorground state size aho. The central density can easily be read off as n0 = μ/g. The chemicalpotential, an important experimental parameter, is given by
μ =�ω
2
(15Na
aho
)2/5
. (1.12)
It is important to recognize that the appearance of BEC is of purely statistical origin, butits behavior is determined by interactions. This is certainly true for the case of superfluidHe, where quantum depletion limits the condensate fraction to a few percent. In atomicgases, the density needs to be ridiculously small to avoid inelastic collisions and decay intothe metallic state2, and quantum depletion is usually negligible. Still, interactions governall relevant properties.
The in-situ density profile is hardly accessible, and most information about the con-densate is drawn from absorption imaging after a time of free expansion, during whichthe momentum distribution of the BEC maps onto a real-space distribution. Upon releasefrom the trapping potential, the mean-field energy gets converted into kinetic energy. In ananisotropic trap, the expansion is also anisotropic and depends on the initial confinement:The condensate expands fastest into the direction of strongest confinement, where the initialsize is given by Eqn. 1.11. The resulting inversion of the aspect ratio during time-of-flight(TOF) is a prominent hallmark of BEC.
1.3.2 Degenerate Fermi gases
Analogous to Eqn. 1.2 for bosons, we can write down the mean occupation number of anenergy state i for fermions as
ni =1
eβ(εi−μ) + 1, (1.13)
known as Fermi-Dirac statistics. Clearly, the maximum occupation of any state is 1. For ahomogeneous Fermi gas at T = 0, all energy states up to the Fermi energy
EF = �ω (6N)1/3 (1.14)
2Typical densities are around 1014 cm−3. For comparison, the density of strontium in the bulk metal isabout 2 × 1022 cm−3, and the concentration in sea water is about 1017 cm−3.

12 Chapter 1. Introduction
are occupied; see again Fig. 1.1(b). Straightforward derivations of the Fermi energy are theFermi temperature TF = EF /kB and the Fermi momentum kF as �
2k2F /2m = EF . The set of
states with energy EF and momentum kF is called the Fermi surface, and the set of denselyoccupied states below is called the Fermi sea.
Temperature
There is another temperature in the system besides the Fermi temperature TF : the “real”temperature T . The Fermi-Dirac distribution in Eqn. 1.13 is a step function for T = 0, butthe discontinuity is smeared out for finite T : there are empty states below the Fermi surface,and occupied states above the Fermi surface. For T > TF , the distribution approachesthe classical Maxwell-Boltzmann distribution: the exponential term in the denominator ofEqn. 1.13 (and correspondingly Eqn. 1.2 for bosons) grows much larger than 1, and thedistribution approaches the classical case of ni = exp(−β(εi − μ)). The width of the stepin the Fermi-Dirac distribution is approximately EF × T/TF . Obviously, the degeneracyparameter T/TF cannot be zero, and experiments typically reach T/TF = 0.05...0.2.
There is no phase transition as we cool a gas into Fermi degeneracy, and the crossover issmooth. In the following, we will discuss three signatures of a degenerate Fermi gas (DFG),which shows clear deviations from the behavior of a thermal gas.
Pauli blocking
At degeneracies below T/TF ∼ 0.5, the occupation of states below EF becomes dense. Thishas implications on the scattering rate of the atoms: From the Pauli exclusion principle,atoms can scatter only into final energy and momentum states that are not occupied. Thechances of finding such scarce states is small for T → 0, and the scattering rate is reduced.This suppression of scattering is called Pauli blocking and can be observed as a decreasein the thermalization rate. Evaporative cooling, which relies on thermalization, becomesincreasingly inefficient in the degenerate regime3.
A similar effect also appears for the scattering of photons. Atoms in excited states cannotdecay into occupied ground states of the Fermi sea, and the decay of such atoms might beinhibited entirely if all energetically allowed final states are Pauli-blocked.
Spatial distribution
The Fermi pressure pushes atoms out of the center of the trap: the cloud is larger comparedto a classical thermal distribution. The spatial extension of a Fermi gas into the direction i
3First off, evaporative cooling of fermions (relying on contact interactions) requires a mixture of at leasttwo distinguishable atoms, as scattering of identical particles is suppressed by the p-wave barrier. Manyexperiments employ a two-component Fermi mixture, and suffer from Pauli blocking in both scatteringpartners. Using a mixture of one bosonic and the fermionic species might improve the situation. In ourexperiments with a 84Sr-87Sr mixture, we observe the formation of a large 84Sr condensate fraction beforereaching Fermi degeneracy. The BEC is superfluid to fermions with velocities below the speed of soundc =
√gn/m, and the thermalization rate is drastically reduced. In addition, the Fermi pressure increases
the size of the fermionic cloud and reduces the spatial overlap with the BEC. We find that a mixture ofmany (up to N = 10) spin states performs much better than a Bose-Fermi mixture.

1.4. Thesis overview 13
is
RTF,i =
√2EF
mω2i
. (1.15)
The spatial distribution depends on the degeneracy parameter T/TF and can thus be usedto measure T/TF . The deviation from a Gaussian, however, is small and difficult to observe.
Momentum distribution
The spatial distribution of an ideal Fermi gas in a harmonic trap is preserved upon releasefrom the trap. The cloud undergoes a re-scaling in the three directions i, which depends onthe initial trap frequencies ωi and the flight time. For sufficiently long times tTOF (ω
2i t
2TOF �
1), the cloud becomes round, very much in contrast to the bosonic case. It is this rescaleddistribution that we use to determine all relevant parameters of a Fermi gas.
The functional form of the distribution of a Fermi gas at finite temperature is derivedin Ref. [DeM01a], and a reduced expression is given in Eqn. 5.1. We use these functions toperform two-dimensional Fermi fits to our absorption images.
Interactions
In Nature, Fermi systems can be found within the nuclei, in neutron stars, in white dwarfs,and the electron gas in metals. All of these regimes are strongly interacting, meaning thatthat the interaction energy scale exceeds all other relevant energy scales. For a homogeneousFermi gas with s-wave scattering, this is fullfilled for |kF a| � 1. Such strongly interacting(yet very dilute) systems can also be realized with ultracold atomic samples close to aFeshbach resonance [Tre11]4. A Feshbach resonance can also be used to interconnect betweenstrongly repulsive and strongly attractive gases, i.e. to study the famous BEC-BCS crossover(see e.g. [Gri08]). In Sr, the scattering length between distinguishable atoms of the fermionicisotope 87Sr is small and cannot be tuned. Generally, the strongly interacting regime canalso be reached by loading the atoms into a lattice, thereby making the interaction energylarger than the kinetic energy. This is relevant for the realization of lattice spin models,where the intersite interaction originates from super-exchange.
1.4 Thesis overview
This thesis does not aim to give a complete account of all details relevant to the experimentalwork with ultracold samples of strontium. This would hardly be possible, and more impor-tantly, there exist already a number of excellent contributions. A first and very readablereview article was published by the Florence group [Sor06], and contains all the information
4A molecular level can be tuned into resonance with the energy of two free atoms by changing the magneticfield, provided that the free atoms and the molecule have different magnetic moments. On resonance, thescattering length diverges, and it can assume any positive or negative value outside of the resonance. Seee.g. Ref. [Chi10] for a review.

14 Chapter 1. Introduction
necessary for laser-cooling bosonic Sr isotopes. Cooling of the fermionic isotope was pio-neered and beautifully described by the Tokyo group [Muk03]. Most of all, two theses fromthe JILA group [Boy07a, Lud08a] are highly recommended. These two masterpieces containalmost everything one needs to know about strontium, and we keep hardcopies of both ofthem in the lab and in every office.
This thesis does aim to give a complete picture of the current state-of-the-art of quantumdegenerate samples of strontium. It aims to provide the reader with the knowledge requiredto generate degenerate samples of an alkaline-earth element, having in mind the delicateproposals outlined above. In addition, it might serve as a reference for my successors in thelab.
The remainder of this thesis is structured as follows: The first part of Chpt. 2 is devotedto the nuclear, electronic, and scattering properties, and discusses relevant implications fora quantum gas experiment. The second part contains a detailed description of the opticalcooling process. Because of its importance and non-triviality, we review the dynamics ofnarrow-line cooling and discuss the phenomenon of momentum state crystals.
Chapter 3 describes the construction of the experimental apparatus. The vacuum cham-ber and the coil system to generate magnetic fields are described in brief. Emphasis is puton a description of the various near-resonant laser systems, as well as the dipole trap andthe lattice. Technical details on the construction of stable cavities, spectroscopy cells, andthe oven are deferred to the appendices.
Chapter 4 is the first one to present scientific results: the first BEC of Sr, created inSeptember 2009. Experiments are performed with the 84Sr isotope, which exhibits veryfavorable scattering properties.
Chapter 5 takes us onward to the fermionic 87Sr isotope, which is the one of interest forthe studies outlined above. We demonstrate a certain degree of control over the spin statecomposition, allowing us to prepare a spin-polarized degenerate Fermi gas. The fermions aresympathetically cooled with 84Sr to form a double-degenerate Bose-Fermi mixture.
Chapter 6 shows a route to Bose-condense the isotope 86Sr, which has a very largescattering length and requires an adaption of the evaporative cooling scheme.
Pursuing the ideas laid out in Sec. 1.1 requires precise control over the spin states. Wedevote the entire Chpt. 7 to both creation and detection of arbitrary spin compositions, andwe take a first step to show that these states indeed have SU(N) character.
Over the years, our experimental capabilities have evolved dramatically, and we were ableto improve key parameters of quantum gas experiments by orders of magnitude. Chapter 8is a collection of many individual experiments reflecting the current status of our apparatus.Specifically, we present an 84Sr BEC of 107 atoms, which is the largest BEC created in anoptical trap to date, and a BEC of 105 atoms created in 2 seconds, which is the fastest cycletime ever reported. Further, we present Fermi degeneracy down to T/TF = 0.08 in 87Sr,along with a set of double-degenerate mixtures.
Some of the proposals described above utilize optical transitions originating from themetastable 3P0,1,2 states. We present the novel spectroscopy scheme, allowing us to thor-oughly investigate the 3P2 −5s5d 3D1,2,3 transitions. This scheme, together with data on the5s5d 3D hyperfine structure at MHz-precision, is presented in Chpt. 9.
Chapter 10 contains the implementation of yet another important ingredient to our ap-

1.4. Thesis overview 15
paratus: a 3D optical lattice. We show the superfluid to Mott-insulator transition and otherexperiments performed in the lattice.
The Mott-insulator state with atoms on doubly occupied sites constitutes the start-ing point for the creation of fully state-controlled 84Sr2 ground-state molecules. These aredirectly associated via STIRAP, thereby circumventing the need for magnetic Feshbach res-onances. The experiment is presented in Chpt. 11, along with the relevant photoassociationspectroscopy data.
Chapter 12 does not strictly follow the lines of quantum simulation experiments, butre-visits a long-standing and hitherto elusive goal: the attainment of quantum degeneracy inatomic gases purely by laser cooling and thermalization, not relying on evaporation. We showhow a properly prepared sample of 84Sr atoms can undergo the BEC phase transition withina region of carefully designed optical potentials. This experiment immediately encouragesnovel approaches to create continuous sources of quantum matter.
In Chpt. 13, we conclude with an outlook on experiments planned for the near future,and projects envisioned for the more remote future. We close the loop by revisiting theproposals described in the beginning of the present chapter, and we discuss their feasibilityin light of the experimental progress already made.

16 Chapter 1. Introduction

Chapter 2
Strontium: an alkaline-earth element
2.1 The discovery of strontium
We find ourselves in London, it is the year 1790. A. Crawford and his assistant W. Cruick-shank are employed as physicians in St. Thomas’ Hospital, just south of London bridge.Many diseases, such as cancer, are treated with mercurial salts at this time. Crawford andhis co-workers are well aware of the serious side effects, and are attempting to substitutethe mercury compounds with muriated barytes (barium chlorides, BaCl2, where the min-eral baryte is BaSO4), while ceaselessly searching for ever better treatments. In a leadmine in Strontian, Argyllshire, Scotland, they discover a new earth, easily mistaken for thealready-known witherite (barium carbonate, BaCO3). They succeed to turn this new earth(strontium carbonate, SrCO3) into a chloride (SrCl2), which allows for extensive comparisonswith the muriated baryte. They find striking differences in many properties, such as the spe-cific weight, solubility in water, and crystalline structure. Crawford and co-workers concludethat this substance must contain an ingredient different from the one in the muriated baryte[Cra90].
At the same time, F.G. Sulzer describes the same mineral and names it strontianite inview of the location where it was found [Sul]:
I have named this interesting fossil of my small collection, which
seems to contain its own underlying earth, strontianite, and will
sacrifice all that I have left of it for further studies. It is an
[...] earth, some pieces of which have a clearly visible similar-
ity with the witherite; but differ by its smaller specific weight,
which amounts to 43 for the witherite, but less than 36 for the
strontianite. Furthermore, ...
Sulzer and his co-workers examine the new mineral closely and find many differences tothe witherite. In the following years, many chemists perform further studies with this newearth, most noticeably T.C. Hope in Edinburgh [Hop98], R. Kirwan in Dublin [Kir95], andM.H. Klaproth in Berlin [Kla93, Kla94]. All available knowledge of that time is gatheredby Klaproth in his Chemisches Worterbuch (Dictionary of chemistry, [Kla07]), in which hedevotes a separate chapter to the strontian earth:
17

18 Chapter 2. Strontium: an alkaline-earth element
Figure 2.1: Chemists renowned for the discovery of strontium: William Cruickshank (sourceunknown), Thomas Charles Hope (courtesy of the Scottish National Portrait Gallery), Mar-tin Heinrich Klaproth (Smithsonian Libraries), and Humphry Davy (ibid., from left to right).
Nature has not yet offered [strontian] earth in a pure state; the
chemist therefore feels obliged to precipitate this earth from
its natural compounds with carbonic acid und sulfuric acid. [...]
The pure strontian earth1
is a porous material of greyish-white
color, caustic and alkaline taste. [...] It acts less severe onto
the animal body than baryte earth, and it is not poisonous. It
does not melt in front of the blow pipe, but it is permeated by
light and surrounded by a white, glaring flame, hardly bearable
to the eye.
Baryte earth2
and strontian earth approach each other in mul-
tiple properties. The main features, by which to tell the lat-
ter from the earlier, are the following: it is less caustic; has
a lesser specific weight, phosphorizes in front of the blow pipe,
stains the flame purple red; is infusible, requires a significantly
larger amount of water to dissolve; it forms crystals of a dif-
ferent principal type, shows a more distant relationship towards
acids, and does not exert poisonous properties on the animal body.
One has initially deemed the strontianit (which contains a com-
pound of this earth with carbonic acid, and was the first fossil in
which this earth was found in exquisite quantities), to be barite
carbonate. [...]3
In his work, Klaproth describes a wealth of experiments carried out with different chem-ical compounds containing strontium, and how they compare to the corresponding com-pounds containing barium. It was not until 1808 that Sr became available as a pure metal.
1This is SrCl2, not yet the pure metal.2BaCl23All translations by the author of this thesis.

2.2. Nuclear properties 19
isotope natural abundance statistics nuclear spin84Sr 0.56% bosonic 086Sr 9.86% bosonic 087Sr 7.00% fermionic 9/288Sr 82.58% bosonic 0
Table 2.1: Naturally ocurring isotopes of strontium, data taken from [NIS].
Sir H. Davy used electrolysis with mercury oxide to remove the Cl2. He obtained strontiumamalgam, from which the metal can be extracted by distillation, and he named it strontium[Dav08]. Appreciating the chemical similarity of Ca, Sr, and Ba and quantifying many oftheir properties contributed to the development of the periodic table some 70 years later.
2.2 Nuclear properties
There are four naturally occurring isotopes of Sr, three of them are bosonic and one isfermionic; see Tab. 2.1. The nuclear spin of all bosonic alkaline-earth elements is zero(I = 0), with a simple explanation: Given the two valence electrons and all inner shellsfilled with even numbers of electrons, the total electron number is even. The neutral overallcharge requires the proton number to be even as well. The bosonic character of the atomthen requires the total number of electrons, protons, and neutrons to be even, thus theneutron number needs to be even, too. In such even-even nuclei, the nucleons arrange inpairs of antiparallel spin, and the nuclear spin is zero. The nuclear spin of 87Sr is I = 9/2,the highest of all stable alkaline-earth isotopes.
There are more than 20 unstable isotopes of Sr. The isotope most prominent to thegeneral public is 90Sr, which has a lifetime of 29 years and is produced in nuclear bombsand nuclear power plants. Both 89Sr and 90Sr are used in medical applications. The isotopicratio 86Sr/87Sr can vary for different types of rock, and is also used for isotopic tracking.87Rb decays into 87Sr, and the ratio of these two isotopes can be used to determine the ageof rock on geologic timescales.
2.3 Electronic properties
Strontium is an alkaline-earth element and can be found in the second column of the periodictable. There is a class of elements with an electronic structure very similar to that ofstrontium. These elements are the other alkaline-earth species Be, Mg, Ca, Ba, and Ra, themembers of the zinc-family Zn, Cd, Hg, and Cn, as well as Yb and No. These atoms are oftenreferred to as “alkaline-earth like systems”, “group-II-atoms”, or “two-electron systems”.Neither of these terms seems convincing, and for simplicity, we will call all elements of thisclass “alkaline-earth atoms” throughout this thesis. In the following, we will show that theseatoms are indeed very different from the alkalis.

20 Chapter 2. Strontium: an alkaline-earth element
1S0 − 1P11S0 − 3P1
3P1 − 3S13P2 − 5s5d 3D2
3P2 − 5s5d 3D3
84Sr −270.8 −351.49 ≈ 200 −91.8 −91.686Sr −124.8 −163.81 ≈ 100 −47.5 −46.687Sr −46.5 −62.15 5488Sr 0 0 0 0 0
Table 2.2: Isotope shifts of the Sr isotopes, given in MHz. All values are referenced to themost abundant isotope 88Sr. The hyperfine structure of the fermionic isotope 87Sr is muchlarger than the isotope shift, which is stated here for an assumed J = 0 state. The relevanthyperfine structure can be found in Fig. 2.3.
2.3.1 Optical transitions
The ground-state electronic configuration of Sr reads [Kr]5s2, featuring two valence electronsin the outer s-shell. The level structure of the excited states resembles that of the well-knownhelium atom4. The spins of the two valence electrons can be aligned anti-parallel (singletstates, S = 0) or parallel (triplet states, S = 1). We find broad transitions within the singletand triplet systems, where almost all the transitions into low-lying states are in the visiblerange of the electromagnetic spectrum and nicely accessible with current laser technology.
The singlet and triplet states are connected by narrow intercombination lines. Thelinewidth of these transitions lies between the pHz and the MHz range, as we will dis-cuss later. These transitions can be used for laser cooling, state preparation, and for theconstruction of frequency references in the optical domain. In addition, transitions originat-ing from the metastable 3P states into higher-lying singlet states can be used for quenchingof the lifetime [Kra09, San11].
All alkaline-earth elements possess two different cooling transitions, originating from the1S0 ground state and addressing the
1P1 and3P1 states. The lifetime of the
1P1 state in Srhas been measured to be 5.22(3) ns [Nag05] and 5.263(4) ns [Yas06], which translates to alinewidth Γ ≈ 2π × 30.5MHz of the 1S0 − 1P1 transition
5. The properties of the metastable3P1 state will be discussed later.
Isotope shifts — Most of the early Sr experiments were centered around the isotopes87Sr and 88Sr, where the hyperfine structure of 87Sr hides the isotope shift. Working now withall four isotopes of Sr requires consideration of the shifts of all relevant states. The shifts areon the order of 100MHz, a frequency difference that can easily be bridged by acousto-opticalmodulators (AOMs). Table 2.2 states the isotope shifts of relevant transitions.
AC Stark shifts — Any radiation field couples to all atomic states and alters theirenergies. We employ these AC Stark shifts to locally and temporally change the energy of a
4The most prominent modification in Sr is the appearance of a 5s5p 3P manifold (the corresponding1s1p 3P manifold does not exist in He), which lies below the 5s6s 3S1 state. The corresponding 1s2s 3S1
state is the lowest triplet state in He and used as the ground state in experiments with He∗.5Many values of the linewidth of this transition can be found in the literature. Although the value
obtained by the Tokyo group is more precise (Γ = 2π × 30.24(2) MHz), we will stay with the earlier value of30.49(17) MHz by the Rice group, which is also used by the JILA group. In our lab, we found 30.96(33) MHzfrom varying the detuning in absorbtion imaging.

2.3. Electronic properties 21
5s2 1S01S
5d 1D2
5p 1P1
4d 3DJ
6p 3PJ
6s 3S1
5d 3DJ
5p 3PJ
1P 1D 3S 3P 3D
012
123
123
12
3
singlet states triplet states
30.5 MHz 7.4 kHz
2.3 MHz
461 nm 689 nm
497 nm
7p 3PJ
3
12
6d 3DJ
123
4f 3FJ
234
7s 3S1
3F
4d5p3FJ
234
ener
gy (1
03 cm
-1)
0
10
20
30
40
4d 1D2
6p 1P1
6s 1S0 494 nm403 nm
707 nm679 nm 688 nm
3.0 μm~1 : 50 000
1 : 2
~1 mHz in 87Sr698 nm
J
Figure 2.2: Selection of the level scheme of strontium. The position of the manifolds aredrawn to scale, but the finestructure splittings are not. The MOT and repump transitions(solid arrows), decay paths from the 1P1 state (dashed arrows) and branching ratios, aproposed quenching transition (dotted arrow), and the clock transition (thin arrow) aredepicted. The 3P2 reservoir state is indicated by a short arrow. The ionization thresholdis at 45932.09 cm−1 (5.69485 eV). The position of the levels is taken from [NIS], additionalinformation on lifetimes and branching ratios is available from [Pol05a].

22 Chapter 2. Strontium: an alkaline-earth element
specific state (see e.g. Chpt. 12), but differential AC Stark shifts are usually a nuisance andneed to be avoided. The wavelength of a light field, for which the AC Stark shift of two statesis equal, is called the magic wavelength. The wavelength, at which the AC Stark shift of twostates is equal but of opposite sign, is called anti-magic. The two transitions, for which thelight shifts play an important role, are the 1S0 − 3P0 clock transition and, to a much lesserdegree, the 1S0 − 3P1 cooling transition. The magic wavelengths for these transitions arearound 813 nm and 915 nm, respectively6. Further distinguished wavelengths are 627 nm, forwhich the 3P0 polarizability is zero, and 689.2 nm, for which the
1S0 polarizability vanishes.The reduction of light shifts induced by the dipole trap will be discussed on a few occasionsthroughout this thesis, but we refer the reader to Ref. [Boy07a] for a detailed treatment.
2.3.2 Metastable states
The decay of the metastable 3P0,1,2 states into the 1S0 ground state requires an electronspin-flip, which cannot be accomplished by emission of a single photon: these states shouldbe stable! They may, however, acquire a finite lifetime through higher-order processes.
The 3P0 state is the clock state in strontium. For the bosons with I = 0, spin-orbitinteractions are absent, and the dominant decay path is the E1M1 two-photon decay. Therate of this decay is tiny, and the lifetime is calculated to be thousands of years. For thefermionic isotope, the nonzero magnetic dipole moment couples the 3P0 state to other statesof the same parity, among them the 1P1 and
3P1 states; this mechanism is called hyperfinecoupling. These states can decay into the 1S0 state by a simple electric dipole (E1) process.The lifetime of the 3P0 state in this case is on the order of 100 s [Boy07c, San04].
The lifetime of the 3P1 state is reduced by spin-orbit interaction, which mixes some1P1-
state contribution into the 3P1 state. This admixture allows for weak electric dipole (E1)decay, leading to a lifetime of 21.4μs and a corresponding linewidth of Γ = 2π × 7.4 kHz[Boy07a].
The 3P2 state and its lifetime are relevant for our work as we use this state for shelv-ing of atoms during the first cooling stage. This state can decay via different pathways.Two of these are parity-conserving one-photon decays of magnetic-dipole (M1) and electric-quadrupole (E2) type into the 3P1 state and further into the ground state. For Sr, thedominant process is a magnetic octupole (M2) transition directly into the ground state, witha calculated lifetime of about 1000 s [Der01, San04]. The Tokyo group measured a lifetime ofabout 500 s, which was explained by radiative decay. Black-body radiation can excite atomsinto the 5s4d 3D states, from where they decay into the 3P1 state. Indeed, the lifetime wasfound to depend on the temperature of the environment [Yas04].
The finite lifetimes of the metastable states are beautifully explained and calculated forMg, Ca, and Sr in [San04].
6The magic wavelength of the clock transition has been determined with MHz-precision. Another radia-tion field inducing a differential shift of the two clock states is the black-body radiation of the environment.Tremendous efforts are made to quantify and reduce the magnitude of this shift, e.g. by measuring theDC polarizability of the clock states ([She12] for Yb and [Mid12] for Sr), by interrogating the atoms in awell-defined or cryogenically cooled environment, or by choosing a comparably insensitive atomic species,such as Hg.

2.3. Electronic properties 23
2.3.3 Nuclear and electron spin
Nuclear spin — The bosonic isotopes of Sr have zero nuclear spin, which hasmanifold implications. Obviously, there is only one spin state in the 1S0 and
3P0 states,mJ = 0. Certain laser-cooling techniques, such as sub-Doppler cooling and VSCPT, requiremore than one mF state and are not possible in bosonic strontium. The nuclear magneticmoment is zero, precluding the appearance of hyperfine structure. The lack of hyperfinestructure simplifies laser cooling compared to the alkalis, as no repumping from a “wrong”lower hyperfine state is required. On the other hand, certain techniques such as the dark spotmagneto-optical trap (MOT) require a hyperfine structure and are not possible in alkaline-earth systems. The fermionic isotope 87Sr carries a nuclear spin of I = 9/2, giving rise toten magnetic substates in the 1S0 and
3P0 states.
Electronic spin — The electron spin and the associated electronic magnetic dipolemoment of the singlet 1S0 state are zero (J = 0) due to the antiparallel alignment of thetwo valence-electron spins. This fact brings about at least three immediate consequences:the absence of hyperfine structure even for the case of I �= 0, the absence of magneticFeshbach resonances [Chi10]7 and a tremendously reduced sensitivity to B-fields. The onlymagnetic moment of the atom arises from the nuclear spin, which is smaller by a factor ofabout 1000, or, more precisely, about the proton-to-electron mass ratio8. The performance ofconventional magnetic Stern-Gerlach separation, which relies on a force Fz = μatom ∂B/∂z,is substantially reduced and would require ridiculously large magnetic field gradients. Theabsence of an electron spin makes this state comparably insensitive to B-fields, which isadvantageous for many applications in precision measurements.
The absence of an electron magnetic moment also leads to a much reduced Zeeman-splitting of the mF states in the fermionic 1S0 state: the gF factor is again smaller by afactor ∼ 103. For the narrow-line MOT, the gF factors of the ground state and excited 3P1
state are therefore very different, leading to an exotic operation of the MOT, which will bedescribed in Sec. 2.7.
All of these characteristics also apply to the 3P0 state, which has zero electron spin as well(J = 0). This is a remarkable property: On the 1S0 − 3P0 clock transition, the nuclear andelectron spin are almost completely decoupled. This allows us to store a piece of quantuminformation in the nuclear spin (mF = −9/2 ... + 9/2) of an atom, and to optically transferthe atom between the 1S0 and
3P0 states without disturbance of the qubit. The1S0 and
3P0
states can be addressed individually by light fields, facilitating transport, state preparation,and state read-out [Dal08].
Hyperfine structure — For the fermionic isotope, we finally do obtain hyperfine struc-ture for the states with J �= 0. The splittings between adjacent F -states are between a few10MHz and 1GHz, easily accessible by acousto-optical modulators. The ordering of theF -states can be perturbed or even inverted, depending on the hyperfine parameters A and
7Feshbach resonances might exist in the fermionic 87Sr isotope, but would be incredibly weak [Jul].8Recall that the Bohr magneton is μB = e�/2mp, and the nuclear magneton is μB = e�/2me. The gF
factors of the 1S0 and 3P0 clock states, as well as their difference, are on the order of 100 Hz/G [Boy07c].

24 Chapter 2. Strontium: an alkaline-earth element
5s2 1S0
1S
5s5p 1P1
1P 3S 3P 3D
9/2
9/211/2
7/2
11/2
9/2
7/2
7/2
9/2
11/2
11/2
9/2
7/2
13/2
11/2
9/2
7/2
5/2
11/29/27/25/2
13/2
-23- 6
+ 37
F
5s6s 3S1
5s5p 3P1
5s5p 3P2
5s5d 3D1
5s5d 3D2
1 GHz
�HFS
+ 2981
+ 542
- 2439
+ 2371.28
+ 1597.14
+ 618.65
- 551.55
- 1898.05
+ 283.86
-1179.29
- 1250
- 227
+ 1023
- 644- 179+ 214+ 536+ 787
+ 1414.12
5s5p 3P0
9/2
3/2 ... 15/2
5s5d 3D3
Figure 2.3: Hyperfine structure for relevant states of 87Sr. The splittings are given in MHzand calculated with respect to an assumed I = 0 state, indicated by a dashed line. The cal-culation is based on the A and Q interaction constants taken from [Boy07a] and determinedin the measurements presented in Chpt. 9.
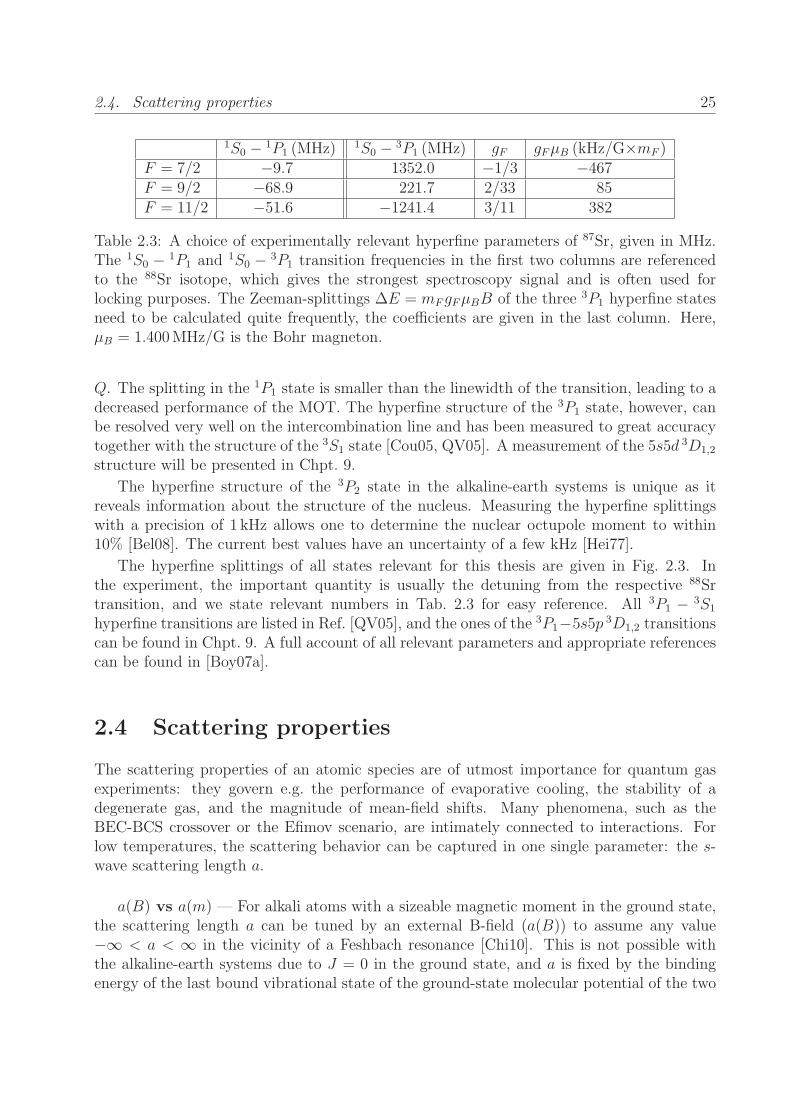
2.4. Scattering properties 25
1S0 − 1P1 (MHz)1S0 − 3P1 (MHz) gF gF μB (kHz/G×mF )
F = 7/2 −9.7 1352.0 −1/3 −467F = 9/2 −68.9 221.7 2/33 85F = 11/2 −51.6 −1241.4 3/11 382
Table 2.3: A choice of experimentally relevant hyperfine parameters of 87Sr, given in MHz.The 1S0 − 1P1 and
1S0 − 3P1 transition frequencies in the first two columns are referencedto the 88Sr isotope, which gives the strongest spectroscopy signal and is often used forlocking purposes. The Zeeman-splittings ΔE = mF gF μBB of the three 3P1 hyperfine statesneed to be calculated quite frequently, the coefficients are given in the last column. Here,μB = 1.400MHz/G is the Bohr magneton.
Q. The splitting in the 1P1 state is smaller than the linewidth of the transition, leading to adecreased performance of the MOT. The hyperfine structure of the 3P1 state, however, canbe resolved very well on the intercombination line and has been measured to great accuracytogether with the structure of the 3S1 state [Cou05, QV05]. A measurement of the 5s5d 3D1,2
structure will be presented in Chpt. 9.
The hyperfine structure of the 3P2 state in the alkaline-earth systems is unique as itreveals information about the structure of the nucleus. Measuring the hyperfine splittingswith a precision of 1 kHz allows one to determine the nuclear octupole moment to within10% [Bel08]. The current best values have an uncertainty of a few kHz [Hei77].
The hyperfine splittings of all states relevant for this thesis are given in Fig. 2.3. Inthe experiment, the important quantity is usually the detuning from the respective 88Srtransition, and we state relevant numbers in Tab. 2.3 for easy reference. All 3P1 − 3S1
hyperfine transitions are listed in Ref. [QV05], and the ones of the 3P1−5s5p 3D1,2 transitionscan be found in Chpt. 9. A full account of all relevant parameters and appropriate referencescan be found in [Boy07a].
2.4 Scattering properties
The scattering properties of an atomic species are of utmost importance for quantum gasexperiments: they govern e.g. the performance of evaporative cooling, the stability of adegenerate gas, and the magnitude of mean-field shifts. Many phenomena, such as theBEC-BCS crossover or the Efimov scenario, are intimately connected to interactions. Forlow temperatures, the scattering behavior can be captured in one single parameter: the s-wave scattering length a.
a(B) vs a(m) — For alkali atoms with a sizeable magnetic moment in the ground state,the scattering length a can be tuned by an external B-field (a(B)) to assume any value−∞ < a < ∞ in the vicinity of a Feshbach resonance [Chi10]. This is not possible withthe alkaline-earth systems due to J = 0 in the ground state, and a is fixed by the bindingenergy of the last bound vibrational state of the ground-state molecular potential of the two

26 Chapter 2. Strontium: an alkaline-earth element
84Sr 86Sr 87Sr 88Sr84Sr 124 32 −56 180086Sr 32 830 164 9887Sr −56 164 97 5588Sr 1800 98 55 −1
Table 2.4: Scattering lengths between the strontium isotopes, given in units of a0. Thevalues are averages of the values given in [Mar08] and [Ste08], and the uncertainty is a fewa0 except for the two very large values, where the uncertainty is larger.
scattering atoms (or the first state above threshold)9.
The shape and depth of the ground-state potential and thus the binding energy of thevibrational states depends on the mass of the two atoms involved. This implies that theposition of the last bound vibrational state with respect to the free-atom threshold dependson the isotope! Two very pleasant features congregate in the alkaline-earth systems: (i) Foratoms heavier than Ca [Dam11], the last vibrational level moves away from threshold (down-wards) by less than half a vibrational level spacing per mass increase by one atomic mass unit(1u ≈ mneutron). The scattering length of a “string” of isotopes therefore follows a somewhatsimple and highly predictable pattern, as we will see later. (ii) The heavy alkaline-earthelements possess many isotopes, which can be understood from a nuclear physics’ point ofview: the even number of protons leads to a stable nucleus, even for a variety of neutronnumbers. Both Rb and Cs possess only one stable isotope10, while Sr and Ba, with only oneadditional proton, feature four and seven stable isotopes, respectively. These two featuresallow for an (admittedly very coarse) mass-tuning of the scattering length, which becomesfiner for elements with higher masses, as illustrated for Sr and Yb in Figs. 2.4 and 2.5. Forall elements heavier than Ca, it is certain that there exists at least one bosonic isotope withpositive scattering length.
Strontium isotopes — Early work on Sr focused on the most abundant 88Sr isotope.It was realized quite soon that the scattering length a88 would be small, which is great forprecision measurements, but fatal for evaporative cooling [Ido00, Pol05b, Yas06]. An attemptto sympathetically cool 88Sr with 86Sr was hindered by the large value of a86 [Fer06a]; seeTab. 2.4.
The scattering length of 84Sr was calculated for us in the summer of 2008 by R. Ciury�lo,using photoassociation (PA) data from the Rice group [Mic05]. He obtained a value ofa84 = 124 a0 with a small error, where a0 is the Bohr radius [Ciu]. This calculation greatlyinfluenced our approach to reach BEC in strontium11. Two separate publications appeared
9It should be noted that magnetic Feshbach resonances do exist between atoms in the 1S0 and 3P2 states.10The isotope 87Rb occurs naturally, but is strictly speaking not stable with a half-life of 50 billion years.11A spectroscopic determination of a86 and a88 existed already in the summer of 2005 [Mic05], while a more
accurate value of a88 alone had been published earlier that year by the Tokyo group [Yas06]. The obtainedvalues agree well with later measurements, but were not precise enough to obtain an accurate prediction ofa84. In hindsight, it is amusing to speculate to which degree a84 could have been calculated already at thattime, and if the outcome would have had an impact on the research pursued in our community.

2.4. Scattering properties 27
84 86 87 88
scat
terin
g le
ngth
(a0)
mass (u)
500
1000
90
Figure 2.4: Mass tuning of the scattering length. The homonuclear scattering lengths of thefour stable Sr isotopes (red dots) are approximated by a tangent function. The heteronuclearscattering lengths (blue crosses placed at the averaged masses) match this fit as well. Fromthis simple plot, the scattering length of 90Sr (red circle) can be estimated to be around100 a0. Mass scaling works best for heavy elements.
a few weeks later, confirming this result. The group of E. Tiemann used Fourier transformspectroscopy together with earlier photoassociation (PA) measurements [Mic05, Yas06] tocalculate the ground-state potential and scattering lengths. The Rice group performed two-photon PA spectroscopy to directly measure the binding energy of the last bound state in88Sr, and inferred the scattering lengths of the other isotopes by mass scaling [Mar08]. Thethree values of a84 were obtained using somewhat different methods and are in remarkableagreement of 1%, which is well within the uncertainty of the individual determinations. Thehigh accuracy of simple mass scaling had been shown already for the case of Yb [Kit08] oneyear earlier.
Optical Feshbach resonances — A continuous tuning of the scattering length a wouldbe highly desirable for many experiments, for example to facilitate evaporation, to enter thestrongly interacting regime, or to minimize mean-field shifts. Not only magnetic fields, butalso light fields close to a PA resonance can influence the scattering length [Fed96a]. Theseoptical Feshbach resonances (OFRs) have been studied in Rb [The04] and observed to beaccompanied by strong losses. There has been considerable hope that the losses would beorders of magnitude smaller if a PA feature associated to a narrow transition was used.Extensive work by the JILA group on the 1S0 − 3P1 transition in
88Sr observed a clear alter-ation of the elastic scattering rate, but losses were substantially larger than initially expected[Bla11b]. Related work by the Rice group [Mar09b] and in Yb [Yam10] showed that the scat-tering length can be changed for time scales on the order of 10−3 s. Many applications, suchas evaporative cooling and clock interrogation, however, require timescales on the order ofseconds, and it seems unlikely that OFRs will be helpful. The resonance strength of an

28 Chapter 2. Strontium: an alkaline-earth element
OFR is expected to be orders of magnitude larger for isotopes with a bound state close tothreshold, e.g. 172Yb, 86Sr, or 40Ca. Such experiments have not yet been performed.
SU(N) character — The scattering lengths between different mF states in the alkalis,e.g. Rb, are similar, but slightly different. This dependence of scattering behavior on thespin state is also reflected in the possibility of spin-changing collisions, in which the totalangular momentum MF = mF,i + mF,j is conserved, but the two colliding atoms i and jmight change their internal state. In the alkaline-earth elements, the 1S0 and 3P0 statespossess no electronic magnetic moment, such that the nuclear moment cannot couple to theelectronic structure [Boy07c]. The spin state is encoded in the nucleus, well isolated fromthe environment, and we expect identical scattering lengths for every pair of two differentmF states, as well as the absence of spin-changing collisions. This higher degree of “similar-ity” between the mF states is referred to as SU(N) symmetry and forms the basis of manyproposals for quantum simulation [Gor10]; see Chpt. 1.1.
Inelastic scattering of bosons in the 3P2 state — The 3P2 state seems like a picture-perfect world for magneto-optical trapping and evaporation. This state gets already pop-ulated during the broad pre-cooling MOT, and further cooling can proceed on the broad3P2 − 5s5d 3D3 transition at 497 nm, followed by narrow-line cooling on the
3P2 − 5s4d 3D3
transition at 2.92μm. This transition has a linewidth of about 50 kHz, and the magneticsubstructure of the 3P2 state even allows for sub-Doppler cooling. The large wavelengthimplies a very low recoil temperature of 110 nK. This transition is also very closed: Thereis no other state below the 5s5d 3D3 state that could open up an additional decay channelwith a reasonable decay rate. The fermionic isotope 87Sr exhibits hyperfine structure in thetwo states involved, but the hyperfine splitting is on the order of 104 linewidths, such thatexcitation of the “wrong” state is negligible. Evaporation could proceed in either an opticalor a magnetic trap, and imaging of atoms in the 3P2 state could be performed on a varietyof transitions.
This marvelous setting is spoiled by the presence of inelastic two-body collisions. Upona collision, an atom can change its Zeeman substate mJ , its fine-structure quantum num-ber J , or go directly into the ground state. The energy released in any of these processesgreatly exceeds the trap depth, leading to trap loss. Such rapid loss has been observed in Ca[Han06], Yb [Yam08], and Sr [Tra09] (inelastic decay rate coefficient βin ≈ 1× 10⁻¹⁰ cm3/s),leaving little hope that evaporative cooling in the 3P2 state will be successful.
Inelastic scattering of bosons in the 3P0 state — A similar experiment was per-formed in the 3P0 state of
88Sr [Tra09, Lis09], where the only energy-releasing mechanism isa direct decay into the ground state. The ratio of the elastic and inelastic collision rates wasfound to be of order unity, which precludes evaporative cooling. The loss rate coefficient wasdetermined to be about βin ≈ 2 × 10⁻¹¹ cm3/s [Tra09]. The PTB group also measured theinelastic loss rate for two atoms in the 1S0 +
3P0 combination to be a factor of 10 smallerthan in the 3P0 +
3P0 combination [Lis09].
Inelastic scattering of fermions in the 3P0 state — Many of the proposals outlined

2.5. Other two-electron systems 29
in Chpt. 1 require the presence of two or more distinguishable fermions on the same latticesite. The atoms would be in the 1S0 or
3P0 state, which naturally raises the question ofstability. The JILA group has approached this subject by measuring the loss of atomsat μK-temperatures in a 1D optical lattice [Bis11]. The loss rate coefficient of a mixtureprepared in a single 3P0 spin state was found to be high (Kee ≈ 10−11 cm3/s, which iscomparable to the bosons) and temperature-dependent. The rate coefficient is only slightlylarger for a sample prepared in an equal mixture of two different 3P0 spin states. The ratecoefficient for collisions between 1S0+
3P0 atoms was too small to be measured, which agreesagain with the bosonic case.
The system envisioned for quantum simulation purposes would harbor atoms on verysmall lattice sites at extremely low temperatures, with all atoms occupying a well-definedband of the lattice. This scenario is qualitatively different from the one studied by the JILAgroup, and further investigation of this important subject is currently under way.
2.5 Other two-electron systems
Strontium is certainly not the only suitable element to pursue the ideas laid out in Chpt. 1.Although we have placed our bets on Sr already years ago, we should spend some time tocompare Sr to other two-electron systems. We will not consider the best-known two-electronsystem, helium, as its transitions from the singlet ground state into the excited states are inthe XUV range, which is not accessible with current laser technology.
Ytterbium
Ytterbium, a lanthanide element with two valence electrons, turns out to be quite similar tostrontium. Ytterbium has five bosonic and two fermionic isotopes, all of which (except forthe 172Yb isotope, which has a large and negative scattering length) have been brought todegeneracy by the Tokyo group. The first one was 174Yb already in 2003 [Tak03], the lastone was 168Yb in 2011 [Sug11]. Work on fermionic Yb is also performed by the Seattle group[Han11]. In the summer of 2012, BEC in Yb was achieved in the Florence, Hamburg, andMunich groups.
The scattering lengths of the isotopes cover the complete range from positive to vanishingand negative values; see Tab. 2.5. Two-photon PA spectra have been taken for a numberof isotope combinations, and all homo- and heteronuclear scattering lengths have been de-termined and compared to theory [Kit08]. This mass tuning is shown in Fig. 2.5. Thereare two bosonic and two fermionic isotopes with positive homonuclear scattering length andreasonable natural abundance, which are well-suited for quantum gas experiments. It is alucky coincidence that the most abundant isotope, 174Yb, has a scattering length very wellsuited for evaporative cooling, and BECs of 150 000 atoms have been achieved12. The largestatom numbers of the other isotopes are around 10 000, but these numbers do not seem to befundamental limits. The selection of isotopes allows for the generation of Bose-Bose [Sug11],Bose-Fermi [Fuk09b], and Fermi-Fermi [Tai10] mixtures. A comparison to Sr-Sr mixtures
12Note that this number is still a factor of almost 100 smaller than the largest Sr BEC atom number.

30 Chapter 2. Strontium: an alkaline-earth element
isotope abundance statistics I scatt. length BEC/DFG atom number168Yb 0.12% boson 0 251 a0 [Sug11] 10 000170Yb 2.98% boson 0 64 a0 [Fuk07a] 7 000171Yb 14.08% fermion 1/2 −3 a0 [Tai10] 8 000172Yb 21.69% boson 0 −598 a0173Yb 16.10% fermion 5/2 199 a0 [Fuk07b] 10 000174Yb 32.02% boson 0 105 a0 [Tak03] ([Yam10]) 150 000176Yb 13.00% boson 0 −24 a0 [Fuk09b] < 250
Table 2.5: All stable isotopes of Yb with their respective natural abundance [Lae06], spinstatistic nature, nuclear spin, homonuclear scattering length [Kit08], reference to the first(largest) reported BEC or degenerate Fermi gas, and the largest atom number reported sofar.
will be given in Chpt. 8. The 172Yb isotope with its large and negative scattering lengthis a very unique candidate to study OFRs: due to the small energy difference between thefree-atom threshold and the nearest bound state, the resonance strength is expected to be afactor of 105 stronger than of 88Sr [Jul].
The availability of two different fermionic isotopes might be an advantage over Sr, butwe are not aware of any experiments which would require different isotopes13. Much moreimportant is the fact that 87Sr offers ten nuclear states, compared to two and six for the 171Yband 173Yb isotopes. This is fundamentally important for the study of SU(N) magnetism,where the ordering of spins is expected to depend on the number of spin states N .
The electronic structure of Yb is similar to Sr at first glance (Fig. 2.6), but there aresome subtle differences. The blue 1S0− 1P1 transition can be addressed by light from a diodelaser, which is an advantage over strontium. The 1D2 state, which happens to lie below the1P1 state in Sr and opens the celebrated decay path from the pre-cooling MOT into themetastable states, lies above the 1P1 state in ytterbium. The only leak of atoms from theblue transition leads into the triplet 3D1,2 states, and from here into the 3P0,2 states. Thisbranching ratio, however, is two orders of magnitude smaller than in Sr. In addition, thelifetime of the 3P2 state in Yb is only 14 s, compared to 500 s in strontium. Almost all presentexperiments with Yb use the 1S0 − 1P1 transition only for Zeeman-slowing, but not for theMOT. We believe, however, that a “blue” MOT and subsequent storage of atoms in themetastable 3P2 state could increase the atom number available for further cooling. As a firststep in this direction, it was recently shown that the atom number of a MOT operated on the1S0 − 1P1 transition can be increased by about 30% when continuously repumping the 3P0,2
states [Par]. The filling of the reservoir could possibly be accelerated by actively pumpingatoms from the 1P1 into the
3S1 state. The vapor pressure of Yb is significantly higher thanthat of Sr, which should allow for fast loading of the relatively short-lived reservoir.
The 1S0 − 3P1 transition at 556 nm has a linewidth of 182 kHz, roughly 25-times broaderthan in Sr and 500-times broader than in calcium. Consequently, the Doppler tempera-
13The Zeeman shift of the 3P1 states is large enough to selectively address single spin states by opticalmeans already at low magnetic fields.

2.5. Other two-electron systems 31
171 172 173
scat
terin
g le
ngth
(a0)
mass (u)
500
176168 170 174
168 + 170168 + 172
168 + 171168 + 173
168 + 174
168 + 176
-500
Figure 2.5: Mass tuning of the scattering length in Yb. The homonuclear scattering lengthsof the seven stable isotopes (red dots) are fit by a tangent function. The heteronuclearscattering lengths of the 168Yb isotope (blue crosses) are drawn as well. Values are takenfrom [Kit08].
ture of this MOT is 25-times higher than in Sr, which is a tremendous disadvantage forsubsequent evaporative cooling and finally leads to comparatively low BEC atom numbers.From a technical point of view, the light at 556 nm is typically generated by a dye laser ora frequency-doubled diode laser, where in Sr a simple laser diode can be used. There arestill some advantages of a broader intercombination line: The ratio of linewidth and hyper-fine splitting of the 3P1 states in the fermions is just right to perform optical Stern-Gerlach(OSG) separation with a single-frequency OSG beam. While the state-selective imagingof mF states in the fermions requires larger magnetic fields than in Sr, the signal-to-noiseshould be much better, since the photon recoil limit is much smaller than the Doppler limit.Although absorption imaging on the 556 nm transition could be state-selective and wouldoffer good spatial resolution, it has not been implemented in present experiments.
The large mass of Yb might be appealing, for example for the creation of molecules witha large mass imbalance, such as LiYb. It turns out, however, that the electric dipole momentof LiYb in the rovibronic ground state is extremely small, about 0.05D.
Taking all these considerations into account, we believe that Sr is the better choice.Nonetheless, many new Yb machines are currently being constructed.
Calcium
The work on Ca has been similar to the one on strontium: 40Ca was and still is used inoptical lattice clocks (e.g. at NIST and PTB), and there have been early attempts to reachquantum degeneracy both in the ground and metastable states, most noticeably in the groupof A. Hemmerich in Hamburg [Gru02, Han03]. BEC of 40Ca in the ground state was hinderedby the large scattering length of about 440 a0 for a long time, and finally achieved by thePTB group [Kra09] a few months before BEC in Sr, and later in Hamburg [Hal12]. The

32 Chapter 2. Strontium: an alkaline-earth element
6s2 1S0
5d 1D2
6p 1P1 5d 3D
7s 3S1
6d 3D1,2,3
6p 3P012
123
29 MHz
182 kHz
399 nm
556 nm
494 nm
4s2 1S0
3d 1D2
4p 1P1
3d 3D1,2,3
5s6s 3S1
4p 3P0,1,2
35 MHz
370 Hz
4.7 kHz
423 nm
657 nm
453 nm
Yb Ca
~1:107
770 nm680 nm
649 nm
E (1
03 cm
-1)
0
10
20
30
40
4d 1D2
~1:105
1S 1P 1D 3S 3P 3D 1S 1P 1D 3S 3P 3D
Figure 2.6: Left: Reduced level scheme of Yb with the decay paths from the 1P1 state (dashedarrows), possible repump lines (red and blue arrows) and a proposed way to accelerateoutcoupling of atoms from the blue MOT cycle (dotted arrow). Right: Corresponding levelscheme of Ca with decay paths from the 1P1 state (dashed arrows), the quench laser (blue)and decay from the 4d 1D2 state (dotted arrow).
pure BEC of the PTB experiment contained 10 000 atoms, and the route to BEC did notprove to be particularly robust; the Hamburg group reported a BEC of 3000 atoms. Thescattering lengths of the other even isotopes of Ca have been calculated in Ref. [Dam11]. Itwas found that the periodicity of the position of the last bound state coincides exactly withtwo mass units of the reduced mass, meaning that all even isotopes of Ca have roughly thesame large and positive homonuclear scattering length. In other words, the other isotopeswill not be suited better for evaporative cooling. Evaporation of atoms in the metastable 3P2
state towards condensation seems impossible due to large inelastic cross sections [Han06].
The second most abundant isotope, bosonic 44Ca, has an abundance of 2.1% and hasnot been investigated in experiments so far. The only stable fermionic isotope 43Ca comesat 0.14% abundance, it has nuclear spin I = 7/2 and a scattering length of about 65 a0
[Dam11]. Enriched sources of Ca are available only in the carbonate form and would needto be reduced to the metal; see Appendix B for details.
The broad 1S0− 1P1 transition is used for Zeeman-slowing and the first MOT stage. Justas in Sr, the 1D2 level lies below the 1P1 level and provides a leak for atoms from the MOTcycle with a branching ratio of 1 : 100 000 [Bev89]14. After pre-cooling, atoms are transferredinto a narrow-line MOT on the intercombination line. This transition has a width of only370Hz, which results in a scattering rate too small for stable operation of a MOT. The upperstate is therefore quenched using the 3P1 − 1D2 transition at 453 nm, which has a linewidthof about 5 kHz and requires frequency-broadening of the laser. This way, the scattering ratecan be increased by a factor of 15 [Bin01] and results in 108 atoms at 15μK at the end
14Repumping of atoms from the metastable reservoir was not necessary for the PTB experiment [Kra09].

2.5. Other two-electron systems 33
of the second MOT stage [Kra09]. This quenching method might also be applicable to Sr,here the relevant transition would be 3P1 − 5s6p 1P1. If not quenched, however, the 370Hzintercombination line might be used as a powerful diagnosis tool for tomography of ultracoldsamples: The linewidth is smaller than typical light shifts induced by the dipole trap, meanfield shifts, and interaction shifts on a lattice site.
Magnesium
Working with the lighter alkaline-earth elements becomes increasingly difficult as all transi-tions shift into the UV, and the linewidths of most relevant transitions become very narrow.Experimental work on magnesium is driven by the desire to build an optical clock on theultranarrow 1S0 − 3P2 clock transition of 70μHz. The small wavelength of all relevant tran-sitions makes Mg optical clocks rather insensitive to blackbody radiation.
Laser cooling of 24Mg was pioneered by the Hanover group, including the first MOT[Sen94] and quenching of the 3P1 state for operation of the narrow-line MOT [Reh07]. Anoptical lattice clock is currently implemented by the Hanover group [Fri11]; further researchis performed by the Copenhagen group [Jen11]. It is interesting to note that the 1,3D stateslie above the 1,3P states in Mg. They shift downwards as the atomic number increases,falling between the 1P and 3P states in Ca and Sr and ultimately drop below both of thesestates in barium.
Apart from the bosonic 24Mg isotope, there are the fermionic 25Mg (I = 5/2) and thebosonic 26Mg isotopes, each with natural abundances of about 10%. Little is known aboutthe scattering properties of these species. One might conclude that Mg is very appealing forthe optical clock community thanks to its very narrow transitions and the insensitivity toblackbody radiation, but possibly too involved for the quantum gas community.
Barium and radium
Laser cooling and trapping of the heavy alkaline-earth elements is motivated by the study offundamental symmetries with well-controlled, cold and dense samples of Ra atoms. Radiumis uniquely sensitive to fundamental symmetry violation, such as permanent electric dipolemoments (EDMs). The observation of an EDM would be a sign of CPT violation, the currentbest atomic EDM measurements being performed with 199Hg [Rom01]. Various calculationspredict that the nuclear octupole deformation of Ra should allow for a sensitivity increaseby two or three orders of magnitude. In addition, atomic parity-violation (APV) effects areenhanced by orders of magnitude due to the near-degeneracy of the parity-odd 7s7p 3P1 andparity-even 7s6d 3D2 levels; see [Gue07] and references therein. The absence of stable Raisotopes has precluded such measurements so far. Barium, which has a similar level structureto Ra, can be used as a model system for laser cooling of these heavy elements.
Operation of a 138BaMOT was reported in 2009 [De09] and further described in Ref. [De08].The strong 1S0 − 1P1 transition is used for the slowing and trapping. This transition is notclosed, as 1P1 atoms can decay into either the singlet
1D2 state (lifetime 0.25 s) or into thetriplet 3D1,2 states (lifetimes on the order of minutes) with a combined branching ratio of1 : 300. Repumping atoms from all of these three states back into the 1P1 state allows forthe operation of stable MOTs with 106 atoms and a lifetime of many seconds. Laser cooling

34 Chapter 2. Strontium: an alkaline-earth element
on the intercombination line is difficult due to a large branching ratio from the 3P1 intolower-lying 6s5d 3D states.
The energy levels and transition linewidths shift further as we go to the next heavyelement, radium. Just as in Ba, the strong 1S0 − 1P1 transition is not cycling anymoredue to a 0.3% branching ratio from the 1P1 into the 1D2 state. Instead, the 1S0 − 3P1
transition with a linewidth of 380 kHz is used for the MOT. Also this transition is onlyquasi-cycling, as atoms in the 3P1 state can decay into a
3D1 state and further into the3P0
clock state. Repumping from this state is done passively through blackbody radiation atroom temperature back into the 3D2 state, from where repumping via the 1P1 state returnsatoms into the MOT cycle. Magneto-optical trapping of the fermionic 225Ra (I = 1/2,t1/2 = 14.9 days) and the bosonic 226Ra (t1/2 = 1600 years) has been reported [Gue07], withMOT atom numbers of 20 and 700, respectively.
Mercury
Mercury with its nuclear charge of Z = 80 is one of the heaviest elements with stableisotopes. Laser-cooling has been pioneered by the Tokyo group and is aimed at two differentapplications: The clock transition of Hg is deep in the UV at 265.5 nm and a factor of tenless sensitive to blackbody radiation than strontium. Second, the large nuclear charge iswell-suited for the study of fundamental symmetries: the parity-violating amplitudes andatomic CP -violating permanent EDMs scale as Z3, and CP -violating polarizabilities evenscale as Z5 [Hac08].
There are six Hg isotopes with natural abundances exceeding 6%, two fermionic (I = 1/2and I = 3/2) and four bosonic ones. The 1S0 − 1P1 transition lies at 185 nm, and even theintercombination line at 254 nm requires frequency quadrupling of an IR diode laser. AMOT operated on this transition does not require repump lasers, and up to 106 atoms couldbe loaded into the MOT from a vapor cell and cooled to the Doppler temperature of 50μK[Hac08]. The MOT was demonstrated for all six abundant isotopes 198−204Hg, making 204Hgthe heaviest laser-cooled stable atom so far. Related work is performed in Darmstadt [Vil11]and at SYRTE [Yi11].
Cadmium
The element Cd is somewhat similar to Hg and Yb, but substantially lighter. There didexist a MOT of Cd [Bri07], containing a few thousand atoms. In this experiment, the atomswere captured directly from the background vapor. The linewidth of the 1S0− 3P1 transition(70 kHz) is likely to be too narrow for a first cooling stage, and the broad 1S0−1P1 transitionat 229 nm was used in this experiment. A photon at this wavelength carries enough energyto ionize an atom in the 1P1 state, leading to ionization loss and limiting the MOT atomnumber.
The strategy of Zeeman-slowing on the broad transition combined with trapping andcooling on the narrow transition has been very successful in Yb [Tak03] and Er [Fri12]. Thisstrategy should also be applicable to Cd, yielding excellent starting conditions for evaporativecooling.

2.6. Experiments with thermal gases of strontium 35
element A B/F I λS (nm) ΓS (MHz) λT (nm) ΓT (kHz) Δ1P11D2
(cm−1)
Be 9 0/1 3/2 235 455 −14 317Mg 24 2/1 5/2 285 79 457 0.036 −11 352Ca 40 1/0 - 423 35 658 0.37 1 803Sr 88 3/1 9/2 461 32 689 7.6 1 549Ba 138 3/2 3/2, 3/2 554 19 791 48 6 665Ra 226 2/1 3/2 483 29 714 380 3 634
Cd 114 6/2 1/2, 1/2 229 91 325 70 −15 527Hg 202 4/2 1/2, 3/2 185 30 254 1270 −17 226Yb 174 4/2 1/2, 5/2 399 29 558 182 −2 609
Table 2.6: Comparison of all alkaline-earth elements and the elements Cd, Yb, and Hg,listing the mass number A of the most abundant or stable isotope, the number of bosonic(B) and fermionic (F) isotopes with natural abundances > 0.5% and lifetime > 2 weeks,the nuclear spin I of the fermionic isotope(s), the wavelengths λ and linewidths Γ of boththe 1S0 − 1P1 transition (S) and the 1S0 − 3P1 intercombination line (T ), and the energydifference Δ between the 1P1 and nearest
1D2 state. Data taken from [NIS].
2.6 Experiments with thermal gases of strontium
Many groups around the world perform experiments with thermal gases of strontium. Mostnoticeable, Sr is used in optical lattice clocks [Der11], originally proposed and first realized bythe Tokyo group [Tak05]. Such clocks are currently operated at many laboratories, includingJILA (Boulder, USA), SYRTE (Paris, France), LENS (Florence, Italy), PTB (Braunschweig,Germany), and various institutes in Tokyo (Japan). Further clocks are currently set up,e.g. at NPL (UK), at NIMC (China), and in Moscow (Russia). Strontium lattice clocksaround the world achieve the best agreed-upon frequency [Bla08], making them a candidatefor a possible re-definition of the SI second. Having lacked behind the best ion clocks interms of stability in the past [Lud08b], Sr lattice clocks have very recently reached the samerecord 1× 10⁻¹⁷ fractional stability as Al+ ion clocks [Cho10, Nic12].
Some of the groups mentioned above are employing optical clocks as force sensors, forexample to measure the gravitational field [Pol11]. Applications in geodesy would requireportable clocks, which are currently being developed and could also provide a platform forsatellite missions.
A very different type of precision measurement can be performed with Sr2 ground-statemolecules: The binding energies of the various vibrational states of the ground-state poten-tial depend differently on the electron-to-proton mass ratio μ = me/mp. A repeated andsufficiently precise measurement of the binding energies of different states might reveal tem-poral drifts of μ and, with a lesser sensitivity, of the fine structure constant α; see Chpt. 11.This research is pursued at the University of Columbia (NYC, USA) [Rei12].
The two valence electrons provide an advantageous handle to Rydberg gases: while oneelectron is excited into the Rydberg state, the other one can be used for cooling, trapping,or imaging. This research line is followed by the Durham group [Mil10]. Closely related is

36 Chapter 2. Strontium: an alkaline-earth element
the study of ultracold plasmas, where one of the two valence electrons is completely ionized[Kil07b]; such studies are performed by the Rice group [Sim04, Kil07a].
2.7 Optical cooling procedure
We employ a sequence of three cooling stages to bring Sr atoms into the regime of degeneracy.The first stage is a MOT operated on a broad transition, ideally suited to capture atoms andcool them to mK temperatures. The second stage is a MOT operated on a narrow transition,capable of cooling the atoms to thousand-times lower temperatures at million-times higherdensities. Such a sample is loaded into an optical dipole trap. The third stage, evaporativecooling, leads into quantum degeneracy. While the details of the last cooling stage dependon the respective isotope and the objective of the experiment, the first two cooling stagesare rather similar for all experiments and will be described in this section.
2.7.1 The blue MOT
A stream of Sr atoms at ∼ 600 ◦C is emitted from an oven (see Appendix C) and directedinto the UHV chamber (see Chpt. 3.1). By design, the atomic beam has a divergence oforder 10mrad, which is consistent with observations. Over time, the divergence increasedsignificantly due to redistribution of material in our oven.
This divergence is given by the geometry of the oven, and can be reduced by a 2D opticalmolasses, also known as transverse cooling. We use light blue-detuned by Γ/2 ≈ 15MHz fromthe 1S0−1P1 transition at 461 nm. This light is split into two beams, propagating orthogonalto each other and to the atomic beam, intersecting with the atoms about 100mm downstreamfrom the oven. The interaction region is about 50mm long. The beams are retro-reflected,and we tried different schemes of round and elliptical beams of different sizes, and multi-passconfigurations. We ended up with simple retro-reflected elliptical beams with aspect ratio1 : 5 (diameter about 30mm in the longitudinal and 6mm in the transverse direction) withclose to 10mW in each axis.
Transverse cooling increased the number of atoms in the 84Sr MOT by about a factor ofthree for the early case of a well-collimated atomic beam, and by a much larger factor for theoven with increased divergence. Note that the transverse cooling beams can also be used tofine-tune the direction of the atomic beam towards the MOT region in an isotope-selectiveway15.
The broad 30-MHz transition allows for fast Zeeman-slowing and offers a high capturevelocity of the MOT. We use a spin-flip Zeeman-slower of 800mm length. The Zeemanslower was originally designed for alkali atoms, and implemented into our machine with thelong-term vision of a combined alkali/alkaline-earth experiment in mind. Typical Sr Zeemanslowers are much shorter and likely to perform better. The Zeeman-slower beam containsabout 35mW of power, it is slightly focussed onto the aperture of the oven and has a waistof about 8mm at the position of the MOT.
15As an extreme case, the atomic beam leaving the oven would be directed away from the MOT region tominimize vacuum degradation, and only the selected isotope would be deflected into the MOT region.

2.7. Optical cooling procedure 37
Atoms in the MOT region are illuminated by three retro-reflected MOT beams, onevertical of about 4mm waist and two horizontal of 5mm waist. They have intensities ofIvert = 0.1 Isat and Ihor = 0.25 Isat, corresponding to about 1mW in the vertical and 4mW inthe horizontal beams. The detuning is −1.0 Γ ≈ 32MHz, and the gradient of the quadrupolefield is 55G/cm in the vertical direction. The Doppler temperature of this “blue” MOT isTD = 720μK, much higher than the recoil temperature Tr = 690 nK. Sub-Doppler coolingis hindered by the absence of a magnetic substructure (I = 0 for the bosonic isotopes), andrepumping in the classic sense is not required due the lack of hyperfine structure (J = 0).
As we will see later, atoms from the upper MOT level can decay via the 1D2 level into themetastable 3P2 level, which possesses a magnetic moment, and atoms in weak-field-seekingmF states of this level can be trapped in a magnetic field. We do not optimize the MOTfor fluorescence or atom number, but for the loading rate of the metastable reservoir, whichwe define as the container formed by the magnetic trap for 3P2 atoms. The loading ratedepends on various experimental parameters, among them the temperature (i.e. the flux) ofthe oven, the amount of light available at 461 nm (i.e. the slowing and capture efficiency),the natural abundance of the respective isotope, and the temperature of the blue MOT. Thislast parameter is somewhat surprising, and we will explain it briefly.
Our glass cell has an inner height of 22mm, such that atoms can take excursions of only11mm from the quadrupole center. With a vertical B-field gradient of 55G/cm, the cut-offB-field is about Bmax = 60G. A comparison of the Zeeman-energy E = gJmJμBB and thethermal energy E = 3
2kBT gives a maximum temperature of 4.0mK for mJ = 1, up to which
atoms are trapped within the glass cell, higher energetic atoms will stick to the walls16. Weindeed observe fluorescence within the entire volume of the glass cell when illuminating the3P2 atoms in the reservoir with light on the quasi-cycling
3P2 − 3D3 transition. Apart fromthis observation, we do not have a suitable imaging system to measure the temperature ofthe blue MOT.
The 1P1 hyperfine structure of the fermionic isotope cannot be resolved on the bluetransition, leading to undesired excitation of the F ′ = 7/2 and F ′ = 9/2 states. We do nothave the means to measure the atom number of the blue MOT directly, but by comparison ofthe fluorescence of the 86Sr and 87Sr MOTs, we estimate that the fermionic MOT performsa factor of about two worse than its bosonic counterpart. Sub-Doppler cooling is possibledue to the magnetic substructure and has indeed been observed by the JILA group [Xu03].Given that the gF factors of the fermionic 3P2 states are substantially smaller than in thebosonic case, it is very fortunate that colder temperatures can be achieved.
We usually operate the blue MOT until a few 107 to 108 atoms are accumulated in thereservoir. This takes between 50ms and 10 s, depending on the abundance of the isotope.
16Atoms in higher mF states will of course also be trapped at higher energies. Note that the gF factorsfor the hyperfine states for the fermionic isotope are different and substantially smaller than for the bosonicone.
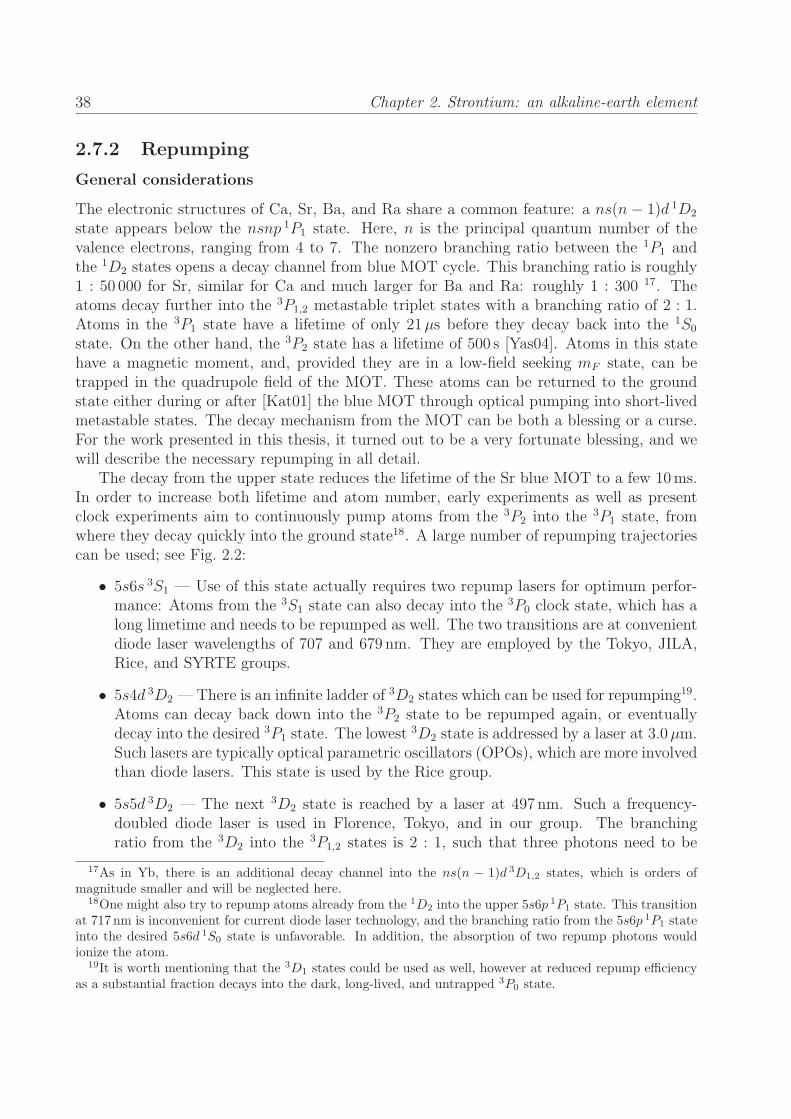
38 Chapter 2. Strontium: an alkaline-earth element
2.7.2 Repumping
General considerations
The electronic structures of Ca, Sr, Ba, and Ra share a common feature: a ns(n − 1)d 1D2
state appears below the nsnp 1P1 state. Here, n is the principal quantum number of thevalence electrons, ranging from 4 to 7. The nonzero branching ratio between the 1P1 andthe 1D2 states opens a decay channel from blue MOT cycle. This branching ratio is roughly1 : 50 000 for Sr, similar for Ca and much larger for Ba and Ra: roughly 1 : 300 17. Theatoms decay further into the 3P1,2 metastable triplet states with a branching ratio of 2 : 1.Atoms in the 3P1 state have a lifetime of only 21μs before they decay back into the 1S0
state. On the other hand, the 3P2 state has a lifetime of 500 s [Yas04]. Atoms in this statehave a magnetic moment, and, provided they are in a low-field seeking mF state, can betrapped in the quadrupole field of the MOT. These atoms can be returned to the groundstate either during or after [Kat01] the blue MOT through optical pumping into short-livedmetastable states. The decay mechanism from the MOT can be both a blessing or a curse.For the work presented in this thesis, it turned out to be a very fortunate blessing, and wewill describe the necessary repumping in all detail.
The decay from the upper state reduces the lifetime of the Sr blue MOT to a few 10ms.In order to increase both lifetime and atom number, early experiments as well as presentclock experiments aim to continuously pump atoms from the 3P2 into the
3P1 state, fromwhere they decay quickly into the ground state18. A large number of repumping trajectoriescan be used; see Fig. 2.2:
• 5s6s 3S1 — Use of this state actually requires two repump lasers for optimum perfor-mance: Atoms from the 3S1 state can also decay into the
3P0 clock state, which has along limetime and needs to be repumped as well. The two transitions are at convenientdiode laser wavelengths of 707 and 679 nm. They are employed by the Tokyo, JILA,Rice, and SYRTE groups.
• 5s4d 3D2 —There is an infinite ladder of 3D2 states which can be used for repumping19.
Atoms can decay back down into the 3P2 state to be repumped again, or eventuallydecay into the desired 3P1 state. The lowest
3D2 state is addressed by a laser at 3.0μm.Such lasers are typically optical parametric oscillators (OPOs), which are more involvedthan diode lasers. This state is used by the Rice group.
• 5s5d 3D2 — The next 3D2 state is reached by a laser at 497 nm. Such a frequency-doubled diode laser is used in Florence, Tokyo, and in our group. The branchingratio from the 3D2 into the
3P1,2 states is 2 : 1, such that three photons need to be
17As in Yb, there is an additional decay channel into the ns(n − 1)d 3D1,2 states, which is orders ofmagnitude smaller and will be neglected here.
18One might also try to repump atoms already from the 1D2 into the upper 5s6p 1P1 state. This transitionat 717 nm is inconvenient for current diode laser technology, and the branching ratio from the 5s6p 1P1 stateinto the desired 5s6d 1S0 state is unfavorable. In addition, the absorption of two repump photons wouldionize the atom.
19It is worth mentioning that the 3D1 states could be used as well, however at reduced repump efficiencyas a substantial fraction decays into the dark, long-lived, and untrapped 3P0 state.

2.7. Optical cooling procedure 39
absorbed on average to return an atom to the ground state. There is a small leak fromthe 5s5d 3D2 into the 5s6p
3P1,2 states, which can guide atoms into the dark 5s5p3P0
state. This loss, however, is small and reduces the repump efficiency by at most a fewpercent.
• 5s6d 3D2 — The next 3D2 state comes at 403.5 nm, which is a very convenient aspowerful and inexpensive laser diodes developed for the Blu-ray technology exist inthis range. This transition has not been used so far. More and more additional decaychannels open up as one advances towards higher 3D2 states. While the branchingratios have not been investigated, we estimate the reduction in repump efficiency tobe small.
Fermions
Repumping of the bosonic isotopes is straightforward even in isotopic mixtures, since theisotope shifts are at most 100MHz. In the case of 87Sr, efficient repumping is complicated bythe hyperfine structure of the involved states. We find that all five hyperfine states F = 5/2through F = 13/2 of the 3P2 level are populated during the blue MOT, however at differentrelative amounts. Three different parameters determine the distribution of atoms in the fivehyperfine states. At first, the blue MOT operates on the F = 9/2 → F ′ = 11/2 transition.The hyperfine splittings of the 1P1 state are only on the order of the transition linewidth,such that also the F ′ = 7/2 and F ′ = 9/2 states become populated and contribute to thedecay. The second and most important class of parameters are the branching ratios of allthree 1P1 states into the five
1D2 and further into the five 3P2 states. And third, not all3P2 hyperfine states are trapped equally well in the quadrupole field. The fraction of thevelocity distribution of atoms leaving the blue MOT that can be trapped depends not onlyon the temperature of the atoms and the strength of the magnetic field, but also on the gF
factor of each state and the mF state of the individual atoms. The gF factors differ by up toa factor of six (see Ref. [Boy07a]) and are particularly small for the F = 7/2 and F = 9/2states. The maximum |mF | increases with F , such that we expect atoms in the F = 13/2state to have the highest probability to remain trapped.
This is what we find in the experiment qualitatively: The majority of atoms populatethe F = 13/2 and F = 11/2 states, with some additional atoms in the F = 5/2 state.We find that additional repumping of the F = 7/2 and F = 9/2 states does not increasethe total number of repumped atoms by more than a few percent. The exact populationof each state is not straightforward to determine, since atoms cycle a few times on the3P2 − 3D2 transition before eventually decaying into the
3P1 state, and they might not fallinto their initial hyperfine state. Spectroscopic data on this repumping transition can befound in Chpt. 9. In the typical experimental cycle, we perform repumping only on theF = 11/2→ F ′ = 13/2 and F = 13/2→ F ′ = 13/2 transitions.
Further investigation
We would like to estimate the fidelity of our repumping scheme, but we have no directmeans of quantification. Instead, we investigate the lifetime of the blue MOT with and

40 Chapter 2. Strontium: an alkaline-earth element
without continuous repumping. The MOT lifetime is strongly density-dependent, thereforemeasurements are taken at low atom number. Measurements are taken with both the 86Srand 87Sr isotopes20. Without repumping, the MOT lifetime is 30(5)ms for both isotopes,which is consistent with a 1P1 lifetime of 5 ns, a decay probability of 1 : 150 000 into the
3P2
level, and an effective MOT light intensity of 0.1 Isat. In presence of the repumping light,the lifetime increases to 950(50)ms for the bosonic and 120(10)ms for the fermionic isotope,where we repump only the F = 11/2 and F = 13/2 states.
The increase by a factor of 30 in the bosonic case shows that the fidelity of repumpingis very high: Atoms are repumped from the 3P2 state at least 30 times on average beforethey are ultimately lost. This factor of 30 will be recovered in a different measurement; seeChpt. 9. Besides standard loss mechanisms of a MOT, we suggest decay into the dark 3P0
as the dominant loss channel21.
In the case of the fermions, the lifetime is increased by only a factor of four. In a crudesimplification, we deduce that only 80% of the atoms that have leaked out of the MOT cyclego into the 3P2 F = 11/2 and F = 13/2 states, the other 20% are distributed over theother states. In addition, we know that the fermionic MOT performs worse than the bosonicMOT: If, despite the fact that the measured bare MOT lifetimes are the same within theerrorbars, standard loss from the MOT is higher in the fermionic case, then the branchingratio into the non-repumped hyperfine states would be even smaller. Repumping also theF = 5/2 state would require two additional frequencies about 3GHz away from the presentones. We believe that this effort would not be worth the gain.
In a next step, we will discuss a way to accelerate the loading of the metastable reservoir,particularly for the fermions. On timescales on the order of the MOT lifetime, the loadingrate could be increased by a factor of about 3 if atoms that have decayed into the 3P1 statewere added to the 3P2 state. This would also be helpful if the size of the MOT is alreadysaturated (as possible in the case of a large 88Sr MOT) or if loss mechanisms other than thedecay into metastable states play a role (as possibly in the 87Sr MOT). Experiments strivingfor fast cycle times (such as optical clocks) or suffering from poor vacuum could also benefitfrom fast reservoir loading. Optical pumping from the 3P1 into the
3P2 state while avoidingthe 3P0 state can be performed with a combination of the
3P1− 3S1 and3P0− 3S1 transitions
at 688 and 679 nm, or with a single laser addressing a 3D2 state at either 2692, 487.4, or397.0 nm.
At the time of writing this thesis, we have only the laser at 688 nm operational to performa preliminary measurement on depopulation of the 3P1 state, very similar to work done atSYRTE [Cou05, QV05]. We illuminate the blue MOT with light resonant on the 3P1 − 3S1
transition to pump atoms into the 3P0,2 states. For all bosonic isotopes, the blue MOT atomnumber is drastically reduced by 78(5)%. In the case of the fermionic isotope, we expecta drop in atom number at seven frequencies, corresponding to the hyperfine transitionsallowed by selection rules. We confirm the resonance positions found by the SYRTE groupand measure the reduction of the MOT atom number on each resonance. Considering only
20The 84Sr and 88Sr isotopes show results very similar to 86Sr. The 84Sr MOT delivers poor signal-to-noisedue to is small size, whereas the 88Sr MOT shows signs of saturation.
21We learned from the JILA group that using the 3S1 state for repumping both the 3P0 and 3P2 statesincreases the lifetime of the MOT to about 8 s, which is the same value as their vacuum lifetime [Mar].

2.7. Optical cooling procedure 41
ΔF = ±1 transitions, which tend to be stronger than ΔF = 0 transitions, we find a reductionof 35(5)% upon depletion of the F = 7/2 state, and correspondingly 50(5)% for the F = 9/2and 60(5)% for the F = 11/2 state. We conclude that the decay into the three 3P1 hyperfinestates is rather uniform, and that optimized pumping into the 3P2 reservoir state wouldinvolve all of these states.
Experimental parameters
The lifetime of metastable atoms in the reservoir in our experiment is about 30 s. This valueis largely independent on the number of atoms in the reservoir (i.e. the density)22. Thelifetime is somewhat shorter than that of ground-state atoms in the dipole trap. One mightspeculate that the black-body radiation of the oven shortens the lifetime of the 3P2 stateconsiderably, an observation made already in measurements with vapor cells [Xu03]. Thelifetime is certainly long enough to allow for sequential loading of different isotopes whenworking with mixtures.
The repumping flash lasts typically 50ms and contains roughly 100μW of light in a beamcollimated to a diameter of 10mm, corresponding to roughly 0.05 Isat. The light contains thecorrect frequency for each isotope involved, but repumps only the F = 11/2 and F = 13/2states in 87Sr 23. The repumping conditions are very relaxed, as only very few photons needto be scattered. We did not measure the repump efficiency in dependence on the parametersinvolved, but we can state that a reduction of the repump duration to 5ms, an intensitydecrease by one order of magnitude, or a frequency detuning of 50MHz (20 linewidths) donot reduce the performance significantly.
2.7.3 The red MOT
The presence of narrow intercombination lines in Sr offer the intriguing opportunity to add asecond cooling stage after the blue MOT in order to reduce the temperature and increase the(phase space) density of the ensemble further. The second cooling stage is often referred toas narrow-line MOT and frequently named “red” MOT, owing to the color of the transitionwavelength at 689 nm.
In general, a first limit of the attainable temperature in a MOT is set by the Dopplerlimit of TD = �Γ/(2kB), where in this case the linewidth is Γ = 2π × 7.4 kHz. The Dopplertemperature is TD = 179 nK, a factor of 4300 smaller than for the blue transition. Thisimpressive number demonstrates the power of narrow-line cooling. For linewidths on theorder of kHz, the Doppler temperature becomes comparable to a second figure of meritof a MOT transition: the recoil temperature Tr = �
2k2/(kBm), where k = 2π/λ is thewave vector of the light field and λ the wavelength. We find Tr = 460 nK on the narrowtransition, and the minimal attainable temperature is Tr/2. Thus, Doppler and recoil limitalmost coincide for the red transition in strontium.
22The cloud of atoms in the reservoir is very dilute: even at full loading, 108 atoms are dispersed over∼ 35 cm3, equivalent to a partial pressure of 3 × 10⁻¹¹ mbar. Two- and even more so three-body collisionsshould be rare.
23As a coincidence, the F = 11/2 → F ′ = 13/2 and F = 9/2 → F ′ = 7/2 transitions overlap, such thatsome atoms in the F = 9/2 state are repumped as well.

42 Chapter 2. Strontium: an alkaline-earth element
Narrow-line cooling of Sr has been established by the Tokyo group [Kat99] and laterstudied extensively by the JILA group [Lof04b, Lof04a]. We will limit ourselves to anintuitive description of the cooling process and report our experimental parameters, butrefer to the literature for an in-depth investigation.
Bosons
The atoms are repumped from the reservoir at temperatures set by the Doppler temperatureof the blue MOT, roughly 1mK. A single frequency would not provide sufficient captureefficiency, and we frequency-broaden the MOT light to match the frequency spectrum tothe velocity distribution of the atoms. We use an AOM to scan the frequency of the MOTlight with a rate of about 20 kHz, thereby creating a comb of lines extending from roughly−200 kHz to −5MHz detuning24. We have about 2.5mW of laser power available on eachMOT axis, collimated to a waist of about 3mm. The saturation intensity Isat = πhc/3λτon this transition is Isat = 3μW/cm2, yielding a maximum intensity of 2000 Isat for ourexperimental setup. Here, τ = 21μs is the lifetime of the 3P1 state. Considering a scanrange of 5MHz comprising 250 comb lines at a spacing of 20 kHz, the intensity per combline is about 10 Isat. We apply this broad-band red MOT already during the repumpingprocess. The quadrupole field gradient along the vertical direction is quickly ramped to∂B/∂z = 1.15G/cm. This capture phase lasts 50ms and is rather robust: the lifetime ofthis MOT exceeds 1 s.
It is helpful to visualize the geometric region in which atoms interact with the MOT light:in the case of narrow-line cooling, the detuning Δ is much larger than the natural linewidth,Δ � Γ. The light is only resonant with the atomic transition in regions where the B-fieldinduced Zeeman shift Δν = mJgJμBB balances the detuning. Here, μB = 1.4MHz/G isthe Bohr magneton, and the Lande g-factor is gJ = 1.5 for the 3S1 state. This regionis the surface of an ellipsoid, where the vertical radius ζ of this ellipsoid is given by ζ =Δ/(mJgJμB ∂B/∂z). Typical sizes are about 4mm for a gradient of 1G/cm and a detuningof 1MHz, but only 100μm for a detuning of 3 Γ ≈ 20 kHz. The thickness of such a shell ison the order of 10μm for a small saturation parameter s = I/Isat. As we apply a frequencycomb that stretches from near-zero to −5MHz, atoms can get into resonance with the lighton 250 narrow, but overlapping shells, filling the entire volume of the ellipsoid25. For eachshell, Δ � Γs ≈ Γ. The maximum acceleration due to photon scattering is Γ · �k/2m. Forthe case of Sr, this value is 16-times larger than gravity, thus gravity starts to play a role.
In a second phase, we narrow the scan range down to 2MHz, where the comb line closestto resonance is 100 kHz red-detuned to the transition. During this phase of 200ms, the totallight intensity is reduced to about 100 Isat (corresponding to about Isat per comb line), andthe magnetic field gradient remains unchanged. Afterwards, we jump to single-frequencyoperation with a detuning of −800 kHz. The parameters of this phase are rather insensitive,
24The scan rate can be varied between 5 and 35 kHz without a decease in capture efficiency. Similarly, thelower boundary of the scan range can be varied between −3 and −10 MHz, depending on the available laserpower. The highest frequency comb line must not be blue-detuned to the atomic transition.
25The optimization of our MOT is likely to be influenced by the small height of our glass cell, which theatoms fill entirely. Experiments with large steel chambers might operate at slightly different parameters.

2.7. Optical cooling procedure 43
e.g. a reduction of the scan range to 4MHz within 100ms will produce a similar result. Thevariation of intensity and detuning, as well as the evolution of atom number and temperature,are depicted in Fig. 12.6.
In the third stage, which we call the single-frequency MOT, we shift the frequency veryclose to resonance while reducing the intensity dramatically to 0.5 Isat
26. This stage lasts200ms and is concluded by a 50ms wait at the final parameters. It is important to under-stand that the MOT is driven through very different regimes during this ramp: We beginin the condition |Δ| � Γsat � Γ, where Γ is the natural and Γsat = Γ
√1 + s the intensity-
broadened linewidth. Atoms are in resonance with the light on a single shell, whose thicknessis enlarged by the factor
√1 + s compared to the low-intensity case. The large intensity en-
sures that the scattering rate is high enough to keep the atoms in the MOT, and lifetimes aretypically 400ms. In this regime, the behavior of the atoms can be described semiclassically[Lof04b], and the expected temperature is T = �Γsat/2kB
27. Note that this temperature isindependent of the detuning, and set only by the light intensity. In a simplified picture, thedecrease of the detuning provides compression, and the decease in intensity provides cooling.
At the end of this stage, the detuning becomes comparable to the linewidth, and sapproaches unity: |Δ| ∼ Γsat ∼ Γ. The behavior of the atoms is determined by single photonrecoils, and the system requires a full quantum treatment [Cas89]. The temperature limitapproaches Tr/2. There is, however, a compromise between atom number and temperature.A temperature of Tr/2 is reached only for very low intensity, accompanied by a very lowscattering rate28. Atoms live only on a very thin shell (the bottom of the ellipsoid) andinteract predominantly with the upward propagating beam; see Fig. 2.7(a). At low intensity,an atom is at risk to fall through this shell without absorption of a photon, and be lost. Thislimits the lifetime at this stage to a few 10ms.
In a final stage, the atoms are loaded into the dipole trap at 1064 nm. At this wavelength,AC Stark shifts reduce the energy of both the 1S0 and
3P1 states, but are stronger for the1S0
state (see [Kat99] and [Boy07a] for calculations), therefore atoms in the center of the trapsee the MOT light further red-detuned. To cool atoms into and inside the dipole trap, wesweep the laser frequency about 40 kHz into the blue while reducing its intensity to zero overa ramp time of 50ms. This stage is crucial for efficient loading of the dipole trap, and we areable to transfer 50% of the atoms from the single-frequency MOT into the dipole trap. Theattainable temperature is limited by heating due to the re-absorption of photons, and wetypically achieve temperatures around 800 nK with about 107 atoms for 84Sr, correspondingto a phase-space density of about 0.1. The temperature in the dipole trap strongly dependson the density and the scattering behavior of the atoms, and can be as low as 400 nK forthe non-interacting isotope 88Sr or equivalently 84Sr at very low densities. A full accountof limitations to the maximally attainable phase-space density, including a discussion andreferences, is given in Chpt. 12.
Note that the light is still far detuned from the bare atomic transition, and that theatoms occupy the shell of an ellipsoid with a size of a few 100μm, not its volume. The
26Unlike all other groups, we do not increase the magnetic field gradient here.27This simplified equation lacks a numerical factor of about 2, see [Lud08a].28In other species with an even smaller linewidth, such as Ca and Mg, this scattering rate needs to be
increased by quenching of the 3P1 state.

44 Chapter 2. Strontium: an alkaline-earth element
(b)
100 μm
(a)
200 μm
Figure 2.7: Narrow-line MOTs of (a) the bosonic 88Sr and (b) the fermionic 87Sr isotopes,shown by in-situ images in the horizontal direction. In case (a), we operate at Δ = −50 kHz,I = Isat and ∂B/∂z = 1.15G/cm. The atoms occupy the shell of an ellipsoid with verticalradius ζ = Δ/(gJμB∂B/∂z), which is 210μm in this case. The white ellipse is a guide to theeye. In the fermionic case (b), we operate at Δtrap ∼ Δstir ∼ Γ and Itrap ∼ Istir ∼ Isat, andthe atoms occupy the volume of an ellipsoid with only minuscule sagging. The aspect ratioof the white ellipse is identical to the value of the anisotropy ∂B
∂z/∂B
∂rof the quadrupole field
given in Chpt. 3.2. The difference in shape is a direct consequence of the MOT dynamics;see the text for details. The atom number is 1.3(1)×106 in both cases, and the temperatureis about 700 nK. Note the different length scales.
vertical position of the horizontal dipole trap beam determines the spatial reference point,and an additional homogeneous offset B-field is used to shift the atoms into this position.The overlap of the dipole trap with the resonance position of the atoms is sensitive to about100μm in the horizontal plane29 and, more importantly, 10μm in the vertical direction,which requires a high stability of both the B-field (around 200μG for our current setup) andthe laser frequency (below 500Hz). The curvature of the quadrupole field sets the density ofthe cloud, which is a rather sensitive parameter as well. Generally, the details of the shapeand loading procedure of the dipole trap highly depend on the atomic scattering properties,which are different for all isotopes. Details are given in Chpts. 2.7.4 and 3.5.4.
Fermions
The bosonic isotopes, for which we have discussed the red MOT dynamics in the previoussection, have nuclear spin I = 0 and therefore only one magnetic substate in the 1S0 groundstate. The fact that the magnetic moment gJμB is zero due to the singlet configuration of
29The position of the MOT also depends on the light forces of the six MOT beams, where the verticallydownward propagating one can safely be omitted. As a result of insufficient balancing of the retro-reflectedMOT beams, the MOT position changes as the intensity is reduced. While doing so, the offset B-field needsto be constantly adapted in order to keep the MOT overlapped with the position of the dipole trap. We callthis the high art of magnetic tracking.

2.7. Optical cooling procedure 45
the two valence electrons (J = 0) did not become apparent. This however changes as weconsider the fermionic 87Sr isotope with I = 9/2 and its ten magnetic states. The magneticmoment is now given by the nuclear moment, which is still orders of magnitude smaller thanan electronic magnetic moment. To understand the implications of the unusual condition ofJ = 0 and I �= 0 in the ground state, let us look at a conventional alkali MOT first. Forsimplicity, we will only consider the behavior along one dimension x.
An atom gets into resonance with the σ+-polarized cooling light (and experiences arestoring force) at a position where the condition
hΔ = ((m ± 1)ge − mgg)μBB(x) (2.1)
is fulfilled. Here, m is the ground-state magnetic quantum number of the atom, and gg and ge
are the Lande factors of the ground- and excited states. The ± sign denotes interaction withσ+ and σ+-polarized light from the two counterpropagating MOT beams; see Fig. 2.8(a).The B-field is usually proportional to the position along one axis, B = αx, and Δ is thedetuning from resonance, with Δ < 0 for red detuning. As long as the right side of Eqn. 2.1is positive for all m, there will be a restoring force for any spatial position. This leads to theconditions
F
F + 1<
ge
gg
<F
F − 1for F → F + 1 transitions
F − 1
F<
ge
gg
<F
F − 1for F → F transitions (2.2)
for stable MOT operation, which are readily fulfilled for alkali MOTs30. This situationis depicted in Fig. 2.8(a): The Zeeman shifts of the ground and excited states are similarenough such that circularly polarized light is nearly resonant with all possiblemF → (mF±1)transitions, especially considering the large linewidth of a few MHz. The textbook MOTdiagram in Fig. 2.8(b) with red detuning of a few linewidths reveals that the resonancecondition for the different mF → (mF ± 1) transitions is only slightly position-dependentand leads to a restoring force over the entire range.
This situation is very different for the alkaline-earth elements, where ge/gg � 1. The 1S0
substates are almost degenerate, and a light field at a given magnetic field can be resonant,blue-detuned, or red-detuned depending on the lower mF state; see Fig. 2.8(c). Consideringthe varying B-field of a MOT, the resonance position is different for all mF → (mF ± 1)transitions; see Fig. 2.8(d). Even more importantly, some transitions expel the atom fromthe center of the trap. This is shown in the simplified diagram in Fig. 2.8(e). We considera ground-state atom in the mF = 9/2 state. The beam with σ+-polarized light can drivea transition to the mF ′ = 11/2 state, which would push the atom towards the trap center,while the σ−-polarized beam can drive a transition to the mF ′ = 7/2 state, which wouldpush the atom away from the center. The probability of these processes is given by theClebsch-Gordan coefficients (Fig. 2.8(f)), which grow with |mF | for the mF → (mF ± 1)transitions with σ±-polarized light. In the most extreme case, which is the one shown in
30For the F = 2 → F ′ = 3 MOT transition in Rb, gJ(52S1/2) ≈ 2 and gJ(52P3/2) ≈ 4/3, resulting in2/3 < 2/3 < 2 for the above condition.

46 Chapter 2. Strontium: an alkaline-earth element
(a) (b)
(c)
Rb
ge / gg ~ 1
Sr
ge / gg >> 1
� mF� �1
mF´
B � x
11/29/27/25/23/21/2
-1/2-3/2-5/2-7/2
-11/2-9/2-7/2-5/2-3/2-1/21/23/25/27/2
mF=9/2
11/2
(d)
(f)(e)
52S1/2
52P3/2
1S0
3P1
1015
1510
206
283
620
351
135
328
45 55
45
55
mF´
� mF� �1
�
�
� �
� �
B � x
��
B � x
��
7/2
-9/2 -7/2 -5/2 -3/2 -1/2 1/2 3/2 5/2 7/2 9/2
Figure 2.8: Principle of the fermionic red MOT. For the paradigmatic F = 2 → F ′ = 3 RbMOT (a and b), the spatial position of the resonance (grey bar) is almost independent ofthe specific mF state. This is very different for 87Sr (c and d), where a given frequency canbe both blue- and red-detuned for different mF transitions. Atoms in an unfortunate statecan be pushed away from the trap center (e), and effective trapping is achieved by averagingover the polarization-dependent Clebsch-Gordan coefficients (f); see the text for details.

2.7. Optical cooling procedure 47
Fig. 2.8(e), the ratio of the restoring vs the expulsive force is 55 : 1. As with all MOTs,stable trapping is achieved by an averaged restoring force over many absorption processes.In this case, stable trapping is guaranteed by the favorable transition probability differencefor σ±-polarized light.
The restoring force is maximized for atoms in the mF = 9/2 state on the left-hand sideof the diagram. However, if this atom happens to be on the right-hand side of the diagram,i.e. at positive B-field, it cannot get into resonance with either of the two light fields anywherein this hemisphere, and is lost from the trap31. A fast randomization of mF states would bedesirable to avoid the loss of such atoms from the trap. Narrow-line MOTs do not provideefficient randomization, as already a few photon recoils move the atom out of the resonanceregion set by the small linewidth. A second MOT beam driving the F = 9/2 → F ′ = 9/2transition is used to thoroughly stir the mF states of the atoms. This “stirring” light issuperimposed with the “trapping” light of the F = 9/2 → F ′ = 11/2 transition and red-detuned such that the regions of resonance overlap. The Zeeman shift of the F ′ = 9/2 stateis about five times smaller than that of F ′ = 11/2 state, thus broadening the resonanceregion by the same factor.
Note that the resonance position of each of the mF → (mF ± 1) transitions is different,such that the two MOT beams are resonant with the mF states on different shells. Theseshells merge for a small detuning Δ or a large saturation parameter s. The atoms occupythe volume of an ellipsoid, unlike in the bosonic case, where atoms are found only on thelower surface of the ellipsoid; see Fig. 2.7.
The first experimental realization of the fermionic red MOT of Sr has been achieved bythe Tokyo group and beautifully described in [Muk03]. Following the MOT cooling, atomshave been loaded into a 1D lattice, optically pumped into one spin state, and further cooledclose to the recoil limit, corresponding to T/TF = 2. In the following, we will briefly describeour experimental parameters, which are slightly different to those of the Tokyo and JILA[Boy07a, Lud08a] experiments.
Just as in the bosonic case, we use the maximum available power on both the trappingand stirring beam to capture the atoms emerging from the metastable reservoir. Conditionsfor the broad MOT are identical to the bosonic case described above. As we move the single-frequency MOT towards resonance and reduce the intensity, we find that larger intensitiesare needed compared to the bosons. Final conditions of the red MOT are a gradient fieldof 1.15G/cm, trapping and stirring beam intensity of a few Isat, and detunings of a fewlinewidths. We add a short wait time of 50ms to ensure equilibration and attain typicaltemperatures of 800 nK with 107 atoms.
Loading of both bosons and fermions into an optical dipole trap is slightly complicatedby the fact that bosons and fermions do not reside in the same position: The shell of bosonicatoms is located up to 500μm below the cloud of fermionic atoms. We first load the fermionsinto the dipole trap by ramping both trapping and stirring beams towards the blue, whilereducing both of their intensities to 0.6 Isat over 100ms. During this entire time, the detuning
31Remember that the detuning is much larger than the linewidth. Note also that the situation describedhere is the same for mF = −9/2-state atoms at negative B-fields and applies also to all other states on the“wrong” side.

48 Chapter 2. Strontium: an alkaline-earth element
(b) (c) (d) (e) (f)
(h) (i) (j) (k) (l) (m)
(a)
B
in-situ
g(g)
� = 0 kHz � = 60 kHz � = 130 kHz � = 60 kHz � = 55 kHz � = -120 kHz
Figure 2.9: Formation of momentum state crystals at blue detunings. The top (bottom)row shows absorption images in the vertical (horizontal) direction. Images (a) and (g) showin-situ images of the atomic cloud, the white arrows indicate the direction of the molassesbeams. Images (b) - (d) and (h) - (j) are taken with different detunings of the laser pulse.A B-field along one axis was applied in (e), and (k) and (l) show the appearance of two andthree lattice points in the vertical direction. Panel (f) illustrates the geometry of a unit cell,and (m) shows the scenario of levitation at red detuning. Imaging is performed along thecrystal axes, the height of each absorption image is 4mm.
of the bosons is large, such that the two clouds do not overlap. The beams for the fermionsare switched off, and the center of the quadrupole field is lifted upwards to superimpose thebosonic atoms with the dipole trap. We find that the loading efficiency of the two isotopesis reduced by around 10% compared to the individual case.
Momentum state crystals
While investigating the dynamics of the red MOT, we accidentally re-discovered the phe-nomenon of momentum state crystals at blue detuning. Later, we discovered the extensivework by the JILA group on this topic, and recovered their findings. While working with25-times colder samples, we extend their description to the case of non-vanishing magneticfield and connect to the phenomenon of levitation for red detuning.
Let us start out with the experimental observation: We use a standard red MOT toprepare > 107 atoms of bosonic Sr at a temperature of 500 nK. The MOT light and thequadrupole field are switched off. A 4-ms wait time, in which the atoms drop due to gravity,ensures that the quadrupole field has decayed to less than 300mG/cm, while the offsetfield is set to zero with an uncertainty of 10mG. We then flash all three retro-reflectedMOT beams (which form a molasses in this case) onto the atoms (pulse duration 12ms,intensity I = 5(1)Isat) and take absorption images in the horizontal and vertical directionsimmediately after. Interesting density distributions occur in dependence of the detuning ofthe molasses beams. We will focus on the dynamics in the horizontal plane first, since thebehavior in the vertical direction is perturbed by gravity, changing the atom’s velocity.

2.7. Optical cooling procedure 49
While the cloud of atoms remains undisturbed by the molasses beams at near-zero detun-ing (see Fig. 2.9(b)), we observe the appearance of remarkably well-defined clouds of atomsin a symmetric pattern as we go to blue detunings of about 50 kHz; see Fig. 2.9(c). At firstsight, this is very reminiscent of superradiance [Ino99, Koz99], especially since the atomsfollow strictly the directions of the molasses beams32. However, as explained in [Lof04b] and[Lof04a] by a semiclassical model and numerical calculations, the separation into well-definedmomentum states can be understood in terms of detuning-dependent absorption of photons,and does not involve coherent or collective behavior. We will give only a qualitative sketchhere and refer to the literature for a quantitative description.
The atoms in the red MOT are already cooled to the Doppler limit and can hardlybe decelerated further. However, they can certainly be accelerated by blue-detuned light.Subjected to the six molasses beams, the atoms will be preferentially accelerated, since thisprocess provides positive feedback, whereas deceleration does not: Once an atom has beenaccelerated by a blue-detuned beam (which is initially about ten linewidths and about 20recoil frequencies detuned from resonance), it comes closer to resonance with this beam,and is more likely to be accelerated further. For a sufficiently long pulse, the accelerationcontinues up to a final velocity vf = (Δ+Γ
√1 + s/2)/k, where Δ = ωL−ωA is the detuning,
Γ = 2π × 7.4 kHz is the linewidth, s = I/Isat denotes the saturation parameter, and k isthe wave vector of the light field [Lof04a]. The atoms are not accelerated beyond vf , asthey fall out of resonance with the molasses beams at this velocity. The final velocity isindependent of the initial velocity and position, atomic mass, offset B-field, and interactionbetween the atoms33. Indeed, it depends only on the detuning Δ and the additional termrepresenting the intensity-broadened linewidth. Both terms are about equal in our case,while the latter term was dominating in the JILA experiments34. It is remarkable that thefinal velocity spread of each cloud can be smaller than the initial one. The separation ofthe clouds could be increased further by increasing Δ, s, the length of the pulse t, or thesubsequent time-of-flight tTOF. In our case, we are limited by the field of view of the imagingsystem.
We observe the appearance of four “momentum states” in the horizontal plane, corre-sponding to the directions of the four molasses beams. Each atom’s selection of the final mo-mentum state is of a stochastic nature in the early phase of the acceleration pulse: Whicheverbeam excites an atom first is likely to excite the atom another time and accelerate it intoits direction. This probability of photon absorption along one axis certainly depends on therelative intensities of the two counterpropagating beams, especially for small s. The distri-bution of atoms into the two momentum states after acceleration is thus a very sensitiveprobe of the intensity imbalance of a pair of counterpropagating beams, as small differencesare amplified. This is visible in our experimental data: In many images of Fig. 2.10, there isan imbalance of atom number along one of the two directions. One of our horizontal MOT
32Remember that superradiance does not require a degenerate sample. The coherence time needs to belarger than the superradiant decay time, which is the time between successive Rayleigh scattering events.
33We observed momentum state crystals with all bosonic isotopes, having near-zero, moderate, and larges-wave scattering lengths.
34In the case of small Δ and large s, one can think of the Δ providing the seed and the s ensuring theamplification.

50 Chapter 2. Strontium: an alkaline-earth element
axes is also used for imaging purposes and contains lenses and polarization optics. Theseattenuate the retro-reflected beam, leading to a reduced intensity of the reflected beam.This is not the case for the other horizontal MOT axis, proven by the roughly equal atomnumbers along the corresponding direction.
As we increase the detuning further, it becomes more and more likely for atoms to notabsorb a photon and therefore not undergo the positive feedback to end up in an excitedmomentum state. This is shown in Fig. 2.9(d). Atoms that have undergone accelerationinto both horizontal axes are found at any of the four corners of the square. Atoms thathave “locked” to only one of the beams are located on the sides of the square, while entirelyuntouched atoms occupy the center of the square. The population of the center increases aswe increase the detuning, and finally converges into the unperturbed case of large detuning.
When generalized to three dimensions, the atoms are located at the corners of a simplecubic unit cell, hence the name “momentum state crystal”. The dimensionality of the crystalcan be reduced either by the omission of pairs of beams, or by the application of a strongenough B-field along one direction. The latter case is shown in Fig. 2.9(e).
Along the vertical direction, the situation becomes more complex due to the influenceof gravity. Atoms falling downward with gravity naturally get into resonance with thedownward propagating beam at some point. Thus, there is an underlying bias which willalways favor the downward-propagating over the upward-propagating beam, making themomentum states pointing downwards more populated than the ones pointing upwards.This is seen in typical sideview images such as Figs. 2.9(h)-(j), in which only the lowermomentum states are populated. It is, however, possible to find configurations in which two(Fig. 2.9(k)) or three (Fig. 2.9(l)) momentum states are occupied.
We will now make a connection to the case of large red detuning. In this case, the atomsare cold enough such that they never get into resonance with the laser beams, except for theone pointing upwards: The atoms fall downward with gravity until they come into resonancewith that beam, which transfers upwards pointing momentum kicks to the atoms that cancelthe force of gravity. The atoms are levitated in a very well-defined cloud without heating,see Fig. 2.9(m). One observes that the location of the atoms after a certain pulse lengthmoves downward as one goes to larger detuning.
In summary, we have discovered a sequence of clearly distinguishable scenarios: goingfrom blue to red detuning, we observe the formation of an immature crystal turning into afully stretched crystal followed by the unperturbed case on resonance, the levitation at reddetunings, and the unperturbed case for even larger red detuning.
Let us now consider the case of nonzero offset B-field. The 3P1 state splits into threemJ magnetic sublevels with Zeeman shifts of Δν = mJgJμBB, with gJ = 1.5 and μB =1.4MHz/G. We apply a B-field in the vertical direction and set its strength such that theinduced Zeeman splitting exceeds the typical range over which the formation of momentumstate crystals and levitation are observed. The atoms can interact with the light fields inthe vicinity of each of the three resonance positions. This can be seen in Fig. 2.10: Goingfrom blue to red detuning, the sequence of scenarios described above repeats itself aroundeach of the three mJ -state resonance positions. Note that perfect levitation occurs only

2.7. Optical cooling procedure 51
detu
ning
(kH
z)
0
200
100
-100
B-field (mG)
mJ‘ = 0
mJ‘ = 1
mJ‘ = -1
Figure 2.10: Three sequences of absorption images taken in the vertical (left columns) andhorizontal (right columns) directions. The sequences are taken in presence of a verticalmagnetic fields with a value of around 0, 40, and 80mG. The detuning of the molassesbeams changes by 20 kHz between consecutive image pairs.
52 Chapter 2. Strontium: an alkaline-earth element
for frequencies that are red detuned to all three transitions. Not surprisingly, the situationbecomes very unclear when the Zeeman splitting is of the same value or smaller than thepreferred detuning for crystal formation or levitation. In these cases, different processescompete and lead to a mixture of momentum states that lack the beauty of symmetry.
The momentum state crystals are not unique to bosons, but appear for fermions as well.This is remarkable, given the complexity of the red MOT. Both the trapping and stirringbeams need to be employed, and given a suitable choice of parameters, the momentumdistributions are exactly identical to the ones of the bosons presented in Figs. 2.9 and 2.10.
2.7.4 Loading of the dipole trap
We will now elaborate on the transfer of atoms into the optical dipole trap. Our knowledgeabout this delicate process evolved over time, and different trap shapes were used for thework presented in the following chapters. Here, we will present the most recent status, whichwas used for the measurements in Chpts. 8, 11, and 12. The details of the evaporation itselfdepend strongly on the isotope or isotopic mixture used and will not be presented here. Theactual setup of the dipole trap is described in Chpt. 3.5.4.
The shapes of the bosonic and fermionic red MOTs are very different; see Fig. 2.7. In thebosonic case, the atoms occupy the surface of an ellipsoid, where the resonance conditionΔ = δmJgJμBB is fulfilled. The force of gravity is comparable to the restoring light force,and atoms accumulate on the lower part of the shell [Kat99, Lof04b]. The size of the shell,and thus the density of the cloud, is set by the detuning Δ and the B-field gradient, whichis ∂B/∂z = 1.15G/cm in our case. We typically operate at a detuning of 150 kHz ≈ 20 Γ,such that the atoms are located about 600μm below the quadrupole center, forming a discof about 500μm diameter.
The fermionic red MOT operates very differently due to the multitude of Zeeman statesand the large difference between ground- and excited-state gF factors. The atoms occupythe entire volume of an ellipsoid, where the circumference is again set by the detuning andB-field gradient. We operate the MOT very close to resonance to achieve densities similarto the bosonic case. The positions of the bosonic and fermionic red MOTs are thus verydifferent, which has implications for dipole trap loading.
We will now describe the loading of atoms into a crossed dipole trap, consisting of ahorizontal and a near-vertical beam. The main contribution to the trapping potential stemsfrom the horizontal trapping beam. This beam supports the atoms against gravity, sets thetrap depth, and thus determines the evaporation trajectory. It is derived from a multimode 5-W Yb-doped fiber laser operating at 1065 nm. The light intensity is set by means of an AOMbut not actively stabilized. A polarization-maintaining single-mode optical fiber behind theAOM is used for mode-cleaning. The transfer of atoms from the red MOT into the dipoletrap can be optimized by proper mode-matching. Since the red MOT is pancake-shaped, wesend the horizontal dipole trap beam through a cylindrical telescope to make it elliptic inshape. The beam is then focused onto the position of the atoms. In its focus, it has a verticalwaist of 17μm and a horizontal waist of 240μm, thus an aspect ratio of about 14. Withthe typical power of 2.0W used for loading of the dipole trap, this corresponds to trapping

2.7. Optical cooling procedure 53
frequencies of ωvert = 740Hz in the vertical, ωtrans = 50Hz in the transverse (horizontal),and ωax = 7Hz in the axial (horizontal) directions and a trap depth of kB × 13μK. Thesebeam parameters are unchanged for all experiments presented in this work, and we will staywith this naming convention of trap frequencies even if further trapping beams are added.The elliptic horizontal beam provides sufficient confinement against gravity, but only littleconfinement in the horizontal plane, leading to a relatively low average trap frequency ofω = 65Hz at the beginning of evaporation.
During evaporation, atoms will leave the trap predominantly vertically downwards, aidedby gravity. The evaporation efficiency benefits from a high vertical trap frequency: once ahigh-energy atom is produced in a collision, it can escape the trap before colliding withanother atom. The vertical trap frequency should thus be large compared to the scatteringrate: this requirement suggests a pancake-shaped trap. It is fortunate that both the loadingof the dipole trap and the evaporation efficiency are optimized with the same trap shape.
The low average trap frequency ω is very well suited for atoms with negative or largeand positive scattering lengths or samples of high atom number, as we will see later. Insome cases, however, an increase in confinement and density is desired. For this purpose,we add a vertically propagating beam to provide confinement in the horizontal plane, butnot against gravity. This beam is derived from another 5-W laser source identical to the oneused for the horizontal beam. To cover a broad range of beam sizes, we use two independentvertical beams, tilted to each other by less than 30mrad, and overlapped on the position ofthe atoms. These beams are focused onto the atoms by a common spherical lens, but arecollimated to different waists on this last lens, such that the waists of their foci are different,typically by a factor of five. These trapping beams are sent through optical fibers, and thechoice of the outcoupler allows for a simple and reliable adjustment of the beam size indiscrete steps. The size of each beam on the atoms can be set between 20μm and about300μm, with typical waists of 55μm. The focusing lens is mounted on a translation stage,and the vertical position of the focus can be adjusted with an uncertainty of about 100μm.Moving this lens allows for fine-tuning of the beam size at the position of the atoms. Due tooptical restrictions, the two beams are not exactly vertical but propagate at an angle of 22◦
with respect to gravity. The trap frequencies are measured by excitation and observationof sloshing modes along the three principal axes. The precision of these measurements isusually about 10−3. The precision in the calculation of the dipole trap waists is restrictedto a few percent by incomplete knowledge of the exact laser beam powers.
The dipole trap is turned on from the beginning of the red MOT, and atoms are continu-ously loaded into the dipole trap once spatial overlap is achieved and the temperature dropsbelow the trap depth. We reach a transfer efficiency of about 50% while maintaining thetemperature of the MOT. Once the atoms are loaded into the dipole trap, the MOT light iskept on for another 100ms at an intensity of about 0.5 Isat. During this time, the atoms arepushed into the center of the dipole trap by the horizontal MOT beams, thereby increasingthe density. For the bosonic case, the quadrupole center is placed about 600μm above thehorizontal dipole trap beam. The detuning of the cooling light from the Zeeman-shiftedand light-shifted σ+-resonance position is about −3 Γ. In the fermionic case, the quadrupolecenter is overlapped with the dipole trap. Working with a mixture of bosonic and fermionic

54 Chapter 2. Strontium: an alkaline-earth element
isotopes requires a sequential loading scheme, in which we load the Fermions first and thenshift the quadrupole center upwards to load the Bosons.
As for the red MOT, we find that the attainable temperature depends on the densityand interaction between the atoms. In the following, we will address two important details:the light shifts induced by the dipole trap, and the stability of the experiment required foroptimized transfer.
A systematic effect influencing in-trap cooling is the differential light shift between thetwo states involved, and a careful consideration is indispensable. During the cooling, atomsinteract predominantly with the upward propagating, circularly polarized MOT beam. Dif-ferent polarizabilities of the ground and excited state lead to a position-dependent detuningacross the sample, which needs to be minimized for optimal performance. The so-calledmagic wavelength, at which the light shifts of the two states are equal, would be at 915 nm[Boy07a] for a dipole trap with π-polarization. At a wavelength of 1065 nm and for typicalintensities used in our experiment, differential light shifts can reach 100 kHz. These shiftscan be reduced, however, by choice of the correct polarization. The B-field at the positionof the atoms is oriented vertically, and we set the linear polarization of the horizontal beamto be vertical as well. The vertical beams are set to the opposite circular polarization of theupward propagating MOT beam. Using narrow-line absorption imaging (see Chpt. 7), theshifted resonance position can be measured with an uncertainty of about 1 kHz. By optimiz-ing the polarization of the dipole trap beams, the differential light shift of the trapping beamcan be reduced to below 20 kHz for all settings used in our experiments. In a typical trapused for evaporative cooling, the atoms explore about one tenth of the trap depth. Usingthis value, we arrive at light shift of 2 kHz across the sample, which is comparable to thelinewidth of our laser.
The transfer of atoms from the red MOT into the dipole trap requires a good spatial over-lap in the vertical direction. Any displacement will reduce the fraction of transferred atomsand increase the temperature of the sample. The quadrupole field of the MOT amountsto 1.15G/cm in the vertical direction, and a shift of 1mG in the offset B-field displacesthe atom cloud already by 9μm. Similarly, a shift of the cooling laser frequency by 1 kHzdisplaces the cloud by 4μm. Comparing these values to the vertical waist of the horizontaltrapping beam (17μm) gives an estimate on the required stability of the B-field and theabsolute laser frequency.
In our experiment, we measure the dependence of the temperature of the sample in thedipole trap on the detuning of the cooling light to be 25 nK/kHz over a range of 20 kHz.Knowing this dependence, we can relate the shot-to-shot variation of the temperature to avariation of the detuning of the cooling light at the position of the atoms. We measure anrms noise in temperature of about 10 nK for a series of a few dozen experimental runs, whichtranslates to a stability of the absolute laser frequency of better than 400Hz over the courseof about an hour. The same variation can be caused by a B-field fluctuation of 200μG 35 ora rotation of the polarization of any dipole trap beam by a few degrees. Our shot-to-shot
35A similar value for the B-field stability will be derived from a different measurement in Chpt. 3.

2.7. Optical cooling procedure 55
reproducibility of the atom number is about 1%.Another important parameter is the lifetime and heating rate of atoms confined in the
dipole trap. We measure the lifetime of a dilute sample of atoms after evaporation in aslightly re-compressed trap to be 2 minutes, much longer than typical evaporation timescales.The heating rate is too small to be quantified and estimated to be below 1 nK/s.
We have shown that the use of one horizontal and one vertical beam gives independentcontrol over the trap depth (horizontal beam) and the density of the sample (vertical beam).This is an ideal setting when working with different isotopes of Sr, which have very differentscattering lengths; see Tab. 2.4. Tuning of the scattering behavior is hampered through theabsence of magnetic Feshbach resonances, while optical Feshbach resonances were shown tobe accompanied by strong losses [Bla11b]. This leaves the density as the only adjustableparameter to improve evaporation efficiency. The scattering rate scales as ∼ a2n with thedensity n and the scattering length a, and a too-low density does not provide fast enoughevaporation to overcome heating and loss due to technical reasons. On the other hand,3-body losses scale as ∼ a4n2, which sets an upper limit to the density. From these tworelations, it becomes immediately clear that the optimum density for evaporation dependson the scattering behavior.
While we limit our discussions to cigar- and pancake-shaped dipole traps in this thesis,these are certainly not the only viable trapping geometry for the 84Sr isotope. By increaseof the horizontal confinement, one can match the horizontal and vertical trap frequencies,thus creating a nearly perfectly spherical trap: ωvert ≈ ωax ≈ ωtrans. If we increase thehorizontal confinement even further, such that the horizontal trap frequencies dominate,ωax, ωtrans � ωvert, the BEC is cigar-shaped with the long axis aligned with gravity, andexpands into a horizontal disc during time-of-flight. Using only the horizontal beam withthe cylindrical telescope entirely removed, the trap can have an aspect ratio ωtrans/ωax ashigh as 50 and contain a few 105 atoms.

56 Chapter 2. Strontium: an alkaline-earth element
Chapter 3
Experimental setup
The machine constructed within the framework of this thesis and described in this chapterhas been designed for quantum gas experiments from the very beginning. This approach isin contrast to most other Sr machines around the world, which are aimed for the operationof optical clocks.
The machine has been designed along the following guidelines:
• The vacuum in the UHV chamber should allow for long lifetimes of the atomic ensem-bles, keeping the collision rate with background atoms well below 0.1 s−1.
• A multi-species oven should allow for the operation with samples of different isotopiccomposition or elements at temperatures of up to 800 ◦C.
• The machine, in particular the Zeeman-slower, should have the potential to operatefor all alkali species and strontium.
• It should be possible to generate B-fields of a few 1000G and gradient fields of a few100G/cm.
• Good optical access should allow for all necessary MOT and imaging beams, dipoletraps, and lattices, while offering a resolution < 2μm in two orthogonal directions.
Great care was taken to construct the machine as stable as possible. Many sources ofnoise, heat, dust, or vibration, such as power supplies, certain lasers, water cooling, and airconditioning, have been moved to the basement floor below the lab. The temperature inthe lab is stabilized to within 0.1 ◦C. The lab contains two large optical tables: One of themsupports the vacuum chamber and a few laser systems, while most of the lasers are locatedon the second table.
A very similar machine, dedicated to the study of strongly interacting Fermi-Fermi mix-tures, has been constructed in Innsbruck from 2005 on, and we could greatly benefit fromthe developments made for that machine [Wil09]. In the following, we will describe some ofthe systems in detail: the design of the vacuum vessel, the coils to generate magnetic fields,and the laser systems.
57

58 Chapter 3. Experimental setup
gate valveglass cell
bellow
bellowbellow
ZS endwindow
atomic beam shutter
oven segments
transverse cooling window
spring-loaded rod
UHV sectionoven section
500 mm
x
z
y
Figure 3.1: Assembly of the vacuum chamber. The entire vessel and part of the supportstructure are shown, while most of the magnetic coils and protective housings are removed.A gate valve separates the oven section from the UHV section to allow for a rapid exchangeof the oven. The two segments of the oven used in this work are clearly visible.
3.1 Vacuum system
The layout of the vacuum system follows very closely that of the FeLiKx machine [Wil09].An overview is given in Fig. 3.1. The vessel is divided into two sections, separated by agate valve: The oven section contains the actual oven and differential pumping stages toprovide a high pressure gradient, and the UHV chamber contains the glass cell, in which theexperiments take place. This concept allows for a fast exchange of individual reservoirs oreven the entire oven without breaking the precious vacuum of the UHV section.
Oven section —We use the multi-species oven developed for the FeLiKx machine. Thisoven is a linear stack of multiple ovens, and produces a collimated beam of atoms that traveldown the main axis of the vacuum chamber, see [Wil09] and the Appendix C for details.It is attached to a CF63 cube which contains windows for transversal cooling on the topand bottom, and branches to a T and a cross on either side. These contain windows fortransversal cooling also in the horizontal axis, one 55 l/s ion pump, one Ti-sub pump, and avalve for initial pumping1. The Sr emanating from the oven and deposited on the walls of the
1We use CF 40 all-metal angle valve models 54032 and 57132 from VAT throughout, where the model54032 is certainly sufficient. The gate valve is model 48132. Ion pumps are from Varian Inc. (now withAgilent), and Ti-sub pumps are from VG Scienta.

3.1. Vacuum system 59
vacuum chamber acts as a supreme getter material and carries a large share in establishinga good vacuum already in the oven section. Counter-intuitively, the vacuum quality in theoven section improves when the oven is turned to higher temperatures.
The atomic beam passes through a first differential pumping stage of 108mm length and5mm inner diameter and enters into the second chamber made by a six-way CF40 cross withone 40 l/s ion pump and one Ti-sub pump. A valve allows for initial pumping, and a wobblestick is attached to a servo motor to make a motorized atomic beam shutter. A gate valveallows for a separation of the oven section from the UHV section, which is important forfilling or exchanging of the oven. The gate valve is followed by a second differential pumpingtube (137mm length, 6mm diameter), which helps to establish another factor of up to 100 inpressure difference. This entire oven section is mounted on a number of adjustable posts andconnected to the UHV chamber by a bellow, and can thus be moved and rotated in all sixdegrees of freedom. In this way, the oven flux can be directed precisely into the MOT region.
UHV section — The UHV section begins with the Zeeman-slower, which is about800mm long with an inner diameter of 14mm and acts as yet another differential pumpingstage. A welded bellow connects to the glass cell, whose front end is placed on a spring-loaded rod to make it free of any mechanical stress. The back part is rigidly fixed to asix-way CF63 cross. Details on the design of the glass cell can be found in Ref. [Wil09],the mounting procedure is described in Ref. [Flo]. Two 55 l/s ion pumps, one Ti-sub pumpand one valve are attached to this cross in the transverse directions. The atomic beamimpinges on a CF63 sapphire window through which the ZS beam is sent into the chamber.Precaution has been taken to avoid deposition of a reflective layer of Sr on this window.First, sapphire is used instead of standard glass as its surface is less sensitive to etching ofaggressive materials. Second, the window is placed inside a double-walled box and heatedto 150 ◦C to increase the chances of atoms to detach from the surface again2. Third, thewindow is mounted on a CF63 straight nipple, which is attached to the six-way cross by abellow, allowing the window to be moved in case part of the window becomes coated. Andfourth, the atomic beam shutter is opened only during the blue MOT phase, which reducesthe accumulated flux substantially.
To assess the vacuum quality, we routinely measure the lifetime of atoms in the metastable3P2 state held in a magnetic trap. The lifetime is around 30 s, with variations below 20%over years. This lifetime dropped to 20 s approximately one year after initial bake-out,and flashing the Ti-sub pumps immediately re-established the 30-s lifetime. Note that thismeasurement procedure is suitable only for relatively short vacuum lifetimes, as the lifetimeof the 3P2 state itself is only about 30 s in our experimental environment, likely limited byblack-body radiation. Once cold clouds in a dipole trap became available, we measured theirlifetime, and found it to be about 2minutes. This lifetime is also limited by off-resonantabsorption of photons and possibly 3-body loss, such that the vacuum lifetime might be evenlonger.
2A failure of the heating went unnoticed for a few days or weeks, during which a reflective coating ofabout 1 inch diameter formed already. Such coatings cannot be removed at reasonable temperatures of upto around 250◦C.
60 Chapter 3. Experimental setup
3.2 Magnetic field coils
Many quantum gas experiments require precise control of the magnetic field, often combinedwith the desire to reach comparably high fields or field gradients. Let us make a roughestimate on the target precision and magnitude of the field needed for the experiments laidout in Chpt. 1.
• Precision The magnetic substates of the 3P1 state in the bosonic isotopes experience aZeeman shift of 2.1MHz/G×mF . A field change of 2mG shifts a 1S0 → 3P1 transitionwith ΔmJ = ±1 already by more than half a linewidth. We therefore need a precisionand stability well below 1mG at low fields.
• Offset field One might envision optical pumping and state-resolved imaging of 87Srisotope on the blue transition. Splitting adjacent mF sublevels of the 1P1 state bymore than ten linewidths would require fields of a few kG, depending on the hyperfinestate. Another appealing goal is the exploration of RbSr Feshbach resonances. Theirpositions have been calculated to appear rather evenly spread over fields of up to a fewkG, and to grow in width when going to larger fields [Zuc10]. Such fields of a few kGare technically feasible.
• Gradient fields Performing magnetic Stern-Gerlach separation of fermions in the1S0 state requires very strong gradient fields, as the force acts only on the nuclearmagnetic moment, which is about three orders of magnitude weaker than an electronicmagnetic moment. Experiments with alkali atoms typically employ gradient fields ofa few 10G/cm, which would translate to insane gradients of a few T/cm requiredfor strontium. Large gradient fields are also required for some quantum computationschemes, in which single-site addressing is achieved by splitting neighboring lattice sitesby a few linewidths. A few 100G/cm would be both sufficient [Dal08] and technicallyfeasible.
In conclusion, we aim for a maximal magnitude of about 5000G (such coils can also beused to create gradient fields of more than 1000G/cm) and a precision of below 1mG at lowfields. The magnetic field strength in the center between two coils depends on the geometryof the coils as
B(z = 0) = IμBr2
(r2 + h2)3/2, (3.1)
where I is the current in the coils, r is the radius of the coils, and 2h is their distance. Itbecomes immediately clear that the size of and, more importantly, the distance between thecoils should be as small as possible. The coil design should also be as compact as possible tonot restrict optical access. We are very fortunate that such a coil system had already beendeveloped for the FeLiKx experiment (see [Wil09] for detailed documentation) and proved toreach a stability of 2mG at a field of a few 100G, corresponding to roughly 10−5 fractionalinstability. Our coil system is an almost identical copy of that one, but presently operatedwith weaker power supplies and reduced pressure on the water cooling system.

3.2. Magnetic field coils 61
coil N Idesignmax [A] B
I
[GA
]∂B∂zI
, ∂B∂rI
[G
cm A
]B◦
max [G] (∂B∂z)◦max
[Gcm
]Feshbach 30 1200 3.28 0.52 0.28 ∼ 600 ∼ 100Curvature 10 600 1.51 0.64 0.35 ∼ 400 ∼ 200Fast 6 200 1.06 ∼ 20Anti-Curvature 5 20 ∼ 0.8 ∼ 20Offset X 40 16 0.281 4.5Offset Y 40 16 3.17 50Earth Comp X 10 16 0.081 1.3Earth Comp Y 10 16 0.038 0.6Earth Comp Z 10 16 0.159 2.5FeLiKx Comp X 3 0.25 0.021 ∼ 0.005FeLiKx Comp Y 1 0.25 0.079 ∼ 0.02FeLiKx Comp Z 1 0.25 ∼ 0.2 ∼ 0.053rd ZS 14 200 ∼ 0.03 ∼ 130ZS Comp 8 200 ∼ 0.1 ∼ 130
Table 3.1: Magnetic field coils: the number of windings N per coil, design value of the max-imum current Idesign
max , calculated or measured field per current BIin Helmholtz-configuration,
field gradient per current in the vertical and horizontal directions ∂B∂zI
and ∂B∂rI
in anti-Helmholtz configuration, and the maximum field B◦
max and field gradient (∂B∂z)◦max of the
currently used configuration. Values are given for each pair of coils, except for the two ZScoils, which are not in Helmholtz-configuration and driven independently.
The heart of the coil system is composed of two pairs of coils in approximately Helmholtz-configuration3: The “Feshbach coils” and the “Curvature coils” are meant to generate largeand homogeneous B-fields4. When used in anti-Helmholtz configuration, these two coilsgenerate the quadrupole field of a MOT. A copper wire with a 4 × 4mm2 square crosssection and 2× 2mm2 square bore is used for these coils, and water-cooled from the insidewith a pressure of 8 bar. These coils are placed into two glass-fiber reinforced PVC boxesand fastened with epoxy. These boxes also contain two smaller coils with a small number ofwindings to allow for fast switching: the “Fast coils”, which are made of a 2× 2mm2 squarecopper wire with 1× 1mm2 square bore for water cooling, and the “Anti-Curvature coils”,which are made of flat copper wires with 1× 5mm2 cross section. Sets of RF coils are gluedonto the outside of the boxes, very close to the glass cell.
All coils mentioned so far lie in the horizontal xy-plane, generating fields in the verticalz-direction. To create offset fields in the horizontal directions, we wind coils onto rectangularframes around the glass cell. These are made of lacquered 1mm2 copper wire and receive
3A pair of circular coils with 2h = r generates a very homogeneous B-field at its symmetry point, whereall spatial derivatives up to ∂4B
∂z4 vanish; such a design is called Helmholtz-configuration. Two coils withcounterpropagating currents, placed at 2h =
√3, create a very uniform gradient field in the center, the
second and third derivative being zero. This is called anti-Helmholtz configuration. In this thesis, we willuse the terms “(anti-) Helmholtz configuration” for any coil geometry generating offset (quadrupole) fields.
4The Curvature coils are explicitly designed to create a field curvature ∂B/∂r = 0.2 G/(cm2 A) inHelmholtz configuration, which is important for the evaporation of certain species, such as lithium.

62 Chapter 3. Experimental setup
no cooling. Fields of more than 10G can be achieved in any direction, which is helpfule.g. for the optical Stern-Gerlach (OSG) experiment. All of the coils mentioned so far areequipped with IGBTs (Feshbach and Curvature coils) or relays to disconnect them entirelyfrom the power supplies. The direction of all fields can be changed with relays. In addition,the Feshbach and Curvature coils can to be toggled between Helmholtz and anti-Helmholtzconfiguration with sets of relays5.
We have not yet considered external perturbations to the magnetic field. These come intwo flavors: static and dynamic ones. Static fields stem from the (on small scales) homoge-neous earth magnetic field and the inhomogeneous B-field created by our ion pumps, bothof which are on the order of a few 100mG and add up to a field of about 500mG. Theyare canceled by large compensation coils made of 2.25mm2 lacquered wire, forming a cubeof about 1m3 size surrounding the experimental chamber. We null only the B-field at theposition of the atoms, not its gradient.
The time-varying B-fields are harder to control. The experimental cycle is synchronizedto the 50Hz line, which does not remove any line noise, but increases the reproducibilityof the experiments. We identify two major sources of disturbance: The FeLiKx machine,which is located about 5m away, and two elevators close to the laboratory, which are about5 and 7m away. Both create fluctuating fields of a few mG in the horizontal plane. Thesesmall field fluctuations are negligible during all but one stage in the experiment: the loadingof the dipole trap from the red MOT. The MOT is operated at a field gradient of 0.6G/cmin the horizontal direction. A field change of 3mG in the horizontal direction displaces thered MOT by 50μm, where the radius of the cloud is typically a few 100μm. Any change inMOT position leads to a significantly reduced number of atoms loaded into the dipole trapdue to a mismatch in position, nicely seen in Fig. 3.2.
There are a number of possible solutions: passive μ-metal shielding of the experimentalchamber, measurement of the B-field at different locations and active feed-back onto theexperiment, active feed-forward, and synchronization. We follow the feed-forward strategy.
A typical experimental cycle of the FeLiKx experiment involves MOT-loading with aquadrupole field and subsequent evaporation at a field of around 1000G. These two settingsgenerate very different stray fields in our lab. We use three analog outputs of the FeLiKxmachine to drive coils around the Sr experiment, compensating these stray fields. The coilsare added to the frames of the existing x and y offset coils. The conversion of currents sentthrough the coils at the FeLiKx machine and the adequate compensation at the Sr machinehas to be determined for all relevant coils in all relevant configurations. In this way, we wereable to reduce the influence of the FeLiKx machine to about the noise level induced by othersources.
5We use TDK Lambda power supplies models ZUP 6-132, GEN 6-200, and GEN 8-300 to generate currentsin excess of 100 A. Simple power supplies from EA (models EA-PS 3016-20 B and 3016-10 B) have initiallybeen used for smaller currents of up to 20 A, but proved to be too unstable. They have been replaced byTDK Lambda models ZUP 20-10 and ZUP 10-20. All power supplies are current-controlled via optocoupledanalog inputs of the computer control system. All currents are monitored using LEM current transducersfrom Danfysik, models IT60-S, IT150-S, and IT400-S of the Ultrastab series. Small PCB models from LEMof the type HX xx-P/SP2 have proven to be insufficient even for small currents.

3.2. Magnetic field coils 63
-150
-100
-50
0
50ho
rizon
tal r
ed M
OT
posi
tion
(μm
)
x-directiony-direction
FeLiKx experiment off
FeLiKx experiment running
FeLiKx experiment running, compensation on
typical elevator movement
1 2 3 4
Figure 3.2: The position of the red MOT is a sensitive probe of the B-field and its stability.We record the MOT position in a series of experimental runs, under the influence of strayfields from the FeLiKx machine (data sets 2 and 3) and a near-by elevator (set 4). PeriodicB-field changes of the FeLiKx machine and movements of the elevator are clearly visible. Aposition shift of 10μm, which is about our residual noise (set 3), corresponds to a B-fieldvariation of 600μG. The noise can approach 100μG on a quiet Sunday night (set 1). Thecycle time of the experiment is about 15 s.
We measure the position of each elevator with commercial distance meters placed belowthe elevators. These devices generate an output voltage proportional to the distance, makingthe implementation of a feed-forward system straightforward. This approach is currentlypursued.
Apart from these coils arranged around the glass cell, there are a total of four coilsused for the Zeeman-slower (ZS). We employ a spin-flip slower originally designed for alkaliatoms. The first section has a length of 600mm and carries a total of 1300 windings madefrom 1× 5mm2 copper wire. The vacuum tube is double-walled with cooling water flowingin the void, such that the ZS is water-cooled from the inside. The ZS is set into a sealedbox and flushed with air for additional cooling. The second (increasing-field) section has alength of 45mm and is made of the same 1× 5mm2 copper wire. It is capped with a shortyet strong coil of 12 windings of 4× 4mm2 square water-cooled wire that provides the steepcut-off of the field: the 3rd ZS coil. The field at the position of the MOT is compensatedby the ZS Compensation coil, which is similar to the 3rd ZS coil. Details of the design andrelated calculations can again be found in Ref. [Wil09].

64 Chapter 3. Experimental setup
3.3 Control system
The machine is steered by a control system developed by Florian Schreck, Todd Meyrath,and Gerhard Hendl. A C-based program equipped with a graphical user interface generatesthe experimental sequence, which is sent from the computer onto a bus system via a NationalInstruments NI6533 card. The communication is entirely digital; the clock cycle is 2MHz,and each piece of data contains 16 bits. Each bus can address 256 devices, where we havecurrently three buses installed. Each bus connects to various devices, such as analog anddigital outputs, analog inputs, and direct digital synthezisers (DDS) for the generation ofRF signals to drive AOMs. The DDS are home-built based on the AD9852 chip by AnalogDevices and generate any frequency between DC and 135MHz with 12-bit dynamic rangein amplitude. A complete documentation of this control system, which is successfully usedin many labs around the world, can be found in Ref. [Con].
3.4 Optical access
The experiments take place in a sophisticated glass cell. The cell is made of SpectrosilR©
2000, has a wall thickness of 5mm, and is not coated6. The inner height is 22mm, chosento guarantee good imaging resolution while at the same time keeping the distance betweenthe Helmholtz coils small. The design of the shape in the horizontal plane is guided by twodemands: two orthogonal axes should cross the windows at or near right angles and intersectin the center, while two of the four windows should be oriented such as to allow for a beamto pass through them at Brewster’s angle for operation of a high-power optical dipole trap.The resulting shape can be seen in Fig. 3.1 and is described in Ref. [Wil09].
The geometry of such a glass cell naturally suggests a system of three mutually orthogonalaxes to be used for the MOT- and imaging beams. We use 1-inch optics, and the clearaperture of these beams is 22mm. The MOT beams at 461 nm and 689 nm (as well as thefuture 780-nm beams for Rb) are overlapped with dichroic mirrors and sent through the sameachromatic λ/4 waveplate7, the MOT is retro-reflected. The MOT- and imaging beams aremultiplexed using polarization optics. We use f = 70mm GradiumR© lenses and f = 140mmstandard achromats to image the atoms onto the CCD cameras8.
It is convenient to introduce a coordinate system, which will also be used throughoutthis thesis. The positive x-axis coincides with the direction of the atoms travelling along theZeeman-slower, and the positive z-axis is given by gravity. The y-axis therefore lies in thehorizontal plane, coinciding with the horizontal dipole trap.
The axis originally planned for an optical resonator is now used for the horizontal dipoletrap. The vertical dipole trap axis is inclined by roughly 20◦ to gravity and enters the
6Our glass cell is from Hellma Analytics (Mullheim, Germany).7We use dichroic mirrors from Laser Optik Garbsen and achromatic waveplates from Thorlabs.8We use two Andor Luca R EMCCD cameras, which are cost-effective and very compact in size. The
Gradium R© lenses are obtained from AMS Technologies, and the achromats are from CVI Melles Griot.Dichroic mirrors are used to combine blue and red imaging light. A motorized stage allows for the movementof the second vertical imaging lens to correct for chromatic aberrations between blue and red imaging. Allbeams are fiber-coupled, and it is crucial to position blue and red MOT beams independently.

3.5. Laser systems 65
chamber from below. The three lattice beams form an (almost) mutually orthogonal system.One beam is almost co-aligned with a horizontal MOT-beam and orthogonal to the horizontalimaging axis, the other two lattice beams enter the chamber from the top. The positions ofall dipole trap and lattice beams on the atoms are imaged onto small TV cameras, and lightis sent onto photodiodes for monitoring. In total, 24 different beams enter into the glass cell,nine of them are retro-reflected, and 15 of them are monitored on TV cameras.
3.5 Laser systems
3.5.1 The blue laser system
We use a frequency-doubled diode laser system to drive the 1S0 − 1P1 transition at 461 nm.The system was originally built by LEOS, but modified in many ways as it proved to be muchtoo unstable. We use a Toptica DLpro master laser at 922 nm with a non-antireflection (AR)coated diode that emits 50mW at a typical current of 130mA. This light is used to seed atapered amplifier (TA), which emits 1.1W, measured behind the isolator. The IR light is sentthrough an lithium triborate (LBO) crystal for frequency doubling9. The doubling efficiencyis greatly enhanced by a bow-tie cavity, which is locked in a Hansch-Couillaud scheme.The doubling cavity is built of discrete elements and therefore mechanically unstable andunpleasant to align.
The LBO crystal suffers from a slow loss in doubling efficiency in regions of high lightintensity. We never characterized this ageing process, but the 1/e decay is about one month.Moving the crystal by a few 10μm restores the original doubling efficiency. The crystal isheated to 50 ◦ to avoid deposition of dust on its surfaces. Some information on the ageingof crystals can be found in Ref. [Bla11a].
When carefully optimized, the laser power of the blue light can be close to 500mW. Afterdegradation of the system, a half-day effort can usually yield a power of 420mW, which is atypical good value for operation. The output power drops by about 20% per week due to theageing of the crystal, making it necessary to move the crystal about every other week. Themaster laser itself is unbelievably stable and runs continuously for more than three years,without ever changing its mode. The TA chip ran for about five years continuously withoutdrop in output power, and the LBO crystal has been used for fours years. The laser is placedinto a box of multi-layer wood, cushioned with a layer of dense vinyl and an acoustic foam forthermal and acoustic insulation10. Some of the light from the IR laser goes to a Fabry-Perotinterferometer (FPI) and towards a high-finesse cavity, which can in the future be used forlinewidth reduction of the laser11.
9The LBO crystal is from Raicol Crystals Ltd. Very recently, blue laser diodes with up to 50mW outputat 461 nm became available, and TA chips are being developed to appear on the market in a few years.
10We use SheetBlok material from Auralex Acoustics for dampening of low frequencies, and standardacoustic foam from Schaumstoffe Wegerich (Wurzburg, Germany) to dampen higher frequencies.
11The laser does not need to be very stable, since the atomic linewidth is 30 MHz, but any frequency jitteron ms-time scales might result in a change in interference pattern in the absorption- and reference images,which leads to interference fringes in the processed image. Therefore, we set up a high-finesse cavity to lockthe laser.

66 Chapter 3. Experimental setup
AOM
AOM
AOM
AOM AOM AOM
AOM
AOM
laser922 nm
TA
PD
FPI
WM
cavity
MO
T
MO
T
MO
T
specZS
TC
imag
imag
imag blow
+ 200 MHz
- 200 MHz
+ 218 MHz
+ 2 x 270 ... 430 MHz
- 350 MHz
2 x 116 MHz2x 150 ... 250 MHz 2 x 116 MHz
Figure 3.3: Setup of the blue laser system. The SHG laser itself is placed in a housingfor thermal and acoustic insulation (top grey-shaded area). The light is split into variouspaths, frequency-shifted, and coupled into fibers. In this drawing, all waveplates, shutters,irises, and other passive elements have been omitted for clarity. Abbreviations: Fabry-Perotinterferometer (FPI); wavemeter (WM); photodiode (PD).

3.5. Laser systems 67
84Sr -270.8 MHz
-350 MHz
2 x 292 MHz2 x 321 MHz
2 x 355 MHz
2 x 428 MHz
ZS-200 MHz
MOT200 MHz
TC218 MHz
imaging1st isotope
2 x 116 MHz
imaging2nd isotope
(a)
laser frequency
86Sr -124.8 MHz
87Sr- 68.9 MHz
88Sr 0 MHz
(b) (c)
frequ
ency
84
86
8788
- 51.6 MHz- 9.7 MHz
F= 9/2F= 11/2F= 7/2{
2 x 189 MHz
2 x 223 MHz2 x 251 MHz
isotope
spectroscopy
AOM 1AOM 2
Figure 3.4: Frequency scheme of the blue laser system used to address all stable isotopes. (a)The isotope and hyperfine shifts of the 1S0 − 1P1 transition, referenced to the
88Sr line. (b)The laser is always locked to the 88Sr spectroscopy signal, but the frequency offset betweenlaser and spectroscopy can be tuned with AOMs 1 and 2 to shift the laser frequency around.(c) The frequencies used for the MOT, ZS, TC, and imaging lights, shown here for the caseof 84Sr. When working with mixtures of isotopes, the time delay between the imaging flashesfor the two isotopes is too short to adjust the frequency of the master laser accordingly, andwe use a second AOM for this purpose (far right arrow).
Spectroscopy lock — There are a number of different options to stabilize the frequencyof the 461-nm laser. The Florence group uses conventional spectroscopy cells, which needonly little adaptations to work at about 350 ◦C. The PTB group locks the laser to a stablereference cavity, the group at JILA uses hollow cathode lamps. Locking to a transfer cavitiyor to a wavemeter (both schemes used by the Tokyo groups) are also viable. We decided toemploy a spectroscopy cell.
About 6mW of the blue light are sent into the spectroscopy path. The frequency ofthe light is shifted down by 350MHz 12 and then passes through another 350MHz AOM
12We use Crystal Technology acousto-optical modulators (AOMs) throughout, obtained from the Germandistributor EQ Photonics. More specifically, we use models 3080-120 and -121, 3110-120, 3200-120, -121,and -125, as well as 3350-199 and -192 for the near-resonant lasers. They provide diffraction efficienciesof up to 90% with less than 1 W RF power, and have a bandwidth of 25% of their nominal frequency.Especially the newly developed models at 350 MHz have been indispensable. The RF is generated by our DDS(DC−135 MHz at -10 dBm), doubled or quadrupled if required, and amplified by our home-built amplifier.

68 Chapter 3. Experimental setup
in double-pass configuration to end up in a fiber; see Fig. 3.4. This double-pass 350-MHzAOM can be driven with frequencies between 270 and 430MHz, which conveniently spansthe isotope shift of 270MHz between 84Sr and 88Sr. When addressing different isotopes,we shift the frequency offset between the laser and the spectroscopy, which is always set tothe most abundant isotope 88Sr. The telescope around this AOM, the position of the AOMin the exact focus of the telescope, and the fiber coupling need to be adjusted carefully toprovide sufficient coupling efficiency into the fiber over the entire frequency range. The RFoutput power of the DDS is adjusted such that the optical power behind the fiber is inde-pendent of the AOM frequency. This adjustment compensates for the frequency-dependentoutput levels of the DDS, gain curves of the RF frequency doublers and the RF amplifier,misalignment of the Bragg angle, diffraction efficiency of the AOM, and fiber coupling effi-ciency. We use typically 100μW behind the fiber, with less than 1% intensity modulationacross the 270MHz scan range. Much more power would be available, leaving room fordegradation of the system before maintenance needs to be performed. The spectroscopylock itself follows the standard Pound-Drever-Hall scheme13, with both pump and probelight impinging onto a photodiode14. The error signal is fed into the Toptica PID, whichcontrols grating and current of the laser head via the backplane of the laser rack, and hasa fast output onto the bias-T. The laser can be scanned across the four isotopes by sweep-ing the frequency of the spectroscopy double-pass AOM in 100ms without falling out of lock.
Light for the experiment—The remainder of the blue light is used for MOT, Zeeman-slower (ZS), transversal cooling (TC), and imaging. The mode quality of the light is ratherpoor and worsens when propagating along the beam path. Additionally, the beam is rathersmall as it exits the doubling stage. We tried different setups to maximize the amount ofusable light from the laser, and stopped optimizing with a very compact setup that doesnot use any telescopes around the AOMs. The light passes through three 200MHz AOMsin series, at distances of about 10 cm, where one AOM uses the non-diffracted zeroth orderof the preceding AOM. The first AOM diffracts light at +200MHz for the MOT beams, thislight is split into three paths and coupled into three fibers15. The second AOM splits offlight at -200MHz for the ZS, which is also sent into a fiber. Finally, the third AOM picksoff light at +218MHz for the TC. The zeroth order of this AOM is split into three paths:Two imaging paths and a so-called blow beam, which is used to resonantly remove atomsfrom the scene without sending light onto the CCD cameras; a 110MHz double-pass AOM
13For all our lasers, we use home-built electro-optical modulators (EOMs) for modulation of sidebands.Their LiNbO3 crystals have a length of 30 mm and AR-coated facets with 3×3 mm2 surface, and are housedin a copper block. A self-built resonator tank with resonance frequency of about 13 MHz amplifies the voltageof the RF across the crystal.
14The spectroscopy cell is a heat pipe operated at 340 ◦C, and the windows are water-cooled. The cell isfilled with about 10 g of Sr and about 10−3 mbar of Ar as buffer gas, and has been running continuously forabout four years without loss in vapor pressure or coating of the windows. The pump and probe beams arefocused at their intersection to obtain a high intensity. The error signal amounts to about 1 V without muchoptimization, with the noise level being a few percent. The quality of the locking scheme is illustrated byour ability to lock also to the 86Sr absorption feature, which is a factor of ten smaller than the 88Sr feature.
15We use Schafter + Kirchhoff fiber couplers (models 60FC) and angle-cut single-mode polarization-maintaining fibers (models PMC) throughout. The fiber couplers are placed into mirror mounts with home-built adapters.

3.5. Laser systems 69
experiment spec.AOM 1 (MOT) spec.AOM 1 (imag.) imag. 1 AOM imag. 2 AOM
84 + 86 428MHz + 355MHz 428MHz 116MHz 189MHz84 + 87 428MHz + 321MHz 428MHz 116MHz 223MHz84 + 88 428MHz + 292MHz 412MHz 100MHz 235MHz86 + 87 355MHz + 321MHz 365MHz 126MHz 160MHz86 + 88 355MHz + 292MHz 355MHz 116MHz 178MHz87 + 88 321MHz + 292MHz 336MHz 134MHz 152MHz
Table 3.2: Blue spectroscopy and imaging AOM frequencies for experiments involving twoisotopes. The spectroscopy AOM 1 sets the locking point of the laser during the MOT(second column) and imaging (third column) phase. The frequencies of the imaging 1 AOM(nominal frequency 110MHz) and imaging 2 AOM (200MHz) are given in the last twocolumns. All AOMs are used in double-pass configuration.
sends the light into a fiber.
The two imaging paths use AOMs of different nominal frequencies and allow for simulta-neous imaging of two different isotopes16. These double-pass AOMs actually use telescopes.The beams are overlapped on a non-polarizing beamsplitter and sent into two fibers for hor-izontal and vertical imaging. Some light out of the horizontal imaging can be picked off andsent into a third fiber for a future wide-field imaging system.
All fibers are equipped with mechanical shutters17. Additional shutters are set in front ofeach imaging AOM, and a global shutter directly behind the laser blocks all blue light, butthe spectroscopy beam. All of these shutters are closed after the blue MOT stage18. Theentire laser system is shown in Fig. 3.3.
We frequently work with mixtures of different isotopes. The sequential loading of differentisotopes into the metastable reservoir is achieved by adjustment of the locking point of thelaser, using the double-pass AOM in front of the spectroscopy. The blue transition is notentirely isotope-selective, and we usually image only one isotope per experimental run. Itmight, however, be desired to image any combination of two isotopes within a few ms duringthe same run. This is not possible by sweeping the laser frequency because of the limitedbandwidth of the doubling cavity. Instead, we set the locking point of the laser to a suitableposition and employ the two different AOMs mentioned above (nominal frequencies of 110and 200MHz with a RF bandwidth of about ±25%) to address the two isotopes; see Tab. 3.2.
16For future optimization, it would be convenient to use a 350 MHz in double-pass to address all isotopes,analogous to the spectroscopy AOMs
17The shutters are made of small metal sheets, moved into the beam path by small servo motors, whichcan be obtained from any electronic distributor, e.g. Conrad Electronic. This design is comparably slow(∼ 100 ms), but very cheap and simple, with a lifetime of about 106 cycles.
18For all of our near-resonant laser systems, we use New Focus model 9801 mirror mounts throughout,available from Newport. We use home-built adapters to mount optical elements other than mirrors (beam-splitter cubes, AOMs, EOMs, fiber couplers,...), or we modify the mounting plate accordingly. The remainingoptomechanics are entirely from Thorlabs. Mirrors are from Thorlabs and Laser Components, simple singletlenses from Thorlabs and CASIX, and polarization optics are from CVI Melles Griot and Qioptiq (formerlyLinos).

70 Chapter 3. Experimental setup
3.5.2 The green laser system
During the blue MOT phase, we collect atoms in the metastable 3P2 reservoir state. Theseatoms need to be returned to the 1S0 ground state, which is done by optical pumping intothe 5s5d 3D2 state, from where atoms relax into the 3P1 state and further into the groundstate. The transition has a width of a few MHz. Isotope shifts are relatively small, buthyperfine splittings are of a few GHz; see Chpt. 9 for spectroscopic data.
Generation of multiple frequencies —We use a Toptica SHG system to generate the497-nm light. An IR diode at 994 nm generates about 300mW of power and is monitored ona FPI and a wavemeter. The light is coupled into a SHGpro doubling cavity, which generatesup to 40mW of green light if optimized. This light is coupled into a fiber for mode-cleaningand ease of operation; see Fig. 3.5. The fiber guides the light to a system dubbed the greenrainbow, where a comb of frequencies (hence the term “rainbow”) is generated to addressall necessary transitions. A set of five AOMs with nominal frequencies of 200 or 350MHz,all of them in double-pass configuration, can be used in parallel or in series, or in a com-bination of the two. This versatile setup allows for very different applications with onlyminor changes to the system. The 350MHz AOMs have reasonable diffraction efficiency upto 80MHz away from the center frequency, thus five of these AOMs in series offer a massivetuning range of 1280MHz, which is very useful for spectroscopic measurements. On theother hand, two or three AOMs in parallel, with all paths combined behind the AOMs andsent into the same fiber, can be used for different isotopes or hyperfine transitions in thefermionic isotope. Out of a total of 13 hyperfine transitions, we address only the 3P2 − 3D2,F = 11/2 → F ′ = 13/2 and F = 13/2 → F ′ = 13/2 transitions (see Chpt. 9), which areseparated by 1350MHz. Adding a bosonic isotope is particularly simple for the combination84Sr + 87Sr, as the F = 11/2 → F ′ = 13/2 transition in 87Sr is only a few MHz away fromthe transition in 84Sr.
Long-term stability—A few 100μW of power on each transition are needed to securelyrepump all atoms, much less than we have available. Especially during the first experimentson 84Sr, when we had orders of magnitude more light available than needed, we had the IRmaster diode running freely and tweaked the current maybe twice a day to get the laser backonto resonance. As the experiment grew in complexity and less power became available oneach transition, we decided to lock the IR master laser to a stable reference cavity. Thisapplication does not demand a narrow linewidth, but some decent long-term stability. Weuse the cavity design described in Appendix A. We use mirrors designed for 1030 nm, whichgive a modest finesse at 994 nm, with one mirror mounted onto piezos in a standard way.The laser is set to resonance with the atomic transition by observation of its influence onthe blue MOT. With the laser on resonance with the atomic transition, the cavity is tunedto resonance with the laser by either applying a voltage to the piezos, or, more elegantly,by using the 350MHz double-pass AOM between laser and cavity. The laser stays lockedto the cavity for more than a week. The IR diode is not AR-coated, and the mode-hop freeplateaus are relatively small: whenever a mode-hop approaches the resonance position, thelaser will inevitably fall out of lock. The drift of the cavity amounts to a few 10MHz per day,
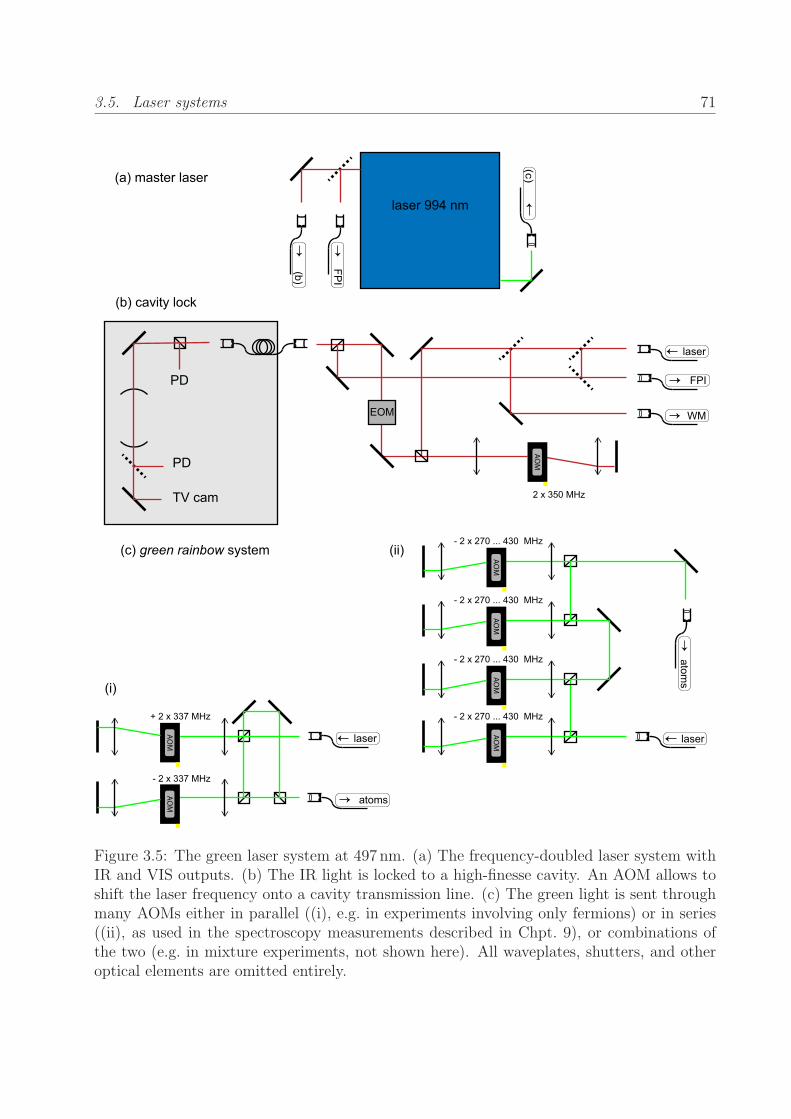
3.5. Laser systems 71
AOM
PD
PD
TV cam
AOM
AOM
AOM
AOM
AOM
AOM
(a) master laser
(b) cavity lock
(c) green rainbow system
(i)
(ii)
FPI
(b)
laser
FPI
WMEOM
laser
(c)
atoms
laser
atoms
+ 2 x 337 MHz
laser 994 nm
- 2 x 337 MHz
- 2 x 270 ... 430 MHz
- 2 x 270 ... 430 MHz
- 2 x 270 ... 430 MHz
- 2 x 270 ... 430 MHz
2 x 350 MHz
Figure 3.5: The green laser system at 497 nm. (a) The frequency-doubled laser system withIR and VIS outputs. (b) The IR light is locked to a high-finesse cavity. An AOM allows toshift the laser frequency onto a cavity transmission line. (c) The green light is sent throughmany AOMs either in parallel ((i), e.g. in experiments involving only fermions) or in series((ii), as used in the spectroscopy measurements described in Chpt. 9), or combinations ofthe two (e.g. in mixture experiments, not shown here). All waveplates, shutters, and otheroptical elements are omitted entirely.

72 Chapter 3. Experimental setup
which is tolerable and likely caused by piezo creep and residual temperature fluctuations.
3.5.3 The red laser system
The red laser system at 689 nm is currently the most sophisticated laser system in our lab.The 1S0 − 3P1 intercombination transition has a natural width of 7.4 kHz, so the laser needsto have a linewidth and long-term stability smaller than this value. As another requirement,we need to address the transition in all isotopes and hyperfine states, where isotope shiftsand hyperfine splittings are up to a few GHz; see Fig. 2.3. In the following, we will showhow these requirements are met.
Linewidth reduction—The master laser is a Toptica DLpro with an intrinsic linewidthof about 1MHz and is locked to a high-finesse cavity to reduce its linewidth to a few kHz19.The laser light passes through a fiber for mode-cleaning and then through an EOM formodulation of sidebands, before entering into another short fiber. Some care has to betaken to avoid amplitude modulation: we use waveplates to set the polarization correctly,use a small beam diameter to avoid clipping, and aim to reduce reflections from the fibercoupling. A photodiode behind the fiber is used to monitor the amplitude modulation, whichis certainly below 10−3.
About 100μW of light are coupled into a cavity with a finesse of about 15 000, formedby two curved mirrors with rcc = 250mm and 99.98% reflectivity around a 100mm Zerodurspacer. One of the two mirrors is glued onto a stack of two piezos. The cavity was originallyplaced into vacuum, which likely degraded over the years of operation as no vacuum pumpsare attached. There is some thermal insulation, but no active temperature stabilization. Thecavity design is further described in Appendix A. The cavity resonance is shifted into thevicinity of the atomic resonance by driving one of the piezos with a HV amplifier. This HVamplifier is static and has a time constant of minutes. The laser is then locked to the cavityin a standard Pound-Drever-Hall scheme. We use the Toptica FALC for this purpose. Theobtained linewidth, as estimated from the noise of the locking signal, is about 2 kHz. Wetake care to double-shield all BNC cables and keep their lengths as short as possible. TheToptica laser rack is placed about 20 cm away from the laser head to provide fast feedback.The laser and cavity are housed in a 14mm multi-layered wooden box, with a dual-layerthermal and acoustic shielding. The laser typically stays locked for a few days. The designcan certainly be improved in many ways. Using a higher modulation frequency of 50MHzon the EOM will increase the locking bandwidth by a factor of three. Adding an ion pumpto the steel chamber would establish a good vacuum and might reduce acoustic noise onthe cavity. Such a cavity with an upgraded design exists already and is sometimes used toanalyze the performance of the first cavity.
Long-term stability — Having now successfully reduced the linewidth of the laser,the next step is to keep the laser frequency on the atomic resonance. We cannot hope thatour cavity will keep its resonance frequency stable within a few kHz over long time scales.
19We find it important to use an AR-coated diode, which we obtain from Sacher Lasertechnik (Marburg,Germany). Two optical isolators in series are used for increased protection from unwanted backreflections.

3.5. Laser systems 73
AOM
(c) red spider system
(a) master laser
AOM
AOMAOMAOM
PD
PD
TV cam AOM
PD
PD
(b) spectroscopy
spider
spec
WM
cavity
laser
gas cell
slaves
laser
slaves
master laser 689 nm
EOM
- 2 x 80 MHz
slaves
omnib.
omnib.
slaves
atoms
slaves
omnib.
84Sr
86Sr
88Sr
87Sr F´= 9/2
87Sr F´= 7/2
e.g. PA
e.g. OS
G
e.g. OS
G
87Sr F´= 11/2
- 2 x460
MHz
- 2 x 160.5MHz
222 MHz
- 163.8 MHz
- 2 x 175.75
MHz
2 x 260
MHz
2 x 376
MHz
AOM AOM
Figure 3.6: (this page and next) The red laser system at 689 nm. Light of the master laseris sent to a high-finesse cavity for linewidth reduction (a), to a spectroscopy cell for locking(b), and to a system called the red spider (c), in which AOMs are used to shift the light toall frequencies used in the experiment (certain outputs have been omitted for simplification).The individual outputs are amplified by a number of slave lasers, used for the red MOT (d)and for other purposes (e). Again, all waveplates, shutters, irises, and other passive elementshave been omitted for clarity.

74 Chapter 3. Experimental setup
(d) red MOT slaves
(e) red omnibus system
three inputs multiplexed to four outputs
AOM
FPI, WM,
PD
AOM AOM AOM
beat PD
FPI
imag
atoms
atoms
atoms
spiderspider
spider
slave laser slave laser slave laser
slave laser
slave laser
master laser 688 nm
spider
spider
spider
(*)
atoms
WM
atoms
atoms
(*)
AOM AOM
2 x 200 MHz 2 x 200 MHz 80 MHz
~ - 80 MHz~ - 80 MHz~ - 80 MHz
3.5. Laser systems 75
This would have required a much better design of the cavity20. Other approaches wouldbe a lock to a stabilized frequency comb, a transfer lock to a cavity referenced to anothernarrow optical transition, or a feedback from the red MOT itself21. We decided to constructa narrow-line spectroscopy cell as direct frequency reference.
The design of the spectroscopy cell is described in Appendix B. Light from the masterlaser is sent through a fiber and split into two paths. One path goes through an 80MHzAOM in double-pass configuration and then passes through the spectroscopy cell. Abouthalf of the power of this probe beam is split off before the spectroscopy cell and sent onto aquiet photodiode, and the entire power emerging behind the spectroscopy cell is sent onto aphotodiode as well. This referencing approach allows us to cancel intensity fluctuations inthe probe light. The second beam counterpropagates the first one through the spectroscopycell, with an extinction of about 70% on resonance. The Doppler-broadened profile has awidth of about 2GHz (FWHM), and the narrow Doppler-free peak is clearly visible. Notethat we are probing a velocity class of atoms shifted by 80MHz from the natural transition.We lock to the 88Sr peak, as it is roughly ten times stronger than any other feature. We usea relatively strong loudspeaker magnet to generate an inhomogeneous B-field that pushesthe transitions into the mJ ′ = ±1 states away and smears them out, thereby allowing us toprobe only the ΔmF = 0 transition.
The 80MHz RF signal of the AOM is frequency-modulated to obtain sidebands at± 10 kHz. The two photodiode signals are delivered to a Stanford Research lock-in am-plifier (model SR830 DSP), whose output goes to a very slow PID. This PID controls thelength of the second piezo of the cavity with a time constant of a few 10 s. Again, greatcare is taken to double-shield all cables and to avoid ground loops. We do not observe anydrifting of the spectroscopy lock on any timescale.
Generation of frequencies — The isotope shift of the 1S0 − 3P1 transition is about75MHz per mass unit for the four stable isotopes. The hyperfine splitting separates theF ′ = 7/2 and F ′ = 11/2 states in 87Sr by 2.5GHz. In total, six atomic transitions needto be addressed: one in each of the three bosonic isotopes, and three hyperfine transitionsin 87Sr. There are a couple of different approaches to this problem: Many experiments usebeat locks to reference grating-stabilized lasers to the master laser. This technique offersvery high flexibility, but adds complexity to the system and might require some monitoringof the locking quality. Another option is the use of fiber-based EOMs, which can certainlygenerate sidebands in the range of many GHz, but might also generate a multitude of side-bands. We chose the approach to shift the frequency of the master laser by AOMs. This isdone by a system dubbed the red spider (the name originates from the fact that a total ofeight (and presently even more) black optical fibers lead to this bread board, just as eightlegs of a spider). A number of AOMs, many of them in double-pass and some of them inseries, shift the frequency and send the light into fibers, which is then used to seed slave
20Such cavities are now commercially available for a fairly low price from Stable Lasers, Inc., with driftsof less than 100 kHz/day.
21The position of the single-frequency red MOT is very sensitive to the frequency of the light. The usualmeasurement cycles could be interleaved with such a measurement every few minutes to compensate for slowdrifts.

76 Chapter 3. Experimental setup
lasers; see Fig. 3.6. Not only the frequencies required for the red MOT, but also for theF = 9/2 → F ′ = 7/2 optical pumping light, the OSG, and the PA spectroscopy/STIRAPare generated here.
Amplification — The light power emerging from the red spider is about 100μW peroutput frequency. To begin, let us roughly estimate the typical power needed for the redMOT: The saturation intensity of the red transition is 3μW/cm2, and the MOT beams aretypically 2 cm in diameter, giving rougly 10μW for all three MOT beams. For the broadbandred MOT, we need to span a frequency comb with a spacing of a few linewidths (say, 20 kHz)over a few MHz (say, 5MHz), giving 250 comb lines. With each comb line containing 10μW,the total power amounts to a few mW. We thus need to amplify the power of the “redspider” output by a factor of at least 100. There are many commercial laser diodes availableat this wavelength, emitting 30mW of power with a tuning range of a few nm 22. Threefibers connect the red spider system with the red MOT laser system. Each fiber seeds aToptica DL100 slave laser via the “wrong” output of the isolator. All three seeding beamsare overlapped and sent to a FPI. The beams of the three slave lasers pass through individual80MHz AOMs and shutters and are combined using non-polarizing 50:50 beam splitters23.Multiplexing three beampaths will always result in four output paths. Three of them areused for the three MOT axes, and are coupled into fibers for mode-cleaning, stability issues,and ease of maintanance24. The fourth output port is split into two paths: one is used forimaging on the red transition, the other one is sent to the same FPI as the seeding lasers.This makes it very convenient to monitor the seeding quality of the slaves25. The 80MHzAOMs are used during the red MOT phase to generate the sidebands and shift the frequency.Although it is only a single-pass configuration, we find that the coupling efficiency into thefibers is good enough over a range of 10MHz. Each output port is equipped with a shutter inorder to address the three MOT paths and the imaging light individually. The whole systemis placed on the vacuum table and cased into an insulated 5mm-aluminum housing. The redMOT system works very stable and does not need any surveillance over weeks. Each slavelaser addresses one isotope, or one hyperfine transition in 87Sr: the system can work witha combination of the fermionic isotope together with any bosonic one, or all three bosonicisotopes. Changing between isotope combinations is just a matter of exchanging fibers inthe red spider system, and is usually done within a minute.
During an upgrade of the experiment in late 2010, we found it convenient to add addi-tional lasers operating on the 1S0 − 3P1 transition. They would be used for the generation oflight for the OSG experiment, imaging on the red transition, two-color PA spectroscopy and
22We use laser diodes from Toptica, as well as Opnext diodes HL6738MG, which can be obtained fromThorlabs. For beam shaping, we use cylindrical lenses throughout. We consider them much superior toanamorphic prism pairs, by which up to 30% of the power are sacrificed. The lenses are placed with a tiltto the optical axis to avoid backreflections into the laser.
23We use custom-made beamsplitters from Laser Components, as VIS broadband beamsplitters are faraway from equal powers in the two outputs.
24A note to the careful reader: we can modify the multiplexing of the three slave lasers such that eachslave laser serves a different MOT axis. This feature is used in the experiments of Chpt. 12.
25There exist additional beam paths behind each slave that lead towards the FPI and wavemeter via aflip mirror. These paths are used when changing the laser diodes.

3.5. Laser systems 77
STIRAP, construction of dipole traps, as spares of the existing MOT slaves, and possibly forother experiments, such as optical Feshbach resonances. Many of these applications requiremore power than available from the red master laser, and are at frequencies different fromthe red MOT transitions. In addition, the 3P1 − 3S1 transition at 688 nm is only 1.5 nmaway and could be used for repumping and the construction of state-selective dipole traps.As the afore mentioned applications would not be used at the same time, we constructeda very flexible laser system that can be used for any purpose. It is dubbed red omnibus,derived from Latin omnibus “for all”. It consists of two Toptica DL100 slave lasers and oneToptica DLpro master laser26. Similar to the red MOT laser system, the two slave lasersare injection-locked via the optical isolator, and all seeding laser beams and output laserbeams are overlapped on a FPI and a wavemeter port. The light of the master laser isoverlapped with light from the red spider system on a GHz photodiode for a versatile beatlock. The lights of these three lasers pass through double-pass AOMs, shutters, and are sentinto fibers. On top of this basic configuration, we often split the light of a slave laser intotwo fibers, or combine the light of any two of these lasers into one fiber, or exchange thedouble-pass AOMs against models with different nominal frequency. These changes can bedone quickly, making this system a very helpful tool. The optics for the two OSG beams,the STIRAP beams, and the transparency beam (mentioned in Chpt. 12) are permanentlyinstalled around the glass cell.
3.5.4 The optical dipole trap
After cooling and compression of atoms in the red MOT, they are loaded into the opticaldipole trap. We employ a crossed-beam optical dipole trap in the infrared. The type of laserused as source, as well as the geometry of the dipole trap, underwent some evolution duringthe past years, which we will sketch here.
Our very first setup mimicked the one of the FeLiKx-machine: two horizontal beams ofsimilar waist, intersecting at an angle of about 30◦, and derived from a broadband 100WIPG fiber laser at 1070 nm. This setup was never used: during the Group-II-meeting inSeptember 2009, we learned that other groups had unsuccessfully tried to evaporate 84Sr,however the reasons for the observed heating and loss were not known. In other elements,such as lithium, it is well known that an atom can absorb a photon of one laser beamand emit it into the mode of the other laser beam, thus driving Raman-transitions intolower vibrational levels via excited molecular states. This leads to considerable heating andloss, which can be avoided by careful alignment of polarizations and completely eliminatedby the use of a laser with narrow linewidth. Also, we learned that the PTB-group useda combination of one horizontal and one vertical beam when condensing Ca for the firsttime; the same geometry had been used before in Yb-experiments in the Kyoto group. Wetherefore changed our setup for one horizontal and one vertical beam, and used an ELS disclaser as source.
The ELS laser was borrowed from another lab, and soon after the first BEC measure-ments, we changed back to the IPG laser. We could generate BECs of comparable size, and
26Very recently, TA systems at 689 nm became available, delivering 400 mW of output power. Thesesystems might simplify our current setup substantially.

78 Chapter 3. Experimental setup
therefore concluded that coupling to molecular levels due to the broad laser linewidth ofabout 3 nm is negligible in strontium. As our understanding of the machine improved withtime, we did find multiple sources of heating and loss of atoms from the dipole trap. Oneof them was the IPG laser itself: Experimentally, we found that we could create large BECswith decent lifetimes right after switch-on of the IPG laser, but as we kept the machinecycling, the BEC atom number decreased by 40% during the next 30minutes of operation,and the lifetime decreased to below 5 s. We speculate that the linewidth of the laser, or itsintensity noise, increase dramatically as the laser heats up. This behavior was not observedduring the early years of operation, and it seems that the high-power versions of the IPGlasers degrade over the years, becoming unusable after around five years.
We replaced the 100-W IPG laser by two 5-W models27, which deliver more power thanneeded. One laser is used for the horizontal, the other for the vertical dipole trap beam,thereby intrinsically inhibiting any stimulated processes. These lasers operate to our fullestsatisfaction. In the meantime, we also evaluated fiber amplifiers from Nufern28, but gaveup on these systems after sequentially testing three different units, all of which broke aftera few days of operation. For future purposes, such as a deep dipole trap for Rb and an IRlattice, we acquired a new 100-W IPG fiber laser and a 42-W Mephisto from Innolight.
Another concern is the mechanical stability of the system. We strive to keep opticalbeam paths short, but the major improvement came about when we fiber-coupled all dipoletrap beams29. Before, we observed a sloshing motion of the atoms in the trap, causing themto appear at varying positions after long TOF. This variation is now reduced to below theeffective camera pixel size.
The geometric shape of the dipole trap also underwent some evolution. The guidingprinciple is the following: a typical trap used for evaporation is characterized by threeparameters: the trap depth, the vertical trap frequency, and the average horizontal trapfrequency. The vertical trap frequency is usually restricted to a small range due to theinfluence of gravity and the limited available laser power. To optimize the evaporation, weseek to have independent control over the trap depth and the geometric mean of the trapfrequencies ω. We employ a horizontal beam that sets the trap depth and vertical trapfrequency, and evaporation trajectory, and a vertical beam that sets the axial confinement
27IPG YLD-5-LP, operating at 1065 nm with a specified linewidth of 0.5 nm.28These devices are capable of amplifying mW-powers of light with kHz-linewidth to up to 15 W, while
maintaining the narrow linewidth; e.g. our model NUA-1063-PD-0015-C0.29The light exits an IPG laser head, passes through a Crystal Technology 3080-194 AOM, and is coupled
into a short fiber. We employ high power fibers from OZ optics (model PMJ-A3AHPC-A3AHPC-1064-6/125-3AS-1.2-1, distributed by AMS Technologies), which we tested to easily transmit more than 10W.The polarization within these fibers turns a bit as they heat up, and we use standard PM fibers from Schafter+ Kirchhoff for powers below 2 W. The beam paths before and behind the fibers are below 50 cm. We uselenses made of Suprasil R© 3001. Compared to quartz glass, this type of glass contains roughly 1000-timesless OH-centers, which are known to absorb light in the IR, leading to heating and thermal lensing. Theabsorption at 1064 nm is typically 2.5 × 10⁻⁷/cm. The coating of these lenses is from LaserOptik Garbsen(Germany). We use high-power mirrors from Laser Components. We use the Ultima A100 mirror mountsfrom Newport, but replace the screws by Mitutoyo micrometer screws of model 148-205, which are verycompact and feature 6.5 mm travel with 2μm resolution. We use sophisticated and home-built air- andwater-cooled beam dumps. The entire system is contained in a 5 mm aluminum housing, and constantlyflushed with filtered air to avoid the deposition of dust particles.

3.5. Laser systems 79
0 2 4 6 8 10 12 40 42 80 82 120 122 200 202 204 206
posi
tion
(μm
)
time (ms)
0
-100
-200
-300
300
200
100
# 22
# 44
# 66# 111
x 10
Figure 3.7: Measurement of trap frequencies by observation of the center-of-mass motionin TOF. More than one hundred oscillations can be recorded. There is a slight increase infrequency for very long hold times, but already the first six periods are sufficient to obtaina precision in the 10−4 range (red line). Here, we measure a frequency of 542.7(5)Hz in thevertical direction. The blue line is a fit to only the last three oscillations.
and thus influences the density, but does not contribute to evaporation; see Chpt. 8 fordetails. The two beams are focused onto the position of the atoms by f = 150mm andf = 250mm lenses, respectively. These lenses can be moved by translation stages. Changingthe output collimator lenses behind the fibers allows us to adjust the waist in discrete steps.
Great improvement came about when we inserted a telescope of cylindrical lenses toshape the horizontal beam elliptically. The aspect ratio can be as extreme as 1 : 20, whereone of the cylindrical lenses is placed on a translation stage to smoothly vary the ellipticity.Such a trap is pancake-shaped, which has at least three main advantages: First, the mode-matching with the final red MOT, which is also pancake-shaped, is optimized. Second, thisshape allows for a high trap frequency in the vertical direction, while keeping the average trapfrequency ω low. Evaporation proceeds mainly downward, aided by gravity, and evaporationefficiency is improved when the trap frequency is at least comparable compared to the elasticscattering rate. And third, having one dimension of tight confinement makes it convenientto distinguish the BEC from the thermal fraction in TOF.
The four isotopes of Sr have very different scattering lengths a. The evaporation efficiencyis set by the interplay between events of elastic scattering (which scale as a2n) and inelasticones (∼ a4n2). The only tuning parameter is the density n, which depends directly on ω.As we are working with a multitude of different isotopes and mixtures, we need to be ableto change ω substantially. This is realized by the implementation of three different verticalbeams, having very different waists. Two of them enter into the glass cell from below,separated by an angle of about 1◦, at an angle of 22◦ to gravity. They share a common lensfor focusing onto the atoms. One of the two is usually called the vertical beam and has atypical waist of 100...300μm. The other one is called the dimple beam and has a waist of20...100μm, depending on the choice of the output collimator lens. The third vertical beamenters through the top of the glass cell, at an angle of 15◦ towards gravity. Its waist can beas small as 5μm. This port is used for the transparency beam mentioned in Chpt. 12.

80 Chapter 3. Experimental setup
The trap frequencies are measured by excitation of sloshing modes along the three prin-cipal axes of the dipole trap. For the two horizontal axes, we make use of the two verticalbeams: Gently displacing the atoms with one of the beams allows us to measure the trap fre-quency of the other beam. The vertical frequency is measured by exploiting the gravitationalsagging: the horizontal beam power is adiabatically lowered and then suddenly increased,setting the atoms into motion. Similar schemes are employed for the lattice, OSG, STIRAP,and other beams. We routinely achieve a precision in the 10−3 range with records in the10−4 range; see Fig. 3.7. The subsequent calculation of the beam waists is limited by theuncertainty in the measurement of the power in the beams, which we generally estimate tobe 2%, and uncertainty in the beam shape.
3.5.5 The lattice
The strong dipole transition at 461 nm allows us to use a Verdi at 532 nm to generate a red-detuned lattice. Compared to lattices in the near IR, which are commonly used with alkaliatoms, the lattice spacing in a Verdi lattice is reduced to half, which significantly reduces alltimescales associated with tunneling. We use a Verdi V18 from Coherent, which providessingle-mode operation at a linewidth below 1MHz.
The setup of a lattice with a cubic unit cell requires a system of three pairwise orthogonallattice beams. The implementation of such beams demands its own share of optical access,which poses a problem to most experiments. Our MOT and imaging beams are reflected offdichroic mirrors in the vicinity of the glass cell. These dichroic mirrors are transmittive at532 nm and could be used as access ports for a lattice. There are, however, two fundamentaldifferences between MOT and lattice beams: polarization30 and focus size31. These twoproperties make it very challenging to combine MOT and lattice beams, and we decided toset up an independent lattice system.
The Verdi light is split into three paths for the three lattice beams, sent through individualAOMs and shutters and is delivered to the experiment via fibers. One of the beams ishorizontal and orthogonal to the horizontal imaging axis. The two other beams are sentonto the atoms through the top and bottom surfaces of the glass cell, at angles of 37.5◦ tothe vertical axis. They are orthogonal to the horizontal lattice beam, but enclose an angleof only 75◦ with each other. Due to the construction of the coil system, the desired angle of90◦ cannot be achieved. In this way, two lattice axes are not completely decoupled.
Great care was taken to design a mechanically stable optical setup. The lattice beamsexit from S+K fibers and collimators and are focused by CVI f = 400mm achromats. Withthis two-lens approach, a change in the beam waist at the position of the atoms, which is100μm with the present setup, can only be achieved in discrete steps by exchange of the
30The lattice beams require a linear polarization, whereas the MOT beams are circularly polarized. Onewould like to place the MOT quarter-waveplate behind the dichroic mirror, since dielectric coatings tend toscramble non-trivial polarizations. This is not compatible with the lattice beams.
31Some of the MOT beams are multiplexed with the imaging beams, and lenses used for imaging need tobe placed close to the atoms to achieve a large numerical aperture. The resolution of our imaging systemis of a few μm, but the lattice beams should have waists of order 100μm. These two requirements cannotbe met with a single lens. Motorized flip-mirrors, as used in some experiments, could solve this problem ifsilver-coated mirrors were used.

3.5. Laser systems 81
collimator lens. The polarizations of all beams are mutually orthogonal, and cubes are usedfor polarization cleaning. On the opposite side of the glass cell, the beam is re-collimatedagain and retro-reflected. The leakage through this mirror is monitored on a TV camera foralignment purposes. The back reflection is easily aligned by re-coupling into the fiber. Thelight passes through the fiber and the AOM, where the first order is sent onto a photodiode.This signal is very convenient for optimization of the lattice.

82 Chapter 3. Experimental setup

Chapter 4
Publication: Bose-Einsteincondensation of strontium†
Phys. Rev. Lett 103, 200401 (2009)
Simon Stellmer,1,2 Meng Khoon Tey,1 Bo Huang,1,2 Rudolf Grimm,1,2 and Florian Schreck,1
1Institut fur Quantenoptik und Quanteninformation, Osterreichische Akademie der Wissenschaften,6020 Innsbruck, Austria
2Institut fur Experimentalphysik, Universitat Innsbruck, 6020 Innsbruck, Austria
We report on the attainment of Bose-Einstein condensation with ultracoldstrontium atoms. We use the 84Sr isotope, which has a low natural abundancebut offers excellent scattering properties for evaporative cooling. Accumulationin a metastable state using a magnetic-trap, narrow-line cooling, and straightfor-ward evaporative cooling in an optical trap lead to pure condensates containing1.5 × 105 atoms. This puts 84Sr in a prime position for future experiments onquantum-degenerate gases involving atomic two-electron systems.
Ultracold gases of strontium atoms have been attracting great attention for various rea-sons. A major driving force for the development of cooling and trapping techniques since theearly 1990s [Kur90] has been the realization of ultraprecise optical clocks [Ido03, Boy07b,Lem09b]. Many other intriguing applications related to metrology [Sor06], novel schemesfor quantum computation [Dal08, Gor09], and quantum simulators of unique many-bodyphenomena [Her09, Gor10] rely on the special properties of this species. Moreover, thereis considerable interest in ultracold Sr2 molecules [Ciu04, Koc08] and their possible appli-cations for testing the time variation of fundamental constants [Kot09]. Ultracold plasmas
†The author largely contributed to the construction of the experiment, namely the vacuum chamber, thelaser systems, and the coils. The setup of the coil system and all the electronics was greatly supported byGerhard Hendl, and B. H. contributed to the construction of the high-finesse cavity. The author createdthe first strontium BEC in a concerted effort together with M.K. T. and F. S. He operated the experiment,acquired the data, and contributed to the writing of the manuscript. All stages of the experiment, includingthe writing of the manuscript, were supported by R. G.
83
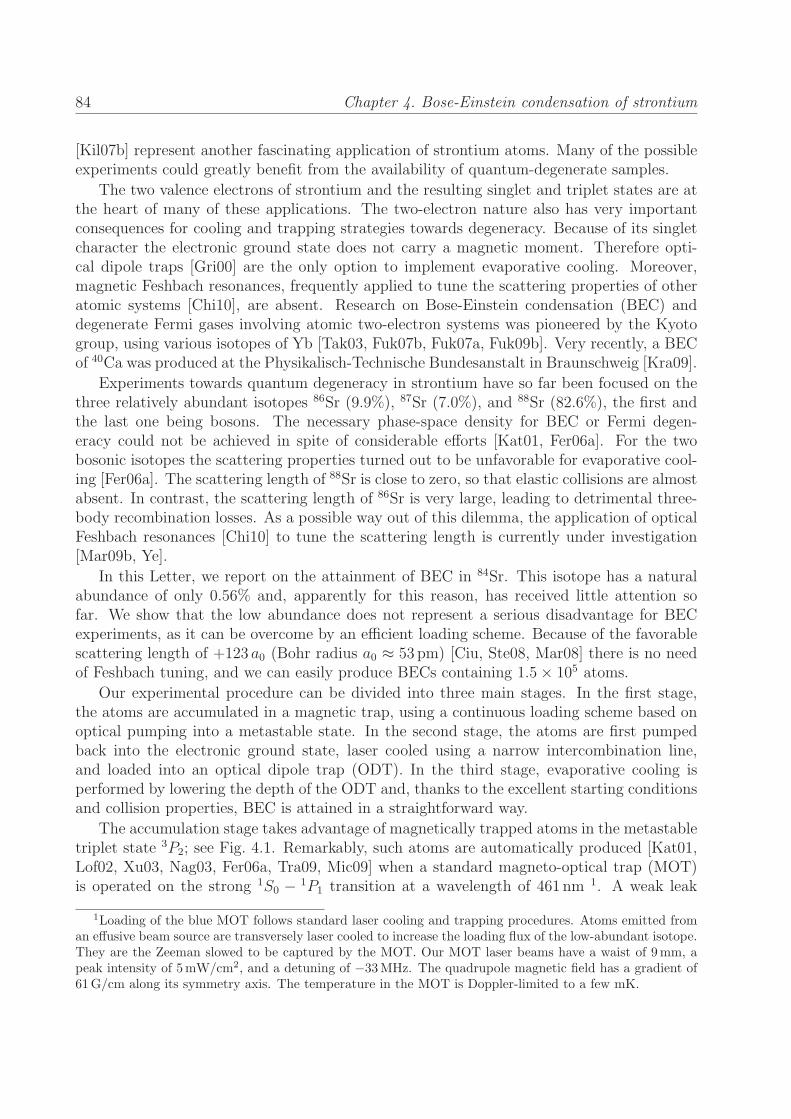
84 Chapter 4. Bose-Einstein condensation of strontium
[Kil07b] represent another fascinating application of strontium atoms. Many of the possibleexperiments could greatly benefit from the availability of quantum-degenerate samples.
The two valence electrons of strontium and the resulting singlet and triplet states are atthe heart of many of these applications. The two-electron nature also has very importantconsequences for cooling and trapping strategies towards degeneracy. Because of its singletcharacter the electronic ground state does not carry a magnetic moment. Therefore opti-cal dipole traps [Gri00] are the only option to implement evaporative cooling. Moreover,magnetic Feshbach resonances, frequently applied to tune the scattering properties of otheratomic systems [Chi10], are absent. Research on Bose-Einstein condensation (BEC) anddegenerate Fermi gases involving atomic two-electron systems was pioneered by the Kyotogroup, using various isotopes of Yb [Tak03, Fuk07b, Fuk07a, Fuk09b]. Very recently, a BECof 40Ca was produced at the Physikalisch-Technische Bundesanstalt in Braunschweig [Kra09].
Experiments towards quantum degeneracy in strontium have so far been focused on thethree relatively abundant isotopes 86Sr (9.9%), 87Sr (7.0%), and 88Sr (82.6%), the first andthe last one being bosons. The necessary phase-space density for BEC or Fermi degen-eracy could not be achieved in spite of considerable efforts [Kat01, Fer06a]. For the twobosonic isotopes the scattering properties turned out to be unfavorable for evaporative cool-ing [Fer06a]. The scattering length of 88Sr is close to zero, so that elastic collisions are almostabsent. In contrast, the scattering length of 86Sr is very large, leading to detrimental three-body recombination losses. As a possible way out of this dilemma, the application of opticalFeshbach resonances [Chi10] to tune the scattering length is currently under investigation[Mar09b, Ye].
In this Letter, we report on the attainment of BEC in 84Sr. This isotope has a naturalabundance of only 0.56% and, apparently for this reason, has received little attention sofar. We show that the low abundance does not represent a serious disadvantage for BECexperiments, as it can be overcome by an efficient loading scheme. Because of the favorablescattering length of +123 a0 (Bohr radius a0 ≈ 53 pm) [Ciu, Ste08, Mar08] there is no needof Feshbach tuning, and we can easily produce BECs containing 1.5× 10⁵ atoms.
Our experimental procedure can be divided into three main stages. In the first stage,the atoms are accumulated in a magnetic trap, using a continuous loading scheme based onoptical pumping into a metastable state. In the second stage, the atoms are first pumpedback into the electronic ground state, laser cooled using a narrow intercombination line,and loaded into an optical dipole trap (ODT). In the third stage, evaporative cooling isperformed by lowering the depth of the ODT and, thanks to the excellent starting conditionsand collision properties, BEC is attained in a straightforward way.
The accumulation stage takes advantage of magnetically trapped atoms in the metastabletriplet state 3P2; see Fig. 4.1. Remarkably, such atoms are automatically produced [Kat01,Lof02, Xu03, Nag03, Fer06a, Tra09, Mic09] when a standard magneto-optical trap (MOT)is operated on the strong 1S0 − 1P1 transition at a wavelength of 461 nm 1. A weak leak
1Loading of the blue MOT follows standard laser cooling and trapping procedures. Atoms emitted froman effusive beam source are transversely laser cooled to increase the loading flux of the low-abundant isotope.They are the Zeeman slowed to be captured by the MOT. Our MOT laser beams have a waist of 9 mm, apeak intensity of 5 mW/cm2, and a detuning of −33 MHz. The quadrupole magnetic field has a gradient of61 G/cm along its symmetry axis. The temperature in the MOT is Doppler-limited to a few mK.

85
5s2 1S0
5s4d 1D2
5s5p 1P1
5s5d 3DJ
5s5p 3PJ
012
123
J
J
singlet triplet
blue MOT461 nm32 MHz
red MOT689 nm7.4 kHz
repump497 nm
2.3 MHz
metastablestate
1:50 000
1:3
Figure 4.1: Schematic illustration of the energy levels and transitions used for cooling andtrapping of Sr atoms. The blue MOT is operated on the strong 1S0-
1P1 transition. Theloading of the magnetic trap proceeds via the weak leak of the excited state (branching ratio1:50 000) into the 1D2 state, which itself decays with a 1:3 probability into the metastable
3P2
state. Here the atoms can be magnetically trapped and accumulated for a long time. Thetransition 3P2-
3D2 allows us to depopulate the metastable state by transferring the atomsinto the 3P1 state. The latter represents the excited state of the 1S0-
3P1 intercombinationline, used for narrow-line cooling in the red MOT.
of the excited state out of the cooling cycle of this “blue MOT” continuously populatesthe metastable state and the atoms are trapped in the magnetic quadrupole field of theMOT. This continuous magnetic-trap loading mechanism is our essential tool to prepare asufficiently large number of 84Sr atoms despite the low natural abundance of this isotope.With a steady-state number of about 3 × 10⁵ atoms in the blue MOT, we can reach anestimated number of roughly 108 atoms in the magnetic trap after typically 10 s of loading.This enormous gain is facilitated by the long lifetime of about 35 s for the magneticallytrapped atoms under our ultrahigh vacuum conditions, which is about 3 orders of magnitudelarger than the leak time constant of the blue MOT. Note that the same scheme has beenapplied to increase the number of 84Sr atoms for spectroscopic measurements [Mic09]. Alsonote that a very similar loading scheme was crucial for the attainment of BEC in Cr [Gri05].
In the narrow-line cooling stage, a MOT is operated on the 1S0−3P1 intercombination line(wavelength 689 nm, linewidth 7.4 kHz) using a scheme pioneered by Katori et al. [Kat99],which has become an almost standard tool for the preparation of ultracold Sr. Loading of this“red MOT” 2 is accomplished by pumping the atoms out of the metastable reservoir using a
2The 689-nm laser system is a master-slave combination. The master laser is stabilized on a 100 kHzlinewidth cavity by optical feedback, resulting in a linewidth of ∼ 2 kHz. The laser frequency is locked to the

86 Chapter 4. Bose-Einstein condensation of strontium
flash of laser light resonant with the 3P2 − 3D2 transition at 497 nm [Sor06]; see Fig. 4.1. Inthe initial transfer phase, the magnetic field gradient is reduced from 61G/cm as used forthe magnetic trap to 3.6G/cm within about 0.1ms. To increase the capture velocity of thered MOT we frequency modulate the light, producing sidebands that cover a detuning rangebetween −250 kHz and −6.5MHz with a spacing of 35 kHz; here each of the MOT beams hasa waist of 5mm and a peak intensity of 10mW/cm2. In a compression phase, the red MOTis then slowly converted to single-frequency operation with a detuning of about −800 kHzby ramping down the frequency modulation within 300ms. At the same time the intensityof the MOT beams is reduced to 90μW/cm2 and the magnetic field gradient is increased to10.4G/cm. At this point, we obtain 2.5× 10⁷ atoms at a temperature of 2.5μK in an oblatecloud with diameters of 1.6mm horizontally and 0.4mm vertically.
To prepare the evaporative cooling stage, the atoms are transferred into a crossed-beamODT, which is derived from a 16-W laser source operating at 1030 nm in a single longitudinalmode. Our trapping geometry follows the basic concept successfully applied in experimentson Yb and Ca BEC [Tak03, Fuk07a, Fuk09b, Kra09]. The trap consists of a horizontaland a vertical3 beam with waists of 32μm and 80μm, respectively. Initially the horizontalbeam has a power of 3W, which corresponds to a potential depth of 110μK and oscillationfrequencies of 1 kHz radially and a few Hz axially. The vertical beam has 6.6W, whichcorresponds to a potential depth of 37μK and a radial trap frequency of 250Hz. Axially,the vertical beam does not provide any confinement against gravity. In the crossing regionthe resulting potential represents a nearly cylindrical trap4. In addition the horizontal beamprovides an outer trapping region of much larger volume, which is of advantage for the traploading.
The dipole trap is switched on at the beginning of the red MOT compression phase. Afterswitching off the red MOT, we observe 2.5 × 10⁶ atoms in the ODT with about 106 of themresiding in the crossed region. At this point we measure a temperature of ∼ 10μK, whichcorresponds to roughly one tenth of the potential depth and thus points to plain evaporationin the transfer phase. We then apply forced evaporative cooling by exponentially reducingthe power of both beams with a 1/e time constant of ∼ 3 s 5. The evaporation processstarts under excellent conditions, with a peak number density of 1.2 × 1014 cm−3, a peakphase-space density of ∼2× 10⁻², and an elastic collision rate of about 3500 s−1. During theevaporation process the density stays roughly constant and the elastic collision rate decreasesto ∼700 s−1 before condensation. The evaporation efficiency is very large as we gain at least3 orders of magnitude in phase-space density for a loss of atoms by a factor of 10.
The phase transition from a thermal cloud to BEC becomes evident in the appearanceof a textbooklike bimodal distribution, as clearly visible in time-of-flight absorption imagesand the corresponding linear density profiles shown in Fig. 4.2. At higher temperatures the
88Sr intercombination line and frequency shifted by 351.4 MHz to the red to account for the isotope shift.A 30-mW slave laser diode is injection locked to the master to obtain sufficient light for the MOT. The redlight is superimposed with the blue MOT beam using dichroic mirrors.
3For reasons of optical access the beam is not exactly vertical, but inclined by 20◦.4To avoid perturbations by interference effects the beams are orthogonally polarized and have a frequency
difference of 160MHz.5The evaporation process turns out to be very robust, and common or individual variations of the ramping
time constants for both beams are not found to have strong effects on the evaporation efficiency.

87
evt = 5.6 s
370 nK
270 nK
−500 −250 0 250 500
T = 470 nK
6.7 s
7.6 s
8.0 s
position (μm)630 (μm)
linea
r den
sity
Figure 4.2: Absorption images and integrated density profiles showing the BEC phase transi-tion for different times tev of the evaporative cooling ramp. The images are along the verticaldirection 25ms after release from the trap. The solid line represents a fit with a bimodaldistribution, while the dashed line shows the Gaussian-shaped thermal part, from which thegiven temperature values are derived.
distribution is thermal, exhibiting a Gaussian shape. Cooling below the critical tempera-ture Tc leads to the appearance of an additional, narrower and denser, elliptically shapedcomponent, representing the BEC. The phase transition occurs after 6.3 s of forced evapo-ration, when the power of the horizontal beam is 190mW and the one of the vertical beamis 410mW. At this point, with the effect of gravitational sag taken into account, the trapdepth is 2.8μK. The oscillation frequencies are 59Hz in the horizontal axial direction, 260Hzin the horizontal radial direction, and 245Hz in the vertical direction.
For the critical temperature we obtain Tc = 420 nK by analyzing profiles as displayedin Fig. 4.2. This agrees within 20%, i.e. well within the experimental uncertainties, with acalculation of Tc based on the number of 3.8 × 10⁵ atoms and the trap frequencies at thetransition point. Further evaporation leads to an increase of the condensate fraction and weobtain a nearly pure BEC without discernable thermal fraction after a total ramp time of8 s. The pure BEC that we can routinely produce in this way contains 1.5× 10⁵ atoms andits lifetime exceeds 10 s.
The expansion of the pure condensate after release from the trap clearly shows anotherhallmark of BEC. Figure 4.3 demonstrates the well-known inversion of the aspect ratio[And95, Ing99], which results from the hydrodynamic behavior of a BEC and the fact that

88 Chapter 4. Bose-Einstein condensation of strontium
Figure 4.3: Inversion of the aspect ratio during the expansion of a pure BEC. The images(field of view 250μm × 250mum) are taken along the vertical direction. The first image isan in-situ image recorded at the time of release. The further images are taken 5ms, 10ms,15ms, and 20ms after release.
the mean field energy is released predominantly in the more tightly confined directions. Ourimages show that the cloud changes from an initial prolate shape with an aspect ratio of atleast 2.6 (limited by the resolution of the in-situ images) to an oblate shape with aspect ratio0.5 after 20ms of free expansion. From the observed expansion we determine a chemicalpotential of μ/kB ≈ 150 nK for the conditions of Fig. 4.3, where the trap was somewhatrecompressed to the setting at which the phase transition occurs in the evaporation ramp.Within the experimental uncertainties, this agrees with the calculated value of μ/kB ≈180 nK.
It is interesting to compare our number of 1.5 × 10⁵ atoms in the pure BEC with otherBECs achieved in two-electron systems. For 174Yb up to 6 × 10⁴ atoms were reported[Fuk09b], and for 40Ca the number is 2 × 10⁴ [Kra09]. It is amazing that our BEC clearlyexceeds these values with little efforts to optimize the number after our first sighting ofBEC (26 September 2009). We anticipate that there is much more room for improvement,in particular, in the transfer from the red MOT into the ODT. We interpret the amazingperformance of 84Sr as the result of a lucky combination of favorable scattering propertieswith excellent conditions for narrow-line cooling, and we believe that this makes 84Sr a primecandidate for future experiments on BEC with two-electron systems.
We finally discuss a few intriguing applications which seem to be realistic on a rathershort time scale. The 84Sr BEC may serve as an efficient cooling agent to bring otherisotopes into degeneracy. A BEC of 88Sr would be a noninteracting one [Chi10], as theintraisotope scattering length is extremely small [Fer06a, Mar08]. This would constitute aunique source of low-momentum, noninteracting, and magnetically insensitive atoms, idealfor precision measurements [Sor06]. The fermionic isotope 87Sr offers a nuclear spin decoupledfrom the electronic degrees of freedom, which is very favorable for quantum computation[Dal08, Gor09] and the essential key to a new class of many-body physics with ultracold atoms[Her09, Gor10]. The realization of a Mott insulator state appears to be a straightforward task[Fuk09a]. Another fascinating application would be the creation of ultracold dimers madeof an alkali-metal atom and a two-electron atom [Nem09]. Since all-optical evaporativecooling strategies for 87Rb and 84Sr proceed under very similar conditions [Bar01, Cen03,Kin05], the creation of SrRb molecules seems to be a realistic option. Such molecules wouldbe qualitatively different from the bi-alkali-metal atoms currently applied in heteronuclear

89
molecule experiments [Kre09] as they offer a magnetic rovibrational ground state [Nem09].We thank Andreas Trenkwalder and Christoph Kohstall for technical assistance with the
dipole trap laser. We furthermore thank Andrew Daley, Peter Zoller, and Hanns-ChristophNagerl for stimulating discussions on the prospects of strontium for future experiments. Wealso acknowledge fruitful discussions with Jun Ye, Thomas Killian, and Yoshiro Takahashi.

90 Chapter 4. Bose-Einstein condensation of strontium

Chapter 5
Publication: Double-degenerateBose-Fermi mixture of strontium†
Phys. Rev. A 82, 011608(R) (2010)
Meng Khoon Tey,1 Simon Stellmer,1,2 Rudolf Grimm,1,2 and Florian Schreck,1
1Institut fur Quantenoptik und Quanteninformation, Osterreichische Akademie der Wissenschaften,6020 Innsbruck, Austria
2Institut fur Experimentalphysik, Universitat Innsbruck, 6020 Innsbruck, Austria
We report on the attainment of a spin-polarized Fermi sea of 87Sr in thermalcontact with a Bose-Einstein condensate (BEC) of 84Sr. Interisotope collisionsthermalize the fermions with the bosons during evaporative cooling. A degen-eracy of T/TF = 0.30(5) is reached with 2 × 10⁴ 87Sr atoms together with analmost pure 84Sr BEC of 105 atoms.
Ground-breaking experiments with ultracold Fermi gases [Ing08, Gio08] have openedpossibilities to study fascinating phenomena, as the BEC-BCS crossover, with a high degreeof control. Most experiments have been performed with the two alkali fermions 40K and 6Li.Fermions with two valence electrons, like 43Ca, 87Sr, 171Yb, and 173Yb, have a much richerinternal state structure, which is at the heart of recent proposals for quantum computationand simulation [Gor10, Caz09, FF10, Her09, Ger10, Dal08, Gor09]. Unlike bosonic isotopesof these elements, the fermions have a nuclear spin, which decouples from the electronicstate in the 1S0 ground state. This gives rise to a SU(N) spin symmetry, where N is thenumber of nuclear spin states, which is 10 for 87Sr. This symmetry can lead to new quantumphases in optical lattices [Gor10, Caz09, FF10, Her09], like the chiral spin liquid. Non-abelian gauge potentials can be realized by engineering state dependent lattices [Ger10]. Inaddition, the nuclear spin can be used to robustly store quantum information, which can bemanipulated using the electronic structure [Dal08, Gor09]. Double-degenerate Bose-Fermi
†The author expanded the capabilities of the experiment to the cooling of the fermionic isotope andisotopic mixtures. He invented the levitation scheme, developed the mF -state detection scheme togetherwith F. S., acquired the data together with M.K. T., and contributed to the writing of the manuscript.
91

92 Chapter 5. Double-degenerate Bose-Fermi mixture of strontium
withwithout
optical pumping
optical pumping
levitation
F = 9/2
F ’ = 11/2
F ’ = 9/2
(a) (b)
mF = 9/2
mF‘ = 11/23P1
1S0
mF =
9/2
othe
r m
F-st
ates
++
Figure 5.1: Optical pumping and state detection of 87Sr. a) Internal states and transitions of87Sr used for optical pumping and detection of spin polarization. The optical pumping beam(dashed arrow) is scanned in frequency to address all mF states. Internal state detection isperformed by levitating only the mF = 9/2-state atoms against gravity using a σ+-polarizedlaser beam on a cycling transition (solid arrow). b) Levitated mF = 9/2-state atoms andatoms in all other mF states, 15ms after switching off the dipole trap.
mixtures extend the possibilities even further, allowing to study phase-separation and theeffects of mediated interactions.
Evaporative cooling of ultracold atoms to quantum degeneracy relies on elastic collisionsto thermalize the sample. Identical fermions do not collide at low temperatures, thereforemixtures of spins [DeM99, Gra02, Fuk07b, DeS10, Tai10], isotopes [Tru01, Sch01, McN06],or elements [Roa02, Had02, Sil05] are used for evaporation. 87Sr has a large nuclear spin ofI = 9/2, which leads to a tenfold degenerate ground state. Recently, 87Sr in a mixture ofthese states was cooled to quantum degeneracy [DeS10]. In this rapid communication, wereport on the attainment of a spin-polarized quantum degenerate Fermi gas of 87Sr togetherwith a BEC of 84Sr. Interisotope collisions are used to thermalize the fermions with thebosons. The system provides a clean starting point for the exploration of alkaline-earthBose-Fermi mixtures.
Our scheme to generate a BEC of 84Sr is described in Ref. [Ste09]. We have extended thisscheme to the preparation of Bose-Fermi mixtures. In the following, we briefly summarizethe basic preparation steps, while technical details will be presented elsewhere. We takeadvantage of atoms in the metastable 5s5p 3P2 state that can be trapped in the quadrupolemagnetic field of the magneto-optical trap (MOT). These atoms are automatically producedwhen operating a “blue MOT” on the 5s2 1S0−5s5p 1P1 transition at a wavelength of 461 nm.The 461-nm laser system is initially tuned to the 84Sr line and metastable-state bosons areaccumulated in the magnetic trap. After 5 s, the laser frequency is shifted by 210MHz tothe 87Sr line and metastable-state fermions are added to the magnetic trap for another 6 s

93
[Pol05b].Further cooling and density increase of the mixture is achieved by operating “red MOTs”
for each isotope simultaneously on the 7.4 kHz linewidth 1S0 − 3P1 intercombination linesat 689 nm. Since 87Sr has a nuclear spin, its 3P1 state is split into three hyperfine stateswith F ′ =11/2, 9/2, and 7/2. The 87Sr MOT uses the transitions to the F ′ = 9/2 andF ′ = 11/2 states simultaneously [Muk03]. To increase the capture velocity of the red MOTs,we frequency modulate the light, producing sidebands, which cover a detuning range froma few ten kHz to a few MHz to the red of the transition. To load the red MOTs, themetastable-state atoms in the magnetic trap are optically pumped to the 1S0 ground stateusing the 5s5p 3P2 − 5s5d 3D2 transition at 497 nm. The nuclear spin of 87Sr leads to asplitting of the 3P2 and
3D2 states into five hyperfine states each. We use two of the 13transitions between these states for repumping [Ste]. After loading, the MOT is compressedby reducing the MOT beam intensity and ramping off the frequency modulation, resultingin a colder and denser sample. After compression, the 84Sr and 87Sr MOTs are spatiallyseparated as a consequence of different red MOT dynamics [Ste, Kat99, Muk03]. The MOTseach contain ∼ 107 atoms at a temperature of ∼ 2μK.
For evaporative cooling, the atoms are transferred into a crossed-beam optical dipoletrap (ODT) based on a broadband ytterbium fiber laser operating at 1075 nm. The trappinggeometry consists of a horizontal and a nearly vertical beam with waists of 80μm. Duringthe red MOT compression phase, the horizontal and vertical beams are ramped to a powerof 4.2W and 1.6W, respectively, corresponding to an average trap oscillation frequency of170Hz and a trap depth of 13μK.
Loading of the dipole trap is achieved in two sequential stages to overcome the spatialseparation of the MOTs, first 87Sr then 84Sr. For each stage, the center of the respectiveMOT is overlapped with the cross of the ODT by shifting the center of the quadrupole field.For optimum loading, we adjust the intensities and detuning of the MOT beams beforeswitching off the MOT beams. After loading both isotopes, the ODT power is suddenlyincreased to 6W in the horizontal and 2W in the vertical beam, resulting in a trap depthof 22μK and an average trap frequency of 200Hz.
In order to obtain a spin-polarized sample of 87Sr, we perform optical pumping on the1S0(F = 9/2) − 3P1(F
′ = 9/2) transition with a σ+-polarized laser beam1 parallel to ahomogeneous guiding field of 3G; see Fig. 5.1(a). The mF = 9/2 state is a dark state ofthis transition. The frequency of the optical pumping light is scanned over the transitions ofthe different mF states, which are spread over 2MHz. After 30ms of optical pumping, thetemperature of the mixture has increased to 3.4μK.
To perform state detection, we selectively levitate only the mF = 9/2-state atoms toseparate them from atoms in all other states after switching off the ODT. An upward prop-agating σ+-polarized laser beam near the 1S0(F = mF = 9/2) − 3P1(F
′ = mF ′ = 11/2)cycling transition is used to levitate the atoms. The intensity and detuning of this beamare adjusted to optimize the levitation. At the magnetic field of 3G, the splitting betweenadjacent mF ′ states is ∼ 1.1MHz, which is about 10 times the power-broadened linewidth.
1The laser beams used for optical pumping and state detection are identical to the red MOT beamsoriented vertically upwards and have an intensity of 10μW/cm2 and 150μW/cm2, respectively. The otherfive MOT beams are blocked by shutters.
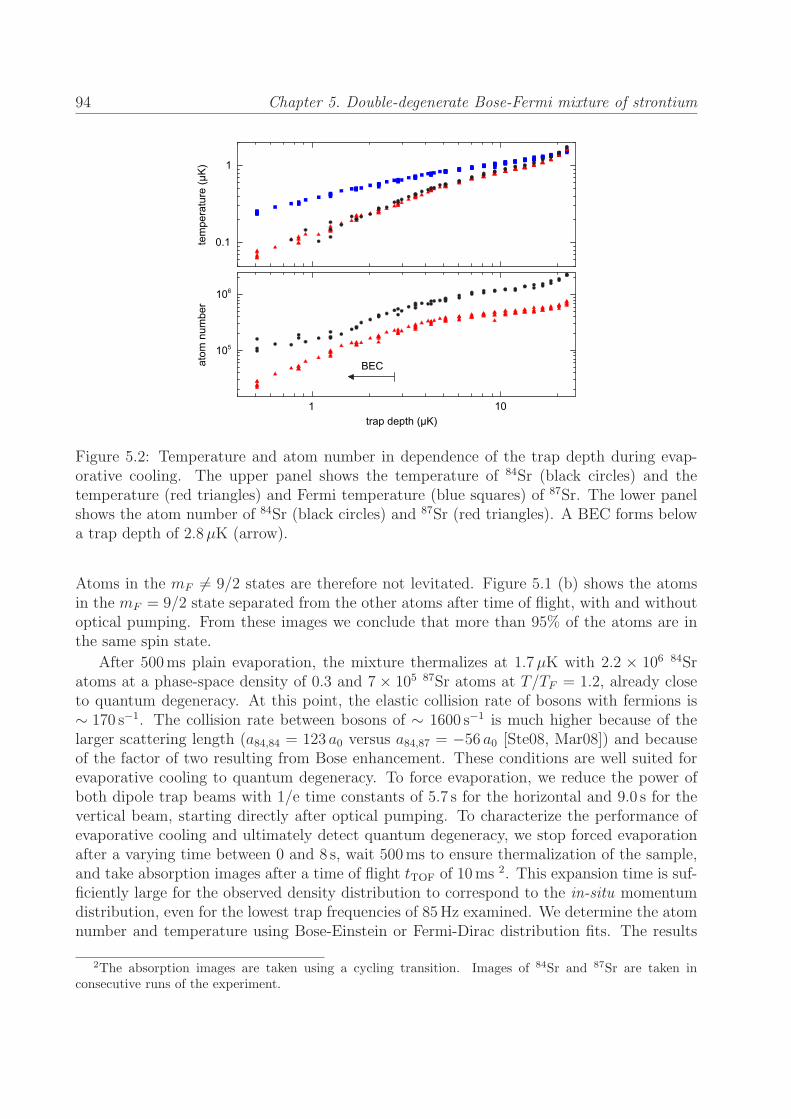
94 Chapter 5. Double-degenerate Bose-Fermi mixture of strontium
����������� �101
atom
num
ber
BEC
��
���
���
���
� 1
0.1
106
105
Figure 5.2: Temperature and atom number in dependence of the trap depth during evap-orative cooling. The upper panel shows the temperature of 84Sr (black circles) and thetemperature (red triangles) and Fermi temperature (blue squares) of 87Sr. The lower panelshows the atom number of 84Sr (black circles) and 87Sr (red triangles). A BEC forms belowa trap depth of 2.8μK (arrow).
Atoms in the mF �= 9/2 states are therefore not levitated. Figure 5.1 (b) shows the atomsin the mF = 9/2 state separated from the other atoms after time of flight, with and withoutoptical pumping. From these images we conclude that more than 95% of the atoms are inthe same spin state.
After 500ms plain evaporation, the mixture thermalizes at 1.7μK with 2.2 × 10⁶ 84Sratoms at a phase-space density of 0.3 and 7 × 10⁵ 87Sr atoms at T/TF = 1.2, already closeto quantum degeneracy. At this point, the elastic collision rate of bosons with fermions is∼ 170 s−1. The collision rate between bosons of ∼ 1600 s−1 is much higher because of thelarger scattering length (a84,84 = 123 a0 versus a84,87 = −56 a0 [Ste08, Mar08]) and becauseof the factor of two resulting from Bose enhancement. These conditions are well suited forevaporative cooling to quantum degeneracy. To force evaporation, we reduce the power ofboth dipole trap beams with 1/e time constants of 5.7 s for the horizontal and 9.0 s for thevertical beam, starting directly after optical pumping. To characterize the performance ofevaporative cooling and ultimately detect quantum degeneracy, we stop forced evaporationafter a varying time between 0 and 8 s, wait 500ms to ensure thermalization of the sample,and take absorption images after a time of flight tTOF of 10ms
2. This expansion time is suf-ficiently large for the observed density distribution to correspond to the in-situ momentumdistribution, even for the lowest trap frequencies of 85Hz examined. We determine the atomnumber and temperature using Bose-Einstein or Fermi-Dirac distribution fits. The results
2The absorption images are taken using a cycling transition. Images of 84Sr and 87Sr are taken inconsecutive runs of the experiment.

95
0.0
0.2
0.4
0.6
0.8
0.0
0.2
0.4
0.6
0.8
radi�������
T/TF=0.3
0 25 50 75 100 125
�����������
optic
al d
ensi
ty
1000 200 300 400
T/TF=1
Figure 5.3: Azimuthally averaged density distributions of a degenerate Fermi gas at T/TF =0.3 and a thermal fermionic cloud at T/TF = 1 (inset) after 10ms of free expansion. Fermi-Dirac distributions (solid red lines) fit both measurements well. The quantum degeneratesample deviates in shape from a Gaussian (dotted blue line). The difference between thedegenerate and thermal samples becomes even more evident when fitting a Gaussian to onlythe outer wings, outside the disk with radius
√2w (dashed line), where w is the 1/e width
of a Gaussian fit to the full distribution. For T/TF = 1 (inset), the difference between thethree fits is barely visible.
show that both bosons and fermions are evaporated and are well thermalized with each other(Fig. 5.2). To demonstrate the importance of interisotope collisions for the cooling of spin-polarized 87Sr, we perform the same evaporative cooling sequence in absence of 84Sr. Thefermions are lost faster than in presence of bosons and do not reach as low temperatures. Inaddition, the momentum distributions are in this case inconsistent with Fermi-Dirac distri-butions, which is expected since the sample cannot thermalize. During the evaporation ofboth isotopes, the BEC phase transition is detected after 6 s by the appearance of a bimodaldistribution [Ste09, Mar09a]. At that moment 5 × 10⁵ bosons remain at a temperature of300 nK.
Fermionic degeneracy manifests itself in subtle changes of the momentum distribution.Pauli blocking limits the occupation of low momentum states to one fermion per state,leading to a flatter and wider momentum distribution than expected classically. This changein shape is evident in the azimuthally averaged time-of-flight density distributions shown inFig. 5.3. The inset shows a thermal cloud at the beginning of evaporation and the main figurea colder sample after 7.6 s of evaporation. The momentum distribution after evaporation isvery well described by a Fermi-Dirac distribution, but not by Gaussian fits.
To quantify the degeneracy, we determine the ratio of the temperature T and the Fermi
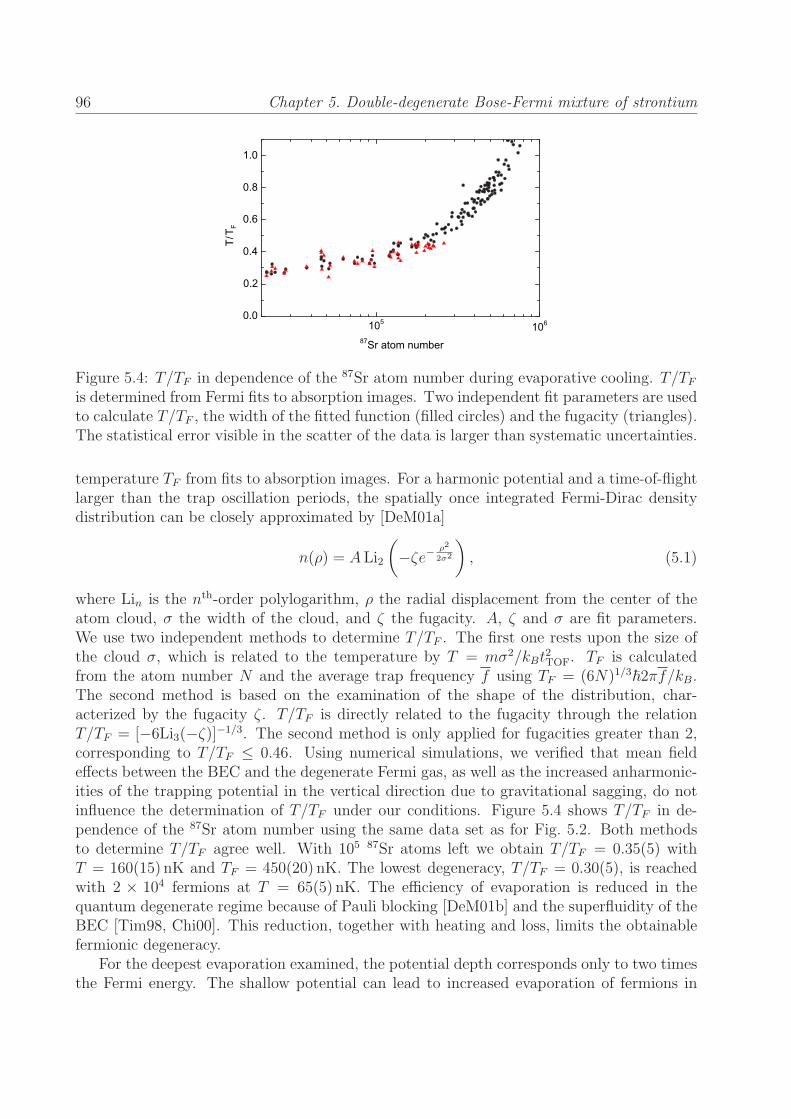
96 Chapter 5. Double-degenerate Bose-Fermi mixture of strontium
87Sr atom number
T/T F
106105
1.0
0.8
0.6
0.4
0.2
0.0
Figure 5.4: T/TF in dependence of the 87Sr atom number during evaporative cooling. T/TF
is determined from Fermi fits to absorption images. Two independent fit parameters are usedto calculate T/TF , the width of the fitted function (filled circles) and the fugacity (triangles).The statistical error visible in the scatter of the data is larger than systematic uncertainties.
temperature TF from fits to absorption images. For a harmonic potential and a time-of-flightlarger than the trap oscillation periods, the spatially once integrated Fermi-Dirac densitydistribution can be closely approximated by [DeM01a]
n(ρ) = ALi2
(−ζe−
ρ2
2σ2
), (5.1)
where Lin is the nth-order polylogarithm, ρ the radial displacement from the center of theatom cloud, σ the width of the cloud, and ζ the fugacity. A, ζ and σ are fit parameters.We use two independent methods to determine T/TF . The first one rests upon the size ofthe cloud σ, which is related to the temperature by T = mσ2/kBt2TOF. TF is calculatedfrom the atom number N and the average trap frequency f using TF = (6N)1/3
�2πf/kB.The second method is based on the examination of the shape of the distribution, char-acterized by the fugacity ζ. T/TF is directly related to the fugacity through the relationT/TF = [−6Li3(−ζ)]−1/3. The second method is only applied for fugacities greater than 2,corresponding to T/TF ≤ 0.46. Using numerical simulations, we verified that mean fieldeffects between the BEC and the degenerate Fermi gas, as well as the increased anharmonic-ities of the trapping potential in the vertical direction due to gravitational sagging, do notinfluence the determination of T/TF under our conditions. Figure 5.4 shows T/TF in de-pendence of the 87Sr atom number using the same data set as for Fig. 5.2. Both methodsto determine T/TF agree well. With 105 87Sr atoms left we obtain T/TF = 0.35(5) withT = 160(15) nK and TF = 450(20) nK. The lowest degeneracy, T/TF = 0.30(5), is reachedwith 2 × 10⁴ fermions at T = 65(5) nK. The efficiency of evaporation is reduced in thequantum degenerate regime because of Pauli blocking [DeM01b] and the superfluidity of theBEC [Tim98, Chi00]. This reduction, together with heating and loss, limits the obtainablefermionic degeneracy.
For the deepest evaporation examined, the potential depth corresponds only to two timesthe Fermi energy. The shallow potential can lead to increased evaporation of fermions in

97
87Sr84Sr
�������������
����
����
����
�����
�����
���
-200 -100 0 100 200
0
25
50
75
100
�������������-200 -100 0 100 200
0
5
10
15
20
Figure 5.5: Time-of-flight absorption images of a nearly pure 84Sr BEC and a 87Sr Fermi gasat T/TF = 0.45 after 15ms of expansion.
the mF = 9/2 state compared to bosons and fermions in other spin states. This preferentialevaporation can reduce the polarization of the fermionic sample. We verified that more than90% of the fermions occupy the mF = 9/2 state even at the end of evaporation.
Our degenerate Fermi sea is accompanied by a BEC containing 105 atoms. Figure 5.5shows time-of-flight absorption images of a BEC and a Fermi gas with T/TF = 0.45, taken15ms after release from a cigar-shaped trap with trap frequency ratio of 1.5. The BECexpansion is mean-field driven and leads to an inverted aspect ratio. By contrast, the 87Srimage shows the isotropic momentum distribution of the fermions.
In conclusion, we have created a double-degenerate Bose-Fermi mixture with the fermionsprepared in a single spin state. In the future, we plan to implement optical pumping andstate detection methods for the controlled preparation of fermions in multiple internal states.Loading the mixture into an optical lattice and further cooling of the sample are the nextsteps towards the exploration of the SU(10) symmetric Hubbard model, and quantum com-putation and simulation with strontium.
We thank Andrew Daley and Sebastian Diehl for stimulating discussions on the prospectsof strontium Bose-Fermi mixtures for future experiments.

98 Chapter 5. Double-degenerate Bose-Fermi mixture of strontium

Chapter 6
Publication: Bose-Einsteincondensation of 86Sr†
Phys. Rev. A 82, 041602 (2010)
Simon Stellmer,1,2 Meng Khoon Tey,1 Rudolf Grimm,1,2 and Florian Schreck,1
1Institut fur Quantenoptik und Quanteninformation, Osterreichische Akademie der Wissenschaften,6020 Innsbruck, Austria
2Institut fur Experimentalphysik, Universitat Innsbruck, 6020 Innsbruck, Austria
We report on the attainment of Bose-Einstein condensation of 86Sr. Thisisotope has a scattering length of about +800 a0 and thus suffers from fast three-body losses. To avoid detrimental atom loss, evaporative cooling is performedat low densities around 3× 1012 cm−3 in a large volume optical dipole trap. Weobtain almost pure condensates of 5× 10³ atoms.
Quantum degenerate gases of atoms with two valence electrons are an exciting field ofresearch. The electronic structure of these atoms is the basis for applications like ultrapreciseoptical clocks [Ido03, Lud08b, Lem09b, Ste04, Lem09a, Hon05, Koh09]. Quantum degeneratesamples open new possibilities such as the study of unique quantum many-body phenomena[Her09, Caz09, Gor10, Ger10] and novel schemes of quantum computation [Dal08, Gor09,Rei09, Sto08]. They are also an ideal starting point for the creation of molecules of two-electron atoms [Ciu04, Koc08] and molecules of two-electron atoms with alkali atoms [Zuc10,Gue10], which have applications in precision measurement [Kot09] or quantum simulationswith spin-dependent anisotropic long range interactions [Mic06]. The first two-electron atomcooled to quantum degeneracy was ytterbium [Tak03, Fuk07a, Fuk09b], followed by calcium[Kra09] and strontium last year. Quantum degenerate samples of bosonic 84Sr and 88Sr[Ste09, Mar09a, Mic10], as well as of fermionic 87Sr [DeS10, Tey10] have been created, butBose-Einstein condensation (BEC) of 86Sr has so far been elusive [Fer06a].
†The author developed the novel dipole trap design, improved the experimental setup, acquired the data,and contributed to the writing of the manuscript.
99

100 Chapter 6. Bose-Einstein condensation of 86Sr
The success of evaporative cooling with the goal to reach quantum degeneracy dependslargely on the ratio of elastic to inelastic collisions of the atomic species used [Ket96]. Thefour isotopes of strontium differ significantly in this respect. Despite its low natural abun-dance of 0.56%, 84Sr was the first to be Bose condensed as it offers ideal scattering proper-ties [Ste09, Mar09a]. 88Sr, which has a scattering length close to zero, and spin-polarizedfermionic 87Sr barely collide at ultralow temperatures. They could only be cooled to quan-tum degeneracy using mixtures with other isotopes or spin states [Mic10, DeS10, Tey10].86Sr poses the opposite challenge: its large scattering length of +800 a0 [Ste10a] leads toa large three-body loss rate constant [Fer06a]. Previously reported conditions of 86Sr in adipole trap led to an elastic to inelastic collision ratio that was insufficient for evaporativecooling [Fer06a]. Magnetic tuning of the scattering properties, as was an essential ingredientto circumvent similar difficulties on the way to BEC of cesium [Web03], is not available inalkaline-earth elements. Another approach to increase the ratio of elastic two-body collisionsand inelastic three-body collisions is to lower the density. This approach was important forBEC of 40Ca, which is also an isotope with large scattering length [Kra09], as well as forBEC of cesium.
In this Rapid Communication, we show that it is indeed possible to create 86Sr BECsby performing evaporation at comparatively low densities around 3× 1012 cm−3. To obtainsizeable atom numbers at these low densities, we implement a large volume optical dipoletrap.
Our experimental procedure initially follows the one used for Bose condensation of 84Sr[Ste09]. Zeeman-slowed atoms are captured and cooled by a “blue” magneto-optical trap(MOT) operating on the 5s2 1S0 − 5s5p 1P1 transition at a wavelength of 461 nm. A weakleak of the excited state of the cooling cycle continuously populates the 5s5p 3P2 metastablestate. Weak-field seeking atoms in this state can be trapped in a magnetic trap formed bythe quadrupole magnetic field used for the MOT. Metastable state atoms are accumulatedin the magnetic trap for 1 s. Further cooling and density increase is achieved by operating a“red MOT” on the 7.4 kHz linewidth 1S0 − 3P1 intercombination line at 689 nm. To increasethe capture velocity of the red MOT, we frequency modulate the light, producing sidebands,which cover a detuning range from a few ten kHz to a few MHz to the red of the transition.To load the red MOT, the metastable-state atoms in the magnetic trap are optically pumpedto the 1S0 ground state using the 5s5p
3P2 − 5s5d 3D2 transition at 497 nm. After loading,the MOT is compressed by reducing the MOT beam intensity and ramping off the frequencymodulation, resulting in a colder and denser sample. At this point the MOT contains 2×10⁷
atoms at a temperature of 1μK.
The following evaporative cooling stage significantly differs from our previous experimentson 84Sr. The atoms are transferred into a crossed-beam optical dipole trap, which is muchlarger than the one used before. The trapping geometry consists of a horizontal and a nearlyvertical beam, derived from a broadband ytterbium fiber laser operating at 1075 nm. Thehorizontal beam has an elliptic beam shape with a horizontal waist of 300μm and a verticalwaist of 33μm. The vertical beam is circular with a waist of 290μm and is used to provideadditional confinement along the weak direction of the horizontal beam towards the end ofevaporation. Initially, only the horizontal dipole trap beam is used and set to a power of2W. The resulting trap is oblate with horizontal trap oscillation frequencies of 3Hz and

101
30Hz, a vertical trap oscillation frequency of 260Hz, and a potential depth of 3.7μK, takinginto account gravitational sagging. This oblate trap geometry combines the requirement ofstrong enough confinement against gravity in the vertical direction with the requirement ofa large trap volume.
For optimum loading of the dipole trap, we adjust the intensity and detuning of the redMOT beams before switching them off. After 1 s of plain evaporation, 2.5× 10⁶ atoms at atemperature of 500 nK remain in the trap. The peak density is 3× 1012 cm−3 and the peakphase-space density is 0.05. Even at the temperature of 500 nK, unitary limitation leadsto a reduction of the thermally averaged elastic scattering cross section by a factor of twocompared to the zero temperature value. The elastic collision rate is 380 s−1.
0
1
23
linea
r den
sity
(108
m-1
)
�������������
0
1
23
0
1
23
0
1
23
0
1
23
T = 44 nK tev = 3.3 s
29 nK
22 nK
14 nK
10 nK
4.0 s
4.3 s
4.6 s
4.7 s
-200 0 100 200-100
Figure 6.1: Absorption images and integrated density profiles showing the BEC phase tran-sition for different times tev of the evaporative cooling ramp. The images are taken in thehorizontal direction at 45◦ to the horizontal trap axes, 25ms after release from the trap. Thefield of view is 400μm by 400μm. The solid line represents a fit with a bimodal distribu-tion, while the dashed line shows the Gaussian-shaped thermal part, from which the giventemperatures are derived.

102 Chapter 6. Bose-Einstein condensation of 86Sr
After the plain evaporation stage, forced evaporation is performed over 4.8 s. The powerof the horizontal dipole trap beam is reduced nearly exponentially to 740mW, with a longertime constant during the last 1.5 s. During the first 2.3 s of forced evaporation, the verticaldipole trap beam is increased to a power of 0.5W, at which it stays for the rest of theevaporation sequence. The vertical beam increases the confinement along the weak directionto 5Hz and does not provide any confinement along the vertical direction. The potentialdepth of the vertical beam in the radial directions is 200 nK. During evaporation atomsescape the trap mainly downwards by leaving the trap over the potential barrier formedby the horizontal beam and gravity. It is beneficial for evaporation that the vertical traposcillation frequency remains higher than the elastic collision rate, so that high energy atomsproduced by collisions can quickly move out of the trap. During evaporation the peak densityslightly drops to 1012 cm−3 and the elastic collision rate drops to 70 s−1 before condensation.At this point the temperature is ∼ 30 nK and the thermally averaged scattering cross sectionis very close to the zero-temperature value.
The phase transition from a thermal cloud to a BEC becomes evident in the appearanceof a bimodal distribution, as clearly visible in time-of-flight absorption images and in thecorresponding linear density profiles shown in Fig. 6.1. At higher temperature the distri-bution is thermal, exhibiting a Gaussian shape. Cooling below the critical temperature Tc
leads to the appearance of an additional, narrower and denser, elliptically shaped compo-nent: the BEC. The phase transition occurs after 4 s of evaporative cooling, when the powerof the horizontal beam is 820mW. At this point, the horizontal trap oscillation frequenciesare 5Hz and 18Hz, the vertical trap oscillation frequency is fvert = 115Hz and the trapdepth is about 110 nK, taking into account gravitational sagging. Note that despite thelarge scattering length, we are not in the collisionally hydrodynamic regime since the elasticscattering rate is only one tenth of 2πfvert [Kag97].
In order to analyze the phase-transition precisely, we fit bimodal distributions to the time-of-flight absorption images. The bimodal distributions consist of a Gaussian for the thermalpart of the cloud and an inverted paraboloid integrated along one direction for the BEC. Weextract the amount of condensed atomsN0, the total amount of atomsN and the temperatureT of the sample from the fits1. The condensate fraction N0/N as a function of temperature,scaled by the transition temperature of a non-interacting gas in the thermodynamic limitT 0
c , is shown in Fig. 6.2. From this data we extract a critical temperature of Tc/T0c = 0.9(1),
where the error is dominated by uncertainties in T 0c resulting from the uncertainty in the
atom number of about 25%. The phase-transition occurs at a temperature of 30(2) nK with3.7 ± 1 × 10⁴ atoms. The theoretically expected critical temperature Tc is reduced by 14%compared to T 0
c by interaction effects. Finite-size effects add a minor reduction of 1%. Theseeffects give a theoretically expected transition temperature of Tc = 0.85T 0
c [Gio96], which iswithin the uncertainty of our data.
After 4.8 s of evaporation, a nearly pure BEC of 5×10³ atoms is produced in a trap with
1To determine if a BEC is present, we also fit single Gaussian distributions to the images. If the fitresidue of such a fit is comparable to that of a bimodal fit, we consider the distribution as purely thermaland extract temperature and atom number from the single Gaussian fit, otherwise from the bimodal fit. Thetemperature is determined from the size of the Gaussian component in the vertical direction, in which thecloud has expanded far enough beyond its initial size to show the momentum distribution.
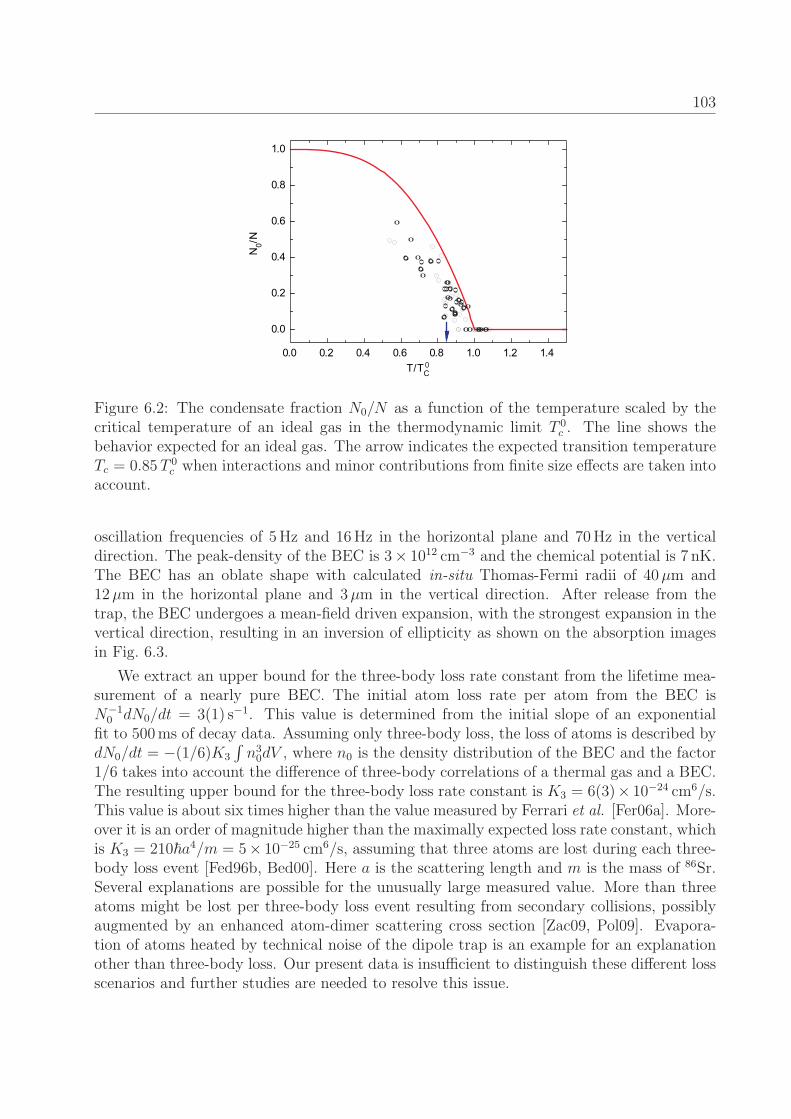
103
0.0 0.2 0.4 0.6 0.8 1.0 1.2 1.4
0.0
0.2
0.4
0.6
0.8
1.0
N0/N
T/TC0
Figure 6.2: The condensate fraction N0/N as a function of the temperature scaled by thecritical temperature of an ideal gas in the thermodynamic limit T 0
c . The line shows thebehavior expected for an ideal gas. The arrow indicates the expected transition temperatureTc = 0.85T 0
c when interactions and minor contributions from finite size effects are taken intoaccount.
oscillation frequencies of 5Hz and 16Hz in the horizontal plane and 70Hz in the verticaldirection. The peak-density of the BEC is 3× 1012 cm−3 and the chemical potential is 7 nK.The BEC has an oblate shape with calculated in-situ Thomas-Fermi radii of 40μm and12μm in the horizontal plane and 3μm in the vertical direction. After release from thetrap, the BEC undergoes a mean-field driven expansion, with the strongest expansion in thevertical direction, resulting in an inversion of ellipticity as shown on the absorption imagesin Fig. 6.3.
We extract an upper bound for the three-body loss rate constant from the lifetime mea-surement of a nearly pure BEC. The initial atom loss rate per atom from the BEC isN−1
0 dN0/dt = 3(1) s−1. This value is determined from the initial slope of an exponentialfit to 500ms of decay data. Assuming only three-body loss, the loss of atoms is described bydN0/dt = −(1/6)K3
∫n3
0dV , where n0 is the density distribution of the BEC and the factor1/6 takes into account the difference of three-body correlations of a thermal gas and a BEC.The resulting upper bound for the three-body loss rate constant is K3 = 6(3)× 10−24 cm6/s.This value is about six times higher than the value measured by Ferrari et al. [Fer06a]. More-over it is an order of magnitude higher than the maximally expected loss rate constant, whichis K3 = 210�a4/m = 5× 10⁻²⁵ cm6/s, assuming that three atoms are lost during each three-body loss event [Fed96b, Bed00]. Here a is the scattering length and m is the mass of 86Sr.Several explanations are possible for the unusually large measured value. More than threeatoms might be lost per three-body loss event resulting from secondary collisions, possiblyaugmented by an enhanced atom-dimer scattering cross section [Zac09, Pol09]. Evapora-tion of atoms heated by technical noise of the dipole trap is an example for an explanationother than three-body loss. Our present data is insufficient to distinguish these different lossscenarios and further studies are needed to resolve this issue.

104 Chapter 6. Bose-Einstein condensation of 86Sr
0 ms 25 ms
Figure 6.3: Inversion of aspect ratio during the expansion of a pure BEC. The images (fieldsof view 300μm × 300μm) are taken along the horizontal direction and show the BEC in thetrap (left) and after 25ms free expansion (right).
In conclusion, we have produced a Bose-Einstein condensate of 86Sr containing 5 × 10³
atoms. With this achievement all stable isotopes of strontium have been cooled to quantumdegeneracy. The large scattering length of 86Sr leads to a very large three-body loss ratecoefficient, which poses a challenge for evaporative cooling. We have shown that performingevaporation at low density in a large volume trap is a possible way to overcome this problem.The BEC of 86Sr enriches the possibilities opened up by strontium quantum gases. The largescattering length of 86Sr originates from a weakly bound state in the molecular potential.This state will influence the properties of optical Feshbach resonances [Ciu05, Eno08]. TheBEC of 86Sr increases the options for quantum degenerate mixtures of different Sr isotopesor of mixtures of Sr with other elements. This wider choice can be important, for examplein the search for magnetic Feshbach resonance in Sr-alkali mixtures suitable for moleculecreation [Zuc10].
We thank P. S. Julienne for fruitful discussions. We gratefully acknowledge support bythe Austrian Ministry of Science and Research (BMWF) and the Austrian Science Fund(FWF) in the form of a START grant under project number Y507-N20. We also gratefullyacknowledge support by the European Commission under project number 250072 iSENSE.

Chapter 7
Publication: Detection andmanipulation of nuclear spin states infermionic strontium†
Phys. Rev. A 84, 043611 (2011)
Simon Stellmer,1,2 Rudolf Grimm,1,2 and Florian Schreck,1
1Institut fur Quantenoptik und Quanteninformation, Osterreichische Akademie der Wissenschaften,6020 Innsbruck, Austria
2Institut fur Experimentalphysik, Universitat Innsbruck, 6020 Innsbruck, Austria
Fermionic 87Sr has a nuclear spin of I = 9/2, higher than any other elementwith similar electronic structure. This large nuclear spin has many applicationsin quantum simulation and computation, for which preparation and detectionof the spin state are requirements. For an ultracold 87Sr cloud, we show twocomplementary methods to characterize the spin-state mixture: optical Stern-Gerlach state separation and state-selective absorption imaging. We use thesemethods to optimize the preparation of a variety of spin-state mixtures by opticalpumping and to measure an upper bound of the 87Sr spin relaxation rate.
7.1 Introduction
Fermions with two valence electrons, like 43Ca, 87Sr, 171Yb, and 173Yb, have a rich in-ternal state structure, which is at the heart of recent proposals for quantum simulationand computation [Caz09, Gor10, Wu03, Wu06, FF10, Her09, Xu10, Hun11, Ger10, Coo11b,Ber11, Gor11a, Dal08, Gor09]. Unlike bosonic isotopes of these elements, the fermions
†The author performed the necessary upgrade of the machine, mainly involving additional laser systemsand B-field coils. He invented the bi-chromatic OSG and introduced the enhancement by an applied B-field,and he and F. S. explored the narrow-line imaging. He acquired the data and contributed to the writing ofthe manuscript. The numerical simulations were performed by F. S.
105
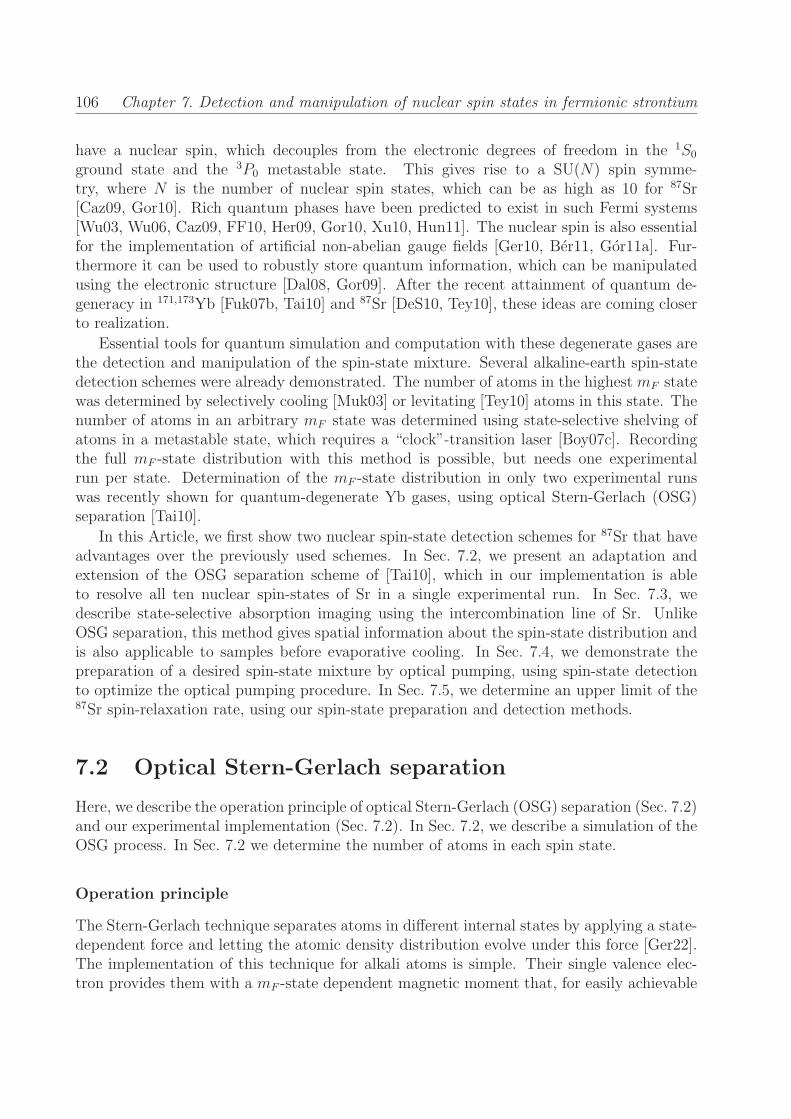
106 Chapter 7. Detection and manipulation of nuclear spin states in fermionic strontium
have a nuclear spin, which decouples from the electronic degrees of freedom in the 1S0
ground state and the 3P0 metastable state. This gives rise to a SU(N) spin symme-try, where N is the number of nuclear spin states, which can be as high as 10 for 87Sr[Caz09, Gor10]. Rich quantum phases have been predicted to exist in such Fermi systems[Wu03, Wu06, Caz09, FF10, Her09, Gor10, Xu10, Hun11]. The nuclear spin is also essentialfor the implementation of artificial non-abelian gauge fields [Ger10, Ber11, Gor11a]. Fur-thermore it can be used to robustly store quantum information, which can be manipulatedusing the electronic structure [Dal08, Gor09]. After the recent attainment of quantum de-generacy in 171,173Yb [Fuk07b, Tai10] and 87Sr [DeS10, Tey10], these ideas are coming closerto realization.
Essential tools for quantum simulation and computation with these degenerate gases arethe detection and manipulation of the spin-state mixture. Several alkaline-earth spin-statedetection schemes were already demonstrated. The number of atoms in the highest mF statewas determined by selectively cooling [Muk03] or levitating [Tey10] atoms in this state. Thenumber of atoms in an arbitrary mF state was determined using state-selective shelving ofatoms in a metastable state, which requires a “clock”-transition laser [Boy07c]. Recordingthe full mF -state distribution with this method is possible, but needs one experimentalrun per state. Determination of the mF -state distribution in only two experimental runswas recently shown for quantum-degenerate Yb gases, using optical Stern-Gerlach (OSG)separation [Tai10].
In this Article, we first show two nuclear spin-state detection schemes for 87Sr that haveadvantages over the previously used schemes. In Sec. 7.2, we present an adaptation andextension of the OSG separation scheme of [Tai10], which in our implementation is ableto resolve all ten nuclear spin-states of Sr in a single experimental run. In Sec. 7.3, wedescribe state-selective absorption imaging using the intercombination line of Sr. UnlikeOSG separation, this method gives spatial information about the spin-state distribution andis also applicable to samples before evaporative cooling. In Sec. 7.4, we demonstrate thepreparation of a desired spin-state mixture by optical pumping, using spin-state detectionto optimize the optical pumping procedure. In Sec. 7.5, we determine an upper limit of the87Sr spin-relaxation rate, using our spin-state preparation and detection methods.
7.2 Optical Stern-Gerlach separation
Here, we describe the operation principle of optical Stern-Gerlach (OSG) separation (Sec. 7.2)and our experimental implementation (Sec. 7.2). In Sec. 7.2, we describe a simulation of theOSG process. In Sec. 7.2 we determine the number of atoms in each spin state.
Operation principle
The Stern-Gerlach technique separates atoms in different internal states by applying a state-dependent force and letting the atomic density distribution evolve under this force [Ger22].The implementation of this technique for alkali atoms is simple. Their single valence elec-tron provides them with a mF -state dependent magnetic moment that, for easily achievable

7.2. Optical Stern-Gerlach separation 107
(a)
1015
1510
206
283
351
6203
281354555
45 55
+ 9/2- 9/2
1S0
(c)
(b)
0.20.10-0.1-20
0
20
40
60
pote
ntia
l (μK
)
z position (mm)
0
-10
10
0 0.05-0.05
mF = +9/2
mF = -9/2
�-
�+
B�+
atomic cloud
�-
gravity
mF
zy
x
3P1
Figure 7.1: Principle of OSG separation. (a) σ+- and σ−-polarized laser beams propagatingin the y-direction create dipole forces on an atomic cloud that is located on the slopes ofthe Gaussian beams. (b) The laser beams are tuned close to the 1S0(F = 9/2) − 3P1(F
′ =11/2) intercombination line, creating attractive (σ− beam) or repulsive (σ+ beam) dipolepotentials. Each mF state experiences a different potential because of the varying linestrength of the respective transition. (c) The potentials resulting from dipole potentials andthe gravitational potential. The dashed line marks the initial position of the atoms. Theinset shows the relevant region of the potentials, offset shifted to coincide at the position ofthe atoms, which clearly shows the different gradient on each mF state.
magnetic field gradients, results in mF -state dependent forces sufficient for state separa-tion [SK98a]. By contrast, atoms with two valence electrons possess only a weak, nuclearmagnetic moment in the electronic ground state, which would require the application of im-practically steep magnetic field gradients. An alternative is OSG separation, where a statedependent dipole force is used. OSG separation was first shown for a beam of metastablehelium [Sle92], where orthogonal dressed states of the atoms were separated by a resonantlaser field gradient. The case of interest here, OSG mF -state separation, was recently realizedfor a quantum degenerate gas of Yb, by using mF -state dependent dipole forces [Tai10].
We first explain the basic operation principle of Sr OSG separation before discussingour experimental implementation. The experimental situation is shown in Fig. 7.1(a). Anultracold cloud of 87Sr atoms in a mixture of mF states is released from an optical dipole

108 Chapter 7. Detection and manipulation of nuclear spin states in fermionic strontium
trap. The mF -state dependent force is the dipole force of two laser beams propagating in theplane of the pancake-shaped cloud, one polarized σ+, the other σ−. The diameter of theseOSG laser beams is on the order of the diameter of the cloud in the x-direction. The beamsare displaced vertically by about half a beam radius to produce a force in the z-directionon the atoms. To create a mF -state dependent force, the OSG beams are tuned close tothe 1S0(F = 9/2) − 3P1(F
′ = 11/2) intercombination line (wavelength 689 nm, linewidth7.4 kHz), so that this line gives the dominant contribution to the dipole force. A guidingmagnetic field is applied in the direction of the laser beams such that the beams couple onlyto σ+ or σ− transitions, respectively. The line strength of these transitions varies greatlywith the mF state [Met99], see Fig. 7.1(b), resulting in different forces on the states. For173Yb, this variation, together with a beneficial summation of dipole forces from transitionsto different 3P1 hyperfine states, was sufficient to separate four of the six mF states usingjust one OSG beam [Tai10]. The remaining two mF states could be analyzed by repeatingthe experiment with opposite circular polarization of the OSG beam.
Strontium, which has nearly twice as many nuclear spin states, requires an improved OSGtechnique to separate the states. The improvement consists of applying two OSG beamswith opposite circular polarization at the same time. The σ+-polarized beam producesdipole forces mainly on the positive mF states, the σ− beam mainly on the negative mF
states. By positioning the beams in the appropriate way (see below), the forces point inopposite directions and all mF states can be separated in a single experimental run. A secondimprovement is to enhance the difference in the dipole forces on neighboring mF states bytuning already strong transitions closer to the OSG beam frequency using a magnetic field,which splits the excited state mF ′ states in energy. For our settings, the difference in forceson neighboring high |mF | states is enhanced by up to 25%, which helps to separate thosestates. This enhancement scheme requires the σ+-polarized OSG beam to be tuned to theblue of the resonance, whereas the σ− beam has to be tuned to the red of the resonance;see Fig. 7.1(b). Both beams are centered above the atomic cloud so that the repulsive bluedetuned beam produces a force pointing downwards, whereas the attractive red detunedbeam produces a force pointing upwards.
Experimental demonstration
We demonstrate OSG separation of a cloud of 4.5 × 10⁴ 87Sr atoms in a mixture of mF
states. To prepare the cloud, Zeeman slowed 87Sr atoms are laser cooled in two stages, firstin a “blue” magneto-optical trap (MOT) on the broad-linewidth 1S0 − 1P1 transition, thenin a “red” MOT on the narrow-linewidth 1S0 − 3P1 transition [DeS10, Tey10]. Next, theatoms are transferred to a pancake-shaped optical dipole trap with strong confinement inthe vertical direction. The sample is evaporatively cooled over seven seconds. At the endof evaporation the trap oscillation frequencies are fx = 19Hz, fy = 11Hz, and fz = 85Hz,where the coordinate system is defined in Fig. 7.1(a). The collision rate at this stage isonly 1 s−1, which is insufficient for complete thermalization. Since atoms are evaporatedmainly downwards, along the z-direction, the sample is not in cross-dimensional thermalequilibrium, having a temperature of 25 nK in the z-direction and twice that value in the xy-plane. The sample is non-degenerate and the 1/e-widths of the Gaussian density distribution

7.2. Optical Stern-Gerlach separation 109
-0.2
0-0
.10
0.1
0.2
12
mF
+ 9/2
- 9/2
(a)
(b)
experiment simulation
z po
sitio
n (m
m)
linear density (105 mm-1)
2
4
6
8 103
-9/2 -7/2 -5/2 -3/2 -1/2 1/2 3/2 5/2 7/2 9/20
atom
num
ber
mF
Figure 7.2: OSG separation of the ten 87Sr nuclear spin states. (a) Atomic density distri-bution after OSG separation integrated over the ((x + y)-direction obtained in experimentand simulation. On the right, the density distribution of the experiment integrated alongthe x- and y-directions is shown together with a fit consisting of ten Gaussian distributions.(b) Atom number distribution determined from the area of the Gaussian distributions (redsquares) and the fit of the simulation to the experiment (black circles).
are wx = 55μm, wy = 85μm, and wz = 7μm.
The OSG beams propagate along the y-direction. The power of the σ+ (σ−) beam is4mW (0.5mW), the waist is ∼ 80μm (∼ 60μm), and the beam center is displaced ∼ 70μm(∼ 40μm) above the cloud. Both beams create dipole forces of similar magnitude since thereduced power of the σ− beam compared to the σ+ beam is partially compensated by itsdecreased waist. At zero magnetic field, the σ± beam is detuned ±100MHz from resonance.To increase the difference in dipole potential on neighboring mF states, a magnetic field of16G is applied parallel to the OSG beams, which splits neighboring 3P1(F
′ = 11/2) mF ′
states by 6.1MHz. With this field applied, the σ± beam has a detuning of ±66.4MHz tothe 1S0(F = 9/2, mF = ±9/2)− 3P1(F
′ = 11/2, mF = ±11/2) transition and a detuning of±121.4MHz to the 1S0(F = 9/2, mF = ∓9/2)− 3P1(F
′ = 11/2, mF = ∓7/2) transition, seeFig. 7.1(b).
OSG separation is started by simultaneously releasing the atoms from the dipole trapand switching on the OSG beams. The atoms are accelerated for 1.6ms by the OSG beams.Then the beams are switched off to avoid oscillations of atoms in the dipole trap formed bythe red detuned OSG beam. The atoms freely expand for another 2.3ms before an absorptionimage on the 1S0 − 1P1 transition is taken. The result is shown in Fig. 7.2(a). All ten mF

110 Chapter 7. Detection and manipulation of nuclear spin states in fermionic strontium
states are clearly distinguishable from each other.To obtain a good separation of the mF states and an even spacing between them, OSG
beam waists, the timing of the OSG separation sequence, the applied magnetic field, and thebeam positions were optimized. We found that for all other parameters fixed, the positionof the OSG beams is critical and has to be aligned to better than 10μm.
To quantify the separation of the states, we fit ten Gaussian distributions to the densitydistribution integrated along the x- and y-directions, see Fig. 7.2(a). We obtain a separationof adjacent states between 28 and 38μm, similar to the 1/e-widths of the distributions, whichare between 24 and 36μm. The 1/e-width expected from initial size and temperature after3.9ms total expansion time is 19μm in the z-direction, slightly narrower than the width ofthe narrowest distributions observed. From the Gaussian fits we also obtain an estimationof the atom number in each state, see Sec. 7.2.
OSG separation works only well for very cold samples. If the temperature is too high, thesample expands too fast and the individual mF -state distributions cannot be distinguished.For a density minimum to exist between two neighboring mF -state distributions of Gaussianshape, the 1/e-widths have to be smaller than
√2 times the distance between the maxima of
the distributions. For our smallest separation of 24μm, this condition corresponds to sampleswith a temperature below 100 nK, which can only be obtained by evaporative cooling.
Simulation
We perform a simulation of classical trajectories of atoms to better understand the OSG sep-aration process. The simulation takes into account the dipole potentials of the OSG beams,discrete spontaneous scattering events of OSG beam photons, and gravity. The phase-spacedistribution of simulated atoms is initialized using the experimentally measured trap fre-quencies and temperatures. The calculated density distributions are fit to the experimentalresult using the OSG beam waists and positions and the atom number of each state as fitparameters. The detunings and intensities of the OSG beams and the value of the magneticfield are fixed to the values used in the experiment1. The parameters of the σ+ (σ−) beamresulting in the best fit are a waist of 90μm (56μm) and a displacement of the beam centerrelative to the atomic cloud’s center by 74μm (35μm) in the z-direction and by 0μm (7μm)in the x-direction. With these parameters, the simulation matches the experimental resultwell, see Fig. 7.2(a).
We now analyze the OSG separation process in detail using the simulation. The OSGbeam potential gradients on atoms in different mF states are nearly evenly distributed be-tween 47m/s2 downwards for the +9/2 state and 32m/s2 upwards for the −9/2 state (seeinset of Fig. 7.1(c)), resulting in the nearly evenly spaced mF -state distribution after OSGseparation. About 25% of the atoms spontaneously scatter photons from the OSG beams,which leads to a widening of the individual mF -state distributions in the z-direction by atmost 20%, which only insignificantly reduces our ability to distinguish the mF states.
Also the 3P1 F ′ = 7/2 and F ′ = 9/2 hyperfine levels contribute noticeably to the dipoleforces created by the OSG beams on the low |mF | states, which at first glance might be
1Assuming OSG beam intensities different by ±20% from the measured values did not change the outcomeof the simulation significantly after fitting OSG beam waists and positions again.

7.2. Optical Stern-Gerlach separation 111
(a)(I) (II) (III)
(b)
(c)
Figure 7.3: Simulated density distributions of atoms after OSG separation. Shown aredistributions integrated along x (aI), along the (x+ y)-direction (aII,b), and along y (aIII,c).The angle symbols indicate the angle between the direction of integration and the directionof the OSG beams, the y-direction. (a) The density distribution obtained from a simulationwith parameters fitted to the outcome of the experiment, integrated along different directions.The experimental situation corresponds to (aII). (b) Influence of the two OSG beams andthe magnetic field on OSG separation. (bI) As (aII), but no σ− beam. (bII) As (aII), butno σ+ beam. (bIII) As (aII), but no magnetic field and reduced OSG beam detuning. (c)Alternative scheme of OSG separation using two blue detuned OSG beams and variationsof that scheme, see main text.
surprising since the detuning of the OSG beams from those states is more than an orderof magnitude larger than the detuning from the F ′ = 11/2 state. The reason is that thedipole forces from the σ+ and σ− OSG beams considering only the F ′ = 11/2 hyperfinelevel nearly compensate each other for low |mF | states, whereas the dipole forces from bothbeams considering the other hyperfine levels point into the same direction and in additionare strongest for low |mF | states. The positions of the low |mF | states after a simulated OSGseparation with and without considering the influence of the F ′ = 7/2 and F ′ = 9/2 levelschanges by up to 13μm. By contrast, the positions of the mF = ±9/2 states are changed byless than 2μm. It is not possible to obtain a good fit of the simulation to the experiment ifthe influence of the 3P1 F ′ = 7/2 and F ′ = 9/2 hyperfine levels is neglected.
The shape of the density distribution is analyzed in row (a) of Fig. 7.3. The densitydistribution is shown as it would appear using absorption imaging along the x- (aI), the(x + y)- (aII), or the y-direction (aIII). Case (aII) is the one realized in the experiment.

112 Chapter 7. Detection and manipulation of nuclear spin states in fermionic strontium
Strong distortions of the spatial distribution of each mF state compared to a free expansionare visible. They are induced by the finite size of the OSG beams. The blue detuned beamexpels high mF -state atoms onto cylindrical surfaces, whereas the red detuned beam attractslow mF -state atoms and acts like a focussing lens.
The role of each OSG beam and the magnetic field are demonstrated in row (b) of Fig. 7.3.Shown are the results of simulations with only the blue (bI) or the red (bII) detuned OSGbeam present. With only one OSG beam, at best four mF states can be well separated,illustrating the need of two beams for Sr OSG separation. In simulation (bIII) the magneticfield was set to zero, which removes the energy splitting of the 3P1(F
′ = 11/2) manifold. Toachieve the same acceleration on the mF = ±9/2 states as with magnetic field, the detuningof the σ± OSG beam was set to ±66.4MHz from the center of the F ′ = 11/2 manifold.Without magnetic field, the spatial splitting between neighboring high |mF | states is slightlyreduced. To separate these states further than done in the experiment, a larger magneticfield could be used.
The simulation also suggests an alternative OSG separation scheme, which is demon-strated in row (c) of Fig. 7.3, but which we did not check experimentally. Instead of oneblue and one red detuned OSG beam, the scheme uses two blue detuned OSG beams of op-posite circular polarization. As before, the σ+ beam is placed above the cloud, acts mainlyon the high mF -state atoms and pushes them downwards. The σ− beam uses now the samedetuning, power, and waist as the σ+ beam, but is placed below the initial center of theatomic cloud. The location of the two beams in the z-direction is symmetric with respectto the initial position of the atomic cloud. The σ− beam acts mainly on the negative mF -state atoms and pushes them upwards. Since this beam is now blue detuned, it does notact similar to a lens as the red detuned σ− beam used in the experiment and leads to lessdistortion of the cloud. Three cases of this alternative scheme are shown in row (c), alwaysassuming an even atom number distribution over the mF states. Case (cI) uses σ+-beamparameters equivalent to the ones used for the simulations of row (a) and σ−-beam param-eters deduced from those as described above. In addition the magnetic field is set to zero.This situation leads to a nearly symmetric separation of positive and negative mF states,where the symmetry is only slightly broken by gravity. Compared to the situation realizedin the experiment, atoms in low mF states are better separated.
One slight drawback of this scheme is that the application of a magnetic field as usedin the experiment will only increase separation of positive mF states. The separation ofnegative mF states will even be decreased. This effect is demonstrated in case (cII), wherea magnetic field similar to the one used in the experiment is assumed and the detunings ofthe OSG beams changed such that the initial accelerations of the mF = ±9/2 states arethe same as in case (cI). The reason for the decreased separation of negative mF states isa reduction of the difference in the dipole forces of the σ− beam on neighboring mF states.This reduction comes from the Zeeman splitting of the 3P1 F ′ = 11/2 level, which willtune transitions with strong line strength farther away from the σ−-beam wavelength thantransitions with weak linestrength.
The distortions of the density distribution after OSG separation can be reduced if morepower is available for the OSG beams. Then the waist of the OSG beams can be made widerin the x-direction keeping the same potential in the z-direction. This leads to a reduction

7.3. Spin-state dependent absorption imaging 113
of unwanted potential gradients along x, which are the source of the distortions well visiblee.g. in (aIII) or (cI). The reduction is demonstrated in case (cIII), where the power and waistin the x-direction of the OSG beams has been doubled compared to case (cI).
Determination of the atom number distribution
To obtain the number of atoms in each mF state, we use two approaches. The first onedetermines the atom numbers from ten Gaussian fits to the density distribution integratedalong the x- and y-directions, see Fig. 7.2(a). The second approach uses the fit of thesimulation to the data described above, which takes the distortions of the distribution betterinto account, but relies on our ability to accurately model the OSG separation process. Asystematic effect should be considered in both approaches: the mF -state dependence of theaverage photon number absorbed by an atom during absorption imaging. This dependencehas its origin in the mF -state dependent line strength of the absorption imaging transition.Under our imaging conditions (probe beam of circularly polarized light on the 1S0 − 1P1
transition with an intensity of 0.5mW/cm2, an angle of 45◦ to the quantization axis givenby the magnetic field, and 40μs exposure time), on average about 40 photons are scatteredper atom, making optical pumping during absorption imaging important. We simulate thisoptical pumping process to obtain an estimate of the number of photons scattered by an atomin dependence of its initial mF state. We find that the optical pumping process dependsstrongly on the detuning of the absorption imaging beam to the closely spaced hyperfinestates of the 1P1 excited state, which are mixed at the 16G magnetic field applied. Becauseof this dependence, not only the absolute number of photons scattered per atom dependson the detuning, but also the ratio of the number of photons scattered for different initialstates. For atoms starting in the mF = +9/2 or the mF = −9/2 state the ratio is highest,about 1.2(2), where the error comes from the uncertainty of the laser detuning used in theexperiment. Further experimental study of this effect is needed to determine the relativeatom numbers better. Simply assuming equal and maximal absorption by atoms in eachmF state, the atom number distributions resulting from the two approaches are shown inFig. 7.2(b). The atom numbers of both approaches agree to better than 20% for all buttwo mF states. The agreement is less good for the mF = +9/2 state, which has the mostdistorted distribution, and the mF = −7/2 state, for which the Gaussian fit underestimatesthe width.
7.3 Spin-state dependent absorption imaging
We also demonstrate a complementary method of mF -state detection: mF -state dependentabsorption imaging. This method is often used for alkali atoms employing a broad linewidthtransition [Mat98]. For Sr, mF -state resolved imaging on the broad
1S0−1P1 transition is notpossible since the magnetic field splitting of the exited state mF ′ states is smaller than thelinewidth of the transition [Boy07c]. But mF -state dependent imaging can be realized usingthe narrow 1S0(F = 9/2)−3P1(F
′ = 11/2) intercombination line. To achieve state selectivity,we apply a magnetic field of 0.5G, which splits neighboring mF ′ states by 200 kHz, which is27 times more than the linewidth of the imaging transition. The advantages of this method

114 Chapter 7. Detection and manipulation of nuclear spin states in fermionic strontium
-1.0 -0.5 0 1.00.5detuning (MHz)
atom
num
ber (
arb.
uni
ts)
0.0
0.2
0.4
0.6
0.8
1.0
(a)
(b)
9/2- 9/2 - 7/2 - 5/2 - 3/2 - 1/2 1/2 3/2 5/2 7/2
�¯
�+
line
stre
ngth
(arb
. uni
ts)
0.0
0.2
0.4
0.6
0.8
1.0
- 9/2 - 7/2 - 5/2 - 3/2 - 1/2 1/2 3/2 5/2 7/2
mF
mF 9/2
Figure 7.4: mF -state resolved absorption imaging on the 1S0(F = 9/2) − 3P1(F′ = 11/2)
intercombination line. (a) Spectrum of a 87Sr sample with nearly homogeneous mF -statedistribution. The spectrum was obtained using σ−-polarized light and shifting transitionscorresponding to different mF states in frequency by applying a magnetic field of 0.5G. Thecircles give the line strengths of the transitions. (b) Absorption images taken on the maximaof absorption of each mF state using σ+ or σ− polarized light.
compared to OSG separation is its applicability to samples that have not been evaporativelycooled, spatially resolved imaging, and a near perfect suppression of signal from undesiredmF states. A disadvantage of this method is that it delivers a reduced signal compared toimaging on the 1S0 − 1P1 transition, as done after OSG separation. The reduction comesfrom the narrower linewidth, optical pumping to dark states during imaging, and weak linestrengths for some mF states.
To demonstrate absorption imaging on the intercombination line, we use a sample of106 atoms at a temperature of 0.5μK in a trap with oscillation frequencies of fx = 45Hz,fy = 40Hz, and fz = 220Hz, obtained after 1.4 s of evaporation. Figure 7.4 shows aspectroscopy scan and absorption images taken on the maxima of the absorption signal ofthis sample. The absorption is stronglymF -state dependent and to obtain the best signal, thepolarization of the absorption imaging light has to be adapted to the mF state of interest:σ+(σ−) for high (low) mF states and π for low |mF | states. For our absorption imagingconditions (an intensity of 15μW/cm2, which is 5 times the saturation intensity, and anexposure time of 40μs), even atoms in mF states corresponding to the strongest transitionwill on average scatter less than one photon. Therefore, for a sample with homogeneousmF -state distribution, the maximum absorption is expected to be nearly proportional tothe mF -state dependent line strength of the transition, which we confirm using a simulationof the absorption imaging process2. This proportionality is observed in the experimental
2The simulation determines the average number of photons scattered by an atom in a certain mF statefor a distribution of atoms corresponding to the one used in our experiment. It takes into account the
7.4. Preparation of spin-state mixtures 115
(a) (b) (c)
+ 9/2
- 9/2
mF
Figure 7.5: Examples of state mixtures prepared by optical pumping and analyzed usingOSG separation. (a) The mF = 1/2 and 5/2 states were pumped to the 3/2 state usingσ+ and σ− light, respectively. (b) The negative mF states were pumped to the positive mF
states. (c) A two-state mixture obtained by pumping the lower mF states to the mF = 5/2and 7/2 states and subsequently pumping the mF = 7/2 state to the mF = 9/2 state.
data, indicating that the sample used has a nearly homogeneous mF -state distribution.The Lorentzian linewidth of the absorption lines is ∼ 40 kHz. Power and interaction-timebroadening result in a linewidth of 30 kHz. In addition Doppler broadening and collisionalbroadening are expected to contribute to the linewidth [Ido05].
7.4 Preparation of spin-state mixtures
For applications of 87Sr to quantum simulation and computation, themF -state mixture needsto be controlled. We produce a variety of different mixtures by optical pumping, making useof OSG separation to quickly optimize the optical pumping scheme and quantify the result.Optical pumping is performed on the 1S0(F = 9/2)− 3P1(F
′ = 9/2) intercombination line,before evaporative cooling. A field of 3G splits neighboring excited state mF ′ states by255 kHz. This splitting is well beyond the linewidth of the transition of 7.4 kHz, allowingtransfer of atoms from specific mF states to neighboring states using σ±- or π-polarized light,the choice depending on the desired state mixture. Sequences of pulses on different mF statescan create a wide variety of state mixtures, of which three examples are shown in Fig. 7.5.Optical pumping on the 1S0(F = 9/2)− 3P1(F
′ = 7/2) and 1S0(F = 9/2)− 3P1(F′ = 11/2)
transitions yields similar results.
7.5 Determination of an upper bound of the spin-relax-
ation rate
A low nuclear spin-relaxation rate is an essential requirement to use 87Sr for quantum sim-ulation and computation [Caz09, Gor10]. The rate is expected to be small since the nuclear
Zeeman splitting of the excited state, the Doppler shift, acceleration of atoms by photon absorption andemission, and optical pumping. The result of the simulation is that the number of photons absorbed byan atom initially in a certain mF state is to within 10% proportional to the line strength of the transitioncorresponding to this mF state.

116 Chapter 7. Detection and manipulation of nuclear spin states in fermionic strontium
(a) (b) (c)
t = 0 s t = 10 sB = 5 G B = 500 G
7/2
5/2
mF
Figure 7.6: Absence of spin relaxation in 87Sr. Shown are absorption images of the mF = 5/2and 7/2 state averaged over 25 runs of the experiment. Atoms were initially removed fromthe mF = 5/2 state by optical pumping, whereas all other mF states remained populated(a). After 10 s hold at a magnetic field of 5G (b) or 500G (c) no mF = 5/2 atoms aredetectable, showing the low rate of spin relaxation.
spin does not couple to the electronic degrees of freedom in the ground state. Here, we useour nuclear spin state preparation and detection techniques to determine an upper boundfor this spin relaxation rate. We start with a sample of 1.5 × 10⁶ atoms with near uniformmF -state distribution and a temperature of T = 1.5μK, confined in a trap with oscillationfrequencies fx = 68Hz, fy = 67Hz, and fz = 360Hz, obtained after transferring the atomsfrom the magneto-optical trap to the dipole trap and adiabatic compression of the trap. Weoptically pump all atoms from the mF = 5/2 state to neighboring states and look out forthe reappearance of atoms in this state by spin relaxation during 10 s of hold. The atomnumber in the mF = 5/2 state and, as a reference, the mF = 7/2 state are determined fromabsorption images. During 10 s of hold at a magnetic field of either 5G or 500G the numberof mF = 5/2 atoms remains below our detection threshold of about 104 atoms, indicating alow spin-relaxation rate, see Fig. 7.6. From this observation, we can obtain an upper boundfor the spin-relaxation rate. To obtain a conservative bound, we assume that the dominantprocess leading to the creation of mF = 5/2-state atoms are collisions of mF = 7/2- withmF = 3/2-state atoms, forming two mF = 5/2-state atoms. Since the second order Zeemaneffect is negligible no energy is released in such a collision and the resulting mF = 5/2-stateatoms will remain trapped. The number of atoms created in the mF = 5/2 state by spinrelaxation after a hold time t is N5/2 = 2Nstategsrnt, where Nstate = 1.5 × 10⁵ is the atomnumber in each populated state, gsr the spin-relaxation rate constant, n = 7.5 × 1011 cm−3
the mean density and the factor 2 takes into account that two atoms are produced in themF = 5/2 state per collision. From our measurement we know that N5/2 < 104, from whichwe obtain an upper bound of 5 × 10⁻¹⁵ cm3s−1 for the spin-relaxation rate constant. This

7.6. Conclusion 117
bound for the rate constant corresponds for our sample to a spin relaxation rate which is2000 times smaller than the elastic scattering rate. The rate constant could be even ordersof magnitude smaller than the already low upper bound we obtained [Jul].
7.6 Conclusion
In conclusion, we have demonstrated two complementary methods to characterize the spin-state mixture of an ultracold cloud of 87Sr. Optical Stern-Gerlach separation can characterizethe spin-state mixture of an evaporatively cooled sample in a single experimental run andis very useful for fast optimization of optical pumping, which we have demonstrated bythree examples. State selective absorption imaging can deliver spatially resolved informationabout the spin state, also for samples at μK temperatures. Using these methods, we havedetermined an upper bound for the 87Sr spin relaxation rate and have found it to be low,as expected. These methods will be necessary tools for the implementation of quantumsimulations and quantum computation making use of the 87Sr nuclear spin.
We gratefully acknowledge support from the Austrian Ministry of Science and Research(BMWF) and the Austrian Science Fund (FWF) through a START grant under projectnumber Y507-N20 as well as support from the European Commission under project number250072 iSENSE.

118 Chapter 7. Detection and manipulation of nuclear spin states in fermionic strontium
Chapter 8
Improved production of degeneratequantum gases of strontium
We report on improved experiments to generate Bose-Einstein condensates (BECs) anddegenerate Fermi gases of strontium. The main improvement results from the use of adifferent dipole trap laser and a new geometry of the trap; see Chpt. 2.7.4. Together witha reduced linewidth of the 689-nm laser and an increased flux from the oven, we are ableto create a BEC of the 84Sr isotope exceeding 107 atoms, which is a 50-fold improvementover the experiments reported in Chpt. 4 and [Mar09a]. We improve the current atomnumber of the 86Sr BEC by a factor of five compared to the work presented in Chpt. 6,and refine the generation of the attractively interacting 88Sr BEC. We present a scheme togenerate 84Sr BECs with a cycle time of 2 s, which is the fastest production rate of BECsever achieved. We create deeply-degenerate Fermi gases with T/TF as low as 0.1, where thenumber of spin states can be set to any value between 1 and 10. Furthermore, we reporton a total of five different double-degenerate Bose-Bose and Bose-Fermi mixtures. Thesestudies bridge the gap between proof-of-principle experiments performed in the past threeyears, and applications of these degenerate samples that are anticipated in the near future.
8.1 Introduction
All of the bosonic Sr isotopes have already been brought to degeneracy [Ste09, Mar09a,Mic10, Ste10b], and degenerate Fermi gases have been reported as well [DeS10, Tey10]. Theseexperiments demonstrate the feasibility of degeneracy in Sr, which was sought-after for solong. Many applications, however, require some or all out of a number of key parametersto be fulfilled: a sufficiently high atom number, a robust strategy to create the degeneratesample, a fast cycle time, and a sufficiently long lifetime. For the fermionic isotope, a highdegree of degeneracy and full control over the spin states are desired as well. Not all of theseproperties were fulfilled in the experiments to date.
In this chapter, we describe a scheme to create degenerate samples that satisfies all ofthe above criteria and improves many key properties substantially. These experiments areperformed with one universal experimental setup that can be used for all isotopes, as wellas mixtures among them, with only little modifications.
119
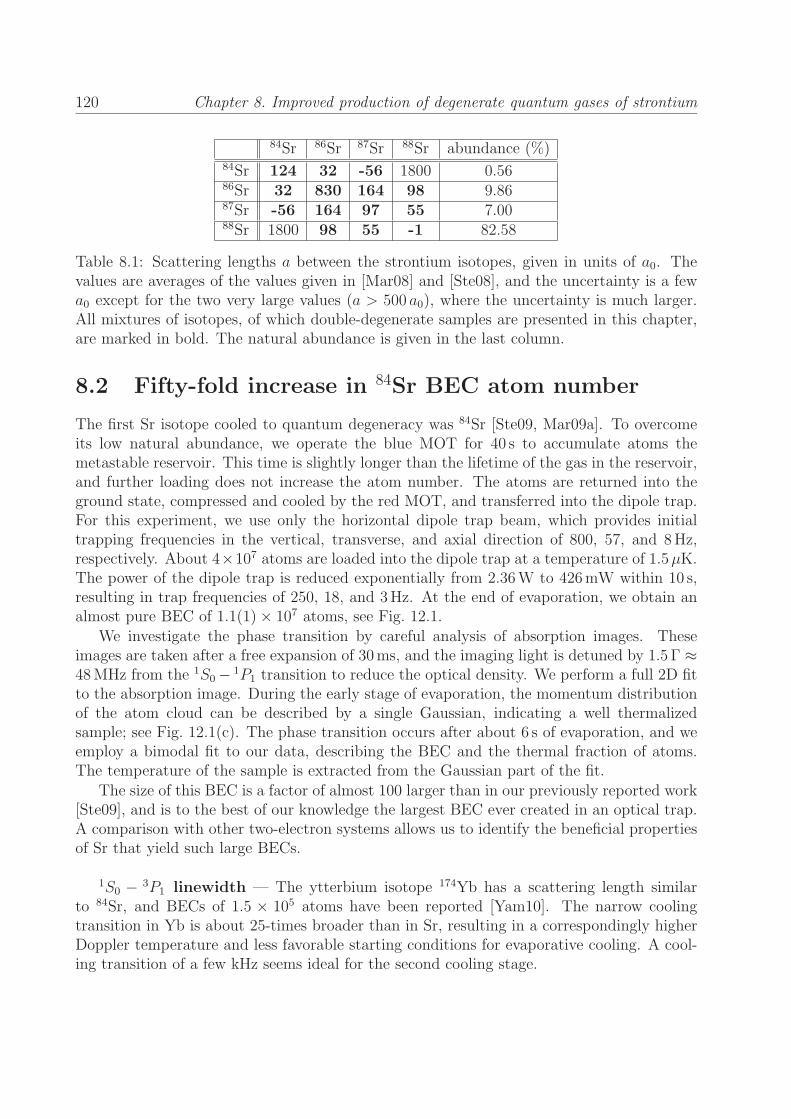
120 Chapter 8. Improved production of degenerate quantum gases of strontium
84Sr 86Sr 87Sr 88Sr abundance (%)84Sr 124 32 -56 1800 0.5686Sr 32 830 164 98 9.8687Sr -56 164 97 55 7.0088Sr 1800 98 55 -1 82.58
Table 8.1: Scattering lengths a between the strontium isotopes, given in units of a0. Thevalues are averages of the values given in [Mar08] and [Ste08], and the uncertainty is a fewa0 except for the two very large values (a > 500 a0), where the uncertainty is much larger.All mixtures of isotopes, of which double-degenerate samples are presented in this chapter,are marked in bold. The natural abundance is given in the last column.
8.2 Fifty-fold increase in 84Sr BEC atom number
The first Sr isotope cooled to quantum degeneracy was 84Sr [Ste09, Mar09a]. To overcomeits low natural abundance, we operate the blue MOT for 40 s to accumulate atoms themetastable reservoir. This time is slightly longer than the lifetime of the gas in the reservoir,and further loading does not increase the atom number. The atoms are returned into theground state, compressed and cooled by the red MOT, and transferred into the dipole trap.For this experiment, we use only the horizontal dipole trap beam, which provides initialtrapping frequencies in the vertical, transverse, and axial direction of 800, 57, and 8Hz,respectively. About 4×10⁷ atoms are loaded into the dipole trap at a temperature of 1.5μK.The power of the dipole trap is reduced exponentially from 2.36W to 426mW within 10 s,resulting in trap frequencies of 250, 18, and 3Hz. At the end of evaporation, we obtain analmost pure BEC of 1.1(1)× 107 atoms, see Fig. 12.1.
We investigate the phase transition by careful analysis of absorption images. Theseimages are taken after a free expansion of 30ms, and the imaging light is detuned by 1.5 Γ ≈48MHz from the 1S0 − 1P1 transition to reduce the optical density. We perform a full 2D fitto the absorption image. During the early stage of evaporation, the momentum distributionof the atom cloud can be described by a single Gaussian, indicating a well thermalizedsample; see Fig. 12.1(c). The phase transition occurs after about 6 s of evaporation, and weemploy a bimodal fit to our data, describing the BEC and the thermal fraction of atoms.The temperature of the sample is extracted from the Gaussian part of the fit.
The size of this BEC is a factor of almost 100 larger than in our previously reported work[Ste09], and is to the best of our knowledge the largest BEC ever created in an optical trap.A comparison with other two-electron systems allows us to identify the beneficial propertiesof Sr that yield such large BECs.
1S0 − 3P1 linewidth — The ytterbium isotope 174Yb has a scattering length similarto 84Sr, and BECs of 1.5 × 10⁵ atoms have been reported [Yam10]. The narrow coolingtransition in Yb is about 25-times broader than in Sr, resulting in a correspondingly higherDoppler temperature and less favorable starting conditions for evaporative cooling. A cool-ing transition of a few kHz seems ideal for the second cooling stage.

8.2. Fifty-fold increase in 84Sr BEC atom number 121
500 μm
020406080
100120140
020406080
100120140
020406080
100120140
-500 0 5000
20406080
100120140 t = 5 s
t = 7 s
t = 9 s
t = 10 s
(a)
(c)
0 2 4 6 8 100
0.5
1
1.5
0 2 4 6 8 100
10
20
30
40
BEC
thermal
(b)
optic
al d
ensi
ty (a
rb. u
nits
)
tem
pera
ture
(K
)at
om n
umbe
r (10
6 )
evaporation time (s)
evaporation time (s)
position (μm)
Figure 8.1: Generation of BECs exceeding 107 atoms. Panel (a) shows the evolution of theatom number in the thermal (black squares) and condensate fraction (red circles) duringevaporation. The temperature of the thermal fraction is shown in (b). Panel (c) shows aseries of absorption images (left) and integrated density profiles (right) for different timesalong the evaporative cooling ramp. The black circles are data points, which are fitted witha bimodal distribution (red line), capturing the thermal fraction (blue line) and the BEC.
Loading rate of blue MOT and accumulation in the 3P2 state — The isotope168Yb has a similarly low natural abundance as 84Sr and a comparable scattering length,and BECs of 10 000 atoms have been reached [Sug11]. In this experiment, the very smallloading rate of the MOT seemed to be the limiting factor. Collection of atoms on the broad1S0 − 1P1 transition in Sr allows us to capture many atoms, while the low-lying 1D2 stateopens the path towards accumulation in the metastable reservoir.

122 Chapter 8. Improved production of degenerate quantum gases of strontium
Scattering property — The calcium isotope 40Ca combines both a high natural abun-dance and a narrow intercombination line, but BEC sizes reached so far amount to 20 000atoms [Kra09] or 3000 atoms [Hal12], depending on the cooling strategy. The scatteringlength of 40Ca is large and comparable to the case of 86Sr, which leads to strong three-bodydecay and therefore demands for a low atom number density.
We find no fundamental limit to the attainable atom number of the 84Sr BEC. Thelifetime of this BEC is about 15 s, indicating that 3-body losses are manageable. To furtherincrease the BEC atom number, an oven with a much higher flux is currently installed inour experiment and is expected to increase the number of atoms loaded into the reservoir.The red MOT could be operated at a larger detuning to increase the size of the ellipsoid(see Fig. 2.7) to reduce the density of atoms in the MOT. With more power available for thedipole trap, the volume can be increased, such that the same density can be preserved evenat higher atom number. Atom numbers approaching 108 seem within reach.
8.3 Generation of BEC with a cycle time of 2 seconds
In the previous section, we have reported on experiments optimized for a large number ofatoms in the BEC. We can also optimize our experimental sequence for a short cycle time.Many experiments, for example precision measurements such as optical clocks, require highrepetition rates or a favorable ratio of probe time vs cycle time. Experiments taking place inan environment of poor vacuum quality could also benefit from fast cycle times. So far, cycletimes for optically trapped degenerate quantum gases are in the range of a few 10 s. Usingmagnetic trapping near the surface of a microchip [Far10, Hor06], narrow cooling transitions[Kra09], or vigorous trap deformation [Kin05], cycle times can be as low as 3 s .
Making use of the very high phase space density achieved already in the red MOT, aswell as the excellent scattering properties of 84Sr, we are able to reduce the cycle time to2 s; see Fig. 12.2(a). At the beginning of the cycle, we operate the blue MOT for 800ms toload the metastable reservoir. A short flash of repump light returns the metastable atomsinto the ground state, where they are trapped, compressed, and cooled to about 1.2μK bythe red MOT. Close to 4× 10⁶ atoms are loaded into a dipole trap which is formed by thehorizontal sheet and a vertical beam of 25μm waist. Forced evaporation reduces the trapdepth over 550ms with a time constant of about 250ms; see Fig. 12.2(b).
Absorption images taken after 22ms TOF and analyzed as described above. In this ex-periment, however, we find that a single Gaussian is not sufficient to describe the thermalfraction. After about 100ms of evaporation, the distribution begins to deviate from a Gaus-sian (see Fig. 12.2(d (i)), indicating that part of the atoms reach a lower temperature thanthe rest of the sample. These are the atoms located in the crossing region of the horizontaland vertical beams, where the density is higher and evaporation is more efficient. Afterfurther evaporation, two samples with different temperatures are clearly visible, and we usea double Gaussian to fit our data (case ii). The phase transition occurs after about 270msof evaporation, and we employ a trimodal fit to our data, describing the BEC, the thermalfraction of atoms in the crossing region, and the thermal atoms in the horizontal beam (cases

8.3. Generation of BEC with a cycle time of 2 seconds 123
(a)
(b)
evaporation time (ms)
evaporation time (ms)
atom
num
ber
tem
pera
ture
(nK
)
200400600800
100012001400
0
(c)
time
(ms)
blue MOT
redcapture MOT
redcompression MOT
evaporation
imaging
0
500
1000
1500
2000(d)
position (μm)-500 5000
500 μm
t = 110 ms
t = 220 ms
t = 330 ms
t = 440 ms
t = 550 ms(v)
(iv)
(iii)
(ii)
(i)
optic
al d
ensi
ty (a
rb. u
nits
)
5004003002000 100
5004003002000 1000
20
40
60
80
0
20
40
60
80
0
20
40
60
80
0
20
40
60
80
0
20
40
60
80
0
1
2
3
4 x 10⁶
total atom numberBEC x 10
Figure 8.2: Generation of BEC with a short cycle time. Panel (a) shows a sketch of theexperimental sequence. The development of atom number (b) and temperature of the dimpleregion (c) during the evaporation trajectory are shown. Absorption images taken after 22msTOF and integrated density profiles show the appearance of an an almost pure BEC of100 000 atoms at the end of evaporation (d). Blue lines indicate Gaussians, green linesdouble-Gaussians, and red lines bi- and trimodal distributions, see the text for details.
iii and iv). After about 480ms of evaporation, the thermal fraction within the crossing regioncannot be discerned, indicating an essentially pure BEC in this region. Further evaporationdoes not increase to BEC atom number, but efficiently removes atoms located outside thecrossing region. For the last stage of evaporation, we employ a bimodal fit to the data,capturing the BEC and the thermal atoms outside the crossing region (case v). About 105

124 Chapter 8. Improved production of degenerate quantum gases of strontium
100 μm
(a) (b)
Figure 8.3: Essentially pure BECs of (a) 86Sr and (b) 88Sr. The free expansion time is 25msfor both images, and the geometric and color scales are identical. The BEC of 86Sr contains25 000 atoms and expands to much larger size compared to the almost non-interacting BECof 88Sr, which contains 5 000 atoms.
atoms reside in the BEC at the end of evaporation. The read-out of the charged-coupleddevice (CCD) chip used for imaging can be performed during the consecutive experimentalcycle and is therefore not included in the 2-s period.
The cycle time could be improved substantially if the reservoir loading time (800ms inthis experiment) was reduced, e.g. by increasing the oven flux. It seems that cycle times ap-proaching 1 s are within reach. Fast preparation times are greatly acknowledged in quantumgas experiments as they allow for a high data acquisition rate, and mandatory for precisionmeasurements, where the performance depends directly on the ratio of probe time vs cycletime.
8.4 Five-fold increase in 86Sr BEC atom number
Some isotopes of alkaline-earth atoms feature large positive scattering lengths, such as 40Ca,42Ca, 44Ca [Dam11], and 86Sr. While scattering between atoms provides thermalizationduring evaporation, there is a downside of a very large scattering length a: Inelastic three-body losses scale as ∼ a4, and can reduce the evaporation efficiency drastically. MagneticFeshbach resonances, a widely used means to tune the scattering length in ultracold samples,are absent in the alkaline-earth species, and a different strategy to reach degeneracy despitethe large scattering length is needed.
In a previous experiment [Ste10b], we have shown degeneracy of 86Sr, which has a scat-tering length of about 830 a0 [Mar08]. Here, the crucial innovation was a drastic reduction ofthe atom density in the dipole trap of large volume. Two-body collisions, vital for thermal-ization, scale proportional with the density n, while detrimental three-body collisions scaleas ∼ n2. At small enough densities, evaporation can be efficient even for large scatteringlengths. In this experiment, we worked in an oblate trap with trapping frequencies of 70(16, 5) Hz in the vertical (horizontal) directions. The horizontal beam was strongly ellipticin the horizontal plane, and we found that a rather large trapping frequency in the verticaldirection is helpful for evaporation in the direction of gravity.
Improving this experiment, we are now going to an even more elliptic horizontal beam

8.5. Reliable generation of an attractive 88Sr BEC 125
(aspect ratio 1:14), while keeping the horizontal confinement the same. The higher verticaltrap frequency allows for a faster evaporation time, moves the phase transition to an ear-lier stage with more atoms at a higher temperature, and ultimately supports larger BECs.Instead of 4.8 s, evaporation now proceeds within 800ms. The onset of BEC is observed ata temperature of about 70 nK with 350 000 atoms present. At the end of evaporation, trapfrequencies are 157, 20.2, and 4.6Hz, and we reach almost pure BECs of 25 000 atoms; seeFig. 12.3(a). A vertical dipole trap beam was added during the last part of evaporation toincrease the axial trapping frequency slightly.
8.5 Reliable generation of an attractive 88Sr BEC
The isotope 88Sr is by far the most abundant one, and early research on cold gases of Srfocused on this isotope. The s-wave scattering length a of 88Sr turned out to be very closeto zero, which makes it an excellent choice for precision measurements [Tak05, Fer06b].Optical clocks, for example, suffer from density-dependent mean-field shifts, which scale as∼ a. Similarly, elastic collisions lead to a dephasing of Bloch oscillations. No other atomicspecies that has been laser-cooled so far combines the properties of high natural abundance,non-magnetic ground state, and very small interaction.
It is this small (and slightly negative) scattering length that hampered evaporative coolingof 88Sr towards degeneracy for a long time [Ido00, Pol05b]. Sympathetic cooling with thesecond-most abundant isotope, 86Sr, could not reach quantum degeneracy because of thelarge 3-body recombination rate of 86Sr [Fer06a].
Efficient evaporation to quantum degeneracy was first achieved by the Rice group [Mic10]using the fermionic isotope 87Sr as cooling agent. An ultracold gas of 88Sr is slightly attractivefor T → 0, and indeed Mickelson and co-workers observed a limited number of atoms in theBEC, in good agreement with a simple mean-field model [Rup95].
Here, we verify the results of the Rice group and highlight a few differences of ourown experimental work. We start with an isotopic mixture in a crossed-beam dipole trap,containing 4.5×10⁶ atoms of 88Sr at 560 nK and 1.9×10⁶ atoms of 87Sr at 1.0μK. The samplethermalizes within the first second of forced evaporative cooling, and remains thermalizedfor the remainder of the 4-s ramp. The BEC of 88Sr appears after 2.1 s, with 2.7×10⁶ atomspresent at a temperature of 320 nK. Further evaporation does not increase the BEC atomnumber beyond a few 1 000 atoms, but the thermal fraction can be removed to obtain verypure BECs at the end of evaporation; see Fig. 12.3(b).
A homogeneous BEC with negative scattering length is unstable for all atom numbers,but a trapped BEC can be stabilized (through the zero-point kinetic energy of the trap) upto a maximum atom number of N0 = 0.575 aho/a. Here, aho =
√�/(mω) is the harmonic
oscillator length, and the prefactor is only slightly dependent on the trapping geometry.The maximum atom number thus depends only weakly on the mean trap frequency ω, andone cannot expect substantial improvements from a change in trapping geometry. As theBEC atom number increases and eventually surpasses this limit during evaporation, partof the atoms are ejected out of the BEC [Don01], leaving the remnant behind to form astable BEC again. This cycle continues throughout evaporation, until the remaining atom

126 Chapter 8. Improved production of degenerate quantum gases of strontium
number is smaller than N0 or the elastic collision rate is too low to reduce the temperaturefurther and add atoms to the BEC. Consequently, one would expect a random atom numberN < N0 in the BEC at the end of evaporation. This is precisely the observation of Ref.[Mic10]: for a large number of experimental realizations, the BEC atom numbers were evenlydistributed between ∼ 0.4N0 and N0. In view of the application of degenerate 88Sr inprecision measurements, we will now show how the shot-to-shot variation in BEC atomnumber can be reduced.
In the work presented here, we deliberately start with a low initial number of 87Sr atomsto perform inefficient evaporation. After 80% (or 3.5 s) of evaporation, only 12 000 87Sr atomsremain, and the scattering rate of a thermal 88Sr atom with an 87Sr atom has dropped frominitially 250 s−1 to below 4 s−1. At this point, we do not expect any appreciable cooling totake place. Instead, further lowering of the trap depth removes all thermal atoms from thetrap, leaving behind a pure BEC of 6000 atoms. The atom number of this BEC is certainlybelow N0 ≈ 10 000 for our conditions of ω = 70(1)Hz and an assumed scattering lengthof a = −1.4 a0. The shot-to-shot variation in BEC atom number, however, is surprisinglysmall: We obtain a standard deviation of only 9% in the atom number. This value is certainlylarger than our typical 84Sr BEC atom number fluctuations of about 1%, but it constitutesa substantial improvement towards precision measurements with 88Sr.
In conclusion, we have confirmed the 88Sr BEC experiments by the Rice group, using verysimilar conditions. We observe a much smaller variation in BEC atom number at the endof evaporation, which might be attributed to a slightly different choice of initial conditions.We note that in our dipole trap with ω = 70Hz, we never observe BECs with more than7000 atoms. When identifying this number with N0, we can deduce a scattering length of−2.0 a0, which is well within the uncertainty of the widely stated value of −1.4 a0.
8.6 Double-degenerate Bose-Bose mixtures of Sr
Many fascinating and fundamentally important systems can be studied with a mixture oftwo Bose-degenerate gases. These range from the (im)miscibility and phase separation oftwo quantum fluids [Hal98] to systems featuring quantum turbulence [Tak10]. A mixture oftwo BECs of different atomic species can be the starting point for the creation of ultracoldheteronuclear molecules, which carry a large dipole moment if transferred to their singletground state [Ni10]. Within the alkalis, a number of Bose-Bose mixtures have been realized:41K + 87Rb [Mod02], 85Rb + 87Rb [Pap08], and 87Rb + 133Cs [Ler11].
For a large and stable two-component mixture, the absolute value of all three intra- andinterspecies scattering lengths must not be too large to avoid rapid decay. Further, theinterspecies interaction should not induce phase separation, but still provide some degreeof interaction. The scattering length of alkaline-earth systems cannot be tuned withoutintroducing detrimental losses [Bla11b]. This limits the number of possible binary mixturesconsiderably, despite the large number of isotopes. In particular, all combination of bosonicCa isotopes seem unfavorable, since all intraspecies scattering lengths of the most abundantCa isotopes are quite large [Kra09, Dam11]. In Yb, two out of five bosonic isotopes havelarge negative scattering lengths [Kit08], excluding many possible combinations of isotopes.

8.6. Double-degenerate Bose-Bose mixtures of Sr 127
0 0.5 1 1.5 2 2.50
1
2
3 x 10⁶
100 μm
evaporation time (s)
86Sr
100 μm
88Sr
100 μm
84Sr
100 μm
86Sr
(a)
(d)
0 0.5 1 1.5 2 2.5evaporation time (s)
(c)
(b)
x 50
atom
num
ber
tem
pera
ture
(nK
)
1000
800
600
400
200
0
88Sr
86Sr88Sr
86Sr
Figure 8.4: Creation of double-degenerate Bose-Bose mixtures. The development of atomnumber (a) and temperature (b) during evaporation are shown for the mixture of 86Sr (blacksquares) and 88Sr (red circles). Despite a significant temperature difference at the start ofevaporation, the sample thermalizes within 1 s. Below, we show absorption images of themixtures 86Sr + 88Sr (c) and 84Sr + 86Sr (d), taken after 26ms of free expansion. The BEC of84Sr contains 2×10⁶ atoms, and imaging is performed with a detuning of 1 Γ. The other threeBECs are not pure. We show 2D integrations along the vertical direction, with bimodal fitsto the data. The color palette of these three images is identical, and the integrated opticaldensities of the insets are to scale.
One remaining combination, 170Yb + 174Yb, has a large and negative interspecies scatteringlength of −500a0. One of the two remaining combination,
168Yb + 174Yb, has been broughtto double degeneracy very recently, with 9 000 atoms in the BEC of each species [Sug11].The interspecies scattering length between these two isotopes is 2.4(3.4)a0 and provides onlyminuscule interaction between the two.
Here we report on double-degenerate Bose-Bose mixtures of the combinations 84Sr + 86Srand 86Sr + 88Sr, which have sizeable interspecies scattering lengths of 32 a0 and 98 a0, respec-tively. The experimental realization is straightforward: We load the two isotopes into the

128 Chapter 8. Improved production of degenerate quantum gases of strontium
reservoir consecutively, repump them simultaneously on their respective 3P2 − 3D2 transi-tions, and operate two red MOTs simultaneously. The mixture is loaded into the dipole trapand subsequently evaporated to form two BECs. Imaging is performed on the blue 1S0− 1P1
transition, and we image only one isotope per experimental run. The frequency shift betweeneven isotopes is about 4.5 Γ, and we spatially separate the two clouds during TOF to avoidsignal contributions from the unwanted isotope. The separation is obtained by accelerationof the unsought species with an 8-ms pulse of light from an upwards propagating beam onthe red transition, which is very isotope-selective. The pulse of light is applied after 17msTOF, such that the density of the sample has decreased sufficiently and both atom numberand momentum distribution of the imaged species remain unperturbed.
The experimental results are shown in Fig. 12.3. We will discuss the 86Sr + 88Sr com-bination first: 2.3 × 10⁶ (3.3 × 10⁶) atoms of 86Sr (88Sr) are loaded into the dipole trap,consisting of the horizontal beam and a weak vertical beam for additional axial confinement.The initial temperatures of the two species are quite different: 950 nK for 86Sr and 720 nKfor 88Sr, which reflects the different intraspecies scattering behavior. The interspecies scat-tering length is around 100 a0, and the two species clearly thermalize to reach equilibriumafter 1 s of evaporation. As the trap depth is lowered further, we observe the onset of BECin 86Sr (88Sr) after 2.0 s (2.3 s). At the end of our evaporation ramp, which lasts 2.4 s, weobtain 10 000 (3000) atoms of 86Sr (88Sr) in the condensate fraction, see Fig. 12.3(a). At thispoint, trap frequencies are 160Hz (20Hz) in the vertical (horizontal) directions, and furtherevaporation does not increase the BEC atom numbers.
In a second experiment, we investigate the 84Sr + 86Sr mixture with an interspeciesscattering length of 32 a0. Starting out with 10 × 106 (1.5 × 10⁶) atoms of 84Sr (86Sr) inthe dipole trap, we perform forced evaporation over 2 s, and the two species remain inperfect thermal equilibrium throughout this time. The phase transition of 84Sr is observedalready after 1.3 s, with about 2.5 × 10⁶ atoms present at a temperature of 200 nK. Trapfrequencies at this point are ωvert = 335Hz, ωtrans = 29Hz, and ωax = 5.0Hz. After 1.9 s,the BEC is essentially pure and contains up to 2 × 10⁶ atoms. The atom number in 86Sris considerably lower to avoid three-body loss, and the phase transition occurs later: after1.7 s, with 400 000 atoms at a temperature of 130 nK and trap frequencies ωvert (ωtrans, ωax)of 160Hz (20Hz, 3.7Hz). Until the end of evaporation, the BEC fraction grows to 8 000atoms but remains accompanied by a large thermal fraction; see Fig. 12.3(b). Note thatthe remaining combination of two bosonic isotopes in Sr, 84Sr + 88Sr, is unstable due to thediverging interspecies scattering length.
In conclusion, we have presented two binary Bose-Bose mixtures of alkaline-earth atomswith appreciable interaction between the two species. These mixtures enjoy the propertythat isotope-selective optical traps can be operated close to one of the intercombination lines.The differential isotope shift between even isotopes of Sr, expressed in term of the linewidth,is about Δ(N+2)−N/Γ = 25 000 for the 1S0− 3P1 transition, and much larger for the
1S0− 3P0
clock transition. This might allow for an individual addressing of the isotopes by a dipoletrap operated close to these transition [Yi08], reminiscent of the case of Rb in its hyperfinestates |F = 1〉 and |F = 2〉 [Man03] or nuclear substates in Yb and Sr [Tai10, Ste11].

8.7. Deeply-degenerate Fermi gases of 87Sr 129
(a)
(f)
time (s)0 10 15 25205
atom
num
ber (
105 )
0
1
2
3
4
5
atom number0 20000 40000 60000 80000 100000
T/T F
0.10
0.15
0.20
0.05
radial distance (μm)0 50 100 150 200
optic
al d
ensi
ty (a
rb. u
nits
)
0
0.2
0.4
0.6
0.8
1.0
100 μm
+9/2
- 9/2
100 μm
(b)
(c)
(d)
(e)
time (s)0 10 15 25205
tem
pera
ture
(nK
)
0200400600800
10001200
Figure 8.5: Deeply degenerate Fermi gases of 87Sr. Panels (a) through (e) illustrate theevaporation of a balanced 10-state mixture. The temperature (b) is determined from Gaus-sian fits for high temperatures (black data), and from fits to the wing of the distribution forlower temperatures (red data). The value of T/TF in dependence of atom number per spinstate is shown in (c), where some data points have been taken multiple times (red data)to determine the statistical uncertainty. The value of T/TF is extracted from Fermi fits(red line in (d)) to the momentum distribution, which describe the data (black circles) verywell. A Gaussian fit (blue line) clearly disagrees with this sample of T/TF = 0.08(1). Thecorresponding absorption image (e) is taken after 25.4ms TOF. Preparation of samples witha variable number of spin states N requires detection of individual spin states, which is doneby the OSG technique and shown here for N = 10, N = 2 and N = 1 (f).
8.7 Deeply-degenerate Fermi gases of 87Sr
A wealth of recent proposals suggest to employ the fermionic isotope of an alkaline-earth atomas a platform for the simulation of spin systems [Caz09, Gor10, Wu03, Wu06, FF10, Her09,Xu10, Hun11], for the generation of artificial gauge fields [Ger10, Coo11b, Ber11, Gor11a],or for quantum computation schemes [Dal08, Gor09]. Many schemes of quantum simulation

130 Chapter 8. Improved production of degenerate quantum gases of strontium
require the number of spin states N to be large. In addition, it is proposed that cooling ina lattice works best for large N [Bon12]. The largest nuclear spin of any alkaline-earth likeatom is 9/2, and it occurs in the nuclei of 87Sr and the two nobelium isotopes 253No and259No, both of which have a lifetime on the order of only minutes. This makes 87Sr with itsten spin states the prime candidate for many studies of quantum simulation.
These schemes also require the temperature of the sample to be below the super-exchangescale, t2/U , where t is the tunneling rate in the lattice, and U is the on-site interaction[Bon12]. A high degree of degeneracy in the bulk would constitute a good starting pointfor subsequent loading of the lattice. A degeneracy of T/TF = 0.26(5) in a 10-state mixture[DeS10] and a degeneracy of T/TF = 0.30(5) in a single-spin state [Tey10] of 87Sr werepresented already, both with about 20 000 atoms in each Fermi sea. Neither of these twoexperiments had the means to set the number of spin states at will. Here, we presentdegenerate Fermi gases of Sr at considerably deeper degeneracy with an arbitrary numberof spin states between 1 and 10.
About 5 × 10⁶ atoms of 87Sr are loaded into the optical dipole trap, where we measurea temperature of 1.2μK. At this time, atoms are in a roughly even mixture of all spins.Optical pumping is then performed on the 1S0 − 3P1, |F = 9/2〉 → |F ′ = 9/2〉 transition ata small guiding field of 3G, which splits adjacent m′
F -states by 35 Γ = 260 kHz. As we haveshown before [Ste11], we can prepare any combination and relative population of the ten spinstates. The optical pumping is optimized using the optical Stern-Gerlach (OSG) techniquedescribed in Ref. [Ste11], and quantified using state-selective absorption imaging on theintercombination line [Ste11]. With a detection threshold of 3 000 atoms, we can reduce thepopulation of undesired spin states to below 0.1%. After the spin preparation, which doesnot heat the sample, we perform evaporative cooling. Evaporation proceeds in two stages:the first stage lasts 16 s, during which the power of the horizontal beam is reduced by afactor of five. At this point, the gas enters the degenerate regime with a typical temperatureof around 0.3TF . Evaporation becomes less efficient due to the increased occupation oflow momentum states. We compensate for this by reducing the ramp speed for the secondevaporation stage, which lasts 10 s. Trap frequencies at the end of evaporation are about120Hz in the vertical and 40Hz in the horizontal directions. The final trap depth is slightlymodified, depending on the number of spin states used. The case N = 1 is unique as fermionsin the same spin state do not collide at low temperatures due to the Pauli exclusion principle,impeding thermalization of the sample. In this case, we add 84Sr atoms to the system tofacilitate sympathetic cooling.
In all of these experiments, we determine the atom number and degeneracy T/TF by 2DFermi fits to the data using the same fitting routine as in our previous work [Tey10]. Thewidth of the cloud σ is related to the temperature by T = mσ2/kBt2TOF, and TF is calculatedfrom the atom number and average trap frequency as TF = �ω(6Nat)
1/3/kB. The momentumdistribution of a gas at small T/TF strongly deviates from a Gaussian shape, which we showin azimuthally integrated profiles; see Fig. 8.5(d).
We will limit the presentation of our data to the cases of N = 10, N = 2, and N = 1.For the 10-state mixture, the fraction of Pauli-forbidden collisions is small, and evaporativecooling performs well to yield a stack of ten spatially overlapping Fermi seas. Figures 8.5(a)and (b) show the development of atom number per spin state and temperature along the

8.8. Degenerate Bose-Fermi mixtures of Sr 131
evaporation ramp. The degree of degeneracy T/TF in dependence of atom number in shownin (c). With about 30 000 atoms per spin state, we obtain a degeneracy of 0.10(1)T/TF . Wereach degeneracies as low as 0.08(1)T/TF by further evaporation. The errors given here arestatistical errors of multiple experimental realizations, and we assume systematic errors tobe of similar magnitude.
For the 2-state mixture, we pump all atoms into a balanced population ofmF = +9/2 andmF = +7/2 states. The total atom number, initial temperature, and evaporation trajectoryare identical to the previous case of a 10-state mixture, but there is a crucial difference: Onlyhalf of all possible collisions are Pauli-allowed in the binary mixture, leading to a decreasedthermalization rate. The reduced evaporation efficiency immediately manifests itself in thedegree of degeneracy reached: Despite the higher atom number per spin state, we can reachonly 0.20(1)T/TF with 1.0× 10⁵ atom per spin state. The lowest degeneracies reached are0.17(1)T/TF with 60 000 atoms remaining. Further evaporation does not reduce T/TF .
In the case of a single-spin sample of 2.5× 10⁶ fermionic atoms, we add 6.5× 10⁶ atomsof 84Sr to the dipole trap. Evaporation is performed in one single exponential ramp over 8 sand results in a pure BEC of 7× 10⁵ atoms. Towards the end of evaporation, the fermioniccloud contains 1.0 × 10⁵ atoms. The sample is not well thermalized in the axial directionof the trap, which we take into account by fitting the vertical and horizontal directionsindependently to obtain T/TF = 0.12 and T/TF = 0.23, respectively.
This result is an improvement by a factor of about five in atom numbers over our previouswork [Tey10] and reaches a deeper degeneracy. However, we find it challenging to reach evenlower degeneracies in this isotopic mixture, probably limited by rather poor thermalizationtowards the end of the evaporation. The interspecies scattering length of −56 a0 is rathersmall in itself. In addition, the bosons form a BEC quite early, which reduces the scatteringcross section with the fermions further. Operating at a higher density might increase scat-tering between bosons and fermions, but also increase 3-body heating and losses within thebosons as ∼ n2. We conclude that the 10-state Fermi mixture performs much better thanthe Bose-Fermi pair.
8.8 Degenerate Bose-Fermi mixtures of Sr
Double-degenerate Bose-Fermi mixtures in ultracold gases have been realized in bi-alkali(e.g. [Sch01]), alkali/alkaline-earth [Har11] and bi-alkaline-earth systems [Fuk09b, Tey10].The Bose-Fermi mixture of 84Sr and a single spin state of 87Sr has already been presented inSec. 8.7. Here, we will introduce two other isotopic combinations: 86Sr + 87Sr and 88Sr + 87Sr.It might seem worthless to realize the same combination of elements with different isotopesof identical nuclear spin, but it is not: Given the absence of magnetic Feshbach resonances,the choice of isotopes can provide some coarse tuning of the interaction strength. Theinterspecies scattering lengths of the three combinations mentioned afore are −56 a0, 164 a0,and 55 a0, respectively, thus covering a broad range of values.
At first, we present the mixture of 84Sr + 87Sr. In contrast to the experiment in Sec. 8.7,we are now working with the entire 10-state mixture of 87Sr. About 6 × 10⁶ fermions at1.15μK and 2.1 × 10⁶ bosons at 1.1μK are loaded into the dipole trap. The first of two

132 Chapter 8. Improved production of degenerate quantum gases of strontium
(a) 84Sr
88Sr
87Sr
87Sr(b)
100 μm
radial distance (μm)0 50 100 150
optic
al d
ensi
ty (a
rb. u
nits
)
00.20.40.60.81.0
00.20.40.60.81.0
Figure 8.6: Eleven-fold degeneracy of Bose-Fermi mixtures. The two combinations shownhere are 84Sr + 87Sr (a) and 88Sr + 87Sr (b). The absorption images of the bosonic (leftcolumn) and fermionic isotopes (middle column) are taken after 25.4ms TOF; the color andlength scales are identical for all four images. The fermionic cloud consists of ten spin states,where azimuthal integrations of the density after TOF are shown in right column. The finalatom number and the degree of degeneracy depend on the scattering properties, which aredifferent for every combination of isotopes.
exponential evaporation ramps takes 12 s, during which the onset of BEC in 84Sr is observedalready after 8 s. The BEC is essentially pure after 12 s, containing about 3 × 10⁵ atoms.The fermions remain in perfect thermal equilibrium with the bosons. At the end of thisfirst ramp, we obtain 7 × 10⁴ atoms per spin state at a temperature of about 100 nK, butstill well outside the degenerate regime. For further cooling, we add a very slow secondevaporation ramp of 7.5 s duration. Such a slow ramp is required because Pauli blockingdecreases the scattering rate between the fermions, and superfluidity of the BEC decreasesthe scattering rate between fermions and bosons. The final trap frequencies are 210Hz(41Hz and 32Hz) in the vertical (horizontal) directions. The degree of Fermi degeneracyhas increased substantially to T/TF = 0.15(1) with 15 000 atoms in each spin component atthe end of evaporation. The BEC atom number has decreased slightly to 2× 10⁵ atoms; seeFig. 8.6(a). This experiment reaches an eleven-fold degeneracy of distinguishable particles,possibly the largest number of overlapping degenerate gases ever reported. It seems thatthe presence of the bosons reduces the evaporation efficiency of the fermions, as deeperdegeneracies were achieved in absence of the bosons; see Sec. 8.7.
In a second experiment, we replace the bosonic isotope by 86Sr. The bosonic intraspeciesand the interspecies scattering lengths are much larger than in the previous case, which weaccount for by decreasing the density of the sample: we load less atoms (1.6 × 10⁶ atomsof 86Sr at 1.1μK and 3.7 × 10⁶ atoms of 87Sr at 1.0μK), and we keep the average trapfrequency low by reducing the horizontal confinement. We maintain the concept of twosequential evaporation ramps of different time constants and evaporate slightly deeper than

8.9. Conclusion 133
is the previous case, but reduce the total evaporation time to 3.4 s. Final trap frequenciesare 160Hz, 23Hz, and about 10Hz in the vertical and horizontal directions. This isotopiccombination performs worse than the previous one, yielding a bosonic sample with only 15%condensate fraction. The axial trap frequency, required to be small to inhibit 3-body lossesof 86Sr, does not ensure thermalization of the fermionic sample in this direction. We obtainT/TF = 0.15(5) for the vertical direction. The BEC contains 5 000 atoms, and each Fermisea contains 10 000 atoms (not shown).
As a last experiment, we use the 88Sr isotope as the boson. Starting out with 1.2× 10⁶
bosons and 6.5 × 10⁶ fermions both at 1.2μK, we reduce the trap depth in two ramps of12 and 8 s. The atom number of the 88Sr BEC is limited by the negative scattering length,and evaporation to this rather low trap depth is required to remove the thermal fraction.We finally obtain a pure BEC of 4000 atoms immersed in ten Fermi seas, each comprising10 000 atoms at 0.11(1)T/TF ; see Fig. 8.6(b).
8.9 Conclusion
In this chapter, we have presented a collection of experiments related to the creation ofBECs and degenerate Fermi gases of strontium. We have shown how both electronic andcollisional properties add to create a framework of unparalleled strength and diversity. Manykey parameters of a quantum gas, such as the BEC atom number, the preparation time, thelifetime, and the fidelity of state preparation, have been improved by an order of magnitudeover previous experiments. In particular, we have presented the largest BECs ever createdin an optical trap, and we were able to reduce the cycle time to 2 s. Some of the techniques,such as the design of the dipole trap, might also be applicable to other systems, for examplethe recently condensed species Dy [Lu11a] and Er [Aik12].

134 Chapter 8. Improved production of degenerate quantum gases of strontium

Chapter 9
Reservoir spectroscopy of the5s5p 3P2 − 5s5d 3D1,2,3 transitions in Sr
Some transitions in strontium are very well explored, but some have not yet been investi-gated. We perform spectroscopy on the optical dipole transition 5s5p 3P2 − 5s5d 3D1,2,3 forall stable isotopes of atomic strontium. We develop a new spectroscopy scheme, in whichatoms in the metastable 3P2 state are stored in a reservoir before being probed. Previousmeasurements have been performed in a magneto-optical trap or discharge. The methodpresented here increases the attained precision and accuracy by two orders of magnitude.We show how the state distribution and velocity spread of atoms in the reservoir can betailored to increase the spectroscopy performance. The absolute transition frequencies aremeasured with an accuracy of 2MHz, and the isotope shifts are given to within 200 kHz. Wecalculate the A and Q parameters for the hyperfine structure of the fermionic isotope withan error of about 1MHz. Furthermore, we show that the 5s5p 3P2 − 5s5d 3D3 transition isnot completely cycling.
9.1 Introduction
The rich electronic structure of elements with two valence electrons, comprising long-livedmetastable states and ultranarrow transitions, is of great interest for precision measurements,as demonstrated by optical clocks [Ido03, Ste04, Tak05, Hon05, Lud08b, Lem09a, Lem09b,Koh09, Nic12] or gravimeters [Pol11]. Quantum degenerate samples of Yb [Tak03, Fuk07a,Fuk07b, Fuk09b, Tai10, Sug11] and the alkaline-earth elements Ca [Kra09] and Sr [Ste09,Mar09a, Mic10, DeS10, Tey10, Ste10b] have opened new possibilities, such as the study ofunique many-body phenomena [Wu03, Wu06, Caz09, Her09, Gor10, FF10, Xu10, Hun11], in-cluding the possibility to create strong artificial gauge fields [Ger10, Coo11b, Ber11, Gor11a],and novel schemes of quantum computation [Sto08, Dal08, Gor09, Rei09].
Many of these applications and proposals rely on broad optical transitions originatingfrom the metastable triplet states. These transitions are essential for laser-cooling of Mg,Ca, and Sr [Reh07, Bin01, Kat99]. They can be used to drive Raman transitions betweenmetastable states and for fluorescence read-out in quantum computation schemes [Dal08].The 3P2 − 3D3 transition could be used for operation of a MOT and for absorption imaging.
135

136 Chapter 9. Reservoir spectroscopy of the 5s5p 3P2 − 5s5d 3D1,2,3 transitions in Sr
5s2 1S0
1S
5s4d 1D25s5p 1P1
5s4d 3DJ
5s6p 3PJ
5s6s 3S1
5s5d 3DJ
5s5p 3PJ
1P 1D 3S 3P 3D
012
123
12
201
3
singlet states triplet states
30.5 MHz
7.4 kHz
2.3 MHz
461 nm
689 nm
497 nm
5s7p 3PJ
201
5s6d 3DJ
123
5s4f 3FJ
234
5s7s 3S1
3F
4d5p3FJ
234
5s5p 3P2
7/2F= 5/2 5s5d 3D1
5s5d 3D2
5s5d 3D3
9/211/213/2
7/2 5/2
9/211/213/2
F‘= 3/2
15/2
7/25/2
9/211/213/2
11/29/27/2
87Sr
(a) (b)J
Figure 9.1: Schematic illustration of the energy levels and transitions in strontium relevantfor this work. (a) Atoms in the metastable 5s5p 3P2 state (indicated by the small solid arrow)are repumped using the 5s5p 3P2 − 5s5d 3D1,2,3 transitions (dotted line) around 497 nm. (b)Details of this transition for the fermionic 87Sr isotope. Its nonzero nuclear spin introducesa rich hyperfine structure.
A good knowledge of these transitions is crucial for the calculation of the polarizability ofthe 3P2 state, which is important for quantum computation schemes [Por08, Dal08].
So far, spectroscopic data is available for some of the dipole transitions within the tripletsystem of strontium. The 3P0 − 3S1 and
3P1 − 3S1 transitions, as well as the isotope shiftsand hyperfine splittings involved, have been measured by Courtillot et al. to a precision ofa few 100 kHz [Cou05]. The Rydberg series 5snd 3D1,2,3 for n > 12 has been investigatedin a discharge [Bei82], and the 5s5p 3P2 − 5s4d 3D2 transition has been investigated in amagneto-optical trap [Mic09], both with an accuracy of about 1GHz and a precision of afew 10MHz. The 5s5p 3P2 − 5s5d 3D1,2,3 transitions have not been investigated so far, thehyperfine structure of the 3P2 state, however, is very well known [Hei77].
In this chapter, we present spectroscopic data on the three 5s5p 3P2 − 5s5d 3D1,2,3 tran-sitions, which are separated by roughly 0.5 nm. Spectroscopy is performed for the threestable bosonic isotopes 84,86,88Sr as well as the fermionic isotope 87Sr. While the bosonicisotopes have zero nuclear spin, the fermionic one has a nuclear spin I = 9/2, which givesrise to a rich hyperfine structure. The wealth of hyperfine transitions requires a sophisticatedspectroscopy scheme. For all isotopes, we use a magnetic trap as a reservoir to accumulateatoms in the metastable 3P2 state, hence the name reservoir spectroscopy. Atoms in thistrap are then probed, and we can populate or deplete certain states beforehand to improvemeasurement performance. Both precision and accuracy are improved by about two ordersof magnitude compared to spectroscopy in a discharge or MOT.

9.2. Experimental procedure 137
5.64 5.66 5.68 5.700
0.5
1.0
frequency - 603 280 (GHz)6.10 6.12 6.14 6.16
0
0.5
1.0
1.5at
om n
umbe
r (10
6 )
4.65 4.70 4.750
4.65 4.70 4.75
020406080100120
wid
th (M
Hz)
intensity (Isat)
0
10
20
30
40at
om n
umbe
r (10
3 )
(a)
(e)
(d)
(b)
5 10 15 20 25 30
10.0
10.5
11.0
11.5
wid
th (M
Hz)
axial B-field gradient (G/cm)
1.5
frequency - 603 280 (GHz)
frequency - 603 280 (GHz) frequency - 603 280 (GHz)
10
20
30
11/213/211/27/2
9/2
11/213/211/27/2
9/2
11/213/211/27/2
9/2
11/213/211/27/2
9/2
800 kHz
10-410-5 10-3
(c)
-100 -50 0 50 100
0.1
1
norm
alize
d flu
ores
cenc
e si
gnal
detuning (MHz)
atom
num
ber
6.18
with optical pumping
atom
num
ber (
106 )
atom
num
ber (
106 )
106
105
Figure 9.2: Reservoir spectroscopy scheme. (a) The amplitude of the reservoir spectroscopysignal (red squares) is much larger than comparable measurements in a MOT (black circles)with respect to the respective background. A Lorentzian profile is fit to each curve, andthe fluorescence curves are taken at I = 1, 3, 10 × 10−3 Isat, from below. (b) Width (blacksquares) and atom number (red circles) in dependence of repump intensity. (c) Dependenceof the width of the transition on the depth of the magnetic trap. (d) Amplification of acertain hyperfine state by optical pumping increases the signal. (e) Depletion of certainhyperfine states allows for a separation of otherwise overlapping hyperfine transitions. Allmeasurements are taken on the 5s5p 3P2−5s5d 3D2 transition in
88Sr ((a)-(d)) and 87Sr ((e));see the text for details.
9.2 Experimental procedure
The experimental sequence for the preparation of cold and dense samples of bosonic Sr atoms,as they are required for our spectroscopy scheme, is as follows: Atoms are Zeeman-slowedand cooled in a blue MOT using the broad 1S0 − 1P1 transition at 461 nm; see Fig. 9.1(a).This transition is not completely cycling, as atoms from the 1P1 state can decay into the1D2 state. From here, they may decay further on two different pathways: One path leadsinto the 3P1 triplet state, which has a lifetime of 21μs and returns the atoms into the 1S0

138 Chapter 9. Reservoir spectroscopy of the 5s5p 3P2 − 5s5d 3D1,2,3 transitions in Sr
singlet ground state, back into the MOT cycle. The other pathway, which is relevant forthis work, leads into the 3P2 metastable state, which has a lifetime of about 500 s [Yas04].Atoms in weak-field seeking mF states of the 3P2 manifold can be trapped in the quadrupolefield of the MOT, which we refer to as the reservoir. The MOT is extinguished when about107 atoms in the 3P2 state have accumulated in the reservoir, where the loading time variesbetween 50ms and 10 s, depending on the natural abundance of the respective isotope. A1-s wait time ensures that only atoms in the magnetic trap remain in the probe volume. Amechanical shutter blocks the atomic beam.
A 50-ms flash of light with a wavelength near 497 nm pumps atoms from the 3P2 into the5s5p 3D2 state, from where they decay into the 3P1 state and further into the
1S0 state. Oncein the 1S0 ground state, they are further cooled and compressed in a red MOT on the narrow1S0 − 3P1 transition at 689 nm. Up to 107 atoms are cooled to about 500 nK. Absorptionimaging is then performed on the broad 1S0−1P1 transition, with a lower detection thresholdof about 3000 atoms. While the 3P2 − 3D2 transition is commonly used for repumping, alsothe 3P2− 3D1,3 transitions return atoms into the ground state, however with lower efficiency.
This sequence forms the basis of our reservoir spectroscopy scheme. We change thefrequency of the repump laser in each experimental run and record the number of atoms inthe red MOT.
9.3 Characterization of the spectroscopy scheme
We will now present the details of the spectroscopy scheme, discuss the optimization ofall relevant parameters, and present different methods to increase the signal strength. Wedo this by comparing our reservoir spectroscopy scheme to a previously used approach, inwhich spectroscopy was performed directly in the blue MOT [Mic09]. The atom numberof a continuously loaded blue MOT is reduced by the constant leakage of atoms into the3P2 state. This leak can be closed by continuously returning the atoms back into the MOTcycle using a laser on a suited repump transition. When on resonance, the number of atomsin the blue MOT increases significantly. The metastable states can also be populated by adischarge, however measurements using this technique have a precision of a few GHz and willnot be considered further. We believe that reservoir spectroscopy is superior to spectroscopyin the blue MOT in three ways.
First, our measurement is intrinsically background-free. Far away from resonance, noatoms are captured in the red MOT. The small background noise on the absorption imagesstems from photon shot noise and residual fringes, which resemble atom clouds of at mosta few thousand atoms. This background noise can be reduced by averaging over multipleimages. On the other hand, spectroscopy in a MOT has the background of the MOT itself,possibly stray light and photo detector dark counts. The superior signal strength is shownin Fig. 9.2(a). Depending on the MOT loading rate and repump intensity used, the fluores-cence of the MOT increases by a factor of up to about five, however at the expense of a largelinewidth. The atom number increase for the fermions is at most a few 10% on resonance[Mic09] due to the involved hyperfine structure. The reservoir spectroscopy described herecan yield a signal more than three orders of magnitude larger than the background noise.

9.3. Characterization of the spectroscopy scheme 139
Fig. 9.2(a) shows typical fluorescence spectra of a 88Sr MOT at repump intensities of about1×10−3, 3×10⁻³, and 1×10⁻² Isat, starting from below (solid black lines, normalized to thefluorescence of a MOT without repumping). The dashed red curve shows the correspondingmeasurement using reservoir spectroscopy, taken at an intensity of 5× 10⁻⁵ Isat. The ampli-tude of 5× 10⁶ atoms is more than three orders of magnitude above the background noise,and the width is smaller by a factor of four compared to the fluorescence curve at highestrepump intensity.
To optimize our spectroscopy approach, we measure the linewidth of the transition andthe amplitude of the signal in dependence of repump intensity. A larger repump intensitywill yield a larger amplitude of the signal, but also a larger width, see Fig. 9.2(b). Wefind a region around 5 × 10⁻⁴ Isat in which the width is not broadened by the intensity,but the amplitude has almost saturated. At this intensity, width and amplitude are almostindependent of the repump time for times greater than about 10 ms. A distortion of the lineshape can be observed at intensities lower than 2× 10⁻⁴ Isat; see panel (a i) in Fig. 9.3. Forhigher intensities, we do not observe any intensity-dependent line shifts.
The second advantage of reservoir spectroscopy is the potential to reduce the Dopplerbroadening: the quadrupole field, which confines the metastable atoms, acts as a velocityfilter, as it traps only atoms below a certain kinetic energy. A deeper trap will capture moreatoms also at higher velocity classes, while the confinement can be reduced to deliberatelyselect only the low-velocity atoms to reduce the Doppler-broadening, as shown in Fig. 9.2(c).In this measurement, the quadrupole field is ramped down after the blue MOT phase to allowhigh-energy atoms to escape.
As a third advantage, we can selectively populate the reservoir with the specific statesof interest. This is important for the fermionic isotope with its large number of hyperfinelevels. In particular, atoms can be pumped into the state of interest during or after theMOT phase. This is illustrated in Fig. 9.2(d): During the 87Sr blue MOT, atoms in all3P2 hyperfine states are accumulated in the reservoir, however at different relative amounts.The F = 7/2 state has the lowest gF factor, therefore only very few atoms are trapped. Inaddition, π-transitions into the 3D2 states tend to be weaker than σ-transitions, making theF = 7/2 → F ′ = 7/2 transition one of the weakest among all 13 3P2 − 3D2 transitions.Constantly pumping atoms from the F = 9/2 into the F = 7/2 state by standard opticalpumping can amplify the population of this state significantly.
Similarly, atoms from undesired states can be removed from the reservoir. This is shownin Fig. 9.2(e): The F = 11/2 → F ′ = 13/2 and F = 9/2 → F ′ = 7/2 hyperfine transitionsof the 3P2 − 3D2 line in
87Sr overlap entirely. The initial population of the F = 11/2 state isabout ten times that of the F = 9/2 state, therefore the F = 11/2 → F ′ = 13/2 transitioncompletely covers the F = 9/2 → F ′ = 7/2 transition. To selectively interrogate only theF = 9/2 → F ′ = 7/2 transition, we remove all F = 11/2-state atoms during the blueMOT phase by optical pumping into the F ′ = 11/2 state. As an additional benefit, thisalso increases the F = 9/2 population. We first verify on the F = 11/2 → F ′ = 11/2(or alternatively the F = 11/2 → F ′ = 13/2) transition that all F = 11/2 atoms havebeen removed, and then selectively probe the F = 9/2 state and determine the frequencydifference between the F = 11/2 → F ′ = 13/2 and F = 9/2 → F ′ = 7/2 transitions tobe 800 (200) kHz. This would not be possible by spectroscopy on a continuously operated

140 Chapter 9. Reservoir spectroscopy of the 5s5p 3P2 − 5s5d 3D1,2,3 transitions in Sr
3D13D2
3D3
Δ8486 45.7 (2) MHz
Δ8688 49.3 (2) MHz
A 227.3 (7) MHzQ 0 (3) MHz
Δ8486 45.3 (2) MHz
Δ8688 47.5 (2) MHz
A −71.5 (5) MHzQ 0 (30) MHz
Δ8486 45.0 (2) MHz
Δ8688 46.6 (2) MHz
Table 9.1: Isotope shifts Δ and interaction constants A and Q of the three 5s5p 3P2 −5s5d 3D1,2,3 transitions.
MOT.
A detailed error analysis is given in Sec. ??. In brief, the laser is locked to a stable cavityfor short-term stability, and monitored on a wavemeter. The wavemeter is calibrated by alaser operating on the clock transition of a 40Ca+ ion. The accuracy of the wavemeter ismeasured with a frequency comb. As a conservative estimate, the accuracy of the absolutefrequencies given here is 2MHz. Relative frequency differences, such as the isotope shifts,have an error of about 200 kHz. Compared to spectroscopy in a MOT or discharge, thescheme described here can improve both the precision and accuracy by at least two ordersof magnitude.
9.4 Spectroscopy data
Our set of measurements is shown in Fig. 9.3, where parts (a), (b), and (c) show spectroscopydata of the 3P2 − 3D(1,2,3) transitions, respectively. Panels (i) show the spectra of the threebosonic isotopes, where the isotope shift is about 20MHz per mass unit. The loading time ofthe reservoir is adjusted to compensate for the different natural abundances of the bosonicisotopes. The three sets in (a) through (c) are taken at different intensities; (a) 1×10⁻⁴ Isat,(b) 5×10⁻⁴ Isat, and (c) 1×10⁻³ Isat. The lineshapes of different isotopes for a given intensityare very similar, which allows for a precise determination of the isotope shift despite theasymmetric shape.
Panels (ii) show measurements on the fermionic isotope, taken with a typical intensity of1×10−3 Isat. Note that the spectrum spans many GHz in frequency, and that the amplitudeof the signal rises up to two orders of magnitude above the background. Note also the twooverlapping lines in panel (b ii), which were discussed in Fig. 9.2(e). The 3P2−3D3 transitionhas the lowest repumping efficiency, as the probability of atoms in the 3D3 state to decayinto the 3P1 state is relatively low. Instead, atoms might decay into another
3P2 hyperfinestate and be dark for the repumping light. Despite a careful search over more than 8GHz,only four out of 15 lines could be detected. One might speculate that two strongest onesare the cycling F = 5/2 → F ′ = 3/2 and F = 13/2 → F ′ = 15/2 transitions, which wouldimply that the hyperfine structure of the 3D3 state is inverted with an interaction constantA ≈ −150. For a complete scan of the 3P2− 3D3 transition, it would be necessary to performrepumping of atoms that have decayed into hyperfine states other than the initial one.
For the 3P2 − 3D(1,2) transitions, we can identify each of the resonances by their relativepositions, and subsequently calculate the interaction constants A and Q of the 3D1,2 states
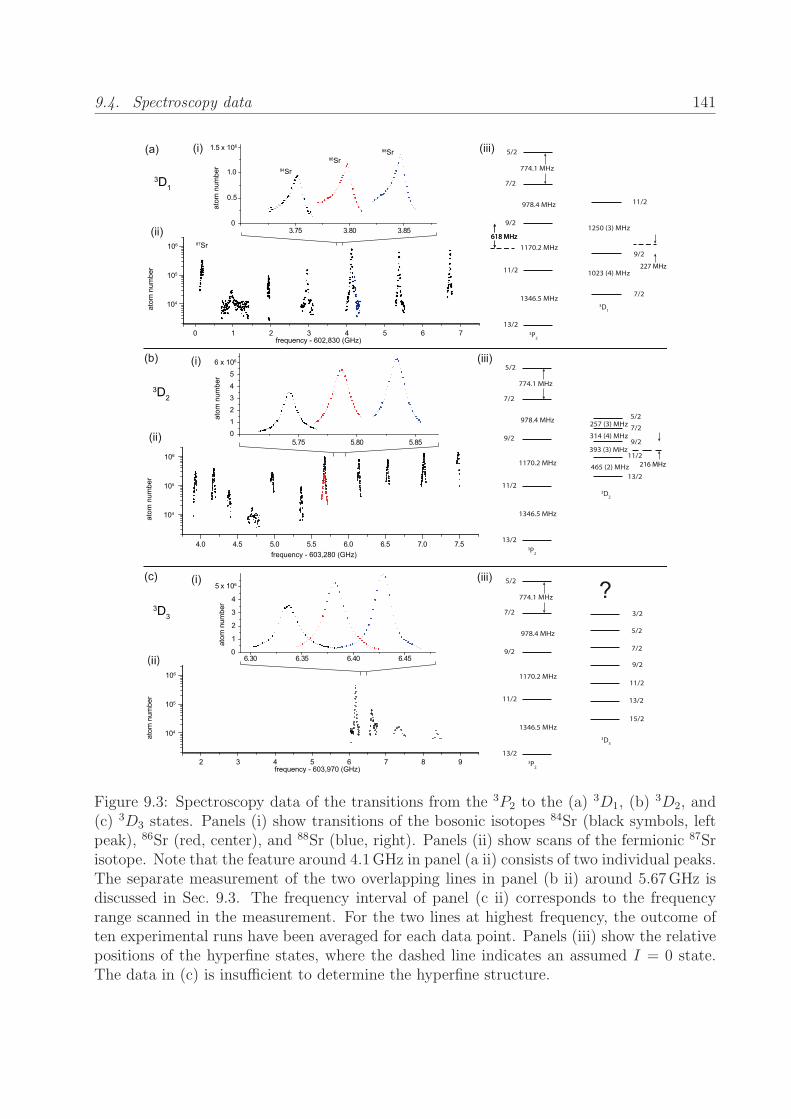
9.4. Spectroscopy data 141
atom
num
ber
frequency - 603,280 (GHz)4.0 4.5 5.0 5.5 6.0 6.5 7.0 7.5
13/2
11/2
9/2
5/2
7/2
13/2
11/2
9/2
5/2
7/2
257 (3) MHz
3P2
3D2
(b)
(ii)
(iii)
3D2
5.75 5.80 5.85012345
6 x 10⁶
atom
num
ber
1346.5 MHz
1170.2 MHz
978.4 MHz
774.1 MHz
465 (2) MHz
393 (3) MHz
314 (4) MHz
atom
num
ber
frequency - 603,970 (GHz)
5/2
11/2
15/2
13/2
11/2
9/2
5/2
7/2
3P2
3D3
(c)
(ii)
(iii)
3D3
atom
num
ber
1346.5 MHz
1170.2 MHz
978.4 MHz
774.1 MHz
2 3 4 5 6 7 8 9
6.30 6.35 6.40 6.450
1
2
3
4
5 x 10⁶ ?
atom
num
ber
frequency - 602,830 (GHz)
11/2
9/2
7/2
13/2
11/2
9/2
5/2
7/2
3P2
3D1
(a)
(ii)
(iii)
104
105
106
3D1
atom
num
ber
1346.5 MHz
1170.2 MHz
978.4 MHz
774.1 MHz
1023 (4) MHz
1250 (3) MHz
0 1 2 3 4 5 6 7
3.75 3.80 3.850
0.5
1.0
1.5 x 10⁶(i)
(i)
(i)
3/2
13/2
7/2
9/2
216 MHz
227 MHz
104
105
106
104
105
106
84Sr
88Sr86Sr
87Sr618 MHz618 MHz
Figure 9.3: Spectroscopy data of the transitions from the 3P2 to the (a)3D1, (b)
3D2, and(c) 3D3 states. Panels (i) show transitions of the bosonic isotopes 84Sr (black symbols, leftpeak), 86Sr (red, center), and 88Sr (blue, right). Panels (ii) show scans of the fermionic 87Srisotope. Note that the feature around 4.1GHz in panel (a ii) consists of two individual peaks.The separate measurement of the two overlapping lines in panel (b ii) around 5.67GHz isdiscussed in Sec. 9.3. The frequency interval of panel (c ii) corresponds to the frequencyrange scanned in the measurement. For the two lines at highest frequency, the outcome often experimental runs have been averaged for each data point. Panels (iii) show the relativepositions of the hyperfine states, where the dashed line indicates an assumed I = 0 state.The data in (c) is insufficient to determine the hyperfine structure.

142 Chapter 9. Reservoir spectroscopy of the 5s5p 3P2 − 5s5d 3D1,2,3 transitions in Sr
using
ΔEhfs/h =A
2K +
Q
2
34K(K + 1)− I(I + 1)J(J + 1)
I(2I − 1)J(2J − 1).
Here, K = F (F + 1)− I(I + 1)− J(J + 1), where I = 9/2 is the nuclear spin, J is the total
angular momentum, and F denotes the hyperfine state, given by �F = �I + �J . The hyperfinestructure of the 3P2 state is known to the kHz-level [Hei77], and we fix these values for ourcalculation. The hyperfine structure is shown in panels (iii).
A compilation of the transition frequencies can be found in Tab. 9.2, and the deducedisotope shifts and interaction constants A and Q are compiled in Tab. 9.1. As discussed inSec. 9.7, the absolute frequencies have an error of 2MHz. The isotope shifts between thebosons can be measured to within 200 kHz. The measurement of the hyperfine structure ofthe fermionic isotope is more involved, leading to a larger error in the magnetic dipole andelectric quadrupole interaction constants A and Q.
9.5 Is the 5s5p 3P2 − 5s5d 3D3 transition cycling?
The 3P2 − 3D3 transitions are unique in that they are the only closed transitions originatingfrom the 3P manifold. There is an infinite ladder of 5snd 3D3 states reachable from the5s5p 3P2 state, starting from n = 4. These transitions have been proposed as MOT transi-tions to cool atoms in the metastable 3P2 state. Doppler cooling on one of them has beenperformed in calcium [Gru02], which has a very similar electronic structure to strontium.These transitions could potentially be used for fluorescence and absorption imaging as well.A recent publication on quantum computation with fermionic 87Sr [Dal08] suggests the useof the 3P2, F = 13/2 → 3D3, F
′ = 15/2 transition for fluorescence readout of atoms in themetastable states. For this application, the transition would need to be cycling. We will firstdetermine the number of photons cycled on the 5s5p 3P2−5s5p 3D3 transition, and commenton the potential usage of the other transitions later. The measurements presented in thefollowing are performed with the bosonic isotope 88Sr, since operation with the fermionicisotope is complicated by the hyperfine structure and multitude of mF states.
The 3P2 − 3D3 transition is certainly not completely cycling, as can be inferred fromthe spectroscopy described in Sec. 9.4: obviously, some atoms are transferred into the 1S0
ground state. One might consider various mechanisms, such as (i) direct decay into the 3P1
state via higher-order processes, or (ii) decay along various dipole-allowed pathways. Case(ii) can be visualized by the level scheme in Fig. 9.1: There are various decay paths fromthe 5s5d 3D3 state into the adjacent 5s6p
3P2 state and further into either the 5s6s 3S1 or5s4d 3D1,2,3 states and into the 5s5p
3P0,1,2 states. Additional channels are opened startingfrom the 4s5p 3F2,3 states. The decay from the 5s5d 3D3 state into states outside of the5s5p 3P manifold should be small due to the large difference in the energy of the releasedphoton, but coupling between the 5s5d 3D3 state and adjacent states could be enhanced byblack-body radiation1.
1As a coincidence, the energy difference of 1050 cm−1 between the 5s6p 3D2 and 5s5d 3D3 states corre-sponds exactly to the maximum intensity of the black body radiation spectrum at room temperature. Ithas been observed in other systems that black body radiation can redistribute population between near-degenerate levels [Gue07], and we assume a similar process here.

9.5. Is the 5s5p 3P2 − 5s5d 3D3 transition cycling? 143
84 602,833,752.9 (2.0) MHz86 3D1 602,833,798.1 (2.0) MHz88 602,833,846.9 (2.0) MHz
5/2→ 7/2 602,830,186.7 (2.0) MHz7/2→ 7/2 602,830,963.6 (2.0) MHz7/2→ 9/2 not observed9/2→ 7/2 602,831,939.1 (2.0) MHz
87 9/2→ 9/2 602,832,967.1 (2.0) MHz9/2→ 11/2 602,834,213.5 (2.0) MHz11/2→ 9/2 602,834,129.3 (2.0) MHz11/2→ 11/2 602,835,381.1 (2.0) MHz13/2→ 11/2 602,836,730.7 (2.0) MHz
84 603,285,688.0 (2.0) MHz86 3D2 603,285,733.3 (2.0) MHz88 603,285,780.8 (2.0) MHz
5/2→ 5/2 603,284,178.9 (2.0) MHz5/2→ 7/2 603,283,927.0 (2.0) MHz7/2→ 5/2 not observed7/2→ 7/2 603,284,694.0 (2.0) MHz7/2→ 9/2 603,284,381.8 (2.0) MHz9/2→ 7/2 603,285,670.6 (2.0) MHz
87 9/2→ 9/2 603,285,358.5 (2.0) MHz9/2→ 11/2 603,284,969.3 (2.0) MHz11/2→ 9/2 603,286,530.8 (2.0) MHz11/2→ 11/2 603,286,133.1 (2.0) MHz11/2→ 13/2 603,285,671.5 (2.0) MHz13/2→ 11/2 603,287,485.6 (2.0) MHz13/2 → 13/2 603,287,021.1 (2.0) MHz
84 603,976,337.0 (2.0) MHz86 3D3 603,976,382.0 (2.0) MHz88 603,976,428.6 (2.0) MHz
? 603,976,180.8 (2.0) MHz87 ? 603,976,619.5 (2.0) MHz
? 603,977,350 (10) MHZ? 603,978,375 (10) MHz
Table 9.2: Measured frequencies of the three 5s5p 3P2 − 5s5d 3D1,2,3 transitions.

144 Chapter 9. Reservoir spectroscopy of the 5s5p 3P2 − 5s5d 3D1,2,3 transitions in Sr
repu
mp
rate
(ato
ms/
s)
0 2 4 6 8 10 12012345
repump time (ms)
x 30
3D23D3
intensity (Isat)
atom
num
ber (
106 )
1010
109
108
107
10-6 10-5 10-4 10-3 10-2
Figure 9.4: Repump rate in dependence of light intensity. The number of atoms repumpedinto the 1S0 ground state is proportional to the repump time before reaching saturation(inset, taken on the 3P2 − 3D3 transition at I = 1 × 10⁻² Isat). This rate is measured for alarge range of intensities on both the 3P2 − 3D2 and
3P2 − 3D3 transitions.
It is now our goal to estimate the branching ratio of atoms in the 5s5d 3D3 state todecay into the 3P2 state, or to decay into other states. To do so, we first measure thenumber of atoms repumped on the 3P2 − 3D2 transition in dependence of repump time.For low intensities and short repumping times, there is a linear dependence of repumpedatoms on repump time until the atom number saturates, see the inset of Fig. 9.4. Weperform this measurement for a wide range of repumping intensities, and plot the rate ofrepumping vs intensity, as shown in Fig. 9.4. Next, we perform the same experiment on the3P2 − 3D3 transition. We find that 30(1)-times the light intensity is needed to achieve thesame repumping rate.
Let us now revisit the other transitions into the 5snd 3D3 states, with n ≥ 4. The5s5p 3P2 − 5s4d 3D3 transition at 2.92μm has a linewidth of only 50 kHz, making it wellsuited for operation of a MOT due to the combination of low Doppler and recoil limit. Thereare no intermediate states between the two, such that this transition is indeed cycling. It isalso the only transition originating from the 3P2 state (except for the open transition into the5s6s 3S1 state) for which the absorption of two photons does not ionize the atom. Apart fromthe fact that lasers at this frequency and linewidth are difficult to operate, efficient MOToperation might be hindered by inelastic losses [Tra09]. The large wavelength brings about asubstantial decrease in imaging resolution compared to the 497-nm transition, which mightbe relevant for single-atom detection. Further, CCD chips based on InGaAs technology donot operate at this wavelength range, but alternative technologies do exist.
The 5s5p 3P2−5s5d 3D3 transition at 497 nm, which has been investigated in this chapter,is probably not well suited for MOT operation due to nonzero branching into other states

9.6. Conclusion 145
and ready ionization upon absorption of two photons. Using this transition for fluorescencedetection might require the repumping of atoms that have decayed out of the fluorescencecycle.
The 5s5p 3P2 − 5s6d 3D3 transition is situated at 403.15 nm, where suitable laser diodeswith high output power are available, thus circumventing the need of frequency doubling2.The effect of nonzero branching ratio into states other than the 5s5p 3P2 state should be evenlarger than for the 5s6d 3P3 state, since further potential decay paths open up: the 5s7p
3P2
state is located only 245.73 cm−1, the 5s4f 3F2,3,4 states are located about 950 cm−1 belowthe 5s6d 3P3 state, see Fig. 9.1. Going up the ladder of 5snd 3D3 states, this branching islikely to become more and more unfavorable.
9.6 Conclusion
In conclusion, we have perfomed spectroscopy on the 5s5p 3P2 − 5s5d 3D1,2,3 transitions instrontium and determined the isotope shifts and A and Q hyperfine parameters. We haveshown that the 5s5p 3P2 − 5s5d 3D3 transition is not completely cycling, which might haveimplications for the usage of this transition for fluorescence detection.
The general scheme of performing spectroscopy on atoms stored in a metastable state canbe applied to many other species as well. Elements such as magnesium, calcium [Han05], andytterbium have an electronic structure very similar to strontium. More complex atoms, suchas the rare-earth species [Han04] dysprosium [Lu11b], holmium, erbium [McC06, Aik12], andthulium [Suk10], which are currently under investigation, all have a wealth of metastablestates which can be trapped in the magnetic field of a MOT.
9.7 Error analysis
The spectroscopy light at 497 nm is generated by a frequency-doubled diode laser, which de-livers about 40mW of green light. The IR laser is locked to a stable reference cavity, whichhas a drift of typically 100 kHz per hour, mainly due to piezo creep and possibly thermal drift.The absolute frequency is constantly monitored on a High Finesse WSU/2 wavemeter. Thewavemeter is calibrated by a Ti:Saph laser at 729 nm. This laser is locked to a high-finessecavity with a drift rate of 10Hz per hour. The absolute frequency is determined by spec-troscopy of the 4s 2S1/2−3d 2D5/2 transition in the
40Ca+ ion at 432 042 129 776 393.2 (1.0)Hz[Chw09]. Calibration of the wavemeter has an (in)accuracy of 500 kHz, which can be re-duced substantially by averaging over many calibrations. If not constantly re-calibrated, thewavemeter drifts by about 100 kHz per hour. A possible inaccuracy of the wavemeter, usedabout 250 nm away from the calibration wavelength, is not considered in this analysis.
The green light is passed through a cascade of four acousto-optic modulators (AOMs) indouble-pass configuration. The AOMs have a design frequency of 350MHz and a bandwidthof about 150MHz, resulting an overall scan range of 1.2GHz. The RF used to drive the
2It is worth mentioning that the 5s5p 3P2 − 5s6d 3D2 transition at 403.15 nm should be well suited forrepumping, where powerful and inexpensive laser diodes available. To our knowledge, this transition has notbeen used so far.
146 Chapter 9. Reservoir spectroscopy of the 5s5p 3P2 − 5s5d 3D1,2,3 transitions in Sr
AOMs is generated by direct digital synthesizers (DDSs), which are referenced to the globalpositioning system (GPS) and have negligible error. The laser light itself has a linewidth onthe order of 1MHz, about 1mW is available for the experiment and collimated to a beamof 18mm diameter to interrogate the atoms.
The dominant uncertainty in our experiment stems from the accuracy and drift of thewavemeter. The accuracy of the absolute transition frequency is limited to the 10MHzaccuracy of the wavemeter. For the measurement of the isotope shifts between the bosons,the wavemeter is carefully calibrated and then left free-running. The complete spectroscopyscan is then performed within less than half an hour, in which the wavemeter drifts by muchless than 100 kHz. A complete scan of all the hyperfine transitions of the fermionic isotopetakes about one day, and the wavemeter might drift by up to 1MHz in this period. Note thatthe error on the frequency of the green light is twice that of the IR light, which we monitoron the wavemeter. As a conservative estimate, the isotope shifts between the bosons can bemeasured with a precision of about 200 kHz, and the hyperfine splittings can be determinedto about 4MHz. We repetitively measure certain transitions over the course of many daysto exclude any long-term drifts and find the scatter to be within less than 1MHz.
The data is fit by a Lorentzian profile, where deviations from a Lorentzian lineshape arevisible only for extremely low repumping intensities. The error in the determination of thecentriod ranges between 50 kHz and a few MHz, depending on the signal strength. Only forweak transitions does this error dominate over the wavemeter uncertainty.

Chapter 10
The lattice
Many experiments targeted at the study of magnetism, topological phases, and related topicsall take place on a lattice geometry. The sites of an optical lattice also form perfect cradles forthe preparation of rovibronic ground-state molecules. In other words: the implementationof an optical lattice is absolutely necessary to pursue the proposals laid out in Chpt. 1.Optical lattices are usually formed by the interference of two counter-propagating laserbeams, forming a standing wave. The light is red- or blue-detuned to the principal transition,thereby forming a periodic potential for the atoms, which accumulate in the potential wells.
The work on optical lattices has been pioneered by the MPQ group in Munich [Gre02],and many experiments around the world are now equipped with such lattices. As the firstalkaline-earth species, both bosonic and fermionic Yb atoms have been loaded into theground state of 3D optical lattices [Fuk09a, Tai10]. These systems are perfectly suited forthe study and simulation of solid-state phenomena, where the light field takes the role ofthe ionic crystal and the atoms take the role of the electrons. In contrast to real solidmaterials, e.g. semi-conductors, the optical lattice is free of defects, and many parameters,such as interactions and lattice depth, can be tuned. The system is governed by the interplaybetween two energy contributions: the energy cost required to place two atoms on a commonlattice site (on-site interaction energy U) and the energy required for an atom to hop fromone lattice site to the next (hopping matrix element J). Together, we find the well-knownBose-Hubbard Hamiltonian
H = −J∑〈i,j〉
a†iaj +
∑i
εia†iai +
U
2
∑i
ni(ni − 1), (10.1)
where ni = a†iai is the occupation of lattice site i, εi is the local energy on a lattice site, and
〈i, j〉 denotes the sum over all neighboring lattice sites. There exists extensive literature forfurther treatment, e.g. Ref. [Blo08] and references therein.
10.1 Experimental techniques
The experimental setup of our 3D lattice at 532 nm has already been described in Chpt. 3.We will start out by establishing some experimental techniques common to all lattice exper-iments.
147

148 Chapter 10. The lattice
initial atom number (106)
atom
num
ber i
n th
e la
ttice
(106 )
0 0.50.0
1 1.5
0.1
0.2
0.3
0.4
0.5
Figure 10.1: Evidence of triply occupied sites: We measure the number of atoms recoveredafter adiabatic loading into a deep lattice. A sharp drop in recovered atom number forsamples of more than 7 × 10⁵ atoms (indicated by the arrow) points to the formation oftriply occupied sites, in which atoms undergo rapid 3-body recombination. The dashed greycurve is a guide to the eye indicating zero losses.
Loading of the lattice — While we observe only little heating when loading 84Sratoms into and out of the lattice, we do observe pronounced atom loss when attempting toincrease the number of atoms in the lattice; see Fig. 10.1. For initial atom numbers belowabout 7× 10⁵, the number of recovered atoms is constantly lower than the initial one, whichwe attribute to 3-body losses in the superfluid bulk as the density increases through theadditional confinement of the lattice beams, and possibly scattering of lattice photons. Forhigher atom number, however, there is dramatic and sudden break-down in atom number.We attribute this loss to the formation of triply occupied sites in the central region, whichrapidly eliminate themselves through inelastic 3-body recombination. We verify that theloss appears already during loading of the lattice (i.e. on timescales below 10ms), not duringa hold time in the lattice. The lifetime of the remaining atoms in the lattice is up to 10 s,depending on the atom number.
We set up a simple model to calculate the “wedding cake” structure in dependence ofatom number [DeM05, She10], and find the formation of the n = 3 Mott shell (i.e. triplyoccupied sites) to set in at an initial atom number of about 1.5× 10⁶ atoms, in rough agree-ment with the observation. As we will see in the next chapter, photoassociation can be usedto determine the number of atoms on doubly occupied sites. All atoms surviving the lat-tice loading and subsequent exposure to photoassociation light must be located on a singlyoccupied site. These three values give a good and model-independent understanding of theatom distribution in the lattice. Note that our lattice sites are a factor of 23 = 8 smallerthan those of a 1064-nm lattice. This requires much higher initial densities to reach largeoccupation numbers, and it seems to reduce the lifetime of triply occupied sites tremendously.
Lattice depth calibration — We need a way to quantify the lattice depth, which isusually stated in units of the recoil energy Erec = �
2k2L/2m, where kL = 2π/λL is the lattice
wave vector. This is done by measuring the energy gap ΔE between the zeroth and second

10.1. Experimental techniques 149
pulse duration (μs)0 10 20 30 40
atom
num
ber (
105 )
0.2
0.0
0.8
0.6
0.4
1.2
1.0
(a) (b) (c)
lattice depth (Erec)
0
� E
(kH
z)
10 205 15
40
60
80
100
2�k
Figure 10.2: Lattice depth calibration. (a) Flashing the two lattice beams orthogonal to theimaging axis for a few μs reveals a beautiful diffraction pattern. (b) The population of thediffraction peaks is modulated with the duration of the pulse. The modulation frequency ω isdirectly related to the energy difference between the zeroth and second band as ΔE = �ω,with only small contributions from higher bands for low enough lattice depths. (c) Thelattice depth given in Erec can be related to ΔE via a simple band structure calculation.
band, and relating this energy to the lattice depth via a simple band structure calculation[Ovc99, Den02]; see Fig. 10.2. The energy gap is measured well in the Kapitza-Dirac regime:the lattice is flashed on for a variable, very short time, and the population of the diffractionpeaks is modulated at the frequency corresponding to ΔE 1. The uncertainty in the mea-sured ΔE is about 1%, and the uncertainty of the band structure calculation is about thesame value, such that this simple method is accurate to within a few percent. The latticedepth is measured independently for all three lattice beams, and the power of the beams isset to obtain an equal depth in all directions.
Band mapping technique — An important technique for lattice experiments is bandmapping. Here, the quasi-momentum of atoms in the lattice is mapped onto real momentumby a fast ramp-down of the lattice [Gre01, Koh05]. The ramping lasts a few ms and isadiabatic on the timescale of the individual lattice sites (O(10 kHz)), but fast on the timescaleof the external confinement (O(10...100Hz)). During the subsequent expansion, atoms ofthe nth band appear in the (n+ 1)th Brillouin zone. A sufficiently cold gas does not fill thelowest lattice band, and the TOF image looks unspectacular. A thermal gas however, whichfills a good part of the lowest band, results in an entirely filled first Brillouin zone, as shownin Fig. 10.3(b). Even hotter atoms might breach the band gap and populate the first excitedband, visible as the second Brillouin zone in Fig. 10.3(c).
When imaging our atoms, we are looking at an edge of the lattice unit cell, not onto aface as in most lattice experiments. While this is true for both of our imaging axes, we willpresent only images from the horizontal imaging system here. Figure 10.3(a) clarifies thegeometry.
1The short pulse is analogous to a thin grating for a beam of photons or massive particles.

150 Chapter 10. The lattice
(a) (b) (c)
quasi-momentum (�k)
2�k
optic
al d
ensi
ty
(arb
. uni
ts)
0 1 2-1-2
optical density (arb. units)
2�2�
k
2�k
quasi-momentum (�k)
optic
al d
ensi
ty
(arb
. uni
ts)
0 1 2-1-2
�k�kx
y
Figure 10.3: The band mapping technique. (a) Most experiments image the atoms lookingat the face of a cubic unit cell (left), whereas we are looking at an edge (right). (b) Anevenly filled first Brillouin zone would not appear as a square, but as a box-shaped densitydistribution of width 2�k in the x-direction and as a triangle of width 2
√2�k in the y-
direction. The Brillouin zone shown here is not completely filled. (c) Thermal atoms mightpopulate the first excited band, visible here as a faint population of the second Brillouinzone, which extends between �k and 2�k in the x-direction and is indicated by the redcircle. Some of the atoms in this image were located on doubly occupied sites and formedrepulsively bound pairs; see Fig. 12.4 for a much clearer signal. The TOF, color scale, andscale of the optical density are different to (b) in order to increase the contrast of smallsignals. Both images are averaged over 20 experimental runs.
10.2 Mott-insulator transition
As a first experiment using the lattice, we will present the famous superfluid-to-Mott insula-tor transition, observed for the first time in strontium. We start out with a pure 84Sr BEC ina crossed dipole trap. The lattice depth is adiabatically increased from zero to 19Erec, heldthere for a short time, and decreased to zero again. Snapshots of the momentum distributionare taken at various times throughout the cycle and shown in Fig. 10.4. For small latticedepths, the BEC remains superfluid, and the periodic potential is a small perturbation. Par-ticles seek to minimize their kinetic energy by spreading out over the lattice, establishinga fixed phase relation across the sample. We observe the appearance of diffraction peaks,caused by the constructive interference of atoms from all lattice sites; equivalent to thediffraction of light from a periodic structure. As the lattice depth increases, atoms begin tolocalize on individual lattice sites, and the phase relation dwindles away: the visibility of thediffraction pattern drops. For the very deep lattice, the atom number on each lattice site isa well-defined Fock state, and the atomic wavepacket is tightly confined to a specific latticesite; all phase coherence between lattice sites is lost. This is called the Mott-insulator (MI)regime, detected by the complete disappearance of interference peaks upon release from thetrap. The external potential leads to a wedding-cake structure with plateaus of uniform
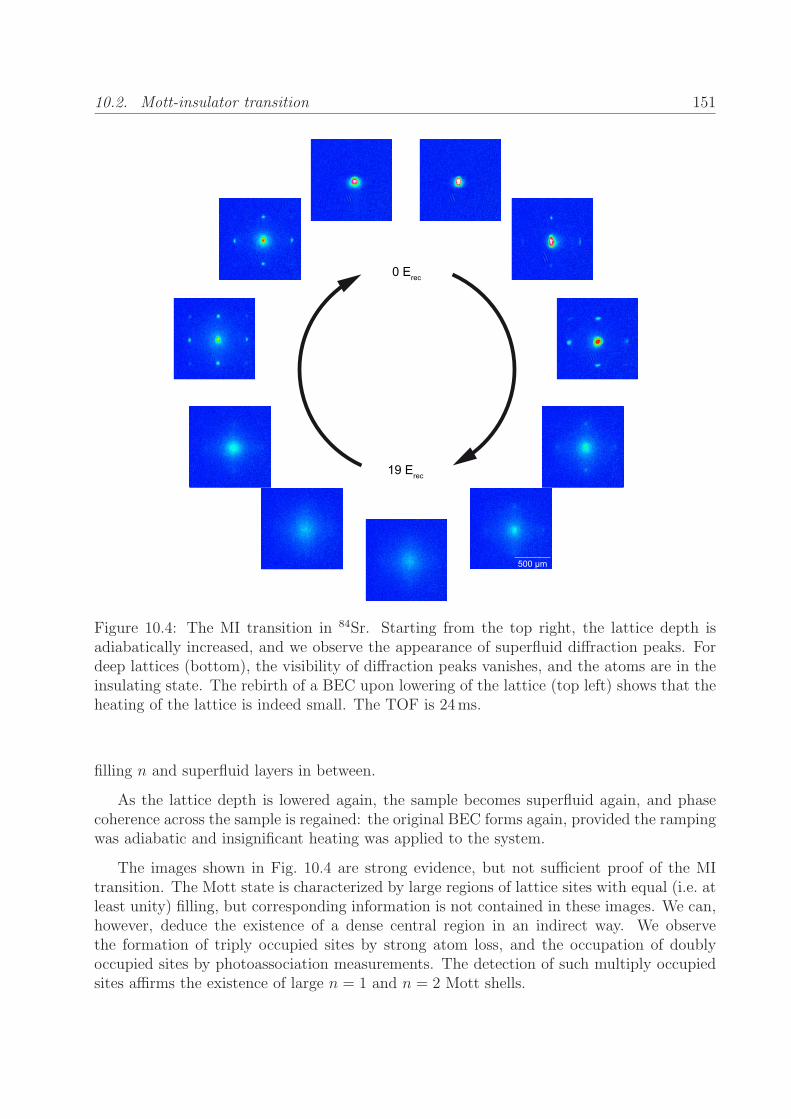
10.2. Mott-insulator transition 151
0 Erec
19 Erec
500 μm
Figure 10.4: The MI transition in 84Sr. Starting from the top right, the lattice depth isadiabatically increased, and we observe the appearance of superfluid diffraction peaks. Fordeep lattices (bottom), the visibility of diffraction peaks vanishes, and the atoms are in theinsulating state. The rebirth of a BEC upon lowering of the lattice (top left) shows that theheating of the lattice is indeed small. The TOF is 24ms.
filling n and superfluid layers in between.
As the lattice depth is lowered again, the sample becomes superfluid again, and phasecoherence across the sample is regained: the original BEC forms again, provided the rampingwas adiabatic and insignificant heating was applied to the system.
The images shown in Fig. 10.4 are strong evidence, but not sufficient proof of the MItransition. The Mott state is characterized by large regions of lattice sites with equal (i.e. atleast unity) filling, but corresponding information is not contained in these images. We can,however, deduce the existence of a dense central region in an indirect way. We observethe formation of triply occupied sites by strong atom loss, and the occupation of doublyoccupied sites by photoassociation measurements. The detection of such multiply occupiedsites affirms the existence of large n = 1 and n = 2 Mott shells.

152 Chapter 10. The lattice
optical density (arb. units)
+9/2
- 9/2(a) (b)
+9/2+7/2
quasi-momentum (�k)
optic
al d
ensi
ty
(arb
. uni
ts)
0 1 2-1-2
2�k
quasi-momentum (�k)
optic
al d
ensi
ty
(arb
. uni
ts)
0 1 2-1-2
2�k
optical density (arb. units)
10 s
tate
s
2 st
ates
Figure 10.5: Fermions in a lattice with (a) 10 spin states and (b) only 2 spin states. Thenumber of occupied spin states is visualized by the OSG technique. Absorption images ofthe Fermi gases prior to loading into the lattice are shown in the top row and indicate asimilar degree of degeneracy of around 0.15T/TF . The band mapping technique reveals apopulation of the lowest Bloch band. There are about twice as many atoms per spin state incase (b) than in case (a), giving rise to a more uniform filling of the first Brillouin zone. Allimages except for the OSG ones are taken after 24ms TOF and have the same color scale,the band mapping images are averaged over five experimental runs.
10.3 Fermions on a lattice
An ultracold gas of fermions loaded into an optical lattice allows for a realization of thefamous Fermi-Hubbard model. Ground-breaking experiments with alkali atoms have beenperformed, establishing fundamental techniques such as the determination of the doublonoccupancy, and measuring basic properties like the incompressibility of a fermionic latticegas (see Refs. [Jor08, Sch08] and Refs. [Blo08, Ess10] for reviews and further references).All of the proposals for alkaline-earth systems outlined in Chpt. 1.1 utilize fermions on alattice as the underlying structure. First experiments with alkaline-earth atoms have beenperformed with Yb [Tai10] and recently demonstrated Pomeranchuk cooling, an importantstep towards the envisioned SU(N) Hubbard systems [Tai12].
For the first time, we will now present the loading of degenerate fermionic 87Sr atomsinto a lattice. The maximum number of spin states in Sr is larger than in Yb, which extendsthe SU(N) systems up to N = 10 and might allow to reach lower temperatures [Bon12].
In a first experiment, we evaporate a mixture of N = 10 spin states to a degeneracyof T/TF = 0.14(2) and load the sample of 28 000 atoms per spin state into a lattice with a

10.4. Spatial Pauli blocking 153
depth of about 16Erec. We perform band mapping [Koh05] and observe a partially-filled firstBrillouin zone; see Fig. 10.5(a). The occupation of higher momenta is not caused by thermalatoms, but a beautiful signature of the finite Fermi momentum even for T → 0. The loadinginto and out of the lattice is not entirely adiabatic, and we observe a decrease in degeneracyto T/TF = 0.30(5) as the lattice is ramped down again. This heating is comparable toprevious experiments with alkali atoms, and the sample remains in the degenerate regimethroughout the sequence.
In a second experiment, we optically pump the atoms into a mixture of only N = 2 spinstates before evaporation. All other experimental parameters, such as the final trap depth,the lattice depth, and the timing are identical to the previous case. Evaporation proceeds alittle less efficient, and we obtain 62 000 atoms per spin state at T/TF = 0.17(3). The largeratom number per spin state leads to an increased filling of the first Brillouin zone, as nicelyseen by a comparison of Figs. 10.5(a) and (b). The heating during the sequence seems to besmaller than in the case of N = 10, and we measure a degeneracy of T/TF = 0.20(2) afterthe lattice ramp-down. While our two measurements are not exactly identical, we note thatrecent experiments by the Kyoto group have shown larger heating rates for larger N as well.
10.4 Spatial Pauli blocking
One of the first experiments we performed in the lattice was an attempt to directly observespatial Pauli blocking, as suggested recently [San11]. In very simplified words, the idea isthe following: two fermionic atoms are prepared on the same lattice site: one is in an excitedstate |e〉, the other in the ground state |g〉, both in the lowest band |0〉. The excited atomsure wants to decay, but the ground state |g, 0〉 is already occupied, and it eventually hasto decay into the first excited band |g, 1〉, but this decay is reduced by a factor η2; seeFig. 10.6(a). Here, η is the Lamb-Dicke parameter and compares the harmonic oscillatorlength with the wavelength of the probe light, η = 2πlho/λ. In essence, this experiment is amodification of the question “What does an excited fermion do if all states of the Fermi seait seeks to decay into are already occupied?”, raised in Ref. [Bus98] for fermions in the bulk.
The original proposal suggests the 3P0 clock state as the excited state. The extremelylong lifetime could be quenched to experimentally accessible timescales by coupling to the1P1 state. The lattice would be operated on the magic wavelength, such that the latticepotential is identical for the 1S0 and
3P0 states. In our present experimental setup, we lackboth the magic wavelength lattice and the clock laser to coherently excite atoms into the3P0 state. Instead, we chose the
3P1 state as |e〉, and we work at a moderate depth of about15Erec in our 532-nm lattice.
The experimental sequence is as follows: A sample of a few 106 atoms of 87Sr is preparedin an incoherent mixture of mF = 7/2 and mF = 9/2 states, evaporated into degeneracy,and loaded into the 3D lattice. We then optically pump the mF = 9/2 atoms into the3P1, |F ′ = 9/2, mF ′ = 9/2〉 state with a short pulse. The natural lifetime of this state is21μs, and we measure the re-appearance of these atoms in the 1S0 state using red absorptionimaging; see Chpt. 7. The excited atom can decay into the mF = 7/2 and mF = 9/2 groundstates, and provided that this atom sits on a doubly-occupied lattice site with the companion

154 Chapter 10. The lattice
time (μs)0 20 40 60 80 100 120
0.00
0.05
0.10
0.15
0.20
0.25
norm
aliz
ed 3 P
1 ato
m n
umbe
r
(a) (b)
Figure 10.6: (a) Scheme to observe spatial Pauli blocking: Two identical fermionic atomsprepared in the internal excited state |e〉 and the internal ground state |g〉 experience thesame external harmonic oscillator potential. In the Lamb-Dicke limit (η � 1), the dominantdecay channel for a single particle |e, 0〉 → |g, 0〉 with a rate Γ0 is now blocked by the ground-state atom due to the Pauli exclusion principle. The excited atom decays under change ofits motional state with a rate that is reduced of order η2. The decay rate Γ0 is smallerthan the vibrational spacing ν. (Image and caption adapted from [San11].) (b) Typicallifetime measurement of atoms in the 3P1, |F ′ = 9/2, mF ′ = 9/2〉 state. Here, the lifetimeis 22.1(9)μs. The data is obtained by measuring the appearance of atoms N(t) in the 1S0
state, normalizing it to the reference value N0 for long wait times, and plotting (1− N/N0)as the decay of the 3P1 state.
atom in the mF = 7/2 state, then this decay path would be blocked and might lead to anincreased lifetime in the 3P1 state. It is this increase in lifetime of a fraction of the
3P1 atomsthat we seek to measure.
Experimentally, we measure the time evolution in the number of atoms in the 1S0, |mF = 9/2〉state following the optical pumping, and from these values deduce the number of atoms inthe 3P1 state; see Fig. 10.6(b). In addition, we perform reference measurements with a spin-polarized sample of thermal mF = 9/2 atoms in the bulk. About 400 data points are takento reduce the statistical uncertainty. Indeed, we find the lifetime of the excited atoms inthe lattice configuration to be increased by about 1.5%. This value, however, is significantlysmaller than our uncertainty of about 15%, and future experiments with a proper setup arerequired for a solid investigation.
10.5 Momentum state crystals revisited
In Chpt. 2.7, we looked into momentum state crystals, formed by multiple cycles of absorp-tion and spontaneous emission of photons close to the 1S0 − 3P1 intercombination line. Theposition of the atoms after TOF resembled the corners of a cubic unit cell. Earlier in thischapter (Sec. 10.1), we worked in a very different regime, and observed the formation of

10.5. Momentum state crystals revisited 155
a different type of lattice: an extended lattice with lattice spacing 2�k, formed upon shortflashing of the lattice beams.
Here, we are working again in the Kapitza-Dirac regime, very different to the measure-ments of Chpt. 2.7. A BEC is released from the dipole trap and immediately subjected to avery short and strong pulse of light red-detuned to the 1S0 − 3P1 transition by 500 kHz. Thelight impinges on the atoms from three retroreflected, mutually orthogonal “lattice” beams,which are our standard circularly polarized MOT beams. The intensity is a few 1000 Isat,and the duration is 10μs. All beams are derived from the same master laser and have thesame frequency, such that the atoms can absorb photons from and re-emit them into themode of any beam.
We can vary the number of beam axes used: with only one beam orthogonal to theimaging axis (here the y-axis; see Fig. 10.7(a)), atoms gain momenta ±ny 2 �k �ey (ni ∈ N)along the direction of the beam. As we add another beam in the x-axis, we obtain anunfamiliar diffraction pattern: not only the ±nx 2 �k �ex ± ny 2 �k �ey momenta are found,but also the ±mx �k �ex ± my �k �ey momenta for even values of (mx +my); see Fig. 10.7(b).
This observation can be generalized to three dimensions by adding a beam along theimaging axis; see Fig. 10.7(c). Besides the well-known momenta
∑i=x,y,z ni 2 �k �ei, also the
momenta∑
i=x,y,z mi �k �ei with even values of∑
i=x,y,z mi are assumed. The reasons thatthese additional peaks are not observed in conventional lattices are the frequency differenceand the orthogonal polarization between orthogonal lattice beams, which do not allow theatoms to absorb a photon from one beam and emit it into another beam. One can also takethe perspective of atoms being diffracted from the standing wave: in this view, orthogonalbeams with a frequency difference of many MHz form a fast-moving interference pattern thatcannot be resolved by the atoms. This experiment is again reminiscent of the seminal workon superradiance in elongated BECs [Ino99], which also showed well-defined momentumpeaks upon scattering of photons. In that case, however, the preferential direction of photonemission was entirely given by the density distribution of the BEC.

156 Chapter 10. The lattice
2 �k ey
�k ex + �k ey
�k ey + �k ez
(a) (b) (c)
y
xz
�k
Figure 10.7: Momentum state crystals in the regime of short laser pulses. Absorption images(top) and corresponding schematic drawings (bottom) for scenarios with (a) one, (b) two, and(c) three orthogonal lattice beams of the same frequency. All six beams interfere pairwise,giving rise to additional diffraction peaks that are not present in usual lattice experiments.Note that the atoms do not form a simple cubic crystal with lattice spacing �k, but a crystalwith face-centered cubic structure and a unit cell size of 2�k.
Chapter 11
Publication: Creation of ultracold Sr2molecules in the electronic groundstate†
Phys. Rev. Lett 109, 115302 (2012)
Simon Stellmer,1 Benjamin Pasquiou,1 Rudolf Grimm,1,2 and Florian Schreck,1
1Institut fur Quantenoptik und Quanteninformation, Osterreichische Akademie der Wissenschaften,6020 Innsbruck, Austria
2Institut fur Experimentalphysik, Universitat Innsbruck, 6020 Innsbruck, Austria
We report on the creation of ultracold 84Sr2 molecules in the electronic groundstate. The molecules are formed from atom pairs on sites of an optical latticeusing stimulated Raman adiabatic passage (STIRAP). We achieve a transferefficiency of 30% and obtain 4×10⁴ molecules with full control over the externaland internal quantum state. STIRAP is performed near the narrow 1S0 − 3P1
intercombination transition, using a vibrational level of the 1(0+u ) potential as
intermediate state. In preparation of our molecule association scheme, we havedetermined the binding energies of the last vibrational levels of the 1(0+
u ), 1(1u)excited-state, and the X1Σ+
g ground-state potentials. Our work overcomes theprevious limitation of STIRAP schemes to systems with magnetic Feshbachresonances, thereby establishing a route that is applicable to many systemsbeyond bi-alkalis.
The creation of ultracold molecular gases has made rapid progress over the last years.The rich internal structure of molecules combined with low translational energy enables pre-
†The author constructed and characterized the optical lattice and build the laser systems required forthe PA spectroscopy and STIRAP. He performed the spectroscopy measurements and analyzed the data.He developed the experimental sequence and characterized the novel scheme of molecule association, andhe acquired and partially analyzed the corresponding data. Calculations of the molecular potentials wereperformed by B. P. The author wrote the manuscript of the supplemental material and contributed to thewriting of the main article.
157

158 Chapter 11. Creation of ultracold Sr2 molecules in the electronic ground state
cision measurements of fundamental constants, realizations of novel quantum phases, andapplications for quantum computation [Kre09]. A very successful route to large samplesof ultracold molecules with complete control over the internal and external quantum stateis association of molecules from ultracold atoms. Early experiments used magnetic Fesh-bach resonances to form weakly bound bi-alkali molecules, some of which have even beencooled to quantum degeneracy [Fer]. Stimulated Raman adiabatic passage (STIRAP) [Vit01]has enabled the coherent transfer of these Feshbach molecules into the vibrational groundstate [Dan08, Lan08, Ni08]. In particular, heteronuclear molecules in the vibrational groundstate have received a lot of attention, because they possess a strong electric dipole moment,leading to anisotropic, long-range dipole-dipole interactions, which will enable studies offascinating many-body physics [Pup]. Efforts are underway to create samples of completelystate-controlled molecules beyond bi-alkalis [Har11, Han11, Nem09], which will widen therange of applications that can be reached experimentally.
So far, the key step in the efficient creation of ultracold molecules has been moleculeassociation using magnetic Feshbach resonances. This magnetoassociation technique cannotbe used to form dimers of alkaline-earth atoms or ytterbium, because of the lack of mag-netic Feshbach resonances in these nonmagnetic species. An example is Sr2, which has beenproposed as a sensitive and model-independent probe for time variations of the proton-to-electron mass ratio [Zel08, Kot09, Bel11]. Another class of molecules for which magnetoas-sociation is difficult, are dimers containing an alkali atom and a nonmagnetic atom, sincein these cases magnetic Feshbach resonances are extremely narrow [Zuc10, Bru12]. Thisdifficulty occurs in current experimental efforts to create LiYb, RbYb, or RbSr molecules[Har11, Han11, Nem09]. Other molecule creation techniques that are suitable for dimerscontaining nonmagnetic atoms have been proposed. Examples are molecule formation bySTIRAP from a Bose-Einstein condensate (BEC) [Mac00, Dru02, Mac05, Dru05] or fromatom pairs in a deep optical lattice [Tom11], as well as two-color photoassociation (PA) ofatom pairs in a Mott insulator [Jak02].
In this Letter, we show that ultracold Sr2 molecules in the electronic ground state canbe efficiently formed, despite the lack of a magnetic Feshbach resonance. Instead of mag-netoassociation, we combine ideas from [Mac00, Dru02, Mac05, Dru05, Tom11, Jak02] anduse optical transitions to transform pairs of atoms into molecules by STIRAP. The moleculeconversion efficiency is enhanced by preparing pairs of atoms in a Mott insulator on the sitesof an optical lattice [Jak98, Gre02]. We achieve an efficiency of 30% and create samples of4× 104 84Sr2 molecules. We perform PA spectroscopy to identify the vibrational levels andoptical transitions used for molecule creation.
STIRAP coherently transfers an initial two-atom state |a〉 into a molecule |m〉 by opticaltransitions; see Fig. 11.1. In our case, the initial state |a〉 consists of two 84Sr atoms occupyingthe ground state of an optical lattice well. The final state |m〉 is a Sr2 molecule in the second-to-last (ν = −2) vibrational level of the X1Σ+
g ground-state molecular potential withoutrotational angular momentum. The molecules have a binding energy of 645MHz and arealso confined to the ground state of the lattice well. States |a〉 and |m〉 are coupled by laserfields L1 and L2, respectively, to state |e〉, the third-to-last (ν ′ = −3) vibrational level of themetastable 1(0+
u ) state, dissociating to1S0 +
3P1.
We use the isotope 84Sr for molecule creation, since it is ideally suited for the creation

159
ener
gy (c
m-1)
internuclear separation (a0)
� = -2
bind
ing
ener
gy/h
(GH
z)
internuclear separation (a0)
bind
ing
ener
gy/h
(GH
z)
0
2000
4000
6000
8000
10000
12000
14000
16000
-1.0
-0.8
-0.6
-0.4
-0.2
0.0
0 10 20 40
1S0 + 1S0 X 1�g
50 150
-1.2
-1.0
-0.8
-0.6
-0.4
-0.2
0.0
|e �
|m �
|a �
30
|m �
|e �
100
� = -1
internuclear separation (a0)50 150100
-1.4
� = -1� = -2� = -3
� = -4
h�
�
1S0 + 3P1 1(0u )
L1, �1
L2, �2
X 1�g+
+
+
1(0u )+
Figure 11.1: Molecular potentials and vibrational levels of 84Sr2 involved in STIRAP. Theinitial state |a〉, an atom pair in the ground state of an optical lattice well, and the finalmolecular state |m〉, are coupled by laser fields L1 and L2 to the excited state |e〉 withRabi frequencies Ω1 and Ω2, respectively. The parameter Δ is the detuning of L1 from the1S0− 3P1 transition and Γ is the decay rate of |e〉. The insets show the last vibrational levelsof the molecular potentials and the wavefunctions of states |m〉 and |e〉. For comparison,the wavefunction of atomic state |a〉 (not shown) has its classical turning point at a radiusof 800 a0, where a0 is the Bohr radius. The potentials are taken from [Ste08, Sko12] and thewavefunctions are calculated using the WKB approximation. The energies of states |m〉 and|e〉 are not to scale in the main figure.
of a BEC [Ste09, Mar09a], and formation of a Mott insulator. The binding energies ofthe vibrational levels involved in our STIRAP scheme are only known for the isotope 88Sr[Zel06, Mar08] and can be estimated for 84Sr by mass-scaling [Gri93, Gao00]. An essentialtask in preparation for molecule creation is therefore to spectroscopically determine thebinding energies of relevant 84Sr2 levels.
We perform PA spectroscopy on a 84Sr BEC, produced similarly to our previous work

160 Chapter 11. Creation of ultracold Sr2 molecules in the electronic ground state
ν 1(0+u ) 1(1u) X1Σ+
g (l = 0) X1Σ+g (l = 2)
(MHz) (MHz) (MHz) (MHz)−1 −0.32(1) −351.45(2) −13.7162(2) -−2 −23.01(1) −644.7372(2) −519.6177(5)−3 −228.38(1)−4 −1288.29(1)
Table 11.1: Binding energies of the highest vibrational levels of the 1(0+u ), 1(1u), and X
1Σ+g
(l = 0, 2) states, where l is the rotational angular momentum quantum number. The levelsare labeled by ν, starting from above with ν = −1. Measurement procedure and errordiscussion are given in Sec. 11.1.1.
[Ste09]; see Sec. 11.1.1. The BEC is confined in an oblate crossed-beam optical dipoletrap with oscillation frequencies of 55Hz in the horizontal plane and 180Hz in the verticaldirection, based on two 5-W laser sources operating at 1064 nm with a linewidth of 3 nm.Laser fields L1 and L2, which are used for spectroscopy and STIRAP, have linewidths of ∼2 kHz and are referenced with an accuracy better than 1 kHz to the 1S0−3P1 intercombinationline, which has a natural width of Γ/2π = 7.4 kHz. To achieve the coherence of the laserfields required for STIRAP, L1 and L2 are derived from the same master laser by means ofacousto-optical modulators. These laser beams are copropagating in the same spatial modewith a waist of 100(25)μm on the atoms and are linearly polarized parallel to a guidingmagnetic field of 120mG.
One-color PA spectroscopy is used to determine the binding energies of the last fourvibrational levels of the 1(0+
u ) state. To record the loss spectrum, we illuminate the BECfor 100ms with L1 for different detunings Δ with respect to the 1S0 − 3P1 transition. Thebinding energies derived from these measurements are presented in Tab. 12.1.
We then use two-color PA spectroscopy to determine the binding energies of the lastvibrational levels of the X1Σ+
g ground-state potential. The loss spectra are recorded in thesame manner as for one-color PA spectroscopy, just with the additional presence of L2.Figure 11.2 shows two spectra, for which L2 is on resonance with the transition from state|m〉 to state |e〉. The difference between the spectra is the intensity of L2. The spectrumshown in Fig. 11.2(a) was recorded at high intensity and displays an Autler-Townes splitting[Aut55]. In this situation, the coupling of states |m〉 and |e〉 by L2 leads to a doublet ofdressed states, which is probed by L1. The data of Fig. 11.2(b) was recorded at low intensityand shows a narrow dark resonance at the center of the PA line. Here, a superposition ofstates |a〉 and |m〉 is formed, for which excitation by L1 and L2 destructively interfere. Thebinding energies of the ground-state vibrational levels derived from measurements of darkresonances are given in Tab. 12.1.
The Rabi frequencies Ω1,2 of our coupling lasers are determined by fitting a three-mode model to the spectra [Win05]; see Fig. 11.2. The free-bound Rabi frequency Ω1
scales with intensity I1 of L1 and atom density ρ as Ω1 ∝ √I1√
ρ [Dru02]. The bound-bound Rabi frequency Ω2 ∝ √
I2 depends only on the intensity I2 of L2. We obtainΩ1/(
√I1
√ρ/ρ0) = 2π× 10(4) kHz/
√W/cm2 at a peak density of ρ0 = 4 × 1014 cm−3 and
Ω2/√
I2 = 2π× 50(15) kHz/√W/cm2, where the error is dominated by uncertainty in the

161
(a)
(b)
(� - 228.38 MHz) (kHz)-100 -50 0 50 100
0.0
0.5
1.0
norm
aliz
ed a
tom
num
ber
-200 -100 0 100 2000.0
0.5
1.0
Figure 11.2: Two-color PA spectra near state |e〉 for two intensities of L2. (a) For highintensity (20W/cm2) the spectrum shows an Autler-Townes splitting. (b) For low intensity(80mW/cm2) a narrow dark resonance is visible. For both spectra, the sample was illu-minated by L1 for 100ms with an intensity of 7mW/cm2 at varying detuning Δ from the1S0-
3P1 transition. The lines are fits according to a three-mode model [Win05].
laser beam intensity.
To enhance molecule formation, we create a Mott insulator by loading the BEC into anoptical lattice; see Chpt. 10. The local density increase on a lattice site leads to an increasedfree-bound Rabi frequency Ω1. Furthermore, molecules are localized on lattice sites andthereby protected from inelastic collisions with each other. The lattice is formed by threenearly orthogonal retroreflected laser beams with waists of 100μm on the atoms, derivedfrom an 18-W single-mode laser operating at a wavelength of λ = 532 nm. Converting theBEC into a Mott insulator is done by increasing the lattice depth during 100ms to 16.5Erec,where Erec = �
2k2/2m is the recoil energy with k = 2π/λ and m the mass of a strontiumatom. After lattice ramp-up, the 1064-nm dipole trap is ramped off in 100ms.
To estimate the number of doubly occupied sites, which are the sites relevant for moleculeformation, we analyze the decay of the lattice gas under different conditions. After loadinga BEC with less than ∼ 3 × 10⁵ atoms into the lattice, the lifetime of the lattice gas is10(1) s. For higher BEC atom numbers, we observe an additional, much faster initial decayon a timescale of 50ms, which removes a fraction of the atoms. We attribute this loss tothree-body decay of triply occupied sites, which are formed only if the BEC peak density

162 Chapter 11. Creation of ultracold Sr2 molecules in the electronic ground state
x 1/10
L2 L1C
(a)
x 1/10(b)
(c)
time (μs)
atom
num
ber (
103 )
inte
nsity
60 80 100 120 140 160 180 20040200
0
1
2
30
20
40
600.00.51.0
association STIRAP dissociation STIRAP
Figure 11.3: Time evolution of STIRAP transfers from atom pairs to Sr2 molecules andback. (a) Intensities of L1, L2, and cleaning laser C, normalized to one. (b), (c) Atomnumber evolution. For these measurements, L1 and L2 are abruptly switched off at a givenpoint in time and the atom number is recorded on an absorption image after 10ms freeexpansion. Note the scaling applied to data taken during the first 100μs (triangles). Thestarting point for the time evolution shown in (b) is a Mott insulator, whereas the startingpoint for (c) is a sample for which 80% of the atoms occupy lattice sites in pairs.
is high enough. To obtain a high number of doubly occupied sites, we load a large BEC of1.5× 106 atoms into the lattice. After the initial decay, 6× 10⁵ atoms remain. By inducingPA loss using L1, we can show that half of these atoms occupy sites in pairs.
We are now ready to convert the atom pairs on doubly occupied sites into moleculesby STIRAP. This method relies on a counterintuitive pulse sequence [Vit01], during whichL2 is pulsed on before L1. During this sequence, the atoms populate the dark state |Ψ〉 =(Ω1 |m〉+Ω2 |a〉)/(Ω2
1+Ω22)
1/2, where Ω1 and Ω2 are the time-dependent Rabi frequencies ofthe two coupling laser fields as defined in [Vit01], which can reach up to Ωmax
1 ∼ 2π×150 kHzand Ωmax
2 = 2π × 170(10) kHz in our case 1. Initially the atoms are in state |a〉, which is
1Note that [Win05] and [Vit01, Win07] use different definitions of Ω1, which we note here as ΩBEC1 and
ΩMI1 . We use the three-mode model of [Win05] to determine ΩBEC
1 from two-color PA spectroscopy of a BEC.This model is not able to describe STIRAP starting from an atom pair on a lattice site. Suitable models aregiven in [Vit01, Win07] and use ΩMI
1 , which we approximate by ΩMI1 ∼ √
2√
ρMI0 /ρBEC
0
√ISTIRAP1 /IPA
1 ΩBEC1 .
Here ρBEC0 = 4 × 1014 cm−3 is the peak density of the BEC, ρMI
0 = 5 × 1015 cm−3 the peak density of anatom pair on a lattice site, IPA
1 the intensity of L1 used for PA spectroscopy, and ISTIRAP1 the intensity of
L1 used during STIRAP, which is maximally 10W/cm2. The factor√
2 is discussed in [Dru05].

163
x (μm)
(a)y
linea
r den
sity
(107 m
-1)
-200 -100 0 100 2000
2
4
6
8
10
x
(b)
Figure 11.4: Quasi-momentum distribution of repulsively bound pairs. (a) Average of 20absorption images recorded 10ms after release of the atoms from the lattice. (b) Integral ofthe distribution along y.
the dark state after L2 is suddenly switched on, but L1 kept off. During the pulse sequence,which takes T = 100μs, L1 is ramped on and L2 off; see association STIRAP in Fig. 11.3(a).This adiabatically evolves the dark state into |m〉 if Ωmax
1,2 � 1/T , a condition, which wefulfill. To end the pulse sequence, L1 is suddenly switched off. During the whole process,state |e〉 is only weakly populated, which avoids loss of atoms by spontaneous emission ifΩmax
1,2 � Γ. This condition is easily fulfilled with a narrow transition as the one used here.The association STIRAP transfer does not lead to molecules in excited lattice bands, sinceT is long enough for the band structure to be spectrally resolved.
We now characterize the molecule creation process. To detect molecules, we dissociatethem using a time-mirrored pulse sequence (dissociation STIRAP in Fig. 11.3(a)) and takeabsorption images of the resulting atoms. The atom number evolution during moleculeassociation and dissociation is shown in Fig. 11.3(b). After the molecule association pulsesequence, 2 × 10⁵ atoms remain, which we selectively remove by a pulse of light resonantto the 1S0 − 1P1 atomic transition, out of resonance with any molecular transition2; see“cleaning” laser C in Fig. 11.3(a). The recovery of 2×10⁴ atoms by the dissociation STIRAPconfirms that molecules have been formed. Further evidence that molecules are the origin ofrecovered atoms is that 80% of these atoms occupy lattice sites in pairs. Quantitatively thisis shown by removing atom pairs using PA and measuring the loss of atoms. Qualitativelywe illustrate this fact by creating and detecting one-dimensional repulsively bound pairsalong the x-direction [Win06]. The pairs were created by ramping the x-direction latticebeam to a value of 10Erec before ramping all lattice beams off, which propels the pairs intofree atoms with opposite momenta along x. Figure 11.4 shows the characteristic momentumspace distribution of these pairs.
To estimate the STIRAP efficiency and subsequently the number of molecules, we performanother round of molecule association and dissociation on such a sample of atoms withlarge fraction of doubly occupied sites; see Fig. 11.3(c). We recover f = 9% of the atoms,which corresponds to a single-pass efficiency of
√f = 30%. The largest sample of atoms
2The pulse of light (duration 7μs, intensity 250mW/cm2) separates the atoms in momentum space fromthe molecules, which leads to a spatial separation on absorption images recorded after 10ms free expansion.

164 Chapter 11. Creation of ultracold Sr2 molecules in the electronic ground state
created by dissociating molecules contains Na = 2.5 × 10⁴ atoms, which corresponds toNm = Na/(2
√f) = 4× 10⁴ molecules.
We measure the lifetime of molecules in the lattice, by varying the hold time betweenmolecule creation and dissociation. We obtain ∼ 60μs, nearly independent of the latticedepth. Executing the cleaning laser pulse after the hold time instead of before, does notchange the lifetime. This time is surprisingly short and can neither be explained by scatteringof lattice photons nor by tunneling of atoms or molecules confined to the lowest band of thelattice and subsequent inelastic collisions. By band mapping [Gre01], we observe that 3×10⁴
of the initial 6×10⁵ atoms are excited to the second band during the association STIRAP, andmore atoms have possibly been excited to even higher bands. We speculate that these atoms,which move easily through the lattice, collide inelastically with the molecules, resulting inthe observed short molecule lifetime. The cleaning laser pulse is not able to push theseatoms out of the region of the molecules fast enough to avoid the loss. The short lifetimecan explain the 30%-limit of the molecule conversion efficiency. Without the loss, the highRabi frequencies and the good coherence of the coupling lasers should result in a conversionefficiency close to 100%. The excitation of atoms to higher bands cannot be explained byoff-resonant excitation of atoms by L1 or L2. Incoherent light of the diode lasers on resonancewith the atomic transition might be the reason for the excitation. Further investigation ofthe excitation mechanism is needed in order to circumvent it.
In conclusion, we have demonstrated that it is possible to use STIRAP to coherentlycreate Sr2 molecules from atom pairs on the sites of an optical lattice. The advantage of thistechnique compared to the traditional magnetoassociation approach is that it can be usedfor systems that do not possess a suitable magnetic Feshbach resonance. This new approachmight be essential for the formation of alkali/alkaline-earth molecules.
We thank Manfred Mark for helpful discussions. We gratefully acknowledge support fromthe Austrian Ministry of Science and Research (BMWF) and the Austrian Science Fund(FWF) through a START grant under Project No. Y507-N20. As member of the projectiSense, we also acknowledge financial support of the Future and Emerging Technologies(FET) programme within the Seventh Framework Programme for Research of the EuropeanCommission, under FET-Open grant No. 250072.
11.1 Supplemental material
11.1.1 One-color PA spectroscopy
We use one-color PA spectroscopy to measure the binding energies of the last vibrationallevels of the 1(0+
u ) and 1(1u) states. A pure BEC of 106 atoms is illuminated by L1 for 100ms,and the number of remaining atoms is measured by absorption imaging. The detuning Δ ofL1 with respect to the atomic
1S0 − 3P1 transition is changed for consecutive experimentalruns, generating loss spectra as the ones shown in Fig. 11.5. To compensate the differencein line strength for the different vibrational levels, we adjust the intensity of L1 to obtain alarge, but not saturated signal. Intensities used for the last four levels (ν ′ = −1,−2,−3,−4)of the 1(0+
u ) state and the last level (ν′ = −1) of the 1(1u) state are 0.005, 1.8, 3.7, 260, and
260 mW/cm2, respectively.

11.1. Supplemental material 165
� (MHz)
rem
aini
ng fr
actio
n
1.0
0.8
0.6
0.4
0.2
0.0-22.5-23.0-228.0-228.5 0.0-0.5
Hallo Hanna!
�' = -1�' = -2�' = -3
Figure 11.5: One-color PA spectra. A BEC is illuminated by L1, and the fraction of remainingatoms is recorded (black circles). Various loss features are observed in the dependence on theL1 frequency. Except for the atomic transition feature near zero, these features correspondto vibrational levels of the 1(0+
u ) state.
The lineshapes of the resonances are very symmetric and can be described by a simpleLorentz profile. This is in contrast to similar measurements performed in a thermal gas of88Sr, where the inhomogeneous broadening of the line had to be considered [Zel06]. Theuncertainty in the position of the resonances amounts to 1, 2, 2, 6, and 20 kHz for the fivelevels mentioned above, and to 1 kHz for the atomic transition. Systematic errors arise fromlight shifts and mean-field shifts; see Tab. 11.2. We measure these shifts for the ν ′ = −3level and find that they are on the kHz scale; see Fig. 11.7(a) and (b). The strength of themagnetic field does not influence the resonance position, since we use π-polarized light forspectroscopy and drive a magnetic field insensitive mJ = 0 to m′
J = 0 transition. We do notmeasure light shifts and mean-field shifts for the other vibrational levels, and therefore givea rather conservative total uncertainty of 10 kHz in Tab. I of the article.
11.1.2 Two-color PA spectroscopy
We use two-color PA spectroscopy to determine the binding energies of the last vibrationallevels of the ground-state potential. The two laser fields L1 and L2 couple three states ina Λ-scheme. Laser field L1 couples two BEC atoms to a molecular state |e′〉, which is avibrational level of the 1(0+
u ) state. Laser field L2 couples |e′〉 to a molecular state |m′〉 inthe ground-state potential. The frequency difference between L1 and L2 gives the bindingenergy of |m′〉.
As an example, we present the determination of the binding energy of the last boundlevel ν = −1 of the X1Σ+
g ground-state. Here we choose the excited vibrational level ν ′ = −3as the intermediate state |e′〉. A pure BEC of 6× 10⁵ atoms is prepared in an optical dipoletrap and illuminated by L1 and L2 for 100ms. Afterwards, the number of remaining atomsis measured using absorption imaging. The frequency of L1 is always set to be resonant withthe free-bound transition, and the intensity is chosen such that almost all atoms are ejectedfrom the trap. To search for the molecular state |m′〉, the frequency of L2 is increased from

166 Chapter 11. Creation of ultracold Sr2 molecules in the electronic ground state
error source uncertaintykHz
position free-free 1position free-bound 2
master laser < 1total 2
error source shift shift shiftHz/mW Hz/(mW/cm2) mW kHz
L1 Stark 2.2(1)× 104 300 0.06 1.3vert DT Stark 170(10) 0.003 4 0.6
mHz/atom atomsmean field 2.4(5) ≤ 106 ≤ 2.5
Table 11.2: Uncertainties and systematic shifts for the binding energy of the ν ′ = −3vibrational level of the 1(0+
u ) state.
effect shift shift shift uncert.HzμW
HzmW/cm2 mW Hz Hz
L1 Stark 16.4(4) 2.8(1) 4.5× 10⁻⁴ 3 <1L2 Stark −10.2(4) −1.7(1) 6× 10⁻⁴ −6 <1
hor DT Stark 4(1)× 10−4 50(10) 320 120 30vert DT Stark 1.1(3)× 104 90(40) 27 300 100
fitting 5RF 1
shot-to-shot 80total 420 130
Table 11.3: Error budget for the binding energy of the ν = −2 (l = 0) level of the X1Σ+g
state.
one experimental run to the next. If L2 is on resonance with the bound-bound transition, anatom-molecule dark state is created. Light from L1 is no longer absorbed and no photoas-sociative loss occurs. We are searching for this dark resonance as a signature of state |m′〉while we change the frequency of L2.
Without initial knowledge about the rough position of the resonance, many 100MHzneed to be scanned; see Fig. 11.6(a). Once the resonance is found, we can reduce theintensity of L2, which reduces the width of the resonance considerably. Consecutive scanswith decreasing intensity allow for a very precise determination of the resonance position,shown in Fig. 11.6(a) through (f). The data can be fitted nicely with a Lorentz profile. Forthe smallest L2 intensity used here, we obtain a linewidth of 1.0 kHz and an uncertainty inthe position of the resonance of 5 Hz. We find the lineshapes to be very symmetric, whichis in contrast to [Mar08], where the measurements were performed in a thermal gas.
In the search presented, we had no initial knowledge about the position of the resonance.

11.1. Supplemental material 167
100 MHz
0
1
2
0
2
0
2
3
1
atom
num
ber (
105 )
0
1
1
0.5
1.5
0.4
0.2
0.6
4
6(a)
ν (L1) - ν (L2) (MHz)
0-100 -50-150 -14 -13-15 -13.5-14
-13.7-13.75 -13.716-13.718-13.715-13.72 -13.71
2 MHz 500 kHz
50 kHz 10 kHz 2 kHz
(b) (c)
(d) (e) (f)
Figure 11.6: Search for a dark resonance. A BEC is illuminated by laser fields L1 and L2,where the frequency of L1 is kept fixed as the frequency of L2 is varied. The number of atomsremaining after a 100 ms pulse is recorded (black circles). The resonance feature is describedby a Lorentz profile (red line). The intensity of L2 is continuously reduced from (a) through(f), assuming values of 110, 13, 3.2, 0.084, 0.038, and 0.013mW/cm2, respectively, therebydrastically reducing the linewidth of the resonance.
The search can be simplified if the rough position is calculated beforehand. We can estimatethe energy of the last bound level from the known s-wave scattering length of 84Sr [Mar08,Ste10a] using a simple analytical model [Gri93]. Using general properties of van der Waalspotentials [Gao00], this estimation is extended to more deeply bound levels. This estimationguides our search for two other bound levels of the X1Σ+
g state: the ν = −2 level for l = 0and the ν = −1 level for l = 2.
We will now investigate the systematic errors and uncertainties of our measurement. Thedominant systematic errors are caused by light shifts induced by the light fields involved: L1
and L2, as well as the horizontal and vertical dipole trap beams. For a systematic analysis,we vary each parameter independently, and record the resonance position. We fit the datawith a straight line and extrapolate to zero; examples are shown in Fig. 11.7(c) and (d).
Uncertainties in the laser frequencies are small, since L1 and L2 are generated by injection-
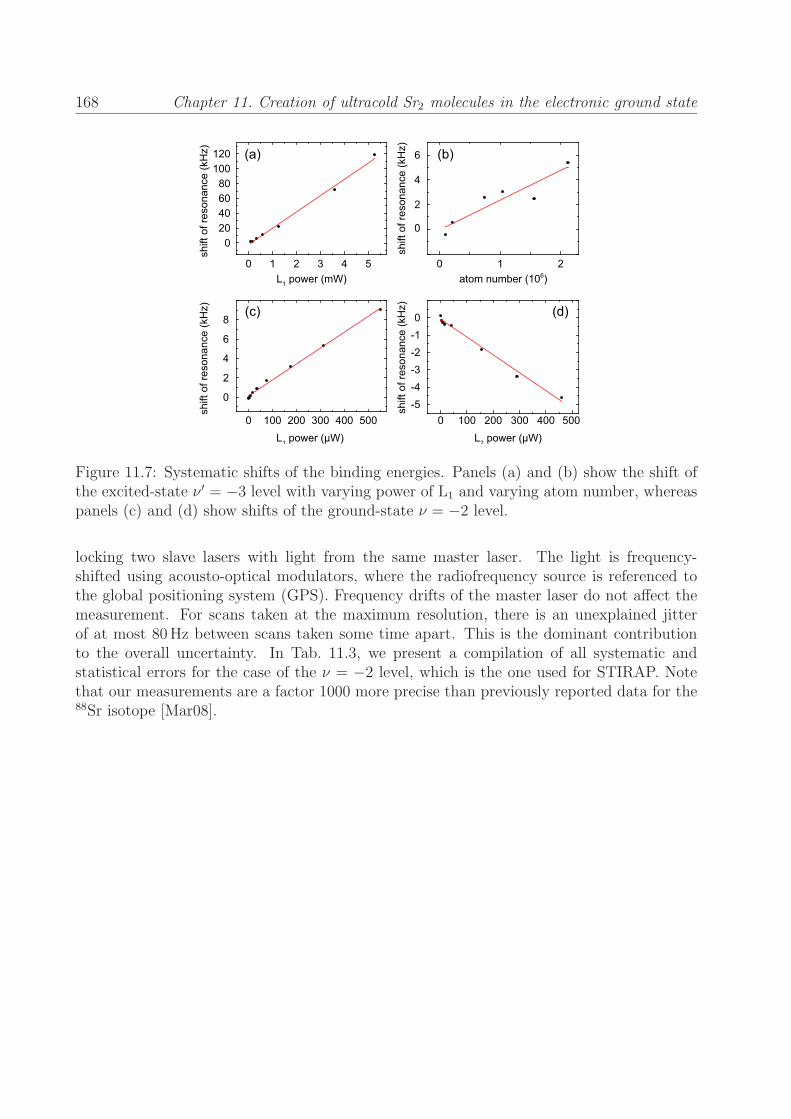
168 Chapter 11. Creation of ultracold Sr2 molecules in the electronic ground state
(a) (b)
(d)(c)
L1 power (mW)
shift
of r
eson
ance
(kH
z)
0 1 2 3 4 5
020406080
100120
atom number (106)0 1 2
0
shift
of r
eson
ance
(kH
z)
2
4
6
L1 power (μW)0 100 200 300 400 500
shift
of r
eson
ance
(kH
z)
0
2
4
6
8
L2 power (μW)0 100 200 300 400 500
-10
-2-3-4-5sh
ift o
f res
onan
ce (k
Hz)
Figure 11.7: Systematic shifts of the binding energies. Panels (a) and (b) show the shift ofthe excited-state ν ′ = −3 level with varying power of L1 and varying atom number, whereaspanels (c) and (d) show shifts of the ground-state ν = −2 level.
locking two slave lasers with light from the same master laser. The light is frequency-shifted using acousto-optical modulators, where the radiofrequency source is referenced tothe global positioning system (GPS). Frequency drifts of the master laser do not affect themeasurement. For scans taken at the maximum resolution, there is an unexplained jitterof at most 80Hz between scans taken some time apart. This is the dominant contributionto the overall uncertainty. In Tab. 11.3, we present a compilation of all systematic andstatistical errors for the case of the ν = −2 level, which is the one used for STIRAP. Notethat our measurements are a factor 1000 more precise than previously reported data for the88Sr isotope [Mar08].

Chapter 12
Laser cooling to quantum degeneracy
We laser cool a gas of strontium atoms to Bose-Einstein condensation (BEC). The condensateis formed within a sample that is continuously Doppler cooled to below one microkelvin on anarrow-linewidth transition. The critical phase-space density for BEC is reached in a centralregion of the sample, in which atoms are rendered transparent for laser cooling photons andthe number density is locally enhanced. Thermal equilibrium between the gas in this centralregion and the surrounding laser cooled part of the cloud is established by elastic collisions.Condensates of up to 105 atoms can be repeatedly formed on a timescale of 100ms, withprospects for the generation of a continuous atom laser.
12.1 Laser cooling to quantum degeneracy
Laser cooling has revolutionized contemporary atomic and molecular physics in many re-spects, for example pushing the precision of clocks by orders of magnitude, and enabling ionquantum computation [Ari92]. Since the early days of laser cooling, the question has beenasked if this efficient method would allow to cool atomic gases to the quantum degenerateregime. Despite significant experimental and theoretical effort this goal has been elusive. Sofar, laser cooling had to be followed by evaporative cooling to reach quantum degeneracy[Ing99].
A gas of bosonic atoms with number density n and temperature T enters the quantum-degenerate regime and forms a Bose-Einstein condensate if its phase-space density nλ3
dB
exceeds a value of 2.612. Here λdB = h/(2πmkBT )1/2 is the thermal de Broglie wavelength,where h and kB are Planck’s and Boltzmann’s constant, respectively, and m is the mass ofan atom. Since nλ3
dB ∝ nT−3/2, low temperatures in combination with high densities haveto be reached to obtain quantum degeneracy. Numerous studies, mainly carried out in the1980’s and 90’s, have paved the ground to the present state of the art of laser cooling andhave identified the limitations of the technique [Chu].
The longstanding goal of reaching the quantum degenerate regime by laser cooling[Dum94, Wis95, Spr95, Ols96, Bor96, Cir96, Mor98, Cas98, San99] can be discussed in termsof three main experimental challenges. First, temperatures in the low microkelvin regimehave to be reached. Only here, quantum degeneracy can be obtained at a density that islow enough to avoid fast decay of the gas by molecule formation. This challenge has been
169

170 Chapter 12. Laser cooling to quantum degeneracy
y
x
z
y
gravity
0.3 mm
y
xz
light shift by “transparency” beam
dimplereservoir
dimplereservoir
“transparency”transition
cooling transition
688 nm4.4 MHz
689 nm7.4 kHz
3P1
1S0
3P1
3S1
1S0
ener
gy
(a) (b)
(d)
(c)
(e)
(f)
Figure 12.1: Scheme to reach quantum degeneracy by laser cooling. (a) A cloud of atomsis confined in a deep reservoir dipole trap and exposed to a single laser cooling beam (redarrow). Atoms are rendered transparent by a “transparency” laser beam (green arrow) andaccumulate in a dimple dipole trap by elastic collisions. (b) Level scheme showing the lasercooling transition and the transparency transition. (c) Potential experienced by 1S0 ground-state atoms and atoms excited to the 3P1 state. The transparency laser induces a light shifton the 3P1 state, which tunes the atoms out of resonance with laser cooling photons. (d)through (f) Absorption images of the atomic cloud recorded using the laser cooling transition.The images show the cloud from above and demonstrate the effect of the transparency laser(e) and the dimple (f). (d) is a reference image without these two laser beams.

12.1. Laser cooling to quantum degeneracy 171
met with several laser cooling techniques, as for example Sisyphus cooling [Let88, Dal89],velocity selective coherent population trapping [Asp88], Raman cooling [Kas92], Raman side-band cooling [Ham98], or Doppler cooling on narrow lines [Ido00]. The second challenge isan efficient trapping scheme that allows to accumulate atoms at high density at a certainlocation [SK98b, Web03]. The third, and most severe challenge is to avoid the detrimentaleffects of the laser cooling photons, which impede the required density increase. One sucheffect are light-assisted inelastic collisions, which lead to loss [Jul92, Wal97]. Another is thereabsorption of photons scattered during laser cooling [Ses91], which leads to an effective re-pulsion between the atoms and to heating of atoms in the lowest energy states. Both effectsincrease with density and make it impossible to reach quantum degeneracy. For low phase-space density samples, this challenge has been overcome by rendering the atoms transparentto laser cooling photons [Ket93, Gri06, Cle09] or by decreasing the photon scattering ratebelow the frequency of a confining trap [Cir96, Cas98, Wol00]. It has also been proposed toreduce reabsorption by dimensional reduction of the sample [Cas98]. The solutions to thethree challenges implemented so far are insufficient to reach quantum degeneracy. The high-est phase-space densities ever attained are one order of magnitude too low [Han00, Ido00].Surprisingly, this last order of magnitude has been an insurmountable obstacle for a decade.
Our experiment overcomes all three challenges and creates a BEC of strontium by lasercooling. Our scheme essentially relies on the combination of three techniques, favored by theproperties of this element. Strontium possesses a transition with such a narrow linewidth(Γ/2π = 7.4 kHz) that simple Doppler cooling can reach temperatures down to 350 nK[Ido00]. Using this transition, we prepare a laser cooled sample of 107 84Sr atoms in a large“reservoir” dipole trap. To avoid the detrimental effects of laser cooling photons, we renderatoms transparent for these photons in a small spatial region within the laser cooled cloud.Transparency is induced by a light shift on the optically excited state of the laser coolingtransition. In the region of transparency, we are able to increase the density of the gas, byaccumulating atoms in an additional, small “dimple” dipole trap [SK98b, Web03]. Atoms inthe dimple thermalize with the reservoir of laser cooled atoms by elastic collisions and forma BEC.
The details of our scheme are shown in Fig. 12.1. Based on our previous work [Ste09],we use several stages of laser cooling to prepare a sample of 84Sr atoms in the reservoirtrap; see Sec. 12.2.1 for details. The trap consists of an infrared laser beam (wavelength1065 nm) propagating horizontally (x-direction). The beam profile is strongly elliptic, witha beam waist of 300μm in the horizontal direction (y-direction) and 17μm along the fieldof gravity (z-direction). The depth of the reservoir trap is kept constant at kB × 9μK.After preparation of the sample, a further laser cooling stage is performed on the narrow1S0 −3 P1 intercombination line, using a single laser beam propagating vertically upwards.The detuning of the laser cooling beam from resonance is ∼ −2 Γ and the peak intensity is0.15μW/cm2, which is 0.05 of the transition’s saturation intensity. These parameters resultin a photon scattering rate of ∼ 70 s−1. At this point, the ultracold gas contains 9 × 10⁶
atoms at a temperature of 900 nK.
To render the atoms transparent to cooling light in a central region of the laser cooledcloud, we induce a light shift on the 3P1 state, using a “transparency” laser beam 15GHzblue detuned to the 3P1 −3 S1 transition; see Sec. 12.5 for details. This beam propagates

172 Chapter 12. Laser cooling to quantum degeneracy
x' (mm)
18 18
x' (mm) x' (mm)
0 0 0
6
z
-1.0 -0.5 0.0 0.5 1.0 -1.0 -0.5 0.0 0.5 1.0 -1.0 -0.5 0.0 0.5 1.00
5
10
15
0.0
0.5
1.0
1.5
2.0
2.5ar
ea d
ensi
ty (1
012 m
-2)
area
den
sity
(1012
m-2)
area
den
sity
(1012
m-2)
t = 20ms t = 160ms reservoir removed
linea
r den
sity
(109 m
-1)
0
5
10
15
t = 160ms
(a) (b) (c)
x'y'
Figure 12.2: Creation of a BEC by laser cooling. Shown are time-of-flight absorption imagesand integrated density profiles of the atomic cloud for different times t after the transparencylaser has been switched on, recorded after 24ms of free expansion. (a) and (b) The appear-ance of an elliptic core at t = 160ms indicates the creation of a BEC. (c) Same as in (b),but to increase the visibility of the BEC, atoms in the reservoir trap were removed beforethe image was taken. The fits (blue lines) consist of Gaussian distributions to describe thethermal background and an integrated Thomas-Fermi distribution describing the BEC. Thered lines show the component of the fit corresponding to the thermal background. The x′y′-plane is rotated by 45◦ around the z-axis with respect to the xy-plane and the field of viewof the absorption images is 2mm × 1.4mm.
downwards under a small angle of 15◦ to vertical and has a beam waist of 26μm in theplane of the reservoir trap (xy-plane). The beam has a peak intensity of 0.7 kW/cm2 andupshifts the 3P1 state by more than 10MHz. Related schemes of light-shift engineering wereused to image the density distribution of atoms [Tho95, Bra08], to improve spectroscopy[Kap02], or to enhance loading of dipole traps [Gri06, Cle09]. To demonstrate the effect ofthe transparency laser beam, we take absorption images of the cloud on the laser coolingtransition. Figure 12.1(d) shows a reference image without the transparency beam. Inpresence of this laser beam, atoms in the central part of the cloud are transparent for theprobe beam, as can be seen in Fig. 12.1(e).
To increase the density of the cloud, the dimple trap is added to the system. It consistsof an infrared laser beam (wavelength 1065 nm) propagating upwards under a small angle of22◦ to vertical and crossing the laser cooled cloud in the region of transparency. In the planeof the reservoir trap, the dimple beam has a waist of 22μm. The dimple is ramped to a depthof kB × 2.6μK, where it has trap oscillation frequencies of 250Hz in the horizontal plane.Confinement in the vertical direction is only provided by the reservoir trap and results ina vertical trap oscillation frequency of 600Hz. Figure 12.1(f) shows a demonstration of thedimple trap in absence of the transparency beam. The density in the region of the dimple
12.1. Laser cooling to quantum degeneracy 173
increases substantially. However, with the dimple alone no BEC is formed because of photonreabsorption.
The combination of the transparency laser beam and the dimple trap leads to BEC.Starting from the laser cooled cloud held in the reservoir trap, we switch on the transparencylaser beam and ramp the dimple trap to a depth of kB × 2.6μK. The potentials of the 1S0
and 3P1 states in this situation are shown in Fig. 12.1(c). Atoms accumulate in the dimplewithout being disturbed by photon scattering. Elastic collisions thermalize atoms in thedimple with the laser cooled reservoir. The phase-space density in the dimple increases anda BEC emerges.
We detect the BEC by taking absorption images 24ms after switching off all laser beams;see Fig. 12.2. Figure 12.2(a) shows the momentum distribution 20ms after switching onthe transparency beam, which is well described by a thermal distribution. By contrast,we observe that 140ms later, an additional, central elliptical feature has developed; seeFig. 12.2(b). This is the hallmark of the BEC. Although clearly present, the BEC is notvery well visible in Fig. 12.2(b), because it is shrouded by 8× 10⁶ thermal atoms originatingfrom the reservoir. To show the BEC with higher contrast, we have developed a backgroundreduction technique. We remove the reservoir atoms by an intense flash of light on the1S0 −3 P1 transition applied during 10ms. Atoms in the region of transparency remainunaffected by this flash. Only 5 × 10⁵ thermal atoms in the dimple remain and the BECstands out clearly; see Fig. 12.2(c). We use this background reduction technique only fordemonstration purposes, but not for measuring atom numbers or temperatures.
Quantitative data on our experiment are obtained by two-dimensional fits to time-of-flight absorption images; see Sec. 12.2.5 for details. The atom number of the thermal cloudand of the BEC are extracted from fits to 24-ms expansion images, consisting of Gaussiandistributions describing the thermal background and an integrated Thomas-Fermi distribu-tion describing the BEC. Further absorption images taken after 4ms expansion time areused to determine atom number and temperature of the gas in the reservoir and the dimple,respectively.
We now analyze the dynamics of the system after the transparency laser beam has beenswitched on. As we increase the dimple strength to its final depth in 10ms, 106 atoms accu-mulate in it (Fig. 12.3(a)) and the temperature of the dimple gas increases; see Fig. 12.3(b).During the next ∼ 100ms the dimple gas thermalizes with the reservoir gas by elasticcollisions. The temperature of the reservoir gas is hereby not increased, since the energytransferred to it is dissipated by laser cooling. We carefully check that evaporation is neg-ligible even for the highest temperatures of the gas; see Sec. 12.4 for details. Already after60ms a BEC is detected. Its atom number saturates at 1.1× 10⁵ after 150ms (Fig. 12.3(c)).The atom number in the reservoir decreases slightly, initially because of migration into thedimple and on longer timescales because of light assisted loss processes in the laser cooledcloud (Fig. 12.3(a)).
To demonstrate the power of our laser cooling scheme, we repeatedly destroy the BECand let it reform; see Fig. 12.4. To destroy the BEC, we pulse the dimple trap depth tokB × 15μK for 2ms, which increases the temperature of the dimple gas by a factor two.We follow the evolution of the BEC atom number while the heating pulse is applied every200ms. A new BEC starts forming a few 10ms after each heating pulse for more than 30

174 Chapter 12. Laser cooling to quantum degeneracy
dimple reservoir
BE
C a
tom
num
ber (
103 )
tem
pera
ture
(μK
)at
om n
umbe
r (10
6 )
time (ms)
(a)
(b)
(c)
0.0
0.2
0.4
0.6
0.8
1.0
1.2
x 1/10
0.0
0.5
1.0
1.5
2.0
0
20
40
60
80
100
120
0 50 100 150 200 250
Figure 12.3: Characterization of the BEC formation process after the transparency laser isswitched on. Shown are the evolution of the atom number in the dimple and the reservoir (a),the evolution of temperature in these regions (b) and the BEC atom number (c). During thefirst 10ms of this evolution, the dimple trap is ramped on. After 60ms a BEC is detected.
pulses. We find that the observed decrease in the BEC size from pulse to pulse stems fromthe reduction of the total atom number in the system.
To clarify the role laser cooling plays in our scheme, we perform a variation of theexperiment. Here, we switch off the laser cooling beam before ramping up the dimple andwe do not use the transparency beam. Heat released while ramping up the dimple or after aheating pulse is again distributed from the dimple to the whole system by elastic collisions,but this time not dissipated by laser cooling. Since the reservoir gas has a ten times higheratom number than the dimple gas, the temperature after thermalization is only increasedby a small amount. If the final temperature in the dimple is below the critical temperature,a BEC is formed. This scheme resembles the formation of a BEC by trap deformation,as demonstrated in [SK98b] using a sample of atoms cooled by evaporation. We test theperformance of this BEC creation scheme again by repeated heating pulses. We can detecta BEC after at most five pulses. For more pulses, the temperature of the gas in the dimpleremains too high to allow the formation of a BEC. This poor behavior stands in stark contrastto the resilience of BEC formation to heating, if the system is continuously laser cooled.

12.1. Laser cooling to quantum degeneracy 175
0
20
40
60
80
100
120B
EC
ato
m n
umbe
r (10
3 )
heating pulse
3400320030006000 200 400
#1 #2 #3 #4 #16 #17 #18
time (ms)
Figure 12.4: Repeated destruction and reformation of the BEC. Shown is the evolution ofBEC atom number while the BEC is destroyed every 200ms (arrows) by suddenly increasingthe depth of the dimple trap. If the system is laser cooled, the BEC atom number quicklyincreases again, which is shown here for up to 18 cycles (red). Without laser cooling, a BECis detectable for at most five heating cycles, of which the first three are shown here (blue).
The ability to reach the quantum degenerate regime by laser cooling has many excitingprospects. This method can be applied to any element possessing a laser cooling transitionwith a linewidth in the kHz range and suitable collision properties. Besides strontium thisencompasses several lanthanides [Lu11a, Aik12]. The technique can also cool fermions toquantum degeneracy and it can be extended to sympathetic cooling in mixtures of isotopesor elements. Another tantalizing prospect enabled by variations of our techniques, is therealization of a continuous atom laser, which converts a thermal beam into a laser-like beamof atoms. To realize such a device, our scheme needs to be extended in two ways. First, thereservoir of laser cooled atoms needs to be replenished, for example by sending a thermalbeam of atoms onto a part of the reservoir with sufficiently high cooling laser intensity toallow capture of these atoms. Second, a continuous beam of condensed atoms needs to beoutcoupled. Using magnetic species such as dysprosium or erbium, outcoupling from theBEC is possible by changing the internal state and thereby the magnetic force on the atoms[Mew97, Blo99]. Alternatively, the reservoir can be connected to a outcoupling dipole trap,creating a narrow channel where atoms can escape without further interaction with the cool-ing light [Lah05].
In the following sections, we will present in-depth information about our approach toreach quantum degeneracy by laser cooling. In Sec. 12.2 we give details on the experimentalsequence. In Sec. 12.3 we discuss the parameter dependence of BEC creation and propertiesof the BEC. In Sec. 12.4 we show that evaporative cooling does not play a role in reachingquantum degeneracy. In Sec. 12.5 we analyze the shifting of atomic and molecular transitionsby the transparency beam. In Sec. 12.6 we model the density distributions of the BEC andthe thermal cloud.

176 Chapter 12. Laser cooling to quantum degeneracy
12.2 Experimental sequence
In the following, we discuss in detail the experimental sequence with which we obtain BECby laser cooling. We first describe the preparation of a sample of ultracold 84Sr atoms in thereservoir dipole trap, which follows closely the procedure used in our previous work [Ste09].Then we give details on the additional steps we take to produce a BEC. These details includeinformation on the transparency beam, the dimple dipole trap and the conditions of the finallaser cooling stage. We end with a discussion of our data acquisition and analysis method.
12.2.1 Sample preparation
Isotope choice — Of the three bosonic strontium isotopes, 84Sr is best suited for ourexperiment, since its scattering length of a84 = 124 a0 (with a0 the Bohr radius) allows effi-cient thermalization by elastic collisions. The other bosonic isotopes are unsuitable for ourtask. 88Sr has a negligible scattering length of a88 = −1.4 a0 and therefore does not ther-malize. 86Sr suffers from three-body inelastic loss because of a very large scattering lengtha86 = 800 a0. Unfortunately
84Sr has a low natural abundance of only 0.56%. To obtain alarge sample, we accumulate metastable state atoms in a magnetic trap, as described below.
Atomic beam and blue MOT — A sample of strontium metal with natural isotopiccomposition is heated in an oven under vacuum to about 600 ◦C in order to sublimate stron-tium atoms. The atoms form an atomic beam after escaping the oven through a bundle ofmicrotubes. 84Sr atoms in the atomic beam are transversally cooled, Zeeman-slowed, andcaptured in a “blue” magneto-optical trap (MOT) with laser light red-detuned to the 84Sr1S0 − 1P1 transition at 461 nm; see Fig. 12.5. This transition has a linewidth of Γblue/2π =30.5MHz, corresponding to a Doppler temperature of TD,blue = �Γblue/(2kB) = 720μK. TheMOT uses a quadrupole magnetic field with vertically oriented axis and a vertical field gra-dient of 55G/cm. The MOT beams have waists of 5mm and peak intensities of 10mW/cm2,which is a quarter of the saturation intensity Isat,blue = πhcΓblue/3λ
3blue = 40.7mW/cm2. The
detuning of the MOT light to resonance is −30MHz.
Metastable state reservoir — The blue MOT cycle is not completely closed, as atomsin the excited 1P1 state can decay into the metastable and magnetic
3P2 state with a branch-ing ratio of 1:150 000. Atoms in this state can be trapped in the quadrupole magnetic fieldof the MOT. Since the lifetime of magnetically trapped 3P2-state atoms of ∼ 30 s is aboutthree orders of magnitude longer than the leak time scale of the blue MOT, metastable stateatoms accumulate in the magnetic trap. We operate the MOT until about 108 atoms areaccumulated in this “metastable state reservoir”, which takes ∼ 10 s. This accumulation ofatoms allows us to use the 84Sr isotope, despite its low natural abundance.
Red MOT — To increase the phase-space density of the sample, we use a narrow-line“red” MOT operated on the 1S0 − 3P1 intercombination line, which has a wavelength ofλred = 689 nm and a linewidth of Γred/2π = 7.4 kHz. Our red MOT laser has a linewidth ofabout 2 kHz and an absolute stability better than 500Hz. The horizontal (upward, down-

12.2. Experimental sequence 177
1S0
1D2
1P1
3DJ
3PJ
012
123
3S1
J
J
singlet states triplet states
15 GHz
red MOT689 nm7.4 kHz
blue MOT461 nm30.5 MHz
repump497 nm2.3 MHztransparency
688 nm4.4 MHz
Figure 12.5: Level scheme of strontium with all relevant states and transitions. The dottedarrows show the decay path of atoms from the 1P1 state into the
3P2 state.
ward propagating) red MOT beams have waists of 3.1mm (2.9mm, 3.1mm). The Dopplertemperature of the red MOT TD,red = 180 nK is comparable to the recoil temperatureTr = �
2k2/(kBm) = 460 nK, where k = 2π/λred is the wave vector of the cooling light,and m is the atom’s mass. The temperature can approach Tr/2 when reducing the coolinglight intensity to the saturation intensity Isat,red = 3μW/cm2 [Lof04b]. Not only the tem-perature but also the atom number decreases, when decreasing the cooling light intensity,and a compromise between atom number and temperature has to be chosen [Sor06]. Wetypically reach temperatures of 800 nK with samples of about 107 atoms.
To load the red MOT, metastable state atoms are transferred into the 1S0 ground stateby optical pumping via the 5s5d 3D2 state. The temperature of the sample recovered fromthe metastable state reservoir is on the order of the Doppler temperature of the blue MOTTD,blue = 720μK, which is three orders of magnitude higher than the final temperaturereached with the red MOT. We initially use red MOT parameters that allow to capturesuch a high temperature sample and then ramp these parameters to conditions in which ahigh phase space density is reached. The intensity and frequency of the MOT light duringthe capture phase and the subsequent ramps are given in Figs. 12.6(a) and (b). During thecapture phase, the red MOT laser beams are frequency-modulated to increase the capturevelocity of the MOT. In addition, the quadrupole magnetic field gradient is suddenly loweredto 1.15(5)G/cm in the vertical direction, which increases the capture volume, and thenmaintained at this value for the remainder of the experimental sequence. The detuning ofthe MOT light is reduced to compress the atomic cloud, and the intensity is reduced to lowerthe temperature. This provides optimal conditions for loading the reservoir dipole trap.

178 Chapter 12. Laser cooling to quantum degeneracy
time (ms)time (ms)
time (ms)
-250 -150-200 -100 -50 0-250 -150-200 -100 -50 0
-500 -300-400 -200 -100 0-600time (ms)
inte
nsity
(103
I sat)
0
1
2
3
4
5
6
7
horizontalupwarddownward
atom
num
ber (
106 )
0
4
2
6
10
8
12
16
14
18
tem
pera
ture
(nK)
0
200
400
800
600
1000
1400
1200
1600
detu
ning
(MH
z)
-500 -300-400 -200 -100 0-600
-8
-6
-7
-5
-4
-3
-1
-2
0
inte
nsity
(I sa
t)
02468
10
MOT IIMOT I MOT III MOT IV MOT V
(a) (b)
(c) (d)
time (ms)-150 -100 -50 0
time (ms)-50 0-100-150
detu
ning
(kH
z)
-100
-80
-60
-40
-20
0
Figure 12.6: Narrow-line MOT and dipole trap loading. The narrow-line cooling consists offive consecutive stages, labeled MOT I through V: a 50-ms capture MOT, during which therepumping of atoms from the 3P2 to the
1S0 state takes place, a compression MOT of 100ms,two cooling MOT stages of 100ms and 250ms, and a 100-ms hold time at final parameters.The end of the MOT phase is chosen as the origin of the time axis. (a) Intensity of theMOT beams in units of the saturation intensity Isat = 3μW/cm2. The intensity of thehorizontal, upward, and downward MOT beams can be set independently. The downwardMOT beam has little effect and is turned off before the other ones (see inset). (b) Frequencyof the MOT beams, given as detuning from the Zeeman-shifted σ+ transition. The light isfrequency-modulated in the first two MOT stages. For clarity, only every tenth line of theresulting frequency comb is shown here. (c) and (d): Atom number (c) and temperature(d) drop significantly during the end of MOT stage IV. The drop in atom number happensas the restoring force of the MOT becomes too weak to support atoms against gravity, andall atoms outside the dipole trap are lost. The last 100ms of hold time do not reduce thetemperature further, but this stage is crucial to increase the density of atoms in the dipoletrap.

12.2. Experimental sequence 179
Reservoir dipole trap — The reservoir dipole trap is a large-volume dipole trap con-sisting of a horizontally propagating beam. This beam is derived from a 5-W fiber laseroperating at a wavelength of 1065 nm with a linewidth of 0.5 nm (IPG ytterbium fiber laser,model YLD-5-1064-LP). The beam contains up to 2W of power and is linearly polarized inthe vertical direction. Cylindrical lenses are used to create a horizontally elongated beamprofile. The beam has a vertical (horizontal) waist of 17.3(2)μm (298(3)μm), yielding anaspect ratio of about 1:17. The trap frequencies are 600(6)Hz (35.3(4)Hz, 5.78(6)Hz) inthe vertical (transverse horizontal, axial horizontal) direction at a power of 1760(35)mW asused in the experiment. Including gravitational sagging, the potential depth in the verticaldirection is ∼ kB × 9μK. The errors given here are dominated by the uncertainty in themeasurement of the laser beam powers, which we assume to be 2%. The uncertainty in thetrap oscillation frequencies is much smaller, and other effects, such as transmission losses ofthe glass cell and gravitational sagging in the dipole trap, are accounted for.
We increase the axial frequency slightly by a second, near-vertical beam with 297(3)μmwaist and circular polarization, using a second fiber laser of the same model as mentionedabove as source. At the power of 740(15)mW used in the experiment it has a trap depthof only kB × 0.29(1)μK and increases the trap frequency in the x-direction to 8.14(8)Hz.This increased axial trap frequency slightly increases the density of the sample and reducesthe timescale of BEC formation. It has no further effects, and otherwise identical results areobtained without this additional beam.
Loading of the reservoir dipole trap — When the intensity of the MOT beams islow, gravity plays an important role in the MOT dynamics. The atoms are pulled towards thelower part of an ellipsoid of equal magnetic field magnitude located around the quadrupolemagnetic field center. On this ellipsoid, the atoms are in resonance with the cooling lightand levitated by it, giving the MOT a pancake shape, roughly matched to the shape of thereservoir dipole trap. The dipole trap is located 600(100)μm below the center of quadrupolefield, where the B-field has a magnitude of 70(10)mG and is oriented nearly vertically.To overlap the MOT with the dipole trap, we carefully adjust the MOT laser detuning.Figures 12.6(c) and (d) show temperature and atom number evolution of the atomic cloud,while it is loaded into the reservoir dipole trap. At the endpoint of the ramp, the intensitiesof the horizontal (upward, downward propagating) MOT beams are 0.6 Isat (0.5 Isat, 0 Isat).The detuning from the σ+-cooling transition is about −20 kHz. With the given nonzeroB-field at the position of the atoms, this corresponds to a detuning of about −150 kHz fromthe unperturbed π-transition.
Laser cooling of the atoms in the dipole trap is influenced by Zeeman and light shifts. Thevertical gradient of 1.15G/cm translates to a negligible shift of 600μG across the sample,assuming an estimated vertical size of 5μm. The horizontal gradient is 0.63G/cm, and thehorizontal radius of the cloud is rather large: about 200μm, giving a shift of 12mG betweenthe center and the outsides, which corresponds to a significant frequency shift of 25 kHz. Thedipole trap induces a non-negligible differential AC Stark shift on the 1S0 and
3P1 states. Wecan reduce this shift by choosing the optimized polarizations for the horizontal and verticaldipole trap beams mentioned above, such that the magnitude of the shift is about 10 kHz[Boy07a]. Assuming that the atoms explore one tenth of the trap depth, we obtain a shift

180 Chapter 12. Laser cooling to quantum degeneracy
beam waist x waist y waist z P U/kB fx fy fz
(μm) (μm) (μm) (mW) (μK) (Hz) (Hz) (Hz)horizontal 298(3) 17.3(2) 1760(35) 9.2(2) 5.78(6) 35.3(4) 600(6)vertical 297(3) 297(3) 740(15) 0.29(1) 5.73(6) 5.73(6) ∼ 0dimple 22.4(2) 22.4(2) 38.3(8) 2.6(1) 228(2) 228(2) ∼ 0
Table 12.1: Parameters of the dipole trap beams used for the experiments described in thereport. Gravitational sagging is taken into account in the calculation of the horizontal dipoletrap depth.
across the sample of about 1 kHz, which is negligible.
About 9×10⁶ atoms are captured in the reservoir dipole trap at a temperature of 830 nK.The achievable temperature is density dependent. A reduction of the atom number by afactor two leads to a temperature reduction of ∼ 100 nK. Over the course of one hour,the variation of atom number between experimental cycles is about 1% and the temperaturevariation is below 10 nK. After loading of the dipole trap, the intensity of the upward coolingbeam is reduced by a factor of 10, and the horizontal beams are turned off. Such a sampleis the starting point for the subsequent laser cooling into quantum degeneracy.
12.2.2 Transparency beam
Immediately after completion of the dipole trap loading, the transparency beam is turnedon. This beam is derived from a free-running master diode laser with a frequency stability oforder 100MHz/day. The frequency is blue detuned by 15GHz from the 3P1− 3S1 transition,and constantly monitored by a wavemeter. The beam is circularly polarized and focusedonto the center of the atomic cloud with a waist of 26.2(3)μm, again calculated from trapfrequency measurements. The power used is 7.5(2)mW, translating to a peak intensity of7 × 105mW/cm2 = 7MW/m2. The beam propagates downwards, at an angle of 15◦ tovertical due to geometrical restrictions.
The transparency beam has a strong influence on the 3P1 state. The differential ACStark shift of the 1S0 − 3P1 cooling transition is on the order of +10MHz, such that thecooling light is red-detuned by > 1000 Γred for atoms at the center of the transparency beam.In this way, atoms illuminated by the transparency beam are transparent to laser coolingphotons. Note that this scheme is drastically different to a scenario in which the coolingbeam would contain a small dark spot imaged onto the dimple region: in this case, atomsin the dimple region could still absorb cooling light scattered by atoms in the reservoir. Ourmethod differs also from the dark spot MOT technique, since we do not change the internalstate of the atom in the region of transparency. A careful analysis of the magnitude of theAC Stark shift of the 3P1 state is given in Sec. 12.5.
The transparency beam also creates an attractive trapping potential for the 1S0 statewith a depth of kB × 0.5μK. Because of similar beam orientation and waists, the potentialcreated by the transparency beam resembles the potential created by the dimple beam, buthas only about 20% of its depth.

12.2. Experimental sequence 181
12.2.3 Cooling light
The cooling light consists of an upward propagating, circularly polarized beam, red detunedby about 15 kHz from the σ+ 1S0 −3 P1 transition. It has a power of 20 nW and a peakintensity of 0.15μW/cm2, corresponding to 0.05 Isat. The light has the same source as thelight used for the narrow-line MOT. Any desired cooling rate of up to many 100 nK/ms canbe achieved by a suitable combination of detuning and intensity, where a larger detuningcan be compensated by an increased intensity. We find a fixed relation between cooling rateand induced decay rate, which is independent on the combination of detuning and intensity.There is a low temperature limit of about 450 nK, below which cooling is accompanied byrapidly increasing loss rates. For the experiments described in the report, we use only oneupward propagating cooling beam, and we find that the addition of further cooling beamsfrom other directions does not improve the performance.
12.2.4 Dimple
The local increase in density is facilitated by the dimple beam. This beam is aligned al-most vertically, with an angle of 22◦ (37◦) towards vertical (the transparency beam) dueto geometrical restrictions. It is derived from the same laser source as the vertical dipoletrap, has circular polarization and a waist of 22.4(2)μm. The dimple beam is centered inthe plane of the reservoir trap with the transparency beam to within 5μm. At a power of38.3(8)mW, the dimple provides horizontal trap frequencies of 228(2)Hz and has negligibletrap frequencies in the vertical direction. In presence of the dimple, we refer only to theregion outside of the dimple as the reservoir.
The dimple trap is set to a small depth of kB × 0.15μK at the beginning of the exper-imental sequence and ramped in 10ms to a depth of kB × 2.6μK after the transparencybeam is switched on. The ramp speed is not adiabatic with respect to the horizontal trapfrequencies of the reservoir trap and atoms from the reservoir continue to accumulate in thedimple for 10ms after the ramp. At this point, the temperature of the gas in the dimple istwice the temperature of the reservoir gas. Thermal contact with the laser cooled reservoirlowers the temperature on a timescale of ∼ 100ms. In thermal equilibrium, the dimple leadsto a peak density increase of a factor of 30 compared to the reservoir. This density increaseis the origin of the gain in phase-space density.
The BEC phase transition is observed 50ms after ramping the dimple to high power.The BEC grows to slightly more than 105 atoms after another 100ms. The local harmonicpotential confining the BEC is dominated horizontally by the dimple trap and vertically bythe horizontal dipole trap, leading to trap frequencies of 228(2)Hz in the horizontal plane and600(6)Hz in the vertical direction. The BEC is pancake-shaped with a horizontal (vertical)Thomas-Fermi radius of 5μm (2μm).
12.2.5 Absorption imaging and data analysis
We use time-of-flight absorption images to deduce all relevant information from our atomicsamples. We are interested in the following quantities: atom number in the dimple and in

182 Chapter 12. Laser cooling to quantum degeneracy
18
x' (mm)
0
-1.0 -0.5 0.0 0.5 1.00
5
10
15
area
den
sity
(1012
m-2)
tex = 24ms
300
x' (mm)
0
-1.0 -0.5 0.0 0.5 1.00
10
20
30
area
den
sity
(1012
m-2)
5
15
25
tex = 4ms0.5 mm
linea
r den
sity
(109 m
-1)
x'
z
y'
(a) (b)
Figure 12.7: Typical absorption images used to determine temperatures and atom numbers.(a) Absorption image after a short expansion time tex = 4ms. A two-dimensional doubleGaussian fit is used to extract atom number and temperature individually for dimple andreservoir. (b) Absorption image after a long expansion time tex = 24ms. A tri-modal two-dimensional fit, consisting of two Gaussians and an integrated Thomas-Fermi distributionare used to extract the atom number of the thermal component and the BEC. The panelsbelow the absorption images show the density distribution (black) and the fits integratedalong the z-direction (blue). The red curves show the Gaussian component of the fits.
the reservoir, temperature of the dimple and of the reservoir, and number of atoms in thecondensate.
The temperature and atom number of the dimple and reservoir regions are measured inabsorption images taken after 4ms of free expansion; see Fig. 12.7(a). After this short time,the clouds from the two regions can still be clearly distinguished in the horizontal direction(x′-direction), but have expanded well beyond their initial size in the vertical direction (z-direction) to allow thermometry. Since the atomic clouds are very dense and nearly opaqueto resonant imaging light, we image at a detuning of 48MHz ≈ 1.5 Γ, which reduces theabsorption cross section by a factor of about twelve. We employ a 2D bi-Gaussian fit to thedata. The temperature is derived from the vertical expansion only.
The overall atom number and the BEC atom number are determined from absorptionimages taken after a free expansion time of 24ms; see Fig. 12.7(b). We fit the data with a 2Ddistribution consisting of two Gaussians for thermal atoms and an integrated Thomas-Fermidistributions for the BEC. Two Gaussians are used to take into account the two differentsources of thermal atoms, the reservoir and the dimple. If only one Gaussian is employed todescribe all thermal atoms, the BEC atom number deduced from the Thomas-Fermi part ofthe fit increases by about 50%.
All measurements are performed three times, and the average values and statistical errorbars of atom number and temperature are given in Figs. 3 and 4 of Sec. 12.1.
12.3. Characterization of laser-cooled BECs 183
12.3 Characterization of laser-cooled BECs
The BEC formation depends on various parameters. In this section, we will explore theinfluence of these parameters on the system and show that our method of laser cooling toquantum degeneracy works in a very broad range of parameters.
12.3.1 BEC atom number
Total atom number and temperature — The lowest achievable temperature de-pends on the total atom number in the system as a consequence of red-MOT dynamics. Wemeasure the BEC atom number NBEC in dependence of the total atom number N , at theselowest achievable temperatures. We find that NBEC ∝ N . This behavior can be explainedby the model described in Sec. 12.6.
Trap depth — We independently vary the trap depth of horizontal beam and dimplearound the values presented in the report. A variation in trap depth of the horizontal beamby a factor of 1.7 changes the BEC atom number by at most 15%, and a variation of dimplepower by a factor of 2.5 changes the atom number by at most 30%. A broad, global maximumof the BEC atom number exists, which is where we perform our experiments.
An important constraint on the trap depth is the desire to avoid evaporation. This con-straint is fulfilled by the conditions chosen; see Sec. 12.4 for details.
Dimple — We find that the BEC atom number depends only weakly on the dimple size.We vary the waist of the dimple beam between 20 and 50μm, but find no appreciable changein BEC atom number. The BEC formation time, however, is increased for larger waists. Wealso vary the ramp-up time of the dimple between 0 and 100ms, but find no influence ontemperature or BEC atom number after a 250-ms equilibration time.
12.3.2 Transparency beam
The transparency beam is the key novelty of our work. A detailed study of the non-trivialshifting of the laser cooling transition can be found in Sec. 12.5.
Frequency — The transparency beam is employed to locally shift the energy of the 3P1
state by about +10MHz. This would in principle be possible with light blue-detuned to anytransition originating from the 3P1 state. We chose to work in the vicinity of the 3P1 − 3S1
transition at 688 nm for two reasons: The availability of diode lasers, and the negligibleinfluence on the 1S0 state.
In our experiment, the transparency beam is blue-detuned by about 15GHz from the3P1− 3S1 transition. In a series of measurements, we set the detuning to different values andvary the intensity of the transparency beam while searching for the appearance of a BEC.We never observe BEC formation for frequencies around or red-detuned to the 3P1 − 3S1
transition. We observe BEC formation only in a frequency range between 6 and 30GHz bluedetuning, where the upper bound of 30GHz is probably limited by the available laser powerof 10mW.

184 Chapter 12. Laser cooling to quantum degeneracy
Intensity —We observe the formation of a BEC only above a certain critical intensity Ic
of the transparency beam, which depends on its frequency. The BEC atom number quicklygrows for larger intensities, and saturates at about 2 Ic. The experiment is performed ataround 10 Ic, corresponding to a peak intensity of 0.7 kW/cm2.
Spectral filtering — The 3P1 − 3S1 transition is 1.428 nm (or 902GHz or 30 cm−1)away from the 1S0 − 3P1 intercombination transition, and off-resonant excitation of the in-tercombination transition is negligible. The light originating from the laser diode, however,contains incoherent fluorescence light, also known as residual amplified spontaneous emission(ASE). This light covers a broad spectrum with a width of about 20THz, which includes the1S0− 3P1 transition. A spectrometer is used to estimate the spectral power of the incoherentbackground PASE to be on the order of 10−12P0 in a 1 kHz wide band 1THz away from thelaser line, where P0 is the power in the laser line. The scattering of these incoherent photonslimits the lifetime of a BEC to 800ms when illuminated by unfiltered transparency light.Spectral filtering of the light allows us to reduce the amount of resonant light by a factor of500, leading to an increased lifetime of 10 s. The lifetime measurement is performed with apure BEC obtained by standard evaporation, and its lifetime is limited to 10 s by inelasticcollisions.
Waist — The transparency beam needs to be well-aligned with the dimple beam, andit needs to cover the BEC entirely. We vary the waist of the transparency beam between10 and 55μm. For comparison, the dimple waist is 22μm and the Thomas-Fermi radiusof the BEC in the xy-plane is 5μm. Given an appropriate adjustment of the intensity, wecan create laser-cooled BECs within the entire range of transparency beam waists exam-ined. The purification method, during which reservoir atoms are selectively removed (seeFig. 12.2(c)), becomes increasingly inefficient for larger beam sizes, as also parts of the reser-voir are shielded. A larger beam size makes the system insensitive to misalignments of thebeams, which we verify experimentally.
Local density increase — One might speculate that the transparency beam leads to anincrease in atom density purely by elimination of photon emission and re-absorption cycles,which act as an effective repulsion. This is not the case. We do observe a small densityincrease induced by the transparency beam, but it can be explained entirely by its trappingpotential for atoms in the 1S0 state.
12.3.3 Timescales
Collision rate and thermalization — The peak scattering rate of thermal atoms inthe dimple region is 3100 s−1, found at the edge of the BEC (see Sec.12.6). The scatteringrate decreases with distance from the center of the dimple, down to 50 s−1 outside of thedimple region. We observe that thermalization happens on a timescale of about 100ms(compare Fig. 12.3(b)), which corresponds to about five collisions. This number matcheswell with the expectation of about three collisions required for thermalization [Mon93].
12.3. Characterization of laser-cooled BECs 185
BEC formation time — We study the time required for the BEC to form after thedimple has been ramped up. For a BEC to be created, the atom number in the dimple has tobe high enough and the temperature below a critical temperature for the given atom number.We find that the timescale required to accumulate atoms in the dimple is much shorter thanthe timescale required to thermalize the dimple gas with the reservoir; see Fig. 12.3. Thus,the BEC formation time is limited by the thermalization time scale. This time scale is linkedto the elastic collision rate, which depends on the density of the sample. To test this relation,we vary the density by two means, changing the reservoir atom number and changing thereservoir trap frequency. We observe an increase in formation time as we decrease the atomnumber, down to a minimum atom number of about 1 × 10⁶ atoms, below which no BECforms in our trap geometry. Using the trap parameters of the experiment described in thereport, the fastest formation time is about 50ms for the maximum achievable atom numberof 10×106 . An increase of the axial frequency from 8Hz to 40Hz reduces the formation timeto about 20ms. The timescale of BEC formation (following abrupt changes of the thermaldistribution) was studied in previous experiments [Koh02, Rit07] and found to depend onthe scattering rate, in agreement with our measurements.
Reservoir lifetime — A sample of 9× 10⁶ atoms at 800 nK confined in the horizontaldipole trap has a lifetime of ∼ 30 s. When adding the dimple beam to obtain settings iden-tical to the ones used in the experiment described in the report, the lifetime is reduced to3.4(1) s. We believe that this lifetime is mainly limited by 3-body collisions in the dimpleregion, as the reservoir constantly replenishes the dimple population. The cooling light in-duces an additional decay, which is strongly dependent on intensity and detuning. For thevalues used in the experiment, the lifetime of the reservoir is reduced to about 2.5 s.
BEC lifetime — We observe that the lifetime of our BEC is linked to the lifetime of thereservoir gas. The reason is that any atom loss from the BEC is quickly and continuouslyreplaced by atoms from the reservoir. A BEC exists as long as the total atom number inthe system is above ∼ 106 atoms. In order to measure the bare lifetime of the BEC withoutconstant replenishment, we create a BEC, remove the atoms in the reservoir, and turn offthe cooling light and the transparency light. The lifetime of this BEC is 1.0(1) s, probablylimited by heating and loss resulting from inelastic 3-body collisions. The same result isobtained for an identical BEC created by conventional evaporation and re-compressed intothe dimple. By contrast, the lifetime of a BEC in presence of the reservoir, the transparencylight and the cooling light corresponds to the reservoir lifetime of 2.5 s.
Performance of the transparency beam — The transparency beam is absolutelynecessary to protect the BEC from destruction by the cooling light. With the transparencybeam turned off and the BEC subjected to cooling light, we measure a decay rate of about1ms, and the BEC is completely destroyed in less than 3ms.
To demonstrate the ability of the transparency light to protect the BEC from resonantphotons, we measure the lifetime of a BEC after removal of the reservoir and in presenceor absence of both, the transparency and the laser cooling light. The lifetime is the samein both cases, 1 s. We conclude that the BEC lifetime is not limited by scattering of laser

186 Chapter 12. Laser cooling to quantum degeneracy
cooling photons if the transparency light is present. We give an upper bound of 1 s−1 for thescattering rate of laser cooling photons, which is consistent with measurements presented inSec. 12.5.
The transparency beam itself has no negative effect on the BEC: lifetime measurementslet us deduce an absorption rate of photons from this light field to be well below 0.1 s−1.
Vacuum lifetime — Limitations to the lifetime of ultracold atoms in a dipole trap(beyond 3-body losses and residual evaporation) are off-resonant scattering of dipole trapphotons, background gas collisions, and resonant stray light. We measure the lifetime ofatoms at low density in a deep dipole trap to be 120 s, much longer than any other timescale.Note that all of the lifetimes evaluated here are between one and three orders of magnitudelarger than the BEC formation time.
12.4 Absence of evaporation
The novelty of our work lies in the fact that BEC is achieved purely by laser cooling andthermalization between atoms, and not by evaporation and associated loss to the outsideenvironment. Standard evaporative cooling of 84Sr has been used in past experiments andcan be very efficient: for a factor of 10 loss in atom number, more than three orders of mag-nitude in phase space density can be gained [Ste09]. Thus, already little evaporative atomloss can increase the phase space density considerably. It would require an infinitely deeptrap to rigorously exclude evaporation. Here, we quantify the flux of evaporated atoms andensure that evaporation is reduced to a negligible level.
We observe an overall atom loss that leads to a lifetime of the sample of about 3 s. Thisloss is not a measure of evaporation, as it includes various other loss processes as well: 3-bodyrecombination, loss by scattering of cooling photons, light-assisted collisions, and off-resonantoptical pumping into the 3P0,2 states by the transparency light. We therefore need a specificprobe for evaporated atoms.
It is also important to understand that the temperature of atoms in the reservoir is setentirely by the cooling light. This is true even if efficient evaporation would be taking place inthe reservoir: in this case, the cooling light would heat the sample. In the following, we willbe concerned only about evaporation in the dimple region, where the sample is transparentto cooling light.
The atoms are supported against gravity by the horizontal trap, and further confinedby the dimple beam, which does not support the atoms against gravity. Atoms from thehorizontal beam will preferentially evaporate downwards, aided by gravity. If they do sowithin the dimple region, they are attracted by and guided in the dimple beam. This beamprovides superb confinement of evaporated atoms and enables us to detect even minute atomnumbers in absorption imaging. The dimple beam has a potential depth of kB × 2.6μKand therefore selectively guides only low-energy atoms from evaporation, but not atomsoriginating from inelastic collisions.
The amount of atoms leaking from the dimple region into the dimple beam will dependon the sample temperature, the power of the horizontal beam, and the power of the dimple

12.4. Absence of evaporation 187
horizontal power (mW)
dim
ple
pow
er (m
W)
22002000180016001400
30
35
40
45
50
55
60
detection th
reshold
Figure 12.8: Detection of residual evaporation. Hot atoms from the dimple region mightleave the dipole trap along gravity. When doing so, they are funneled into the dimple beamand can be detected by absorption imaging (insets). The amount of evaporation depends onthe power in the horizontal and dimple trap beams, illustrated by the three insets showingatom fluxes of 350, 120, and < 50 atoms/ms. Our detection limit is about 50 atoms/ms, andconditions with atom fluxes that touch this limit are indicated by the black data points. Thestraight line is a linear fit to the data. Experiments are performed in the region below thisline, indicated by the star. The images are averages of 10 experimental realizations, and thecolor scale is adjusted to maximize contrast of small signals.
beam. We set the temperature to the one used in the experiment, vary the power of thehorizontal and the dimple beam independently, and measure the atom leakage. The resultof such a measurement is shown in Fig. 12.8. The data points denote combinations ofparameters where the atom flux is about 50 atoms/ms, which is our detection threshold.The straight line is a linear fit to the data. Note that for a leakage of 50 atoms/ms anda BEC formation time below 60ms, less than 3000 out of 9 × 10⁶ atoms evaporate in thedimple region. For the experiments described in the report, we verify that no discernableevaporation takes place at any time during the optical cooling.
We explore the entire parameter region shown in Fig. 12.8 and find no dramatic differ-ence in BEC formation time or final BEC atom number, again indicating that any residualevaporation has no measurable contribution to the BEC formation.

188 Chapter 12. Laser cooling to quantum degeneracy
detuning (kHz)
atom
num
ber (
105 )
-600 -400
1
2000-200
2
3
4
5
0
PA�
�
�
Figure 12.9: Loss spectrum of atoms confined in a dipole trap and illuminated by σ+-polarized cooling light. A small guiding field of 90mG splits the 3P1 state into three clearlyvisible mJ states. The broad feature around −400 kHz is due to photoassociation (PA). Thevisibility of π and σ− transitions indicates that the cooling light is not perfectly circularlypolarized. In the experiment described in the report, cooling is performed on the red sideof the σ+ transition, indicated by the arrow. The line is a guide to the eye. Note that thedetuning here is calculated from the resonance position at zero B-field, which is determinedto better than 10 kHz.
12.5 Shifting atomic and molecular transitions
12.5.1 Introduction
We intend to cool atoms in the dipole trap with light resonant to the 1S0 − 3P1 transition,but only in the region outside the dimple. To do so, we render the atoms in the dimpleregion transparent for the cooling light by locally shifting the 3P1 state out of resonance.Cooling of atoms in the reservoir is performed on the red side of the 1S0 − 3P1 transition, sowe need to locally shift the 3P1 state towards higher energies by at least a few 10 linewidths.This is done with the transparency beam, which spatially overlaps with the dimple region.
To characterize the system, we work in similar conditions as used in the experimentdescribed in Sec. 12.1. Atoms are tightly confined in a crossed-beam dipole trap, consistingof the horizontal trap and the dimple, and we evaporate into a pure BEC to reach bothhigh densities (to enhance possible photoassociative loss) and low trap depths (such thatatoms can leave the trap with very few photon recoils). We then illuminate the atoms withcircularly polarized cooling light, using only an upward propagating beam. The intensityof the cooling light is 1.2 Isat and the duration of illumination is 10ms. A magnetic field of90mG magnitude and vertical orientation is present. A typical loss spectrum is shown inFig. 12.9; note the broad photoassociation (PA) feature, which corresponds to the ν = −1state of the 1(0+
u ) potential [Ste12].

12.5. Shifting atomic and molecular transitions 189
0 1 2 3 4intensity (MW/m²)
detu
ning
(kH
z)
intensity (MW/m²)
detu
ning
(kH
z)
0 1 2 3 4
0
-100
-200
-300
-400
�
PA
�
-500
-500
0
1000
1500
2000
2500
3000
3500
4000
Figure 12.10: Resonance positions in dependence of transparency light intensity. Spectra asthe one shown in Fig. 12.9 are taken for various intensities of the transparency beam, andthe resonance positions recorded. The σ− transition is too weak to be tracked. Inset: amagnification of the region around the cooling frequency, denoted by the dotted line. Anintensity of 0.6MW/m2 (arrow) is used to take the data presented in Fig. 12.11.
12.5.2 Shifting of resonances
In a next step, we illuminate the atoms with transparency light tuned 15GHz blue to the3P1 − 3S1 transition. The light is linearly polarized, propagating at an angle of 15◦ tovertical. The waist is set to 35μm to ensure a uniform light intensity across the sample. Wetake loss spectra as the one shown in Fig. 12.9 for various intensities and observe that thefour loss features experience different Stark shifts and move differently with intensity; seeFig. 12.10. The π-transition moves rapidly towards blue detuning, whereas the σ+ and PAlines approach asymptotic values less than 100 kHz from resonance.
For our cooling strategy, we intend to work at a detuning of about −150 kHz from theresonance frequency at zero B-field. It seems possible to move the σ+ transition a few 100 kHzaway from this frequency. Unfortunately, the broad PA transition moves into exactly thisregion, potentially causing undesired losses given the high density in the dimple region. Thetransitions broaden considerably with increased transparency beam intensity.
12.5.3 Polarization dependence
So far, we have not considered the polarization of the transparency beam, which was linear inthe previous measurement. This beam is almost co-aligned with the magnetic quantization

190 Chapter 12. Laser cooling to quantum degeneracy
axis, such that its field can be decomposed into equal amounts of σ+ and σ−-light (butno π-light) in the reference frame of the atoms. The three mJ -states of the
3P1 manifold,as well as the PA line tied to the mJ = +1 state, couple differently to the 3S1 states; seeFig. 12.11(a). This helps to understand the different shifts of the π- and σ+-transitions inFig. 12.10, and we expect the shifting of the individual states to strongly depend on thepolarization of the transparency light.
In a next step, we fix the intensity of the transparency light intensity to 0.6MW/m2
and take scans at various polarizations. The results are shown in Figs. 12.11(b) and (c).The loss features change dramatically in position, width, and amplitude depending on thepolarization of the transparency beam. The σ+-transition and its associated PA line aremaximally shifted by a σ−-polarized transparency beam. This can easily be understood fromthe fact that σ+-polarized light cannot couple the mJ = +1 state to the 3S1 manifold. Wefind that already small variations in the polarization decrease the performance considerably.Note that in the experiment described in the report, we use an intensity of the transparencylight that is larger by a factor of about ten.
We will now focus on the region of interest around the cooling frequency and highlight theimportance of the polarization of the transparency light under conditions close to the onesused in the experiment described in the report. We increase the intensity of the transparencybeam to 7MW/m2 and make the cooling pulse 25-times stronger (five times longer and fivetimes more intense) to amplify even small losses. Two spectra for σ− and near-linear polar-ization are shown in Fig. 12.11(d). Not only does the loss feature move to positive detuningwith increasing circular polarization, also its width and amplitude decrease dramatically.The small remaining loss feature is about 250 kHz = 35Γ away from the desired coolingfrequency. We speculate that this is the mJ = −1 state, which is unaffected by transparencylight of σ−-polarization and driven by small σ−-polarization components in the cooling light.
12.5.4 Conclusion
We have shown that the magnetic substates of the 3P1 state, as well as the highest molecularlevel of the 1(0+
u ) potential, can be shifted by a light field slightly detuned from the 3P1− 3S1
transition. In particular, we find that the three Zeeman lines and the first PA line movevery differently in dependence of the polarization of the transparency laser. We find that alllines can be moved at least 250 kHz away from the desired cooling transition, reducing thephoton scattering rate by at least three orders of magnitude. The strongest lines are evenmoved by a few MHz. This transparency beam allows us to cool atoms in the reservoir, whilekeeping the photon scattering rate of atoms in the dimple below the rate of 3-body collisions,which eventually determine the lifetime of the BEC. Further investigations are needed togain a quantitative understanding of the AC Stark shifts in dependence on transparencylaser frequency, intensity, and polarization.

12.5. Shifting atomic and molecular transitions 191
detuning cooling light (kHz)
pola
rizat
ion
trans
pare
ncy
lase
r
0-1000 1000 2000�
�
lin
1.0
0.9
0.8
0.7
0.6
0.5
0.4
0.3
0.2
rem
aini
ng fr
actio
n
0.4
0.6
0.8
1.0
1S0
3P1
3S1
PA
��
�
mJ -1 +10
PA
�
�
pol linear pol�
rem
aini
ng fr
actio
n
detuning cooling light (kHz)-300 -200 0-100 100 200 300
0.0
0.2
0.4
0.6
0.8
1.0
15 GHz
(a) (b)
(c)
(d)
Figure 12.11: Resonance positions in dependence of the polarization of the transparencylight. (a) The three mJ states of the
3P1 manifold couple differently to light on the3P1− 3S1
transition (green arrows). The mJ = +1 state, for example, does not couple at all to σ+-polarized light due to the absence of any mJ = +2 state in the 3S1 manifold. The coolinglight (red arrow) is always σ+-polarized, with small admixtures of other components due toexperimental imperfections. (b) A loss spectrum of atoms illuminated by the transparencylight and subjected to a pulse of cooling light. The frequency of the cooling light is scanned,and the number of remaining atoms is recorded. The three loss features correspond to thePA-, σ+-, and π-transitions. This spectrum is taken with a near-linear polarization of thetransparency light and corresponds to the data set indicated by an arrow in Fig. 12.10. (c)We take spectra at various polarizations, covering the complete range between σ+-circular(bottom) to linear and σ−-circular polarization (top). The fraction of remaining atomsis encoded in the color, with red color denoting high atom loss. The dotted white lineindicates the frequency of the cooling light. (d) Loss spectra for two extreme values ofthe polarization, taken with the intensity of the transparency light used in the experimentdescribed in the report, and applying a 25-times stronger cooling pulse compared to themeasurements shown in (b) and (c). The spectra taken with intermediate polarizations (notshown) smoothly interconnect between these two curves. The cooling frequency is againindicated by an arrow.

192 Chapter 12. Laser cooling to quantum degeneracy
12.6 Density distribution models
We now determine the density distributions of our samples by a numerical model and bya simple analytical model. Both models assume that the gas is in thermal equilibrium andneglect the influence of laser cooling light on the density distribution in the reservoir. Themodels are compared to the experiment and used to determine important quantities, suchas the elastic collision rate.
12.6.1 Self-consistent mean-field equations
We use a self-consistent mean-field model [Dal99] to describe the density distribution of theBEC n0(r) and of the thermal gas nth(r). The thermal gas is described as a gas of non-interacting particles residing in the potential Uth(r) = Uext(r) + 2g(n0(r) + nth(r)), which isthe sum of the external trapping potential Uext and the mean-field potential of all atoms.Here g = 4π�
2a/m, where a is the scattering length and m the mass of the atoms. Thepotential Uext is assumed to be zero at its deepest point. In the semiclassical approximation,the thermal density distribution in dependence of the potential is given by
nth(U) = λ−3th g3/2(e
−[U−μ]/kBT ),
where λth = h/√2πmkBT is the thermal de Broglie wavelength and μ the chemical potential.
The function g3/2(z) is a polylogarithm function, gα(z) =∑∞
n=1 zn/nα. The spatial densitydistribution is then
nth(r) = nth(Uth(r)). (12.1)
The BEC distribution is obtained in the Thomas-Fermi (TF) approximation
n0(r) = max[(μ − U0(r))/g, 0], (12.2)
where the potential U0(r) = Uext(r) + 2gnth(r) is the sum of external potential and themean-field potential of the thermal atoms.
12.6.2 Numerical model
To determine the density distributions n0 and nth, we self-consistently solve Eqns. 12.1 and12.2. The solution is obtained by a numerical calculation for given values of the chemicalpotential μ and the temperature T . The calculation starts from initial density distributionsthat are zero everywhere, and obtains better and better approximations for the distributionsby iterating Eqns. 12.1 and 12.2 1. The potential is described by a sum of the gravitational
1To speed up calculations, we first calculate tables containing n0(U) and nth(U) for a range of relevantpotential depths U . We then interpolate these tables to obtain n0(U) and nth(U) for any U . The spatialdensity distributions n0(r) and nth(r) are obtained in the local density approximation using realistic poten-tials U(r). To avoid numerical artifacts, the self-consistent solution of Eqns. 12.1 and 12.2 is obtained in twostages. During the first stage, the mean-field of the thermal atoms is not included in the potential that thethermal atoms experience. After 20 rounds of iteratively solving Eqns. 12.1 and 12.2, we linearly ramp-on

12.6. Density distribution models 193
potential and the potentials created by the dipole trapping beams, which we assume to beGaussian.
In the experiment we determine the atom number in the reservoir Nres and the atomnumber in the dimple Ndimple by performing a double-Gauss fit to the density distributionrecorded after a short expansion time. To determine similar values from the numericalcalculation, we define the reservoir density distribution nth,res(r) = nth(Ures(r)), where Ures(r)is a potential without the contribution of the dimple, but the same potential values outsidethe dimple region. The atom numbers in BEC and reservoir are determined by integratingn0(r) and nth,res(r), respectively. The thermal atom number in the dimple is obtained byintegrating nth,dimple(r) = nth(r) − nth,res(r). The radii Ri (i ∈ {x, y, z}) of the BEC aredefined by the locations at which the BEC density drops to zero.
An important quantity which we want to extract from our model is the elastic collisionrate of the thermal gas. It is given by Γel,th(n) = nvσ, where v = 4
√kBT/πm and σ = 8πa2
[Dal98]. The peak collision rate of the thermal gas Γel,th,peak is reached at the edge of theBEC, where the gas has the critical density. The timescale of thermalization between thegas in the dimple and the reservoir gas is limited by the elastic collision rate in the reservoir,outside the dimple region. This rate is highest just to the side of the dimple in the xy-plane, and determined from nth at that location, which we denote as nth,edge. Assuming aGaussian reservoir density profile in the z-direction and a homogeneous distribution in thexy-plane, the average elastic collision rate in the reservoir close to the dimple is Γel,th,res =nth,edgevσ/
√2.
12.6.3 Analytical model
Before we present the results of the numerical model, we discuss a simple analytical model.We neglect the mean-field of the thermal atoms and approximate the dimple potential bya harmonic potential with trap oscillation frequencies fi. The BEC resides entirely in thedimple and has the usual TF inverted parabola shape. The chemical potential is determinedfrom the BEC atom number N0 by
μ =�ω
2
(15N0a
aho
)2/5
,
where aho =√
�/mω and ω = 2π(fxfyfz)1/3. The radii of the BEC are given by the TF
radii RTF,i =√2μ/m(2πfi)2 and the peak density is n0(0) = μ/g.
Because of different correlations in the BEC and the thermal gas, the BEC mean-fieldis twice as strong for thermal atoms than for atoms in the BEC. Thermal atoms in thecenter of the trap experience a “Mexican hat” potential, created by the external confinementcombined with the BEC mean-field. In the center of the BEC, this mean-field reaches2gn0(0) = 2μ. For our typical parameters (see Tab. 12.3), the chemical potential is on
this potential contribution in a second stage consisting of 25 rounds. In every round, the minimum Uminth
of Uth is determined. Since the presence of a BEC is assumed, nth(Uminth ) = nc and is used as boundary
condition in the determination of nth(r). To avoid oscillations in the calculation, we low pass filter Uminth and
use the filtered value in the calculation of nth(r).
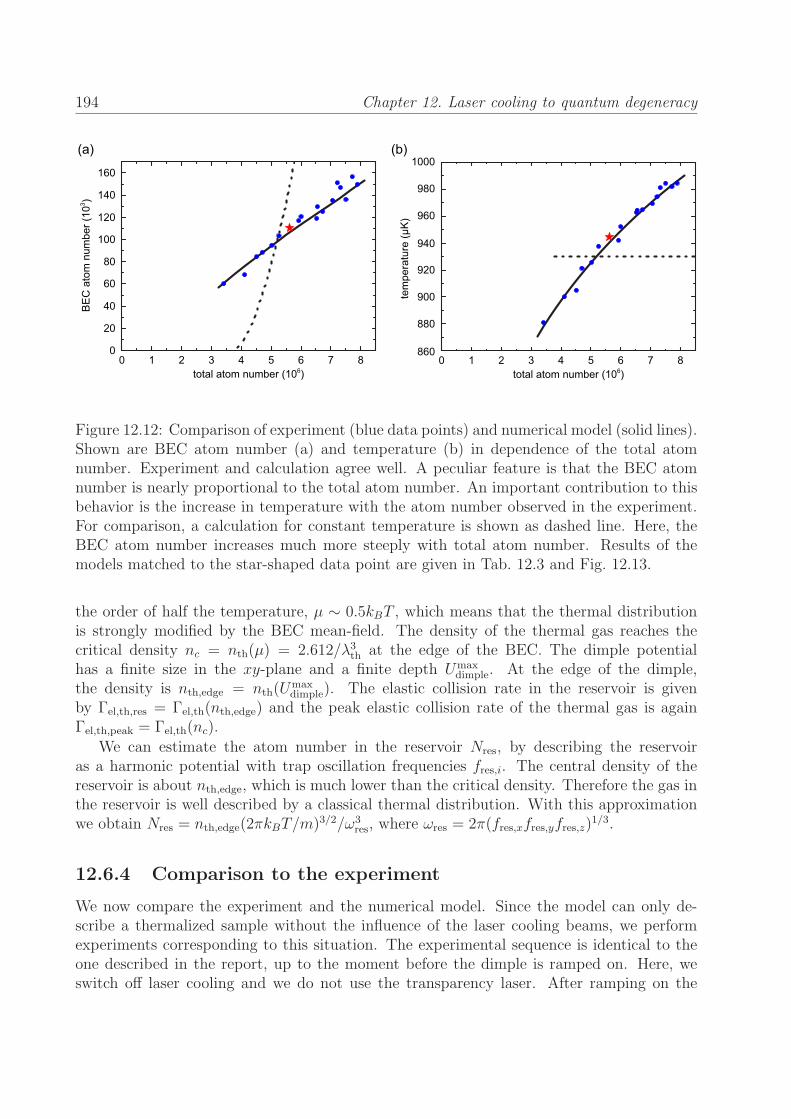
194 Chapter 12. Laser cooling to quantum degeneracy
total atom number (106) total atom number (106)
tem
pera
ture
(μK
)
BE
C a
tom
num
ber (
103 )
876543210 8765432100
20
40
60
80
100
120
140
160
860
880
900
920
940
960
980
1000(a) (b)
Figure 12.12: Comparison of experiment (blue data points) and numerical model (solid lines).Shown are BEC atom number (a) and temperature (b) in dependence of the total atomnumber. Experiment and calculation agree well. A peculiar feature is that the BEC atomnumber is nearly proportional to the total atom number. An important contribution to thisbehavior is the increase in temperature with the atom number observed in the experiment.For comparison, a calculation for constant temperature is shown as dashed line. Here, theBEC atom number increases much more steeply with total atom number. Results of themodels matched to the star-shaped data point are given in Tab. 12.3 and Fig. 12.13.
the order of half the temperature, μ ∼ 0.5kBT , which means that the thermal distributionis strongly modified by the BEC mean-field. The density of the thermal gas reaches thecritical density nc = nth(μ) = 2.612/λ3
th at the edge of the BEC. The dimple potentialhas a finite size in the xy-plane and a finite depth Umax
dimple. At the edge of the dimple,the density is nth,edge = nth(U
maxdimple). The elastic collision rate in the reservoir is given
by Γel,th,res = Γel,th(nth,edge) and the peak elastic collision rate of the thermal gas is againΓel,th,peak = Γel,th(nc).
We can estimate the atom number in the reservoir Nres, by describing the reservoiras a harmonic potential with trap oscillation frequencies fres,i. The central density of thereservoir is about nth,edge, which is much lower than the critical density. Therefore the gas inthe reservoir is well described by a classical thermal distribution. With this approximationwe obtain Nres = nth,edge(2πkBT/m)3/2/ω3
res, where ωres = 2π(fres,xfres,yfres,z)1/3.
12.6.4 Comparison to the experiment
We now compare the experiment and the numerical model. Since the model can only de-scribe a thermalized sample without the influence of the laser cooling beams, we performexperiments corresponding to this situation. The experimental sequence is identical to theone described in the report, up to the moment before the dimple is ramped on. Here, weswitch off laser cooling and we do not use the transparency laser. After ramping on the

12.6. Density distribution models 195
beam waist x waist y waist z P U/kB
(μm) (μm) (μm) (mW) (μK)reservoir 298.2 17.32 1748 11.73vertical 297 297 743 0.29dimple 22.41 22.41 39.6 2.73
Table 12.2: Parameters of the dipole trap beams used for the experiments described in thissection.
dimple, we wait 200ms to let the system thermalize. Then we record as usual time-of-flightabsorption images with 24ms expansion time, from which we extract temperature, totalatom number and BEC atom number. We perform this measurement for different loadingtimes of the metastable state reservoir at the beginning of the experimental sequence. Alonger loading time leads to a higher atom number and, as a consequence of the laser coolingprocess, to a higher temperature. The result of the experiment is shown in Fig. 12.12. Inthe examined range from 3.5× 10⁶ to 8× 10⁶ atoms, the temperature changes from 880 nKto 990 nK. The atom number in the condensate is nearly proportional to the total numberof atoms Ntot and is well described by N0 = 0.02Ntot.
The numerical model needs the potential as input. To describe the potential, we sumthe contributions of gravity and of the potentials of the three Gaussian optical dipole trapbeams used in this experiment. The parameters of the beams, determined from trap os-cillation and beam power measurements, are given in Tab. 12.2. The precision with whichwe know the potential shape is not quite enough to give a good match between the modeland the experiment. We therefore vary one potential parameter, here the dimple depth, andmatch the model to the experiment around Ntot = 6× 10⁶. Experiment and model agree fora dimple depth that is 10% larger than the measured one. A good match between modeland experiment could have alternatively been achieved by varying other parameters or bycorrecting a possible systematic error in the experimental data. A candidate systematicmeasurement error, which would be sufficient to bring the numerical model and the exper-iment into agreement, is an overestimation of the temperature by 5%. This hypotheticalsystematic shift is smaller than our experimental uncertainty.
After matching the model to the data in a single point, we can now explore the wholerange of data. The model requires as input parameters the chemical potential and thetemperature. For two data points near 3.5 × 10⁶ and 8 × 10⁶ atoms, we determine thechemical potential that corresponds to the measured BEC atom number. This procedureresults automatically in a good match for the total atom number, which already shows thatthe model describes the data well. Instead of determining the chemical potential for eachmeasurement point, we now simply linearly interpolate temperature and chemical potentialbetween these two extreme points and calculate N0 and Ntot for many values in between.The result is the solid line in Fig. 12.12 and shows a good overall match between experimentand calculation. In a second calculation, we keep the temperature always at 930 nK and varyonly the chemical potential; see dashed line in Fig. 12.12. The mismatch between calculationand data shows the importance of the small temperature change observed in the experimentbetween low and high atom number.

196 Chapter 12. Laser cooling to quantum degeneracy
-200 -150 -100 -50 0 50 100 150 2000
2
4
6
8
10
y position (μm)
-200 -150 -100 -50 0 50 100 150 2001010
1011
1012
1013
1014
1015
y position (μm)
-40 -30 -20 -10 0 10 20 30 400.0
0.5
1.0
1.5
2.0
2.5
3.0
3.5
4.0
y position (μm)
-40 -30 -20 -10 0 10 20 30 400
2
4
6
8
10
y position (μm)
dens
ity (c
m-3)
dens
ity (1
014 c
m-3)
pote
ntia
l / k
B (μ
K)
pote
ntia
l / k
B (μ
K)
(a) (b)
(c) (d)
Figure 12.13: Potential (a) and (b) and density (c) and (d) along the y-direction determinedby the numerical model, using parameters that correspond to the star-shaped data point ofFig. 12.12. In (a) and (b) the reservoir potential is shown as blue, dashed line and the fullpotential, including the dimple, as red line. Panels (c) and (d) show the density distributionsof the thermal gas nth (red line) and of the BEC n0 (black line). The dashed blue line showsthe density of thermal atoms in absence of the dimple potential nth,res.
We now examine the data point marked by a star in Fig. 12.12 in more detail. We chosethis data point because the atom number in the BEC is comparable to the one achievedin the experiments discussed in the report. As input for the models, we use the measuredtemperature and BEC atom number and adapt the chemical potential accordingly. Fig-ure 12.13 shows the potential and the density profiles of BEC and thermal gas along thex-direction as determined by the numerical calculation. The BEC mean-field clearly hasa strong effect on the thermal distribution, pushing thermal atoms outwards. Table 12.3compares experimental data with the two models and shows a general good agreement.
Some information extracted from the models is worth further discussion. We expect thatthe conditions in the experiments presented in the report are comparable to the experimentspresented here within the volume illuminated by the transparency laser. Only outside this

12.6. Density distribution models 197
quantity experiment numerical analyticalT 944(50) nK 944 nK 944 nKμ/kB 478 nK 405 nKNBEC 111× 103 111× 103 111× 103
Ndimple 654× 103
Nreservoir 5.0× 10⁶ 2.6× 10⁶
Ntotal 5.8× 10⁶ 5.8× 10⁶
n0(0) 1.0× 1015 cm−3 8.6× 1014 cm−3
nc 3.5× 1014 cm−3 3.5× 1014 cm−3
nth,edge 9.9× 1012 cm−3 8.7× 1012 cm−3
v 21.8μm/ms 21.8μm/msΓel,th,peak 2700 s−1 2700 s−1
Γel,th,res 50 s−1 50 s−1
RTF,x 5.1μm 5.8μmRTF,y 5.0μm 5.8μmRTF,z 1.9μm 2.3μm
Table 12.3: Comparison of the experiment and the models. The values given correspondto the star-shaped data point in Fig. 12.12. The trap oscillation frequencies of dimple andreservoir are fx = 244Hz, fy = 247Hz, fz = 624Hz, fres,x = 8.4Hz fres,y = 37Hz, andfres,z = 622Hz.
volume, laser cooling will change the conditions and make a comparison more complicated.An indication for this is that the atom number in the dimple, which was not measured here,is comparable to the one observed in the experiment of the report.
Since the reservoir contains nearly an order of magnitude more atoms than the dimple,the density distribution of the gas in the reservoir and the temperature of the system willbarely change when ramping the dimple on. Therefore the ratio of nth,edge/nc, which is35, gives an idea of the thermal gas density increase and the phase-space density increaseprovided by the dimple.
Finally we note that the average elastic collision rate in the reservoir close to the dimplecorresponds to about five collisions during the ∼ 100ms required for thermalization. Thisnumber compares well with the ∼ 3 collisions required to obtain thermal equilibrium asdetermined from Monte Carlo simulations [Mon93].

198 Chapter 12. Laser cooling to quantum degeneracy

Chapter 13
Outlook: On and behind the horizon
During the course of this thesis, we went from an empty lab to the first degenerate gases of Sr,and later developed a collection of techniques to handle our new and beloved atomic species.The reader might ask “Are we there yet?” or “Cool, where do we go next?”, depending onhis or her attitude.
Predicting the future of this experiment will inevitably fail, and in a few years’ time, thecommunity is likely to move into a direction no one can anticipate today. Still, we will try tosketch a few ideas of experiments that could be performed in the near and not-so-far future.We will divide them into three categories: (i) the “homework” we still have to do in order tobetter understand Sr, (ii) work along the lines of quantum simulation, and (iii) work alongthe lines of RbSr molecules.
13.1 Further investigation of strontium
Part of this thesis was dedicated to the investigation of atomic and many-body properties ofstrontium. Some quite obvious and important questions, however, have not been addressed.
• 3-body decay coefficients We have not yet succeeded in measuring the 3-bodydecay coefficient K3 of the different isotopes, most prominently
84Sr, with a satisfyingprecision. We identified a trapping geometry of two horizontal dipole trap beamsto be advantageous for this measurement. Some quantum simulations require threedistinguishable fermions to be located on the same lattice site, and it would be valuableto assess the lifetime of such a system.
• SU(N) character In Chpt. 7, we were able to put an upper bound on the ratio ofspin-changing to elastic collisions in a spin mixture of the fermionic isotope. Thisvalue can be converted into a deviation of less than 5× 10⁻⁴ from the assumed SU(N)symmetry [Bon12]. These measurements were performed in a dipole trap that didnot allow for strong compression or long hold times. With our improved laser coolingcapability and an increased oven flux, we should be able to improve the phase spacedensity by a factor of ten. Pumping atoms into two carefully-chosen states (insteadof depleting only one state) will increase the number of relevant collisions by a factor
199

200 Chapter 13. Outlook: On and behind the horizon
of about five. The confinement can certainly be increased as well. With improvedstatistics, we might be able to improve our sensitivity of spin-changing collisions bythree orders of magnitude. To rigorously prove SU(N) symmetry, one would have toshow that the scattering lengths of all combinations of two different mF states areidentical.
• Inelastic scattering in the 3P0 state Some proposals for quantum simulation requiretwo distinguishable fermions in the metastable 3P0 state to be located on the same3D lattice site. Large inelastic decay rates are expected and were indeed measuredin a thermal gas [Bis11]. Expanding these measurements into the regime of lowertemperatures would certainly be helpful. This measurement requires a clock laser todrive the 1S0 − 3P0 transition, which will soon be available in our laboratory [Vog12].
• 5s5d 3D3 hyperfine structure In Chpt. 9, we determined the hyperfine interactionconstants A and Q of the 5s5d 3D1,2 states, but lacked sufficient information on the3D3 state. Adding the repumpers at 679 and 707 nm will increase the signal strengthsufficiently. Alternatively, spectroscopy can be performed starting from the 3P0,1 states.
• Lifetime of the 3D1 states The frequency of the 1S0 − 3P0 clock transition is per-turbed by black-body radiation. A quantification of the black-body shift requires goodknowledge of the lifetime of all states that are coupled to the clock states. Such ameasurement has been performed very recently for Yb [Bel12] and could be performedfor Sr as well.
• Simplified repumping The 5s6d 3D2 state has not yet been considered for repump-ing. Using this state would require light at 403.15 nm, which is available from theavailable Blu-ray technology. If the branching ratio into the 3P0 state turns out to betolerable, then these diode lasers would be an inexpensive and simple replacement forlasers at 497 nm or 2.7μm.
13.2 Quantum simulation
The investigation of non-trivial spin models, possibly possessing topological order, is chal-lenging to both theoretical and experimental approaches. An adequate starting point wouldbe a fermionic Mott-insulator state with variable spin number N . Attainment of this statewould be verified e.g. by measurement of double occupancy via photoassociation. Thismethod could also be used to quantify the entropy of the sample. The heating rate duringlattice loading, as well as the attainable entropy, depend on N , and a determination of thevariation with N would connect to similar work in Yb [Tai12]. The attained entropy mightnot allow for antiferromagnetic ordering, calling for novel schemes to remove or re-distributeentropy. The amount of entropy still present in the system will select the class of possibleexperiments.
The detection of magnetic order is also not trivial, and the measurement of correlationsfrom TOF absorption images seems a possible yet challenging approach. Eventually, onewould desire spin-selective, in-situ fluorescence imaging with single-site resolution, which

13.3. Rb-Sr mixtures and molecules 201
might not be feasible with the present glass cell. This glass cell might also hinder theimplementation of lattice geometries envisioned for quantum computation [Dal08], whichrequire supreme control of beams at non-standard lattice beam angles. The investigationof optical flux lattices [Coo11b] seems less challenging from a technological perspective andmight thus be pursued on a shorter time scale.
13.3 Rb-Sr mixtures and molecules
The creation of RbSr ground state molecules seems straightforward, since all necessary tech-niques have already been demonstrated in similar systems. Our experiment is augmentedwith an additional Rb oven, a standard Rb laser system together with the necessary optics,and with a more powerful dipole trap laser. The metastable state reservoir of Sr suggests asequential MOT operation. There is considerable hope that the Sr red MOT can be used tosympathetically cool Rb to μK temperatures. The large choice of isotopes guarantees theexistence of a Rb-Sr pair with a scattering length suitable for evaporative cooling, allowingto the formation of two overlapping BECs. These would constitute the starting point of two-color PA measurements, aiming for a characterization of the ground-state potential and adetermination of all Rb-Sr interspecies scattering lengths. The sample would then be loadedinto an IR lattice. Molecules can be associated via STIRAP from two free atoms on thesame lattice site, closely following the scheme for Sr2 molecules presented in Chpt. 11. Thefinal STIRAP into the rovibronic ground state would be the subsequent step, where suit-able intermediate potentials and states have been identified already. Such molecules havea sizable dipole moment and could be used to study lattice spin models with long-range,spin-dependent interactions. In some sense, this work follows studies on the Li-Yb mixture[Har11]; a system which, in stark contrast to Rb-Sr, features a large mass imbalance butonly a midget dipole moment in the molecular ground state. At the time of writing thisthesis, two-species Rb-Sr MOTs have been realized in our laboratory.

202 Chapter 13. Outlook: On and behind the horizon

Appendix A
Construction of a simple high-finessecavity
Optical resonators are of utmost importance for the field of laser technology. They are foundas the resonator around the lasing medium, for intensity enhancement (e.g. around a dou-bling crystal for frequency conversion or for large-volume optical dipole traps), for modecleaning, frequency selection, monitoring of the performance of a laser (in the form of com-mon Fabry-Perot cavities), precision measurements, for the reduction of a laser linewidth, forthe detection of gravitational waves (such as in LIGO), or as an absolute frequency reference.The type of cavity described below is by no means aimed at the small linewidth or absolutefrequency stability realized in groups within the optical clock community (see e.g. the workof the JILA/NIST, MPQ, or PTB groups), which have reached sub-Hz linewidths and ab-solute frequency drifts of less than 100mHz/s. Instead, we are optimizing the cavity designfor simplicity, such that it can be constructed within two days at a cost of about 5000e.A laser locked to such a cavity has a linewidth below 10 kHz and a drift on the order of1MHz/day.
In the following, we will describe the set-up of the cavity, give some advice for the as-sembly, and evaluate the performance. A thorough treatment of optical resonators recentlyappeared in our group [Tre07] and includes relevant references. Some information on thedesign described here can be found in Ref. [Hua09].
Design — A horizontally mounted 100mm ZerodurR© spacer is used. It has a squarefront facet of 30×30mm2, a longitudinal bore of 10mm diameter and an additional side boreto vent the central bore. The mirrors are 12.7mm in diameter and have a center thickness of3mm. They are glued to the spacer using 353ND two-component heat-curing epoyx. Thisepoxy is certified by NASA and has very low outgassing. We also tried UV-curing epoxy, butfound no advantage. The mirrors have a radius of curvature of 150mm. This ensures stableoperation of the resonator and sufficient mode separation. The reflectivity of the mirrorsdepends on the desired finesse and ranges from 99% for the green cavity to 99.95% for thered and blue cavities1.
1The spacer is custom-made from Hellma (Jena, Germany). The epoxy can be obtained e.g. from EpoxyTechnology, Inc. The coating of all our resonator mirrors is done by Layertec (Mellingen, Germany).
203

204 Appendix A. Construction of a simple high-finesse cavity
If the length of the cavity is to be actively controlled, a pair of piezos is glued to oneside of the cavity2. The use of two piezos has two advantages: the tuning range is doubledfor a certain voltage applied, and possible temperature drifts due to thermal expansion ofthe piezos cancel. The outer piezo has a diameter of 24.5mm, a thickness of 1mm and aheight of 5mm. It is glued to the spacer. On the other side, it is attached to a MacorR©
ring of thickness 2mm, which has a slit to allow for wires to be guided outwards3. A smallerpiezo of same height and thickness, but outer diameter 18.5mm is glued to the same sideof the Macor R© ring. It carries another MacorR© ring, to which the mirror is attached withits curved surface. Capton wires of 500μm diameter are soldered to the two sides of thepiezos using standard solder. The use of special vacuum-compatible solder might howeverbe desired. The wires are connected to the vacuum feedthroughs using standard vacuumconnectors.
The spacer is placed inside a massive stainless steel block of 175mm length and 74mmby 74mm width. The block is chosen as a large thermal capacitor, as well as for vibrationdampening. Steel is preferred over other materials because of its large density and heatcapacity. The length is limited by the capability of our wire erosion machine, and the widthis maximized to fit into a CF100 vacuum tube. The steel block features an inner boreto accommodate the spacer. The bore is machined at an angle of 4◦ with respect to thelongitudinal axis of the block. This angle ensures that reflections from the cavity do notcoincide with reflections from the vacuum window. This angle is way too large and is reducedto 1◦ in an improved design.
The spacer is mounted inside the steel block with rubber rods of 5.7mm diameter madeof Viton R©. It is essential to use Viton R© as the material. Nitrile, a similar substance, hasoutgassing rates that are about three orders of magnitude higher. It is not possible to heata cavity chamber equipped with nitrile to 50 ◦C and maintain vacuum conditions. Othermaterials, such as silicone and Teflon R©, have similar high outgassing rates. The VitonR©
needs be heated to 175 ◦C for at least four hours to free large amounts of water immersed inthe material. The size of the material shrinks substantially during this process (about 2%of the diameter), which needs to be taken into account for tight fitting. After this baking,which does not harm the material, it can be used in high vacuum conditions. The steel blockitself is set into the vacuum tube with VitonR© rods of 8.5mm diameter. The steel blockfeatures notches to securely hold the VitonR© rods, and care is taken to avoid bubbles of airbeing trapped. To reduce the outgassing surface of the VitonR©, we do not use the entirelength of the spacer for clamping. The end facets of the steel block are covered by simplesheets of 2.5mm aluminium to prevent black-body radiation from entering the spacer. Theyare clamped to the spacer at four points, again preventing the formation of air bubbles. Adrawing of the assembly is shown in Fig. A.1.
2We use ring piezos from the Chinese company Annon Piezo. Similar piezos at comparable costs arenow available from Ferroperm, a Danish company that spares certain annoyances. The piezos are designedto operate between −30 and +150 V, but have been found to routinely operate between −200 and +300 Vwithout damage. They can be stored at ambient temperature and humidity conditions over many yearswithout damage. The piezos are driven by home-built HV amplifiers.
3The Macor R© rings are home-built. Machining of this material works surprisingly well, given the smallthickness of only 2 mm.

205
Figure A.1: Technical drawing of the cavity assembly. The spacer (yellow) holds two mirrors(white), one of which is supported by two piezos (black) and two MacorR© rings (white). Thespacer is clamped into a stainless steel block (blue) with VitonR© rods (brown).
The CF100 tube is equipped with a large viewport on both sides and mounted horizon-tally. The two CF100 flanges are not rotatable and oriented such that no M8 hole lies onthe vertical symmetry axis. This way, the support structures can be designed such that dualnuts can be used throughout. Two support structures attach to the M8 bolts and are madeof a simple 3mm aluminum sheet. The support structure is shaped to act as a spring. Thisdesign reduces heat conduction and provides some vibrational insulation, but can surely beimproved. The height of the optical axis of the cavity can be set by the design of the supportstructure and is at least 80mm.
The CF100 tube features two (or three, if an electrical feedthroughs is needed) CF40 or16 flanges on the top. These flanges are welded very close to the tube to make the wholedevice as compact as possible. The flanges connect to a valve, a 2 l/s ion pump, and possiblythe feedthroughs4.
The CF100 tube is wrapped with about 60 turns of standard lacquered copper wireof 200μm diameter, amounting to a resistance of about 6Ω. The wire is mainly woundaround the sides of the tube, as most heat loss is expected through the support structureand the windows. Two 10 kΩ NTCs are glued to the tube. A Wheatstone bridge is used to
4Most of our vacuum parts are from Vacom (Jena, Germany), the CF 100 tube is custom-made. Captonwire, connectors, and 4-pin feedthroughs are from MDC Caburn. We tested both the 2 l/s and 8 l/s ionpumps from Varian, Inc. (now with Agilent), and found the small model to be superior due to its extremelysmall size (120 cm3) and weight. This pumps starts operation at 10−3 mbar and securely pumps the cavityinto and below the 10−7 mbar range. The lifetime of the pump is tens of years. The current is less than 2μAat a voltage of 5 kV, amounting to less than 10 mW of heating.

206 Appendix A. Construction of a simple high-finesse cavity
convert the resistance of the NTCs into a voltage, and a slow home-built PID is used fortemperature stabilization. About 50mm of thermal insulation are tightly wrapped aroundthe vessel, where we choose a high-quality foam mainly used in plumbing5. A wooden boxis built around the cavity, and insulated with foam on the inside. Three-layered wood ischosen to provide dampening over a wide range of acoustic frequencies.
Assembly procedure — The assembly of the cavity is very straightforward. At first,we bake the Viton R© rods for a few hours at up to 200 ◦C. During this time, the mirrors (andpossibly the piezos, to which the capton wires have been soldered) are glued to the spacerwith a cure time of 45min at around 80 ◦C, where a few steps are necessary. The piezosshould be short-circuited when heated. Some pressure should be exerted during curing toensure that no air bubbles form and no large amounts of glue accumulate between the sur-faces. The cavity itself might be tested before mounting into the vacuum. Next, we assemblethe complete vacuum chamber with all parts except for the actual cavity. Normal coppergaskets are used for the viewports, as annealed gaskets are found to be too soft for handling.The vessel is pumped down by an external turbo pump, moderately baked for a few hours,and leak tested. The ion pump should also be tested: after a few minutes, it should be ableto maintain a vacuum in the 10−6mbar range. In a next step, one of the vacuum windowsis removed again, and the steel block including the spacer is placed inside the vacuum tube.The wires are connected to the feedthroughs, the vacuum is closed again, and pumping isperformed over night at a moderate temperature of around 80 ◦C. On the next day, we turnon the ion pump, evaluate the vacuum quality, and then remove the turbo pump. We addthe heating wires, NTCs, and thermal insulation to the cavity, and maybe build a woodenbox around it.
Piezo vs AOM—One main question that needs to be addressed before the constructionof the cavity is whether piezos should be used or not. With piezos in place, it is very easyto tune the cavity into resonance with the laser. It is also very convenient to scan the cavityduring initial set-up. On the other hand, piezos are the major source of outgassing in thevacuum, of misalignment of the cavity, and of temperature drifts. They are susceptible toRF getting into the cavity, and to electronic noise eventually changing the length of thecavity at all possible frequencies. They require feedthroughs, which add to complexity ofthe vacuum system. And finally, they require a very stable HV amplifier.
On the other hand, an AOM placed between the laser and the cavity can be used to shiftthe frequency of the laser onto the cavity’s resonance. A cavity of length L = 100mm hasa free spectral range (FSR) νFSR = c/2L of 1.5GHz, and AOMs with such a bandwidth donot exist. In an improved design, we now use spacers of 150mm length, reducing the FSR to1.0GHz. A 350MHz AOM in double-pass configuration can cover a large part of this FSR6.
Evaluation — A total of six cavities of the type described above have been constructed
5The insulation material is Armaflex from Armacell.6The diffraction efficiency of AOMs at large RF frequencies tends to decrease when going to larger wave-
lengths. A new model (3350-125 from Crystal Technology) has been developed partially for our application,showing decent efficiencies up to 850 nm.

207
and are successfully used in our lab. A linewidth of below 2 kHz has been measured for oneof them. We observe a drift of up to 10MHz/day without active temperature stabilization.The price of one such cavity amounts to about 5000e, where the coating run for the mirrorsand the ion pump take by far the largest share.
A major improvement might come from a new way of mounting the spacer: in the currentdesign, it is mechanically squeezed rather than supported. It would be fairly simple toadapt the design such that the spacer is nicely hosted onto two horizontal VitonR© rods.Furthermore, it might be noteworthy that cavities of similar design are now commerciallyavailable from Stable Lasers Inc.

208 Appendix A. Construction of a simple high-finesse cavity
Appendix B
Construction of a spectroscopy cellfor the 1S0 − 3P1 transition
The 689 nm laser is locked to a cavity for linewidth reduction and for short-term frequencystability. The atomic transition is only 7.4 kHz wide, and the absolute frequency of the laserneeds to be stabilized to less than this value. This cannot be done by our cavity, sincelong-term drifts are expected to be substantially larger than ∼ 1 kHz/hour, which could betolerated in the experiment. Therefore, the piezos in the cavity are used to lock the cavityto a spectroscopy signal. The spectroscopy cell should fulfill two requirements: it shouldgive a large and stable spectroscopy signal, and it should operate for about a year withoutmaintenance. Only a small disturbance of the environment due to heat dissipation wouldalso be desirable.
In the following, we will describe the concept of a simple and robust spectroscopy cellthat gives a large signal with only 30W of power consumption, a lifetime of many years andcosts of less than 1500e.
Basic considerations — Unlike the strong D-line transitions in the alkalis, the inter-combination lines in the alkaline earth elements are very weak. Therefore, a rather largevapor pressure is needed to generate enough absorption of the probe beam for a sufficientlylarge signal. The alkaline-earth elements and lanthanides have rather high melting points,very much unlike the alkalis. This might pose a challenge to the construction of a spec-troscopy cell.
The dependence of vapor pressure on temperature in Sr is given e.g. in Ref. [Pol05a], whileslightly conflicting numbers are found in the literature as well. Given the experimentallydetermined coefficients [Vog99], the Clausius-Clapeyron equation reads
P (T ) = 10−9450/T+10.62−1.31 log(T ) (B.1)
with the temperature T given in units of K and the pressure P obtained in mbar. Thedependence is plotted in Fig. B.1. Our spectroscopy cell will operate at a temperature ofabout 450 ◦C, corresponding to a pressure of about 10−6mbar. By contrast, the spectroscopycell for the broad transition at 461 nm operates at about 340 ◦C, where the vapor pressureis roughly three orders of magnitude smaller.
209
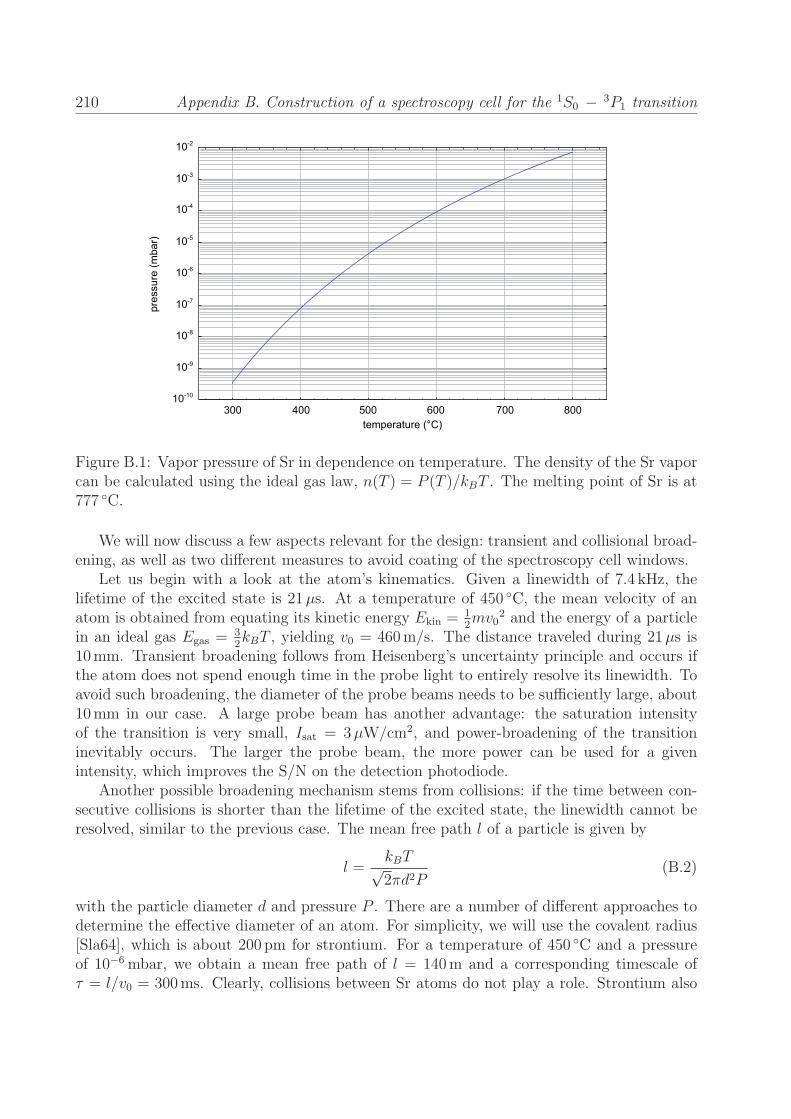
210 Appendix B. Construction of a spectroscopy cell for the 1S0 − 3P1 transition
temperature (°C)
pres
sure
(mba
r)
300 400 500 600 700 80010-10
10-8
10-6
10-4
10-2
10-3
10-5
10-7
10-9
Figure B.1: Vapor pressure of Sr in dependence on temperature. The density of the Sr vaporcan be calculated using the ideal gas law, n(T ) = P (T )/kBT . The melting point of Sr is at777 ◦C.
We will now discuss a few aspects relevant for the design: transient and collisional broad-ening, as well as two different measures to avoid coating of the spectroscopy cell windows.
Let us begin with a look at the atom’s kinematics. Given a linewidth of 7.4 kHz, thelifetime of the excited state is 21μs. At a temperature of 450 ◦C, the mean velocity of anatom is obtained from equating its kinetic energy Ekin =
12mv0
2 and the energy of a particlein an ideal gas Egas =
32kBT , yielding v0 = 460m/s. The distance traveled during 21μs is
10mm. Transient broadening follows from Heisenberg’s uncertainty principle and occurs ifthe atom does not spend enough time in the probe light to entirely resolve its linewidth. Toavoid such broadening, the diameter of the probe beams needs to be sufficiently large, about10mm in our case. A large probe beam has another advantage: the saturation intensityof the transition is very small, Isat = 3μW/cm2, and power-broadening of the transitioninevitably occurs. The larger the probe beam, the more power can be used for a givenintensity, which improves the S/N on the detection photodiode.
Another possible broadening mechanism stems from collisions: if the time between con-secutive collisions is shorter than the lifetime of the excited state, the linewidth cannot beresolved, similar to the previous case. The mean free path l of a particle is given by
l =kBT√2πd2P
(B.2)
with the particle diameter d and pressure P . There are a number of different approaches todetermine the effective diameter of an atom. For simplicity, we will use the covalent radius[Sla64], which is about 200 pm for strontium. For a temperature of 450 ◦C and a pressureof 10−6mbar, we obtain a mean free path of l = 140m and a corresponding timescale ofτ = l/v0 = 300ms. Clearly, collisions between Sr atoms do not play a role. Strontium also

211
acts as a supreme getter and will quickly remove all chemically reactive elements to establisha high vacuum. Further details can be found in Ref. [Bid02].
A major complication of working with heat pipes is the degradation of the windows: HotSr atoms attach to the cold viewports and form a reflective layer that can only be removedby exposure to oxygen. A widely used solution is the addition of a small amount of buffer gasinto the heat pipe. Any hot atom travelling towards a window should collide with a buffergas atom and be deflected to the cold end of the heat pipe, where it attaches to the wall. Inan early trial, we found that a buffer gas pressure of less than 10−6mbar will lead to a coatingof the windows within hours, while a pressure of about 10−3mbar will prevent coating foryears. In the current setup, 8 × 10⁻⁴mbar of nitrogen are added as buffer gas. This wasactually a bad choice, as Sr reacts with N2 to form strontium nitrite Sr3N2 at temperaturesabove 380 ◦C. A better choice would be argon. At a buffer gas pressure of 10−3mbar andassuming a covalent radius of 70 pm, we calculate a mean free path of 400mm, which isabout the size of our cell.
Another approach to reduce the flux of atoms impinging on the windows is an optimizedgeometry of the spectroscopy cell. Atoms are heated to high temperatures only in the centerof the cell, and the smaller the solid angle under which they can hit a window in a directflight, the smaller the flux. In other words: the longer the cell, the better.
With a length of the spectroscopy cell L and an inner diameter of the tube D, the solidangle of the windows as seen from a hot Sr atom in the center is Ω = 2π(D/L)2 sr. In ourcase of L = 600mm and D = 8mm, we obtain Ω ≈ 10−3 sr or about 10−4 of the total solidangle. Decreasing the tube diameter and building the tube as long as possible is thereforebeneficial.
Let us now summarize our findings. The desire for a large probe beam (> 10mm) com-petes with the requirement of a narrow tube, which reduces the solid angle for atoms hittingthe windows. There is no disadvantage to making the cell longer, except for limitations inavailable space. The temperature could safely be increased to about 700 ◦C before observingcollisional broadening from Sr-Sr collisions. The amount of buffer gas should be chosen suchthat the mean free path of Sr atoms is much larger than the diameter of the probe beam, butmuch smaller than the length of the tube, D < l < L. A few 10−3mbar of Ar seem reason-able. A systematic determination of the broadening and shifting of the 1S0 − 3P1 transitionin Sr by various buffer gases has been performed by the Tokyo group [Shi09] and comparedto earlier results of other groups. Broadening and shifts are at most a few kHz/10−3mbarpressure and went unnoticed in all of our experiments.
Design — The spectroscopy cell consists of a 600mm long stainless steel tube of 12mmouter diameter and 8mm inner diameter. The thickness is chosen to be large enough toprevent the tube from bending at high temperatures, while being small enough to minimizeheat conduction. Two CF40 flanges are welded to the sides and will support the viewports.The metallic Sr is contained in a barrel welded into the center of the tube. This barrel has aheight of 60mm and an outer diameter of 30mm. It is oriented vertically, with the bottom ofthe barrel situated 45mm below the axis of the horizontal tube. This barrel forms a nice cupto hold 10 g of strontium. Initial pumping is performed through a short 6mm tube weldedto one side of the long tube and equipped with a CF16 flange. A heating wire is wound

212 Appendix B. Construction of a spectroscopy cell for the 1S0 − 3P1 transition
around the barrel, and two thermocouples are attached for temperature measurement. Theentire length of the long tube is tightly wrapped in 80mm of thermal insulation, which iscapped with multiple layers of aluminum foil1.
About 30W of power are needed to heat the central region to 450 ◦C. We use a simpleDC power supply, which is very convenient as it spares the annoyances of 50Hz noise, highvoltages, or noise from pulse-width modulation. Water-cooling of the cell is provided throughsmall copper blocks clamped to the ends of the long tube, about 50mm away from the view-ports. These copper blocks are internally flushed with cooling water. Two simple supportstructures attach to the CF40 viewports and hold the cell at a height of 100mm. The en-tire structure is set inside a 2mm aluminum box to decouple it from the environment. Theair inside this box heats up considerably and is cooled by a commercial water cooler radiator.
Assembly procedure — The tube is equipped with heating wires, thermocouples, andsome provisional insulation, and heated to about 300 ◦C to remove any contamination fromthe welding process. The viewports and valve are attached. The valve is connected to aT, which goes to the valve used to inject the buffer gas in a controlled way, and the turbopump. The cell is pumped, baked, and leak-tested. The controlled flushing of buffer gas istested as well. As a next step, the vacuum is opened again, the insulation and viewportsare removed, and the cell is placed in an atmosphere of argon. About 5 to 10 g of metallicSr are filled into the barrel. This can nicely be done by placing small pieces of up to 3mmsize into the long tube and sliding them one-by-one into the center. Attempting to forcefullyshove larger pieces into the center will unavoidably clog the tube. It takes about an hour tocomplete the task. Afterwards, the viewports are attached again.
In a last step, the cell is pumped, moderately heated to about 200 ◦C for an hour, andleak-tested. Excess heating under high vacuum at this stage will coat the windows. Thebuffer gas is slowly flushed into the system up to a pressure of about 1mbar, and then turnedoff. The pressure is reduced to the desired value of about 10−3mbar by the turbo pump,and the valve of the cell is closed. Care should be taken when reading the pressure from thevacuum pump’s gauge: the values are usually given for diatomic gases and differ significantlyfor argon. The cell can now be tested: at about 450 ◦C, a resonant probe beam of moderateintensity should be absorbed almost entirely.
Evaluation — The design of our spectroscopy cells undergoes a steady improvement.The version described above operates already for more than 2 years at around 420 ◦C, without
1The CF 16 valve is a VAT model 54024. Our heating wire is model SEI 10/50 from Thermocoax (France).The hot part has a length of 50 cm and an outer diameter of 1mm, its resistance is about 6 Ω, and themaximum heating capability is about 200 W. The smaller version SEI 10/25 of half the length could be usedas well. We use standard K-type thermocouples, which can be purchased from a range of companies. Wetried different types of thermal insulation material suited for high temperatures, and found Superwool R©
PLUSTM
most satisfying, obtained from Contherm (Germany). This is a ceramic wool optimized for smallvolumes of confined air and reduced knots. This wool comes in different shapes (paper, blankets, bulk, ...)and is developed for high temperatures of up to 1500 ◦C. It is also supposed to be less harmful than glassfiber, which comes apart much more easily. We use blankets of 25 mm and 50mm thickness. The entirespectroscopy cell is home-built in our workshop, employing vacuum parts from Vacom (Germany). We usemetallic Sr from Alfa Aesar, delivered in dendritic pieces under Ar atmosphere.

213
degradation of the absorption signal or coating of the windows, and has not been touchedever since. From previous experiments, we know that the cell can be heated to above 700 ◦C,leaving a large security margin should the absorption signal ever drop. We are able tostabilize the laser to better than 500Hz over a 1-hour period, and we did not detect anydrifts of more than a few kHz over years. A few 100μW of power are used in the pump andprobe beams, which is certainly sufficient for a suitable photodiode. We estimate that thisdesign can also be used for atomic species with substantially smaller linewidth (such as Ca)or much higher boiling point (such as Er).

214 Appendix B. Construction of a spectroscopy cell for the 1S0 − 3P1 transition

Appendix C
Construction of an oven for strontium
The design of our oven follows the design of the FeLiKx multi-species oven, which has beendescribed in Ref. [Wil09]. We will summarize the basic concept here, elaborate on differentheating strategies, and then evaluate the oven design in view of future improvements. After-wards, we will briefly review our unsuccessful efforts to work with an enriched source. Thevapor pressure of Sr, as well as all relevant information on the required materials, can befound in the preceding Appendix B.
Design —We follow the FeLiKx design not only because of the possibility to later add adifferent element such as Rb to Sr, but also to be able to use a natural and an enriched sourceof atoms. A common Zeeman-slower should be used for the chemically different elements,which are potentially reactive and have to be heated to different temperatures. Therefore,the reservoirs need to be spatially separated sufficiently to establish a temperature differ-ence of up to 500 ◦C, and migration between the reservoirs must be avoided. Each elementis devoted its own oven segment; see Fig. 3.1 for an image and Ref. [Wil09] for details. Themetal is contained and evaporated in a reservoir tube, and the atoms are directed towardsthe MOT region by a bundle of microtubes. The area of the microtubes formes a segmentof a circle (typically 1/3) around the longitudinal axis of the oven. Up to three ovens can bestacked one after the other. They are rotated around the common axis such that the fluxof the rear oven can pass through the front ones, which provide a suitable “fly-by” channel.This compact design establishes a high flux of atoms very close to the axis of the Zeeman-slower. In the setup used for the work of this thesis, the front oven and two-thirds of theavailable cross section were reserved for an enriched source of strontium. This segment wasnever used, and we worked with only one third of the available cross section.
Heating of the oven — Two 25 cm heating wires are used for each oven segment, andone 50 cm wire is wrapped around each reservoir. Some of the flanges connecting two ovensegments are heated as well, and each heating wire is driven independently. Close to a dozenof thermocouples are used to read out the temperature of different spots of the oven. We usea ceramic wool for insulation and cast the oven into a solid double-walled 6mm aluminumbox, where the air enclosed between the two walls of the box is constantly exchanged forcooling.
215

216 Appendix C. Construction of an oven for strontium
The choice of the power supplies and the concept of temperature control are guided bythe following criteria: The power supplies need to deliver about 200W, but they must notbe powerful enough to melt the entire oven. For safety reasons, they should not operate athazardous voltages. DC power supplies are preferred over AC ones to avoid 50Hz emissionin the vicinity of the experiment. Similarly, pulse-width modulation should be avoided toreduce time-varying fields. The heating of the oven could be turned off during the crucialstage of the experiment to avoid influences on the B-field.
In the beginning, we used an 35V AC transformer as power source, and control wasachieved via pulse-width modulation using a set of solid state relays, one for each heatingwire. After about two years, we had to increase the temperature of our oven to maintain thesame atom flux, we found that the heating wires broke more frequently. The heating wireshave a limited lifetime, where rapid changes in the temperature as well as mechanical andthermal stress lead to degradation. In an attempt to reduce the stress on the heating wires,we opted for DC power supplies with a manually adjusted current output. We reduced theoven temperature only when not operating the machine for more than a few days. None ofthe heating wires broke during about one year of such operation.
Evaluation — After about three years of operation, the oven flux had decreased sub-stantially, and we exchanged the oven. We disassembled the old oven completely and foundthat the stainless steel structure and flanges showed no signs of degradation, despite opera-tion at temperatures of up to 750 ◦C for years. To our surprise, we found that the reservoirwas completely empty, and a large chunk of Sr had deposited in the “fly-by” channel of thefront oven, entirely blocking this section. This now explained the reduced flux and poorercollimation which we had observed. Astonishingly, the microtubes were as clean as at thetime of installation, with no Sr deposited in or around the tubes.
A future design might consider a slightly different distribution of heating wires aroundthe oven segments to increase the temperature at the front ends of the microtubes. It isrecommended to use only the long 50 cm heating wires to reduce thermal stress and increasetheir lifetime. Great care should be taken to heat the front oven segment to a higher tem-perature than the rear ones in order to avoid deposition in the “fly-by” channels.
Enriched source — Out of the four stable isotopes of strontium, the ones of mostinterest to us are 84Sr (because of its moderate scattering length, rendering it ideal forefficient evaporative cooling to form large BECs sympathetically cool 87Sr and possibly otherelements) and 87Sr (because of its fermionic nature and nonzero nuclear spin). Ironically,84Sr has the lowest natural abundance of all isotopes, 0.5%. The natural abundance of 87Sris roughly 10%, but the rich hyperfine structure decreases the efficiency of the blue MOT,the repumping, and the red MOT. Despite being 20-times more abundant, an optimized redMOT of 87Sr contains only about one third of the atom number of the 84Sr isotope, giventhe same reservoir loading time. Thus, it would be beneficial to use enriched sources of thesetwo isotopes.
A few years ago, metallic 84Sr enriched to 70% was available from Eurisotopes. Unfortu-nately, this is not the case any more. Instead, enriched strontium in the chemical compoundstrontium carbonate 84SrCO3 is easily and readily available from various companies, at a
217
price of roughly 70 $/mg. The task of converting the carbonate into a pure metal is highlynontrivial, and despite considerable effort, we were not able to find a company able andwilling to perform this purification. A collaboration with two chemists, Prof. Huppertzand Dr. Heymann from the University of Innsbruck, was aimed to explore possible ways ofpurification.
An aluminothermic reaction is the most straightforward process. The SrCO3 would beheated to more than 1268 ◦C, where it would form an oxide: SrCO3 → SrO + CO2. Theoxide can be reduced further by aluminum: 3SrO + 2Al→ 3Sr + Al2O3. Two major prob-lems occurred: First, the carbonate turned out to be very reactive and penetrate into theglass container, which was made of quartz. The high temperatures made it impossible touse another material, thus some new material would have to be engineered. Second, thewettability of the SrO by the aluminum melt turned out to be unexpectedly low, makingreaction times very long.
Because of these difficulties, we turned to fused-salt electrolysis. This process is commonto remove chlorene or fluorene from all alkalis and most alkaline-earths. The idea is to turnthe strontium carbonate into a chloride: SrCO3 + 2HCl→ SrCl2 +H2CO3. Afterwards,the strontium chloride would be heated and decomposed into its constituents by electrolysis.Again, we found that currently available types of glass cannot stand the temperatures presentduring the reaction.
In order not to rely on any glass container for the reaction process, one might considerdoing the chemistry not in vitro and later transferring an ampoule with metallic strontiuminto the oven, but to do everything in situ within our vacuum chamber. This approach wassuccessfully followed in an experiment with barium [De09], where Ba follows Sr in the secondcolumn of the periodic table. Here, the oven was filled with both BaCO3 and Zr powder andheated to about 700 ◦C. At this temperature, the carbonate bond breaks to from bariumoxide, BaCO3 → BaO + CO2. Afterwards, the oven is operated at a lower temperature ofroughly 500 ◦C, where reduction by zirconium removes the oxygen atom. The atomic Ba hasa sufficient vapor pressure at this temperature to form a proper atomic beam [De08]. Anadaption of this scheme to Sr would require a much higher temperature for the calcinationprocess, as stated above. The thermite reaction might also employ silicon, but the necessarytemperature is generally expected to be higher than in the case of barium. Nevertheless, itwould be interesting to test this approach.
Research was far from completion when we found that accumulation of laser-cooled atomsin the metastable 3P2 state allows for large enough samples and large BECs, so we discontin-ued further studies. With the advent of space missions employing 87Sr clocks, there is newinterest in the production of pure metallic 87Sr. In applications that require a good vacuumin the experimental chamber, but could tolerate a high oven temperature, isotopic post-selection by optical means is also possible: an atomic beam emerging from the source couldbe deflected and guided into the experimental chamber by light resonant on the 1S0 − 1P1
transition, which is fairly isotope-selective.

218 Appendix C. Construction of an oven for strontium

Bibliography
[Aid11] M. Aidelsburger, M. Atala, S. Nascimbene, S. Trotzky, Y.-A. Chen, and I. Bloch,Experimental Realization of Strong Effective Magnetic Fields in an Optical Lattice,Phys. Rev. Lett. 107, 255301 (2011).
[Aik12] K. Aikawa, A. Frisch, M. Mark, S. Baier, A. Rietzler, R. Grimm, and F. Ferlaino,Bose-Einstein Condensation of Erbium, Phys. Rev. Lett. 108, 210401 (2012).
[And95] M. Anderson, J. Ensher, M. Matthews, C. Wieman, and E. Cornell, Observationof Bose-Einstein condensation in dilute atomic vapor, Science 269, 198 (1995).
[And06] A. Andre, D. DeMille, J. Doyle, M. Lukin, S. Maxwell, P. Rabl, R. Schoelkopf, andP. Zoller, A coherent all-electrical interface between polar molecules and mesoscopicsuperconducting resonators, Nature Phys. 2, 636 (2006).
[Ari92] E. Arimondo, W. D. Phillips, and F. Strumia (Eds.), Laser Manipulation of Atomsand Ions, North Holland, Amsterdam (1992), Proceedings of the InternationalSchool of Physics “Enrico Fermi”, Course CXVIII, Varenna, 9-19 July 1991.
[Asp88] A. Aspect, E. Arimondo, R. Kaiser, N. Vansteenkiste, and C. Cohen-Tannoudji,Laser Cooling below the One-Photon Recoil Energy by Velocity-Selective CoherentPopulation Trapping, Phys. Rev. Lett. 61, 826 (1988).
[Aut55] S. Autler and C. Townes, Stark Effect in Rapidly Varying Fields, Phys. Rev. 100,703 (1955).
[Bak09] W. S. Bakr, J. I. Gillen, A. Peng, S. Folling, and M. Greiner, A quantum gasmicroscope for detecting single atoms in a Hubbard-regime optical lattice, Nature462, 74 (2009).
[Bar01] M. D. Barrett, J. A. Sauer, and M. S. Chapman, All-Optical Formation of anAtomic Bose-Einstein Condensate, Phys. Rev. Lett. 87, 010404 (2001).
[Bar02] M. Baranov, L. Dobrek, K. Goral, L. Santos, and M. Lewenstein, Ultracold DipolarGases - a Challenge for Experiments and Theory, Physica ScriptaT102, 74 (2002).
[Bar08] M. A. Baranov, Theoretical progress in many-body physics with ultracold dipolargases, Physics Reports 464, 71 (2008).
219

220 Bibliography
[Bec10] C. Becker, P. Soltan-Panahi, J. Kronjager, S. Dorscher, K. Bongs, and K. Sen-gstock, Ultracold quantum gases in triangular optical lattices, New Journal ofPhysics 12, 065025 (2010).
[Bed00] P. F. Bedaque, E. Braaten, and H.-W. Hammer, Three-body recombination in Bosegases with large scattering length, Phys. Rev. Lett. 85, 908 (2000).
[Bei82] R. Beigang, K. Lucke, D. Schmidt, A. Timmermann, and P. J. West, One-PhotonLaser Spectroscopy of Rydberg Series from Metastable Levels in Calcium and Stron-tium, Physica Scripta 26, 183 (1982).
[Bel08] K. Beloy, A. Derevianko, and W. R. Johnson, Hyperfine structure of the metastable3P 2 state of alkaline-earth-metal atoms as an accurate probe of nuclear magneticoctupole moments, Phys. Rev. A 77, 012512 (2008).
[Bel11] K. Beloy, A. W. Hauser, A. Borschevsky, V. V. Flambaum, and P. Schwerdtfeger,Effect of α variation on the vibrational spectrum of Sr2, Phys. Rev. A 84, 062114(2011).
[Bel12] K. Beloy, J. A. Sherman, N. D. Lemke, N. Hinkley, C. W. Oates, and A. D. Ludlow,Determination of the 5d6s 3D1 state lifetime and blackbody radiation clock shift inYb, arXiv:1208.0552v1 (2012).
[Ber11] B. Beri and N. Cooper, Z2 Topological Insulators in Ultracold Atomic Gases, Phys.Rev. Lett. 107, 145301 (2011).
[Bev89] N. Beverini, F. Giammanco, E. Maccioni, F. Strumia, and G. Vissani, Measure-ment of the calcium 1P1− 1D2 transition rate in a laser-cooled atomic beam, JOSAB 6, 2188 (1989).
[Bid02] Y. Bidel, Piegeage et refroidissement laser du strontium; Etude de l’effet des in-terferences en diffusion multiple, Ph.D. thesis, Universite de Nice, Nice, France(2002).
[Bin01] T. Binnewies, G. Wilpers, U. Sterr, F. Riehle, J. Helmcke, T. E. Mehlstaubler,E. M. Rasel, and W. Ertmer, Doppler Cooling and Trapping on Forbidden Tran-sitions, Phys. Rev. Lett. 87, 123002 (2001).
[Bis11] M. Bishof, M. J. Martin, M. D. Swallows, C. Benko, Y. Lin, G. Quemener, A. M.Rey, and J. Ye, Inelastic collisions and density-dependent excitation suppressionin a 87Sr optical lattice clock, Phys. Rev. A 84, 052716 (2011).
[Bla08] S. Blatt, A. D. Ludlow, G. K. Campbell, J. W. Thomsen, T. Zelevinsky, M. M.Boyd, J. Ye, X. Baillard, M. Fouche, R. Le Targat, A. Brusch, P. Lemonde,M. Takamoto, F.-L. Hong, H. Katori, and V. V. Flambaum, New Limits on Cou-pling of Fundamental Constants to Gravity Using 87Sr Optical Lattice Clocks, Phys.Rev. Lett. 100, 140801 (2008).

Bibliography 221
[Bla11a] S. Blatt, Ultracold Collisions and Fundamental Physics with Strontium, Ph.D.thesis, University of Colorado, Boulder, USA (2011).
[Bla11b] S. Blatt, T. L. Nicholson, B. J. Bloom, J. R. Williams, J. W. Thomsen, P. S.Julienne, and J. Ye, Measurement of Optical Feshbach Resonances in an IdealGas, Phys. Rev. Lett. 107, 073202 (2011).
[Blo99] I. Bloch, T. W. Hansch, and T. Esslinger, Atom Laser with a cw Output Coupler,Phys. Rev. Lett. 82, 3008 (1999).
[Blo05] I. Bloch, Ultracold quantum gases in optical lattices, Nature Phys. 1, 23 (2005).
[Blo08] I. Bloch, J. Dalibard, and W. Zwerger, Many-body physics with ultracold gases,Rev. Mod. Phys. 80, 885 (2008).
[Blo12] I. Bloch, J. Dalibard, and S. Nascimbene, Quantum simulations with ultracoldquantum gases, Nature Phys. 8, 267 (2012).
[Bon12] L. Bonnes, K. R. A. Hazzard, S. R. Manmana, A. M. Rey, and S. Wessel, Adia-batic loading of one-dimensional SU(N) alkaline earth fermions in optical lattices,arXiv:1207.3900v1 (2012).
[Bor96] C. Borde, Amplification of atomic waves by stimulated emission of atoms, in M. In-guscio, M. Allegrini, and A. Sasso (Eds.), Proceedings of the 12th InternationalConference on Laser Spectroscopy, 208, World Scientific, Singapore (1996).
[Bos24] S. N. Bose, Plancksches Gesetz und Lichtquantenhypothese, Zeitschrift fur Physik26, 178 (1924).
[Boy07a] M. M. Boyd, High Precision Spectroscopy of Strontium in an Optical Lattice: To-wards a New Standard of Frequency and Time, Ph.D. thesis, University of Col-orado, Boulder, USA (2007).
[Boy07b] M. M. Boyd, A. D. Ludlow, S. Blatt, S. M. Foreman, T. Ido, T. Zelevinsky, andJ. Ye, 87Sr lattice clock with inaccuracy below 10−15, Phys. Rev. Lett. 98, 083002(2007).
[Boy07c] M. M. Boyd, T. Zelevinsky, A. D. Ludlow, S. Blatt, T. Zanon-Willette, S. M.Foreman, and J. Ye, Nuclear spin effects in optical lattice clocks, Phys. Rev. A 76,022510 (2007).
[Bra08] J. P. Brantut, J. F. Clement, M. Robert-de-Saint-Vincent, G. Varoquaux, R. A.Nyman, A. Aspect, T. Bourdel, and P. Bouyer, Light-shift tomography in anoptical-dipole trap for neutral atoms, Phys. Rev. A 78, 031401 (2008).
[Bre07] G. K. Brennen, A. Micheli, and P. Zoller, Designing spin-1 lattice models usingpolar molecules, New J. Phys. 9, 138 (2007).
222 Bibliography
[Bri07] K.-A. Brickman, M.-S. Chang, M. Acton, A. Chew, D. Matsukevich, P. C. Haljan,V. S. Bagnato, and C. Monroe, Magneto-optical trapping of cadmium, Phys. Rev.A 76, 043411 (2007).
[Bru12] D. A. Brue and J. M. Hutson, Magnetically Tunable Feshbach Resonances in Ul-tracold Li-Yb Mixtures, Phys. Rev. Lett. 108, 043201 (2012).
[Buc07] H. P. Buchler, A. Micheli, and P. Zoller, Three-body interactions with cold polarmolecules, Nature Phys. 3, 726 (2007).
[Bus98] T. Busch, J. R. Anglin, J. I. Cirac, and P. Zoller, Inhibition of spontaneous emis-sion in Fermi gases, EPL 44, 1 (1998).
[Cas89] Y. Castin, H. Wallis, and J. Dalibard, Limit of Doppler cooling, J. Opt. Soc. Am.B 6, 2046 (1989).
[Cas98] Y. Castin, J. I. Cirac, and M. Lewenstein, Reabsorption of Light by Trapped Atoms,Phys. Rev. Lett. 80, 5305 (1998).
[Caz09] M. A. Cazalilla, A. Ho, and M. Ueda, Ultracold Gases of Ytterbium: Ferromag-netism and Mott States in an SU(6) Fermi System, New J. Phys. 11, 103033(2009).
[Cen03] G. Cennini, G. Ritt, C. Geckeler, and M. Weitz, Bose-Einstein condensation in aCO2-laser optical dipole trap, Appl. Phys. B 77 (2003).
[Chi00] A. P. Chikkatur, A. Gorlitz, D. M. Stamper-Kurn, S. Inouye, S. Gupta, andW. Ketterle, Suppression and Enhancement of Impurity Scattering in a Bose-Einstein Condensate, Phys. Rev. Lett. 85, 483 (2000).
[Chi10] C. Chin, R. Grimm, P. S. Julienne, and E. Tiesinga, Feshbach resonances in ul-tracold gases, Rev. Mod. Phys. 82, 1225 (2010).
[Cho10] C. W. Chou, D. B. Hume, J. C. J. Koelemeij, D. J. Wineland, and T. Rosenband,Frequency Comparison of Two High-Accuracy Al+ Optical Clocks, Phys. Rev. Lett.104, 070802 (2010).
[Chu] S. Chu and C. Wieman, eds., Laser Cooling and Trapping of Atoms, Special issueof J. Opt. Soc. Am. B, 6, Issue 11, (1989).
[Chw09] M. Chwalla, J. Benhelm, K. Kim, G. Kirchmair, T. Monz, M. Riebe, P. Schindler,A. S. Villar, W. Hansel, C. F. Roos, R. Blatt, M. Abgrall, G. Santarelli, G. D.Rovera, and P. Laurent, Absolute Frequency Measurement of the 40Ca+ 4s 2S1/2 −3d 2D5/2 Clock Transition, Phys. Rev. Lett. 102, 023002 (2009).
[Cir96] J. I. Cirac, M. Lewenstein, and P. Zoller, Collective laser cooling of trapped atoms,Europhys. Lett. 35, 647 (1996).
[Ciu] R. Ciury�lo, private communication.

Bibliography 223
[Ciu04] R. Ciury�lo, E. Tiesinga, S. Kotochigova, and P. S. Julienne, Photoassociation spec-troscopy of cold alkaline-earth-metal atoms near the intercombination line, Phys.Rev. A 70, 062710 (2004).
[Ciu05] R. Ciury�lo, E. Tiesinga, and P. Julienne, Optical tuning of the scattering length ofcold alkaline-earth-metal atoms, Phys. Rev. A 71, 030701 (2005).
[Cle09] J.-F. Clement, J.-P. Brantut, M. Robert-de-Saint-Vincent, R. A. Nyman, A. As-pect, T. Bourdel, and P. Bouyer, All-optical runaway evaporation to Bose-Einsteincondensation, Phys. Rev. A 79, 061406 (2009).
[Con] Control system homepage, http://iqoqi.at/control.
[Coo09] N. Cooper and G. Shlyapnikov, Stable topological superfluid phase of ultracold polarfermionic molecules, Phys. Rev. Lett. 103, 155302 (2009).
[Coo11a] N. Cooper and J. Dalibard, Optical flux lattices for two-photon dressed states, EPL95, 66004 (2011).
[Coo11b] N. R. Cooper, Optical Flux Lattices for Ultracold Atomic Gases, Phys. Rev. Lett.106, 175301 (2011).
[Cou05] I. Courtillot, A. Quessada-Vial, A. Brusch, D. Kolker, G. D. Rovera, andP. Lemonde, Accurate spectroscopy of Sr atoms, Eur. Phys. J. D 33, 161 (2005).
[Cra90] A. Crawford, Medical Communications (London) 2, 301 (1790).
[Dal89] J. Dalibard and C. Cohen-Tannoudji, Laser cooling below the Doppler limit by po-larization gradients: simple theoretical models, J. Opt. Soc. Am. B 6, 2023 (1989).
[Dal98] J. Dalibard, Bose-Einstein condensation in atomic gases, chapter Collisional dy-namics of ultra-cold atomic gases, North Holland, Amsterdam (1998), Proceedingsof the International School of Physics “Enrico Fermi”, Course CXL, Varenna, 7-17July 1998.
[Dal99] F. Dalfovo, S. Giorgini, L. P. Pitaevskii, and S. Stringari, Theory of Bose-Einsteincondensation in trapped gases, Rev. Mod. Phys. 71, 463 (1999).
[Dal04] A. J. Daley, P. O. Fedichev, and P. Zoller, Single-atom cooling by superfluid im-mersion: A nondestructive method for qubits, Phys. Rev. A 69, 022306 (2004).
[Dal08] A. J. Daley, M. M. Boyd, J. Ye, and P. Zoller, Quantum computing with alkaline-earth-metal atoms, Phys. Rev. Lett. 101, 170504 (2008).
[Dal11] J. Dalibard, F. Gerbier, G. Juzeliunas, and P. Ohberg, Artificial gauge potentialsfor neutral atoms, Rev. Mod. Phys. 83, 1523 (2011).
[Dam11] U. Dammalapati, L. Willmann, and S. Knoop, Scattering lengths of calcium andbarium isotopes, Phys. Rev. A 84, 054703 (2011).
224 Bibliography
[Dan08] J. G. Danzl, E. Haller, M. Gustavsson, M. J. Mark, R. Hart, N. Bouloufa,O. Dulieu, H. Ritsch, and H.-C. Nagerl, Quantum Gas of Deeply Bound GroundState Molecules, Science 321, 1062 (2008).
[Dav08] H. Davy, Electro-chemical researches on the decomposition of the earths; with ob-servations on the metals obtained from the alkaline earths, and on the amalgamprocured from ammonia, Philosophical Transactions of the Royal Society of Lon-don 98, 333 (1808).
[Dav95] K. B. Davis, M. O. Mewes, M. R. Andrews, N. J. van Druten, D. S. Durfee, D. M.Kurn, and W. Ketterle, Bose-Einstein condensation in a gas of sodium atoms,Phys. Rev. Lett. 75, 3969 (1995).
[De08] S. De, Laser Cooling and Trapping of Barium, Ph.D. thesis, University of Gronin-gen, Groningen, The Netherlands (2008).
[De09] S. De, U. Dammalapati, K. Jungmann, and L. Willmann, Magneto-optical trappingof barium, Phys. Rev. A 79, 041402(R) (2009).
[DeM99] B. DeMarco and D. S. Jin, Onset of Fermi Degeneracy in a Trapped Atomic Gas,Science 285, 1703 (1999).
[DeM01a] B. DeMarco, Quantum Behavior of an Atomic Fermi Gas, Ph.D. thesis, Universityof Colorado, Boulder, USA (2001).
[DeM01b] B. DeMarco, S. B. Papp, and D. S. Jin, Pauli Blocking of Collisions in a QuantumDegenerate Atomic Fermi Gas, Phys. Rev. Lett. 86, 5409 (2001).
[DeM02] D. DeMille, Quantum Computation with Trapped Polar Molecules, Phys. Rev. Lett.88, 067901 (2002).
[DeM05] B. DeMarco, C. Lannert, S. Vishveshwara, and T.-C. Wei, Structure and stabilityof Mott-insulator shells of bosons trapped in an optical lattice, Phys. Rev. A 71,063601 (2005).
[Den02] J. H. Denschlag, J. E. Simsarian, H. Haffner, C. McKenzie, A. Browaeys, D. Cho,K. Helmerson, S. L. Rolston, and W. D. Phillips, A Bose-Einstein condensate inan optical lattice, Journal of Physics B: Atomic, Molecular and Optical Physics35, 3095 (2002).
[Der01] A. Derevianko, Feasibility of Cooling and Trapping Metastable Alkaline-EarthAtoms, Phys. Rev. Lett. 87, 023002 (2001).
[Der11] A. Derevianko and H. Katori, Colloquium: Physics of optical lattice clocks, Rev.Mod. Phys. 83, 331 (2011).
[DeS10] B. J. DeSalvo, M. Yan, P. G. Mickelson, Y. N. Martinez de Escobar, and T. C.Killian, Degenerate Fermi Gas of 87Sr, Phys. Rev. Lett. 105, 030402 (2010).
Bibliography 225
[Die08] S. Diehl, A. Micheli, A. Kantian, B. Kraus, H. Buchler, and P. Zoller, Quantumstates and phases in driven open quantum systems with cold atoms, Nature Phys.4, 878 (2008).
[Don01] E. A. Donley, N. R. Clausen, S. L. Cornish, J. L. Roberts, E. A. Cornell, andC. E. Wieman, Dynamics of Collapsing and Exploding Bose-Einstein Condensates,Nature 412, 295 (2001).
[Dru02] P. D. Drummond, K. V. Kheruntsyan, D. J. Heinzen, and R. H. Wynar, StimulatedRaman adiabatic passage from an atomic to a molecular Bose-Einstein condensate,Phys. Rev. A 65, 063619 (2002).
[Dru05] P. D. Drummond, K. V. Kheruntsyan, D. J. Heinzen, and R. H. Wynar, Reply to“Comment on ‘Stimulated Raman adiabatic passage from an atomic to a molecularBose-Einstein condensate’ ”, Phys. Rev. A 71, 017602 (2005).
[Dum94] R. Dum, P. Marte, T. Pellizzari, and P. Zoller, Laser Cooling to a Single QuantumState in a Trap, Phys. Rev. Lett. 73, 2829 (1994).
[Ein24] A. Einstein, Quantentheorie des einatomigen idealen Gases I, Sitzungsberichte derPreussischen Akademie der Wissenschaften 21, 261 (1924).
[Ein25] A. Einstein, Quantentheorie des einatomigen idealen Gases II, Sitzungsberichteder Preussischen Akademie der Wissenschaften 1, 3 (1925).
[End12] M. Endres, T. Fukuhara, D. Pekker, M. Cheneau, P. Schauß, C. Gross, E. Dem-ler, S. Kuhr, and I. Bloch, The ‘Higgs’ amplitude mode at the two-dimensionalsuperfluid/Mott insulator transition 487, 454 (2012).
[Eno08] K. Enomoto, K. Kasa, M. Kitagawa, and Y. Takahashi, Optical Feshbach Reso-nance Using the Intercombination Transition, Phys. Rev. Lett. 101, 203201 (2008).
[Ess10] T. Esslinger, Fermi-Hubbard Physics with Atoms in an Optical Lattice, AnnualReview of Condensed Matter Physics 1, 129 (2010).
[Far10] D. M. Farkas, K. M. Hudek, E. A. Salim, S. R. Segal, M. B. Squires, and D. Z.Anderson, A compact, transportable, microchip-based system for high repetitionrate production of Bose–Einstein condensates, Applied Physics Letters 96, 093102(2010).
[Fed96a] P. O. Fedichev, Y. Kagan, G. V. Shlyapnikov, and J. T. M. Walraven, Influenceof nearly resonant light on the scattering length in low-temperature atomic gases,Phys. Rev. Lett. 77, 2913 (1996).
[Fed96b] P. O. Fedichev, M. W. Reynolds, and G. V. Shlyapnikov, Three-Body recombi-nation of ultracold atoms to a weakly bound s level, Phys. Rev. Lett. 77, 2921(1996).

226 Bibliography
[Fer] F. Ferlaino, S. Knoop, and R. Grimm, chap. 9 in [Kre09].
[Fer06a] G. Ferrari, R. E. Drullinger, N. Poli, F. Sorrentino, and G. M. Tino, Cooling of Srto high phase-space density by laser and sympathetic cooling in isotopic mixtures,Phys. Rev. A 73, 023408 (2006).
[Fer06b] G. Ferrari, N. Poli, F. Sorrentino, and G. M. Tino, Long-lived Bloch oscillationswith bosonic Sr atoms and application to gravity measurement at the micrometerscale, Phys. Rev. Lett. 97, 060402 (2006).
[Fey82] R. Feynman, Simulating Physics with Computers, International Journal of Theo-retical Physics 21, 467 (1982).
[FF10] M. Foss-Feig, M. Hermele, and A. M. Rey, Probing the Kondo lattice model withalkaline-earth-metal atoms, Phys. Rev. A 81, 051603 (2010).
[Flo] Private homepage of Florian Schreck, http://iqoqi006.uibk.ac.at/users/
c704250/lab/GlasscellMountingCompressed.pdf.
[Fol05] S. Folling, F. Gerbier, A. Widera, O. Mandel, T. Gericke, and I. Bloch, Spatialquantum noise interferometry in expanding ultracold atom clouds, Nature 434, 481(2005).
[Fol07] S. Folling, S. Trotzky, P. Cheinet, M. Feld, R. Saers, A. Widera, T. Muller, andI. Bloch, Direct observation of second-order atom tunnelling, Nature 448, 1029(2007).
[Fri11] J. Friebe, M. Riedmann, T. Wubbena, A. Pape, H. Kelkar, W. Ertmer, O. Terra,U. Sterr, S. Weyers, G. Grosche, H. Schnatz, and E. Rasel, Remote frequencymeasurement of the 1S0 → 3P1 transition in laser-cooled 24Mg, New Journal ofPhysics 13, 125010 (2011).
[Fri12] A. Frisch, K. Aikawa, M. Mark, A. Rietzler, J. Schindler, E. Zupanic, R. Grimm,and F. Ferlaino, Narrow-line magneto-optical trap for erbium, Phys. Rev. A 85,051401 (2012).
[Fuk07a] T. Fukuhara, S. Sugawa, and Y. Takahashi, Bose-Einstein condensation of anytterbium isotope, Phys. Rev. A 76, 051604(R) (2007).
[Fuk07b] T. Fukuhara, Y. Takasu, M. Kumakura, and Y. Takahashi, Degenerate Fermigases of ytterbium, Phys. Rev. Lett. 98, 030401 (2007).
[Fuk09a] T. Fukuhara, S. Sugawa, M. Sugimoto, S. Taie, and Y. Takahashi, Mott insulatorof ultracold alkaline-earth-metal-like atoms, Phys. Rev. A 79, 041604(R) (2009).
[Fuk09b] T. Fukuhara, S. Sugawa, Y. Takasu, and Y. Takahashi, All-optical formation ofquantum degenerate mixtures, Phys. Rev. A 79, 021601(R) (2009).

Bibliography 227
[Gao00] B. Gao, Zero-energy bound or quasibound states and their implications for diatomicsystems with an asymptotic van der Waals interaction, Phys. Rev. A 62, 050702(2000).
[Ger22] W. Gerlach and O. Stern, Der experimentelle Nachweis des magnetischen Momentsdes Silberatoms, Z. Phys. 8, 110 (1922).
[Ger10] F. Gerbier and J. Dalibard, Gauge fields for ultracold atoms in optical superlattices,New J. Phys. 12, 033007 (2010).
[Gio96] S. Giorgini, L. P. Pitaevskii, and S. Stringari, Condensate fraction and criticaltemperature of a trapped interacting Bose gas, Phys. Rev. A 54, R4633 (1996).
[Gio08] S. Giorgini, L. P. Pitaevskii, and S. Stringari, Theory of ultracold atomic Fermigases, Rev. Mod. Phys. 80, 1215 (2008).
[Gor02] K. Goral, L. Santos, and M. Lewenstein, Quantum Phases of Dipolar Bosons inOptical Lattices, Phys. Rev. Lett. 88, 170406 (2002).
[Gor08] A. V. Gorshkov, P. Rabl, G. Pupillo, A. Micheli, P. Zoller, M. D. Lukin, andH. P. Buchler, Suppression of Inelastic Collisions Between Polar Molecules Witha Repulsive Shield, Phys. Rev. Lett. 101, 073201 (2008).
[Gor09] A. V. Gorshkov, A. M. Rey, A. J. Daley, M. M. Boyd, J. Ye, P. Zoller, and M. D.Lukin, Alkaline-earth-metal atoms as few-qubit quantum registers, Phys. Rev. Lett.102, 110503 (2009).
[Gor10] A. Gorshkov, M. Hermele, V. Gurarie, C. Xu, P. Julienne, J. Ye, P. Zoller, E. Dem-ler, M. D. Lukin, and A. M. Rey, Two-orbital SU(N) magnetism with ultracoldalkaline-earth atoms, Nature Phys. 6, 289 (2010).
[Gor11a] A. Gorecka, B. Gremaud, and C. Miniatura, Synthetic magnetic fluxes on thehoneycomb lattice, Phys. Rev. A 84, 023604 (2011).
[Gor11b] A. V. Gorshkov, S. R. Manmana, G. Chen, E. Demler, M. D. Lukin, and A. M.Rey, Quantum magnetism with polar alkali-metal dimers, Phys. Rev. A 84, 033619(2011).
[Gra02] S. R. Granade, M. E. Gehm, K. M. O’Hara, and J. E. Thomas, All-Optical Pro-duction of a Degenerate Fermi Gas, Phys. Rev. Lett. 88, 120405 (2002).
[Gre01] M. Greiner, I. Bloch, O. Mandel, T. W. Hansch, and T. Esslinger, ExploringPhase Coherence in a 2D Lattice of Bose-Einstein Condensates, Phys. Rev. Lett.87, 160405 (2001).
[Gre02] M. Greiner, O. Mandel, T. Esslinger, T. W. Hansch, and I. Bloch, Quantum phasetransition from a superfluid to a Mott insulator in a gas of ultracold atoms, Nature415, 39 (2002).

228 Bibliography
[Gri93] G. F. Gribakin and V. V. Flambaum, Calculation of the scattering length in atomiccollisions using the semiclassical approximation, Phys. Rev. A 48, 546 (1993).
[Gri00] R. Grimm, M.Weidemuller, and Y. B. Ovchinnikov, Optical dipole traps for neutralatoms, Adv. At. Mol. Opt. Phys. 42, 95 (2000).
[Gri05] A. Griesmaier, J. Werner, S. Hensler, J. Stuhler, and T. Pfau, Bose-Einsteincondensation of chromium, Phys. Rev. Lett. 94, 160401 (2005).
[Gri06] P. F. Griffin, K. J. Weatherill, S. G. MacLeod, R. M. Potvliege, and C. S. Adams,Spatially selective loading of an optical lattice by light-shift engineering using anauxiliary laser field, New J. Phys. 8, 11 (2006).
[Gri08] R. Grimm, Proceedings of the International School of Physics “Enrico Fermi”,Course CLXIV, Varenna, 20-30 June 2006, chapter Ultracold Fermi gases in theBEC-BCS crossover: a review from the Innsbruck perspective (2008).
[Gru02] J. Grunert and A. Hemmerich, Sub-Doppler magneto-optical trap for calcium,Phys. Rev. A 65, 041401 (2002).
[Gue07] J. R. Guest, N. D. Scielzo, I. Ahmad, K. Bailey, J. P. Greene, R. J. Holt, Z.-T.Lu, T. P. O’Connor, and D. H. Potterveld, Laser Trapping of 225Ra and 226Rawith Repumping by Room-Temperature Blackbody Radiation, Phys. Rev. Lett. 98,093001 (2007).
[Gue10] R. Guerout, M. Aymar, and O. Dulieu, Ground state of the polar alkali-metal-atom-strontium molecules: Potential energy curve and permanent dipole moment,Phys. Rev. A 82, 042508 (2010).
[Hac08] H. Hachisu, K. Miyagishi, S. G. Porsev, A. Derevianko, V. D. Ovsiannikov, V. G.Pal’chikov, M. Takamoto, and H. Katori, Trapping of Neutral Mercury Atoms andProspects for Optical Lattice Clocks, Phys. Rev. Lett. 100, 053001 (2008).
[Had02] Z. Hadzibabic, C. A. Stan, K. Dieckmann, S. Gupta, M. W. Zwierlein, A. Gorlitz,and W. Ketterle, Two-Species Mixture of Quantum Degenerate Bose and FermiGases, Phys. Rev. Lett. 88, 160401 (2002).
[Haf08] H. Haffner, C. Roos, and R. Blatt, Quantum computing with trapped ions, PhysicsReports 469, 155 (2008).
[Hal98] D. S. Hall, M. R. Matthews, J. R. Ensher, C. E. Wieman, and E. A. Cornell,Dynamics of Component Separation in a Binary Mixture of Bose-Einstein Con-densates, Phys. Rev. Lett. 81, 1539 (1998).
[Hal12] P. Halder, C.-Y. Yang, and A. Hemmerich, Alternative route to Bose-Einsteincondensation of two-electron atoms, Phys. Rev. A 85, 031603 (2012).
Bibliography 229
[Ham98] S. E. Hamann, D. L. Haycock, G. Klose, P. H. Pax, I. H. Deutsch, and P. S. Jessen,Resolved-Sideband Raman Cooling to the Ground State of an Optical Lattice, Phys.Rev. Lett. 80, 4149 (1998).
[Han00] D.-J. Han, S. Wolf, S. Oliver, C. McCormick, M. T. DePue, and D. S. Weiss, 3DRaman Sideband Cooling of Cesium Atoms at High Density, Phys. Rev. Lett. 85,724 (2000).
[Han03] D. P. Hansen, J. R. Mohr, and A. Hemmerich, Magnetic trapping of metastablecalcium atoms, Phys. Rev. A 67, 021401(R) (2003).
[Han04] C. I. Hancox, S. C. Doret, M. T. Hummon, L. Luo, and J. M. Doyle, Magnetictrapping of rare-earth atoms at millikelvin temperatures, Nature 431, 281 (2004).
[Han05] D. Hansen and A. Hemmerich, Doppler-free spectroscopy of metastable calcium ina discharge heat pipe, Phys. Rev. A 72, 022502 (2005).
[Han06] D. Hansen and A. Hemmerich, Observation of Multichannel Collisions of ColdMetastable Calcium Atoms, Phys. Rev. Lett. 96, 073003 (2006).
[Han11] A. H. Hansen, A. Khramov, W. H. Dowd, A. O. Jamison, V. V. Ivanov, andS. Gupta, Quantum degenerate mixture of ytterbium and lithium atoms, Phys.Rev. A 84, 011606 (2011).
[Har11] H. Hara, Y. Takasu, Y. Yamaoka, J. M. Doyle, and Y. Takahashi, Quantum De-generate Mixtures of Alkali and Alkaline-Earth-Like Atoms, Phys. Rev. Lett. 106,205304 (2011).
[Hay07] D. Hayes, P. S. Julienne, and I. H. Deutsch, Quantum Logic via the ExchangeBlockade in Ultracold Collisions, Phys. Rev. Lett. 98, 070501 (2007).
[Haz12] K. R. A. Hazzard, V. Gurarie, M. Hermele, and A. M. Rey, High-temperatureproperties of fermionic alkaline-earth-metal atoms in optical lattices, Phys. Rev.A 85, 041604 (2012).
[Hei77] S. M. Heider and G. O. Brink, Hyperfine structure of 87Sr in the 3P2 metastablestate, Phys. Rev. A 16, 1371 (1977).
[Her09] M. Hermele, V. Gurarie, and A. M. Rey, Mott Insulators of Ultracold FermionicAlkaline Earth Atoms: Underconstrained Magnetism and Chiral Spin Liquid, Phys.Rev. Lett. 103, 135301 (2009).
[Hof76] D. R. Hofstadter, Energy levels and wave functions of Bloch electrons in rationaland irrational magnetic fields, Phys. Rev. B 14, 2239 (1976).
[Hon05] T. Hong, C. Cramer, E. Cook, W. Nagourney, and E. N. Fortson, Observation ofthe 1S0 - 3P0 transition in atomic ytterbium for optical clocks and qubit arrays,Optics Letters 30, 2644 (2005).

230 Bibliography
[Hop98] T. C. Hope, Transactions of the Royal Society of Edinburgh IV, no. II, 3 (1798).
[Hor06] M. Horikoshi and K. Nakagawa, Atom chip based fast production of BoseEinsteincondensate, Applied Physics B: Lasers and Optics 82, 363 (2006).
[Hua09] B. Huang, Linewidth Reduction of a Diode Laser by Optical Feedback for StrontiumBEC Applications, Master’s thesis, University of Innsbruck, Austria (2009).
[Hud06] E. R. Hudson, H. J. Lewandowski, B. C. Sawyer, and J. Ye, Cold Molecule Spec-troscopy for Constraining the Evolution of the Fine Structure Constant, Phys. Rev.Lett. 96, 143004 (2006).
[Hun11] H.-H. Hung, Y. Wang, and C. Wu, Quantum magnetism in ultracold alkali andalkaline-earth fermion systems with symplectic symmetry, Phys. Rev. B 84, 054406(2011).
[Ido00] T. Ido, Y. Isoya, and H. Katori, Optical-dipole trapping of Sr atoms at a highphase-space density, Phys. Rev. A 61, 061403 (2000).
[Ido03] T. Ido and H. Katori, Recoil-free spectroscopy of neutral Sr atoms in the Lamb-Dicke regime, Phys. Rev. Lett. 91, 053001 (2003).
[Ido05] T. Ido, T. H. Loftus, M. M. Boyd, A. D. Ludlow, K. W. Holman, and J. Ye,Precision Spectroscopy and Density-Dependent Frequency Shifts in Ultracold Sr,Phys. Rev. Lett. 94, 153001 (2005).
[Ing99] M. Inguscio, S. Stringari, and C. Wieman (Eds.), Bose-Einstein condensation inatomic gases, North Holland, Amsterdam (1999), Proceedings of the InternationalSchool of Physics “Enrico Fermi”, Course CXL, Varenna, 7-17 July 1998.
[Ing08] M. Inguscio, W. Ketterle, and C. Salomon (Eds.), Ultracold Fermi gases, IOSPress, Amsterdam (2008), Proceedings of the International School of Physics “En-rico Fermi”, Course CLXIV, Varenna, June 2006.
[Ino99] S. Inouye, A. P. Chikkatur, D. M. Stamper-Kurn, J. Stenger, D. E. Pritchard, andW. Ketterle, Superradiant Rayleigh Scattering from a Bose-Einstein Condensate,Science 285, 571 (1999).
[Jak98] D. Jaksch, C. Bruder, J. I. Cirac, C. W. Gardiner, and P. Zoller, Cold BosonicAtoms in Optical Lattices, Phys. Rev. Lett. 81, 3108 (1998).
[Jak02] D. Jaksch, V. Venturi, J. I. Cirac, C. J. Williams, and P. Zoller, Creation of aMolecular Condensate by Dynamically Melting a Mott Insulator, Phys. Rev. Lett.89, 040402 (2002).
[Jak03] D. Jaksch and P. Zoller, Creation of effective magnetic fields in optical lattices:the Hofstadter butterfly for cold neutral atoms, New J. Phys. 5, 56 (2003).

Bibliography 231
[Jen11] B. B. Jensen, H. Ming, P. G. Westergaard, K. Gunnarsson, M. H. Madsen, A. Br-usch, J. Hald, and J. W. Thomsen, Experimental Determination of the 24Mg I(3s3p)3P2 Lifetime, Phys. Rev. Lett. 107, 113001 (2011).
[Jo12] G.-B. Jo, J. Guzman, C. K. Thomas, P. Hosur, A. Vishwanath, and D. M.Stamper-Kurn, Ultracold Atoms in a Tunable Optical Kagome Lattice, Phys. Rev.Lett. 108, 045305 (2012).
[Jor08] R. Jordens, N. Strohmaier, K. Gunter, H. Moritz, and T. Esslinger, A Mott insu-lator of fermionic atoms in an optical lattice, Nature 455, 204 (2008).
[Jul] P. S. Julienne, private communication.
[Jul92] P. Julienne, A. Smith, and K. Burnett, Theory of Collisions between Laser CooledAtoms, Adv. At. Mol. Opt. Phys. 30, 141 (1992).
[Kag97] Y. Kagan, E. L. Surkov, and G. V. Shlyapnikov, Evolution of a Bose gas inanisotropic time-dependent traps, Phys. Rev. A 55, R18 (1997).
[Kap02] A. Kaplan, M. Fredslund Andersen, and N. Davidson, Suppression of inhomoge-neous broadening in rf spectroscopy of optically trapped atoms, Phys. Rev. A 66,045401 (2002).
[Kas92] M. Kasevich and S. Chu, Laser cooling below a photon recoil with three-level atoms,Phys. Rev. Lett. 69, 1741 (1992).
[Kat99] H. Katori, T. Ido, Y. Isoya, and M. Kuwata-Gonokami, Magneto-optical trappingand cooling of strontium atoms down to the photon recoil temperature, Phys. Rev.Lett. 82, 1116 (1999).
[Kat01] H. Katori, T. Ido, Y. Isoya, and M. Kuwata-Gonokami, Laser cooling of strontiumatoms toward quantum degeneracy, in E. Arimondo, P. DeNatale, and M. Inguscio(Eds.), Atomic Physics 17, 382–396, American Institute of Physics, Woodbury(2001).
[Ket93] W. Ketterle, K. B. Davis, M. A. Joffe, A. Martin, and D. E. Pritchard, Highdensities of cold atoms in a dark spontaneous-force optical trap, Phys. Rev. Lett.70, 2253 (1993).
[Ket96] W. Ketterle and N. J. van Druten, Evaporative Cooling of Trapped Atoms, Adv.Atom. Mol. Opt. Phys. 37, 181 (1996).
[Kil07a] T. C. Killian, Ultracold Neutral Plasmas, Science 316, 705 (2007).
[Kil07b] T. C. Killian, T. Pattard, T. Pohl, and J. M. Rost, Ultracold neutral plasmas,Phys. Rep. 449, 77 (2007).
[Kin05] T. Kinoshita, T. Wenger, and D. S. Weiss, All-optical Bose-Einstein condensationusing a compressible crossed dipole trap, Phys. Rev. A 71, 011602 (2005).
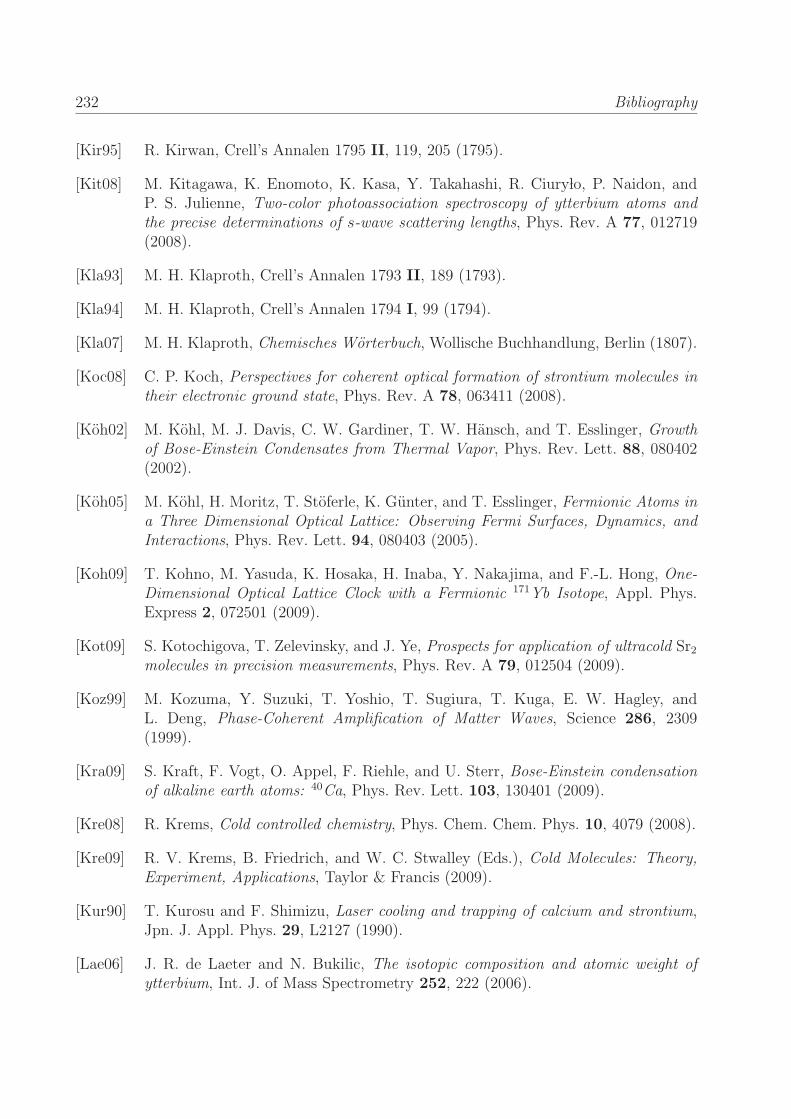
232 Bibliography
[Kir95] R. Kirwan, Crell’s Annalen 1795 II, 119, 205 (1795).
[Kit08] M. Kitagawa, K. Enomoto, K. Kasa, Y. Takahashi, R. Ciury�lo, P. Naidon, andP. S. Julienne, Two-color photoassociation spectroscopy of ytterbium atoms andthe precise determinations of s-wave scattering lengths, Phys. Rev. A 77, 012719(2008).
[Kla93] M. H. Klaproth, Crell’s Annalen 1793 II, 189 (1793).
[Kla94] M. H. Klaproth, Crell’s Annalen 1794 I, 99 (1794).
[Kla07] M. H. Klaproth, Chemisches Worterbuch, Wollische Buchhandlung, Berlin (1807).
[Koc08] C. P. Koch, Perspectives for coherent optical formation of strontium molecules intheir electronic ground state, Phys. Rev. A 78, 063411 (2008).
[Koh02] M. Kohl, M. J. Davis, C. W. Gardiner, T. W. Hansch, and T. Esslinger, Growthof Bose-Einstein Condensates from Thermal Vapor, Phys. Rev. Lett. 88, 080402(2002).
[Koh05] M. Kohl, H. Moritz, T. Stoferle, K. Gunter, and T. Esslinger, Fermionic Atoms ina Three Dimensional Optical Lattice: Observing Fermi Surfaces, Dynamics, andInteractions, Phys. Rev. Lett. 94, 080403 (2005).
[Koh09] T. Kohno, M. Yasuda, K. Hosaka, H. Inaba, Y. Nakajima, and F.-L. Hong, One-Dimensional Optical Lattice Clock with a Fermionic 171Yb Isotope, Appl. Phys.Express 2, 072501 (2009).
[Kot09] S. Kotochigova, T. Zelevinsky, and J. Ye, Prospects for application of ultracold Sr2molecules in precision measurements, Phys. Rev. A 79, 012504 (2009).
[Koz99] M. Kozuma, Y. Suzuki, T. Yoshio, T. Sugiura, T. Kuga, E. W. Hagley, andL. Deng, Phase-Coherent Amplification of Matter Waves, Science 286, 2309(1999).
[Kra09] S. Kraft, F. Vogt, O. Appel, F. Riehle, and U. Sterr, Bose-Einstein condensationof alkaline earth atoms: 40Ca, Phys. Rev. Lett. 103, 130401 (2009).
[Kre08] R. Krems, Cold controlled chemistry, Phys. Chem. Chem. Phys. 10, 4079 (2008).
[Kre09] R. V. Krems, B. Friedrich, and W. C. Stwalley (Eds.), Cold Molecules: Theory,Experiment, Applications, Taylor & Francis (2009).
[Kur90] T. Kurosu and F. Shimizu, Laser cooling and trapping of calcium and strontium,Jpn. J. Appl. Phys. 29, L2127 (1990).
[Lae06] J. R. de Laeter and N. Bukilic, The isotopic composition and atomic weight ofytterbium, Int. J. of Mass Spectrometry 252, 222 (2006).

Bibliography 233
[Lah05] T. Lahaye, Z. Wang, G. Reinaudi, S. P. Rath, J. Dalibard, and D. Guery-Odelin,Evaporative cooling of a guided rubidium atomic beam, Phys. Rev. A 72, 033411(2005).
[Lah08] T. Lahaye, J. Metz, B. Frohlich, T. Koch, M. Meister, A. Griesmaier, T. Pfau,H. Saito, Y. Kawaguchi, and M. Ueda, d-wave collapse and explosion of a dipolarBose-Einstein condensate, Phys. Rev. Lett. 101, 080401 (2008).
[Lan08] F. Lang, K. Winkler, C. Strauss, R. Grimm, and J. Hecker Denschlag, UltracoldTriplet Molecules in the Rovibrational Ground State, Phys. Rev. Lett. 101, 133005(2008).
[Lem09a] N. D. Lemke, A. D. Ludlow, Z. W. Barber, T. M. Fortier, S. A. Diddams, Y. Jiang,S. R. Jefferts, T. P. Heavner, T. E. Parker, and C. W. Oates, Spin-1/2 OpticalLattice Clock, Phys. Rev. Lett. 103, 063001 (2009).
[Lem09b] P. Lemonde, Optical lattice clocks, Eur. Phys. J. Special Topics 172, 81 (2009).
[Ler11] A. Lercher, T. Takekoshi, M. Debatin, B. Schuster, R. Rameshan, F. Ferlaino,R. Grimm, and H. Nagerl, Production of a dual-species Bose-Einstein condensateof Rb and Cs atoms, EPJD 65, 3 (2011).
[Let88] P. D. Lett, R. N. Watts, C. I. Westbrook, W. D. Phillips, P. L. Gould, and H. J.Metcalf, Observation of Atoms Laser Cooled below the Doppler Limit, Phys. Rev.Lett. 61, 169 (1988).
[Lin09] Y.-J. Lin, R. L. Compton, K. Jimenez-Garcia, J. V. Porto, and I. B. Spielman,Synthetic magnetic fields for ultracold neutral atoms, Nature 462, 628 (2009).
[Lin11] Y.-J. Lin, K. Jimenez-Garcia, and I. B. Spielman, Spin-orbit-coupled Bose-Einsteincondensates, Nature 471, 83 (2011).
[Lis09] C. Lisdat, J. S. R. Vellore Winfred, T. Middelmann, F. Riehle, and U. Sterr,Collisional Losses, Decoherence, and Frequency Shifts in Optical Lattice Clockswith Bosons, Phys. Rev. Lett. 103, 090801 (2009).
[Llo96] S. Lloyd, Universal Quantum Simulators, Science 273, 1073 (1996).
[Lof02] T. Loftus, J. R. Bochinski, and T. W. Mossberg, Magnetic trapping of ytterbiumand the alkaline-earth metals, Phys. Rev. A 66, 013411 (2002).
[Lof04a] T. H. Loftus, T. Ido, M. M. Boyd, A. D. Ludlow, and J. Ye, Narrow line coolingand momentum-space crystals, Phys. Rev. A 70, 063413 (2004).
[Lof04b] T. H. Loftus, T. Ido, A. D. Ludlow, M. M. Boyd, and J. Ye, Narrow Line Cooling:Finite Photon Recoil Dynamics, Phys. Rev. Lett. 93, 073003 (2004).
[Lu11a] M. Lu, N. Q. Burdick, S. H. Youn, and B. L. Lev, Strongly Dipolar Bose-EinsteinCondensate of Dysprosium, Phys. Rev. Lett. 107, 190401 (2011).

234 Bibliography
[Lu11b] M. Lu, S. H. Youn, and B. L. Lev, Spectroscopy of a narrow-line laser-coolingtransition in atomic dysprosium, Phys. Rev. A 83, 012510 (2011).
[Lud08a] A. D. Ludlow, The Strontium Optical Lattice Clock: Optical Spectroscopy withSub-Hertz Accuracy, Ph.D. thesis, University of Colorado, Boulder, USA (2008).
[Lud08b] A. D. Ludlow, T. Zelevinsky, G. K. Campbell, S. Blatt, M. M. Boyd, M. H. G.de Miranda, M. J. Martin, J. W. Thomsen, S. M. Foreman, J. Ye, T. M. Fortier,J. E. Stalnaker, S. A. Diddams, Y. Le Coq, Z. W. Barber, N. Poli, N. D. Lemke,K. M. Beck, and C. W. Oates, Sr Lattice Clock at 1× 10¹⁶ Fractional Uncertaintyby Remote Optical Evaluation with a Ca Clock, Science 319, 1805 (2008).
[Mac00] M. Mackie, R. Kowalski, and J. Javanainen, Bose-Stimulated Raman AdiabaticPassage in Photoassociation, Phys. Rev. Lett. 84, 3803 (2000).
[Mac05] M. Mackie, A. Collin, and J. Javanainen, Comment on “Stimulated Raman adi-abatic passage from an atomic to a molecular Bose-Einstein condensate”, Phys.Rev. A 71, 017601 (2005).
[Mad00] K. W. Madison, F. Chevy, W. Wohlleben, and J. Dalibard, Vortex Formation ina Stirred Bose-Einstein Condensate, Phys. Rev. Lett. 84, 806 (2000).
[Man03] O. Mandel, M. Greiner, A. Widera, T. Rom, T. W. Hansch, and I. Bloch, CoherentTransport of Neutral Atoms in Spin-Dependent Optical Lattice Potentials, Phys.Rev. Lett. 91, 010407 (2003).
[Man11] S. R. Manmana, K. R. A. Hazzard, G. Chen, A. E. Feiguin, and A. M. Rey, SU(N)magnetism in chains of ultracold alkaline-earth-metal atoms: Mott transitions andquantum correlations, Phys. Rev. A 84, 043601 (2011).
[Mar] M.J. Martin, private communication.
[Mar08] Y. N. Martinez de Escobar, P. G. Mickelson, P. Pellegrini, S. B. Nagel, A. Traverso,M. Yan, R. Cote, and T. C. Killian, Two-photon photoassociative spectroscopy ofultracold 88Sr, Phys. Rev. A 78, 062708 (2008).
[Mar09a] Y. N. Martinez de Escobar, P. G. Mickelson, M. Yan, B. J. DeSalvo, S. B. Nagel,and T. C. Killian, Bose-Einstein Condensation of 84Sr, Phys. Rev. Lett. 103,200402 (2009).
[Mar09b] Y. N. Martinez de Escobar, P. G. Mickelson, M. Yan, and T. C. Killian, Modifica-tion of atom scattering using an intercombination-line optical Feshbach resonanceat large detuning, arXiv:0906.1837v1, v3 (2009).
[Mat98] M. R. Matthews, D. S. Hall, D. S. Jin, J. R. Ensher, C. E. Wieman, E. A. Cornell,F. Dalfovo, C. Minniti, and S. Stringari, Dynamical Response of a Bose-EinsteinCondensate to a Discontinuous Change in Internal State, Phys. Rev. Lett. 81, 243(1998).

Bibliography 235
[Mat99] M. R. Matthews, B. P. Anderson, P. C. Haljan, D. S. Hall, C. E. Wieman, andE. A. Cornell, Vortices in a Bose-Einstein Condensate, Phys. Rev. Lett. 83, 2498(1999).
[McC06] J. J. McClelland and J. L. Hanssen, Laser Cooling without Repumping: AMagneto-Optical Trap for Erbium Atoms, Phys. Rev. Lett. 96, 143005 (2006).
[McK11] D. McKay and B. DeMarco, Cooling in strongly correlated optical lattices:prospects and challenges, Reports on Progress in Physics 74, 054401 (2011).
[McN06] J. M. McNamara, T. Jeltes, A. S. Tychkov, W. Hogervorst, and W. Vassen, De-generate Bose-Fermi Mixture of Metastable Atoms, Phys. Rev. Lett. 97, 080404(2006).
[Med11] P. Medley, D. M. Weld, H. Miyake, D. E. Pritchard, and W. Ketterle, Spin Gra-dient Demagnetization Cooling of Ultracold Atoms, Phys. Rev. Lett. 106, 195301(2011).
[Met99] H. J. Metcalf and P. van der Straten, Laser Cooling and Trapping, Springer, NewYork (1999).
[Mew97] M.-O. Mewes, M. R. Andrews, D. M. Kurn, D. S. Durfee, C. G. Townsend, andW. Ketterle, Output Coupler for Bose-Einstein Condensed Atoms, Phys. Rev.Lett. 78, 582 (1997).
[Mic05] P. G. Mickelson, Y. N. Martinez, A. D. Saenz, S. B. Nagel, Y. C. Chen, T. C.Killian, P. Pellegrini, and R. Cote, Spectroscopic Determination of the s-WaveScattering Lengths of 86Sr and 88Sr, Phys. Rev. Lett. 95, 223002 (2005).
[Mic06] A. Micheli, G. K. Brennen, and P. Zoller, A toolbox for lattice-spin models withpolar molecules, Nature Phys. 2, 341 (2006).
[Mic07] A. Micheli, G. Pupillo, H. P. Buchler, and P. Zoller, Cold polar molecules in two-dimensional traps: Tailoring interactions with external fields for novel quantumphases, Phys. Rev. A 76, 043604 (2007).
[Mic09] P. G. Mickelson, Y. N. Martinez de Escobar, P. Anzel, B. J. DeSalvo, S. B. Nagel,A. J. Traverso, M. Yan, and T. C. Killian, Repumping and spectroscopy of laser-cooled Sr atoms using the (5s5p)3P2 − (5s4d)3D2 transition, J. Phys. B: At. Mol.Opt. Phys. 42, 235001 (2009).
[Mic10] P. G. Mickelson, Y. N. Martinez de Escobar, M. Yan, B. J. DeSalvo, and T. C.Killian, Bose-Einstein condensation of 88Sr through sympathetic cooling with 87Sr,Phys. Rev. A 81, 051601 (2010).
[Mid12] T. Middelmann, S. Falke, C. Lisdat, and U. Sterr, High accuracy correction ofblackbody radiation shift in an optical lattice clock, arXiv:1208.2848v1 (2012).

236 Bibliography
[Mil10] J. Millen, G. Lochead, and M. P. A. Jones, Two-Electron Excitation of an Inter-acting Cold Rydberg Gas, Phys. Rev. Lett. 105, 213004 (2010).
[Mod02] G. Modugno, M. Modugno, F. Riboli, G. Roati, and M. Inguscio, Two AtomicSpecies Superfluid, Phys. Rev. Lett. 89, 190404 (2002).
[Mon93] C. R. Monroe, E. A. Cornell, C. A. Sackett, C. J. Myatt, and C. E. Wieman,Measurement of Cs-Cs elastic scattering at T =30 μK, Phys. Rev. Lett. 70, 414(1993).
[Mor98] G. Morigi, J. I. Cirac, K. Ellinger, and P. Zoller, Laser cooling of trapped atomsto the ground state: A dark state in position space, Phys. Rev. A 57, 2909 (1998).
[Muk03] T. Mukaiyama, H. Katori, T. Ido, Y. Li, and M. Kuwata-Gonokami, Recoil-limitedlaser cooling of 87Sr atoms near the Fermi temperature, Phys. Rev. Lett. 90, 113002(2003).
[Nag03] S. B. Nagel, C. E. Simien, S. Laha, P. Gupta, V. S. Ashoka, and T. C. Killian, Mag-netic trapping of metastable 3P2 atomic strontium, Phys. Rev. A 67, 011401(R)(2003).
[Nag05] S. B. Nagel, P. G. Mickelson, A. D. Saenz, Y. N. Martinez, Y. C. Chen, T. C.Killian, P. Pellegrini, and R. Cote, Photoassociative Spectroscopy at Long Rangein Ultracold Strontium, Phys. Rev. Lett. 94, 083004 (2005).
[Nem09] N. Nemitz, F. Baumer, F. Munchow, S. Tassy, and A. Gorlitz, Production ofheteronuclear molecules in an electronically excited state by photoassociation in amixture of ultracold Yb and Rb, Phys. Rev. A 79, 061403 (2009).
[Ni08] K.-K. Ni, S. Ospelkaus, M. H. G. de Miranda, A. Pe’er, B. Neyenhuis, J. J. Zirbel,S. Kotochigova, P. S. Julienne, D. S. Jin, and J. Ye, A High Phase-Space-DensityGas of Polar Molecules, Science 322, 231 (2008).
[Ni10] K. K. Ni, S. Ospelkaus, D. Wang, G. Quemener, B. Neyenhuis, M. H. G. deMiranda, J. L. Bohn, J. Ye, and D. S. Jin, Dipolar collisions of polar molecules inthe quantum regime, Nature 464, 1324 (2010).
[Nic12] T. Nicholson, M. Martin, J. Williams, B. Bloom, M. Bishof, M. Swallows, S. Camp-bell, and J. Ye, Comparison of Two Independent Sr Optical Clocks with 1× 10⁻¹⁷
Stability at 103 s, arXiv:1210.0064v1 (2012).
[NIS] The National Institute of Standards and Technology (NIST) database, availableonline at http://www.nist.gov/pml/data.
[Ols96] M. Olshanii, Y. Castin, and J. Dalibard, A model for an atom laser, in M. Inguscio,M. Allegrini, and A. Sasso (Eds.), Proceedings of the 12th International Conferenceon Laser Spectroscopy, 7, World Scientific, Singapore (1996).

Bibliography 237
[Ovc99] Y. B. Ovchinnikov, J. H. Muller, M. R. Doery, E. J. D. Vredenbregt, K. Helmer-son, S. L. Rolston, and W. D. Phillips, Diffraction of a Released Bose-EinsteinCondensate by a Pulsed Standing Light Wave, Phys. Rev. Lett. 83, 284 (1999).
[Pap08] S. B. Papp, J. M. Pino, and C. E. Wieman, Tunable Miscibility in a Dual-SpeciesBose-Einstein Condensate, Phys. Rev. Lett. 101, 040402 (2008).
[Par] Chang Yong Park et al., Optical repumping of triplet-P states enhances magneto-optical trapping of ytterbium atoms, Poster at ICAP 2012.
[Pol05a] N. Poli, Raffreddamento ed intrappolamento di atomi di stronzio: verso un nuovostandard di frequenza nella regione ottica, Ph.D. thesis, Universita degli studi diFirenze, Florence, Italy (2005).
[Pol05b] N. Poli, R. E. Drullinger, G. Ferrari, J. Leonard, F. Sorrentino, and G. M. Tino,Cooling and trapping of ultracold strontium isotopic mixtures, Phys. Rev. A 71,061403 (2005).
[Pol09] S. E. Pollack, D. Dries, and R. G. Hulet, Universality in three- and four-body boundstates of ultracold atoms, Science 326, 1683 (2009).
[Pol11] N. Poli, F.-Y. Wang, M. G. Tarallo, A. Alberti, M. Prevedelli, and G. M. Tino,Precision Measurement of Gravity with Cold Atoms in an Optical Lattice andComparison with a Classical Gravimeter, Phys. Rev. Lett. 106, 038501 (2011).
[Por08] S. G. Porsev, A. D. Ludlow, M. M. Boyd, and J. Ye, Determination of Sr propertiesfor a high-accuracy optical clock, Phys. Rev. A 78, 032508 (2008).
[Pup] G. Pupillo, A. Micheli, H. P. Buchler, and P. Zoller, chap. 12 in [Kre09].
[QV05] A. Quessada-Vial, Developpement d’une horloge optique a atomes de strontiumpieges: realisation d’un laser ultra-stabile et stabilite de frequence, Ph.D. thesis,Universite de Paris VI, Paris, France (2005).
[Reh07] N. Rehbein, T. E. Mehlstaubler, J. Keupp, K. Moldenhauer, E. M. Rasel, W. Ert-mer, A. Douillet, V. Michels, S. G. Porsev, A. Derevianko, C. Froese Fischer, G. I.Tachiev, and V. G. Pal’chikov, Optical quenching of metastable magnesium, Phys.Rev. A 76, 043406 (2007).
[Rei09] I. Reichenbach, P. S. Julienne, and I. H. Deutsch, Controlling nuclear spin ex-change via optical Feshbach resonances in 171Y b, Phys. Rev. A 80, 020701 (2009).
[Rei12] G. Reinaudi, C. B. Osborn, M. McDonald, S. Kotochigova, and T. Zelevinsky, Op-tical Production of Stable Ultracold 88Sr2 Molecules, Phys. Rev. Lett. 109, 115303(2012).
[Rit07] S. Ritter, A. Ottl, T. Donner, T. Bourdel, M. Kohl, and T. Esslinger, Observingthe Formation of Long-Range Order during Bose-Einstein Condensation, Phys.Rev. Lett. 98, 090402 (2007).

238 Bibliography
[Roa02] G. Roati, F. Riboli, G. Modugno, and M. Inguscio, Fermi-Bose Quantum De-generate K-Rb Mixture with Attractive Interaction, Phys. Rev. Lett. 89, 150403(2002).
[Rom01] M. V. Romalis, W. C. Griffith, J. P. Jacobs, and E. N. Fortson, New Limit on thePermanent Electric Dipole Moment of 199Hg, Phys. Rev. Lett. 86, 2505 (2001).
[Rup95] P. A. Ruprecht, M. J. Holland, K. Burnett, and M. Edwards, Time-dependentsolution of the nonlinear Schrodinger equation for Bose-condensed trapped neutralatoms, Phys. Rev. A 51, 4704 (1995).
[San67] P. G. H. Sandars, Measurability of the Proton Electric Dipole Moment, Phys. Rev.Lett. 19, 1396 (1967).
[San99] L. Santos and M. Lewenstein, Dynamical cooling of trapped gases. II: Many-atomproblem, Phys. Rev. A 60, 3851 (1999).
[San00] L. Santos, G. V. Shlyapnikov, P. Zoller, and M. Lewenstein, Bose-Einstein Con-densation in Trapped Dipolar Gases, Phys. Rev. Lett. 85, 1791 (2000).
[San04] R. Santra, K. V. Christ, and C. H. Greene, Properties of metastable alkaline-earth-metal atoms calculated using an accurate effective core potential, Phys. Rev. A 69,042510 (2004).
[San11] R. M. Sandner, M. Muller, A. J. Daley, and P. Zoller, Spatial Pauli blocking ofspontaneous emission in optical lattices, Phys. Rev. A 84, 043825 (2011).
[Sch01] F. Schreck, L. Khaykovich, K. L. Corwin, G. Ferrari, T. Bourdel, J. Cubizolles,and C. Salomon, Quasipure Bose-Einstein Condensate Immersed in a Fermi Sea,Phys. Rev. Lett. 87, 080403 (2001).
[Sch02] F. Schreck, Mixtures of ultracold gases: Fermi sea and Bose-Einstein condensateof lithium isotopes, Ph.D. thesis, Universite de Paris VI, Paris, France (2002).
[Sch04] V. Schweikhard, I. Coddington, P. Engels, V. P. Mogendorff, and E. A. Cornell,Rapidly Rotating Bose-Einstein Condensates in and near the Lowest Landau Level,Phys. Rev. Lett. 92, 040404 (2004).
[Sch08] U. Schneider, L. Hackermuller, S. Will, T. Best, I. Bloch, T. A. Costi, R. W.Helmes, D. Rasch, and A. Rosch, Metallic and Insulating Phases of RepulsivelyInteracting Fermions in a 3D Optical Lattice, Science 322, 204 (2008).
[Sen94] K. Sengstock, U. Sterr, J. H. Mller, V. Rieger, D. Bettermann, and W. Ertmer,Optical Ramsey spectroscopy on laser-trapped and thermal Mg atoms, App. Phys.B 59, 99 (1994).
[Ses91] D. W. Sesko, T. G. Walker, and C. E. Wieman, Behavior of neutral atoms in aspontaneous force trap, J. Opt. Soc. Am. B 8, 946 (1991).

Bibliography 239
[She10] J. F. Sherson, C. Weitenberg, M. Endres, M. Cheneau, I. Bloch, and S. Kuhr,Single-atom-resolved fluorescence imaging of an atomic Mott insulator, Nature467, 68 (2010).
[She12] J. A. Sherman, N. D. Lemke, N. Hinkley, M. Pizzocaro, R. W. Fox, A. D. Lud-low, and C. W. Oates, High-Accuracy Measurement of Atomic Polarizability in anOptical Lattice Clock, Phys. Rev. Lett. 108, 153002 (2012).
[Shi09] N. Shiga, Y. Li, H. Ito, S. Nagano, T. Ido, K. Bielska, R. S. Trawinski, andR. Ciury�lo, Buffer-gas-induced collision shift for the 88Sr 1S0-
3P 1 clock transition,Phys. Rev. A 80, 030501 (2009).
[Shu10] E. S. Shuman, J. F. Barry, and D. DeMille, Laser cooling of a diatomic molecule,Nature 467, 820 (2010).
[Sil05] C. Silber, S. Gunther, C. Marzok, B. Deh, P. W. Courteille, and C. Zimmermann,Quantum-Degenerate Mixture of Fermionic Lithium and Bosonic Rubidium Gases,Phys. Rev. Lett. 95, 170408 (2005).
[Sim04] C. E. Simien, Y. C. Chen, P. Gupta, S. Laha, Y. N. Martinez, P. G. Mickelson,S. B. Nagel, and T. C. Killian, Using Absorption Imaging to Study Ion Dynamicsin an Ultracold Neutral Plasma, Phys. Rev. Lett. 92, 143001 (2004).
[SK98a] D. M. Stamper-Kurn, M. R. Andrews, A. P. Chikkatur, S. Inouye, H.-J. Miesner,J. Stenger, and W. Ketterle, Optical Confinement of a Bose-Einstein Condensate,Phys. Rev. Lett. 80, 2027 (1998).
[SK98b] D. M. Stamper-Kurn, H.-J. Miesner, A. P. Chikkatur, S. Inouye, J. Stenger, andW. Ketterle, Reversible Formation of a Bose-Einstein Condensate, Phys. Rev.Lett. 81, 2194 (1998).
[Sko12] W. Skomorowski, F. Pawlowski, C. P. Koch, and R. Moszynski, Rovibrationaldynamics of the strontium molecule in the A1Σ+
u , c3Πu, and a3Σ+u manifold from
state-of-the-art ab initio calculations, J. Chem. Phys. 136, 194306 (2012).
[Sla64] J. C. Slater, Atomic Radii in Crystals, Journal of Chemical Physics 41, 3199(1964).
[Sle92] T. Sleator, T. Pfau, V. Balykin, O. Carnal, and J. Mlynek, Experimental demon-stration of the optical Stern-Gerlach effect, Phys. Rev. Lett. 68, 1996 (1992).
[Sor06] F. Sorrentino, G. Ferrari, N. Poli, R. Drullinger, and G. M. Tino, Laser cooling andtrapping of atomic strontium for ultracold atom physics, high precision spectrosopyand quantum sensors, Modern Physics Letters B 20, 1287 (2006).
[Spr95] R. J. C. Spreeuw, T. Pfau, U. Janicke, and M. Wilkens, Laser-like Scheme forAtomic Matter Waves, Europhys. Lett. 32, 469 (1995).

240 Bibliography
[Ste] S. Stellmer et al., to be published.
[Ste04] U. Sterr, C. Degenhardt, H. Stoehr, C. Lisdat, H. Schnatz, J. Helmcke, F. Riehle,G. Wilpers, C. Oates, and L. Hollberg, The optical calcium frequency standards ofPTB and NIST, C.R. Physique 5, 845 (2004).
[Ste08] A. Stein, H. Knockel, and E. Tiemann, Fourier-transform spectroscopy of Sr2 andrevised ground-state potential, Phys. Rev. A 78, 042508 (2008).
[Ste09] S. Stellmer, M. K. Tey, B. Huang, R. Grimm, and F. Schreck, Bose-Einsteincondensation of strontium, Phys. Rev. Lett. 103, 200401 (2009).
[Ste10a] A. Stein, H. Knockel, and E. Tiemann, The 1S+1S asymptote of Sr2 studied byFourier-transform spectroscopy, Eur. Phys. J. D 57, 171 (2010).
[Ste10b] S. Stellmer, M. K. Tey, R. Grimm, and F. Schreck, Bose-Einstein condensation of86Sr, Phys. Rev. A 82, 041602 (2010).
[Ste11] S. Stellmer, R. Grimm, and F. Schreck, Detection and manipulation of nuclearspin states in fermionic strontium, Phys. Rev. A 84, 043611 (2011).
[Ste12] S. Stellmer, B. Pasquiou, R. Grimm, and F. Schreck, Creation of Ultracold Sr2Molecules in the Electronic Ground State, Phys. Rev. Lett. 109, 115302 (2012).
[Sto08] R. Stock, N. S. Babcock, M. G. Raizen, and B. C. Sanders, Entanglement ofgroup-II-like atoms with fast measurement for quantum information processing,Phys. Rev. A 78, 022301 (2008).
[Str11] J. Struck, C. Olschlager, R. Le Targat, P. Soltan-Panahi, A. Eckardt, M. Lewen-stein, P. Windpassinger, and K. Sengstock, Quantum Simulation of FrustratedClassical Magnetism in Triangular Optical Lattices 333, 996 (2011).
[Stu12] B. K. Stuhl, M. T. Hummon, M. Yeo, G. Quemener, J. L. Bohn, and J. Ye,Evaporative cooling of the dipolar radical OH, arXiv:1209.6343v1 (2012).
[Sug11] S. Sugawa, R. Yamazaki, S. Taie, and Y. Takahashi, Bose-Einstein condensate ingases of rare atomic species, Phys. Rev. A 84, 011610 (2011).
[Suk10] D. Sukachev, A. Sokolov, K. Chebakov, A. Akimov, S. Kanorsky, N. Kolachevsky,and V. Sorokin, Magneto-optical trap for thulium atoms, Phys. Rev. A 82, 011405(2010).
[Sul] F. G. Sulzer, Uber den Strontianit, letter to J. F. Blumenbach (1791), printede.g. inMagazin fur das Neueste aus der Physik und Naturgeschichte, VII, 3. (1807).
[Tai10] S. Taie, Y. Takasu, S. Sugawa, R. Yamazaki, T. Tsujimoto, R. Murakami, andY. Takahashi, Realization of a SU(2) × SU(6) System of Fermions in a ColdAtomic Gas, Phys. Rev. Lett. 105, 190401 (2010).

Bibliography 241
[Tai12] S. Taie, R. Yamazaki, S. Sugawa, and Y. Takahashi, An SU(6) Mott insulatorof an atomic Fermi gas realized by large-spin Pomeranchuk cooling, Nature Phys.(2012).
[Tak03] Y. Takasu, K. Maki, K. Komori, T. Takano, K. Honda, M. Kumakura,T. Yabuzaki, and Y. Takahashi, Spin-singlet Bose-Einstein condensation of two-electron atoms, Phys. Rev. Lett. 91, 040404 (2003).
[Tak05] M. Takamoto, F.-L. Hong, R. Higashi, and H. Katori, An optical lattice clock,Nature 435, 321 (2005).
[Tak10] H. Takeuchi, S. Ishino, and M. Tsubota, Binary Quantum Turbulence Arisingfrom Countersuperflow Instability in Two-Component Bose-Einstein Condensates,Phys. Rev. Lett. 105, 205301 (2010).
[Tar12] L. Tarruell, D. Greif, T. Uehlinger, G. Jotzu, and T. Esslinger, Creating, movingand merging Dirac points with a Fermi gas in a tunable honeycomb lattice, Nature483, 302 (2012).
[TE12] A. Trabesinger (Ed.), Nature Physics Insight - Quantum Simulation, in NaturePhys. 8, no. 4 (2012).
[Tey10] M. K. Tey, S. Stellmer, R. Grimm, and F. Schreck, Double-degenerate Bose-Fermimixture of strontium, Phys. Rev. A 82, 011608 (2010).
[The04] M. Theis, G. Thalhammer, K. Winkler, M. Hellwig, G. Ruff, R. Grimm, andJ. H. Denschlag, Tuning the Scattering Length with an Optically Induced FeshbachResonance, Phys. Rev. Lett. 93, 123001 (2004).
[Tho95] J. Thomas and L. Wang, Precision position measurement of moving atoms, Phys.Rep. 262, 311 (1995).
[Tim98] E. Timmermans and R. Cote, Superfluidity in Sympathetic Cooling with AtomicBose-Einstein Condensates, Phys. Rev. Lett. 80, 3419 (1998).
[Tom11] M. Tomza, F. Paw�lowski, M. Jeziorska, C. P. Koch, and R. Moszynski, Formationof ultracold SrYb molecules in an optical lattice by photoassociation spectroscopy:theoretical prospects, Phys. Chem. Chem. Phys. 13, 18893 (2011).
[Tra09] A. Traverso, R. Chakraborty, Y. N. Martinez de Escobar, P. G. Mickelson, S. B.Nagel, M. Yan, and T. C. Killian, Inelastic and elastic collision rates for tripletstates of ultracold strontium, Phys. Rev. A 79, 060702(R) (2009).
[Tre07] A. Trenkwalder, Design of a Resonator Enhanced Optical Dipole Trap forFermionic Mixtures, Master’s thesis, University of Innsbruck, Austria (2007).
[Tre11] A. Trenkwalder, C. Kohstall, M. Zaccanti, D. Naik, A. I. Sidorov, F. Schreck,and R. Grimm, Hydrodynamic Expansion of a Strongly Interacting Fermi-FermiMixture, Phys. Rev. Lett. 106, 115304 (2011).

242 Bibliography
[Tro08] S. Trotzky, P. Cheinet, S. Folling, M. Feld, U. Schnorrberger, A. M. Rey,A. Polkovnikov, E. A. Demler, M. D. Lukin, and I. Bloch, Time-Resolved Obser-vation and Control of Superexchange Interactions with Ultracold Atoms in OpticalLattices, Science 319, 295 (2008).
[Tru01] A. G. Truscott, K. E. Strecker, W. I. McAlexander, G. B. Partridge, and R. G.Hulet, Observation of Fermi Pressure in a Gas of Trapped Atoms, Science 291,2570 (2001).
[Vil11] P. Villwock, S. Siol, and T. Walther, Magneto-optical trapping of neutral mercury,Eur. Phys. J. D 65, 251 (2011).
[Vit01] N. V. Vitanov, T. Halfmann, B. W. Shore, and K. Bergmann, Laser-Induced Pop-ulation Transfer by Adiabatic Passage Techniques, Annu. Rev. Phys. Chem. 52,763 (2001).
[Vog99] K. R. Vogel, Laser Cooling on a narrow atomic transition and measurement of thetwo-body cold collision loss rate in a strontium magneto-optical trap, Ph.D. thesis,University of Colorado, Boulder, USA (1999).
[Vog12] F. Vogl, Master’s thesis, University of Innsbruck, Austria (2012).
[Wal97] T. Walker and P. Feng, Measurements of Collisions Between Laser-Cooled Atoms,Adv. At. Mol. Opt. Phys. 34, 125 (1997).
[Web03] T. Weber, J. Herbig, M. Mark, H.-C. Nagerl, and R. Grimm, Bose-Einstein con-densation of cesium, Science 299, 232 (2003).
[Wil09] E. Wille, Preparation of an Optically Trapped Fermi-Fermi Mixture of 6Li and40K Atoms and Characterization of the Interspecies Interactions by Feshbach Spec-troscopy, Ph.D. thesis, University of Innsbruck, Innsbruck, Austria (2009).
[Win05] K. Winkler, G. Thalhammer, M. Theis, H. Ritsch, R. Grimm, and J. H. Denschlag,Atom-Molecule Dark States in a Bose-Einstein Condensate, Phys. Rev. Lett. 95,063202 (2005).
[Win06] K. Winkler, G. Thalhammer, F. Lang, R. Grimm, J. Hecker Denschlag, A. J.Daley, A. Kantian, H. P. Buchler, and P. Zoller, Repulsively bound atom pairs inan optical lattice, Nature 441, 853 (2006).
[Win07] K. Winkler, F. Lang, G. Thalhammer, P. van der Straten, R. Grimm, and J. HeckerDenschlag, Coherent optical transfer of Feshbach molecules to a lower vibrationalstate, Phys. Rev. Lett. 98, 043201 (2007).
[Wis95] H. Wiseman and M. Collett, An atom laser based on dark-state cooling, Phys. Lett.A 202, 246 (1995).
[Wol00] S. Wolf, S. J. Oliver, and D. S. Weiss, Suppression of Recoil Heating by an OpticalLattice, Phys. Rev. Lett. 85, 4249 (2000).

Bibliography 243
[Wu03] C. Wu, J.-P. Hu, and S.-C. Zhang, Exact SO(5) Symmetry in the Spin-3/2Fermionic System, Phys. Rev. Lett. 91, 186402 (2003).
[Wu06] C. Wu, Hidden symmetry and quantum phases in spin-3/2 cold atomic systems,Mod. Phys. Lett. B 20, 1707 (2006).
[Xu03] X. Xu, T. H. Loftus, J. L. Hall, A. Gallagher, and J. Ye, Cooling and trapping ofatomic strontium, J. Opt. Soc. Am. B 20, 968 (2003).
[Xu10] C. Xu, Liquids in multiorbital SU(N) magnets made up of ultracold alkaline-earthatoms, Phys. Rev. B 81, 144431 (2010).
[Yam08] A. Yamaguchi, S. Uetake, D. Hashimoto, J. M. Doyle, and Y. Takahashi, InelasticCollisions in Optically Trapped Ultracold Metastable Ytterbium, Phys. Rev. Lett.101, 233002 (2008).
[Yam10] R. Yamazaki, S. Taie, S. Sugawa, and Y. Takahashi, Submicron Spatial Modulationof an Interatomic Interaction in a Bose-Einstein Condensate, Phys. Rev. Lett.105, 050405 (2010).
[Yas04] M. Yasuda and H. Katori, Lifetime Measurement of the 3P2 Metastable State ofStrontium Atoms, Phys. Rev. Lett. 92, 153004 (2004).
[Yas06] M. Yasuda, T. Kishimoto, M. Takamoto, and H. Katori, Photoassociation spec-troscopy of 88Sr: Reconstruction of the wave function near the last node, Phys.Rev. A 73, 011403 (2006).
[Ye] J. Ye, private communication.
[Yel06] S. F. Yelin, K. Kirby, and R. Cote, Schemes for robust quantum computation withpolar molecules, Phys. Rev. A 74, 050301 (2006).
[Yi07] S. Yi, T. Li, and C. P. Sun, Novel quantum phases of dipolar Bose gases in opticallattices, Phys. Rev. Lett. 98, 260405 (2007).
[Yi08] W. Yi, A. J. Daley, G. Pupillo, and P. Zoller, State-dependent, addressable sub-wavelength lattices with cold atoms, New Journal of Physics 10, 073015 (2008).
[Yi11] L. Yi, S. Mejri, J. J. McFerran, Y. Le Coq, and S. Bize, Optical Lattice Trapping of199Hg and Determination of the Magic Wavelength for the Ultraviolet 1S0 ↔ 3P0
Clock Transition, Phys. Rev. Lett. 106, 073005 (2011).
[Zac09] M. Zaccanti, B. Deissler, C. D’Errico, M. Fattori, M. Jona-Lasinio, S. Muller,G. Roati, M. Inguscio, and G. Modugno, Observation of an Efimov spectrum inan atomic system, Nature Phys. 5, 586 (2009).
[Zel06] T. Zelevinsky, M. M. Boyd, A. D. Ludlow, T. Ido, J. Ye, R. Ciury�lo, P. Naidon,and P. S. Julienne, Narrow Line Photoassociation in an Optical Lattice, Phys. Rev.Lett. 96, 203201 (2006).

244 Bibliography
[Zel08] T. Zelevinsky, S. Kotochigova, and J. Ye, Precision test of mass-ratio variationswith lattice-confined ultracold molecules, Phys. Rev. Lett. 100, 043201 (2008).
[Zuc] P. S. Zuchowski, private communication.
[Zuc10] P. S. Zuchowski, J. Aldegunde, and J. M. Hutson, Ultracold RbSr Molecules CanBe Formed by Magnetoassociation, Phys. Rev. Lett. 105, 153201 (2010).

Acknowledgements
The construction and operation of the strontium experiment has been a real adventure. Mostof it has been hard work, and we have been rewarded with beautiful results. Especially therace for the first Sr BEC in September 2009 left fond memories. Since then, we set up whatI believe is safe to call a very capable and versatile quantum gas machine. Although it mightseem to be the achievement of only very few people, it is not. Indeed, the setup of such anexperiment is a tremendous effort involving the help and advice of many people, and I feelprivileged to be granted the company of many brilliant people. As I conclude my thesis, Iwould like to express my gratitude to everyone who contributed in one way or the other, andI ask everyone not mentioned here for forgiveness.
First and most of all, I would like to thank Florian Schreck for his supervision, advice,trust, and the great leeway he has given me. Florian’s experience is amazing, ranging fromsoftware and hardware into all stretches of experimental physics, and is parallelled by hisprofound understanding of physics. I thank Florian for the careful reading of the manuscript,and, more importantly, for never ever accepting to come in second. We made a great team,and I wish him all the best for his future.
I would like to thank Rudi Grimm for giving me the opportunity to work in the UltracoldGroup, and for his generous support in all respects. The Ultracold Group is his achievement,and it provides a fantastic environment for our research. Rudi had the right sense of when itwould be appropriate to commence the strontium effort, and he got us started with a greatdeal of support and motivation. I acknowledge the continuous trust Rudi has in me and inour work.
Jun Ye agreed to be the external reviewer of this thesis, for which I would like to expressmy gratitude.
I would like to thank Meng Khoon Tey for setting up the red laser system and latergetting the analysis of the first Fermi gases right. With his help, we were able to move fastenough towards the first BEC. Furthermore, I would like to thank Bo Huang for his workon the red cavity and laser lock. To my successors Benjamin Pasquiou, who contributed alot during the last year, as well as to Alex Bayerle and Slava Tzanova, I wish all the best ofluck. I am sure that they will make a great team and celebrate beautiful results.
Andreas Trenkwalder and I shared an office over all the years, and uncountable bike rideshome, literally tons of bananas, discussions, hiking tours, skiing days, beers, and friendship.Andi knows right out everything about a quantum gas machine, and he will gratefully andpatiently share his knowledge.
I would like to thank Eric Wille for piling up vast resources of optomechanics, optics, andmyriads of useful gadgets in the cupboards of the FeLiKx lab, and I thank him and Devang
245

246 Appendix C. Acknowledgements
Naik for support in the early stages of the experiment. The company and friendship of theentire FeLiKx team has been a tremendous help.
Further, I would like to thank Gerhard Kirchmair, Florian Zahringer, Cornelius Hempel,and Michael Chwalla for valuable advice and for sharing of equipment. The spectroscopymeasurements presented in Chpt. 9 could not have been performed without the help of Mikeand Cornelius. Reaching beyond the premises of the IQOQI labs, I would like to thankthe heros of the CsIII lab, Elmar Haller, Hans Danzl, and Manfred Mark, for dispensingall these little hints and tricks. Sure enough, I would like to thank the remainder of boththe Ultracold and Rainer Blatt’s group for making Innsbruck such a vivid and professionalplace to work in. In particular, I would like to thank Hanns-Christoph Nagerl for his careand hospitality when I visited Innsbruck for the first time. He convinced me that Innsbruckwould be the right place to go.
Gerhard Hendl built endless numbers of electronics boxes, power supplies, and DDSracks. He mastered the construction of the coils and water cooling, and helped us out incountless occasions. I would like to thank our two guys from the mechanics workshop, StefanHaslwanter and Andreas Strasser, for working so well so fast while never complaining aboutdesired quantities or tight schedules. Regular working hours were meaningless when timewas pressing.
I would like to thank Mr. Knabl for managing the institute in a very professional andeffective manner. He deserves all respect for balancing the needs of so many people. Togetherwith Doris Corona, we worked through hundreds of orders, and I always enjoyed coming intoher office. Valentin Staubmann is a great help as our IT engineer, and he is always kindenough to overlook my ignorance of computers. Together with Elisabeth Huck and ChristineGotsch-Obmascher, who took care of the necessary administrative paperwork, they providea friendly and smoothly working environment. I would like to thank all of them for theirtrust in me.
During our work, we were able to greatly benefit from the expertise and knowledgeaccumulated by other groups. We especially acknowledge the work by the groups of Jun Ye,Hidetoshi Katori, Thomas Killian, and Yoshiro Takahashi, and we enjoyed discussions (andsometimes competition) with them. Furthermore, we would like to thank Roman Ciury�loand Eberhard Tiemann for calculations of the 84Sr scattering length, as well as many othertheoreticians for stimulating discussions, among them Alexey Gorshkov, Kaden Hazzard,Ana Maria Rey, Lars Bonnes, Andreas Lauchli, Andrew Daley, and Peter Zoller. Lookingback, I would also like to thank the Hamburg group of Klaus Sengstock, especially ChristophBecker and Klaus, for drawing me into the field of ultracold atoms and providing me with aphenomenal training. The beauty of the Sr machine is a testimony of this education.
Constructing a quantum gas experiment, one finds oneself awfully dependent on externalcompanies. Among many others, I remember very pleasant co-operation with and supportfrom Jurgen Stuhler and Jan Schafer from Toptica Photonics, Gerald Hegenbart and hisexceptional team from Thorlabs, Kester Kroll from CVI, the entire team from Linos/Qioptiq,Sabine Hermann from VACOM, Michaela Bohme from Laser Components, Jaroslaw Sperlingfrom Newport, and Alois Wiesbock and Franz Schwarzbauer from EQ Photonics.
Finally, I would like to thanks my parents Hartmut and Urte and my sister Franziska fortheir continuous support, and Hanna for her endless patience and love.