Deformation field in plane-strain indentation of...
8
IOP PUBLISHING JOURNAL OF PHYSICS D: APPLIED PHYSICS J. Phys. D: Appl. Phys. 41 (2008) 074026 (8pp) doi:10.1088/0022-3727/41/7/074026 Characterization of deformation field in plane-strain indentation of metals T G Murthy, C Huang and S Chandrasekar 1 Center for Materials Processing and Tribology, School of Industrial Engineering, Purdue University, West Lafayette, IN 47907-2023, USA E-mail: [email protected] Received 3 October 2007, in final form 5 December 2007 Published 12 March 2008 Online at stacks.iop.org/JPhysD/41/074026 Abstract A study has been made of the deformation field in plane-strain indentation of metals with a flat punch. Deformation field parameters such as velocity and strain rate have been measured using the technique of particle image velocimetry. For this purpose, images of the indentation region were recorded in situ during the deformation process, and motion of ‘asperities’ specially introduced onto a side of the sample being indented was analysed. The velocity and strain rate fields in and around the indentation zone were obtained from an analysis of the asperity motions. The measurements have shown, among other things, the presence of a dead metal zone underneath the indenter, the formation and evolution of regions of intense strain rates or shear bands and a linear variation of the strain rate with indentation speed. Many of the characteristics of the deformation field, e.g. slip lines and dead metal zone, compare favourably with those inferred from classical solutions for this indentation problem. Extensions of the technique for the study of strain field around indentations and deformation in plane-strain indentation by wedges and cylinders are discussed. (Some figures in this article are in colour only in the electronic version) 1. Introduction Quasi-static indentation is now a widely used technique for studying mechanical properties of solids such as hardness, flow stress and elastic modulii (Tabor 1951, 1996, Chaudhri and Enomoto 1996). Indentation tests are also being used to explore phenomena such as creep and strain gradient plasticity. In interpreting data from these applications of quasi-static indentation, concepts of representative strain, strain rate and strain gradient have been used, even though the theoretical underpinnings of these concepts have been less than rigorously established. A better understanding and clarification of these concepts could potentially be realized if a general experimental method was available for studying deformation field parameters such as velocity of material flow, strain rate and strain in indentation. Such measurements should also enable an assessment of various models of indentation based on data that are far more detailed than what are typically available in ensemble measurements of load–displacement and hardness, leading to possible improvements in measurement 1 Author to whom any correspondence should be addressed. of the mechanical properties. It is in this context that this exploratory study to develop a direct method for measuring parameters of the indentation deformation field has been undertaken. While the experimental method is described for the model system of plane-strain indentation of a semi-infinite solid by a flat punch, it is equally applicable to other plane- strain configurations such as wedge and cylinder indentation. Measurements of the strain distribution in the indentation region have generally relied on post-indentation observation of ‘microstructure features’ associated with the deformation or on correlation of hardness with strain. The extent of the plastic zone around indentations in brass was characterized by Samuels and Mulhearn (1957) using a metallographic etching technique that was sensitive to the level of strain in the material. The spatial resolution of this technique is determined by the resolution of the microstructures induced at varying levels of strain, and the technique is limited to selecting materials that exhibit this strain sensitivity of microstructure. In this context, it is worth noting that the recrystallization microstructure characteristic of a specific level of strain may be used to highlight the plastic zone around a spherical indentation, see 0022-3727/08/074026+08$30.00 1 © 2008 IOP Publishing Ltd Printed in the UK
Transcript of Deformation field in plane-strain indentation of...

IOP PUBLISHING JOURNAL OF PHYSICS D: APPLIED PHYSICS
J. Phys. D: Appl. Phys. 41 (2008) 074026 (8pp) doi:10.1088/0022-3727/41/7/074026
Characterization of deformation field inplane-strain indentation of metalsT G Murthy, C Huang and S Chandrasekar1
Center for Materials Processing and Tribology, School of Industrial Engineering, Purdue University,West Lafayette, IN 47907-2023, USA
E-mail: [email protected]
Received 3 October 2007, in final form 5 December 2007Published 12 March 2008Online at stacks.iop.org/JPhysD/41/074026
AbstractA study has been made of the deformation field in plane-strain indentation of metals with a flatpunch. Deformation field parameters such as velocity and strain rate have been measuredusing the technique of particle image velocimetry. For this purpose, images of the indentationregion were recorded in situ during the deformation process, and motion of ‘asperities’specially introduced onto a side of the sample being indented was analysed. The velocity andstrain rate fields in and around the indentation zone were obtained from an analysis of theasperity motions. The measurements have shown, among other things, the presence of a deadmetal zone underneath the indenter, the formation and evolution of regions of intense strainrates or shear bands and a linear variation of the strain rate with indentation speed. Many ofthe characteristics of the deformation field, e.g. slip lines and dead metal zone, comparefavourably with those inferred from classical solutions for this indentation problem.Extensions of the technique for the study of strain field around indentations and deformation inplane-strain indentation by wedges and cylinders are discussed.
(Some figures in this article are in colour only in the electronic version)
1. Introduction
Quasi-static indentation is now a widely used technique forstudying mechanical properties of solids such as hardness,flow stress and elastic modulii (Tabor 1951, 1996, Chaudhriand Enomoto 1996). Indentation tests are also being used toexplore phenomena such as creep and strain gradient plasticity.In interpreting data from these applications of quasi-staticindentation, concepts of representative strain, strain rate andstrain gradient have been used, even though the theoreticalunderpinnings of these concepts have been less than rigorouslyestablished. A better understanding and clarification ofthese concepts could potentially be realized if a generalexperimental method was available for studying deformationfield parameters such as velocity of material flow, strain rateand strain in indentation. Such measurements should alsoenable an assessment of various models of indentation basedon data that are far more detailed than what are typicallyavailable in ensemble measurements of load–displacement andhardness, leading to possible improvements in measurement
1 Author to whom any correspondence should be addressed.
of the mechanical properties. It is in this context that thisexploratory study to develop a direct method for measuringparameters of the indentation deformation field has beenundertaken. While the experimental method is described forthe model system of plane-strain indentation of a semi-infinitesolid by a flat punch, it is equally applicable to other plane-strain configurations such as wedge and cylinder indentation.
Measurements of the strain distribution in the indentationregion have generally relied on post-indentation observation of‘microstructure features’ associated with the deformation oron correlation of hardness with strain. The extent of theplastic zone around indentations in brass was characterized bySamuels and Mulhearn (1957) using a metallographic etchingtechnique that was sensitive to the level of strain in the material.The spatial resolution of this technique is determined by theresolution of the microstructures induced at varying levels ofstrain, and the technique is limited to selecting materials thatexhibit this strain sensitivity of microstructure. In this context,it is worth noting that the recrystallization microstructurecharacteristic of a specific level of strain may be used tohighlight the plastic zone around a spherical indentation, see
0022-3727/08/074026+08$30.00 1 © 2008 IOP Publishing Ltd Printed in the UK

J. Phys. D: Appl. Phys. 41 (2008) 074026 T G Murthy et al
the beautiful series of micrographs presented in Hanemannand Schrader (1927). Nadai (1931) has also presented a similarrecrystallization micrograph indicative of a characteristic levelof strain around a flat punch indenter.
Direct measurements of deformation around an indenterhave been carried out by Hill et al (1947), Nye (1947), Atkinsand Tabor (1965) and Yew and Goldsmith (1964), using the‘split specimen’ approach. In this approach, the specimenbeing indented is split into two halves and grids are inscribedon each of the surfaces of the solid to be conjoined. Thetwo halves are clamped to create a monolithic specimen. Thedistortion of the grids is examined after the indentation byseparating the halves. While this approach provides someinsight into material flow, accurate measurement of strain rateand strain parameters is not feasible due to deformation ofthe split halves in the third dimension. Another importantdisadvantage of this method is that the deformation of a splitspecimen is likely different from that of a whole (un-split)specimen (Chaudhri 1993).
Chaudhri (1993) developed an elegant variation of theuse of grids to measure strain distribution by indenting mildsteel specimens which had inherent pearlite ‘stringers’ alignedperpendicular to the indentation direction. The stringers servedas markers, intrinsic internal grids, whose distortion could bemeasured to estimate the strain. The directionally alignedpearlite stringers were a consequence of the macroscopictexture resulting from a drawing process used to produce thesteel. While this offers a direct method for measurementof the strain, it is restricted to materials with resolvablepearlitic (e.g. steels) or similar aligned microstructure features.The spatial resolution of the measurements is determined bythe size and interlamellar spacing of the pearlite stringers. Thisapproach has also provided qualitative insights into the frictioncondition prevalent at the indenter–specimen contact, based onconsideration of the nature of the stringer distortions (cuttingor bending of the stringers).
In a follow-on study, Chaudhri (1996) characterized thestrain distribution around a large spherical indentation incopper by studying the extent of hardening produced by theindentation. This was done by carrying out Vickers hardnessmeasurements along a median plane section of the sphericalindentation and correlating these hardness values with strain,using the hardness of copper specimens strained to differentlevels in uniaxial compression. The measurements gave anestimate of the plastic strain around the indentation, with themaximum plastic strain recorded below the indentation alongthe load axis.
The studies of Chaudhri (1993, 1996) have by far providedthe best characterization to date of the strain field around anindentation. It should be noted that none of the aforementionedstudies estimated the strain rate in the indentation zone.
The technique of particle image velocimetry (PIV)offers scope for direct in situ measurement of variousparameters of the deformation field (velocity, strain rate,strain) in indentation. This technique relies on the analysisof image sequences of the indentation region taken duringindentation of a suitably prepared specimen. Noteworthyin this regard are the studies by White and Bolton (2004)
and O’Loughlin et al (2003) of deep indentation (piling) andshallow indentation (shallow footings) in sands; and studiesof a special type of ‘sliding wedge indentation’ of metals byLee et al (2004, 2006). In the studies on sand, the inherenttexture of the sand particles was used to track the motionof these particles during the deformation process using the PIVtechnique. A direct measure of the displacement field aroundthe indenter tip (pile tip) in deep and shallow indentationwas obtained, along with the strain field in and around theindentation region.
This study builds on the prior work of Lee et al(2004, 2006) on measurement of strain field in slidingindentation of metals, and describes an adaptation of the PIVtechnique to directly determine the velocity and strain ratefields in plane-strain indentation by a flat punch. Efficacy,accuracy and precision of this method are comparable tothat of local instrumentation. The results are compared withclassical solutions of velocity and strain rate fields for punchindentation, providing a preliminary evaluation of a versatileexperimental technique.
2. Particle image velocimetry
PIV is an optical measurement technique that has beenwidely used since the early 1980s to obtain velocity fieldsin macroscopic fluid flows (Adrian 1991). In this technique,particles (or tracers) are injected into the fluid and trackedto determine the velocity field. Recently, this technique hasbeen adapted to study deformation, namely, velocity, strain rateand strain, in severe plastic deformation of metals (Lee et al2004, 2006) and indentation of soils (White and Bolton 2004).A variant of a prior approach (Lee et al 2004, 2006) is usedhere to measure parameters of the deformation field (velocity,strain rate) in plastic indentation of a solid by a punch underplane strain conditions.
Figure 1 shows a schematic of the experimentalarrangement for plane-strain indentation of a solid by arectangular punch. An inset in this figure also shows the widthand depth of indentation used in the analysis in the followingsections. One surface (side face) of the model material system,lead, is prepared for imaging by abrasion. When the abradedside face of the lead sample is illuminated, an optical ‘texture’is formed, due to scattering of light from the crests and troughsof the ‘asperities’ of the lead surface as shown in figure 2.A region of interest around the indenter is imaged using acharge-coupled device (CCD) camera attached to an opticalmicroscope. The camera is stationary with respect to the regionof interest. As the indentation progresses, the asperities inthe region of interest are displaced, this displacement beingcaptured by the CCD camera. A sequence of images from theregion of interest, all with the same exposure time, is thusobtained for the analysis; this approach is generally calledmultiple frame, single exposure PIV.
For the analysis, two images from a sequence taken ata certain time interval apart are considered. Each image isdivided into a grid of a desired size as shown in figure 2.An interrogation window, typically larger than the grid sizeis then specified. A single grid element is chosen for the
2

J. Phys. D: Appl. Phys. 41 (2008) 074026 T G Murthy et al
Figure 1. Schematic of experimental set up for plane-strainindentation. The indenter is placed on the fixed base of an universaltesting machine while the lead sample is mounted on the movingcross-head. The sample is moved vertically downward at a pre-setspeed. Inset shows depth of indentation (d) and contact length (b) ofthe indenter.
Figure 2. Indentation region showing lead sample just brought intocontact with high speed steel indenter. The abraded surface of thesample, when illuminated by white light, shows a ‘texture’ that isused in the PIV. Also shown is an artificial grid of desired size that issuperposed onto the image for the PIV analysis.
analysis in the first image. This single grid element is overlaidand traversed throughout the specified interrogation windowin the second image of the image pair. A ‘degree of match’is assessed through the PIV algorithm and the best match islocated by using a cross-correlation function (Nguyen andWereley 2002). The peak of the cross correlation indicatesthe displacement vector for the asperities of a particulargrid. The calculation time is reduced by applying a fastFourier transform to the region of interest. This procedureof finding the displacement vector is repeated for the entireset of grid elements, thus producing a displacement field forthe whole region being imaged, in this case the region aroundthe indenter. The analysis is continued by substituting the
second image of the image pair with subsequent images fromthe image sequence. Thus an overall averaged displacementfield is obtained for the quasi-static indentation using the entiresequence of images. The time interval between images and theevolving displacement field provide a map of the velocity inthe deformation process.
White et al (2003) investigated the effect of interrogationpatch size and grid size on the accuracy and precision of PIVmeasurements. Although they utilized the PIV for measuringdeformation fields and gradients in soils, elements of theiranalysis are equally well applicable for plastic flow fields inmetals. Their work suggests the selection of an optimizedinterrogation patch size: a larger interrogation window offersimproved precision, whereas a smaller interrogation windowallows for greater detail to be resolved in regions of higherstrain gradient. In this study, an interrogation window sizeof approximately 3 times the grid size was chosen for all ofthe PIV analysis. White et al (2003) used a photogrammetriccalibration procedure for conversion between object space andimage space. This transformation also accounts for noiseand errors due to non-coplanarity of object and image planes,radial and tangential lens distortion of the CCD camera, andrefraction due to the glass block used here as a constraintto ensure plane-strain conditions (figure 1). This kind oftransformation would be essential if the field of view is large.However, due to the relatively small area of interest observed(5 mm × 5 mm) and imaged in this experiment, a linearscaling approach was used to convert the object space to theimage space.
The linear transformation factor, i.e. magnification ofthe lens, was verified against a calibration stage of amicrometer. The size of the grid measured through imagingand transformation matched well with the actual calibratedgrid. A part of the indenter was also imaged throughout thedeformation process to provide a constant frame of reference.
3. Strain and strain rate estimation
The velocities obtained from the PIV analysis can be usedto calculate the strain rate and the strain in and around theindentation. The PIV analysis provides a grid of velocityvectors over the field of view. The strain rate componentsare estimated as (Thomsen et al 1965, Lee et al 2004, 2006)
ε̇xx = ∂u
∂x,
ε̇yy = ∂v
∂y,
γ̇ = 2ε̇xy = ∂v
∂x+
∂u
∂y, (1)
ε̇eff =√
4
9
(1
2
[(ε̇xx − ε̇yy)2 + ε̇2
xx + ε̇2yy
]+
3
4γ̇ 2
),
where u and v are the velocity components in the x andy directions. The strain rate components are calculatednumerically using the velocity values at the discrete grid points.To calculate the incremental strain imposed in a material
3
J. Phys. D: Appl. Phys. 41 (2008) 074026 T G Murthy et al
volume as it traverses a grid element, the strain rates andvelocities at the grid points are needed. The velocity andthe strain rate in a grid element are assumed to be constant.Then, the product of the strain rate and time required totraverse a particular grid element (this time is calculatedfrom the velocity at the grid point) is the incremental strainimposed in that particular grid element. Furthermore, byintegrating the strain rate field in this manner along particletrajectories, the cumulative strain at different locations in thesample during the indentation can be obtained (Lee et al 2006).
4. Experimental
A series of punch indentations was performed on a lead block,127 mm long, 25.4 mm wide and 25.4 mm high, that wasmounted onto the moving cross-head of a tension/compressiontest machine (MTS Qtest/50LP, 50 kN). The lead surface beingindented was prepared by machining. The surface roughness(Ra ∼ 1 µm) was much smaller than the indentation size.The stationary indenter was a flat punch (2.54 × 25.4 ×5.4 mm3) machined out of high speed steel. The experimentalarrangement is shown in figure 1. The contact length ofthe indenter and the depth of indentation are labelled as(b) and (d), respectively, in the figure. The indenter wasattached to the fixed cross-head (base) of the machine andapproximately in the middle of the lead block, with the indenterextending across the entire width of the lead block. Theheight of the lead sample (25.4 mm), as measured in thedirection of indentation, was sufficiently large compared withthe contact length of the indenter (b = 2.54 mm) so as toendure deformation typical of a semi-infinite medium. Anoptically smooth glass block was clamped to the indenterbase and kept lightly pressed and aligned against the leadsample so as to minimize any transverse flow of material inthe direction of the sample width (Lee et al 2004, 2006).The glass block remained in contact with the entire side faceof the lead block throughout the indentation process thusensuring a plane-strain condition during the indentation. Theregion in and around the indentation was imaged for the PIVanalysis. In this experimental arrangement, the samplematerial sweeps through the region being imaged while theindenter is stationary.
A CCD based high speed camera (Nikon-Optiphot, NikonInc, Mellville, NY) coupled to an optical microscope was usedfor observation and imaging. The microscope allowed formagnifications of up to 200 times. A white light source wasused for the illumination. The typical framing rate was 30images per second. The spatial resolution in measurement ofthe velocity and strain rate field is ∼30 µm, for the smallestfield of view used in the experiments. The indentation wascarried out under displacement control with the cross-head ofthe MTS machine being moved at a constant velocity in therange 1–8.5 mm s−1. The indenter load was measured usinga 50 kN load cell attached to the cross-head of the testingmachine.
Commercially pure lead (99.8% purity with 0.2% traceelements, McMaster-Carr, Elmhurst, IL, USA) was chosen asthe model sample material, because its mechanical behaviour
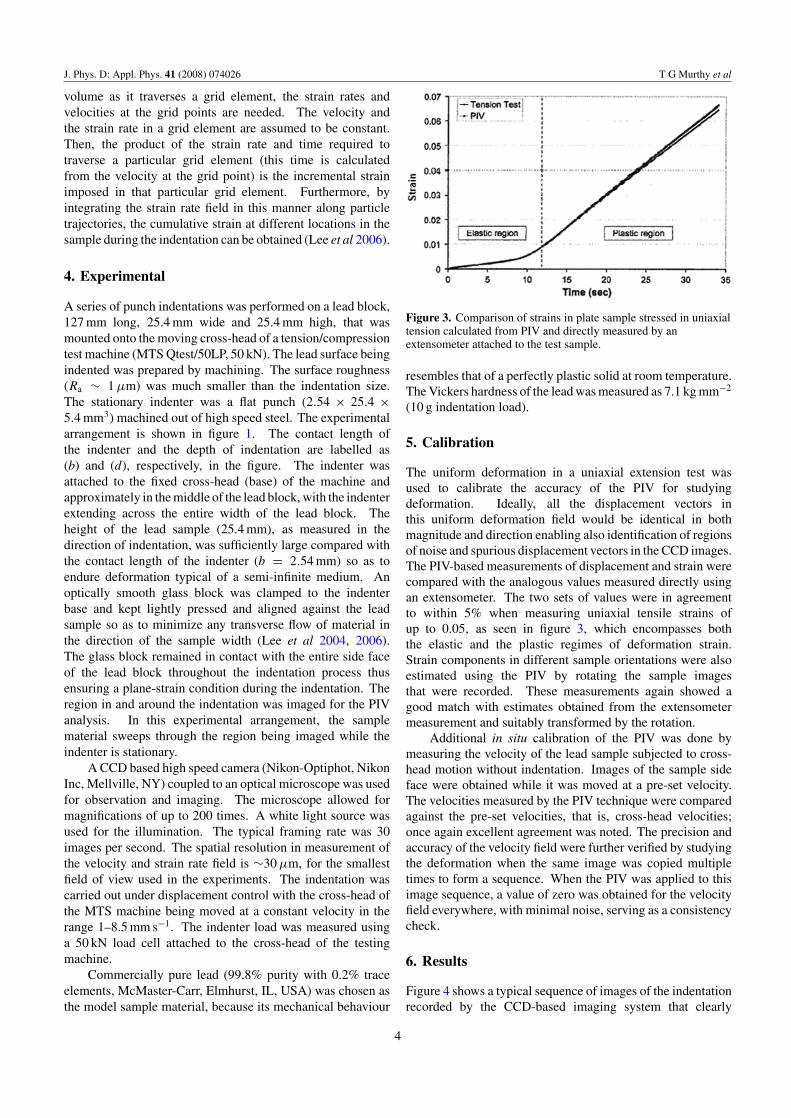
Figure 3. Comparison of strains in plate sample stressed in uniaxialtension calculated from PIV and directly measured by anextensometer attached to the test sample.
resembles that of a perfectly plastic solid at room temperature.The Vickers hardness of the lead was measured as 7.1 kg mm−2
(10 g indentation load).
5. Calibration
The uniform deformation in a uniaxial extension test wasused to calibrate the accuracy of the PIV for studyingdeformation. Ideally, all the displacement vectors inthis uniform deformation field would be identical in bothmagnitude and direction enabling also identification of regionsof noise and spurious displacement vectors in the CCD images.The PIV-based measurements of displacement and strain werecompared with the analogous values measured directly usingan extensometer. The two sets of values were in agreementto within 5% when measuring uniaxial tensile strains ofup to 0.05, as seen in figure 3, which encompasses boththe elastic and the plastic regimes of deformation strain.Strain components in different sample orientations were alsoestimated using the PIV by rotating the sample imagesthat were recorded. These measurements again showed agood match with estimates obtained from the extensometermeasurement and suitably transformed by the rotation.
Additional in situ calibration of the PIV was done bymeasuring the velocity of the lead sample subjected to cross-head motion without indentation. Images of the sample sideface were obtained while it was moved at a pre-set velocity.The velocities measured by the PIV technique were comparedagainst the pre-set velocities, that is, cross-head velocities;once again excellent agreement was noted. The precision andaccuracy of the velocity field were further verified by studyingthe deformation when the same image was copied multipletimes to form a sequence. When the PIV was applied to thisimage sequence, a value of zero was obtained for the velocityfield everywhere, with minimal noise, serving as a consistencycheck.
6. Results
Figure 4 shows a typical sequence of images of the indentationrecorded by the CCD-based imaging system that clearly
4

J. Phys. D: Appl. Phys. 41 (2008) 074026 T G Murthy et al
Figure 4. Sequence of images in indentation with a flat punch. The images are shown inverted with respect to the actual experimentalconfiguration with the indenter on top for ease of understanding. A region of deformation, partially spherical, may be seen under theindenter. The images are taken at a low magnification so as to show a larger field of view.
Figure 5. Velocity field from PIV analysis for a large field of view.This field provides a qualitative description of material flow aroundthe indenter. The indenter velocity is 1 mm s−1 in the downwarddirection and the velocity scale is in mm s−1. The region withvelocity approximately equal to 1 mm s−1 under the indenterindicates a dead metal zone (region 1), since the material here isessentially stationary with respect to the indenter. Note that while inthe experiment the indenter is stationary and the sample moves withrespect to the indenter, in this and other figures the velocities areshown assuming the indenter is moving down with respect to astationary sample, as in a typical indentation test.
highlight the indentation process. Even though the indenterwas stationary with respect to the sample in the experiments,the results such as in figure 4 are presented such that theindenter is shown moving vertically downwards at a uniformvelocity and the sample is stationary. This is to facilitate easyidentification and comparison with quasi-static indentation inpractice. A spherical cap of deformed material is evident in theimage sequence in figure 4. Asperities are clearly seen on theside of the sample, which are used in the PIV analysis.
Figure 5 shows a map of the velocities obtained fromthe PIV analysis of image sequences such as these shown infigure 4. The velocity contours are plotted for a large fieldof view (low magnification). The velocity of the material
immediately underlying the indenter and in contact withit is seen to be nearly constant and equal to the velocityof indentation (1 mm s−1). Consequently, this material isstationary with respect to the indenter and corresponds toa dead metal zone (region 1) that acts as an extension ofthe indenter. The dead metal zone is seen to resemble ahemispherically capped rectangle in figure 5 and intersectsthe bottom face of the indenter at nearly right angles. Thevelocity field is approximately symmetrical with respect tothe indenter mid-plane (axis) as is expected. The velocity ofmaterial flow decreases from a value of ∼1 mm s−1 near theindenter (region 1), which is the velocity of indentation, toabout 0.6 mm s−1 (60% of the indentation velocity) in region2 beyond the dashed line in the figure. Finally at distancessufficiently far away from the indenter, in region 3, the velocityof the material is essentially zero. The velocities very closeto the indented (free) surface of the sample are not analysedhere because of uncertainties arising from material pile-up.These three regions are delineated in figure 5 with velocityvectors imprinted at select locations. The maximum extentof the dead metal zone underneath the indenter is about 1.4times the width of the indenter. Although the large fieldof view shown in figures 4 and 5 is ideal for obtaining aqualitative description of the velocity field, the resolutionis insufficient to characterize strain rate, shear localization(velocity discontinuity) and evolution of strain rate in theindentation zone.
To better characterize the deformation, the indentationzone was observed at a higher magnification by reducingthe field of view to a region encompassing only one-halfof the indenter and the surrounding material. Symmetryconsiderations dictate that the other half of the deformationfield is similar and indeed this was noted in the experiments.The velocity and strain rate fields derived from this observationare shown in figures 6(a) and (b), respectively. Thethree regions of distinct velocity identified in the lowmagnification view (figure 5) are also identified here, withregion 1 corresponding to a velocity of about 1 mm s−1
(dead metal zone), region 2 corresponding to a velocity ofabout 0.6 mm s−1 and region 3 to velocities of ∼0.2 mm s−1
decaying down to zero farther away. Velocity vectors at
5

J. Phys. D: Appl. Phys. 41 (2008) 074026 T G Murthy et al
y
Figure 6. (a) Velocity and (b) strain rate fields obtained from PIVanalysis of images. Only one half of the indentation region and thesurrounding indentation are shown. The velocity field map showsvectors whose lengths are indicative of the magnitude of thevelocities.
select locations in the indentation region are also shown infigure 6(a). It was observed in the images recorded at a highermagnification that the indenter did not penetrate the asperitiesintroduced on the side surface. Rather, as the indentationprogressed, these asperities were displaced below the indenterindicating a sticking type of friction condition at the indenter–sample interface. A similar observation has been made byChaudhri (1993) in wedge indentation of mild steel, based onthe deformation of the pearlite stringers.
The strain rate field in figure 6(b) shows the presence ofa region of intense strain rate, see marked region, with aneffective strain rate magnitude of ∼1.8 s−1 at the corner of theindenter. This region of intense strain rate will, henceforth, bereferred to as a shear band. The shear band begins to developalmost at right angles to the bottom face of the indenter.
As the indenter penetrates deeper into the sample, withprogression of the indentation, the velocity and strain rate fieldsbecome better defined with much sharper transitions in themagnitudes of the velocities, and continued development of
Figure 7. Strain rate field at two different depths of indenterpenetration. The shear band and its propagation into the solid areseen to increase with increasing depth of indentation. Note also thedevelopment of a second shear band in (b). (a) Shallow and (b)deeper.
the shear band. This may be seen in figure 7 which showsthe strain rate field at two different stages of the indentationprocess. The maximum value of the strain rate at the corner ofthe indenter continues to remain at ∼1.8 s−1 with progressionof the indentation, but the shear band curves towards the axis ofthe indenter. Figure 7(b) also shows the formation of anothershear band at the corner of the indenter that curves away fromthe axis of the indenter.
The variation of the strain rate with indentation velocitywas studied using indentation velocities of 1, 5 and 8.5 mm s−1.The velocity of material flow and strain rates in the deformationzone were found to scale approximately linearly with theindentation velocity. The maximum strain rate, typicallyrecorded in the shear band emanating from a corner of the
6

J. Phys. D: Appl. Phys. 41 (2008) 074026 T G Murthy et al
indenter, was ∼1.8 times the indentation velocity (in mm s−1)in magnitude.
7. Discussion
A study has been made of the velocity and strain rate fields inindentation of an elastic–perfectly plastic solid by a flat punch.The technique of PIV has been applied to image sequencesrecorded of the indentation region, from which the strain rateand velocity have been estimated at different locations. Thevelocity field has highlighted three distinct regions of velocity(figures 5 and 6)—a dead metal zone underneath the indenterwherein the material is essentially stationary with respect tothe indenter; a central fan shaped zone of different velocityadjoining this dead metal zone; and a region of very lowvelocity far away from the indenter. The strain rate field hasrevealed the formation and propagation of shear bands fromthe corners of the indenter (figure 7). The main shear bandpropagates towards the axis of the indenter. As indentationprogresses, a second shear band is observed that propagatesaway from the axis of the indenter (figure 7(b)).
It is instructive to compare these results with some ofthe classical solutions for the plane-strain punch indentationproblem. Two of the principal features of the measureddeformation field are the dead metal zones, and the shear bandsseen in the strain rate field (figure 7) which are the analogue ofslip lines. The observed dead metal zones are compatible withboth Prandtl’s slip line field solution and laminar flow resultingfrom dislocation loop punching (Johnson et al 1970, Friedel1964). Preliminary analysis of the measured deformationfield data suggests qualitative agreement with Prandtl’s slipline field. Quantitative and more concrete comparisonsbetween the experimental results and classical solutions willsoon be possible when the hodograph and slip line field areconstructed from the experimentally observed deformationfield. Such a comparison will facilitate a more rigorousdescription of the deformation field around an indenter,while also providing reliable values of the magnitudes ofstrain.
While the strain rate magnitudes along the shear bandsscale as ∼1.8 times the indentation velocity (in mm s−1),this prediction cannot be directly compared with slip linefield theory wherein the shear band appears as a region ofvelocity discontinuity. However, the linear scaling of the strainrate with indentation velocity observed in the experiment isconsistent with general considerations of strain rate inferredfrom plasticity analysis. Lastly, the velocity of indentation didnot affect the development and shape of the dead metal zone,or that of the shear bands, as is to be expected from theory fora rate insensitive plastic solid.
The experiments have also provided important insightsinto the formation and propagation of the shear bands. Theshear bands are quite ‘narrow’, originating at the corners ofthe indenter and then propagating into the bulk of the solidfrom these locations (figure 7). As the indentation progresses,the shear bands become better defined as seen in the strainrate fields of figure 7. An interesting feature pertaining toshear bands is the occurrence of a main shear band, followed
by a secondary one which forms at a subsequent stage of theindentation. The main band curves towards the axis of theindenter and demarcates the boundary of the dead metal zone(region 1 in figure 7) while the secondary one curves awayfrom the axis. The strain rate values in both the primary andthe secondary shear bands are similar and their propagationin figure 7(b) is analogous to that seen in slip line fields. Athigher depths of indentation, d/b > 1.75, it became difficult totrack the motion of particles in and around the indentation zonedue to the larger deformations imposed in these regions. Thisprecluded a determination of whether shear bands, in additionto the main and secondary ones discussed above, form. Also,an analysis of movement of the free surface of the solid wasnot carried out to explore phenomena such as ‘piling-up orsinking-in’ of material around the indentation because of therelatively small field of view used in this experiment. Thesewill be considered in the future.
While slip line fields generally provide a characterizationof the deformation field at a steady state of deformation, theyoffer little information about the incremental development ofthe deformation. In contrast, the high speed image sequencesand the PIV analysis offer a wealth of information pertainingto the development of the deformation. Furthermore, unlikewedge or cylinder indentation, the flat punch indentationproblem is not self-similar in that the deformation evolveswith increasing depth of indentation; this is an additionalcomplication to any slip line field analysis of incipientdeformation (Nepershin 2002). Nepershin (2002) hasformulated an analysis of the incipient stage of deformationfor plane-strain indentation with a punch. In this analysis, thevelocities (hodograph) are related to the deformation of thefree boundary in the sample, which in turn is a function of thedepth of indentation. The analysis also suggests that a steadystate of deformation is reached only when the ratio of the depthof the indentation (including material pile-up) to the width ofthe indenter exceeds a value of about 8, i.e. d/b � 8, and thatonly in this steady state regime is the Prandtl slip line fieldsolution valid. A more detailed study of the deformation usingthe PIV approach should enable a systematic assessment ofthese consequences of Nepershin’s analysis.
The application of PIV described herein has beenrestricted to an exploratory study of velocity and strain ratefields. By tracking the motion of individual particles andintegrating the strain rate field along the particle trajectories,it is feasible to determine the strain field in and around theindentation zone. This has been carried out recently for largestrains imposed in a specific type of sliding wedge indentation(Lee et al 2004, 2006). Ongoing work is implementing thispath integration to obtain the strain field in indentation.
A complete determination of the parameters ofthe deformation field (velocity, strain rate, strain) forpunch, wedge and cylinder indentation, should enable aquantitative assessment of the validity of slip line fieldand finite element models of indentation processes, overand above just a validation based on load–displacementdata. Additional questions that may be explored, especiallywith advancements in the PIV technique in progress,pertain to the friction conditions at the indenter–solid
7

J. Phys. D: Appl. Phys. 41 (2008) 074026 T G Murthy et al
interface, concept of representative strain associated with anindentation (Tabor 1951), rotational component of plasticflow (Brown 1997), scaling of and strain gradients in thedeformation field and mechanics of piling-up and sinking-inphenomena.
8. Conclusion
Direct measurement of the velocity and strain rate fieldsin plane-strain indentation of a semi-infinite solid by a flatpunch has been demonstrated. The measurement involves theapplication of the technique of PIV to sequences of images ofthe indentation taken in situ. The measurement has provideda quantitative characterization of the velocity and strain ratefields in the indentation zone, the formation and evolutionof regions of velocity ‘discontinuity’ or locally intense strainrate during the incipient and later stages of the indentation,and the variation of strain rate with indentation velocity.The magnitude of the maximum effective strain rate was∼1.8 times the velocity (in mm s−1) of the indentation. Themeasurements suggest qualitative similarity with the Prandtlslip line field solution for punch indentation of a rigid-plasticsolid. The technique for the analysis of deformation is equallyapplicable to other types of static and dynamic indentationprocesses, including indentation with self-similar indenters(e.g. wedge, cylinder) and deformation processing methods.The availability of detailed data pertaining to the deformationfield parameters of velocity, strain rate and strain, will enableassessments of validity of models of quasi-static indentation atan extraordinary high-level of detail. These should further ourunderstanding of deformation phenomena in indentation, themechanics of hardness tests, and accuracy, interpretation andscope of indentation tests.
Acknowledgments
This work was supported in part by NSF grants CMMI0654250 and CMMI 0626047. We would like to thank thereviewers for their insightful comments and suggestions.
References
Adrian R J 1991 Particle imaging techniques for experimental fluidmechanics Annu. Rev. Fluid Mech. 23 261–304
Atkins A G and Tabor D 1965 Plastic indentation in metals withcones J. Mech. Phys. Solids 13 149–64
Brown L M 1997 Transition from laminar to rotational motion inplasticity Proc. R. Soc. Lond. A 355 1979–90
Chaudhri M M 1993 Subsurface deformation patterns aroundindentations in work-hardened mild steel Phil. Mag. Lett.67 107–15
Chaudhri M M 1996 Subsurface plastic strain distributionaround spherical indentations in metals Phil. Mag. A74 1213–24
Chaudhri M M and Enomoto Y (ed) 1996 Proc. Int. IndentationWorkshop (Cambridge, UK, 10–12 January 1996) Phil. Mag. A74 5 (special issue)
Friedel J 1964 Dislocations ( Oxford: Pergamon) pp 230–1Hanemann and Schrader 1927 Atlas Metallographicus (Berlin:
Verlag von Gebruder Borntraeger) p 760–5Hill R, Lee E H and Tupper S J 1947 The theory of wedge
indentation of ductile materials Proc. R. Soc. A 188 273–89Johnson W, Sowerby R and Haddow J B 1970 Plane Strain Slip Line
Fields: Theory and Bibliography (Amsterdam: Elsevier)Lee S, Hwang J, Shankar M R, Chandrasekar S and Compton W D
2004 Velocity and strain distribution in 2-D orthogonalmachining Proc. ASME Int. Mechanical Engineering Congressand Exposition (Anaheim, CA, USA, 13–19 November 2004)
Lee S, Hwang J, Shankar M R, Chandrasekar S and Compton W D2006 Large strain deformation field in machining Metall.Mater. Trans. A 37 1633–43
Nadai A 1931 Plasticity (New York: McGraw-Hill)Nepershin R I 2002 The indentation of a flat punch into a
rigid-plastic half-space J. Appl. Math. Mech. 66 135–40Nguyen N T and Wereley S T 2002 Fundamentals and Applications
of Microfluidics (Boston, MA: Artech House) pp 137–200Nye J F 1947 Experiments on the compression of a body between
rough plates Armament Research Department (A.R.D.)Research Report No 39/47, Division for Physical Research,Ministry of Supply, UK
O’Loughlin C D, Lehane B M and White D J 2003 Deformationpatterns in sand beneath shallow foundations subjected tovertical loading Proc. 13th Eur. Conf. on Soil Mechanics andGeotechnical Engineering (Prague, Czech Republic)pp 767–72
Samuels L E and Mulhearn T O 1957 An experimental investigationof the deformed zone associated with indentation hardnessimpressions J. Mech. Phys. Solids 5 125–34
Tabor D 1951 The Hardness of Metals (Oxford: Oxford UniversityPress)
Tabor D 1996 Indentation hardness: fifty years on A personal viewPhil. Mag. A 74 1207–12
Thomsen E G, Yang C T and Kobayashi S 1965 Mechanics of PlasticDeformation in Metal Processing (New York: Macmillan)
White D J, Take W A and Bolton M D 2003 Soil deformationmeasurement using particle image velocimetry (PIV) andphotogrammetry Geotechnique 53 619–31
White D J and Bolton M D 2004 Displacement and strain pathsduring plane-strain model pile installation in sandGeotechnique 54 375–97
Yew C H and Goldsmith W 1964 Stress distributions in softmetals due to static and dynamic loading J. Appl. Mech.31 636–46
8