
Deformation and damage mechanisms of laminated glass...
56
1 Deformation and damage mechanisms of laminated 1 glass windows subjected to high velocity soft impact 2 3 I. Mohagheghian 1* , Y. Wang 1 , J. Zhou 1 , L. Yu 1 , X. Guo 2 , Y. Yan 2 , M.N. 4 Charalambides 1 and J.P. Dear 1 5 6 1 Department of Mechanical Engineering, Imperial College London, South Kensington 7 Campus, London SW7 2AZ, United Kingdom 8 2 Beijing Institute of Aeronautical Materials, Beijing 100095, China 9 10 Abstract 11 Bird strike can cause serious risks to the safety of air travel. In this paper, the aim is to improve 12 design by determining deformation and damage mechanisms of laminated glass windows when 13 subjected to high velocity soft impacts. To achieve this, laboratory-scale impact experiments 14 using bird substitute materials were performed in the velocity range of 100-180 m s -1 . An 15 important step forward is that high-speed 3D Digital Image Correlation (DIC) has effectively 16 been employed to extract the full-field deformation and strain on the back surface of the 17 specimens during impact. The finite element simulations were performed in Abaqus/explicit 18 using Eulerian approach and were able to represent successfully the experiments. 19 * Author for correspondence Email: [email protected]
Transcript of Deformation and damage mechanisms of laminated glass...

1
Deformation and damage mechanisms of laminated 1
glass windows subjected to high velocity soft impact 2
3
I. Mohagheghian1*, Y. Wang1, J. Zhou1, L. Yu1, X. Guo2, Y. Yan2, M.N. 4
Charalambides1 and J.P. Dear1 5
6
1 Department of Mechanical Engineering, Imperial College London, South Kensington 7
Campus, London SW7 2AZ, United Kingdom 8
2 Beijing Institute of Aeronautical Materials, Beijing 100095, China 9
10
Abstract 11
Bird strike can cause serious risks to the safety of air travel. In this paper, the aim is to improve 12
design by determining deformation and damage mechanisms of laminated glass windows when 13
subjected to high velocity soft impacts. To achieve this, laboratory-scale impact experiments 14
using bird substitute materials were performed in the velocity range of 100-180 m s-1. An 15
important step forward is that high-speed 3D Digital Image Correlation (DIC) has effectively 16
been employed to extract the full-field deformation and strain on the back surface of the 17
specimens during impact. The finite element simulations were performed in Abaqus/explicit 18
using Eulerian approach and were able to represent successfully the experiments. 19
* Author for correspondence
Email: [email protected]

2
For the laminated glass structures investigated, the damage inflicted is strongly sensitive to the 20
nose shape of the projectile and most deleterious is a flat-fronted projectile. Two threshold 21
velocities for impact damage have been identified associated with firstly the front-facing and 22
secondly the rear-facing glass layer breaking. The order of the glass layers significantly 23
influences the impact performance. The findings from this research study have led to a deeper 24
and better-quantified understanding of soft impact damage on laminated glass windows and 25
can lead to more effective design of aircraft windshields. 26
Keywords: bird strike, laminated glass, hydrodynamics, soft impact, 3D DIC 27
28
1-Introduction 29
Bird strike is a well-known safety concern in the aviation industry. However, more attention 30
has been paid towards this problem recently as the number of the bird strikes has increased in 31
the last two decades (Dolbeer et al., 2014). In the United States, for example, the number of 32
wildlife strikes on civil aircraft was 6.1 times greater in 2013 compared to 1990 and 97% of 33
the strikes are by birds. According to Dolbeer et al. (2014), 243 aircraft have been destroyed 34
and 255 people have been killed globally since 1988 by wildlife strikes. 35
All front facing components of aircraft such as windshields, nose cones, wing leading edges 36
and engine blades are vulnerable to bird strike during flight time, especially at the time of take-37
off and landing (Dolbeer et al., 2014). Although engine ingestion is recognised as the major 38
threat to transport and executive jets (77% of all accidents are engine ingestion followed by 39
10% for windshields), for smaller aircraft, bird strike on the windshield is the main safety 40
concern (52% of fatal accidents) (Thorpe, 2003). Similar figures have been reported by Dennis 41
and Lyle (2008) where amongst the 51 fatal accidents identified between 1962 and 2009, 42

3
caused by bird-strike on the airframe, 27 accidents occurred on the windshield with the majority 43
for smaller aircraft. 44
Despite its importance, there are not many experimental investigations available in the 45
literature on the performance of the laminated glass windows against bird strike. This is due to 46
the cost of full-scale experimental evaluations. Doubrava and Strnad (2010) investigated the 47
performance of laminated glass windows with the thickness of 14, 18 and 20 mm against 48
impact by a 1.81 kg bird at the velocity range of 300-450 km h-1 (83-125 m s-1). The details of 49
the laminated glass configurations were not specified but the velocity at which the failure 50
occurred increased linearly with the thickness of the windshield. Kangas and Pigman (1948) 51
performed impact tests on various windshields using different materials and types of 52
construction. The tests were conducted using birds at velocities up to 725 km h-1 (208 m s-1). 53
Their study suggests that the primary factor influencing the impact strength of laminated glass 54
window is the thickness of the plastic interlayer. Different methods of installation of the 55
windshield to the cockpit were also investigated and were shown to have a strong effect on the 56
impact strength of the windshield 57
Due to the high cost of running full-scale experimental investigations, many researchers have 58
used numerical analysis, e.g. finite elements (Grimaldi et al., 2013; Hedayati et al., 2014). 59
Grimaldi et al. (2013) used the SPH method to parametrically investigate the response of a 60
laminated glass window consisting of three layers of glass and two layers of PVB. They studied 61
the effect of target geometry, impact angle and plate curvature on the response of the 62
windshield against bird strike. The impact angle was found to have the strongest influence on 63
the impact performance. Hedayati et al. (2014) also used the SPH method for the selection of 64
the best material option for a helicopter windshield according to CS 29 certification for large 65
helicopters. They suggested that the laminated glass with PVB interlayer performs the best. 66

4
Despite the lack of experimental as well as numerical studies on high velocity soft impact 67
response of laminated glass windows, research in this field can benefit from the rich literature 68
on low velocity impact response (Chen et al., 2013, 2015; Grant et al., 1998; Kaiser et al., 2000; 69
Peng et al., 2013; Pyttel et al., 2011; Saxe et al., 2002; Zhang et al., 2013) as well as ballistic 70
testing of glass at high rates (Bourne et al., 1994; Chocron et al., 2016, 2010, 2007b; Holmquist 71
and Johnson, 2011; Walley, 2013). 72
Grant et al., (1998) investigated the damage threshold of laminated glass structures using 73
granite projectiles up to impact velocities of 20 m s-1. Critical impact velocity was defined as 74
the lowest velocity at which damage occurred during a set of 30 impact tests. The thickness of 75
the outer glass layer was found to be the primary parameter affecting this critical velocity. The 76
performance of laminated glass windows was investigated against the windborne debris for 77
hard (Kaiser et al., 2000; Saxe et al., 2002) as well as soft (Zhang et al., 2013) impactors. Kaiser 78
et al., (2000) proposed a “sacrificial ply” design concept for protection of architectural glazing 79
against the windborne debris. In this approach, the exterior-facing, outer glass ply, is allowed 80
to fracture during impact. This however, prevents the fracture in the inner glass ply and retains 81
the structural integrity of the whole structure. A statistical approach, mean minimum breakage 82
velocity (MMBV), was used by Kaiser et al., (2000) to compare various laminated glass 83
constructions. Cumulative probability of inner glass failure was also assessed. The “sacrificial 84
ply” design concept was explored further by Saxe et al., (2002). The effect of glass type on the 85
impact performance was studied using annealed, heat strengthened, and fully tempered glass. 86
Regardless of outer glass layer type, using heat-strengthened or fully tempered inner glass layer 87
instead of annealed glass significantly improved the MMBV. Chen et al., (2013) investigated 88
the radial and circular crack propagation in a laminated glass window subjected to low velocity 89
hard impact. The speed of radial and circular cracks were measured using high speed 90
photography. A Weibull statistical approach was used to analyse the macroscopic cracking 91

5
morphology over 100 repeated experiments. Increasing impact velocity and polymer interlayer 92
thickness were found to have an opposite effect on the radial and circular crack numbers. 93
Chocron et al., (2016) studied the damage threshold of borosilicate glass under plate impact at 94
velocities ranging from 116 to 351 m s-1. The damage in the glass was observed to occur behind 95
the shock wave at velocities as low as 130 m s-1. 96
Numerical simulations were also employed to predict the response of laminated glass windows 97
subjected to pedestrian head impact (Peng et al., 2013; Pyttel et al., 2011), windborne debris 98
(Shetty et al., 2012; Zhang et al., 2013) and low velocity hard impact (Behr et al., 1999; Chen 99
et al., 2015). Chen et al., (2015) developed a three-dimensional computational framework for 100
modelling impact fracture in laminated automotive glazing. Good agreement was observed 101
between the experimental and numerical results in terms of fracture patterns and peak force. 102
Pyttel et al., (2011) proposed a failure criterion for laminated glasses subjected to impact 103
loading. The success of the failure criterion was then assessed by comparing numerical and 104
experimental results for pedestrian head impact on flat and curved windows. Pedestrian head 105
impact was also simulated by Peng et al., (2013) using different combinations of glass and 106
PVB. A critical fracture stress criterion was used to model the failure in the glass. Zhang et al., 107
(2013) investigated the response of laminated glass windows against large windborne wooden 108
blocks. The glass was modelled using a Johnson Holmquist Ceramic constitutive model (JH2) 109
(Holmquist and Johnson, 2011). The developed numerical model reliably simulated the 110
window deflection, maximum strain, debris penetration and glass cracking shape. Chocron et 111
al., (2007a, 2007b) developed a constitutive model for pre-damaged borosilicate glass under 112
confinement. The model was employed to simulate the penetration of projectile into the glass 113
targets (Chocron et al., 2007a). 114
115

6
Hydrodynamic loading 116
Bird impact at high velocities can be considered as a “soft body impact”. The soft body impact 117
refers to an impact in which the strength of the projectile is much lower than that of the target 118
and consequently the projectile undergoes extensive deformation. The loading imposed on the 119
target is very different from normal hard impact (in which the projectile deformation is 120
negligible) and can be described well using hydrodynamic theory. In the hydrodynamic 121
approach, the loading mainly depends on the density and velocity of the projectile and 122
projectile strength and viscosity are neglected (Wilbeck, 1978). Although, the bird body 123
consists of various parts with different densities (head, neck, wings, torso shell, etc.), in most 124
theoretical and numerical studies, the bird is normally treated as a homogenous material with 125
a uniform density (average density of all parts). McCallum et al., (2013) developed a numerical 126
multi-material bird model with a more accurate representation of bird anatomy. However, 127
comparison with standard projectile shapes (cylindrical, hemi-spherical and ellipsoid) with a 128
single homogenous density showed similar results for Hugoniot pressure, maximum impact 129
force and impact duration for bird-strike certifications tests. 130
According to Wilbeck (1978) and Barber et al. (1978), the bird impact loading on a rigid target 131
can be divided into two stages: stage i) in which the intensity of loading is high but the duration 132
is very short (transient state) and stage ii) which has the opposite characteristics, longer 133
duration but less intensity (steady state). This will be further discussed in Section 5-1. The 134
loading can be affected by the response of the target, as there is a coupling between loading 135
and response. Factors such as shock impedance, compliance and deformability of the target can 136
significantly affect all aspects of the loading including peak force and pressure, rise time, 137
magnitude of impulse and duration of decay and the steady state process (Barber et al., 1978). 138
139

7
Outline of the investigation 140
In this paper, a combination of experimental and numerical analyses is employed to investigate 141
the impact performance of laminated glass windows. The deformation and failure mechanisms 142
of the laminated glass windows are studied at the velocity range between 100 to 180 m s-1. The 143
effect of projectile nose shape, the glass front layer type and the order of glass layers on impact 144
damage of laminated glass windows are also investigated. The novel aspect of this research is 145
that high-speed 3D Digital Image Correlation (DIC) has effectively been employed to extract 146
the full-field deformation and strain on the back surface of the specimens during impact. This 147
is a very useful method for checking the validity of the finite element simulations developed. 148
The combined full field experimental/modelling approach provides useful insights for 149
designing lightweight and impact resistant glazing against bird strike. 150
151
2-Materials 152
The laminated glass specimens used in this study are square plates with the dimension of 180 153
×180 mm. The plates consist of two layers of glass and one layer of polymer which were 154
laminated using an autoclave at Beijing Institute of Aeronautical Materials (BIAM). Two types 155
of the strengthened alumina silicate glass were used for lamination: thermally and chemically 156
strengthened. The chemically strengthened glass plates were manufactured by soaking float 157
glasses in potassium salt solution for ion exchange at 420˚C for 5 hours. This results in the 158
formation of compressive layers with a depth of 38 ± 5 µm and strength of 738 ± 20 MPa on 159
both sides of the glass (air and tin sides), measured using Orihara surface stress meter model 160
FSM-6000LE (only the strength and depth of compressive layer was measured and the 161
distribution of through-thickness residual stress was not measured). Therefore, the variation in 162
the strength and depth of compressive layer is about 3% and 13% respectively. These variations 163

8
in addition to other factors including flaw size and distribution can contribute to the variation 164
in the strength of glass plates. In order to quantify these variations, quasi-static failure strain of 165
chemically strengthened glasses was measured using ring-on-ring experiments. The failure 166
probability was then assessed using a two-parameter Weibull statistical distribution. The 167
Weibull probability of failure ln(−ln(1 − 𝑃𝑓)) is plotted against failure strain for 2.2 and 4.0 168
mm chemically strengthened glass plates in Fig. 1. The curves are fitted using a non-linear 169
least-squares method through at least 12 repeat tests. Further details on the experimental 170
procedure can be found in a separate publication (Mohagheghian et al., 2016). 171
Three configurations, including two laminated and one monolithic glass, were studied in this 172
paper. The details of each configuration can be found in Table 1. For the laminated glass test 173
specimens, Cases 1 and 2, two layers of strengthened glass with the thickness of 2.2 and 4.0 174
mm were used (the thinner glass layer normally faces the projectile except in one situation later 175
which will be identified). The tin side of the glass was used for lamination. For the polymer 176
interlayer, Thermoplastic Polyurethane (TPU) - KRYSTALFEX®PE499 from Huntsman was 177
used. Due to a limitation on the conventional polymer interlayer thickness available in the 178
market, two layers of polymer were used to achieve the required thickness (Table 1). Case 3 in 179
Table 1 represents an equivalent monolithic glass sample. 180
181
3-Experimental 182
To investigate the performance of laminated glass plates under soft impact, laboratory scale 183
impact experiments were performed using a gas gun apparatus up to the velocity of 180 m s-1 184
(648 km h-1). All impact tests were performed at 90° incidence angle (i.e. the target was 185
orientated normal to the barrel). 186

9
3-1 Projectile 187
Using real birds in impact experiments is quite common in the aviation industry. However, it 188
has several disadvantages including lack of repeatability and control on the orientation, 189
homogeneity and isotropy of the projectile (Wilbeck and Rand, 1981). To overcome these 190
shortcomings, gelatine and RTV rubber have been identified as two substitute materials and 191
have been demonstrated to create a pressure profile similar to that of a real bird (Wilbeck and 192
Rand, 1981). 193
In this study RTV rubber, Mold Max ® 10T, was used for the projectile which has a density of 194
1.09 g/cm3 and shore hardness A of 10. Cylindrical projectiles were made by mixing two liquid 195
components and casting into steel moulds. The moulds were then left in the vacuum chamber 196
for curing and degassing. The final projectile has a diameter of 23.5 ± 0.05 mm and length of 197
50 ± 0.3 mm. This gives an aspect ratio, projectile length over its diameter, of approximately 198
two. 199
The projectile was accelerated to the required velocity using a light carrier. The carrier was 200
made out of a thin layer of polystyrene film and a 2 mm PMMA backing disc. It has a wall 201
thickness of 0.6 ± 0.02 mm and weight of 4.0 ± 0.2 g and is shown in Fig. 12a. The length of 202
the carrier was chosen to be slightly less than that of the projectile. This is to ensure that no 203
part of the carrier comes into contact with the target. The interaction of the rubber projectile 204
with a 5 mm aluminium plate target, which was painted black prior to the experiment for better 205
visualisation, is shown in Fig. 2b. 206
3-2 Gas gun set-up 207
As noted earlier, for achieving high velocity impacts, a gas gun apparatus was employed. The 208
projectile was accelerated along a 3 m long barrel and its velocity was measured by two pairs 209

10
of IR sensors located at the end of the barrel. The accuracy of the velocity measurements was 210
confirmed by a series of calibration tests using a high-speed camera located perpendicular to 211
the travel direction of the projectile. A transparent safety chamber, mainly made of thick 212
polycarbonate panels, was used to confine the end of the barrel as well as the target area. This 213
chamber helps to illuminate the target, observing the impact event and protecting the 214
surrounding from the flying fragments caused by the impact. A schematic of the gas gun set-215
up is shown in Fig. 3a. 216
In order to measure the deformation of the target (i.e. the laminated glass windows), high-speed 217
3D digital image correlation (DIC) was employed. Two synchronised high-speed cameras 218
(Phantom Miro M/R/ LC310) were located at the back of the target chamber (Fig. 3a). They 219
were separated by 410 mm and had a distance of 925 mm from the centre point of the target. 220
This gives an angle of approximately 25˚ between the two cameras which is the best 221
recommended angle to do stereo vision measurements (Schreier et al., 2009). The cameras were 222
recording at the rate of 40,000 frames per second. A pair of identical Nikon lenses with a fixed 223
focal length of 50 mm was used for both cameras. 224
To monitor the interaction of the projectile with the target, another high-speed camera, Photron 225
FASTCAM Mini UX50, was located on the impacted side (Fig. 3a). This camera was recording 226
at a rate of 20,000 frames per second. All three cameras were triggered simultaneously using 227
the signal generated by the IR sensors. Halogen lamps were used to illuminate the target. To 228
prevent any effect of heating from the halogen lamps, the lights were turned on just a few 229
seconds before the test. 230
3-3 Sample preparation and boundary conditions 231
The laminated glass test samples with the size of 180×180 mm, were clamped around the edge 232
to a metallic fixture by using twelve M8 bolts. The clamp was made of steel and had an opening 233

11
of 150×150 mm. To avoid any direct contact between the glass and metallic clamp, which can 234
lead to stress concentrations at the clamp edge and ultimately premature failure in the glass, 235
rubber gaskets were used. The specimen and clamping system are shown in Figs. 2b and c. For 236
all plates, rubber gaskets with the thickness of 4.1 ± 0.1 mm were used. The gaskets were 237
compressed between the laminated glass plate and the clamp by tightening the bolts. The 238
amount of the compression was controlled by a metallic spacer (Fig. 3b) with a thickness such 239
that only a small amount of compression was present in the gaskets after tightening the bolts. 240
This means that the sample can be assumed to be simply supported on an elastic foundation. 241
The thickness of different test samples and their corresponding metallic spacer sizes are listed 242
in Table 1. 243
In order to measure the deformation of the target by the digital image correlation technique 244
(DIC), first a random speckle pattern was applied onto the surface of the specimen. The DIC 245
algorithm then calculates the deformation by tracking each point through a pair of image 246
sequences captured by the two high-speed cameras. The speckle pattern was made on the back 247
surface of the specimen using a black marker on a white acrylic paint to generate the maximum 248
contrast. The recommended size of the black speckles is between 3-5 pixels (Aramis, 2006). 249
For the current experimental set-up, the optimum size of the speckles is between 0.7 to 1.0 mm 250
(which can be best achieved by hand painting). Also, to prevent any shadow from the projectile 251
affecting the DIC calculation of the back face, the front layer of the glass was painted black. 252
There is always a trade-off between the resolution and the number of photographs recorded by 253
a high-speed camera. Therefore, for maximising the amount of information, which can be 254
obtained from DIC in a relatively short impact event (duration less than 1 ms), the speckle 255
pattern was only applied to the areas of most interest. Two configurations were chosen and are 256
shown in Fig. 3c. In Configuration I, only the central part of the specimen, with the area of 257
70×70 mm was monitored. In Configuration II, the length of observation area was expanded to 258

12
the whole free span of the plate (150 mm), but the width was narrowed down to 33 mm. This 259
gives a similar total area as in Configuration I. In both configurations, two strain gauges were 260
used. The strain gauge, FLA-2-8 from Techni Measure Ltd, has a 2 mm linear gauge and is 261
thermally compensated for glass and ceramic. The surface of the glass was cleaned before 262
attaching the strain gauge to it using a Cyanoacrylate adhesive. In Configuration I, a single 263
strain gauge was located on the front glass face, whilst the second strain gauge was located 264
exactly at the same position but on the back face. Both of the gauges were located 30 mm off-265
centre and measuring the strain along the y-axis (Fig. 3c). For Configuration II, both of the 266
strain gauges were placed on the back glass face, one at the centre and the other at 30 mm off-267
centre. The strain gauges were attached to the glass surface before the sample was painted. 268
269
4-Numerical 270
In this section, the finite element method is used to simulate the mechanical response of the 271
laminated glass windows under impact loading. The simulations were performed using 272
Abaqus/explicit (Abaqus Version 6.14). As a result of symmetry, only one quarter of the target 273
was modelled (Fig. 4) with a symmetry boundary condition applied along the sectioned 274
surfaces. The boundary of the target, shown in Fig. 3b, was modelled including the rubber 275
gaskets (Fig. 4a). The two free surfaces of the rubber gaskets were constrained in the z 276
direction, simulating the presence of the two clamps in Fig. 3b. The target including glass, 277
polymer interlayer and rubber gaskets were discretised using brick elements with eight nodes 278
and reduced integration, C3D8R (in Abaqus notation). The mesh was refined near the central 279
region of the plate (Fig. 4b) with a typical element size of 0.33× 0.33×0.33 mm. The simulation 280
results became insensitive to the size of the mesh on further refinement. The glass was modelled 281
as an elastic material with ρ = 2440 kg m-3, E = 71.7 GPa and υ = 0.21 (Xue et al., 2013) where 282

13
ρ, E and υ are density, elastic modulus and Poisson’s ratio respectively. Modelling fracture in 283
the glass plates is not considered in the present study and therefore no failure model is 284
employed for the glass in the FE model. 285
In this study, the chemically strengthened glass is treated as an isotropic material without 286
considering the initial through-thickness residual stress distribution. The same approach has 287
also been used for finite element simulation of quasi-static and low velocity impact response 288
of chemically strengthened glass plates (Hu et al., 2014; Shetty et al., 1980; Singh et al., 2016; 289
Westbrook et al., 2010; Xue et al., 2013). As shown by Jiang et al., (2016), chemically 290
strengthening does not affect the quasi-static flexural stiffness of the glass plates but only 291
increases the strength of the glass by postponing the failure to larger deformations. In this 292
paper, the response of laminated glass windows is investigated numerically only at impact 293
velocities for which no fracture occurs in the glass layers. Therefore, it is believed that not 294
considering the residual stress in the FE model has no effect on the simulation results. It should 295
be noted however, that when the failure of the glass plates needs to be modelled, considering 296
the residual stress would be essential as it has a significant effect especially on the crack 297
propagation and on the shape of the fragments. 298
The rubber gaskets were modelled using a hyperelastic material model (Mooney-Rivlin) (Li et 299
al., 2010) with density of 1060 kg m-3 and C10 and C01 (Mooney-Rivlin material model 300
constants) of 0.69 and 0.173 MPa respectively. For the polymer interlayer (TPU), a linear 301
viscoelastic material model (generalised Maxwell model) was chosen as follows: 302
𝐸(𝑡) = 𝐸∞ + ∑ 𝐸𝑖𝑛𝑖=1 𝑒
−(𝑡
𝜏𝑖), (1)
where 𝐸∞ is the long-term modulus and 𝐸𝑖 is elastic modulus associated to the relaxation time 303
𝜏𝑖. Material parameters used for the generalised Maxwell model (Table 2) were extracted with 304

14
a method similar to (Macaloney et al., 2007). The parameters were imported in Abaqus in the 305
form of shear modulus (𝐺𝑖), which has a value approximately one-third of 𝐸𝑖. The values of 306
1070 kg m-3 and 0.485 were chosen for the density and Poisson’s ratio of the TPU respectively. 307
For modelling the soft impactor, the Eulerian method was used. In this approach, the mesh is 308
fixed in space and the material flows thought the elements. In comparison with the Lagrangian 309
approach, the Eulerian method does not suffer from extensive mesh distortion. However, the 310
method has its own disadvantages including mesh dependency of boundaries and relatively 311
high computational cost (Heimbs, 2011). Depending on the duration of the simulations, two 312
types of the Eulerian box were used (Figs. 3a and b). When the response of the target was of 313
interest and the simulation was performed over a long period (1 ms), the Eulerian box in Fig. 314
4a was used as the box needed to cover the complete radial flow of the projectile. When the 315
initial contact pressure and pressure distribution inside the projectile were of interest and the 316
simulations were performed over the shorter period (the initial 50 µs), the Eulerian box shown 317
in Fig. 4b was used. The Eulerian box was discretised using 8-node brick elements with reduced 318
integration (EC3D8R in Abaqus notation). The mesh size inside the Eulerian box had a typical 319
size of 0.18×0.18×0.18 mm. It was found that the simulation results became insensitive to the 320
size of the mesh on further refinement. 321
The rubber projectile was modelled using the Mie–Grüneisen equation of state (EOS) with an 322
assumption of linear relationship between the velocity of the projectile (V0) and the shock wave 323
speed in the projectile material (Vs) as follows: 324
𝑉𝑠 = 𝑐 + 𝑠𝑉0. (2)
Therefore the relationship between the pressure (p) and nominal volumetric compressive strain 325
(η) defined as 𝜂 = 1 − 𝜌0 𝜌⁄ is (Abaqus Version 6.14): 326

15
𝑝 =𝜌0𝑐
2𝜂
(1−𝑠𝜂)2(1 −
Γ0𝜂
2) + 𝛤0𝜌0𝐸𝑚.. (3)
In the above equations 𝜌0, 𝜌, and 𝐸𝑚 are reference density, current density and internal energy 327
per unit mass respectively; c, s and 𝛤0 are material constants with values of c = 1869 m s-1, s = 328
0.5072 and 𝛤0= 0 (Iyama et al., 2009). 329
General frictionless explicit contact was used for modelling contact between all surfaces except 330
the interface between the glass and the polymer interlayer for which a tie constraint was used. 331
This is valid assumption as long as no debonding occurs at this interface, which was the case 332
before the glass layers fractured. The general contact algorithm in Abaqus enforces contact 333
between Eulerian materials and Lagrangian surfaces (Abaqus Version 6.14). The contact 334
constraints are enforced with the penalty method (Abaqus Version 6.14). 335
336
5-Results 337
5-1 Deformation and failure mechanisms 338
As described earlier, soft impact by a silicon rubber projectile is used to generate hydrodynamic 339
loading similar to that which a windshield experiences during a bird strike. An example of the 340
results from an impact experiment is shown in Fig. 5, for a laminated glass sample, with a 341
thermally strengthened front face (Case 2), as often employed in the aircraft industry. This is 342
impacted at the velocity of 170 ± 1 m s-1 (using sample Configuration I shown in Fig. 3c). Fig. 343
5a displays the deformation of the projectile and its interaction with the target at intervals of 344
0.05 ms. The duration of the contact is short (less than 1 ms); the projectile flows radially as 345
expected and no part of the carrier hits the glass during the impact. At this velocity, only the 346
front glass layer breaks and the rear glass layer is still intact. Fig. 5b displays the out-of-plane 347

16
displacement of the target calculated by DIC. The centre of the plate is displaced by about 5.0 348
± 0.1 mm. The time of the maximum deflection is coincident with the time when the projectile 349
completely loses its momentum and comes to rest (ca. 450 s). After this time, the projectile 350
which is nearly flattened (Fig. 5a), starts to rebound. As noted earlier, the speed of the cameras 351
used for DIC is twice the speed of the one camera used for monitoring the projectile. Hence, 352
for each image in Fig. 5a, two images exist for DIC calculation. The extra images are excluded 353
from Figs. 4b and c. 354
The major principal strain calculated by DIC can be found in Fig. 5c. The strain reaches its 355
maximum of about 0.8 % at ca. 200 s. As can be noted, the time of maximum strain is not 356
aligned with that of the maximum deflection (ca. 450 s). To further investigate this, the test 357
was repeated using the sample Configuration II. This configuration allows observing the 358
deformation over the whole span of the plate and the effect of the boundary on the deformation 359
of the plate can be investigated. The results are shown in Fig. 6 for a laminated glass (Case 2) 360
at an impact velocity of 174 ± 1 m s-1. Similar to Fig. 5, the out-of-plane displacement and 361
major principal strain contours are plotted for the observed area. The maximum deflection at 362
the centre of the plate reaches approximately 5.5 mm and the major strain of nearly 0.8%. The 363
out-of-plane displacement and major strain history are plotted in Fig. 6c for the centre point of 364
the plate. Each data point shown in Fig. 6c, corresponds to one of the contours in Figs. 5a and 365
b. There is a gradual increase in central out-of-plane displacement until the maximum at 475 366
µs. A more rapid rise in central major strain can be seen, starting at the very early stages of the 367
deformation. The deformation of the plate in Fig. 6c can be divided into four phases: Phase 1 368
where both strain and displacement are increasing, Phase 2 in which the displacement is 369
increasing but there is not much change in the value of the strain, Phase 3 where the strain is 370
decreasing while the displacement is still increasing and finally Phase 4 where both 371
displacement and strain are decreasing. 372

17
The out-of-plane displacement profile of the plate is plotted over its whole span when the plate 373
is displaced (Fig. 6d) and then rebounds (Fig. 6e). Again, each profile corresponds to one of 374
the out-of-plane displacement plots in Fig. 6a. As can be observed, the deformation profile 375
does not cover the whole 150 mm of the plate length as some data (obtained from DIC) is lost 376
at points close to the edge of the clamp. At the early stage, Phase 1, the deformation is highly 377
localised under the point of impact and the boundaries are still not activated (Fig. 6d). During 378
this phase, flexural elastic waves travel from the point of contact towards the plate boundary. 379
This phase ends when these waves reach the boundary (at ca. 175 s). During Phase 2, the level 380
of the strain at the centre of the plate does not change significantly. The out of the plane 381
displacement however, is still increasing. It can be noticed in Fig. 6d that the displacement at 382
the boundaries is not zero in this phase. This means that the rubber gasket is compressed and 383
its deformation can account for a part of the increase in the out-of-plane displacement. In Phase 384
3, the plate starts unloading, as indicated by a significant drop in the major strain at the centre 385
of the plate (Fig. 6c). The profile of the plate in this phase is also different from that of Phase 386
2 (Fig. 6d). The rubber gasket is still being compressed and is responsible for a further increase 387
in the out-of-plane displacement (Fig. 6c). At the end of Phase 3, the gasket, which had the 388
original thickness of 4.1 mm, is compressed by around 50%. In Phase 4, the plate is rebounding 389
back and both the out-of-plane displacement and major strain are decreasing. The profile of the 390
plate in this phase is plotted in Fig. 6e. 391
The in-plane strain (strain in the y direction in Fig. 3c), calculated by DIC is compared in Fig. 392
7 with the results of the two strain gauges mounted on the back surface of the plate for a 393
Configuration II specimen. As mentioned earlier, the top surface of the strain gauges was 394
painted and speckled therefore, the deformation of the gauge can be monitored during the 395
impact event using DIC. Overall, there is a very good agreement between the two 396
measurements. The strain gauge at the centre only measured the strain up to 0.4 ms before the 397

18
gauge terminals peeled off. This problem was observed for most of the strain gauges placed at 398
the centre of the plate as the out-of-plane displacement was largest at this point. In most cases, 399
only the terminals, which had a heavier solder connection, peeled off from the plate but the 400
gauge was still attached. This allowed continuous measurement of gauge deformation using 401
DIC. 402
The gauge at the centre of the specimen recorded a high initial rise in the strain at the very early 403
stage of the deformation. This initial peak in strain can also be observed in the DIC results but 404
it has a lower value. For capturing this peak more accurately using DIC, higher frame rates 405
needed to be used for high-speed cameras. The strain at the centre of the sample reaches the 406
maximum value of 0.8% around 0.2 ms and, as shown in Fig. 7, there is a good agreement 407
between the strain gauge and DIC values. 408
A photograph of the failed sample, for Case 2, is shown in Fig. 8. The front impacted side of 409
the specimen was painted black prior to the impact experiment. Therefore, the white area in 410
Fig. 8, is an indicator of the regions where the glass fragments detached from the polymer 411
interlayer. There is a black circular area, with the diameter equal to that of the projectile, at the 412
centre of the plate where the glass fragments are still attached to the polymer. This type of 413
damage pattern in Fig. 8 is similar to what has been reported for liquid jet impact (Bourne et 414
al., 1997; Bowden and Field, 1964; Field, 1966; Hand and Field, 1990; Van Der Zwaag and 415
Field, 1983; Walley et al., 2004). 416
It was apparent from the high-speed photographs that whilst the fracture in the front glass 417
occurred during the loading phase of the deformation, the glass fragments mostly detached 418
when the plate rebounded. Due to the presence of the black paint layer, the onset of the failure 419
in the glass front layer was difficult to identify in high-speed photographs (Fig. 5a). From the 420
signal of the strain gauge attached to the front layer (Configuration I, Fig. 3c), it can be inferred 421

19
that the fracture started very early in the deformation process. However, determining the exact 422
time of fracture initiation was difficult. 423
To further investigate this, a separate series of experiments was performed using clear targets 424
(i.e. no painting was used on either side of the glass). Two high-speed cameras were used: one 425
observing the impacted side and the other one monitoring the back side of the glass. The high-426
speed image sequences are shown in Fig. 9 for a monolithic (6.0 mm monolithic chemically 427
strengthened plate – Fig. 9a) and a laminated glass (Case 1) plate (Fig. 9b) impacted at the 428
velocity of 144 ± 1 m s-1 and 160 ± 1 m s-1 respectively. At the velocity of 144 m s-1, the 429
monolithic glass plate is completely broken and the projectile penetrates through it (Fig. 9a) 430
whilst for the laminated glass plate, which is impacted at the higher speed of 160 m s-1, only 431
the front layer is broken (Fig. 9b). By looking more closely at the high-speed image sequence, 432
it can be seen that the fracture is initiated as soon as the projectile comes into contact with the 433
plate (i.e. the damage is apparent in the second image which is only 25 ± 1 µs after the initial 434
contact). Both the time of the damage initiation (Fig. 9) and type of damage pattern (Fig. 8) 435
indicate that the failure in the front glass layer is mainly controlled by high intensity water-436
hammer-type pressures developed in the initial phase of hydrodynamic loading. 437
The schematic in Fig. 10 can be used to explain the deformation and failure mechanisms of 438
laminated glass windows under a high velocity soft impact. The hydrodynamic loading is well-439
known to have two distinct stages, illustrated in Fig. 10a. In Stage 1, as soon as the projectile 440
comes into contact with the front glass layer, a shock wave is generated that then propagates 441
along the projectile (Fig. 10b). The high intensity pressure behind the shock wave in the 442
projectile is called “Hugoniot pressure” PH and depends on the initial density (𝜌0) and velocity 443
of the projectile (V0) as well as the shock wave speed in the projectile material (Vs) (Equation 444
2) according to the following relationship (Wilbeck, 1978): 445

20
𝑃𝐻 = 𝜌0𝑉0𝑉𝑠 . (4)
At the time of impact, two types of stress waves are generated in the target: surface waves 446
called “Rayleigh waves” and compression elastic waves (Field, 1966), which propagate inside 447
the glass (Fig. 10b). Soon after the initial phase of the contact, the release waves are generated 448
at the edges of the projectile causing formation of high velocity jets which travel with 449
transverse velocity, 2𝑉0/, across the impact surface (Lesser, 1995). The release waves start 450
propagating inside the shocked material, which leads to a significant drop in the pressure inside 451
this region. The duration of Stage 1 depends on how fast these waves can reach the centre of 452
the projectile which itself is a function of speed of sound in the shocked material and radius of 453
the projectile (Field, 1966; Wilbeck, 1978). In cases when the duration of Stage 1 is short (e.g. 454
impacts by small diameter projectiles with high initial velocity), the high intensity compressive 455
waves can reach the interface between glass and polymer interlayer, turn to tensile waves and 456
reflect back (Fig. 10c-1). This is a result of the mismatch between the acoustic properties of 457
the two layers. Field (1966) suggested that a combination of Rayleigh waves and reflected 458
tensile waves are responsible for the damage initiation in liquid impact of thin glass plates. The 459
damage is initiated in the form of a large number of circumferential cracks which form a ring 460
with a diameter approximately equal to the initial diameter of the projectile. 461
Considering the diameter of the projectile here (d = 23.5 mm) and assuming the speed of release 462
waves (cr) to be the same as Vs (cr is slightly greater than Vs (Wilbeck, 1978)) the duration of 463
Stage 1 is calculated to be around 6.5 µs. This is significantly longer than the time needed for 464
compressive waves to reach the glass-polymer interface (only about 1 µs according to the speed 465
of sound in the alumina silicate glass, 5,868 m s-1 (Jin-Hyun, 1997)). It means that by the end 466
of Stage 1, the elastic waves travel at least six times across the thin front glass whilst the 467
material is still in a compressive state. Therefore, the reflected tensile waves cannot account 468
for the failure of the front glass layer here. 469

21
For soft polymer interlayers (e.g. TPU) the compliance of the interlayer can cause more local 470
bending in the front glass layer which can facilitate failure in this layer (Fig. 10c-2). Van der 471
Zwaag and Field (1983) investigated the combined effect of bending stresses and stress wave 472
reflection from the rear surface of a thin glass plate by supporting the glass with an acoustically-473
matched thick glass backing. Their results suggest that the bending stresses and stress wave 474
reflection indeed contribute to the liquid jet impact damage. Therefore, we believe that a 475
combination of Rayleigh waves and local bending stresses is more likely to be responsible for 476
the impact damage in the thin front glass layer. 477
In the second stage of the deformation, known as “steady state”, the projectile flows radially. 478
The steady state pressure (Ps) can be estimated using the Bernoulli equation: 479
𝑃𝑠 =1
2𝜌0𝑉0
2. (5)
During Stage 2, it is assumed that the broken front glass layer does not contribute significantly 480
in carrying the load. The time scale in Stage 2 is sufficient for the development of flexural 481
waves which initiate from the centre of the plate and move towards the boundary (Fig. 6d). If 482
the impulse transferred to the target, defined as the area under the curve in Fig. 10a, becomes 483
high enough, the rear glass layer will break normally at the centre of the plate (Fig. 10e) where 484
the flexural stresses are maximum. 485
The strain development and impact damage as a function of impact initial velocity are shown 486
in Fig. 11 for laminated glass windows (Case 1). Impact tests at different velocities were 487
performed ranging between 120-180 m s-1. The maximum strain at the centre and at a location 488
30 mm off-centre of the rear glass layer are used for evaluating the performance in Fig. 11b. 489
The solid symbols correspond to the maximum major strain measured at the centre of the 490
specimen using DIC. The open symbols correspond to the maximum strain measured using the 491
off-centre strain gauge in the y-direction (location shown in the bottom right diagram of Fig. 492

22
11b). The strain gauge traces are shown in Fig. 11c for seven different impact velocities. Apart 493
from the impact experiment at a velocity of 118 m s-1, the maximum strain occurs around 0.2 494
ms for all experiments. 495
Three regions can be identified in Fig. 11b. For impact velocities below 131 m s-1, no damage 496
was observed in any of the glass layers. The intensity of Hugoniot pressure (Equation 4) is not 497
high enough to cause any failure in the front glass layer. The level of Hugoniot pressure is 498
however, strongly dependent on the projectile initial velocity: both directly with V0 and 499
indirectly with Vs (Equations 2 and 4). Therefore, the level of Hugoniot pressure rises steeply 500
with increasing projectile velocity and becomes sufficient to break the glass front layer at the 501
impact velocities between 146 and 168 m s-1. The photographs of the failed samples at 502
velocities of 146, 157, 165 m s-1 and 179 m s-1, taken from the impacted side, are shown in Fig. 503
11a. For impact velocities of 146, 157 and 165 m s-1, only the front layer is fractured and the 504
rear glass layer is still intact. Since the exact impact damage threshold velocity, at which the 505
failure is initiated in the front glass layer, is not precisely known, the region between 131 and 506
146 m s-1 is shaded in Fig. 11b. Additional tests are needed to narrow down this area. However, 507
because of variations in the strength of glass plates (Fig. 1), determination of exact impact 508
damage threshold velocity is not possible without performing large number of experiments and 509
using statistical approaches (Kaiser et al., 2000). 510
Although the rear glass layer is protected from failure by the polymer interlayer in the initial 511
high intensity stage, it can break if the amount of impulse transferred to the target becomes 512
high enough. This second impact damage threshold velocity, also displayed as a shaded area 513
in Fig. 11b, is located between impact velocities of 168 and 179 m s-1. At the velocity of 179 514
m s-1 both layers of glass are broken. It should be noted that the maximum major strain in Fig. 515
11b for 179 m s-1 (solid symbol) is chosen from one frame prior to the failure. 516

23
For visual guidance, a solid line is fitted through the off-centre strain gauge open square data 517
points. A dashed line with a similar slope is fitted through the two solid square data points 518
below the first threshold (where no damage in front glass layer occurred at these velocities). A 519
good fit is observed in both cases. For all of the impact velocities at which the front glass layer 520
breaks, a jump in the maximum strain in the centre of the specimen is observed. A dotted line 521
is fitted through these solid square data points and is shown in Fig. 11b. 522
523
5-2 The effect of the nose shape of the projectile 524
The projectile nose shape and consequently the geometry of the contact area is known to 525
significantly affect different aspects of hydrodynamic loading (Dear and Field, 1988; Field et 526
al., 1985). In this section, the effect of projectile nose shape on the impact performance of the 527
laminated glass windows is investigated by using two nose shapes: flat (as investigated in the 528
previous section) and hemi-spherical. Both experimental and numerical analyses are used for 529
assessing the difference in the performance. In Fig. 12, the simulation results for the 530
deformation and strain are compared with that from the experiment for a laminated glass plate 531
(Case 1) impacted by a hemi-spherical nose projectile at the velocity of 158 m s-1. The 532
comparison is made for the deformation profile (Fig. 12a), central out-of-plane displacement 533
and strain history (Fig. 12b), and strain in the y direction at the location of the strain gauge 534
(Fig. 12c). In general, a very good agreement is observed which indicates the validity of the 535
simulation results. 536
The experimental results obtained from impacts on the laminated glass windows (Case 1) by 537
projectiles with the two nose shapes are compared in Fig. 13. For the range of impact velocities 538
investigated, 100-169 m s-1, no damage was observed in any of the glass layers for the hemi-539
spherical projectile. It should be noted that for a hemi-spherical nose, the maximum major 540

24
strain at the centre (solid symbols), even at the higher velocities (e.g. 159 & 169 m s-1), lies on 541
the dashed line plotted for the flat-fronted nose shape (the linear fit for data points with no 542
breakage) (Fig. 13). 543
The explanation for this dependency of failure to the projectile nose shape can be found in Fig. 544
14 where the numerical pressure development inside the projectile and the associated contact 545
pressure imposed on the laminated glass are shown for flat and hemi-spherical nose shapes. 546
Both of the projectiles have the same mass and diameter and are fired at the same initial velocity 547
of 131 m s-1. This is the velocity at which no fracture occurs for any of the nose shapes (Fig. 548
13). 549
The development of high intensity pressures is apparent at the very early stages of impact (t = 550
0.75 µs) for a flat-ended projectile. This causes an approximately uniform contact pressure 551
across the diameter of projectile. In contrast, for a hemi-spherical nose the level of pressure 552
inside the projectile is lower and the contact pressure is mainly localised over a small area at 553
the centre of the plate (This area is growing as the contact area increases). As the time passes, 554
the release waves are developed at the edges of the flat-fronted projectile (t = 4 µs) which then 555
start travelling towards its centre. This changes the shape of the contact pressure profile and 556
reduces the pressure values around the edges. A second region of high intensity pressure is 557
developed at the centre of the plate at t = 6.5 µs for the flat-fronted projectile as soon as the 558
release waves collide at the centre of the plate. The contact pressure now has its highest value 559
(ca. 200 MPa) at the centre of the plate. In contrast, for the hemi-spherical nose, the peak 560
pressure normally occurs at the edge of the contact (Field et al., 1985) and moving away from 561
the centre of the plate as the time passes (Fig. 14). At t = 8.5 µs a negative pressure is developed 562
at the centre of the plate for the flat nose shape. The development of these tensile stresses and 563
the resulting cavitation are also mentioned by Field et al. (1985). At this time, the contact 564

25
pressure is nearly zero all over the plate except at a small area with (𝑥 𝑟⁄ ~0.2) where x is the 565
distance from the centre of the plate and r is the radius of the projectile. 566
The level of maximum principal strain is compared for the two nose shapes in Fig. 15 at two 567
locations inside the laminated glass target: location 1 and 2, which are the central points at the 568
distal side of the front and rear glass layers respectively. In Figs. 14a and b the focus is on the 569
early stage of the impact (the initial 50 µs) while in Fig. 15c the performance is compared over 570
a longer period (500 µs). As can be seen in Fig. 15a, the level of strain in the front glass layer 571
significantly increases over a short period of time and reaches the value of approximately 1%. 572
The initial negative value of strain is because of the elastic compression wave reaching the 573
back of the plate before the plate starts bending. As can be observed the level of strain in 574
location 1 is higher than location 2 and is more likely to be the fracture initiation point. This 575
reflects what has been seen experimentally in Fig. 11, where the fracture always occurred 576
earlier in the front glass layer. It should be mentioned that although the plate does not fail at 577
this impact velocity (131 m s-1), the level of calculated strain already exceeds that of measured 578
under quasi-static loading (ca. 0.8% (Mohagheghian et al., 2016)). This can be due to the higher 579
failure strain of glass under dynamic loading. Nie et al. (2010) found that depending on the 580
surface condition of the glass, dynamic failure strain can be five times greater than its quasi-581
static value. The strain at location 2 is compared in Fig. 15c between the two nose shapes. The 582
existence of initial high intensity strains is apparent for the flat nose shape. The level of strain 583
becomes more similar later on the deformation stage for the two nose shapes. 584
In addition to intensity of pressure in Stage 1, the other important factor which can have a 585
significant influence on the growth of the surface micro-cracks is the duration of Stage 1 (Van 586
Der Zwaag and Field, 1983). This itself is nose shape dependent and is shorter for a hemi-587
spherical nose (Wilbeck, 1978). In summary, the low intensity and short duration of Stage 1 588

26
for a hemi-spherical nose prevent the growth of micro-cracks and therefore the onset of failure 589
in the front glass layer. 590
591
5-3 The effect of glass front type 592
In this section, the glass front layer is changed from a chemically to a thermally strengthened 593
glass. Thermally strengthened glasses are manufactured using rapid cooling of glass above its 594
glass transition temperature (Gardon, 1980). This generates residual stresses across the 595
thickness, which have a lower compressive stress on the surface but higher tensile stress in the 596
centre compared to a chemically strengthened glass. In general, thermally strengthened glasses 597
are cheaper but have lower strength than chemically strengthened glasses (Gy, 2008). 598
The comparison between the two laminates is shown in Fig. 16 (Case 2 with thermally 599
strengthened front glass layer compared with Case 1 with chemically strengthened front glass). 600
All other parameters, including the rear glass layer type, are kept the same. For the three 601
velocities tested, the damage occurred only in the front glass layer. The value of the maximum 602
strain in the rear glass layer in Fig. 16 is nearly the same for both cases. Therefore, the choice 603
of glass type for the front layer has little influence on the threshold velocity at which the rear 604
glass layer fails (second damage threshold in Fig. 11b). The front glass layer here acts as a 605
sacrificial layer; breaks in the very early stage of the loading (Stage 1 in Fig. 10a) and protects 606
the rest of the structure from premature failure, which is what happens for the thick monolithic 607
glass in Fig. 9a. 608
609
610
611

27
5-4 The effect of the order of the glass layers 612
In the previous sections, a 2.2 mm thick glass layer was employed as the front glass layer. The 613
effect of the order of the glass layers is investigated in this section by changing the layer 614
orientation of Case 1 and placing the 4.0 mm glass layer facing the projectile. Fig. 17a shows 615
a comparison between the damage caused by an impact at the velocity of 146 m s-1 for both 616
cases. In the case of a thicker glass layer in the front, both glass layers are broken. At the same 617
speed however, when the thinner glass layer is facing the projectile, fracture only appears in 618
the front layer with no damage in the thick rear glass layer. This again supports the argument 619
that the front layer is susceptible to failure by high intensity stresses generated early in the 620
impact event (Stage I in Fig. 10). When the 2.2 mm glass layer is at the front, the glass fails 621
almost instantaneously with the remainder of the impulse carried by a 4.0 mm rear glass layer. 622
The same mechanism happens when the 4.0 mm glass is located in the front. The main 623
difference is that in the latter case, the remaining load should be carried by a 2.2 mm rear glass 624
layer which has a much lower load carrying capacity. 625
The strain development at the back of the front glass layer, obtained from simulation, is 626
compared in Fig. 17b at the impact velocity of 131 m s-1 for these two configurations, thin glass 627
layer in the front and at the back. The level of maximum strain in the initial phase of 628
deformation is similar despite the difference in their front glass layer thickness. This confirms 629
that positioning a thinner glass layer in front is more beneficial. 630
631
6-Conclusions 632
Deformation and damage mechanisms of laminated glass windows were investigated 633
experimentally and numerically under high velocity soft impacts. Impact tests were performed 634

28
using silicon rubber projectiles at a velocity range of 100-180 m s-1. High-speed 3D digital 635
image correlation was employed to monitor the deformation and strain at the back surface of 636
the target and its results were validated using strain gauges. The simulations were performed 637
in Abaqus/explicit using an Eulerian approach. The simulations were validated with the 638
experimental results and good agreement was observed. From these research findings, the 639
following conclusions are drawn: 640
There are different phases identified for the deformation of a laminated glass window 641
under a high velocity soft impact. Unlike the central out-of-plane displacement, the 642
maximum strain in the centre of the rear glass layer occurs early in the impact as a result 643
of highly localised deformation. 644
The damage inflicted is sensitive to the nose shape of the projectile with a flat-fronted 645
nose soft projectile being more damaging than a projectile with a hemi-spherical nose. 646
Two impact velocity thresholds for damage are identified for a flat-fronted nose 647
projectile. When the impact velocity exceeds the first threshold, the glass front layer 648
breaks. This damage occurs in the early stages of the hydrodynamic loading and has 649
similar characteristics to that observed for liquid jet impact (Field, 1966). A 650
combination of Rayleigh surface waves and localised bending stresses is believed to be 651
responsible for the damage in this layer. The rear glass layer breaks when the impact 652
velocity and the associated impulse transferred to the target is high enough to exceed a 653
second higher threshold velocity. The fracture is initiated from the point of maximum 654
flexural stress, which normally occurs at the centre of the specimen. 655
The front glass layer in a laminated glass window acts as a sacrificial layer and protects 656
the rest of the structure from premature failure. In contrast, for a thick monolithic glass, 657
the damage made in the early stage of hydrodynamic loading causes the structure to 658
lose its load carrying capacity at velocities much lower than that for the laminated glass. 659

29
The order of the glass layers has a significant effect on the impact performance. 660
Laminated glass with a thinner glass layer in the front outperforms the case when this 661
layer is located at the back. In the former case, the thicker rear glass is protected from 662
failure in the early stages and is able to carry the remainder of the load. 663
The choice of glass front layer type (chemically versus thermally strengthened glass) is 664
found to have no significant effect on the maximum strain in the rear-glass layer for 665
soft impacts in the range of impact velocities investigated. 666
Finally, the model developed represents well the experimentally determined 667
deformation and strain response using 3D DIC. Knowledge of these deformations and 668
associated strains is key in determining the onset of failure and so the model developed 669
can provide the basis of a viable design tool for aircraft windshields in the future. 670
671
Acknowledgment 672
Much appreciated is the strong support received from AVIC Beijing Institute of Aeronautical 673
Materials (BIAM). The research was performed at the AVIC Centre for Materials 674
Characterisation, Processing and Modelling at Imperial College London. The authors are very 675
grateful for the thoughtful discussions with Professor John Field FRS at the Cavendish 676
Laboratory, Dr Stephen Walley at the Cavendish Laboratory, Professor Martin Lesser at KTH 677
Stockholm, Dr David Townsend at Impact & Materials Dynamics Ltd, Professor Tony Kinloch 678
FRS, Professor Gordon Williams FRS, Professor Peter Cawley FRS and Professor Jianguo Lin 679
FREng of Imperial College London. 680
681

30
References 682
Abaqus Version 6.14. Dassault Systèmes Simulia Corp. 683
Aramis, G.O.M., 2006. Theory and user manual. 684
Barber, J., Taylor, H., Wilbeck, J., 1978. Bird impact forces and pressures on rigid and 685
compliant targets. Tech. Rep. AFFDL-TR-77-60. 686
Behr, R.A., Kremer, P.A., Dharani, L.R., Ji, F.S., Kaiser, N.D., 1999. Dynamic strains in 687
architectural laminated glass subjected to low velocity impacts from small projectiles. J. 688
Mater. Sci. 34, 5749–5756. doi:10.1023/A:1004702100357 689
Bourne, N.K., Obara, T., Field, J.E., 1997. High-speed photography and stress gauge studies 690
of jet impact upon surfaces. Philos. Trans. R. Soc. A Math. Phys. Eng. Sci. 355, 607–691
623. doi:10.1098/rsta.1997.0028 692
Bourne, N.K., Rosenberg, Z., Mebar, Y., Obara, T., Field, J.E., 1994. A high-speed 693
photographic study of fracture wave propagation in glasses. Le J. Phys. IV 4, 635–640. 694
doi:10.1051/jp4:1994896 695
Bowden, F.P., Field, J.E., 1964. The Brittle Fracture of Solids by Liquid Impact, by Solid 696
Impact, and by Shock. Proc. R. Soc. A Math. Phys. Eng. Sci. 697
doi:10.1098/rspa.1964.0236 698
Chen, J., Xu, J., Yao, X., Liu, B., Xu, X., Zhang, Y., Li, Y., 2013. Experimental investigation 699
on the radial and circular crack propagation of PVB laminated glass subject to dynamic 700
out-of-plane loading. Eng. Fract. Mech. 112–113, 26–40. 701
doi:10.1016/j.engfracmech.2013.09.010 702
Chen, S., Zang, M., Xu, W., 2015. A three-dimensional computational framework for impact 703
fracture analysis of automotive laminated glass. Comput. Methods Appl. Mech. Eng. 704
294, 72–99. doi:10.1016/j.cma.2015.06.005 705
Chocron, S., Anderson, C.E., Nicholls, A.E., Dannemann, K.A., 2010. Characterization of 706
confined intact and damaged borosilicate glass. J. Am. Ceram. Soc. 93, 3390–3398. 707
doi:10.1111/j.1551-2916.2010.03863.x 708
Chocron, S., Anderson, C.E., Nicholls, A.E., Rickmann, R., 2007a. Constitutive model for 709
borosilicate glass and application to long-rod penetration, in: 23rd International 710

31
Symposium on Ballistics, Tarragona, Spain 16-20 April 2007. 711
Chocron, S., Barnette, D.D., Holmquist, T.J., Anderson, C.E., Bigger, R.P., Moore, T.Z., 712
2016. Damage Threshold of Borosilicate Glass Under Plate Impact. J. Dyn. Behav. 713
Mater. 2, 167–180. doi:10.1007/s40870-016-0056-4 714
Chocron, S., Dannemann, K.A., Walker, J.D., Nicholls, A.E., Anderson, C.E., 2007b. 715
Constitutive model for damaged borosilicate glass under confinement. J. Am. Ceram. 716
Soc. 90, 2549–2555. doi:10.1111/j.1551-2916.2007.01814.x 717
Dear, J.P., Field, J.E., 1988. High-speed photography of surface geometry effects in 718
liquid/solid impact. J. Appl. Phys. 63, 1015–1021. doi:10.1063/1.340000 719
Dennis, N., Lyle, D., 2008. Bird Strike Damage & Windshield Bird Strike Final Report. 720
Dolbeer, R., Wright, S., Weller, J., Begier, M., 2014. Wildlife strikes to civil aircraft in the 721
United States 1990–2013, Federal Aviation Administration National Wildlife Strike 722
Database. 723
Doubrava, R., Strnad, V., 2010. Bird strike analyses on the parts of aircraft structure, in: 724
Proceedings of the 27th Congress of the Aeronautical Sciences. 725
Field, J.E., 1966. Stress Waves, Deformation and Fracture Caused by Liquid Impact. Philos. 726
Trans. R. Soc. A Math. Phys. Eng. Sci. doi:10.1098/rsta.1966.0032 727
Field, J.E., Lesser, M.B., Dear, J.P., 1985. Studies of Two-Dimensional Liquid-Wedge 728
Impact and Their Relevance to Liquid-Drop Impact Problems. Proc. R. Soc. A Math. 729
Phys. Eng. Sci. doi:10.1098/rspa.1985.0096 730
Gardon, R., 1980. Elasticity and Strength in Glasses, in: Glass: Science and Technology 731
Edited by D. R. Uhlmann and N. J. Kreidl, Pp. pp. 146–216. 732
Grant, P., Cantwell, W., McKenzie, H., Corkhill, P., 1998. the Damage Threshold of 733
Laminated Glass Structures. Int. J. Impact Eng. 21, 737–746. doi:10.1016/S0734-734
743X(98)00027-X 735
Grimaldi, A., Sollo, A., Guida, M., Marulo, F., 2013. Parametric study of a SPH high velocity 736
impact analysis – A birdstrike windshield application. Compos. Struct. 96, 616–630. 737
doi:10.1016/j.compstruct.2012.09.037 738
Gy, R., 2008. Ion exchange for glass strengthening. Mater. Sci. Eng. B. 149, 159–165. 739

32
doi:10.1016/j.mseb.2007.11.029 740
Hand, R.J., Field, J.E., 1990. Liquid impact on toughened glasses. Eng. Fract. Mech. 37, 293–741
311. doi:10.1016/0013-7944(90)90042-F 742
Hedayati, R., Ziaei-Rad, S., Eyvazian, A., Hamouda, A.M., 2014. Bird strike analysis on a 743
typical helicopter windshield with different lay-ups. J. Mech. Sci. Technol. 28, 1381–744
1392. doi:10.1007/s12206-014-0125-3 745
Heimbs, S., 2011. Computational methods for bird strike simulations: A review. Comput. 746
Struct. 89, 2093–2112. doi:10.1016/j.compstruc.2011.08.007 747
Holmquist, T.J., Johnson, G.R., 2011. A Computational Constitutive Model for Glass 748
Subjected to Large Strains, High Strain Rates and High Pressures. J. Appl. Mech. 78, 749
51003. doi:10.1115/1.4004326 750
Hu, G., Harris, J.T., Tang, Z., Mauro, J.C., 2014. Dynamic fracturing of strengthened glass 751
under biaxial tensile loading. J. Non. Cryst. Solids 405, 153–158. 752
doi:10.1016/j.jnoncrysol.2014.09.007 753
Iyama, H., Hamashima, H., Nishi, K., Itoh, S., 2009. Study on Expansion of a Silicon Tube 754
by Underwater Shock Wave. ASME 2009 Press. Vessel. Pip. Div. Conf. 1–5. 755
doi:10.1115/PVP2009-77502 756
Jiang, L., Wang, Y., Mohagheghian, I., Li, X., Guo, X., Li, L., Dear, J.P., Yan, Y., 2016. 757
Effect of residual stress on the fracture of chemically strengthened thin aluminosilicate 758
glass. J. Mater. Sci. doi:10.1007/s10853-016-0434-2 759
Jin-Hyun, S., 1997. Ultrasonic properties of aluminosilicate glass and fluorosilicate glass-760
ceramic. PhD thesis, Ohio University. 761
Kaiser, N.D., Behr, R.A., Minor, J.E., Dharani, L.R., Ji, F., Kremer, P.A., 2000. Impact 762
Resistance of Laminated Glass Using “Sacrificial Ply” Design Concept. J. Archit. Eng. 763
6, 24–34. doi:10.1061/(ASCE)1076-0431(2000)6:1(24) 764
Kangas, P., Pigman, G.L., 1948. Development of aircraft windshields to resist impact with 765
birds in flight part II~Investigation of windshield materials and methods of windshield 766
mounting, No. 4580001. SAE Technical paper. doi:10.4271/480001 767
Lesser, M., 1995. Thirty years of liquid impact research: a tutorial review. Wear 186–187, 768
28–34. doi:10.1016/0043-1648(95)07190-3 769

33
Li, L., Yang, S.H., Hwang, C.S., Kim, Y.S., 2010. Effects of string tension and impact 770
location on tennis playing. J. Mech. Sci. Technol. 23, 2990–2997. doi:10.1007/s12206-771
009-0903-5 772
Macaloney, N., Bujanda, A., Jensen, R., Goulbourne, N., 2007. Viscoelastic Characterization 773
of Aliphatic Polyurethane Interlayers. Army Res. Lab. Reprt No:, ARL-TR-4296. 774
McCallum, S., Shoji, H., Akiyama, H., 2013. Development of an advanced multi-material 775
bird-strike model using the smoothed particle hydrodynamics method. Int. J. 776
Crashworthiness 18, 579–597. doi:10.1080/13588265.2013.843498 777
Mohagheghian, I., Wang, Y., Jiang, L., Zhang, X., Yan, Y., Kinloch, A.J., Dear, J.P., 2016. 778
Structural and low velocity impact performance of monolithic and laminated windows 779
employing chemically strengthened glass. To be Submitt. 780
Nie, X., Chen, W.W., Templeton, D.W., 2010. Dynamic ring-on-ring equibiaxial flexural 781
strength of borosilicate glass. Int. J. Appl. Ceram. Technol. 7, 616–624. 782
doi:10.1111/j.1744-7402.2010.02508.x 783
Peng, Y., Yang, J., Deck, C., Willinger, R., 2013. Finite element modeling of crash test 784
behavior for windshield laminated glass. Int. J. Impact Eng. 57, 27–35. 785
doi:10.1016/j.ijimpeng.2013.01.010 786
Pyttel, T., Liebertz, H., Cai, J., 2011. Failure criterion for laminated glass under impact 787
loading and its application in finite element simulation. Int. J. Impact Eng. 38, 252–263. 788
doi:10.1016/j.ijimpeng.2010.10.035 789
Saxe, T.J., Behr, R. a., Minor, J.E., Kremer, P. a., Dharani, L.R., 2002. Effects of Missile 790
Size and Glass Type on Impact Resistance of “Sacrificial Ply” Laminated Glass. J. 791
Archit. Eng. 8, 24–39. doi:10.1061/(ASCE)1076-0431(2002)8:1(24) 792
Schreier, H., Orteu, J.-J., Sutton, M. a., 2009. Image Correlation for Shape, Motion and 793
Deformation Measurements. Springer. doi:10.1007/978-0-387-78747-3 794
Shetty, D.K., Rosenfield, A.R., McGuire, P., Bansal, G.K., Duckworth, W.H., 1980. Biaxial 795
flexure tests for ceramics. Am. Ceram. Soc. Bull. 59, 1193–1197. 796
Shetty, M.S., Dharani, L.R., Stutts, D.S., 2012. Analysis of Laminated Architectural Glazing 797
Subjected to Wind Load and Windborne Debris Impact. ISRN Civ. Eng. 2012, 1–9. 798
doi:10.5402/2012/949070 799

34
Singh, C., Chaparala, S., Zhou, C., Zhang, B., Park, S.B., 2016. Deformation of Display for 800
Handheld Devices during Drop Impact, in: IEEE 66th Electronic Components and 801
Technology Conference. pp. 1990–1995. doi:10.1109/ECTC.2016.204 802
Thorpe, J., 2003. Fatalities and destroyed civil aircraft due to bird strikes, 1912-2002, in: 803
International Bird Strike Committee, 26th Meeting. pp. 1–28. 804
Van Der Zwaag, S., Field, J.E., 1983. Rain erosion damage in brittle materials. Eng. Fract. 805
Mech. 17, 367–379. doi:10.1016/0013-7944(83)90087-5 806
Walley, S.M., 2013. An Introduction to the Properties of Silica Glass in Ballistic 807
Applications. Strain 470–500. doi:10.1111/str.12075 808
Walley, S.M., Field, J.E., Blair, P.W., Milford, a. J., 2004. The effect of temperature on the 809
impact behaviour of glass/polycarbonate laminates. Int. J. Impact Eng. 30, 31–53. 810
doi:10.1016/S0734-743X(03)00046-0 811
Westbrook, J.T., Bayne, J.F., Roe, T.A., Kim, J.S., Su, P., Ono, T., Gulati, S.T., 2010. 812
Strength Measurements of Thin AMLCD Panels. SID Symp. Dig. Tech. Pap. 41, 1073–813
1076. doi:10.1889/1.3499838 814
Wilbeck, J., 1978. Impact behavior of low strength projectiles. Tech. Rep. AFML-TR-77-815
134. 816
Wilbeck, J.S., Rand, J.L., 1981. The Development of a Substitute Bird Model. J. Eng. Power 817
103, 725. doi:10.1115/1.3230795 818
Xue, L., Coble, C.R., Lee, H., Yu, D., Chaparala, S., Park, S., 2013. Dynamic Analysis of 819
Thin Glass Under Ball Drop Impact With New Metrics, in: Volume 1: Advanced 820
Packaging; Emerging Technologies; Modeling and Simulation; Multi-Physics Based 821
Reliability; MEMS and NEMS; Materials and Processes. ASME, p. V001T03A006. 822
doi:10.1115/IPACK2013-73291 823
Zhang, X., Hao, H., Ma, G., 2013. Laboratory test and numerical simulation of laminated 824
glass window vulnerability to debris impact. Int. J. Impact Eng. 55, 49–62. 825
doi:10.1016/j.ijimpeng.2013.01.002 826
827

35
Figure Captions: 828
Figure 1: Cumulative probability of failure for 2.2 and 4.0 mm chemically strengthened glass 829
tested using ring-on-ring flexural experiment. 830
Figure 2: (a) Manufacture of a thin-walled, light weight carrier for a silicon rubber projectile 831
(diameter of 23.5 mm and length of 50 mm). (b) Interaction of the projectile and its carrier with 832
a 5 mm aluminium alloy plate. The plate is painted black to visualise the deformation of the 833
projectile. 834
Figure 3: Schematic of (a) Gas gun and 3D Digital Image Correlation (DIC) setup; (b) clamping 835
used for gas gun experiments and (c) two types of sample configuration prepared. 836
Figure 4: Finite element models used for (a) long-period (1 ms) and (b) short-period (50 µs) 837
simulations. 838
Figure 5: Soft impact results of a laminated glass window (Case 2-Configuration I) at the 839
velocity of 170 m s-1: (a) shows the projectile deformation; (b) and (c) display the out-of-plane 840
displacement and major principal strain contours over the observation area, calculated using 841
DIC. 842
Figure 6: Soft impact results of a laminated glass window (Case 2-Configuration II) at the 843
velocity of 174 m s-1: (a) and (b) display the out-of-plane displacement and major principal 844
strain contours over the observation area, calculated using DIC; (c) shows the history of central 845
out-of-plane displacement and major principal strain (Markers in (c) are 25 µs apart and each 846
corresponds to a contour plot in (a) and (b)); (d) and (e) are the plate profile displacing and 847
rebounding respectively; each profile in (d) and (e) corresponds to a contour plot in (a). 848
Figure 7: Comparison between the strain obtained from strain gauges and that calculated by 849
DIC for a laminated glass plate (Case 2-Configuration II) impacted at velocity of 174 m s-1. 850
36
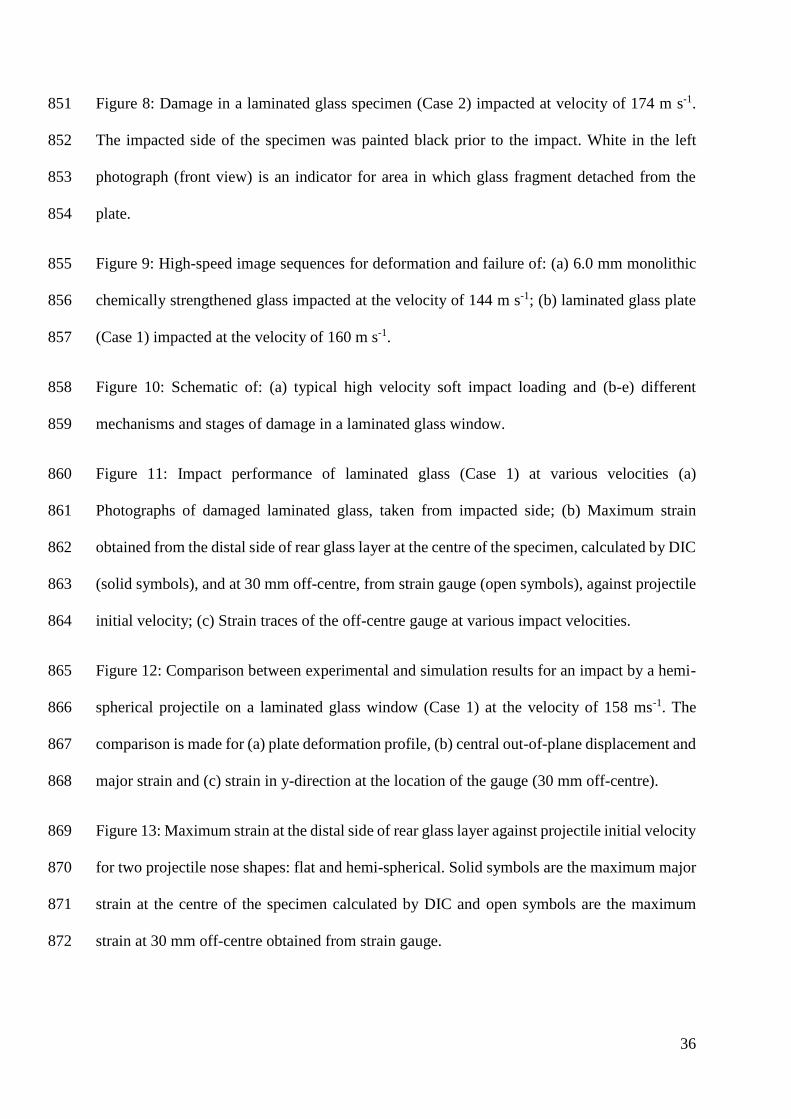
Figure 8: Damage in a laminated glass specimen (Case 2) impacted at velocity of 174 m s-1. 851
The impacted side of the specimen was painted black prior to the impact. White in the left 852
photograph (front view) is an indicator for area in which glass fragment detached from the 853
plate. 854
Figure 9: High-speed image sequences for deformation and failure of: (a) 6.0 mm monolithic 855
chemically strengthened glass impacted at the velocity of 144 m s-1; (b) laminated glass plate 856
(Case 1) impacted at the velocity of 160 m s-1. 857
Figure 10: Schematic of: (a) typical high velocity soft impact loading and (b-e) different 858
mechanisms and stages of damage in a laminated glass window. 859
Figure 11: Impact performance of laminated glass (Case 1) at various velocities (a) 860
Photographs of damaged laminated glass, taken from impacted side; (b) Maximum strain 861
obtained from the distal side of rear glass layer at the centre of the specimen, calculated by DIC 862
(solid symbols), and at 30 mm off-centre, from strain gauge (open symbols), against projectile 863
initial velocity; (c) Strain traces of the off-centre gauge at various impact velocities. 864
Figure 12: Comparison between experimental and simulation results for an impact by a hemi-865
spherical projectile on a laminated glass window (Case 1) at the velocity of 158 ms-1. The 866
comparison is made for (a) plate deformation profile, (b) central out-of-plane displacement and 867
major strain and (c) strain in y-direction at the location of the gauge (30 mm off-centre). 868
Figure 13: Maximum strain at the distal side of rear glass layer against projectile initial velocity 869
for two projectile nose shapes: flat and hemi-spherical. Solid symbols are the maximum major 870
strain at the centre of the specimen calculated by DIC and open symbols are the maximum 871
strain at 30 mm off-centre obtained from strain gauge. 872

37
Figure 14: Finite element simulation result of impact by a flat and hemi-spherical nose 873
projectile on a laminated glass window (Case 1) at the velocity of 131 ms-1. (Left) displays the 874
pressure development inside the projectile and (Right) displays the imposed contact pressure 875
on the front glass layer. 876
Figure 15: Strain development in two central locations: the back side of the front glass layer 877
(location 1) and the back side of the rear glass layer (location 2) for an impact on a laminated 878
glass window (Case 1) at the velocity of 131 ms-1. (a) and (b) shows the strain development in 879
the first 50 µs of impact at the two locations for a flat and hemi-spherical nose respectively. (c) 880
compares the strain development at location 2 for the two nose shapes over the longer period 881
(500 µs). 882
Figure 16: Maximum strain at the distal side of rear glass layer against projectile initial velocity 883
for two laminates with thermally and chemically strengthened glass in the front. Solid symbols 884
are the maximum major strain at the centre of the specimen calculated by DIC and open 885
symbols are the maximum strain at 30 mm off-centre obtained from strain gauge. 886
Figure 17: The effect of glass layer orientation on (a) impact damage of a laminated glass 887
window (Case 1) at the velocity of 146 m s-1 and (b) strain development in the centre point at 888
the back-side of the front glass layer. The results for strain are obtained from finite element 889
simulations at the impact velocity of 131 m s-1. 890
891
Table 1: Different configurations of samples used in this investigation. 892
Table 2: Prony series material constants extracted for TPU (KRYSTALFEX®PE499). 893
894

38
Figure 1: 895
896
897
898

39
Figure 2: 899
900
901

40
Figure 3: 902
903
904

41
Figure 4: 905
906
907

42
Figure 5:

43
Figure 6:

44
Figure 7:

45
Figure 8:

46
Figure 9:

47
Figure 10:
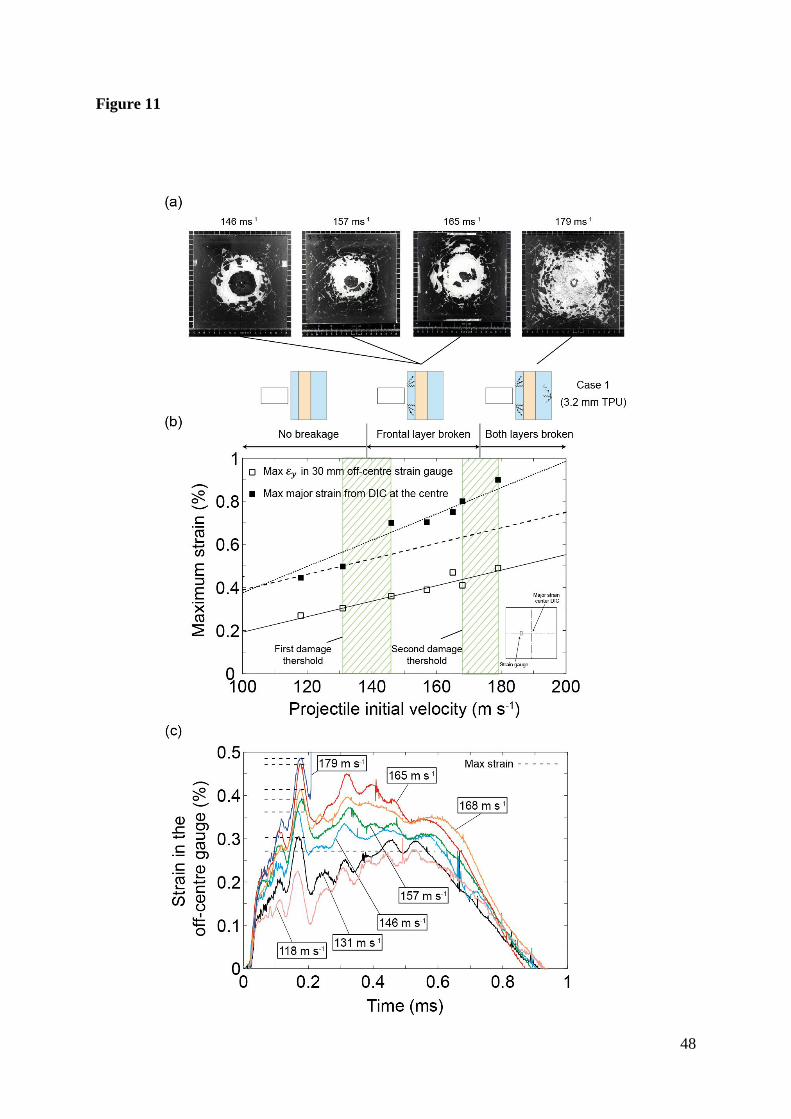
48
Figure 11
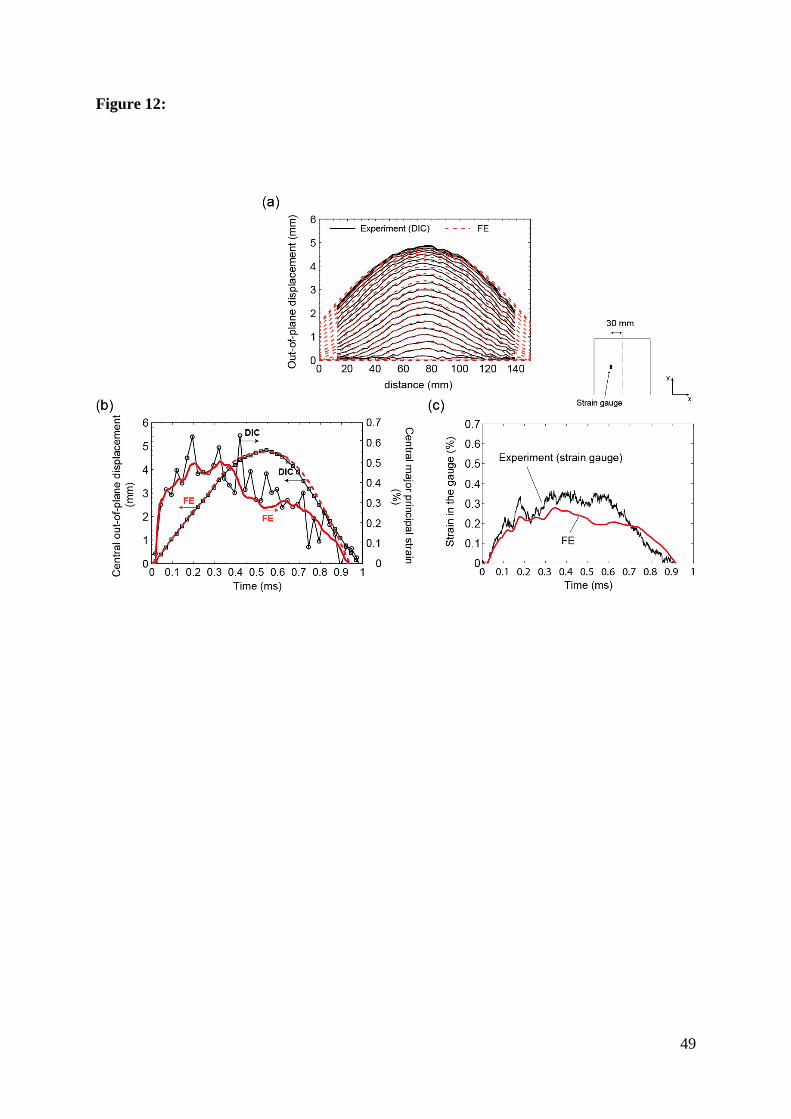
49
Figure 12:

50
Figure 13:

51
Figure 14:

52
Figure 15:

53
Figure 16:

54
Figure 17:

55
Table 1
Configuration Glass and polymer layers
Average
plate
thickness
(mm)
Metallic
spacer
size
(mm)
Case 1 2.2 mm CT(i) /1.27+1.91 mm TPU(ii)/4.0 mm CT 9.2 17.1
Case 2 2.2 mm TT(iii)/1.27+1.91mm TPU/4.0 mm CT 9.4 17.1
Case 3 6.0 mm CT 6.0 13.8
(i) Chemically toughened glass
(ii) Themoplastic Polturethane (KRYSTALFEX®PE499)
(iii) Thermally toughened glass
Table 2
Gi / Go * 𝜏𝑖 (s)
1 0.44231 10-10
2 0.11511 10-9
3 0.17258 10-8
4 0.08917 10-7
5 0.07606 10-6
6 0.04828 10-5
7 0.02867 10-4
8 0.01444 10-30
9 0.00611 10-2
10 0.00249 10-1

56
11 0.00097 100
12 0.00058 10+1
13 0.00050 10+2
14 0.00041 10+3
15 0.00036 10+4
16 0.00029 10+5
17 0.00016 10+6
Long-term 0.001404 Infinity
* Go is the instantainous shear modulus and it value is equal to: 𝐺∞ + ∑ 𝐺𝑖𝑛𝑖=1