
Deflating the Myths Immigrants and the Use of Medical Services in the United States Leo R. Chavez...
45
Deflating the Myths Immigrants and the Use of Medical Services in the United States Leo R. Chavez April 7, 2008 LMSA Presentation, UCI School of Medicine
-
Upload
josephine-harrington -
Category
Documents
-
view
221 -
download
3
Transcript of Deflating the Myths Immigrants and the Use of Medical Services in the United States Leo R. Chavez...
Deflating the Myths
Immigrants and the Use of Medical Services in the United States
Leo R. ChavezApril 7, 2008
LMSA Presentation, UCI School of Medicine

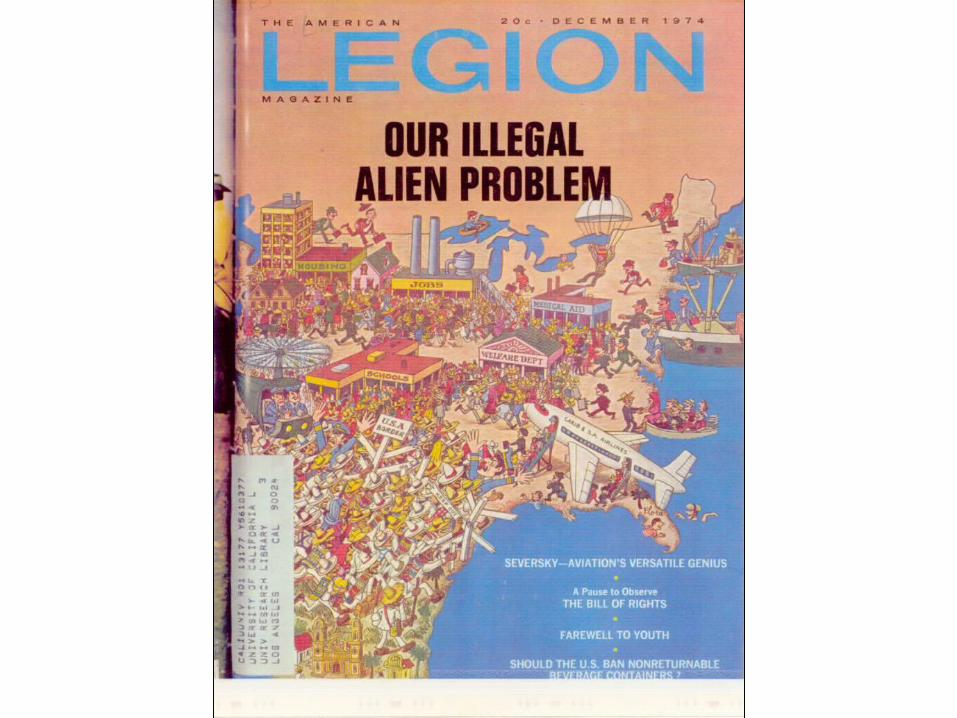
Myth 1
• Today’s immigrants are different from yesterday’s immigrants


Immigrants and disease
• Chinese: plague
• Irish: Typhoid Mary
• Haitians: Aids


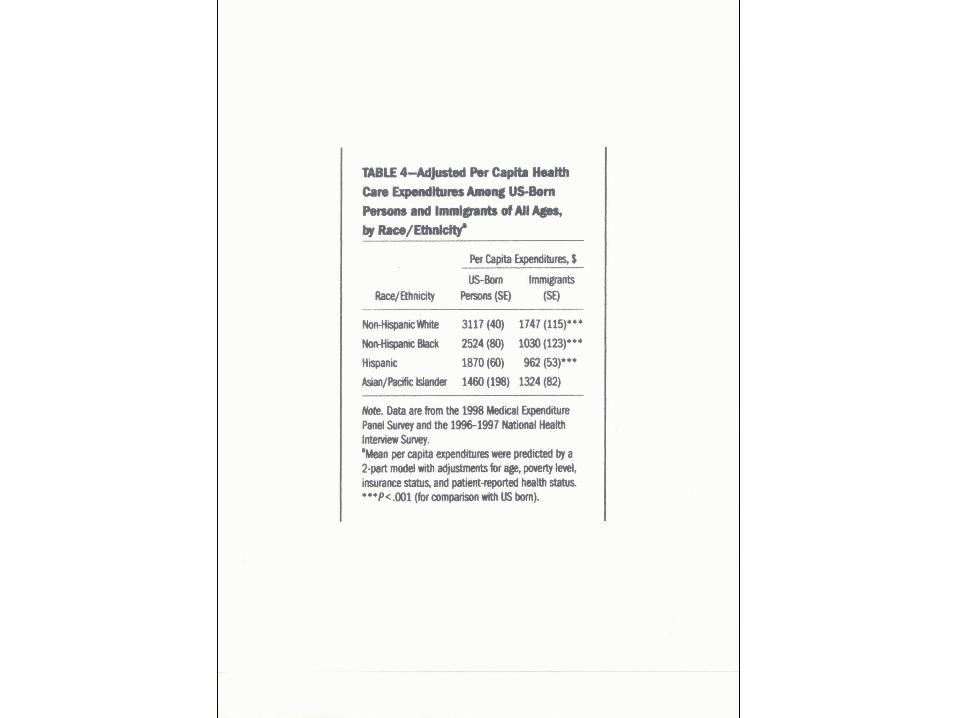
Myth 2
• Today’s immigrants, especially Mexicans and other Latin Americans, are overusing medical services


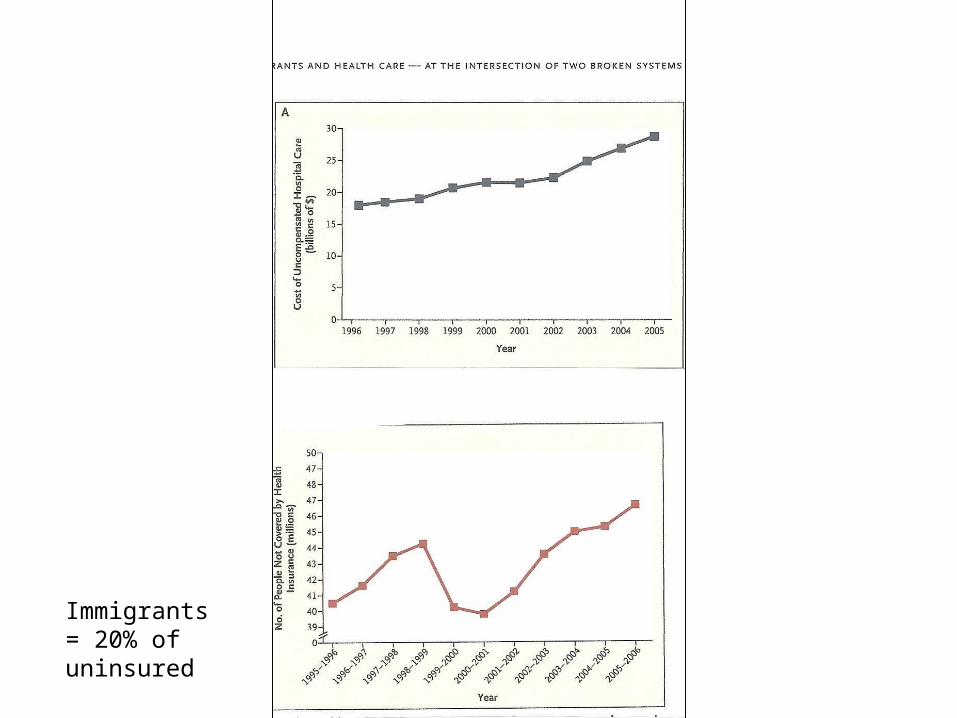
Immigrants = 20% of uninsured


MYTH 3
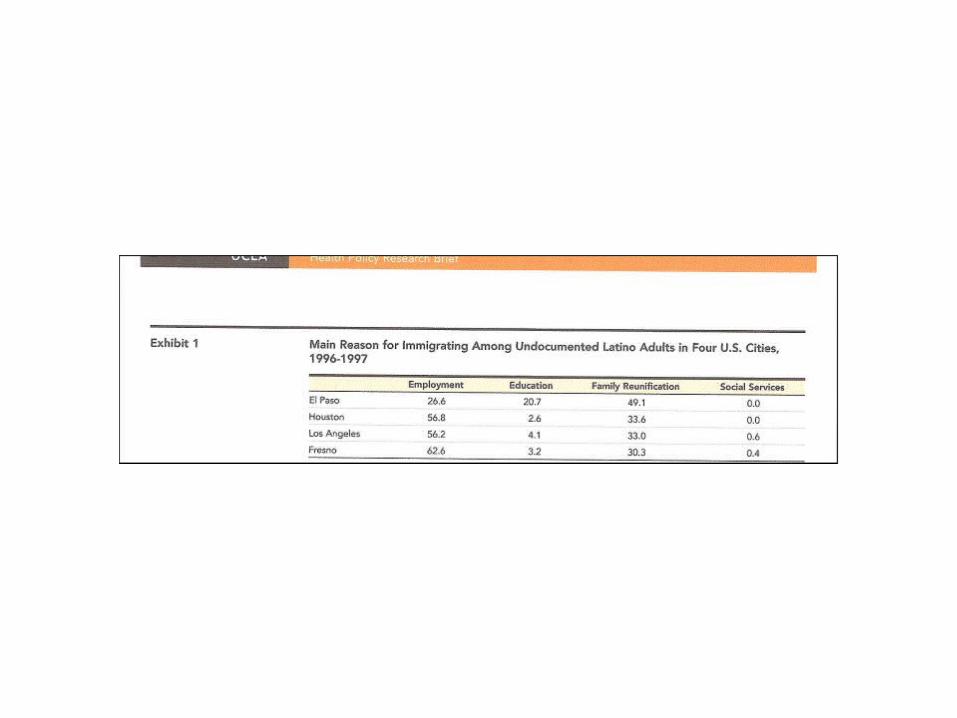
• Giving undocumented immigrants health care and/or medical insurance will act as a magnet resulting in new undocumented migration

MYTH 4
• Latina immigrants and their offspring have excessively high, even pathologically high, fertility levels

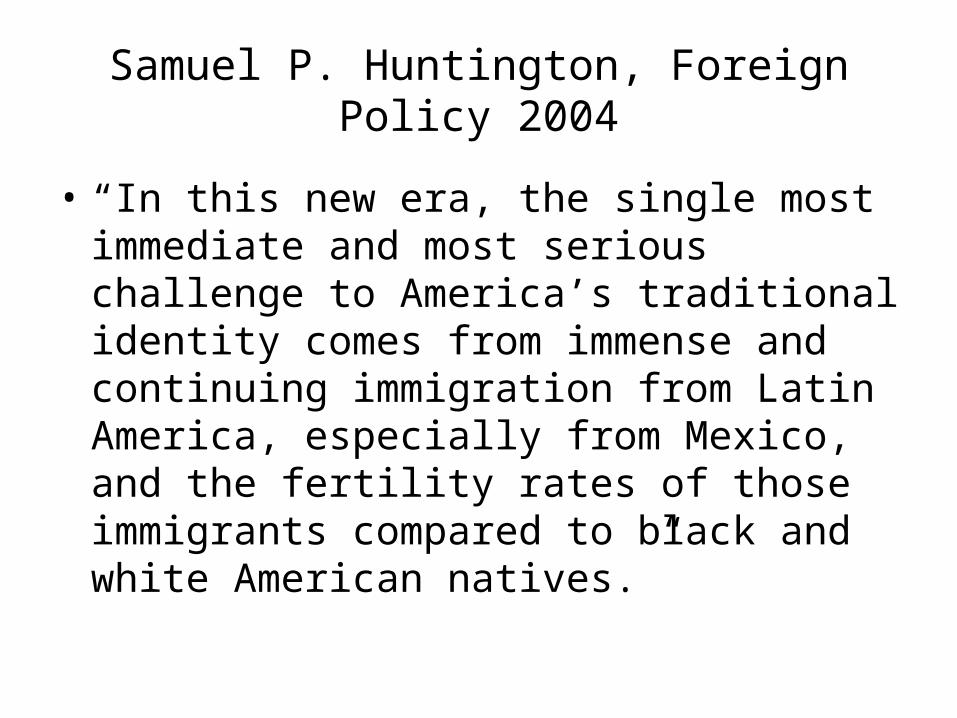
Samuel P. Huntington, Foreign Policy 2004
• “In this new era, the single most immediate and most serious challenge to America’s traditional identity comes from immense and continuing immigration from Latin America, especially from Mexico, and the fertility rates of those immigrants compared to black and white American natives.”

Declines in Fertility
Mexican-origin Women and Anglo Women, ages 18-44
Source: U.S. Census
3.5
1.27
4.4
1.81
1970 20000
1
2
3
4
5
Mexican-origin women Anglo women
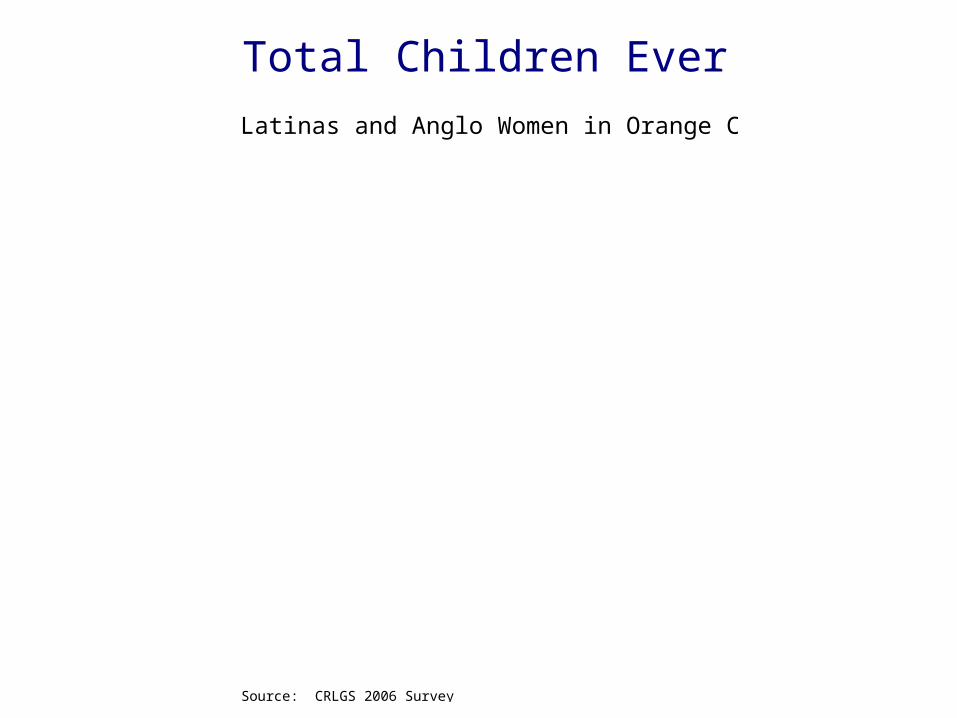
Total Children Ever Born
Latinas and Anglo Women in Orange County
Source: CRLGS 2006 Survey
2.38
1.631.78
2.21
1.91
1.28 1.271.16
Latina immig 2nd Gen 3rd Gen Anglos0
0.5
1
1.5
2
2.5
3
All ages
<45
MYTH 5
• In places that are relatively rich, such as Orange County, health care is good for everyone

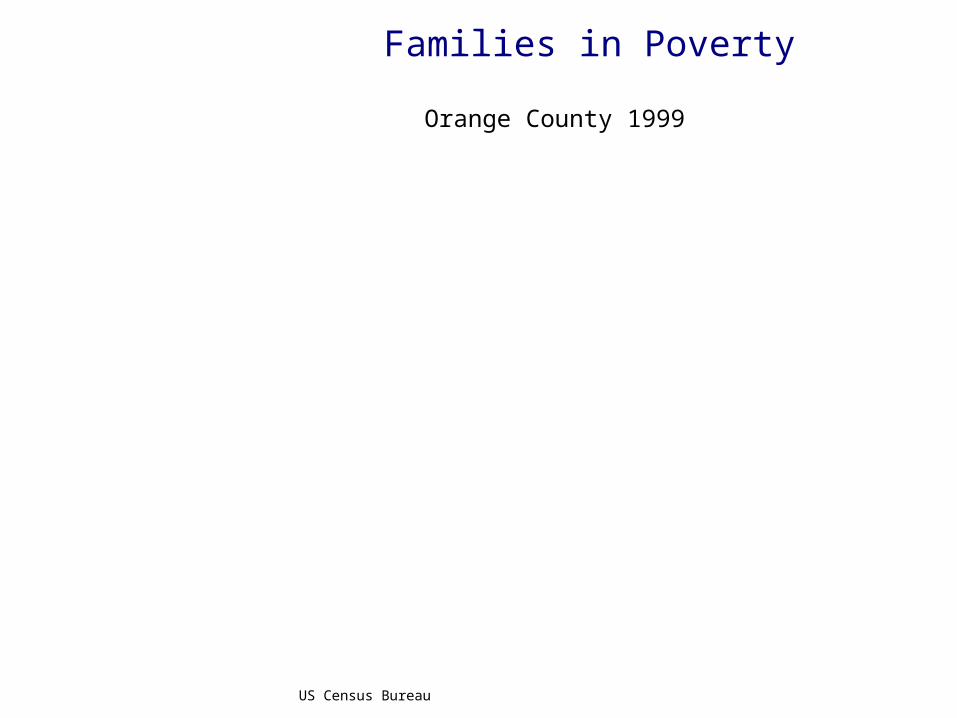
Families in Poverty
Orange County 1999
US Census Bureau
15.8
9.1
2.8
7.9
Latinos Asian Am Whites African Am0
2
4
6
8
10
12
14
16
18
Percent of Families in Poverty
Source: CRLGS 2006

Private or Government Insurance
Latinos (N=805) and Anglos (N=398) in Orange County, California
Source: Center for Research on Lations in a Global Society Survey 2006
45
56
75 73
90
No status Legal Res Naturalized US-born Anglos0
20
40
60
80
100
Percent with Insurance

LACK OF MEDICAL CARE
“I don’t have insurance. In my opinion, if one doesn’t have insurance, it’s bad because, well, here cures are expensive and, well you know, sometimes for many people, what we earn is not enough even to eat and live. So when we have these types of illnesses, we don’t go to the doctor because of a lack of money.”
Mexican Immigrant

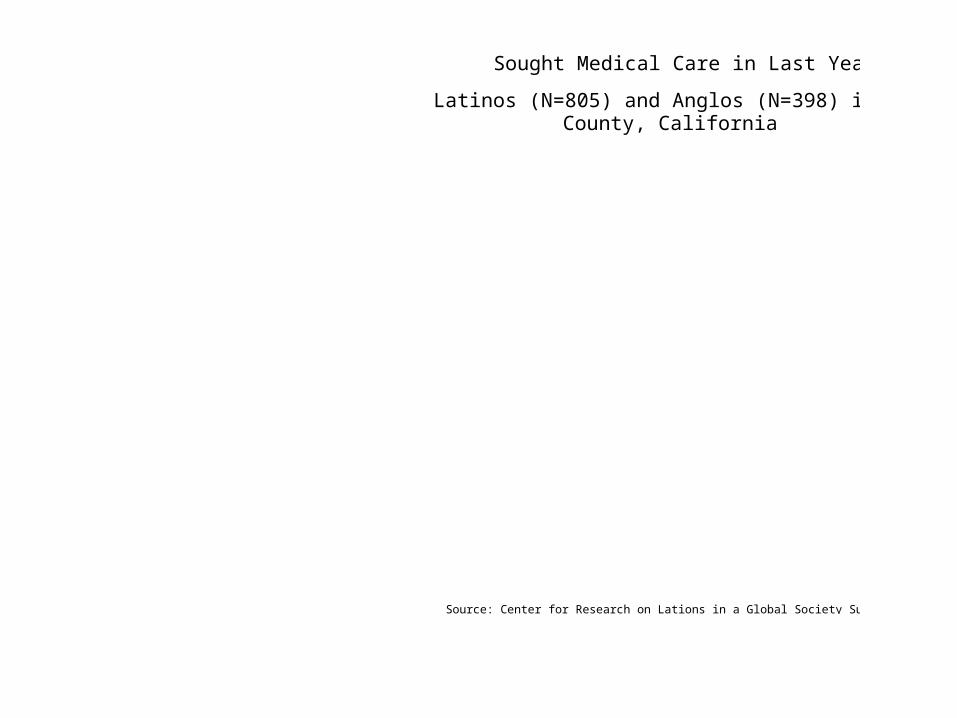
Sought Medical Care in Last Year
Latinos (N=805) and Anglos (N=398) in Orange County, California
Source: Center for Research on Lations in a Global Society Survey 2006
55
68
78 80
89
No status Legal Res Naturalized US-born Anglos0
20
40
60
80
100
Percent with Insurance
Sought Medical Care in Last Year
Latinos (N=805) and Anglos (N=398) in Orange County, California
Source: Center for Research on Lations in a Global Society Survey 2006
55
68
78 80
89
No status Legal Res Naturalized US-born Anglos0
20
40
60
80
100
Percent with Insurance
Private or Government Insurance
Latinos (N=805) and Anglos (N=398) in Orange County, California
Source: Center for Research on Lations in a Global Society Survey 2006
45
56
75 73
90
No status Legal Res Naturalized US-born Anglos0
20
40
60
80
100
Percent with Insurance

Variable Beta S.E. Exp(B) Significance
Years in U.S./Age .011 .006 1.01 .045Private/Gov’t Insurance .941 .177 2.56 .000Latino/Anglo .198 .271 1.22 .464$35,000+ Family Income .509 .193 1.66 .008Male/Female .789 .170 2.20 .00013+ Years of School .441 .199 1.55 .027
Constant -3.589 .484 0.03 .000Model X2 = .000.
Table 6. Logistic Regression. Dependent variable: Sought medical care in U.S. in last 12 months. Latinos and Anglos in Orange County, California.
Source: Center for Research on Latinos in a Global Society Telephone Survey 2006.

Source: CRLGS Survey 2006
Table Logistic Regression. Dependent variable: Sought medical care in U.S. in last 12 months. Latinos Only in Orange County, California.
Variables in the Equation
.855 .193 19.689 1 .000 2.352
.254 .227 1.254 1 .263 1.289
.720 .216 11.172 1 .001 2.055
.482 .228 4.456 1 .035 1.619
-.005 .198 .001 1 .981 .995
.917 .195 21.995 1 .000 2.501
-4.034 .585 47.611 1 .000 .018
privgovins2
incomecat2
undoclegal
educcategory
kidliveswith
sex
Constant
Step1
a
B S.E. Wald df Sig. Exp(B)
Variable(s) entered on step 1: privgovins2, incomecat2, undoclegal, educcategory,kidliveswith, sex.
a.

MYTH 6
• Immigrants are unhealthy that is why they use so much health care

Low Birth Weight (<2,500 grams) per 1000 Live Births
In Orange County, by selected groups
OC HCA 2002
53
71
60
93
Latinos Asian Am Whites African Am0
20
40
60
80
100
120
Number of Low Weight Babies Per 1,000 Live Births

Heart Disease Orange County
Age Adjusted, per 100,000
OC HCA 2002
168 169
257
366
Latinos Asian Am Whites African Am0
100
200
300
400
Heart Disease Rate per 100,000
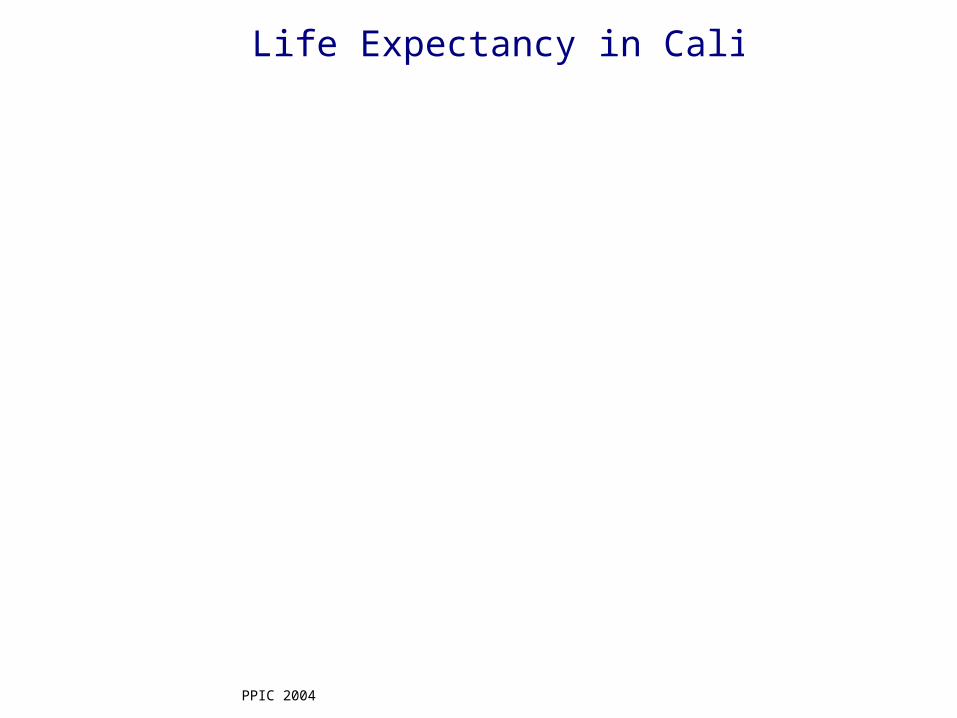
Life Expectancy in California
PPIC 2004
81 8378
72
Latinos Asian Am Whites African Am0
20
40
60
80
100
Expected Years of Life

MYTH 7
• Immigrants are just “takers” not “contributors”

Contributions
• $25 billion agricultural industry in California and Orange County
• $15 billion in remittances to families and communities in Mexico
• $7 billion a year in subsidies to Social Security by undocumented immigrants


