Definition of Energy Efficiency Indicators in ODYSSEE database
56
Glossary energy efficiency The sole responsibility for the content of this report lies with the authors. It does not necessarily reflect the opinion of the European Communities. The European Commission is not responsible for any use that may be made of the information contained therein. 2 Definition of data and energy efficiency indicators in ODYSSEE data base Project: ODYSSEE-MURE EU-27
Transcript of Definition of Energy Efficiency Indicators in ODYSSEE database

Glossary energy efficiency
The sole responsibility for the content of this report lies with the authors. It does not necessarily reflect the opinion of the European Communities. The European Commission is not responsible for any use that may be made of the information
contained therein.
2
Definition of data and energy efficiency indicators in
ODYSSEE data base
Project: ODYSSEE-MURE EU-27

Glossary energy efficiency
The sole responsibility for the content of this report lies with the authors. It does not necessarily reflect the opinion of the European Communities. The European Commission is not responsible for any use that may be made of the information
contained therein.
3
Content
1. INTRODUCTION ................................................................................................. 1
1.1. Why energy efficiency indicators? .............................................................................. 1
1.2. What are the energy efficiency indicators .................................................................. 2 1.2.1. Indicators to monitor energy efficiency trends ...................................................... 2 1.2.2. Comparison indicators ............................................................................................ 3 1.2.3. Diffusion indicators ................................................................................................ 3
1.3. List of indicators by sector .......................................................................................... 4
2. MACRO DATA AND INDICATORS .................................................................... 8
2.1. Macro economy and energy balance data .................................................................. 8
2.1.1. Final and primary energy consumption .................................................................. 8 2.1.2. GDP, value added ................................................................................................... 8 2.1.3. Deflator and constant prices ................................................................................... 9 2.1.4. Index, annual growth rate ..................................................................................... 10
2.1.5. Exchange rate, purchasing power parity .............................................................. 10
2.2. Headline Indicators .................................................................................................... 10
2.2.1. Primary energy intensity ...................................................................................... 10 2.2.2. Final energy intensity ........................................................................................... 11
2.2.3. Ratio final/primary intensities .............................................................................. 12 2.2.4. Primary or final energy intensity with climatic corrections ................................. 12
2.3. Issue Indicators ........................................................................................................... 13
2.3.1. Final energy intensity at constant GDP structure ................................................. 13 2.3.2. Energy efficiency index ....................................................................................... 14
2.4. Comparison Indicators .............................................................................................. 15 2.4.1. Primary or final energy intensity at purchasing power parities ........................... 15 2.4.2. Final energy intensity at reference climate .......................................................... 16 2.4.3. Final energy intensity at reference economic structure ........................................ 16
3. INDUSTRY ........................................................................................................ 17
3.1. Data for industry ........................................................................................................ 17
3.1.1. Final energy consumption of industry .................................................................. 17 3.1.2. Classification of industry by industrial branch .................................................... 18
3.2. Headline Indicators ...................................................................................................... 1 3.2.1. Energy intensity of industry, manufacturing, primary metals … ........................... 1 3.2.2. Unit consumption of steel, cement, paper and glass .............................................. 2
3.3. Issue indicators ............................................................................................................. 2 3.3.1. Energy intensity of manufacturing at constant structure ........................................ 2 3.3.2. Energy efficiency index in industry ....................................................................... 3

Glossary energy efficiency
The sole responsibility for the content of this report lies with the authors. It does not necessarily reflect the opinion of the European Communities. The European Commission is not responsible for any use that may be made of the information
contained therein.
4
3.4. Indicators of comparisons ........................................................................................... 4 3.4.1. Energy intensity of industry at reference structure ................................................ 4
4. TRANSPORT ...................................................................................................... 5
4.1. Data on transport ......................................................................................................... 5 4.1.1. Final energy consumption of transport sector ........................................................ 5
4.1.2. Traffic in ton-km, pass-km,or gross-ton-km .......................................................... 6 4.1.3. Stock and sales of vehicles ..................................................................................... 6 4.1.4. Average distance by type of vehicle or traffic of vehicles ..................................... 6 4.1.5. Specific consumption of vehicles ........................................................................... 7 4.1.6. Specific consumption of new cars .......................................................................... 7
4.2. Headline Indicators ...................................................................................................... 7 4.2.1. Energy intensity of transport .................................................................................. 7
4.2.2. Unit consumption of gasoline vehicles .................................................................. 8
4.2.3. Unit consumption of rail transport ......................................................................... 8 4.2.4. Unit consumption of water transport ...................................................................... 8 4.2.5. Unit consumption of air transport .......................................................................... 9 4.2.6. Unit consumption of domestic air transport ........................................................... 9
4.3. Issue Indicators ............................................................................................................. 9 4.3.1. Unit consumption of gasoline vehicules per equivalent car ................................... 9
4.3.2. Unit consumption of road transport per equivalent car ........................................ 10 4.3.3. Unit consumption of cars ..................................................................................... 10 4.3.4. Unit consumption of cars per passenger-km ........................................................ 11
4.3.5. Unit consumption of trucks and light vehicles ..................................................... 11 4.3.6. Unit consumption of diesel of heavy vehicles ..................................................... 11
4.3.7. Unit consumption of road transport of goods (per ton-km) ................................. 12 4.3.8. Unit consumption of passenger transport ............................................................. 12
4.3.9. Unit consumption of passenger transport at constant modal split ........................ 12 4.3.10. Unit consumption of goods transport ................................................................... 13
4.3.11. Unit consumption of goods transport at constant modal split .............................. 13 4.3.12. Energy efficiency index for transport ................................................................... 14
4.4. Comparison indicators ............................................................................................... 14 4.4.1. Unit consumption of passenger transport at reference modal split ...................... 14 4.4.2. Unit consumption of goods transport at reference modal split ............................ 14
5. HOUSEHOLDS ................................................................................................. 15
5.1. Data .............................................................................................................................. 15 5.1.1. Dwellings and characteristics ............................................................................... 15 5.1.2. Household electrical appliances and lighting ....................................................... 15
5.1.3. Household energy consumption by end-use ......................................................... 16
5.2. Headline Indicators .................................................................................................... 17 5.2.1. Unit consumption of households per dwelling ..................................................... 17 5.2.2. Unit consumption of electricity of households per dwelling ............................... 17 5.2.3. Unit consumption of households per dwelling with climatic corrections ............ 17 5.2.4. Unit consumption of households per m2.............................................................. 18
5.3. Issue Indicators ........................................................................................................... 18
Glossary energy efficiency
The sole responsibility for the content of this report lies with the authors. It does not necessarily reflect the opinion of the European Communities. The European Commission is not responsible for any use that may be made of the information
contained therein.
5
5.3.1. Unit consumption for space heating ..................................................................... 18 5.3.2. Specific consumption of new dwellings............................................................... 19
5.3.3. Unit consumption per dwelling for lighting and electrical appliances ................. 19 5.3.4. Specific consumption of new refrigerators and freezers ...................................... 19 5.3.5. Energy efficiency index of households ................................................................ 19
5.4. Comparison indicators ............................................................................................... 20 5.4.1. Unit consumption (per m2 or dwelling ) for space heating per degree-day ......... 20 5.4.2. Unit consumption (per m2 or dwelling ) for space heating scaled to the average
european climate .................................................................................................................. 20 5.4.3. Unit consumption (per m2 or dwelling ) scaled to the average european climate 20
5.4.4. Useful consumption (per m2 or dwelling ) for space heating per degree-day ..... 21
6. SERVICE SECTOR ........................................................................................... 21
6.1. Data .............................................................................................................................. 21
6.2. Headline Indicators .................................................................................................... 22 6.2.1. Energy intensity of service sector ........................................................................ 22 6.2.2. Unit consumption of service sector ...................................................................... 22
7. AGRICULTURE ................................................................................................ 22
8. ENERGY EFFICIENCY INDEX : ODEX ............................................................ 23 ▪ Energy savings ............................................................................................................. 23
▪ Choice of the weighting system ................................................................................... 24 ▪ Weighting system in ODEX ......................................................................................... 25
▪ ENERGY EFFICIENCY INDEX IN INDUSTRY ................................................. 26
▪ ENERGY EFFICIENCY INDEX IN TRANSPORT ............................................. 26
▪ ENERGY EFFICIENCY INDEX IN HOUSEHOLDS .......................................... 27

The sole responsibility for the content of this report lies with the authors. It does not necessarily reflect the opinion of the European Communities. The European Commission is not responsible for any use that may be made of the information
contained therein.
1

Energy efficiency indicators in ODYSSEE
The sole responsibility for the content of this report lies with the authors. It does not necessarily reflect the opinion of the European Communities. The European Commission is not responsible for any use that may be made of the information
contained therein.
1
1. Introduction
This report provides a methodological guideline for the data necessary for the calculation of
energy efficiency indicators for the ODYSSEE database. An Excel template is used by energy
agencies or their representatives (partners of the ODYSSEE-MURE project) to provide all the
data useful for the calculation of energy efficiency indicators, following the classification of
EUROSTAT.
This methodological report explains how the ODYSSEE indicators are calculated, with a full
description of all the indicators by sector with all the equations and necessary explanation for
the interpretation of their trends. The raw data useful for the calculations of energy efficiency
indicators are also clearly identified and defined in the different sectors.
1.1. Why energy efficiency indicators?
Energy efficiency indicators have several objectives :
- monitoring of the targets set at the national and international levels in energy
efficiency and CO2 abatement programmes.
- evaluation of the energy efficiency policy and programmes. Ministries, energy
agencies or organisations in charge of the implementation of energy efficiency
programmes need to provide regular evaluations to justify their action and the large
amounts of public money that have been spent to support these programmes or to
operate the energy efficiency agencies.
- planning of future actions, including R&D programmes,
- feeding the energy demand forecasting models and improving the quality of forecasts;
technico-economic models, that are characterised by a high level of desegregation
(end-uses), make use of energy efficiency indicators to account for future changes in
energy efficiency.
- and, finally, cross-country comparisons, a crucial question in connection with
international negotiations on climate change.
The set of indicators presented here have been selected and defined so as to enable countries
to review their achievements in the field of energy efficiency and CO2 emissions, in a
comparable manner among countries, and to compare their energy efficiency performance
among EU countries.
To reach this objective of harmonisation, the indicators are set up as follows:
- The data collection is decentralised and carried out by national teams, in general the
national energy efficiency agency associated with the national statistical organisation,
so as to get the best data available.
- The data will are centralised in a common data base managed by Enerdata
- The control of the harmonisation of data definition and disaggregation is carried out
by Enerdata.

Energy efficiency indicators in ODYSSEE
The sole responsibility for the content of this report lies with the authors. It does not necessarily reflect the opinion of the European Communities. The European Commission is not responsible for any use that may be made of the information
contained therein.
2
- The energy efficiency and CO2 indicators are calculated for all countries with a
common methodology, both in a central data base and in the data sheet used by
national teams to fill in the data.
1.2. What are the energy efficiency indicators
Energy efficiency indicators considered here are macro-indicators, defined at the level of the
economy as a whole, of a sector, or a sub-sector (industrial process, mode of transport, or end-
use or in the household sector).
Three types of indicators are considered according to their role:
• Indicators to monitor trends in energy efficiency and CO2 abatement by country:
descriptive and explanatory indicators
• Indicators to compare the energy efficiency “performance” level of a country with
other countries
• Diffusion indicators to measure the diffusion (i.e. the market penetration) of efficient
technologies and practices
1.2.1. Indicators to monitor energy efficiency trends
Four types of indicators are considered to monitor energy efficiency trends:
- Energy/carbon intensities, relating an energy consumption (measured in energy
units: toe, Joule ...), or CO2 emissions to an indicator of activity measured in
monetary units (Gross Domestic Product, value added ...).
- Technico-economic ratios or unit consumption/ unit CO2 emission, relating energy
consumption or CO2 emission to an indicator of activity measured in physical terms:
(l/100 km for car, toe per ton of cement, kWh per refrigerator, goe per m2 for space
heating in dwelling etc.).
- Index of energy efficiency progress, called “ODEX”, defined at the level of sectors
(industry, transport, households) or of the whole economy (all final consumers). This
index is obtained by aggregating the unit consumption changes at detailed levels, by
sub-sector or end-use, observed over a given period. The unit consumption variation is
measured in terms of index, which enable the use of various units for the detailed
indicator (kWh/appliance, toe/m2…). Using relevant physical parameters, the ODEX
indicator provides a good “proxy” of the energy efficiency progress from a policy
evaluation viewpoint. ODEX is an alternative to the aggregate monetary energy
intensities to monitor energy efficiency trends by sector, as intensities include many
factors that are not directly linked to energy efficiency. In a similar way, a CO2 index
can be calculated
- Energy/ CO2 savings, expressing the variations of the ODEX, in terms of amount of
energy saved (in Mtoe) or CO2 saved (in Mt), in comparison to a situation without
energy efficiency progress.

Energy efficiency indicators in ODYSSEE
The sole responsibility for the content of this report lies with the authors. It does not necessarily reflect the opinion of the European Communities. The European Commission is not responsible for any use that may be made of the information
contained therein.
3
These indicators can be gathered in 3 groups, according to their level of complexity and their
capacity to explain the trends observed:
- Headline/ descriptive indicators that mainly describe overall energy efficiency
trends, from a macro-economic point of view; these descriptive indicators are
calculated from usual official economic and energy statistics, as a direct ratio
between an energy consumption and a macro-economic variable.
- Explanatory/issue indicators, that go into more details (end-use, mode of
transport) and aims at explaining trends observed for the headline indicators; such
issue indicators may rely on usual statistics but also may be estimated or derived
from surveys; they usually imply some calculation procedures using a
conventional methodology ("calculated ratios"). Intensities at constant structure,
ODEX or energy savings are explanatory indicators.
1.2.2. Comparison indicators
Two types of indicators are proposed to compare energy performances across countries:
• Adjusted indicators, that are adjusted for structural differences between countries to
enable more accurate cross-country comparisons; the adjustments correct for
differences in the countries’ economic (general price level, economic and industry
structure), geographic or climatic situations. The EU average is usually taken as the
reference for the adjustments. The adjustment to the same price level is done by using
power purchasing parities. To be meaningful, the comparison should be made on the
most recent year available and at current purchasing power parities or at constant
power parities, with a recent base year (e.g. at 2005 ppp)
• Benchmark or target indicators, that indicates for a given country the gap between
the actual values of some indicators and benchmark/target values. They are
calculated for each country with the countries characteristics and the energy
performance of “target countries” (e.g. the best EU performance) or benchmark
values. The gap between the observed value for a given indicator and the target/
benchmark value can show a feasible potential of energy efficiency improvement.
1.2.3. Diffusion indicators
These indicators aim at complementing the existing energy efficiency indicators. They are be
in principle easier to monitor and more rapidly updated than energy efficiency indicators that
depend on the availability of data on end-use consumption.
Three types of indicators are considered:
• Market penetration of efficient technologies: number of efficient lamps sold, % of
label A in new sales of electrical appliance, …
• Diffusion of energy efficient practices, % of passenger transport by public modes, by
non motorised modes; % of transport of goods by rail by combined rail-road transport,
% of efficient process in industry, …
• Market penetration of end-use renewable (number of solar water heaters, % of wood
boilers for heating, …)
Energy efficiency indicators in ODYSSEE
The sole responsibility for the content of this report lies with the authors. It does not necessarily reflect the opinion of the European Communities. The European Commission is not responsible for any use that may be made of the information
contained therein.
4
These indicators can then be used for to complement the evaluation of the sectoral trends in
energy efficiency.
1.3. List of indicators by sector
Altogether, about 200 energy efficiency indicators are proposed by country. Three reasons
explain the necessity to rely on such a large variety of indicators:
• First of all, each indicator answers to a specific question. Questions can be raised
from a policy, economic or, technical viewpoint. Depending on the exact question,
one or several indicators can be considered.
• Finally, energy efficiency has different meaning and frontiers (economic
efficiency, technical efficiency). Depending on the perspective, some indicators
may be more appropriate than others. Energy intensities provide for instance an
assessment of energy efficiency from an economic point of view whereas unit
consumption are more focused on technical energy efficiency.
The selected indicators are presented below by sector in Tables 1 to 5.
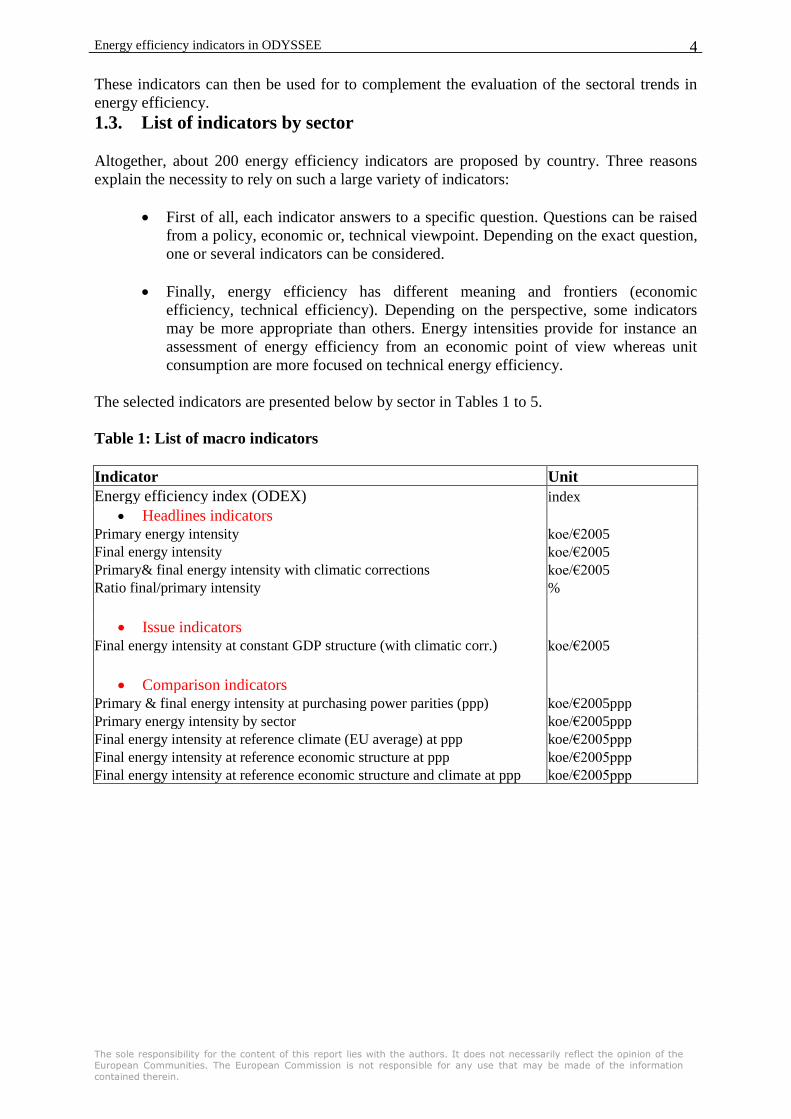
Table 1: List of macro indicators
Indicator Unit
Energy efficiency index (ODEX) index
• Headlines indicators
Primary energy intensity koe/€2005
Final energy intensity koe/€2005
Primary& final energy intensity with climatic corrections koe/€2005
Ratio final/primary intensity %
• Issue indicators Final energy intensity at constant GDP structure (with climatic corr.) koe/€2005
• Comparison indicators Primary & final energy intensity at purchasing power parities (ppp) koe/€2005ppp
Primary energy intensity by sector koe/€2005ppp
Final energy intensity at reference climate (EU average) at ppp koe/€2005ppp
Final energy intensity at reference economic structure at ppp koe/€2005ppp
Final energy intensity at reference economic structure and climate at ppp koe/€2005ppp

Energy efficiency indicators in ODYSSEE
The sole responsibility for the content of this report lies with the authors. It does not necessarily reflect the opinion of the European Communities. The European Commission is not responsible for any use that may be made of the information
contained therein.
5
Table 2: List of indicators for industry
Indicator Unit
Energy efficiency index of industry (ODEX) index
• Headlines indicators
Energy intensity of industry koe/€2005
Energy intensity of manufacturing koe/€2005
Energy intensity of primary metals koe/€2005
Energy intensity of chemicals koe/€2005
Energy intensity of non-metallic minerals koe/€2005
Energy intensity of machinery & fabricated metals
Energy intensity of transport vehicles
koe/€2005
koe/€2005
Energy intensity of food and tobacco koe/€2005
Energy intensity of paper, pulp and printing koe/€2005
Energy intensity of textiles and leathers koe/€2005
Unit consumption of steel toe/t
Unit consumption of cement toe/t
Unit consumption of paper toe/t
Unit consumption of glass toe/t
• Issue indicators
Energy intensity of manufacturing at constant structure koe/€2005
• Comparison indicators Energy intensity of industry at reference structure at ppp
Energy intensity of manufacturing at reference structure at ppp
Unit consumption of steel as a function of share of electric steel
koe/€2005ppp
koe/€2005ppp
toe/ton

Energy efficiency indicators in ODYSSEE
The sole responsibility for the content of this report lies with the authors. It does not necessarily reflect the opinion of the European Communities. The European Commission is not responsible for any use that may be made of the information
contained therein.
6
Table 3: List of indicators for transport
Indicators Unit
Energy efficiency index of transport (ODEX) index
• Headline indicators
Energy intensity of transport related to GDP koe/€2005
Unit consumption of gasoline vehicles toe/vehicle
Unit consumption of rail transport: passenger, goods koe/tkbr
Unit consumption of air transport koe/pass
Unit consumption of domestic air transport koe/pkm
Unit consumption of water transport koe/tkm
Unit consumption of urban transport koe/pkm
• Issue indicators
Unit consumption of road transport per equivalent car toe/car
Unit consumption of road transport per equivalent car toe/car
Specific consumption of new cars (test values) l/100km
Specific consumption of cars l/100km
Unit consumption of cars toe/car
Unit consumption of cars per passenger-km koe/pkm
Unit consumption of diesel heavy vehicles toe/vehicle
Unit consumption of trucks (or trucks and light vehicles) toe/vehicle
Unit consumption of road transport of goods koe/tkm
Unit cons. of passenger transport koe/pkm
Unit consumption of goods transport koe/tkm
Unit cons. of passenger transport at constant modal split koe/pkm
Unit cons. of goods transport at constant modal split koe/tkm
• Comparison indicators
Unit cons. of passenger transport at reference modal split koe/pkm
Unit cons. of goods transport at reference modal split koe/tkm

Energy efficiency indicators in ODYSSEE
The sole responsibility for the content of this report lies with the authors. It does not necessarily reflect the opinion of the European Communities. The European Commission is not responsible for any use that may be made of the information
contained therein.
7
Table 4: List of indicators for households
• Headline indicators
Unit consumption per dwelling toe/dw
Unit consumption of electricity per dwelling kWh/dw
Unit consumption per dwelling with climatic corrections toe/dw
Unit consumption per m2 with climatic corrections koe/m2
• Issue indicators
Unit cons. per dwelling for space heating with climatic corrections toe/dw
Unit cons. per m2 for space heating with climatic corrections koe/m2
Specific cons. of new dwellings (multifamily/single family dwellings toe/dw
Unit cons. per dwelling for lighting and electrical appliances kWh/dw
Specific cons. of electricity of new refrigerators & freezers kWh/dw
Energy efficiency index of households (ODEX) index
• Comparison indicators
Space heating cons per m2 (or dwelling) per degree-day koe/dw/dd
Useful space heating cons per m2 (or dwelling) per degree-day koe/dw/dd
Unit cons. per dwelling (or m2) scaled to European average climate toe/dw
Table 5: List of indicators for services, agriculture and transformations
• Services
Energy intensity of services sector : total, electricity koe/€2005
Unit cons. of services sector per employee : total, electricity toe/emp
Unit cons. of services sector per m2 with climatic corr. :total & electricity koe/m2
Energy intensity of services sector at ppp koe/€ppp
• Agriculture
Energy intensity of agriculture koe/€2005
Table 5: List of indicators for transformations
Efficiency of thermal power plants %
Efficiency of district heating %
Efficiency of cogeneration %
Efficiency of energy sector %
Efficiency of electricity sector %
Percent of CHP in total thermal electricity production %
Overall efficiency of public power plants %
Overall efficiency of autoproducers %

Energy efficiency indicators in ODYSSEE
The sole responsibility for the content of this report lies with the authors. It does not necessarily reflect the opinion of the European Communities. The European Commission is not responsible for any use that may be made of the information
contained therein.
8
2. Macro Data and Indicators
2.1. Macro economy and energy balance data
2.1.1. Final and primary energy consumption
Final energy consumption : it is equal by definition to the difference between the primary
energy consumption and the consumption in energy transformations and losses. Its definition
stems from the accounting rules used to present national energy balances. It represents the
amount of energy that is required by final consumers. It is broken down into different sectors :
industry, transport, households, services and agriculture.
The energy used by the energy industries is not included: for instance, the energy used in coal
mining, power production, or in refineries as well as losses for transmission and distribution
are excluded.
In particular, the final electricity consumption does not correspond to the total electricity
consumption. Table 1 clarifies the differences between the final electricity consumption and
other electricity consumption shown in energy statistics.
To calculate efficiency indicators, non-energy uses are excluded from the final consumption,
as their utilization is not related to energy efficiency considerations, but rather to materials
management.
Table 1: Final electricity consumption and total electricity consumption
Final electricity consumption
+
Consumption in energy industries
+
Self consumption of electricity sector
Water pumping
=
Domestic consumption (or net consumption)
+
Losses and self consumption
=
Gross availability (or gross consumption)
The usual conversion of electricity consumption into energy units in the final consumption
(e.g. from kWh to toe or Joule) is based on the calorific value of electricity: 1 000 kWh =
0.086 toe or 1 kWh = 3.6 MJ.
Primary energy consumption : balance of primary production, external trade, marine
bunkers and stock changes. It represents the total energy consumption of a country. It is called
Gross Inland Consumption by Eurostat and Total Primary Energy Supply (TPES) by IEA.
2.1.2. GDP, value added
GDP : Gross Domestic Product : measures the economic activity of a country ; it is usually
measured at market prices. The GDP at market price is the sum of value added at factor
cost, plus indirect taxes less subsidies.

Energy efficiency indicators in ODYSSEE
The sole responsibility for the content of this report lies with the authors. It does not necessarily reflect the opinion of the European Communities. The European Commission is not responsible for any use that may be made of the information
contained therein.
9
Private consumption : total consumption in monetary units of goods and services by
households.
Value added : usual mode of measurement of the net output of a branch or sector in monetary
units ; the value added equals the difference between the gross output and the value of inputs ;
the value added can be measured at factor cost or at market prices.
Factor cost (or factor values) : measurement of value added or GDP that excludes all indirect
taxes and includes all subsidies received. The GDP at factor cost is strictly equal to the sum of
value added at factor cost of agriculture, industry and services.
Market prices (or producer prices) : measurement of value added or GDP, that includes all
indirect taxes but excludes all subsidies. The GDP at market price is the GDP at factor cost
plus indirect taxes less subsidies.
Agriculture value added measures the activity of agriculture, fishing, and forestry.
Industry value added measures the activity of mining, manufacturing, construction and
electricity, gas and water.
Services or tertiary sector value added measures the activity of all public and private
services : wholesale and retail trade, banking, public administration...
2.1.3. Deflator and constant prices
Deflator : price index used to convert a monetary value given in current price into a value at
constant price ; it equals 100 for the reference year of measurement of constant prices (e.g. =
100 in 2005 if the values are measured at constant 2005 prices) ; current price (PRX) divided
by the deflator (DEF) and multiplied by 100 gives constant price (PRC), as follows.
PRC = PRX/DEF x 100
Each macro-economic variable (e.g. GDP, private consumption, value added) has its own
deflator. The consumer price index is the deflator of private consumption.
Constant price : to leave out the inflation, monetary values are measured at constant price of
a given reference year e.g. constant price of 2005. Constant prices are obtained by dividing
current (or normal) prices by a deflator.
The methodology to calculate constant prices based on current prices is explained below.
Use of price deflators (price index) and exchange rate (national currency to €)
GDP xx = GDP / DEFL * DEFL xx/TXCHG xx with:
▪ GDPxx: GDP at constant price of year xx (e.g. 2005);
▪ DEFLxx: price deflator of the GDP with xx as base year (= 100 for base year)
▪ TXCHG : Exchange rate of the base year (eg 2005)
Use of rate of change in volume (TCVOL) compared to the previous year, which measures
the increase in the volume of activity (i.e. by definition the variation of constant prices)

Energy efficiency indicators in ODYSSEE
The sole responsibility for the content of this report lies with the authors. It does not necessarily reflect the opinion of the European Communities. The European Commission is not responsible for any use that may be made of the information
contained therein.
10
We start from the GDP (or VA) at current prices for the reference year of the constant prices
(e.g. 2000) and build the series of constant price year by year from the rate of change in
volume (TCVOLt)
GDPxx (2000)= GDP (2000)
GDPxx (2001)= GDPxx (2000) *(1+TCVOL2001 /100)
GDPxx (2002)= GDPxx (2001) *(1+TCVOL2002 / 100)
………
GDPxx (t)= GDPxx (t-1) *TCVOLt
Before 2000, GDPxx (t-1)= GDPxx (t) /TCVOLt
2.1.4. Index, annual growth rate
Index : mode of expression of a variable (e.g. consumption, intensity) reflecting the variation
compared to a reference year, for which the index equals 100 by definition : I = Xt/X0 x 100.
If the reference year is 1980, the index of 1980 = 100 (1980 = 100) ; an index of 150 in 1985
means that the variable has increased by 50 % between 1980 and 1985 ; an index of 80 means
a reduction of 20 % between 1980 and 1985.
Annual growth rate : mode of measurement of the average annual variation of a variable (X)
over a period ; it is calculated as follows between year m and n :
((Xm/Xn)1/m-n
-1) x 100
2.1.5. Exchange rate, purchasing power parity
Exchange rate (of €) : coefficient used to convert a monetary value expressed in national
currency into €; it measures the average value over a year of 1 € in national currency ; the
conversion in € is obtained by dividing the value in national currency by the exchange rate.
To convert in € of a given year (e.g. €2005), it is necessary to express first the values in
national currency at constant price of 2005, then to divide by the 2005 exchange rate.
Purchasing power parity (PPP) : measures the rate of currency conversion that equalises the
purchasing power of different currencies.
The purpose of purchasing power parities is to eliminate the difference in price level, so as to
improve the comparison of volumes.
2.2. Headline Indicators
2.2.1. Primary energy intensity
The primary energy intensity is the ratio between the total energy consumption of a country
and the GDP. It measures the total amount of energy necessary to generate one unit of GDP.
ietoctpc=toccp / (pibxx/txchg€(2005))*1000 (koe/€ 2005)
with:
toccp: primary energy consumption in Mtoe
pibxx: GDP at constant prices in national currency (base year 2005)
txchg€(2005): coefficient to convert constant prices in national currency in € of 2005

Energy efficiency indicators in ODYSSEE
The sole responsibility for the content of this report lies with the authors. It does not necessarily reflect the opinion of the European Communities. The European Commission is not responsible for any use that may be made of the information
contained therein.
11
This total consumption has different names depending on the organisation in question: it is
called "total primary energy supply"(TPES) by IEA, "gross inland consumption" by
EUROSTAT or, in short, "primary consumption" by many institutions (this name is used in
ODYSSEE).
Electricity is converted from kWh to a common energy unit (toe or Joule) according to the
EUROSTAT/IAE conventions: respectively 0.26 toe/MWh for nuclear power (10.9 MJ/kWh),
0.086 toe/MWh (3.6 MJ/kWh) for hydroelectricity, 0.86 toe/MWh (36 MJ/kWh) for
geothermal.
2.2.2. Final energy intensity
The final energy intensity is the ratio final energy consumption over GDP. ietoctfc=toccf / (pibxx./txchg€(2005))*1000 (koe/€2005)
with:
toccf: final consumption in Mtoe
pibxx: GDP at constant prices in national currency (base year 2005)
txchg€(2005): coefficient to convert constant prices in national currency in € of 2005
Basically, the definition of final consumption is the same as the “final consumption for energy
uses” from EUROSTAT . It differs however from IEA who includes the non-energy uses in
the final consumption. Non-energy uses are excluded in ODYSSEE, as their utilization is not
related to energy efficiency considerations, but rather to materials management.
Electricity is converted from kWh to a common energy unit (toe or Joule) according to the
EUROSTAT/IAE conventions : 0.086 toe/MWh or 3.6 MJ/MWh (calorific value)
Interpretation
Final energy intensities involve all types of factors which help to change the amount of final
energy required to produce one unit of GDP: economic, technical, managerial and
behavioural. More precisely, five types of factors can be identified:
- first of all, changes in the GDP structure between sectors: for instance, the
tertiarisation of the economy, all things being equal, decreases final energy intensity; a
decreasing contribution of energy-intensive branches, such as steel, non metallic
minerals or chemicals, will also result in a decrease in final energy intensity; this first
factor is usually referred to as structural changes in the economy;
- secondly, the spread of energy efficient techniques and equipment or else of more
efficient behaviours and practices;
- thirdly, energy substitutions favouring energies with high end-use efficiency (e.g.
district heating, natural gas, electricity),
- fourthly, other structural changes, such as an increasing share of bigger cars in the
stock of cars or of single family dwellings in the stock of dwellings, or else of cars in
urban traffic;
- finally, an improvement in living standards (i.e. greater confort), with a wider
distribution of energy-consuming appliances: electrical appliances, central heating,
cars, for instance.

Energy efficiency indicators in ODYSSEE
The sole responsibility for the content of this report lies with the authors. It does not necessarily reflect the opinion of the European Communities. The European Commission is not responsible for any use that may be made of the information
contained therein.
12
All these factors usually have contradictory influences: the first three factors have usually
drawn final energy intensities downward, whereas the last two factors tend to increase
intensities, all things being equal. The contribution of the last factor is all the more decisive as
the country is less developed: it probably plays a decisive role in the countries of Central and
Eastern Europe.
2.2.3. Ratio final/primary intensities
It is the ratio final energy intensity/primary energy intensity (i.e. the ratio of final to primary
energy consumption). Divergent trends between the two intensities will be reflected by
changing values for the ratio over time.
For most countries there is a slight decrease in this ratio, indicating that, on average, more and
more primary energy is needed per unit of final energy consumption.
Losses in transformation and distribution are responsible for most of the difference between
primary and final energy consumption; the rest is explained by non energy uses, that are
excluded from the final consumption in ODYSSEE
Interpretation
Different trends in primary and final energy intensities can be explained by five factors:
- changes in the energy supply mix, mainly linked to changes in the electricity
generation mix, since most of the losses (about 3/4) come from electricity generation:
an increase in the share of nuclear power generation increases the gap between the two
intensities; in contrast, an increasing share of hydropower or cogeneration narrows this
gap.
- changes in the efficiency of transformations: for instance, greater efficiency of
thermal power plants (e.g. development of gas combined cycle power plants), reduces
the ratio of primary to final intensity.
- changes in the share of secondary energies (mainly electricity) in final consumption.
- changes in the percentage of energy for non-energy uses, as these consumptions are
included in the primary intensity but excluded from the final intensity.
- finally, changes in the share of imported secondary energies: any increase, for
instance, in electricity imports will decrease transformation losses and narrow the gap
between the two intensities.
2.2.4. Primary or final energy intensity with climatic corrections
The primary or final energy intensity with climatic corrections is a fictive value of these
intensities where the space heating part of the consumption is corrected so as to correspond to
a normal winter (climatic corrections)
The purpose of these climatic corrections is to leave out the influence of cold winter. This is
particularly important when there are large climatic variations from one winter to the other.
Energy efficiency indicators in ODYSSEE
The sole responsibility for the content of this report lies with the authors. It does not necessarily reflect the opinion of the European Communities. The European Commission is not responsible for any use that may be made of the information
contained therein.
13
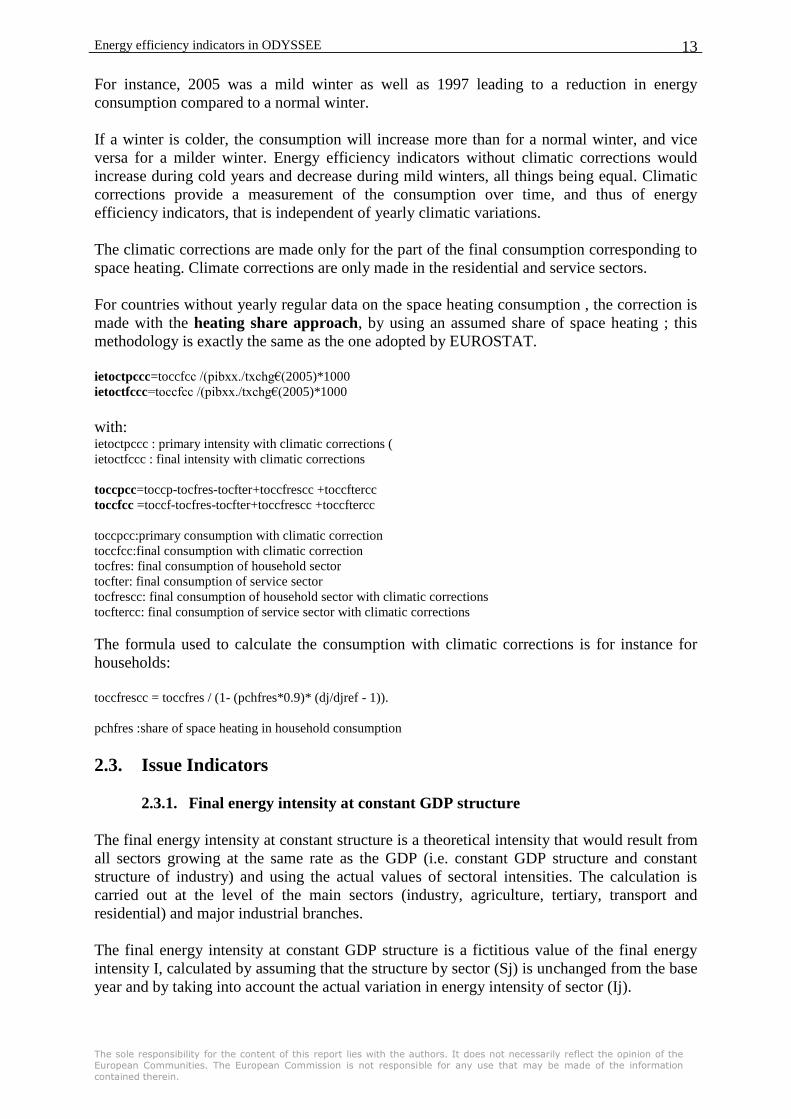
For instance, 2005 was a mild winter as well as 1997 leading to a reduction in energy
consumption compared to a normal winter.
If a winter is colder, the consumption will increase more than for a normal winter, and vice
versa for a milder winter. Energy efficiency indicators without climatic corrections would
increase during cold years and decrease during mild winters, all things being equal. Climatic
corrections provide a measurement of the consumption over time, and thus of energy
efficiency indicators, that is independent of yearly climatic variations.
The climatic corrections are made only for the part of the final consumption corresponding to
space heating. Climate corrections are only made in the residential and service sectors.
For countries without yearly regular data on the space heating consumption , the correction is
made with the heating share approach, by using an assumed share of space heating ; this
methodology is exactly the same as the one adopted by EUROSTAT.
ietoctpccc=toccfcc /(pibxx./txchg€(2005)*1000
ietoctfccc=toccfcc /(pibxx./txchg€(2005)*1000
with: ietoctpccc : primary intensity with climatic corrections (
ietoctfccc : final intensity with climatic corrections
toccpcc=toccp-tocfres-tocfter+toccfrescc +toccftercc
toccfcc =toccf-tocfres-tocfter+toccfrescc +toccftercc
toccpcc:primary consumption with climatic correction
toccfcc:final consumption with climatic correction
tocfres: final consumption of household sector
tocfter: final consumption of service sector
tocfrescc: final consumption of household sector with climatic corrections
tocftercc: final consumption of service sector with climatic corrections
The formula used to calculate the consumption with climatic corrections is for instance for
households:
toccfrescc = toccfres / (1- (pchfres*0.9)* (dj/djref - 1)).
pchfres :share of space heating in household consumption
2.3. Issue Indicators
2.3.1. Final energy intensity at constant GDP structure
The final energy intensity at constant structure is a theoretical intensity that would result from
all sectors growing at the same rate as the GDP (i.e. constant GDP structure and constant
structure of industry) and using the actual values of sectoral intensities. The calculation is
carried out at the level of the main sectors (industry, agriculture, tertiary, transport and
residential) and major industrial branches.
The final energy intensity at constant GDP structure is a fictitious value of the final energy
intensity I, calculated by assuming that the structure by sector (Sj) is unchanged from the base
year and by taking into account the actual variation in energy intensity of sector (Ij).

Energy efficiency indicators in ODYSSEE
The sole responsibility for the content of this report lies with the authors. It does not necessarily reflect the opinion of the European Communities. The European Commission is not responsible for any use that may be made of the information
contained therein.
14
The calculation is based on the Divisia method which is a usual method to separate out what
is due to structural changes from what is due to changes in sectoral intensities in the variation
of the final intensity (see the detailed equations in part 3.3.1 Energy intensity of
manufacturing at constant structure).
For the industry, tertiary and agriculture sectors, the sectoral energy intensities are calculated
as the ratio of final energy consumption to value added. For these sectors, a constant GDP
structure means that their value added increases at the same rate as GDP. In industry, the
intensity is measured at constant structure of industrial at value added, among the usual 10
branches.
For transport, the sectoral energy intensity is calculated as the ratio of transport energy
consumption to GDP.
For the residential sector, finally, the intensity is calculated as the ratio of household energy
consumption to private consumption; for this sector, a constant GDP structure means that
private consumption increases at the same rate as GDP.
This energy intensity at constant structure provides an assessment of energy efficiency trends
cleared of the influence of structural changes. A comparison of I and Is over time shows the
influence of structural changes.
2.3.2. Energy efficiency index
The index of energy efficiency progress, called “ODEX” is defined at the level of sectors
(industry, transport, households, tertiary) or of the whole economy (all final consumers). This
index is obtained by aggregating the unit consumption changes at detailed levels, by sub-
sector or end-use, observed over a given period. The unit consumption variation is measured
in terms of index, which enable the use of various units for the detailed indicator
(kWh/appliance, toe/m2…).
The ODEX for a sector (e.g. industry, transport or households, tertiary) is calculated as a
weighted average of the unit consumption index of each sub-sector or end-use, with a weight
based on the relative consumption of each sub-sector in the base year. For instance,
considering two sub-sectors with a share of the consumption of 60% and 40% respectively in
the base year and a change in the unit consumption from 100 to 85 for the first sub-sector and
100 to 97.5 for the second, the weighted average index is 0.6*(85/100)+0.4* (97.5/100) = 90.
Initially, all variations in unit consumption were measured in relation to a base year (e.g.
1990: in other words, all energy efficiency progress were measured compared to the situation
of 1990 (i.e. the energy performance of 1990). The variation of the ODEX was obtained by
weighting the gains of each sector between t and 1990. The drawback of this approach is that
the results are influenced by the situation of the reference year. Therefore, in the present
calculation, energy efficiency gains are measured in relation to the previous year (“sliding
ODEX”). The sliding ODEX cumulates the incremental energy savings from one year to the
other.
Annex 2 gives more details on the calculation of ODEX.
Energy saving can be easily derived from the index. Indeed, the energy efficiency index can
also be defined as a ratio between the actual energy consumption of the sector in year t and
the sum of fictive energy consumption of each underlying sub-sector /end-use that would
have been observed in year t had the unit consumption of the sub sector been that of a

Energy efficiency indicators in ODYSSEE
The sole responsibility for the content of this report lies with the authors. It does not necessarily reflect the opinion of the European Communities. The European Commission is not responsible for any use that may be made of the information
contained therein.
15
reference year. For instance, if the actual consumption of the sector is 90 Mtoe and if the
unchanged unit consumption in all sub-sectors/end-uses should lead to a sector’s consumption
of 100 Mtoe, the index is equal to 90/ 100 = 0.9 or 90, if expressed as an index. Such an index
of 90 means a 10% energy efficiency gain.
The ODEX-indicator represents a better proxy for assessing energy efficiency trends at an
aggregate level (e.g. overall economy, industry, households, transport, services) than the
traditional energy intensities cited above, as they are cleaned from structural changes and
from other factors not related to energy efficiency (more appliances, more cars…).
The detailed calculation of the ODEX will be presented sector by sector. The global ODEX
calculated for the whole economy is just an aggregate of the ODEX by sector.
2.4. Comparison Indicators
2.4.1. Primary or final energy intensity at purchasing power parities
It is an energy intensity, in which the current GDP is converted into a common currency, in €
using purchasing power parities instead of exchange rates.
ietoctfcpp=toccp / (pibxx./txchgppp)*1000 (koe/€ppp)
ietoctfcpp=toccf / (pibxx./txchgppp)*1000 (koe/€ppp)
with:
toccp: primary consumption in Mtoe
toccf: final consumption in Mtoe
pibxx: GDP in national currency (in constant prices)
txchgppp: coefficient of purchasing parities to convert national prices into purchasing parities
The purpose of purchasing power parities is to eliminate the difference in price level, so as to
improve the comparison of volumes. For example, the per capita GDP was almost 3 times
greater in Germany than in Portugal in 2005. However the difference represents not just a
greater volume of activity on Germany, but also a higher general price level. Expressed in
purchasing power parities, the difference between Germany and Portugal is only a factor of
1.7.
Expressed in purchasing power parities, the GDP of Germany has decreased by 15% and that
of Portugal increased by 50%.
To convert macro-economic data from national currencies to € , it is necessary to divide by
the purchasing power parity.
The use of purchasing power parities instead of exchange rates has two consequences:
- it increases the evaluation of GDP and, thus, decreases the intensity of countries with
the lowest cost of living, which generally correspond to those with the lowest incomes;
conversely, it increases the intensity of the richest countries;
- it narrows the differences between countries.
Therefore, the use of purchasing power parities affects the ranking of intensities among
countries, but does not affect the trends (at constant price the ratio of purchasing power
parities is the same for every year). As economies develop the gap between the two intensities
narrow.

Energy efficiency indicators in ODYSSEE
The sole responsibility for the content of this report lies with the authors. It does not necessarily reflect the opinion of the European Communities. The European Commission is not responsible for any use that may be made of the information
contained therein.
16
2.4.2. Final energy intensity at reference climate
The final energy intensity at reference climate represents a fictitious value of the final
intensity of a country calculated by taking for the household and service sector a consumption
adjusted to a reference climate (see below the definition for households). It is measured at
current purchasing power parities.
2.4.3. Final energy intensity at reference economic structure
The final energy intensity at reference economic structure represents a fictitious value of the
final intensity of a country calculated by taking for each economic sector and industrial
branch the actual sectoral intensity of the country and the economic structure (ie the share of
each sector and branch in the GDP) of a reference country (eg the EU average for instance)
The structure adjustment is made for the following sectors and branches : service, agriculture,
mining, construction ,and the usual 10 manufacturing branches.
For transport, the sectoral energy intensity is calculated as the ratio of transport energy
consumption to GDP.
ietoctfcaj=(vadindxx.ueur-vadimaxx.ueur)*(toccfind-toccfima)/(vadindxx.-vadimaxx.)
+(vadimaxx.ueur/(txchgppp*1000))*ietocimaaj
+vadagrxx.ueur*toccfagr/vadagrxx
+(vadterxx.ueur*toccfter/vadterxx.+pibxx.ueur*toccftra/pibxx.)
+(cprxx.ueur*toccfres/cprxx.))/(pibxx.ueur/txchgppp)*1000 [koe/€ppp]
Note: in this example, the European Union is the reference (ueur)

Energy efficiency indicators in ODYSSEE
The sole responsibility for the content of this report lies with the authors. It does not necessarily reflect the opinion of the European Communities. The European Commission is not responsible for any use that may be made of the information
contained therein.
17
3. Industry
3.1. Data for industry
3.1.1. Final energy consumption of industry
Final energy consumption of industry includes all the fuels used for mining,
manufacturing of industrial goods and construction. It excludes however the energy
consumption of the energy transformation industries (e.g. energy mining, refineries,
power plants, gas plants).
The fuels used by industrial factories for transport purposes, e.g. for their fleet of
vehicles (“transport for own-account”) are not included in industry, but in the transport
sector.
The fuels used in industrial boilers to produce steam are included but not the heat
generated. Only the heat purchased by industrial consumers is considered as a final
consumption of heat.
The fuels used for electricity generation and cogeneration of heat and electricity are
excluded from the final energy consumption of industry. The electricity consumption of
industry combines both purchased and self generated electricity. This mode of
accounting is such that changes in the share of electricity self generated and electricity
purchased do not affect the final energy consumption of industry. This problem has
become especially important now with the priority given in many countries to private
generation (or self generation) by industrial autoproducers. In this accounting, the fuels
inputs for self generation of electricity appear in the line “autoproducers”. In case of
CHP, only the part corresponding to the electricity production is included in this line ;
the part of fuels corresponding to the heat produced appears in the final consumption.
For instance, with a cogeneration in industry with an overall efficiency of 80 % and an
output mix of 25 %/75 % for electricity and heat respectively, 25 % of the fuel input
goes into transformations and the rest goes into the final consumption of fuels of
industry. Table 3 illustrates the methodology of accounting of industrial self-generation
and cogeneration.
In case the final consumption is not available, the fuels used for transportation can be
estimated from the gasoline and diesel consumption. The fuels used for electricity
generation can be derived from the electricity self generated, information that is usually
available. Thus the diesel consumption needs to split into three parts : transportation,
self generation of electricity and the rest, that corresponds to the final consumption.
Energy products used as a raw materials or chemical products are generally separated or
at least identified in the item non energy uses.
Non energy uses : consumption of energy products in the petrochemical sector
(fabrication of organic materials), in the fabrication of ammonia (natural gas), in
furnaces as electrode (carbon), as well as products used for their physico-chemical
properties (asphalt, wax, engine oils, etc...)

Energy efficiency indicators in ODYSSEE
The sole responsibility for the content of this report lies with the authors. It does not necessarily reflect the opinion of the European Communities. The European Commission is not responsible for any use that may be made of the information
contained therein.
18
3.1.2. Classification of industry by industrial branch
Classification of industry : in economic statistics, the output of the industry sector is
measured by the value added. It is broken down into various industrial sectors, or
industrial branches. According to the International Standard Industrial Classification
(ISIC) of economic activity, the industry sector is split into four major branches :
mining, manufacturing, electricity, gas and water, and construction. Manufacturing is
further broken down into various individual branches : the most usual disaggregation,
the two digit one, encompasses 9 branches in the old classification (ISIC Rev 2) and 23
in the new NACE classification (Rev 3) (see table 4) Energy intensive industries such as
steel, cement, correspond to 3 to 5 digits level.
The energy transformation industries (i.e. the energy production and transformation
activities), appear at different levels :
- in mining (coal mining, oil and gas production) (NACE code 10 and 11 ) ;
- in manufacturing (e.g. chemicals for refineries) (NACE 23) ;
- in electricity, gas... (including district heating) (NACE 40-41).
Energy efficiency indicators in ODYSSEE
The sole responsibility for the content of this report lies with the authors. It does not necessarily reflect the opinion of the
European Communities. The European Commission is not responsible for any use that may be made of the information
contained therein.
1
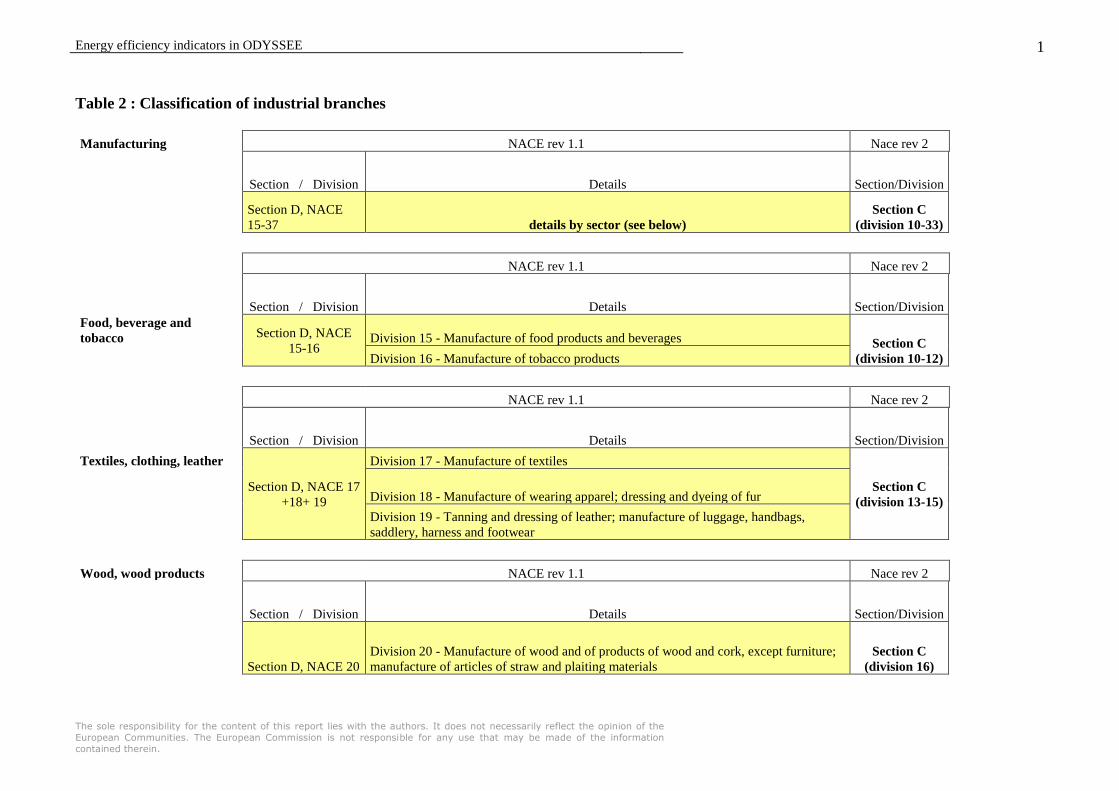
Table 2 : Classification of industrial branches
Manufacturing NACE rev 1.1 Nace rev 2
Section / Division Details Section/Division
Section D, NACE
15-37 details by sector (see below)
Section C
(division 10-33)
NACE rev 1.1 Nace rev 2
Section / Division Details Section/Division
Food, beverage and
tobacco Section D, NACE
15-16 Division 15 - Manufacture of food products and beverages Section C
(division 10-12) Division 16 - Manufacture of tobacco products
NACE rev 1.1 Nace rev 2
Section / Division Details Section/Division
Textiles, clothing, leather
Section D, NACE 17
+18+ 19
Division 17 - Manufacture of textiles
Section C
(division 13-15) Division 18 - Manufacture of wearing apparel; dressing and dyeing of fur
Division 19 - Tanning and dressing of leather; manufacture of luggage, handbags,
saddlery, harness and footwear
Wood, wood products NACE rev 1.1 Nace rev 2
Section / Division Details Section/Division
Section D, NACE 20
Division 20 - Manufacture of wood and of products of wood and cork, except furniture;
manufacture of articles of straw and plaiting materials
Section C
(division 16)

Energy efficiency indicators in ODYSSEE
The sole responsibility for the content of this report lies with the authors. It does not necessarily reflect the opinion of the
European Communities. The European Commission is not responsible for any use that may be made of the information
contained therein.
2
Paper, pulp and printing
products NACE rev 1.1 Nace rev 2
Section / Division Details Section/Division
Section D, NACE
21-22
Division 21 - Manufacture of paper and paper products
Section C
(division 17-18) Division 22 - Publishing, printing and reproduction of recorded media
Chemicals NACE rev 1.1 Nace rev 2
Section/Division Details Section/Division
Section D, NACE 24 Division 24 - Manufacture of chemicals and chemical products
Section C
(division 20-21)
Non metallic minerals NACE rev 1.1 Nace rev 2
Section / Division Details Section/Division
Section D, NACE 26 Division 26 - Manufacture of other non-metallic mineral products
Section C
(division 23)
Iron and steel NACE rev 1.1 Nace rev 2
Section / Division Details Section/Division
Section D, Division
27.1, 27.2, 27.3,
27.51, 27.52
Division 27.1 - Manufacture of basic iron and steel and of ferro-alloys
Section C
(division 24.1)
Division 27.2 - Manufacture of tubes, pipes, hollow profiles and fittings, of steel
Section C
(division 24.2)
Division 27.3 - Manufacture of other products of first processing of steel
Section C
(division 24.3)

Energy efficiency indicators in ODYSSEE
The sole responsibility for the content of this report lies with the authors. It does not necessarily reflect the opinion of the
European Communities. The European Commission is not responsible for any use that may be made of the information
contained therein.
3
Division 27.51 - Casting of iron
Section C
(division 24.51)
Division 27.52 - Casting of steel
Section C
(division 24.52)
NACE rev 1.1 Nace rev 2
Non ferrous metals Section / Division Details Section/Division
Section D, Division
27.4, 27.53, 27.54
Division 27.4 - Manufacture of basic precious and other non-ferrous metals
Section C
(division 24.4)
Division 27.53 - Casting of light metals
Section C
(division 24.53)
Division 27.54 - Casting of other non-ferrous metals
Section C
(division 24.54)
Machinery and metals
products NACE rev 1.1 Nace rev 2
Section / Division Details Section/Division
Section D, Division
28 - 32
Division 28- Manufacture of fabricated metal products, except machinery and equipment
Section C
(division 25)
Division 29- Manufacture of machinery and equipment n.e.c.
Section C
(division 28)
Division 30- Manufacture of office, accounting and computing machinery
Section C
(division 26)
Division 31- Manufacture of electrical machinery and apparatus n.e.c.
Section C
(division 27)
Division 32- Manufacture of communication equipment (radio,TV); repair and
installation of machinery and equipment
Section C
(division 33)

Energy efficiency indicators in ODYSSEE
The sole responsibility for the content of this report lies with the authors. It does not necessarily reflect the opinion of the
European Communities. The European Commission is not responsible for any use that may be made of the information
contained therein.
4
Transport equipement NACE rev 1.1 Nace rev 2
Section / Division Details Section/Division
Section D, NACE
34-35
Division 34 - Manufacture of motor vehicles, trailers and semi-trailers
Section C
(division 29)
Division 35 - Manufacture of other transport equipment
Section C
(division 30)
NACE rev 1.1 Nace rev 2
Other manufacturing* Section / Division Details Section/Division
Section D, Division
25-33-36-37
Division 25- Manufacture of rubber and plastics products
Section C
(division 22-23)
Division 33- Manufacture of medical, precision and optical instruments, watches and
clocks
Section C
(division 32)
Division 36- Manufacture of furniture; manufacturing n.e.c. Section C
(division 31) Division 37- Recycling
NACE rev 1.1 Nace rev 2
Section / Division Details Section/Division
Mining and quarrying
Section C, NACE
10-14
Division 10 - Mining of coal and lignite; extraction of peat
Section B
(Section 05-09)
Division 11 - Extraction of crude petroleum and natural gas; service activities incidental
to oil and gas extraction, excluding surveying
Division 12 - Mining of uranium and thorium ores
Division 13 - Mining of metal ores
Division 14 - Other mining and quarrying

Energy efficiency indicators in ODYSSEE
The sole responsibility for the content of this report lies with the authors. It does not necessarily reflect the opinion of the
European Communities. The European Commission is not responsible for any use that may be made of the information
contained therein.
5
Construction NACE rev 1.1 Nace rev 2
Section / Division Details Section/Division
Section F, NACE 45 Division 45 - Construction
Section F
(division 41-43)

Energy efficiency indicators definition
The sole responsibility for the content of this report lies with the authors. It does not necessarily reflect the opinion of the European Communities. The European Commission is not responsible for any use that may be made of the information
contained therein.
1
Sectors : corresponds to the grouping of industrial activities into sub-categories on the
basis of establishments (e.g. enterprises). Sectors correspond to all establishments
having the same main activity.
Branches : corresponds to the grouping of industrial activities on the basis of the
activity : branches correspond to all enterprises or part of enterprises having the same
activity.
• Value added at constant price
The value added at constant price by branch (also called in real terms) measures the
industrial output in monetary value. It is less well covered by national statistics1. Value added
at constant price are derived from values at current price, using price deflators2. In some case
data at constant price have to be calculated from production index, assuming that the change
in the value added at constant price, i.e. in volume, follows the change in production index
(see Box 1 to calculate value added at constant prices).
• Production index
The production index by sub-sector is the most common indicator used to measure the
industrial output; it is usually measured in relation to a base year (e.g. index base 100 in 2005
for instance) or in relation to the previous year. It is well covered in national statistics. This
index usually measures the changes in the volume of physical production: it is calculated from
index of change in physical production at a very detailed level (4 to 5 digits) measured with
different units (e.g. number of litres of milk processed, of tons of meat produced for the food
industry) and aggregated at the branch level (e.g. food) into a production index on the basis of
the weight of each sub-branch in the value added of the branch in the base year (2005).
• Physical production
The physical production corresponds to a dominant output of the branch and is usually
measured in ton (e.g. crude steel, cement, clinker).
3.2. Headline Indicators
3.2.1. Energy intensity of industry, manufacturing, primary metals …
The energy intensity of industry, of manufacturing or of an industrial branch is defined as the
ratio between the final energy consumption of the branch (measured in energy units: toe,
Joule, etc) and the value added measured in constant monetary units.
ietocind=toccfind/(vadindxx./txchg€(2005))*1000 (koe/€2005)
with:
toccfind: final consumption of industry in Mtoe
vadindxx: value added of industry at constant prices of 2005 in national currency
txchg€(2005): coefficient to convert constant prices in national currency into € of 2005
ietocima=toccfima/(vadimaxx./txchg€(2005))*1000 (koe/€2005)
1 Value added should be preferred to output value (i.e. turn over) as its variation is closer to the physical output. 2 See above definition of price deflators in footnote 6.

Energy efficiency indicators definition
The sole responsibility for the content of this report lies with the authors. It does not necessarily reflect the opinion of the European Communities. The European Commission is not responsible for any use that may be made of the information
contained therein.
2
with:
toccfima: final consumption of manufacturing industry in Mtoe
vadimaxx: value added of manufacturing industry at 2005 prices in national currency
ietocmpr=toccfmpr/(vadmprxx./txchg€(2005))*1000 (primary metals)
ietocchi=toccfchi/(vadchixx./txchg€(2005))*1000 (chemical industry
ietocmnm=toccfmnm/(vadmnmxx./txchg€(2005))*1000 (non metallic minerals)
ietocmac=toccfmac/(vadmacxx./txchg€(2005))*1000 (machinery)
ietocveh=toccfveh/(vadvehxx./txchg€(2005))*1000 (transport equipment)
ietociaa=toccfiaa/(vadiaaxx./txchg€(2005))*1000 (food, tobacco,..)
ietocppp=toccfppp/(vadpppxx./txchg€(2005))*1000 (paper industry)
ietoctex=toccftex/(vadtexxx./txchg€(2005))*1000 (textiles)
3.2.2. Unit consumption of steel, cement, paper and glass
These unit consumption are calculated as the ratio between the final energy consumption of
the branches and their output measured in tons.
cutocacb=toccfsid/prdacb*1000 [toe/t]
cutoccim=toccfcim/prdcim*1000 [toe/t]
cutocver=toccfver/prdver*1000 [toe/t]
cutocpap=toccfppp/prdpap*1000 [toe/t]
With:
toccfsid: energy consumption of steel, prdacb: production of crude steel
toccfcim: energy consumption of cement, prdcim: production of cement
toccfver: energy consumption of glass, prdver: production of glass
toccfppp: energy consumption of paper & printing, prdpap: production of paper
3.3. Issue indicators
3.3.1. Energy intensity of manufacturing at constant structure
The intensity at constant structure of industry or manufacturing reflects the variation of the
energy intensity assuming a constant structure of value added, between the various branches
or sub-branches, for a reference year, so as to leave out the influence of structural changes.
Structural effects : represents the influence of structural changes in the industry sector (or
manufacturing or within an industrial branch) on the energy intensity of industry (or of
manufacturing, or of an industrial branch). Structural effects are important each time the
structural changes take place between branches with different sectoral intensities.
The structural effects are usually calculated with the Divisia method.
Structural changes in industry : changes in the share (in %) of each branch or sub-branch in
the value added of industry (or manufacturing, or of an industrial branch).
Sectoral intensities : see energy intensity of an industrial branch.
Intensity at constant structure of industry or manufacturing reflects the variation of the
energy intensity assuming a constant structure of value added, between the various branches
or sub-branches, for a reference year, so as to leave out the influence of structural changes.
Changes in this intensity at constant structure result from variations in the sectoral intensities ;
they provide a good indicator of the overall energy efficiency trend in industry or
manufacturing (or within a branch).

Energy efficiency indicators definition
The sole responsibility for the content of this report lies with the authors. It does not necessarily reflect the opinion of the European Communities. The European Commission is not responsible for any use that may be made of the information
contained therein.
3
Divisia method : usual method to separate out what is due to structural changes from what is
due to changes in sectoral intensities in the variation of the energy intensity of industry or
manufacturing sector (or of an aggregate branch).
The Divisia method is applied on a yearly basis and decomposes the growth rate of the
intensity between year t and t-1 into two components. The first one measures the influence of
structural changes, and the second one measures the influence of changes in the sectoral
intensities.
ln ln lnt
t
i
it
ti
i
it
ti
ieie
wss
wieie
1 1 1
wi= energy consumption weight =Ei / E
The variation of the intensity over a period can be expressed in index (I) as follows :
I = Is x Ie
Ie : index of sectoral intensity effect, which represents the index of the intensity at constant
structure.
Is : index of structural effect which represents the variation of the intensity due to structural
changes.
Iei
it
itit
wieie
exp ln1
100 Isi
it
itit
wss
exp ln1
100
Interpretation
Changes in this intensity at constant structure result from variations in the sectoral intensities ;
they provide a good indicator of the overall energy efficiency trend in industry or
manufacturing (or within a branch).
The difference in the variations of the intensity and the intensity at constant structure is due to
intensity changes: the larger is the discrepancy the greater are the intensity effects
3.3.2. Energy efficiency index in industry
For each branch, the indices are based on unit consumption expressed in terms of energy used
per unit of physical output (tons produced for steel, cement, glass and paper and production
index for the other branches) (see Box 2). Indices capture the energy efficiency development
better than traditional energy intensities (per unit of value added). For some branches the
trends shown include also some non-technical changes, especially in the chemical industry the
shift to light chemicals, due to the fact that this sector is not sufficiently disaggregated.
Box 2: Energy efficiency index for industry
For industry, the evaluation is carried out at the level of 10 branches:
4 main branches: chemicals, food, textile & leather and equipment goods;
3 energy intensive branches: steel, cement and pulp & paper
3 residual branches: other primary metals (i.e. primary metals minus steel), other non-metallic minerals (i.e.
non-metallic mineral minus cement) and other pulp, paper and printing (i.e. mainly printing ).
The unit consumption is expressed in terms of energy used per ton produced for energy intensive products (steel,
cement, glass and paper) and in terms of energy used related to the production index for the other branches.

Energy efficiency indicators definition
The sole responsibility for the content of this report lies with the authors. It does not necessarily reflect the opinion of the European Communities. The European Commission is not responsible for any use that may be made of the information
contained therein.
4
3.4. Indicators of comparisons
3.4.1. Energy intensity of industry at reference structure
The final energy intensity of industry at reference structure represents a fictitious value of the
final intensity of a country calculated by taking for each industrial branch the actual sectoral
intensity of the country and the industrial structure (ie the share of each branch in the value
added of industry) of a reference country (eg the EU average for instance)
Calculation of a fictitious energy consumption (“adjusted energy consumption”)3
For the other branches : Ef = IEji * (VA j / VA) EU * VA
Note: the European union is the reference
With VA : value added of manufacturing
IE j : Energy intensity of a branch j
VA j : Value added of a branch j
For the industry as a whole, we get the energy intensity at reference structure by compiling the
information for the different branches ietocimaaj= Σ Ef / VA
3 For the branches such as steel, cement, paper, using the ratio “production per value added” instead of the
sectoral intensity can be better. In this case the adjusted energy consumption would be: Ef = UC i * (P i / VA) EU
* VA ; with UC i: unit consumption of an intensive branch i
Pi : physical production of an intensive branch i

Energy efficiency indicators definition
The sole responsibility for the content of this report lies with the authors. It does not necessarily reflect the opinion of the European Communities. The European Commission is not responsible for any use that may be made of the information
contained therein.
5
4. Transport
4.1. Data on transport
4.1.1. Final energy consumption of transport sector
Final energy consumption of transport sector : includes all the energy consumed for
transport activities except bunkers. It should not include the energy used in buildings of
transport companies (railways station, airport, ports...) that are considered in the tertiary
sector. The energy consumption of the transport sector is broken-down by transport mode.
The definition of this sector in energy consumption statistics is quite different from its
definition in economic statistics.
Transport mode represents a classification of transport activities by type of infrastructure :
air transport, rail transport, road transport, water transport, pipeline transport.
Road transport includes all the energy consumed by road vehicles, including agriculture
and industrial trucks, household cars and motorcycles, commercial and government vehicles.
Road vehicles are usually classified in the following categories : two-wheels, motorcycles
(and mopeds), tricycles, cars, light vans (or pick-ups), buses and trucks (or lorries). This last
category can be broken-down by size between light trucks, medium trucks, heavy trucks and
road tractors.
Rail transport only includes the energy consumption of trains (i.e. for traction) ; the
consumption of railway stations and other buildings (workshops) should in principle be
included in the tertiary sector ; the main sources of energy consumed will be electricity and
diesel (coal for countries still using steam trains).
Air transport only includes the energy used by all domestic and foreign aeroplanes (i.e.
private, commercial, military or agricultural planes). The energy consumption of airport
should not be accounted for in the transport sector but in the tertiary sector. The treatment of
international air transport is not systematic. Some international organisations include it in
transport (e.g. IEA or EUROSTAT) ; others consider it as exports which means that is does
not appear in the transport sector (e.g. UN or ADB). In addition, the definition of international
air transport varies among the countries : sometimes it covers all international flights,
sometimes only international carries. The main source of energy for air transport is jet fuel.
Water transport only includes the energy used for domestic transport (river transport, coastal
maritime transport). The consumption of energy for international water transport or bunkers
is excluded from the transport sector and is considered in the same way as exports in the
energy balance, and is shown as a separate line.
Bunkers, or international marine bunkers, represent the fuel used for sea : going ships,
including warships and fishing vessels in international waters (domestic and foreign flags).
Pipeline transport : the energy consumed for pipeline transport may either be fully
considered in transport (i.e. IEA) or partly, excluding oil and gas pipe-line (i.e. pipelines
transporting energy commodities), that are then included in the energy transformation sector
(item “own-use”).

Energy efficiency indicators definition
The sole responsibility for the content of this report lies with the authors. It does not necessarily reflect the opinion of the European Communities. The European Commission is not responsible for any use that may be made of the information
contained therein.
6
4.1.2. Traffic in ton-km, pass-km,or gross-ton-km
Ton-km : unit of traffic for goods transport obtained as the multiplication of a volume of
goods carried, in tons, and the average distance of transport, in km.
Passenger-km : unit of traffic for passenger transport obtained as the multiplication of a
number of trips (i.e. a number of passenger) and an average distance per trip (in km).
Gross ton-km (gtkm) : unit of measurement of the traffic of goods and passenger in ton-km,
including the weight of locomotives and carriages ; it is mainly used for rail transport (“gross
ton-km hauled”) to aggregate the passenger and goods traffic and to allocate the consumption
between passenger and goods traffic.
4.1.3. Stock and sales of vehicles
The stock of road vehicles by type (cars, trucks, light-duty vehicles, buses, two-wheels or
motorcycles) is available from national statistics. It corresponds to the number of road
vehicles registered at a given date (usually at the end of the year or the middle of the year) in
a country and licensed to use roads open to public traffic4.
It should refer to the number of vehicles really on the road (i.e. in circulation and that
consume motor fuels). Official data often relate to all registered vehicles, i.e. including
vehicles that have been scrapped and are not used any more, as they cumulate all the new
registrations to the existing stock of vehicles without retiring the vehicles that are no longer
used. This often overestimates the real stock of vehicles in use by some 30%.
To get the real stock on the road, several approaches are possible:
o Use other sources that better correspond to vehicles in use (from fiscal registry
if annual fees are paid);
o Or modelling using a survival law;
Cars should also include taxis. Light duty vehicles also called light commercial vehicles have
a useful load below a certain threshold (e.g. < 3 t). Trucks correspond to medium and heavy
trucks (generally > 3 t useful load); trucks should also include road tractors that pull trailers
(articulated vehicles, also called trailer truck)
Annual sales of vehicles represent the yearly new vehicles produced or imported. It generally
corresponds to the vehicles registered in the country.
Both stock and sales should be available by fuel type to ease the allocation of motor fuels (e.g.
gasoline and diesel) consumption by type of vehicles.
4.1.4. Average distance by type of vehicle or traffic of vehicles
The average distance travelled by year by car is usually available from household or
transport surveys. It should be based on observed annual data and should not be extrapolated,
as it can fluctuate quite a lot from one year to the other depending on the economic situation
4 Military vehicles are usually excluded from the statistics.

Energy efficiency indicators definition
The sole responsibility for the content of this report lies with the authors. It does not necessarily reflect the opinion of the European Communities. The European Commission is not responsible for any use that may be made of the information
contained therein.
7
and fuel prices level. They may also be obtained from panel of representative vehicle owners
or from surveys at gas stations
4.1.5. Specific consumption of vehicles
The average specific consumption of cars in litre/100km is calculated from the total
consumption of cars, the stock of cars and the average distance travelled by year by car. This
indicator can also be given obtained directly from surveys.
The same approach can be followed for the other road vehicles.
4.1.6. Specific consumption of new cars
The specific consumption of new cars represents the average normalized specific
consumption. It is derived from fuel consumption test. These test values are provided each
year by energy administrations or associations of car manufacturers to monitor energy
efficiency trends with new cars. They are obtained as follows.
The test specific consumption is traditionally measured for each type of car following
standardised test procedures in terms of driving cycles. In the European Union, passenger
vehicles are commonly tested using two drive cycles, and corresponding fuel economies are
reported as 'urban' and 'extra-urban', in litres per 100 km. The urban economy is measured
using the test cycle known as ECE-15, introduced by the EEC Directive 90/C81/01 in 1999. It
simulates a 4 km urban trip at an average speed of 20 km/h and at a maximum speed of 50
km/h. The extra-urban cycle or EUDC lasts 400 seconds (6 minutes 40 seconds) at an average
speed 62.6 km/h and a top speed of 120 km/h.
An average specific consumption for each car is then calculated and a national sales weighted
average is obtained for all cars sold or from a representative sample of cars, possibly with a
distinction by category of cars (based on size or horsepower) and/or by type of fuel (gasoline,
diesel, LPG).
The accuracy and comparability of data on test specific consumption depends on:
- the quality of the testing procedure and a degree of control by outside authorities;
- the accuracy of the weighting between driving cycles to reflect the average
conditions of driving;
- finally, the size of the sample used to get a national average: comprehensive in
France, sample of the most popular models (about 10) in other countries.
4.2. Headline Indicators
4.2.1. Energy intensity of transport
The energy intensity of the transport sector is calculated as the ratio of the transport energy
consumption to the GDP. It is not related to the value added of the sector as this value added
only reflects the activity of transport companies, which only represent a part of the total
consumption of the sector (about less than 60% usually in the EU countries)
ietoctra=toccftra / (pibxx./txchg€(2005))*1000 (koe/€2005)
with:
toccftra: final consumption of the transport sector in Mtoe
pibxx: GDP at constant prices in national currency
txchg€(2005): coefficient to convert constant prices in national currency in € of 2005

Energy efficiency indicators definition
The sole responsibility for the content of this report lies with the authors. It does not necessarily reflect the opinion of the European Communities. The European Commission is not responsible for any use that may be made of the information
contained therein.
8
4.2.2. Unit consumption of gasoline vehicles
The unit consumption of gasoline of road vehicles is obtained by dividing the total gasoline
consumption for road transport by the total stock of gasoline vehicles.
Interpretation
Using this unit consumption to interpret and compare the energy efficiency of light vehicles
may be misleading due to the heterogeneity of the fleet of gasoline vehicles among countries
and, within one country, over time. Indeed, motorcycles, cars and commercial light vehicles
are added together: one motorcycle counts for one vehicle, as does one car. Therefore, if, the
number of commercial light vehicles is increasing more rapidly than the number of cars, for
instance, the unit consumption will increase, since on average a commercial light vehicle uses
more fuel than a car (by a factor of between 1.5 and 2). Any change in the composition of the
stock of vehicles will affect the unit consumption, even if the vehicles do not change from a
technical point of view.
4.2.3. Unit consumption of rail transport
The unit consumption of rail transport represents the average energy consumption per unit of
traffic . For rail transport, the total traffic is measured in gross ton-km (gtkm).The unit
consumption is thus expressed in GJ or koe/ gtkm .
The traffic in gross ton-km is the usual unit of measurement of the total traffic of goods and
passenger in ton-km, including the weight of locomotives and carriages ; it is used to
aggregate the passenger and goods traffic . The energy consumption is usually allocated
between passenger and goods traffic according to the share of passenger and goods traffic
respectively in the total traffic in gtkm.
cutocfer=toccfer/tkbfer . [koe/tkbfer]
cutocferpkm=cutocfer*1,7 [koe/pkm]
cutocfertkm=cutocfer*2,5 [koe/tkm]
with:
cutocferpkm : unit consumption of rail transport of passengers per passenger-km
cutocfertkm : unit consumption of rail transport of goods per ton-km
cutocfer : unit consumption of rail transport per ton-km (gross tkm)
toccffer :consumption of rail transport
pkmfer : : passenger rail traffic in pkm
tkmfer : rail traffic of goods in tkm
tkbfer : total rail traffic in gross ton-km (1.7*pkmfer + 2.5 * tkmfer)
4.2.4. Unit consumption of water transport
The unit consumption of water transport represents the average energy consumption of water
transport per unit of traffic, measured in ton-km
cutocflv=toccfflv/tkmflv [koe/tkm]
with:
tocfflv: energy consumption for domestic water transport
tkmflv: traffic of goods for domestic water transport

Energy efficiency indicators definition
The sole responsibility for the content of this report lies with the authors. It does not necessarily reflect the opinion of the European Communities. The European Commission is not responsible for any use that may be made of the information
contained therein.
9
4.2.5. Unit consumption of air transport
The unit consumption of air transport represents the average energy consumption of air
transport per unit of traffic, measured in passengers (passengers embarked and disembarked).
cutocair=carcfair/pasair [toe/pas]
with :
carcfair : energy consumption for air transport
pasair : traffic of airport (number of passengers embarked and disembarked).
4.2.6. Unit consumption of domestic air transport
The unit consumption of domestic air transport represents the average energy consumption of
domestic air transport per unit of traffic, measured in passenger-km
cutocavd=carcfado/pkmavd [toe/pkm]
with :
carcfado : energy consumption for domestic air transport
pkmavd : domestic traffic in passenger-km.
4.3. Issue Indicators
4.3.1. Unit consumption of gasoline vehicules per equivalent car
The unit consumption of gasoline per equivalent car relates the total consumption of gasoline
to a fictitious stock of gasoline vehicles, measured in terms of a number of equivalent cars.
Converting the actual stock of gasoline vehicles into a stock of equivalent cars is based on a
coefficient reflecting the difference in average yearly consumption between each type of
vehicle and the car. If, for instance, a motorcycle consumes on average 0.15 toe/year and a car
1 toe/year, one motorcycle is considered to be equal to 0.15 equivalent cars.
These coefficients can be derived from surveys (or estimates) of distance travelled and
specific consumption (1/100km) for selected years; they can also be adapted from similar
countries in terms of vehicle characteristics and patterns of use; in ODYSSEE they are taken
to be equal to constant reference values for countries for which data are not available.
cuesseqc=esscfrou / (nbrvpcess + nbrmot*coefvpcmot+nbrcamvlress*coefvpccamvlr+nbrbusess*coefvpcbus)
[toe/veh]
with:
esscfrou: consumption of gasoline of road transport
nbrvpcess: stock of gasoline cars
nbrvlress: stock of gasoline light vehicles
nbrmot: stock of motorcycles
nbrcamess: stock of gasoline trucks
nbrbusess: stock of gasoline buses
coefvpcmot: coefficient of conversion of one motorbike in terms of an equivalent car (=0.15)
coefvpcbus: coefficient of conversion of one bus in terms of an equivalent car (=15)
coefvpcamvlr: coefficient of conversion of one truck/light vehicles in terms of an equivalent car( =4) or 15 if we
only consider trucks, 1.8 if we consider only light vehicles

Energy efficiency indicators definition
The sole responsibility for the content of this report lies with the authors. It does not necessarily reflect the opinion of the European Communities. The European Commission is not responsible for any use that may be made of the information
contained therein.
10
Interpretation
This indicator allows to determine what, in the variations in unit consumption of gasoline
light vehicles, may be attributed to structural changes in the composition of the stock of light
vehicles
This indicator is more relevant than the average gasoline consumption per gasoline vehicle,
for which all types of vehicles are put on the same level.
4.3.2. Unit consumption of road transport per equivalent car
The unit consumption of road transport per equivalent car relates the total consumption of
motor fuels to a fictitious stock of all road vehicles, measured in terms of a number of
equivalent cars.
The stock of road vehicles is converted into a stock of equivalent cars on the basis of
coefficients reflecting the difference in average yearly consumption between each type of
vehicle and the car. If, for instance, a truck consumes on average 15 toe/year and a car 1
toe/year, one truck is equal to 15 equivalent cars.
cutoceqc=toccfrou/(nbrvpc+ nbrmot*coefvpcmot+nbrcamvlr*coefvpccamvlr+nbrbus*coefvpcbus) [toe/car]
with :
toccfrou
nbrvpc: stock of cars
nbrvlr: stock of light vehicles
nbrmot: stock of motorcycles
nbrcam: stock of trucks
nbrcamvlr: stock of trucks and light vehicles
nbrbus: stock of buses
coefvpcmot: coefficient of conversion of one motorbike in terms of an equivalent car (=0.15)
coefvpcbus: coefficient of conversion of one bus in terms of an equivalent car (=15)
coefvpcamvlr: coefficient of conversion of one truck/light vehicles in terms of an equivalent car( =4) or 15 if we
only consider trucks, 1.8 if we consider only light vehicles
4.3.3. Unit consumption of cars
The average unit consumption of cars is calculated as the statistical division of the yearly
motor fuel consumption of cars divided by the stock of cars. This unit consumption is the
easiest indicator to calculate with the currently available statistics.
cutocvpc=toccfvpc/nbrvpc [toe/veh]
cuessvpc=esscfvpc/nbrvpcess [toe/veh]
cugzlvpc=gzlcfvpc/nbrvpcgzl [toe/veh]
with:
toccfvpc: total consumption of cars
esscfvpc consumption of gasoline of cars
gzlcfvpc: diesel consumption of cars
nbrvpc : stock of cars
nbrvpcess : stock of gasoline cars
nbrvpcgzl : stock of diesel cars
Interpretation
This indicator may be considered as an indicator of efficiency if a decrease in the use of cars
is considered as an energy efficiency improvement: in other words, it indicates whether cars
Energy efficiency indicators definition
The sole responsibility for the content of this report lies with the authors. It does not necessarily reflect the opinion of the European Communities. The European Commission is not responsible for any use that may be made of the information
contained therein.
11
are used more or less efficiently, without indicating whether this is due to reduced mobility,
improved technical efficiency or changes in driving behaviour.
4.3.4. Unit consumption of cars per passenger-km
The average unit consumption of cars per passenger-km is calculated as the statistical division
of the yearly motor fuel consumption of cars divided by the traffic of cars expressed in
passengers-km
cutovpcpkm=toccfvpc/pkmvpc
with:
toccfvpc: total consumption of cars
pkmvpc: traffic of cars in pkm
4.3.5. Unit consumption of trucks and light vehicles
The average unit consumption of trucks and light vehicles is calculated as the statistical
division of the yearly motor fuel consumption of trucks and light vehicles divided by the
stock of trucks and light vehicles.
cutoccamvlr=toccfcamvlr/nbrcamvlr*1000 [toe/veh]
with:
toccfcamvlr: total consumption of trucks and light vehicles
nbrcamvlr: stock of trucks and light vehicles
4.3.6. Unit consumption of diesel of heavy vehicles
The unit consumption of diesel of heavy vehicles is equal to the ratio (total diesel oil
consumption by road transportation - diesel oil consumption by cars and light vehicles) /
(number of diesel trucks + number of diesel buses).
If diesel oil consumption by cars and light vehicles is not available, it will be estimated from
the stock of diesel cars and diesel light vehicles and the average diesel consumption per
vehicle; the latter being estimated on the basis of the average gasoline consumption per
equivalent car for cars, as defined above, and, for light vehicles, on the basis of the coefficient
of conversion into equivalent cars.
Heavy vehicles include trucks and buses. As the consumption of buses is usually small in
comparison to that of trucks, the indicators related to heavy vehicles will mostly reflect the
situation of trucks, and can be considered as an approximation for them.
Interpretation
Indicators related to trucks or heavy vehicles should be interpreted with care, as there may be
limitations in the quality of diesel consumption data for these vehicles, for two reasons:
-The consumption of diesel by heavy vehicles or trucks is usually obtained as the difference
between the total consumption of diesel and estimates of diesel consumption by cars and light
vehicles; in recent years, most countries have experienced a rapid increase in the proportion of
cars and light vehicles using diesel fuel, that may not always be fully reflected in these
consumption estimates.

Energy efficiency indicators definition
The sole responsibility for the content of this report lies with the authors. It does not necessarily reflect the opinion of the European Communities. The European Commission is not responsible for any use that may be made of the information
contained therein.
12
- In some countries, an increasing amount of diesel may be used by foreign trucks (transit
traffic), which are not accounted for in the indicators.
These two factors may lead to an overestimation in recent years of the consumption of diesel
by trucks and heavy vehicles.
cugzlhvv=(gzlcfrou-gzlcfvpc-gzlcfvlr) /(nbrcamgzl+nbrbusgzl)*1000 [toe/veh]
with:
gzlcfrou, gzlcfvpc, gzlcfvlr: diesel consumption of road, cars & light vehicles
nbrcamgzl: stock of diesel trucks
nbrbusgzl: stock of diesel bus
4.3.7. Unit consumption of road transport of goods (per ton-km)
It is the ratio between the consumption of trucks and the traffic of goods measured in tonne-
km performed by trucks; This indicator provides information on the energy efficiency of the
overall transport services.
cugzltgr=gzlcfcam/tkmrou. [koe/tkm]
Interpretation
The unit consumption per ton-km: enables to assess whether freight transport by road is
becoming more energy-efficient: a shift towards bigger trucks, while increasing the specific
consumption, certainly decreases the unit consumption per ton-km: in other words trucks on
average look less efficient but the transport of goods by road becomes more energy efficient
4.3.8. Unit consumption of passenger transport
It is the ratio of the consumption for domestic transport and the traffic expressed in
passengers-km ; international air transport is excluded as usually it the traffic is not measured
in pkm
cutocpkm=toccfpas/pkm [koe/pkm]
with:
toccfpas: consumption of passenger transport (cars, buses, railway and domestic air transport)
pkm: domestic traffic for passenger transport in pkm
4.3.9. Unit consumption of passenger transport at constant modal split
It is the weighted average of the unit consumption of each mode weighted with the share of
each mode in the traffic in the base year.
cutocpkmst=(cutocferpkm*pkmfer.(2005)+cutocbus*pkmbus.(2005)+cutocvpcpkm*
pkmvpc.(2005)+cutocavd*pkmavd)/(pkmfer.(2005)+pkmbus.(2005)+pkmvpc.(2005)+
pkmavd.(2005))
with:
cutocferpkm: unit consumption for rail transport of passengers
pkmfer: traffic for rail transport of passengers
cutocbus: unit consumption for public road transport (buses)
pkmbus: traffic by public road transport (buses)
cutocvpcpkm: unit consumption of cars per passenger-km

Energy efficiency indicators definition
The sole responsibility for the content of this report lies with the authors. It does not necessarily reflect the opinion of the European Communities. The European Commission is not responsible for any use that may be made of the information
contained therein.
13
pkmvpc: traffic of cars in passenger-km
cutocavd: unit consumption for domestic air transport
pkmavd: traffic for domestic air transport
Interpretation
A comparison of the variation of the average unit consumption for passenger transport
(cutocpkm) and the unit consumption at constant modal split (cutocpkmst) shows the
influence of modal substitutions
4.3.10. Unit consumption of goods transport
It is the ratio of the consumption for goods transport (road, rail and water) and the traffic
expressed in ton-km
cutocmch=toccfmch/tkm [koe/tkm]
with:
toccfmch: consumption of goods transport (trucks, light duty vehicles, railway and water transport)
tkm: domestic traffic for goods transport in tkm
4.3.11. Unit consumption of goods transport at constant modal split
It is the weighted average of the unit consumption of each mode weighted with the share of
each mode in the traffic in the base year.
cutocmchst=(cutocfertkm*tkmfer.(2005)+cutocflv*tkmflv.(2005)+cugzltgr*
tkmrou.(2005))/(tkmfer.(2005)+tkmflv.(2005)+tkmrou.(2005))
With:cutocfertkm: unit consumption for rail transport of goods
tkmfer: traffic for rail transport of goods
cutocflv: unit consumption for water transport of goods
tkmflv: traffic for water transport of goods
cugzltgr: unit consumption for road transport of goods
tkmrou: traffic for road transport of goods
Note : Difference between unit consumption and specific consumption
Unit consumption : ratio between the energy consumption of a sector (E), and an indicator of
activity (A) measured in physical terms (e.g. tons of steel, number of passenger-km) or a
consumption unit (e.g. vehicle, dwelling, appliance). A unit consumption is a statistical
concept that is a result of a calculation reflecting the average energy performance at the
national level by opposition to specific consumption that are direct data derived from
surveys..
Specific consumption : energy required per unit of output or per unit of service measured in
standard conditions (e.g. kWh/ton, l/100 km). A specific consumption is an engineer’s
concept. The specific consumption can be measured at different level of performance of the
technologies, in particular the best practice will characterise the lowest specific consumption
achieved in a country.

Energy efficiency indicators definition
The sole responsibility for the content of this report lies with the authors. It does not necessarily reflect the opinion of the European Communities. The European Commission is not responsible for any use that may be made of the information
contained therein.
14
4.3.12. Energy efficiency index for transport
This overall energy efficiency index aggregates the trends for each transport mode in a single
indicator for the whole sector. For cars, the energy efficiency is measured by the specific
consumption, expressed in litre/100km. For the transport of goods (trucks and light vehicles),
the unit consumption per ton-km is used, as the main activity is to move goods. For other
modes of transport various indicators of unit consumption are used, taking for each mode the
most relevant indicator given the statistics available: toe/passenger-km for air transport,
goe/pass-km for passenger rail, goe/t-km for transport of goods by rail and water, toe per
vehicle for motorcycles and buses (see Box 3).
Box 3: Energy efficiency index for transport
For the transport sector, the evaluation is carried out at the level of 8 modes or vehicle types: cars, trucks, light
vehicles, motorcycles, buses, domestic air transport, rail, and water transport. For each mode, the energy
efficiency indicators considered are the following:
cars: specific consumption in litres/km
trucks & light vehicles : unit consumption per ton-km
air transport : unit consumption per passenger
rail ,water : unit consumption/pkm or tkm motorcycles, buses: toe/vehicle
4.4. Comparison indicators
4.4.1. Unit consumption of passenger transport at reference modal split
cutocpkmaj=(cutocvpcpkm*pkmvpc.ueur+cutocferpkm*pkmfer.ueur+cutocflvpkm*..
pkmflv.ueur+cutocairpkm*pkmavd.ueur)/(pkmvpc.ueur+pkmfer.ueur+pkmflv.ueur+pkmavd.ueur) [koe/pkm]
Note: reference country : ueur (for example European Union as a whole)
4.4.2. Unit consumption of goods transport at reference modal split
cutocmchaj=(cutocfertkm*tkmfer.ueur+cutocflvtm*tkmflv.ueur+cutocgzltgr* tkmrou.ueur.)/
(tkmfer.ueur+tkmfer.ueur+tkmrou.ueur) [koe/pkm]

Energy efficiency indicators definition
The sole responsibility for the content of this report lies with the authors. It does not necessarily reflect the opinion of the European Communities. The European Commission is not responsible for any use that may be made of the information
contained therein.
15
5. Households
5.1. Data
5.1.1. Dwellings and characteristics
A household includes all the persons who occupy a housing unit as their usual place of
residence5. A housing unit is a house, an apartment, a mobile home, a group of rooms, or a
single room. The occupants may be a single family, one person living alone, two or more
families living together, or any other group of related or unrelated persons who share living
arrangements.
The number of households is by definition similar to the number of occupied dwellings and
can be a proxy for that variable; the main difference being people living in community
(military, religious). It is usually available from the National Statistical Office either for years
of housing surveys or on a yearly basis. If not available on a yearly basis can be
interpolated/extrapolated from the population and an average number of persons per
household, indicator that is changing slowly and smoothly.
There exists different statistics related to the stock of dwellings. The most common ones
relate to the total stock and to the stock of permanently occupied dwellings. The difference
between the two data corresponds to summer/week-end residences plus vacant dwellings. For
energy consumption analysis, the relevant data to handle is the stock of permanently occupied
dwellings. Such statistics are usually available from the national statistical office.
The annual construction of dwellings represents the number of dwellings which are built
every year. Such statistics are usually available from the national statistical office.
The average dwelling size (m2) corresponds to the living area as usually defined in
household survey and construction statistics. Such information is generally based on housing
surveys; if none available, it can be estimated from housing surveys based on the number of
rooms.
The residential building floor areas correspond to the useful floor area; it is different from
the gross floor area which includes common areas in multifamily buildings (e.g. corridors,
etc.), attics, basement or verandas. It is expressed in million m².
5.1.2. Household electrical appliances and lighting
• Stock, ownership, and sales of household electrical appliances
Equipment ownership ratios for refrigerators and washing machines correspond to the % of
household with the appliance. For TV and fans equipment ownership ratios should include
multi equipment and correspond to the average number per household.
Equipment ownership ratios are usually available from the National Statistical Office either
for years of housing surveys or on a yearly basis; they may also come from surveys carried
5 It is also defined as a group of persons who commonly live together and would take their meals from a
common kitchen.

Energy efficiency indicators definition
The sole responsibility for the content of this report lies with the authors. It does not necessarily reflect the opinion of the European Communities. The European Commission is not responsible for any use that may be made of the information
contained therein.
16
out by electric utilities. If they are not available on a yearly basis they can be linearly
interpolated/extrapolated as they are changing slowly and smoothly.
Yearly statistics may also come from surveys sponsored by equipment manufacturers
associations (or by the energy administration;
The sales of electrical appliances represent the number of appliances sold every year. The
information comes from equipment manufacturers associations.
The annual stock of appliance can be estimated in two ways:
▪ Either with a stock model from annual sales and an average lifetime.
▪ Or from annual household survey on equipment ownership (i.e. % of households
owning one or several appliances).
The market share of efficient appliances represent the percentage of appliances sold
corresponding to the most efficient label class (A and higher). The source of information may
be the monitoring of programme, survey from the energy administration, or consumer panels.
▪ Specific electricity consumption by electrical appliance
The specific electricity consumption by electrical appliances kWh per appliance) is
usually estimated from calculation procedure that are specific to each appliance type: for
instance, for washing machines, dishwashers and cloth dryers, it is calculated as the electricity
consumption per cycle multiplied by a number of cycles per year6; for TV it is calculated as
the average power of the TV stock (in Watts) multiplied by an average number of hours of use
per day and multiplied by 365 days. For refrigerators, it is calculated as the specific electricity
consumption per litre multiplied by the average size of the stock in litre and multiplied by 365
days.
The specific electricity consumption per litre or per cycle for the stock average can be
simulated from data on new appliances split by energy efficiency label.
5.1.3. Household energy consumption by end-use
The energy consumption for heating represents the total energy consumption of households
for space heating. It is usually not a statistics published by national statistical organization. It
is estimated by specialised organisation on the basis of surveys and modelling and endorsed
by national energy agencies or institutions.
The energy consumption for water heating is not available in usual energy statistics and is
part of more detailed data or estimates. The consumption for water heating includes oil
products, gas, coal and lignite, electricity, biomass and solar.
The energy consumption of cooking is not available in usual energy statistics and is part of
more detailed data or estimates. The consumption for cooking includes oil products, gas,
electricity and biomass.
The energy consumption for air conditioning represents the electricity consumption of
households for space cooling. Such information is estimated on the basis of surveys on the
diffusion of space cooling appliances (i.e. air conditioners) and modelling, taking into account
the intensity of use (number of hours) and their average rated power.
6 Default value in the EU is for instance 220 cycles per year for washing machines.

Energy efficiency indicators definition
The sole responsibility for the content of this report lies with the authors. It does not necessarily reflect the opinion of the European Communities. The European Commission is not responsible for any use that may be made of the information
contained therein.
17
The energy consumption of electrical appliances (including lighting) can be calculated by
difference between total electricity consumption – electricity consumption for air conditioning
- electricity consumption for cooking – electricity for water heating.
The electricity consumption for lighting is for some countries available from national
estimates; it is not covered by usual energy statistics. It is usually estimated from modelling
taking into account the number of lighting points, or the average lighting power and an
average number of hours of lighting per year7.
5.2. Headline Indicators
5.2.1. Unit consumption of households per dwelling
It relates the energy consumption of the household sector to the number of permanently
occupied dwellings.
cutoclog=toccfres/nbrlpr*1000 [toe/dw]
with:
toccfres : energy consumption of households in energy balance unit (toe, Joule..) (including wood,…)
nbrlpr: :number of permanently occupied dwellings
Interpretation
This is the most usual indicator considered to measure energy efficiency improvements in
dwellings. However, changes in this indicator do not only reflect the influence of better
insulation or more efficient appliances, but result from different factors:
• genuine energy efficiency improvements, from more efficient buildings, space heating
appliances or electrical appliances, on the one hand;
• better living standards (larger dwellings, more appliances, greater comfort of heating, etc),
on the other hand;
• finally, substitutions between energies with different end-use efficiencies (e.g. switch from
oil or coal to district heating, electricity, or gas).
5.2.2. Unit consumption of electricity of households per dwelling
cuelelog=(elccfres/eleun.fix)/nbrlpr*1000*1000 [kWh/dw]
with:
elccfres : electricity consumption of households in energy balance unit (toe, Joule..)
eleun.fix: coefficien to convert the energy balance unit in kWh (1 toe = 11628 kWh)
nbrlpr: :number of permanently occupied dwellings
5.2.3. Unit consumption of households per dwelling with climatic corrections
cutoclogcc=toccfrescc/nbrlpr*1000 [toe/dw]
with:
toccfrescc : energy consumption of households with climatic corrections
nbrlpr: :number of permanently occupied dwellings
toccfrescc = toccfres / (1-(pchfres*0.9)* (1-dj/djref)).
7 A default value can be 1000 hours per year.

Energy efficiency indicators definition
The sole responsibility for the content of this report lies with the authors. It does not necessarily reflect the opinion of the European Communities. The European Commission is not responsible for any use that may be made of the information
contained therein.
18
pchfres :share of space heating in household consumption
toccfres : energy consumption of households in energy balance unit (toe, Joule..) (including wood,…) dj: actual number of degree days
djref: degree days of reference or mean degree-days
The actual number of heating degree days is an indicator of the winter severity, and thus of
the heating requirement. It is calculated as the sum over each day of the heating period (e.g.
October to April) of the difference between a reference indoor temperature (usually 18°C) and
the average daily temperature8. The number of degree-days in EU countries is in a range from
700-800 degree-days for Cyprus and Malta to 4000-5000 degree-days in Nordic and Baltic
countries; the EU-27 average stands around 2800 degree-days. The daily outside temperature
is measured from the various meteorological stations existing in the country. The national
average can be just calculated as an arithmetic average or as a population weighted average.
The second approach should be used as it is more representative of the heating requirement in
the country. Eurostat calculates these two values for all EU countries, but only the arithmetic
national average is published and available on its web site.
The mean number of heating degree days represents the number of degree-days for a
normal winter or an average winter; it is based on a long-term average of degree-days values.
Eurostat uses a 25 years average (1980-2004)9.
5.2.4. Unit consumption of households per m2
It is obtained by dividing the unit consumption per dwelling by the average size of dwellings
(floor area).
cutocsur=toccfres/(surlog*nbrlpr)*1000000 [koe/m2
cutocsurcc=toccfrescc/(surlog*nbrlpr)*1000000 [koe/m2]
with:
toccfres : energy consumption of households
toccfrescc : energy consumption of households with climatic corrections
nbrlpr: :number of permanently occupied dwellings
surlog: average size of dwellings in m2
5.3. Issue Indicators
5.3.1. Unit consumption for space heating
It relates the energy consumption of the household sector for space heating to the number of
permanently occupied dwellings.
cutoclogchf=toccfreschf/nbrlpr*1000 [toe/dw]
with:
toccfreschf : energy consumption of households for space heating in energy balance unit (toe, Joule..) (including
wood,…)
nbrlpr: :number of permanently occupied dwellings
8 If the average temperature of a day in winter is 5°C, the number of degree day of that day is 13 degree days
(18-5). 9 Some countries have however shortened the reference period and are calculating the average since 1990 to
account for the fact that winters have been warmer since 1990. Some countries are in addition changing the
period (moving reference period), which means that the number of normal degree-days is not fix.
Energy efficiency indicators definition
The sole responsibility for the content of this report lies with the authors. It does not necessarily reflect the opinion of the European Communities. The European Commission is not responsible for any use that may be made of the information
contained therein.
19
5.3.2. Specific consumption of new dwellings
The specific consumption of new dwellings is a theoretical specific consumption, i.e. the
specific consumption corresponding to energy efficiency standards and a conventional (or
reference) heating behaviour,
These standards are expressed in different ways depending on the country and may refer to
space heating only or to other uses as well as (e.g. water heating). This makes it difficult to
compare insulation standards among countries. What can be compared is a theoretical specific
consumption derived from the standard (in toe or GJ/m2).
5.3.3. Unit consumption per dwelling for lighting and electrical appliances
This unit consumption is calculated by dividing the electricity consumption for all appliances
and lighting, by the number of permanently occupied dwellings. The electrical appliances
considered here are all those with specific (captive) uses of electricity. Space heating systems,
water heaters or cooking appliances are not included.
Interpretation
This unit consumption is changing over time under the influence of four factors:
- more households equipped with each of the usual electrical appliances (behavioural factor),
i.e. increase in the household ownership of appliances;
- changes in the technology, i.e. in the energy efficiency of these appliances (technical factor);
- changes in the size (trend to smaller households) and characteristics of appliances (more
combi-refrigerator compared to simple refrigerators, colour instead of black and white TV,
etc), (behavioural factors);
- changes in the intensity of use, mainly for washing machines, TV and also for freezers or
dish-washers (behavioural factors).
5.3.4. Specific consumption of new refrigerators and freezers
The specific consumption of new appliances is usually calculated from an average power
capacity and an assumed duration of use in hours per year. It may also be referred to as
“theoretical specific consumption” as it corresponds to a theoretical behaviour in terms of use.
The average power capacity is usually obtained as a “sales weighted average” taking into
account the actual market shares of different brands and sizes of appliance.
This specific consumption can also be calculated in a different way on the basis of a standard
size appliance (e.g. refrigerators of 180 litres with *** freezers, etc.).
5.3.5. Energy efficiency index of households
This index aggregates the trends in the different end-uses on the basis of their weight in the
total consumption. For space heating, energy efficiency trends are calculated from the change
in unit consumption per m2 at normal climate, and for large electrical appliances from the
change in specific electricity consumption, in kWh/year/appliance (Box 4). For water heating

Energy efficiency indicators definition
The sole responsibility for the content of this report lies with the authors. It does not necessarily reflect the opinion of the European Communities. The European Commission is not responsible for any use that may be made of the information
contained therein.
20
and cooking, energy efficiency trends are captured by the change in unit consumption per
dwelling.
Box 4: Energy efficiency index for households
For households, the evaluation is carried out at the level of 3 end-uses (heating, water heating, cooking) and 5
large appliances (refrigerators, freezers, washing machines, dishwashers and TVs).
For each end-use, the following indicators are considered to measure efficiency progress:
Heating: unit consumption per m2 at normal climate (toe/m2)10
Water heating: unit consumption per dwelling with water heating
Cooking: unit consumption per dwelling
5.4. Comparison indicators
5.4.1. Unit consumption (per m2 or dwelling ) for space heating per degree-day
It is equal to the unit space heating consumption per dwelling or m2 divided by the number of
degree-days
5.4.2. Unit consumption (per m2 or dwelling ) for space heating scaled to the
average european climate
It is obtained, for each country, by multiplying the heating consumption of households per m2
with climatic corrections by the ratio mean number of heating degree days of the country over
mean number of heating degree days of the EU average. cusurche (i) = cusurchc (i) * (djref (i)/djref (eu)).
with:
cusurchc (i): heating consumption per m2 of households in country (i) with climatic corrections (i.e. at
normal climate)
djref (i): mean number of heating degree-days of country i
djref (eu): mean number of heating degree-days of the EU average
5.4.3. Unit consumption (per m2 or dwelling ) scaled to the average european
climate
It is calculated by scaling the space heating consumption to the average climate in the
European Union on the basis of a relative number of degree days.
This indicator is more relevant to compare countries with different space heating
requirements.
cutocsurce=(toccfreschc/(surlog*nbrlpr)*(djref.ueur/djref)+(toccfrescc-toccfreschc)/(surlog*nbrlpr))*1000000
[koe/m2]
cutoclogce=toccfresce/nbrlpr*1000
Note: djref.ueur refers to the degree of reference of the whole EU as reference.

Energy efficiency indicators definition
The sole responsibility for the content of this report lies with the authors. It does not necessarily reflect the opinion of the European Communities. The European Commission is not responsible for any use that may be made of the information
contained therein.
21
5.4.4. Useful consumption (per m2 or dwelling ) for space heating per degree-
day
The unit consumption is measured in useful terms by multiplying the final consumption for
each fuel by the end-use efficiency for that fuel. Reference end-use efficiency values are used.
6. Service sector
6.1. Data
The energy consumption of services is usually split into 8 branches that somehow correspond
to homogenous categories of buildings :
- Wholesale and retail trade (Section G)
- Hotel and restaurant (Section I)
- Private offices (Sections H, J, K, L, M, and N).
- Public offices (Section O)
- Education (Section P)
- Health and social work (Section Q)
- Other branches (Section R-S)
- Public lighting;
Energy consumption can be split by fuel and by end-use:
- Space heating
- Water heating
- Cooking
- Air cooling
- Lighting
- ICT’s and other (by difference)
The activity data required in services are:
o The value added by branch;
o The number of employees by branch;
o The floor area size (m2) by branch;
o Or for some sub-sectors, sectoral indicators of activity, such as number of beds
for hospitals, number of person-nights for hotels, number of pupils/students in
education.
The floor area represents the floor space that needs to be heated, cooled or illuminated; it is
measured in m2 .
The annual construction of tertiary buildings represents the floor area of new buildings
which are built every year.
The employment in tertiary represents the total employment in services, usually expressed in
full-time equivalent (Full-time equivalent employees equal the number of employees on full-
time schedules plus the number of employees on part-time schedules converted to a full-time
basis).

Energy efficiency indicators definition
The sole responsibility for the content of this report lies with the authors. It does not necessarily reflect the opinion of the European Communities. The European Commission is not responsible for any use that may be made of the information
contained therein.
22
6.2. Headline Indicators
6.2.1. Energy intensity of service sector
The energy intensity of the service sector is defined as the ratio between the final energy
consumption of the sector (measured in energy units: toe, Joule, etc) and the value added
measured in constant monetary units.
ietocter=toccfter/(vadterxx./txchg€(2005))*1000 [koe/EC2005]
ieelcter=(elccfter/eleun.fix)/(vadterxx./txchg€(2005))*1000*1000 [kWh/employee]
with:
toccfter: final consumption of service sector in Mtoe
vadterxx: value added of services at constant prices in national currency
txchg€(2005): coefficient to convert constant prices in national currency into € of 2005
elccfter : electricity consumption of service sector in energy balance unit (toe, Joule..)
eleun.fix: coefficient to convert the energy balance unit in kWh (1 TWh = 0.086 Mtoe)
6.2.2. Unit consumption of service sector
The unit consumption of service sector is calculated as the ratio between the final energy
consumption or electricity consumption of the sector and the number of employees.
cutocter=toccfter/empter [toe/emp]
cueleter=(elccfter/eleun.fix)/empter*1000 [kWh/emp]
with:
toccfter: final consumption of service sector in Mtoe
empter: total employement in services in Millions
elccfter : electricity consumption of service sector in energy balance unit (toe, Joule..)
eleun.fix: coefficient to convert the energy balance unit in kWh (1 toe=11628 kWh)
7. Agriculture
Energy intensity of agriculture
The energy intensity of agriculture is defined as the ratio between the final energy
consumption of the sector (measured in energy units: toe, Joule, etc) and the value added
measured in constant monetary units.
ietocagr=toccfagr/(vadagrxx./txchg€(2005))*1000 [koe/EC2005]
with:
toccfagr: final consumption of agriculture in Mtoe
vadagrxx: value added of agriculture at constant prices in national currency
txchg€(2005): coefficient to convert constant prices in national currency into € of 2005

Energy efficiency indicators definition
The sole responsibility for the content of this report lies with the authors. It does not necessarily reflect the opinion of the European Communities. The European Commission is not responsible for any use that may be made of the information
contained therein.
23
8. Energy efficiency index ODEX
ODEX is the index used in the ODYSSEE-MURE project to measure the energy efficiency
progress by main sector (industry, transport, households) and for the whole economy (all final
consumers).
For each sector, the index is calculated as a weighted average of sub-sectoral indices of
energy efficiency progress; sub-sectors being industrial or service sector branches or end-uses
for households or transport modes.
• The sub-sectoral indices are calculated from variations of unit energy consumption
indicators, measured in physical units and selected so as to provide the best “proxy” of
energy efficiency progress, from a policy evaluation viewpoint. The fact that indices
are used enables to combine different units for a given sector, for instance for
households kWh/appliance, koe/m2, tep/dwelling…
• The weight used to get the weighted aggregate is the share of each sub- sector in the
total energy consumption of the sub –sectors considered in the calculation.
A value of ODEX equal to 90 means a 10% energy efficiency gain.
Box 1: Principle of calculation of ODEX11
Considering two sub-sectors with a share of the consumption of 60% and 40% respectively in the base
year and a change in the unit consumption from 100 to 85 for the first sub-sector and 100 to 97.5 for
the second, the weighted average index with a simple weighting system is:
0.6*(85/100)+0.4* (97.5/100) = 90
ODEX indicators represent a better proxy for assessing energy efficiency trends at an
aggregate level (e.g. overall economy, industry, households, transport, services) than the
traditional energy intensities, as they are cleaned from structural changes and from other
factors not related to energy efficiency (more appliances, more cars…).
ODEX and energy savings
▪ Energy savings
Top-down energy savings are derived from the multiplication of the variation of a unit energy
consumption by an indicator of activity over a reference period. For instance, the energy
savings of a given appliance (e.g. refrigerators) are derived from the variation in the average
specific energy consumption per appliance (in kWh/year) multiplied by the stock of
refrigerators12; for example, a reduction of the specific consumption of refrigerators from 400
to 300 kWh in a country with one 1 million of refrigerators will result in total electricity
savings equal to 100 GWh (Figure 1).
11 As explained below the exact weighting system is slightly different to guarantee a convergence with the mode
of calculation of energy savings in top-down methods. 12 For market diffusion indicators, the energy savings are derived from the increase in the market share; for
instance, energy savings from solar water heaters will be calculated from the diffusion of solar water heaters (in
terms of installed stock in m2) multiplied by a coefficient expressed in terms of kWh/m2.

Energy efficiency indicators definition
The sole responsibility for the content of this report lies with the authors. It does not necessarily reflect the opinion of the European Communities. The European Commission is not responsible for any use that may be made of the information
contained therein.
24
Figure 1: Example of calculation of top-down energy savings (refrigerators)
•Energy savings in 2007 (compared
to 1990) = 100 GWh ((400-300)*1 )
assuming a stock of 1 M refrigerators in
2007
•Rate of energy savings: 25% (=100/400)
▪ Choice of the weighting system
The weighting system used to calculate ODEX has been defined in such a way that ODEX is
equal to a rate of energy savings, i.e. the ratio between the actual energy consumption (E) of
the sector in year t and actual energy consumption (E) without energy savings (ES):
ODEX =(E/(E+ES)) *100.
The energy savings are calculated as the sum of energy savings of each underlying sub-sector
/end-use without:
ODEX =E/(E+ES) *100
For instance, if the actual consumption of the sector is 50 Mtoe and if the energy savings are
10 Mtoe, ODEX is equal to (50/ 60)*100 = 83.3. Such an index of 83.3 is thus equivalent to a
rate of energy savings of 16.7%.
Energy saving (ES) can be easily derived from the index from the previous formula:
ES= E*((100/ODEX)-1)
For instance , if the actual consumption of the sector is 50 Mtoe and if the ODEX is equal to
90, the energy savings are equal to 50*((100/90)-1)= 5.56 Mtoe
Table 1 illustrates the calculation in the case of the cement industry.
Table 1: Energy efficiency index and energy savings: case of cement
t0 = 2000 t = 2005
Production (A) Consumption (E) Unit consumption (UC) Energy savings Energy effcicncy index
Mt Mtoe toe/t Mtoe index
25 1.9 0.076
30 2.1 0.070 0.18 92
The energy savings measures the impact of the variation of the unit energy consumption per tonne of cement. It
is calculated by multiplying the cement production by the variation of unit consumption (UC) between the base
year 2000 and year t= 2005: At * (UC 0-UC t) = (0.076-0.07)*30= 0.18 Mtoe.
The energy efficiency index of the cement industry in 2000 is then 2.1/(2.1+0.18)=92, which means that energy
efficiency improved by 8%.
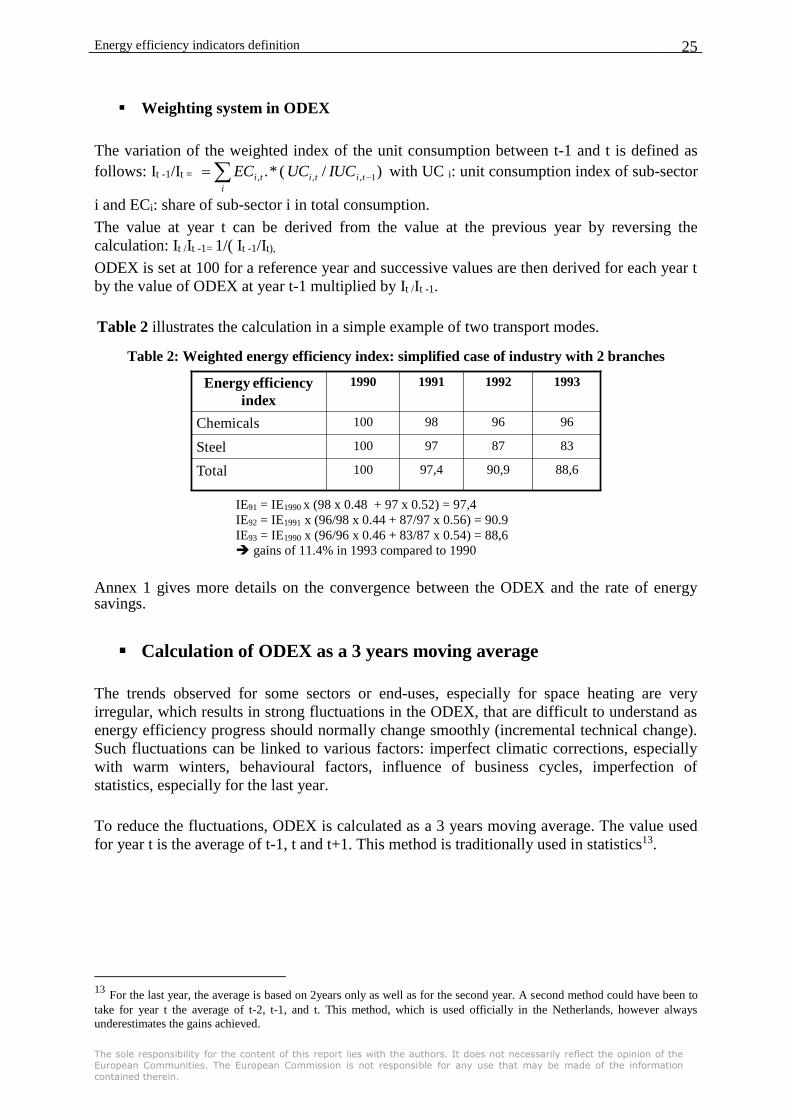
Energy efficiency indicators definition
The sole responsibility for the content of this report lies with the authors. It does not necessarily reflect the opinion of the European Communities. The European Commission is not responsible for any use that may be made of the information
contained therein.
25
▪ Weighting system in ODEX
The variation of the weighted index of the unit consumption between t-1 and t is defined as
follows: It -1/It = )/(*. 1,,, i
tititi IUCUCEC with UC i: unit consumption index of sub-sector
i and ECi: share of sub-sector i in total consumption.
The value at year t can be derived from the value at the previous year by reversing the
calculation: It /It -1= 1/( It -1/It),
ODEX is set at 100 for a reference year and successive values are then derived for each year t
by the value of ODEX at year t-1 multiplied by It /It -1.
Table 2 illustrates the calculation in a simple example of two transport modes.
Table 2: Weighted energy efficiency index: simplified case of industry with 2 branches
Energy efficiency
index
1990 1991 1992 1993
Chemicals 100 98 96 96
Steel 100 97 87 83
Total 100 97,4 90,9 88,6
IE91 = IE1990 x (98 x 0.48 + 97 x 0.52) = 97,4
IE92 = IE1991 x (96/98 x 0.44 + 87/97 x 0.56) = 90.9
IE93 = IE1990 x (96/96 x 0.46 + 83/87 x 0.54) = 88,6
gains of 11.4% in 1993 compared to 1990
Annex 1 gives more details on the convergence between the ODEX and the rate of energy savings.
▪ Calculation of ODEX as a 3 years moving average
The trends observed for some sectors or end-uses, especially for space heating are very
irregular, which results in strong fluctuations in the ODEX, that are difficult to understand as
energy efficiency progress should normally change smoothly (incremental technical change).
Such fluctuations can be linked to various factors: imperfect climatic corrections, especially
with warm winters, behavioural factors, influence of business cycles, imperfection of
statistics, especially for the last year.
To reduce the fluctuations, ODEX is calculated as a 3 years moving average. The value used
for year t is the average of t-1, t and t+1. This method is traditionally used in statistics13.
13 For the last year, the average is based on 2years only as well as for the second year. A second method could have been to
take for year t the average of t-2, t-1, and t. This method, which is used officially in the Netherlands, however always
underestimates the gains achieved.
Energy efficiency indicators definition
The sole responsibility for the content of this report lies with the authors. It does not necessarily reflect the opinion of the European Communities. The European Commission is not responsible for any use that may be made of the information
contained therein.
26
▪ How to manage negative energy efficiency improvement
A decrease in the specific energy consumption indicators indicates that energy efficiency has
been improving. However, in some cases the observed indicator trend shows an increase,
resulting in negative energy efficiency improvement.
This increase in the specific consumption may be due to an inefficient use of the equipment,
as it is often observed during economic recession; this is particular true in industry or
transport of goods. For instance in industry, in a period of recession, the energy consumption
does not decrease proportionally to the activity as the efficiency of most equipment drops, as
they are not used at their rated capacity, and, in addition, part of this consumption is
independent of the production level. In that case, the technical energy efficiency does not
decrease as such, as the equipment is still the same, but it is used less efficiently. It is
therefore suggested to separate the technical efficiency from the observed (or apparent)
energy efficiency. The apparent energy efficiency index can be replaced by a technical
energy efficiency index, by considering that if the specific consumption for a given sub
sector increases its value will be kept constant in the calculation of the technical index.
When publishing results for the index, it should be specified if it measures the apparent or
technical energy efficiency and what end-uses may have been removed for the calculation
because of hidden structural changes.
▪ Energy efficiency index in industry
For industry, the evaluation is carried out at the level of 10 branches:
• 4 main branches: chemicals, food, textile & leather and equipment goods;
• 3 energy intensive branches: steel, cement and pulp & paper
• 3 residual branches: other primary metals (i.e. primary metals minus steel), other non-
metallic minerals (i.e. non-metallic mineral minus cement) and other pulp, paper and
printing (i.e. mainly printing ).
The unit consumption is expressed in terms of energy used per ton produced for energy
intensive products (steel, cement and paper) and in terms of energy used related to the
production index for the other branches. Unit energy consumption captures the energy efficiency development better than traditional
energy intensities (per unit of value added). For some branches the trends shown include also
some non-technical changes, especially in the chemical industry the shift to light chemicals,
due to the fact that this sector is not sufficiently disaggregated.
▪ Energy efficiency index in transport
For the transport sector, the evaluation is carried out at the level of 8 modes or vehicle types:
cars, trucks, light vehicles, motorcycles, buses, total air transport, rail, and water transport.
The overall energy efficiency index aggregates the trends for each transport mode in a single
indicator for the whole sector.
For cars, the energy efficiency is measured by the specific consumption, expressed in
litre/100km.

Energy efficiency indicators definition
The sole responsibility for the content of this report lies with the authors. It does not necessarily reflect the opinion of the European Communities. The European Commission is not responsible for any use that may be made of the information
contained therein.
27
For the transport of goods (trucks and light vehicles), the unit consumption per ton-km is
used, as the main activity is to move goods.
For other modes of transport various indicators of unit consumption are used, taking for each
mode the most relevant indicator given the statistics available:
✓ toe/passenger for air transport, ✓ goe/pass-km for passenger rail, ✓ goe/t-km for transport of goods by rail and water, ✓ toe per vehicle for motorcycles and buses.
▪ Energy efficiency index in households
For households, the evaluation is carried out at the level of 3 end-uses (heating, water heating,
cooking) and 5 large appliances (refrigerators, freezers, washing machines, dishwashers and
TVs).
For each end-use, the following indicators are considered to measure efficiency progress:
• Heating: unit consumption per m2 at normal climate (toe/m2)14
• Water heating: unit consumption per dwelling with water heating
• Cooking: unit consumption per dwelling
• Large electrical appliances: specific electricity consumption, in kWh/year/appliance
In some countries, there is a slow down or even a deterioration of energy efficiency progress
for heating since the mid-nineties. In a few other countries, there is even an overall increase in
the ODEX since 1990. Such changes should not be interpreted as a reduction of energy
efficiency, as technical savings have not actually stopped, with all the extra policy measures
implemented in the late nineties and the continuous addition of new dwellings that are much
more efficient. This situation rather reflects negative behavioural savings, due to higher
indoor temperature. This means that the actual energy efficiency progress is under estimated,
with the standard calculation of the ODEX, as proposed above.
To separate out the influence of behavioural factors, a technical ODEX is calculated and used
to measure the energy efficiency progress.
• First of all, by accounting for energy efficiency gains linked to the penetration of more
efficient new dwellings
• Secondly, by separating behavioural and technical changes by assuming that technical
efficiency cannot reverse: it may not improve from one year to the other but cannot be
“worse”
The difference between the technical ODEX and the gross ODEX shows the influence of
behavioural factors (see Figure below). This calculation of a technical ODEX could even be
further improved by estimating the technical gains associated to the diffusion of efficient
technologies (eg CFL, condensing boilers).

Energy efficiency indicators definition
The sole responsibility for the content of this report lies with the authors. It does not necessarily reflect the opinion of the European Communities. The European Commission is not responsible for any use that may be made of the information
contained therein.
28
80
85
90
95
100
105
110
1990
1991
1992
1993
1994
1995
1996
1997
1998
1999
2000
2001
2002
2003
Odex (gross) Odex (MM3) Odex (technical)
“Heating behaviour” (higher
temperature, duration of
heating…),more hot water