Defining abnormal slow EEG activity in acute ischaemic ...367878/UQ367878_OA.pdf · Defining...
32
Accepted Manuscript Defining abnormal slow EEG activity in acute ischaemic stroke: delta/alpha ratio as an optimal QEEG index Simon Finnigan, Andrew Wong, Stephen Read PII: S1388-2457(15)00723-3 DOI: http://dx.doi.org/10.1016/j.clinph.2015.07.014 Reference: CLINPH 2007562 To appear in: Clinical Neurophysiology Accepted Date: 15 July 2015 Please cite this article as: Finnigan, S., Wong, A., Read, S., Defining abnormal slow EEG activity in acute ischaemic stroke: delta/alpha ratio as an optimal QEEG index, Clinical Neurophysiology (2015), doi: http://dx.doi.org/10.1016/ j.clinph.2015.07.014 This is a PDF file of an unedited manuscript that has been accepted for publication. As a service to our customers we are providing this early version of the manuscript. The manuscript will undergo copyediting, typesetting, and review of the resulting proof before it is published in its final form. Please note that during the production process errors may be discovered which could affect the content, and all legal disclaimers that apply to the journal pertain.
Transcript of Defining abnormal slow EEG activity in acute ischaemic ...367878/UQ367878_OA.pdf · Defining...

Accepted Manuscript
Defining abnormal slow EEG activity in acute ischaemic stroke: delta/alpharatio as an optimal QEEG index
Simon Finnigan, Andrew Wong, Stephen Read
PII: S1388-2457(15)00723-3DOI: http://dx.doi.org/10.1016/j.clinph.2015.07.014Reference: CLINPH 2007562
To appear in: Clinical Neurophysiology
Accepted Date: 15 July 2015
Please cite this article as: Finnigan, S., Wong, A., Read, S., Defining abnormal slow EEG activity in acute ischaemicstroke: delta/alpha ratio as an optimal QEEG index, Clinical Neurophysiology (2015), doi: http://dx.doi.org/10.1016/j.clinph.2015.07.014
This is a PDF file of an unedited manuscript that has been accepted for publication. As a service to our customerswe are providing this early version of the manuscript. The manuscript will undergo copyediting, typesetting, andreview of the resulting proof before it is published in its final form. Please note that during the production processerrors may be discovered which could affect the content, and all legal disclaimers that apply to the journal pertain.

Defining slow EEG abnormality in acute ischaemic stroke
1
Defining abnormal slow EEG activity in acute ischaemic stroke:
delta/alpha ratio as an optimal QEEG index
Simon Finnigan a, b *, Andrew Wong c,d, Stephen Read c,d
a UQ Centre for Clinical Research, University of Queensland, Brisbane, Australia
b Centre for Allied Health Research, Royal Brisbane and Women's Hospital, Metro North
Hospital and Health Service, Queensland, Australia
c School of Medicine, University of Queensland, Brisbane, Australia
d Acute Stroke Unit, Neurology Department, Royal Brisbane and Women's Hospital, Metro
North Hospital and Health Service, Queensland, Australia
* Correspondence:
Simon Finnigan
UQ Centre for Clinical Research
University of Queensland
Royal Brisbane & Women's Hospital
Herston QLD 4029
Australia
Tel.: +61 7 33466015
Fax: +61 7 33465594
E-mail: [email protected]

Defining slow EEG abnormality in acute ischaemic stroke
2
ABSTRACT
Objective: Quantitative electroencephalographic (QEEG) indices sensitive to
abnormal slow (relative to faster) activity power seem uniquely informative for clinical
management of ischaemic stroke (IS), including around acute reperfusion therapies.
However these have not been compared between IS and control samples. The
primary objective was to identify the QEEG slowing index and threshold value which
can most accurately discriminate between IS patients and controls.
Methods: The samples comprised 28 controls (mean age: 70.4; range: 56-84) and
18 patients (mean age: 69.3; range: 51-86). Seven indices were analysed: relative
bandpower (delta, theta, alpha, beta), delta/alpha power ratio (DAR),
(delta+theta)/(alpha+beta) ratio (DTABR) and QSLOWING. The accuracies of each
index for classifying participants (IS or control) were analysed using receiver
operating characteristic (ROC) techniques.
Results: All indices differed significantly between the samples (p < .001). DAR alone
exhibited optimal classifier accuracy, with a threshold of 3.7 demonstrating 100%
sensitivity and 100% specificity for discriminating between radiologically-confirmed,
acute IS or control. DTABR and relative delta were the next most accurate
classifiers.
Conclusions: DAR of 3.7 demonstrated maximal accuracy for classifying all 46
participants as acute IS or control.
Significance: DAR assessment may inform clinical management of IS and perhaps
other neurocritical patients.
Keywords: Acute ischaemic stroke; quantitative electroencephalography; delta
activity; alpha activity.

Defining slow EEG abnormality in acute ischaemic stroke
3
HIGHLIGHTS
• All QEEG indices (sensitive to power of delta, theta, alpha, and/or beta bands)
differed highly significantly between acute ischaemic stroke (IS) and control
samples.
• Delta/alpha power ratio (DAR) demonstrated maximal accuracy for
discriminating between acute IS patients and controls.
• DAR < 3.7 was 100% specific for the absence, and > 3.7 was 100% sensitive
for the presence, of a radiologically-confirmed IS lesion.

Defining slow EEG abnormality in acute ischaemic stroke
4
INTRODUCTION
Ischaemic stroke (IS) produces abnormal, slow EEG activity - particularly in the delta
frequency range (1-4 Hz) - and attenuation of normative, faster activity, particularly in
the alpha frequency range (8-12 Hz; e.g., Jordan, 2004; Hirsch et al., 2013). A recent
review (Finnigan and van Putten, 2013) emphasises that particular QEEG indices,
which are sensitive to such cerebral pathophysiology following IS, can inform clinical
decision-making including: (1) continuous monitoring to inform about the efficacy of
acute reperfusion therapies, and; (2) outcome prognostication and clinical
management decisions based on brief, pre-discharge EEG. As summarised in Table
1, indices sensitive to the power of delta relative to faster activity which have proven
particularly informative for these clinical applications are: relative delta power (e.g.,
Claassen et al., 2004; Finnigan et al., 2004; 2007), the delta/alpha power ratio (DAR;
e.g., Claassen et al., 2004; Finnigan et al., 2007; Leon-Carrion et al., 2009; Schleiger
et al., 2014; Sheikh et al., 2013), and (delta+theta)/(alpha+beta) power ratio (e.g.,
DTABR; Sheorajpanday et al., 2011 a). The current study investigates the respective
capacities of these and other bandpower-derived indices to distinguish between
acute IS versus normative EEG.
Several observations indicate that continuous monitoring of relative delta power or
DAR can promptly inform bedside assessment of the efficacy (or otherwise) of acute
reperfusion therapies, such as intravenous alteplase or intra-arterial clot retrieval,
prior to potential clinical changes (e.g., Finnigan et al., 2006; Finnigan and van
Putten, 2013; Sheikh et al., 2013). Importantly QEEG can thus inform about potential
salvage of ischaemic neural tissue (“penumbra”), whereas imaging modalities can
inform about (re-)perfusion but not the activity of this ischaemic, cerebral tissue. To
date such studies have relied upon repeated-measures, statistical tests (performed
retrospectively) to assess the potential significance of delta power or DAR changes
over time. However such techniques are not particularly feasible in time-critical,
clinical settings and for this and other reasons, identification of a QEEG threshold
value for defining abnormal cerebral activity should prove informative and
translatable. For example reperfusion therapy may be more readily (yet accurately)
determined to be successful when a pertinent QEEG index (e.g., DAR) normalises
Defining slow EEG abnormality in acute ischaemic stroke
5
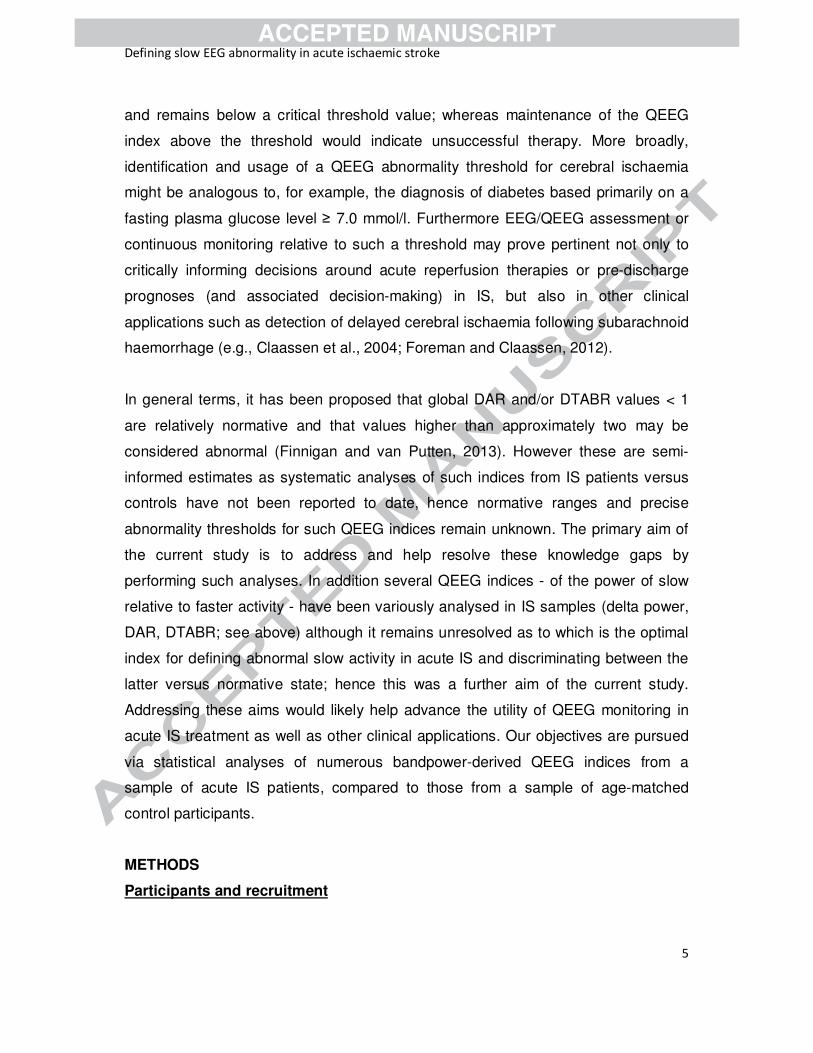
and remains below a critical threshold value; whereas maintenance of the QEEG
index above the threshold would indicate unsuccessful therapy. More broadly,
identification and usage of a QEEG abnormality threshold for cerebral ischaemia
might be analogous to, for example, the diagnosis of diabetes based primarily on a
fasting plasma glucose level ≥ 7.0 mmol/l. Furthermore EEG/QEEG assessment or
continuous monitoring relative to such a threshold may prove pertinent not only to
critically informing decisions around acute reperfusion therapies or pre-discharge
prognoses (and associated decision-making) in IS, but also in other clinical
applications such as detection of delayed cerebral ischaemia following subarachnoid
haemorrhage (e.g., Claassen et al., 2004; Foreman and Claassen, 2012).
In general terms, it has been proposed that global DAR and/or DTABR values < 1
are relatively normative and that values higher than approximately two may be
considered abnormal (Finnigan and van Putten, 2013). However these are semi-
informed estimates as systematic analyses of such indices from IS patients versus
controls have not been reported to date, hence normative ranges and precise
abnormality thresholds for such QEEG indices remain unknown. The primary aim of
the current study is to address and help resolve these knowledge gaps by
performing such analyses. In addition several QEEG indices - of the power of slow
relative to faster activity - have been variously analysed in IS samples (delta power,
DAR, DTABR; see above) although it remains unresolved as to which is the optimal
index for defining abnormal slow activity in acute IS and discriminating between the
latter versus normative state; hence this was a further aim of the current study.
Addressing these aims would likely help advance the utility of QEEG monitoring in
acute IS treatment as well as other clinical applications. Our objectives are pursued
via statistical analyses of numerous bandpower-derived QEEG indices from a
sample of acute IS patients, compared to those from a sample of age-matched
control participants.
METHODS
Participants and recruitment

Defining slow EEG abnormality in acute ischaemic stroke
6
This study was approved by the local hospital and university, human research ethics
committees, and all participants (or the legally authorised, substitute decision maker
for severe stroke cases, if appropriate) gave informed consent.
Healthy older adults
Participants were recruited from an older adult participant panel which was initially
assembled via newspaper advertisements. All participants completed a detailed
questionnaire about their own health and current medications, as well as any
relevant health issues in their family. Participants with a history of anxiety,
depressive disorders, head injury, stroke, epilepsy, heart attack, neurological
conditions, major psychiatric disorder, were excluded from the study. Thirty older
adult participants were thus recruited.
Each participant was administered the Mini Mental State Exam, Wechsler Adult
Intelligence Scale (3rd edition), Geriatric Depression Scale, Boston Naming Test,
Alzheimer’s Disease Assessment Scale, cognitive sub-section, the Rey Auditory
Verbal Learning Test, and letter (F,A,S) and category (animal) fluency tests. All
participants previously had cranial magnetic resonance imaging (MRI) performed as
part of a parallel study. On the basis of their outcomes from all screening and
assessment items detailed above, participants were classified as controls by
consensus decision between a neurologist and a clinical psychologist. Classifications
were made with thorough consideration of contemporary diagnostic criteria for mild
cognitive impairment (e.g., Winblad et al., 2004) and for “delirium, dementia, and
amnestic and other cognitive disorders” in the Diagnostic and Statistical Manual of
Mental Disorders, 4th Edition, Text Revision (2000; DSM-IV-TR). Two participants
(both male, ages 75 and 77) met criteria for mild cognitive impairment (amnestic
domain; e.g,, Winblad et al., 2004) hence these participants were excluded from the
analyses.
As summarised in Supplementary Table S1 the normative older adult sample then
included 28 healthy, cognitively unimpaired individuals (17 females) whose mean
age was 70.4 years (S.D. = 8.58, Range = 56 - 84).

Defining slow EEG abnormality in acute ischaemic stroke
7
Stroke patients
Patients with acute focal motor neurological symptoms together with symptoms such
as speech impairment, inattention or impaired cognition, consistent with ischemic
cortical stroke, were initially considered for recruitment. All patients underwent acute,
non-contrast computed tomography (CT) scanning. For patients 1 to 10, magnetic
resonance imaging (MRI) assessments were also performed, within 6 h of symptom
onset, and EEG recordings performed as soon as feasible thereafter (and always
within 24 h of onset) at the bedside, as per a previously-reported protocol (Finnigan
et al., 2004). Patients 11 to 18 had CT perfusion (CTP) and angiogram (CTA), and
EEG recordings commenced as soon as feasible thereafter at the bedside.
Ischaemic stroke and arterial territory affected by same were confirmed via acute,
multi-modal MRI or CT, and thereby only patients with unilateral, ischaemic lesions
in the territory of the middle cerebral artery (MCA) were included. Patients were
excluded if they presented with fever, seizures, a cerebral haemorrhage on CT, a
pre-existing neurological condition that would confound clinical or neuroimaging
assessment, such as radiological evidence of previous stroke, EEG abnormalities
consistent with encephalitis or medications that could confound EEG assessment
(e.g., benzodiazepines, tricyclics or neuroleptic medications). The National Institutes
of Health Stroke Scale (NIHSS) was administered by a neurologist following
enrolment into the study.
Eighteen IS patients (7 males; mean age, 69.3; range, 51 to 86 years) were enrolled.
Patient demographics, affected vascular territories, admission NIHSS scores, QEEG
indices and descriptive statistics for same are summarised in Supplementary Table
S2. (Patients 4, 6, 7 and 15 were administered intravenous alteplase following
imaging and EEG.)
EEG data acquisition
An elasticated EEG cap (Quik-Cap, Neuromedical Supplies) was used containing
nineteen sintered Ag/AgCl scalp electrodes positioned at the sites of the international
10-20 system (FP1, FP2, F7, F3, Fz, F4, F8, T3, C3, Cz, C4, T4, T5, P3, Pz, P4, T6,

Defining slow EEG abnormality in acute ischaemic stroke
8
O1, O2), except for patients 11 to 18 for whom individual electrodes (Nicolet) were
used but with all other parameters remaining identical. Vertical and horizontal
electro-oculograms (EOGs) were recorded from two bipolar channels via electrodes
placed below and on the supra-orbital ridge of the left eye (VEOG) and on the outer
canthus of each eye (HEOG). Electrode impedances were predominantly 5-10
kOhms or less. The online reference was immediately posterior to Cz. These data
were acquired using a Neuroscan Synamps2™ amplifier or, for IS patients 11 to 18,
a NicOne Brain Monitor system (Natus Medical Inc.) with a 500Hz sampling rate and
were filtered online (bandpass; 0.01-100 Hz). EEG was recorded for at least fifteen
minutes per participant in resting, awake state with eyes closed. Alertness or
sleepiness was assessed throughout each recording, primarily via periodic
behavioural assessments (saying the patient’s name and asking if they were still
awake, every 3 to 5 minutes). Generally, patients and control participants were
awake and resting quietly with eyes closed during recording periods from which EEG
data were analysed quantitatively (i.e., the first 3 to 5 minutes; see below). Two
patients (3, 18) evidently were dozing by the fifth minute of recording although their
QEEG data is consistent with previous evidence that in acute IS the capacities of
global delta power and DAR to inform clinical assessments are robust to sleep state
(Finnigan et al., 2004) and sedation (Sheikh et al, 2013), at least. That is, if sleep
were to substantially increase delta power and DAR we would have expected these
indices to be higher in these, relative to the other participants (see Figure 1 and
Supplementary Table S2).
EEG signal processing & QEEG computations
Offline signal processing was performed with Edit 4.5 software (Compumedics-
Neuroscan) using the following methods which we have previously reported (e.g.,
Cummins and Finnigan, 2007, 2008; Finnigan et al., 2007; Finnigan and Robertson,
2011; Schleiger et al., 2014). EOG artefacts were reduced where appropriate using
the procedure of Semlitsch et al. (1986). These data were filtered (bandpass; 0.5-40
Hz, 12dB/octave), then EEG data were re-referenced to the common average
reference. Each data file was “epoched” into contiguous epochs of 2048 ms (1024
data points), then epochs in which EEG amplitude exceeded ±100 µv were
Defining slow EEG abnormality in acute ischaemic stroke
9
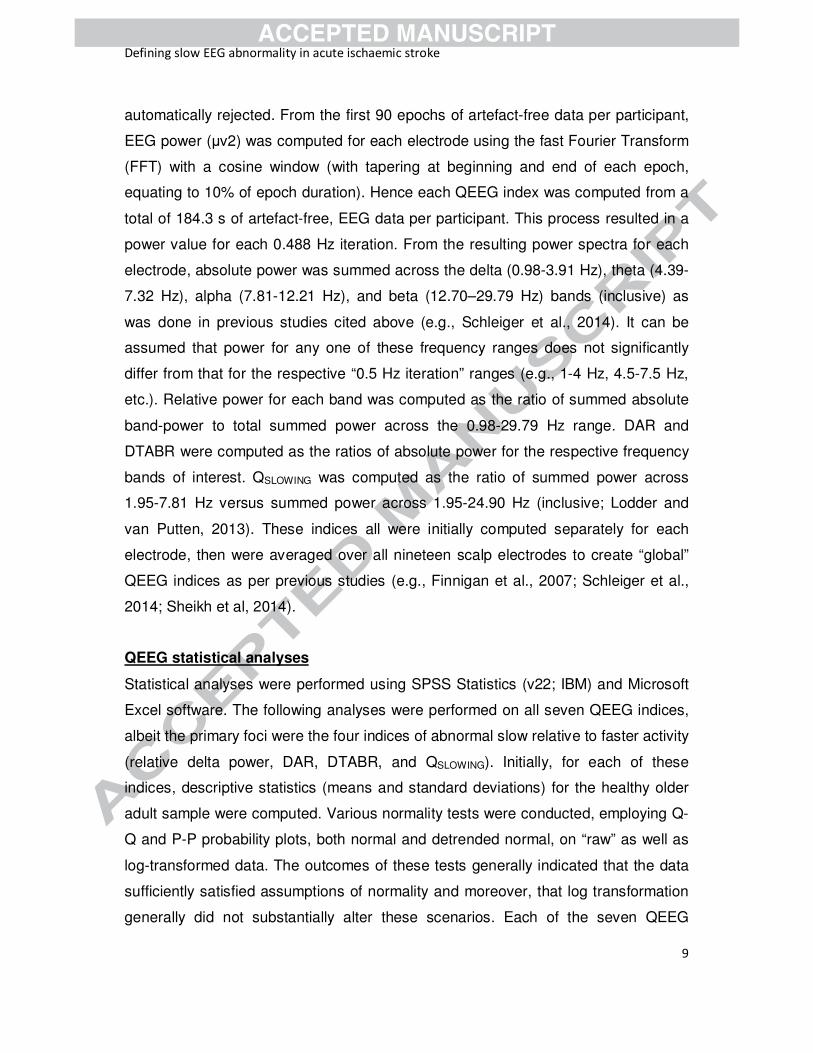
automatically rejected. From the first 90 epochs of artefact-free data per participant,
EEG power (µv2) was computed for each electrode using the fast Fourier Transform
(FFT) with a cosine window (with tapering at beginning and end of each epoch,
equating to 10% of epoch duration). Hence each QEEG index was computed from a
total of 184.3 s of artefact-free, EEG data per participant. This process resulted in a
power value for each 0.488 Hz iteration. From the resulting power spectra for each
electrode, absolute power was summed across the delta (0.98-3.91 Hz), theta (4.39-
7.32 Hz), alpha (7.81-12.21 Hz), and beta (12.70–29.79 Hz) bands (inclusive) as
was done in previous studies cited above (e.g., Schleiger et al., 2014). It can be
assumed that power for any one of these frequency ranges does not significantly
differ from that for the respective “0.5 Hz iteration” ranges (e.g., 1-4 Hz, 4.5-7.5 Hz,
etc.). Relative power for each band was computed as the ratio of summed absolute
band-power to total summed power across the 0.98-29.79 Hz range. DAR and
DTABR were computed as the ratios of absolute power for the respective frequency
bands of interest. QSLOWING was computed as the ratio of summed power across
1.95-7.81 Hz versus summed power across 1.95-24.90 Hz (inclusive; Lodder and
van Putten, 2013). These indices all were initially computed separately for each
electrode, then were averaged over all nineteen scalp electrodes to create “global”
QEEG indices as per previous studies (e.g., Finnigan et al., 2007; Schleiger et al.,
2014; Sheikh et al, 2014).
QEEG statistical analyses
Statistical analyses were performed using SPSS Statistics (v22; IBM) and Microsoft
Excel software. The following analyses were performed on all seven QEEG indices,
albeit the primary foci were the four indices of abnormal slow relative to faster activity
(relative delta power, DAR, DTABR, and QSLOWING). Initially, for each of these
indices, descriptive statistics (means and standard deviations) for the healthy older
adult sample were computed. Various normality tests were conducted, employing Q-
Q and P-P probability plots, both normal and detrended normal, on “raw” as well as
log-transformed data. The outcomes of these tests generally indicated that the data
sufficiently satisfied assumptions of normality and moreover, that log transformation
generally did not substantially alter these scenarios. Each of the seven QEEG

Defining slow EEG abnormality in acute ischaemic stroke
10
indices were then compared statistically between the samples via independent
groups t-tests, with a Bonferroni correction for multiple comparison also employed
(thus rendering the critical “alpha” level to be 0.007 or less; i.e., 0.05 divided by 7).
On the basis of past literature (summarised in Finnigan and van Putten, 2013) we
hypothesised that indices directly involving and proportional to delta power (relative
delta, DAR, DTABR) would be significantly greater in the acute stroke sample,
whereas relative alpha power would be significantly greater in the control sample.
We did not consider existing literature to be of sufficient quantity and/or equivocality
to support definitive hypotheses regarding relative theta or beta power, or QSLOWING.
Thereafter a preliminary abnormality threshold for each QEEG index was identified,
as the “critical z” value representing a z-score of + 1.96 relative to (1.96 standard
deviations above) the normative mean, for all indices except relative power of the
“faster” frequency bands, alpha and beta (in which cases z-scores of - 1.96 were
computed). This is a standard statistical method for defining whether or not an
individual’s score is significantly different to the mean of a given sample or
population (using an alpha level of 0.05, two-tailed; e.g., Howell, 2014). Using this
method an individual is significantly different to a given population if the absolute
value of the z-score is greater than 1.96. For five of the QEEG indices analysed
(excluding alpha and beta power), relatively high values are routinely observed in IS,
indicating abnormal degrees of slow activity. In addition it remains unclear as to
whether or not a z-score associated with DAR, for example, of – 1.96 might be
considered abnormal per se. Hence only “upper-end” abnormality thresholds were of
key interest in the current investigation (with the exception of alpha and beta power,
for which “lower-end” criteria were considered, secondarily). This is not only a routine
statistical approach (e.g., Howell, 2014) but also it is analogous to that of a past
study which computed z-scores from QEEG band-power measures acquired from IS
patients (and correlated these with functional outcome measures; Cuspineda et al.,
2003).
The respective capacities of the preliminary abnormality thresholds to accurately
classify participants as ischaemic stroke or control were then analysed using

Defining slow EEG abnormality in acute ischaemic stroke
11
receiver operating characteristic (ROC) techniques. Classifier specificity and
sensitivity values were first calculated for each preliminary threshold. For cases
wherein an alternative threshold value for any given QEEG index was associated
with better classifier performance on the basis of ROC results (a more optimal
combination of specificity and sensitivity values) relative to the preliminary threshold,
the latter was revised as appropriate.
RESULTS
Comparisons between control and acute IS samples
Descriptive statistics for age and QEEG indices of the control and IS samples are
summarised in Table 2. Age did not significant differ between the samples. QEEG
indices for each individual participant are plotted in Figures 1-4 and are listed for the
control and IS samples in Supplementary Tables S1 and S2 respectively. As
expected all QEEG indices were higher in the stroke sample, with the exception of
relative alpha and relative beta power which were higher in the control sample. Mean
relative delta power was twice as high in the IS sample as in the controls whereas
mean relative alpha was more than twice as high in controls as in IS and relatedly,
DAR was much higher in IS. Although relative theta did not differ so markedly (being
slightly higher in IS), mean relative beta power was more than twice as high in
controls compared to IS and relatedly, DTABR was much higher in IS. Independent
groups t-tests demonstrated that all seven QEEG indices differed highly significantly
between the samples: all between-sample differences were of sufficient magnitude
to maintain statistical significance even after a Bonferroni correction for multiple
comparisons (see Table 2).
Receiver operating characteristic analyses
Preliminary thresholds computed for each QEEG index, corresponding to the values
at which z = +1.96 or in the case of relative power for the “faster” bands (alpha and
beta), z = -1.96, are summarised in Table 2. The outcomes of initial ROC analyses of
classifier performance of these thresholds are summarised in Supplementary Table
S3. In brief, DAR demonstrated optimal classifier performance as indicated by an
area under the ROC curve (AUC) value of 1 (the maximum possible AUC value).

Defining slow EEG abnormality in acute ischaemic stroke
12
This result relates to the fact that DAR was the only index for which there was
separation (i.e., no overlap) in values between the two samples (see Figure 2,
compared to Figures 3 and 4). The next most accurate classifier indices according to
their respective AUC values were DTABR (0.996) and relative delta power (0.994),
while the poorest classifier clearly was relative theta (0.812). None of the preliminary
thresholds demonstrated maximal classifier accuracy, in terms of both sensitivity and
specificity measures. Although DAR had maximal performance (AUC of 1) the
preliminary DAR threshold (3.32) was lower than the DAR values (3.43 and 3.56) of
two control participants (C17, C26) and these “false positives” are reflected in the
specificity of this threshold being less than 100% (Supplementary Table S3).
Assuming these control participants are without occult cerebral infarction or other
neurological damage, these results suggest that a higher DAR threshold would be
appropriate. Likewise for all indices except DTABR, revised threshold values were
found to result in improved sensitivity and/or specificity, compared to the preliminary
thresholds (see Table 3). A DAR threshold of 3.7 demonstrated 100% specificity and
100% sensitivity (i.e., maximal accuracy) for classifying all 46 participants as
(radiologically-confirmed) acute IS or control. As illustrated in Figure 2, this DAR
threshold is midway between the highest control (3.56) and the lowest IS patient
value (3.85). Of the six other indices the next most accurate performance was
provided by the original DTABR threshold of 1.76 (100% sensitivity, 96.4%
specificity) and relative theta still demonstrated the lowest accuracy as a classifier
(see Table 3).
DISCUSSION
These are the first reported analyses of QEEG indices compared between acute
ischaemic stroke (IS) and age-matched control samples and of DAR and QSLOWING in
control participants, to our knowledge. All seven QEEG indices analysed - relative
bandpower, and ratio measures of relative intensity of abnormal slow-wave activity -
differed significantly between the samples. IS sample EEGs contained greater
intensity of pathophysiological, slow activity (particularly delta, and also theta)
relative to faster activity (particularly alpha, and also beta), whereas the converse
was true for controls. In addition we statistically analysed the capacities of these

Defining slow EEG abnormality in acute ischaemic stroke
13
respective indices to classify EEG as acute IS or normative state. DAR was found to
be the most accurate index for discriminating between radiologically-confirmed,
acute IS and age-matched controls and we identified 3.7 as the optimal DAR
threshold value for this purpose (see Figure 2).
Sheorajpanday et al. (2011b) proposed that DTABR < 1 was 100% specific for the
absence, and > 3.5 was 100% sensitive for the presence, of a recent, radiologically-
confirmed IS lesion (DAR was not analysed). Those findings do not resolve how to
interpret DTABR values between 1 and 3.5 and this is salient, for in the current data
6 IS cases (33%) and 9 controls (32%) were within this range. The current outcomes
update this scenario by indicating that DAR is a more accurate classifier index; DAR
< 3.7 is 100% specific for the absence, and > 3.7 is 100% sensitive for the presence,
of a recent, radiologically-confirmed IS lesion. The sample of middle cerebral artery
IS patients included several cases with relatively small ischaemic lesions on imaging
and mild symptoms (cases 1, 2, 6; Table 2) as well as a subcortical lesion (see
below) suggesting this threshold may apply to all such cases. However analyses of
data from larger samples may identify a revised threshold and/or thresholds more
specific to stroke locations (e.g., cortical versus subcortical; anterior versus posterior
circulation).
The efficacy of DAR compared to other QEEG indices
These outcomes converge with and build upon other evidence supporting the value
of DAR, over other QEEG indices, for assessing ischaemic cerebral pathophysiology
(see Table 1). DAR previously was found to be the most effective of 12 QEEG
indices in relation to detection of delayed cerebral ischaemia in subarachnoid
haemorrhage (Claassen et al., 2004). Indices analysed included absolute and
relative bandpower, power ratios and also alpha and delta coherence. The only
studies which have compared the prognostic capacities of DAR and DTABR within
samples have found DAR to be superior (Finnigan et al., 2007; Leon-Carrion et al.,
2009; Table 3). DTABR, relative power indices and, in part, QSLOWING (see below) are
sensitive to power of all four traditional frequency bands but DAR is computed from
absolute power of delta and alpha activity only. Theta and beta activity appear

Defining slow EEG abnormality in acute ischaemic stroke
14
relatively less reliable in IS assessments (e.g., Finnigan and van Putten, 2013;
Sainio et al., 1983). For example beta is more susceptible to contamination by
electromyogram (EMG) artefacts (e.g., Finnigan et al., 2007) and theta power is an
unreliable index of IS pathophysiology in part because theta band measures can be
confounded by slowed alpha activity (Nuwer et al., 1987). Consistent with this, in the
current analyses relative theta power had the lowest accuracy as a classifier index.
These factors evidently explain why several studies’ results converge to indicate that
DTABR is less accurate than DAR, in relation to informing IS assessments and
prognoses. The optimality of DAR is exemplified by control participant C02 whom
had abnormal values on all indices except DAR (e.g., higher DTABR and QSLOWING
than IS Patient 2; Supplementary Table S1, Figure 1) thus only DAR (with threshold
of 3.7) would correctly classify C02 as non-IS. Evidently these outcomes relate to
C02 having the lowest relative beta power of the controls, whereas DAR is the only
index not sensitive to beta, or theta activity. Consequently DTABR had lower
classifier accuracy and specificity than DAR, albeit DTABR was overall the second
most accurate index as a classifier.
In contrast to DTABR, relative power measures for delta and alpha are only indirectly
sensitive to theta and beta power. In IS studies wherein EEG was recorded at 48 h
or later post-stroke, relative alpha power has demonstrated highly significant
correlations with functional outcome measures (Finnigan et al., 2007; Schleiger et
al., 2014). However relative alpha appears less informative in relation to acute (< 24
h) IS assessment and monitoring. In terms of relative delta there was minor overlap
between the samples , and the IS mean was double that of the control sample. Delta
power measures have demonstrated some degree of value in IS monitoring and
prognostication (Finnigan et al., 2004, 2006, 2007, 2008; Schleiger et al., 2014; see
Table 1) and according to Foreman and Claassen (2012) “the relative delta (power)
percentage appears to provide the most robust correlation with CBF and metabolism
during focal ischemia” (compared to relative power of the other three classical
frequency bands rather than to ratios such as DAR, evidently). Relative delta had
similar classifier accuracy to DTABR but with slightly lower sensitivity. In future

Defining slow EEG abnormality in acute ischaemic stroke
15
applications one of these indices could in some cases be considered, as
supplementary to DAR, for example if DAR were around the threshold.
QSLOWING was a less accurate classifier than DAR, DTABR and relative delta, with
39% of controls and 33% of patients were within the range of overlap of QSLOWING
values between samples (Figure 3). Albeit it should be noted that Lodder and van
Putten initially proposed QSLOWING not for this application, but as one of five indices to
supplement visual EEG interpretations. In acute IS a “lower delta” power peak
(around 1.5 Hz) appears salient and informative for acute IS monitoring (Finnigan et
al. 2004) yet QSLOWING is not sensitive to this but measures the relative power of
“upper delta and theta” activity (2-8 Hz). These factors, together with evidence that
theta power is unreliable in this context (see above) appear to underlie the current
findings.
Potential clinical applications of DAR abnormality assessment
Some current clinical systems automatically compute and instantly display QEEG
indices (as well as conventional EEG), hence the proposed abnormality assessment
employing a DAR threshold can readily be applied at the bedside. This procedure
may prove valuable for promptly detecting cerebral ischaemia after subarachnoid
haemorrhage (Claassen et al., 2004), in other acute brain injury or ICU patients (e.g.,
Foreman and Claassen, 2012; Gaspard et al., 2013; Claassen et al., 2014) or during
carotid endarterectomy. Pending the outcomes of future studies, it may prove useful
in other clinical contexts or neurological patient groups, such as distinguishing IS
versus stroke mimic or medically unexplained symptoms.
Another potential clinical application is continuous monitoring to inform decisions
regarding reperfusion therapies in acute IS. Identification of a DAR abnormality
criterion extends previous proposals on this topic (Finnigan and van Putten, 2013).
Sheikh et al (2013) report longitudinal DAR measures from two patients receiving
reperfusion therapy. In one case (admission NIHSS score 15) DAR was above 12
prior to intravenous alteplase administration and remained highly abnormal
thereafter, accurately indicating lack of successful therapy (discharge NIHSS score

Defining slow EEG abnormality in acute ischaemic stroke
16
11; moderate-severe disability at 3 months). In the other case DAR remained
abnormal (>7.5) and symptoms severe (NIHSS 19) following unsuccessful,
intravenous alteplase, but soon after ensuing intra-arterial clot retrieval DAR had
dropped below 3.7, accurately indicating successful reperfusion (mild symptoms at
discharge; NIHSS 2). These data indicate that DAR falling below our proposed
criterion may prognosticate treatment efficacy; whereas lack of prompt DAR
normalisation following intravenous alteplase (indicating unsuccessful treatment)
may expedite decisions regarding intra-arterial reperfusion strategies within the
critical, brief window of opportunity for same. Further data are required to
systematically evaluate these proposals and identify the precise nature of DAR
decrease that would reliably indicate efficacy (e.g., 4 to 3.5, versus 12 to 4, etc.). We
do not suggest that QEEG could replace neuroimaging techniques in clinical
management of IS, however while imaging can indicate reperfusion it does not
directly inform about potential response of ischaemic, neural tissue to same.
Whereas EEG directly measures neural (dys)function and the latter, and DAR may
constitute a reliable, bedside indicator of success of reperfusion therapy.
Additional considerations
Several caveats to the current study should be noted. Fifteen (83%) of the IS sample
had EEG performed within 8 h of stroke symptom onset and three, between 8 and 24
h. Whereas in our past studies of EEG acquired around 48 h post-onset or thereafter
(Finnigan et al., 2007; Schleiger et al., 2014) DAR values below 3.7 were not
uncommon, indicating that this proposed threshold is not directly applicable by this
time period (albeit this is well beyond the therapeutic window for reperfusion). Future
studies may further investigate a lower DAR abnormality criterion pertinent to the
(pre-discharge) days following stroke which, together with other assessments, may
help inform clinical prognoses and decisions. All patients studied suffered
radiologically-confirmed, MCA stroke with (partly) cortical lesions in all but one case:
in patient 12 the lesion was striatocapsular (restricted to the basal ganglia). While
this single case suggests our proposals might also apply to such cases of IS
affecting only subcortical regions (e.g., basal ganglia or lacunar strokes) or non-MCA
arterial territories (see also Finnigan and van Putten, 2013) further investigations are

Defining slow EEG abnormality in acute ischaemic stroke
17
warranted. It is also noteworthy that subtle slowing of the peak alpha frequency can
occur with ageing (e.g., Finnigan and Robertson, 2011) hence these data from
participants aged 51 to 86 may possibly differ to those from younger adults.
Relatedly it is possible that one or more patients had DAR above 3.7 prior to IS due
to alpha slowing or cognitive impairment linked to cerebrovascular issues, for
example. Other QEEG indices may also prove informative. Inter-hemispheric voltage
(a)symmetry has been quantified (across 1-25 Hz) via the pairwise-derived brain
symmetry index (pdBSI). To date indices relating to delta power, particularly DAR,
generally have demonstrated greater value in relation to IS assessments (e.g.,
Claassen et al., 2004; Finnigan and van Putten, 2013; Foreman and Claassen 2012;
Leon-Carrion et al., 2009; Schleiger et al., 2014; Table 1) although subacute pdBSI
seems informative for outcome prognostication (e.g., Sheorajpanday et al., 2011).
The only study which has directly compared subacute DAR and pdBSI reported that
only DAR had highly significant correlations with functional outcomes (Schleiger et
al., 2014), although future studies may investigate the potential value of pdBSI in
acute IS.
Assessment of EEG traces remains important, e.g. for verification of artefacts.
Lodder and van Putten (2013) report several bandpower-derived QEEG indices
which can support and improve inter-rater reliability of visual EEG interpretation. As
discussed in detail elsewhere (e.g., Finnigan and van Putten, 2013; Foreman and
Claassen, 2012) EEG/QEEG may be susceptible to factors including artefacts,
medications, metabolic conditions and sleep state, although evidence indicates that
in acute IS the monitoring and prognostic value of global delta power and DAR are
robust to sleep state (Finnigan et al., 2004) and sedation (Sheikh et al, 2013), at
least. Nevertheless such factors must be considered, particularly given that some
artefacts (e.g., those caused by eye blinks) can potentially affect delta power
measures, and this further emphasises the value of assessing raw EEG traces as
well as QEEG. It has been proposed that computer-assisted EEG/QEEG monitoring
can facilitate recognition of common EEG abnormalities by non-expert clinical staff
(Cloostermans et al., 2011). Using such technology in future, non-experts (e.g., allied
health professionals) may generally prefer to first assess QEEG information (and

Defining slow EEG abnormality in acute ischaemic stroke
18
perhaps then consult EEG traces, or experts) whereas the converse may generally
apply for experts (e.g., neurologists).
In summary DAR with a threshold value of 3.7 demonstrated perfect accuracy for
distinguishing between acute IS pathophysiology and normative state, and
classifying all 46 participants accordingly. Further investigations are warranted in IS
and other neurocritical patient groups.

Defining slow EEG abnormality in acute ischaemic stroke
19
Conflict of Interest
None.
Funding
Simon Finnigan was supported in part by a Career Development Award from the
National Health and Medical Research Council of Australia. This research was
supported in part by the National Stroke Foundation, and the Royal Brisbane and
Women's Hospital Foundation.

Defining slow EEG abnormality in acute ischaemic stroke
20
REFERENCES
Claassen J, Hirsch LJ, Kreiter KT, Du EY, Connolly ES, Emerson RG, et al.
Quantitative continuous EEG for detecting delayed cerebral ischemia in patients
with poor-grade subarachnoid hemorrhage. Clin Neurophysiol 2004;115:2699-
2710.
Claassen J, Vespa P, Participants in the International Multi-disciplinary Consensus
Conference on Multimodality Monitoring. Electrophysiologic monitoring in acute
brain injury. Neurocrit Care. 2014;21(S2):129-47.
Cloostermans MC, de Vos CC, van Putten MJ. A novel approach for computer
assisted EEG monitoring in the adult ICU. Clin Neurophysiol 2011;122:2100-2109.
Cummins TAD, Finnigan S. Theta power is reduced in healthy cognitive ageing. Int J
Psychophysiol. 2007;66:10-17.
Cummins TAD, Broughton M, Finnigan S. Theta oscillations are affected by mild
cognitive impairment (amnestic domain) and cognitive load. Int J Psychophysiol.
2008;70:75-81.
Cuspineda E, Machado C, Aubert E, Galan L, Llopis F, Avila Y. Predicting outcome
in acute stroke: A comparison between QEEG and Canadian Neurological Scale.
Clin Electroencephalogr 2003;34:1-4.
de Vos CC, van Maarseveen SM, Brouwers PJ, van Putten MJ. Continuous EEG
monitoring during thrombolysis in acute hemispheric stroke patients using the
brain symmetry index. J Clin Neurophysiol. 2008;25:77-82.
Finnigan SP, Rose SE, Walsh M, Griffin M, Janke AL, McMahon KL, et al.
Correlation of quantitative EEG in acute stroke with 30 day NIHSS score:
Comparison with diffusion and perfusion MRI. Stroke 2004;35:899-903.
Defining slow EEG abnormality in acute ischaemic stroke
21
Finnigan SP, Rose SE, Chalk JB. Rapid EEG changes indicate reperfusion after
tissue plasminogen activator injection in acute ischaemic stroke. Clin
Neurophysiol. 2006;117:2338-2339.
Finnigan SP, Walsh M, Rose SE, Chalk JB. Quantitative EEG indices of sub-acute
ischaemic stroke correlate with clinical outcomes. Clin Neurophysiol.
2007;118:2525-2532.
Finnigan SP, Rose SE, Chalk JB. Contralateral hemisphere delta EEG in acute
stroke precedes worsening of symptoms and death. Clin Neurophysiol.
2008;119:1690-1694.
Finnigan S, Robertson IH. Resting EEG theta power correlates with cognitive
performance in healthy older adults. Psychophysiology. 2011;48:1083-7.
Finnigan S, van Putten MJAM. EEG in ischaemic stroke: Quantitative EEG can
uniquely inform (sub-)acute prognoses and clinical management. Clin
Neurophysiol. 2013;124:10-9.
Foreman B, Claassen J. Quantitative EEG for the detection of brain ischemia.
Critical Care 2012;16:216-25.
Gaspard N, Manganas L, Rampal N, Petroff OAC, Hirsch LJ. Similarity of lateralized
rhythmic delta activity to periodic lateralized epileptiform discharges in critically ill
patients. JAMA Neurol. 2013;70:1288-1295.
Hirsch LJ, LaRoche SM, Gaspard N, Gerard E, Svoronos A, Herman ST, et al.
American Clinical Neurophysiology Society’s Standardized Critical Care EEG
Terminology: 2012 version. J Clin Neurophysiol 2013;30:1–27.
Howell DC. Fundamental statistics for the behavioral sciences. 8th ed. Belmont,
Calif.: Wadsworth, Cengage Learning; 2014.

Defining slow EEG abnormality in acute ischaemic stroke
22
Jordan KG. Emergency EEG and continuous EEG monitoring in acute ischemic
stroke. J Clin Neurophysiol. 2004;21:341-352.
Leon-Carrion J, Martin-Rodriguez JF, Damas-Lopez J, Barroso y Martin JM,
Dominguez-Morales MR. Delta-alpha ratio correlates with level of recovery after
neurorehabilitation in patients with acquired brain injury. Clin Neurophysiol
2009;120:1039-1045.
Lodder SS, van Putten MJAM. Quantification of the adult EEG background pattern.
Clin Neurophysiol 2013;124:228-37.
Nuwer MR. EEG in the emergency department: Speeding the patients toward the
right treatment plans. Clin Neurophysiol 2012;123:855.
Nuwer MR, Jordan SE, Ahn SS. Evaluation of stroke using EEG frequency analysis
and topographic mapping. Neurology 1987;37:1153-1159.
Sainio K, Stenberg D, Keskimäki I, Muuronen A, Kaste M. Visual and spectral EEG
analysis in the evaluation of the outcome in patients with ischemic brain infarction.
Electroencephalogr Clin Neurophysiol 1983;56:117-124.
Schleiger E, Sheikh N, Rowland T, Wong A, Read S, Finnigan S. Frontal EEG
delta/alpha ratio and screening for post-stroke cognitive deficits: the power of four
electrodes. Int J Psychophysiol. 2014;94:19-24.
Sheikh N, Wong A, Read S, Coulthard A, Finnigan S. QEEG may uniquely inform
and expedite decisions regarding intra-arterial clot retrieval in acute stroke. Clin
Neurophysiol 2013;124:1913-4.
Sheorajpanday RV, Nagels G, Weeren AJ, van Putten MJ, De Deyn PP. Quantitative
EEG in ischemic stroke: Correlation with functional status after 6 months. Clin
Neurophysiol 2011 a;122:874-883.

Defining slow EEG abnormality in acute ischaemic stroke
23
Sheorajpanday RV, Nagels G, Weeren AJ, De Deyn PP. Quantitative EEG in
ischemic stroke: Correlation with infarct volume and functional status in posterior
circulation and lacunar syndromes. Clin Neurophysiol 2011 b;122:884-890.
Winblad B, Palmer K, Kivipelto M, Jelic V, Fratiglioni L, Wahlund L-O, et al. Mild
cognitive impairment – beyond controversies, towards a consensus: report of the
International Working Group on Mild Cognitive Impairment. J Int Med.
2004;256:240–246.

Defining slow EEG abnormality in acute ischaemic stroke
24
FIGURE LEGENDS
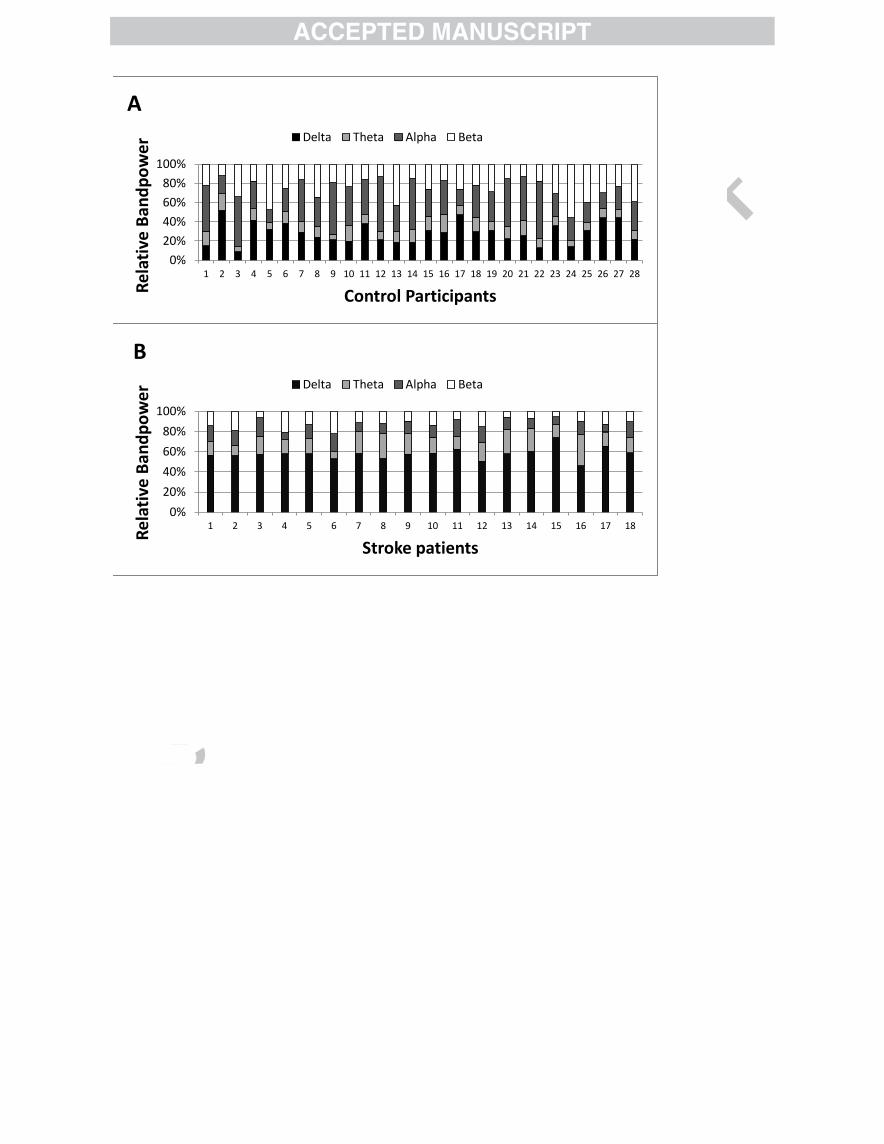
Figure 1: Bar graphs plotting relative power values for each of the four classical
frequency bands in each individual analysed. A: Control participants; B: Acute
ischaemic stroke cases; C: Mean values for each sample. The sample mean graphs
illustrate key differences particularly for delta and alpha power. Relative delta power
was significantly higher in the stroke (M = 0.58) than the control sample (M = 0.29 t =
11.63, p < 0.0001), whereas relative alpha power was significantly lower in the stroke
(M = 0.13) than the control sample (M = 0.34; t = 8.06, p < 0.0001). Such outcomes
also relate to the finding that DAR was significantly higher in the stroke (M = 6.64)
than the control sample (M = 1.34; t = 7.75, p < 0.0001).
Figure 2: DTABR and DAR values plotted for each individual in the control versus
stroke samples. There was substantial overlap of DTABR values between the
samples but no overlap for DAR. The horizontal line represents the proposed DAR
abnormality threshold value of 3.7.
Figure 3: Relative delta power and QSLOWING values plotted for each individual in the
control versus stroke samples. There was substantial overlap of QSLOWING values
between the samples, and some (lesser) overlap of relative delta values.
Figure 4: Relative power values – for theta, alpha and beta bands respectively -
plotted for each individual in the control versus stroke samples. There was
substantial overlap between the samples for each of these relative bandpower
measures.
Number Gender Age Delta Theta Alpha Beta DAR DTABR
C01 F 83 0.15 0.15 0.47 0.22 0.35 0.45
C02 F 83 0.52 0.17 0.19 0.12 3.13 2.32
C03 F 65 0.09 0.05 0.52 0.34 0.19 0.17
C04 M 74 0.42 0.12 0.29 0.18 1.88 1.30
C05 F 60 0.32 0.07 0.13 0.47 3.13 0.74
C06 F 76 0.38 0.12 0.24 0.25 1.95 1.16
C07 M 71 0.29 0.11 0.43 0.16 0.85 0.73
C08 F 78 0.24 0.11 0.30 0.34 0.86 0.60
C09 F 65 0.21 0.06 0.53 0.19 0.5 0.44
C10 M 82 0.20 0.16 0.41 0.24 0.62 0.58
C11 M 68 0.38 0.09 0.37 0.16 1.37 1.07
C12 F 84 0.21 0.09 0.56 0.13 0.46 0.49
C13 M 56 0.19 0.11 0.28 0.43 0.69 0.43
C14 M 72 0.19 0.13 0.54 0.15 0.4 0.51
C15 F 67 0.31 0.15 0.28 0.26 1.22 0.97
C16 M 76 0.29 0.19 0.35 0.17 0.98 1.03
C17 M 82 0.47 0.09 0.17 0.26 3.43 1.46
C18 M 70 0.30 0.15 0.33 0.22 1.1 0.94
C19 F 73 0.31 0.09 0.31 0.29 1.35 0.87
C20 F 64 0.22 0.13 0.49 0.15 0.55 0.62
C21 F 74 0.26 0.16 0.46 0.13 0.75 0.85
C22 F 60 0.13 0.10 0.60 0.18 0.27 0.33
C23 M 80 0.36 0.10 0.24 0.31 2.12 1.00
C24 F 66 0.14 0.06 0.24 0.55 0.61 0.26
C25 M 61 0.31 0.08 0.21 0.4 1.83 0.67
C26 F 61 0.44 0.10 0.16 0.3 3.56 1.59
C27 F 63 0.44 0.08 0.24 0.23 2.38 1.30
C28 F 57 0.22 0.09 0.30 0.39 1.05 0.54
MEAN 70.39 0.29 0.11 0.34 0.26 1.34 0.84
SD 8.59 0.11 0.04 0.13 0.11 1.01 0.47
Minimum 56 0.09 0.05 0.13 0.12 0.19 0.17
Maximum 84 0.52 0.19 0.60 0.55 3.56 2.32
zcritical 0.50 0.19 0.09 0.04 3.31 1.75
Table 1: QEEG indices for healthy older adult participants and acute ischaemic stroke cases. Relative band-power measures are shown.
DAR: Delta/Alpha Power Ratio; DTABR: (Delta+Theta)/(Alpha+Beta) Power Ratio; C: Control Participant; SD: Standard Deviation
0%
20%
40%
60%
80%
100%
1 2 3 4 5 6 7 8 9 10 11 12 13 14 15 16 17 18 19 20 21 22 23 24 25 26 27 28
Re
lati
ve B
and
po
we
r
Control Participants
A
Delta Theta Alpha Beta
0%
20%
40%
60%
80%
100%
1 2 3 4 5 6 7 8 9 10 11 12 13 14 15 16 17 18
Re
lati
ve B
and
po
we
r
Stroke patients
B Delta Theta Alpha Beta

0
2
4
6
8
10
12
14 (D
elta+
Theta
)/(A
lpha+
Beta
) R
atio;
Delta/A
lpha R
atio
Control-DTABR Stroke-DTABR Control-DAR Stroke-DAR

0
0.1
0.2
0.3
0.4
0.5
0.6
0.7
0.8
0.9
Re
lative
de
lta
po
we
r; Q
slo
win
g in
de
x
Control-Delta Stroke-Delta Control-Qslow Stroke-Qslow

0
0.1
0.2
0.3
0.4
0.5
0.6
Re
lative
Ba
nd
po
we
r Control-Theta Stroke-Theta Control-Alpha Stroke-Alpha Control-Beta Stroke-Beta

Study EEG time Principal EEG/QEEG indices of prognostic value Associated outcome assessment & time-point
Sainio et al (1983) < 48 h Delta power, alpha power Neurological examination; Discharge
Claassen et al (2004) 1- 6 days^ DAR* Delayed cerebral ischaemia; 14 days^
Finnigan et al (2004) < 18 h Delta power change over time* NIHSS; 30 days
Finnigan et al (2006) 0.5 h#
Delta power change over time* Efficacy of reperfusion therapy; discharge & 90 days
Finnigan et al (2007) 46-52 h DAR*; relative alpha*; DTABR (ns) NIHSS; 30 days
Finnigan et al (2008) < 25 h Delta power (contralateral hemisphere)* Death; 2 - 10 days
Leon-Carrion et al (2009) < 1 wk DAR*; DTABR (ns); pdBSI (ns) Functional Independence Measure +
Functional Assessment Measure; 6 mths
Sheorajpanday et al < 72 h† DTABR* Modified Rankin scale; dependency, mortality; 6 mths
(2011a) pdBSI* Modified Rankin scale; disability; 6 mths
Sheorajpanday et al < 72 h† DTABR* Modified Rankin scale; 7 days
(2011b) pdBSI* Radiologically-confirmed stroke; < 96 h
Sheikh et al (2013) 2.5 h#
DAR change over time* Efficacy of reperfusion therapy; discharge & 90 days
Schleiger et al (2014) 62-101 h DAR*; relative alpha*; pdBSI (ns) Functional Independence Measure +
Functional Assessment Measure; 70-209 days
Table 1: Summary of key detials and results from past studies reporting analyses of respective QEEG indices in stroke patient samples.
* Statistically significant; (ns): non-significant
^Post-subarachnoid haemorrhage
† 96 of 110 of patients had EEG in < 72 h; the remainder in < 7 days

Age Delta Theta Alpha Beta DAR DTABR QSLOWING
Control
Mean 70.4 0.29 0.11 0.34 0.26 1.34 0.84 0.36
SD 8.60 0.11 0.04 0.13 0.11 1.01 0.47 0.11
zcritical 0.50 0.19 0.09 0.04 3.31 1.75 0.57
Stroke
Mean 69.3 0.58 0.17 0.13 0.12 6.64 4.25 0.66
SD 9.9 0.06 0.06 0.04 0.05 2.78 1.77 0.09
t 0.37 11.63 3.92 -8.06 -5.66 7.75 8.01 9.98
p 0.71 < 0.0001 < 0.001 < 0.0001 < 0.0001 < 0.0001 < 0.0001 < 0.0001
Table 2: Descriptive statistics of the control and stroke samples, and the outcomes of comparisons between these.
QEEG relative band-power, and power ratio, indcies, and statistical (t and probability [p ]) values are shown.
DAR: Delta/Alpha Power Ratio; DTABR: (Delta+Theta)/(Alpha+Beta) Power Ratio; SD: Standard Deviation

Index Threshold AUC Sensitivity Specificity
Delta 0.49 0.994 0.944 0.964
Theta 0.12 0.812 0.889 0.679
Alpha 0.17 0.972 0.889 0.929
Beta 0.16 0.901 0.833 0.821
DAR 3.70 1.000 1.000 1.000
DTABR 1.76 0.996 1.000 0.964
Qslowing 0.54 0.968 0.944 0.964
Table 3: Outcomes of ROC analyses for repsective QEEG indices and their optimised thresholds.
DAR: Delta/Alpha Power Ratio; DTABR: (Delta+Theta)/(Alpha+Beta) Power Ratio; AUC: Area Under Curve.


![Big Data Resources for EEGs: Enabling Deep Learning Research 1 · 2017. 12. 12. · Abnormal EEG Corpus [3] . It contains both normal and abnormal EEGs, with no patients overlapping](https://static.fdocuments.in/doc/165x107/61199806132e7f0dc63b51e3/big-data-resources-for-eegs-enabling-deep-learning-research-1-2017-12-12-abnormal.jpg)