Defining a World-Class Community · Landon Yoder • Akash Gupta • Seiya Kato . May 5, 2014 ....
30
May 5, 2014 Landon Yoder • Akash Gupta • Seiya Kato Defining a World-Class Community
Transcript of Defining a World-Class Community · Landon Yoder • Akash Gupta • Seiya Kato . May 5, 2014 ....

May 5, 2014 Landon Yoder • Akash Gupta • Seiya Kato
Defining a World-Class Community

Table of Contents
2
Team
Project Overview
Approach
Definition
Approach to Prioritization
Attributes and Metrics
Comparable Cities
Next Steps
Appendix
Approach Definition Attributes Metrics
Next Steps

Team
3
Seiya Kato Tokyo, Japan
Landon Yoder Harrisonburg, Virginia
Akash Gupta New Delhi, India
Approach Definition Attributes Metrics
Next Steps

Project Overview
4
City of Scottsdale had a lengthy, complex mission statement
“The effective mission statement is short and sharply focused. It should fit on a T-shirt.“ – Peter Drucker
“Simply better service for a world-class community” (Dec. 2013)
Context
Objectives Formalize definition and attributes of world-class community
Evaluate each attribute for fit with Scottsdale
Develop possible citywide, customer-focused key performance indicators
Approach Definition Attributes Metrics
Next Steps

Approach
5
Recommendations
Identify key customers Research expert sources
Stages
Late February – mid March Timeline
Definition, Attributes and Metrics Discovery and Analysis
Compile and filter attributes Develop definition of the
world-class community which fits Scottsdale
Choose metrics for each attribute
Compile comparable cities
Mid March – mid April
Customer Map “Expert Sources”
Definition: “world-class community”
Attributes from expert sources Metrics for each attribute Preliminary list comparable
cities
Activity
Mid April – early May
Prioritize attributes Examine actionability of
recommended metrics Refine the list of comparable
cities for benchmarking studies
Deliverable Prioritized attributes Source for each metric Availability of each metric List of comparable cities Final Presentation
Monday, May 5th at 3:00 pm
Approach Definition Attributes Metrics
Next Steps

Scottsdale
City of Scottsdale Customer Map
Customer Map
A customer is an actual or potential user of your
organization’s products, programs, or services.
Definition
• Permanent residents • Visitors • Business activities
Priority
6
– Baldrige Performance Excellence Program
Approach Definition Attributes Metrics
Next Steps

“Expert” sources
Subjective Scientific
7
Approach Definition Attributes Metrics
Next Steps
Attributes from Expert Sources
Natural Assets
Cultural Assets
Specific Amenities
People
Technology/ Innovation
Economics
Public Services
Environment/ Sustainability
Other
• Climate / Weather • Green Space • Outdoor Access • Body of Water
• Churches • Architecture • “Third Place” • Outdoor Public Art • Historical
Monuments/Sights • Museums/Galleries • Venues
• Air and Water Quality • Peace and Quiet
• Cost of Living • Employment • Economic Growth • Wage Growth • Corporate Tax • Personal Tax
• Healthcare • Public
Transportation • Stability • K-12 Education • Pedestrian
Friendliness • Urban Design • Public
Restrooms
• Concentration • Social Capital • Beauty at Night • Seasonal Appeal • Manageable Size • Sufficient Diversity
• Talent (Education) • Creativity/Bohemia • Tolerance / Openness • Professional /
Amateur Sports • Cultural Events
• Hotel Options • Restaurants / Cafes
/ Bars • Classical Music
• Social Diversity • Attractiveness • Good Drivers • Nightlife • Street
Performers
• Tech Leadership
• Safety / Crime • Cleanliness
(Garbage, Street)
• Wireless Availability / Coverage
• Free Attractions • Proactive Policy
Development
Category
Attribute
Legend
World-Class Community
Quality of Life Quality of Place
Livability
Referred more than 7 times Referred 4 to 6 times
• Characteristic Souvenirs
• Shopping Options
8
Approach Definition Attributes Metrics
Next Steps
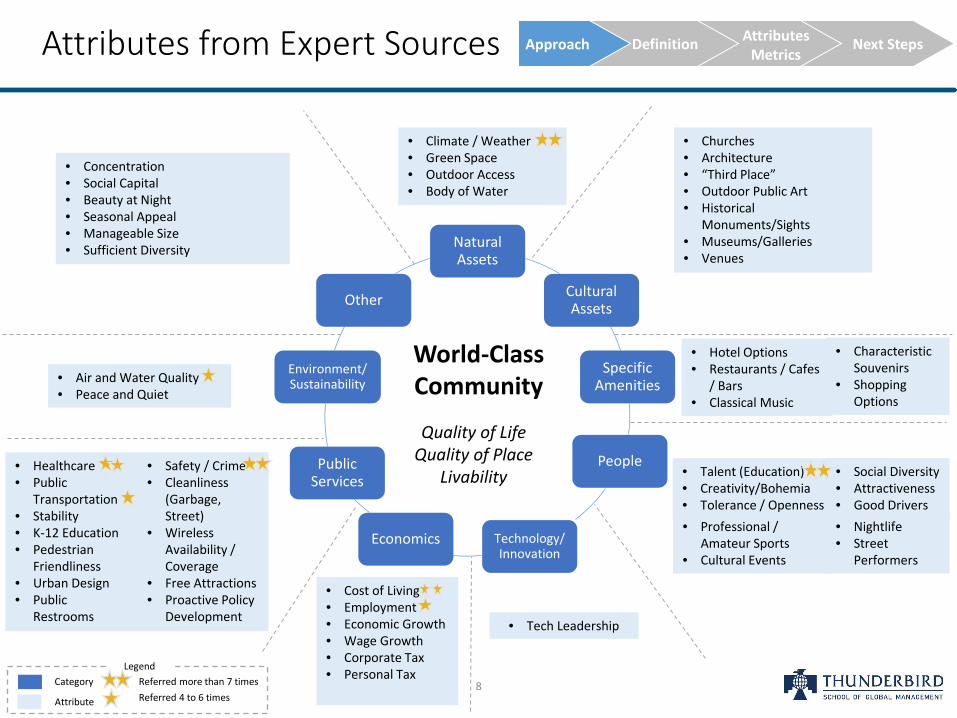
From Attributes to Definition
World-Class Community
• Influenceable in the short to medium-term
• Attributes whose improvement leads to improvement in other attributes
Criteria for “Fit”
Definition ≈12 Attributes
3+ metrics each
fit
Natural Assets
Cultural Assets
Specific Amenities
People
Technology/ Innovation
Public Services
Economics
Environment/ Sustainability
Other
9
Approach Definition Attributes Metrics
Next Steps

Definition
A World-Class Community
• Supports use of natural assets, today and in the future
• Stewards human and cultural assets to grow their value
• Garners recognition as a desirable place to live and visit.
1. Natural Assets 2. Ecological Quality 3. Cultural Assets 4. Human Capital 5. Lively People 6. Inclusiveness 7. Specific Amenities 8. Tech Leadership 9. Safety 10.Healthcare 11.Transport 12.Employment Options 13.Beauty at Night 14.Social Brand
Attributes
10
Approach Definition Attributes Metrics
Next Steps

Attributes
Attribute Rationale Metrics
1. Natural Assets
Natural environment is “most important to quality of life” for Scottsdale residents.
a. Trails available (miles per capita) b. Preserve areas (m2/ area) c. Golf courses (number) d. Spending on parks per capita
2. Ecological Quality
“The quality of our local living environment has a direct impact on our health and well-being....satisfaction…mental well-being…recovery from the stress.”
a. “Air Quality Index” (number of good days per year) b. Maximum air pollutant concentrations c. Drinking water quality (number of incidents per year)
3. Cultural Assets
Recreation and wellness is “most important to quality of life” for Scottsdale residents.
a. Performing arts venues (seats per capita) b. Top ranked attractions (number of such museums,
zoos/aquariums, art galleries, theaters, etc., MSA) c. Professional sports teams (number in MSA) d. Public spending on arts and culture ($ per capita)
11
Approach Definition Attributes Metrics
Next Steps

Attribute Rationale Metrics
4. Human Capital
Skilled people attract more skilled people and companies.
a. Size of workforce (number) b. Educational attainment of workforce (median) c. Educational attainment (standard deviation) d. High worker engagement (% of workforce)
5. Lively People
A population engaged in various social and recreational activities attracts members of the “creative class”
a. Spending on leisure and recreation ($ per capita) b. Participation in cultural or recreational activities (number of
times per week) c. Full-time students in higher education institutions (number) d. City library loans (number per capita) e. Resident performing groups in the city (number per capita) f. Shows per year (number) g. Volunteerism (times volunteered per 6 months)
6. Inclusive-ness
“Toleration for different opinions, creativity, and risk-taking” feeds innovative and entrepreneurial culture.
a. “Haas Inclusiveness Index” b.“Esri US Diversity Index” c. “Religious Diversity Index “ d.“Bohemian Index” e.“Gay Index” or “Municipal Equality Index”
Attributes continued
12
Approach Definition Attributes Metrics
Next Steps

Attributes continued
Attribute Rationale Metrics
7. Specific Amenities
The “creative class” chooses a location “based to a large degree on their lifestyle interests and the availability of respective amenities.”
a. Hotels, night clubs, bars, and restaurants (number per capita, variety: distribution by price and type)
b. AAA Five and Four Diamond hotels and restaurants (number) c. Michelin star restaurants (number) d. “The Globe Shopper Index” e. Tourists inflow (number)
8. Tech Leadership
Diverse R&D expertise is linked to higher rankings in other attributes.
a. Innovation (number of patents per capita) b. Economic output in high-tech sector (% of total GDP) c. Workers involved in STEM (% of workforce)
9. Safety
Safety is “most important to quality of life” for Scottsdale residents and many other communities.
a. Fire response time (minutes) b. Police response time (minutes) c. Crime rate (number per capita, % of which violent) d. Identity theft consumer complaints
13
Approach Definition Attributes Metrics
Next Steps

Attributes continued
Attribute Rationale Metrics
10. Health-care
Access to preventive health services and healthcare is “most important to quality of life” for Scottsdale residents.
a. Cost per visit for doctors, dentists, and optometrist ($ average)
b. Medical response time (minutes) c. Hospital beds (number per capita) d. Top-ranked hospitals (number)
11. Transport
Mercer’s City Infrastructure Ranking is measured based on “public transportation, traffic congestion, and airport effectiveness.”
a. Household spending on transportation ($ per year) b. Commute to/from work (average hours per day) c. Mode share (% of all travel done via car, bike,
foot, bus, taxi, etc.) d. Parking spaces (per employee, visitor) e. Utilization of [bike lanes, trails, sidewalks]
(number of users per day) f. Walk Score®
12. Employment Options
Employment options help “attract talented and ambitious people as the assets that cities need to propel innovation and enterprise, thereby spurring long-term prosperity.”
a. Frequency of data collection (number of surveys per year)
b. Unemployment rates (% of workforce) c. Incorporated entities (number) d. Gallup Payroll to Population Index e. Internship positions (number per worker) f. Worker confidence in strength of economy and
availability of jobs (perception of residents) 14
Approach Definition Attributes Metrics
Next Steps

Attributes continued
Attribute Rationale Metrics
13. Beauty at Night
A world-class city offers beauty that is greater than the sum of its parts “…when everything useful is closed, something above utility that unites all these separate features”
a. Electricity usage in commercial properties after sunset (kWh after sunset per square mile)
b. “DarknessMap” (experimental)
14. Social Brand
Leaders, citizens, and admirers of leading cities invest resources in social media and in other brand-building to influence the worlds’ perception of their cities
a. Mentions in social media (number per week) b. Mentions outside Arizona, US, North America (number
per week) c. Positivity of sentiments (proprietary score) d. Google Search Trends (percent difference versus comparable
cities)
15
Approach Definition Attributes Metrics
Next Steps
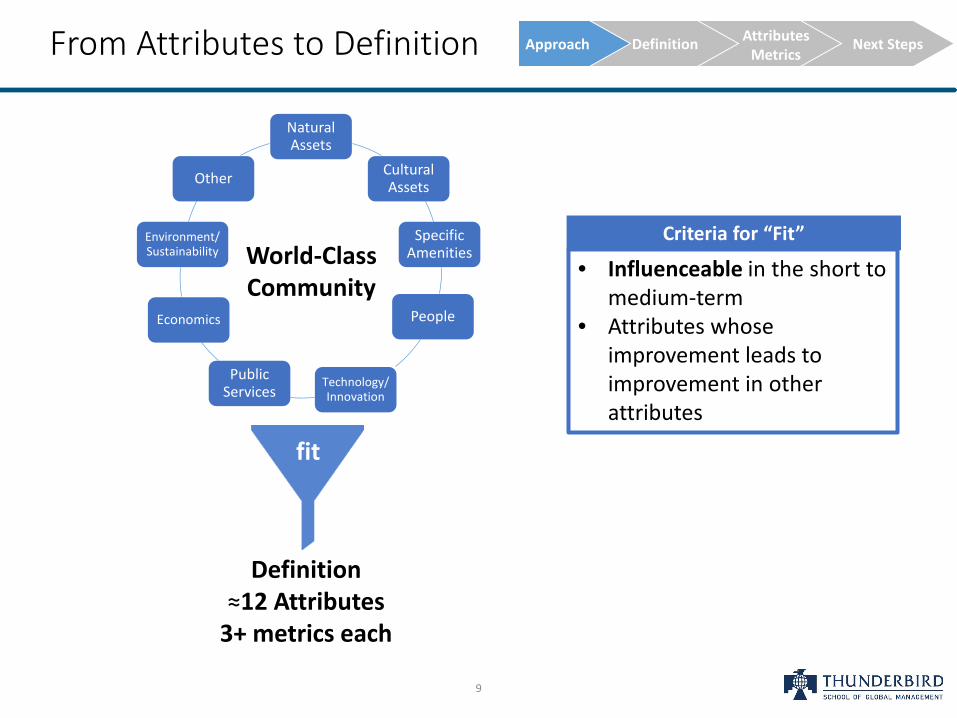
Attributes Metrics Approach to Prioritization
Alignment with Strategic Goals
Influ
ence
able
High
Low
Low High
Employment
Natural Assets
Safety
Plot of 14 Attributes
Social Brand
Ecological Quality
Cultural Assets
Human Capital
Lively People
Inclusiveness
Specific Amenities
Tech Leadership
Healthcare
Transport
Beauty at Night
Priority
Other Possible Priorities
• Time sensitivity (election cycle, competitors) • Availability of partners • Resources required (time, land, $, talent) • Urgency to customers
16
Approach Definition Next Steps
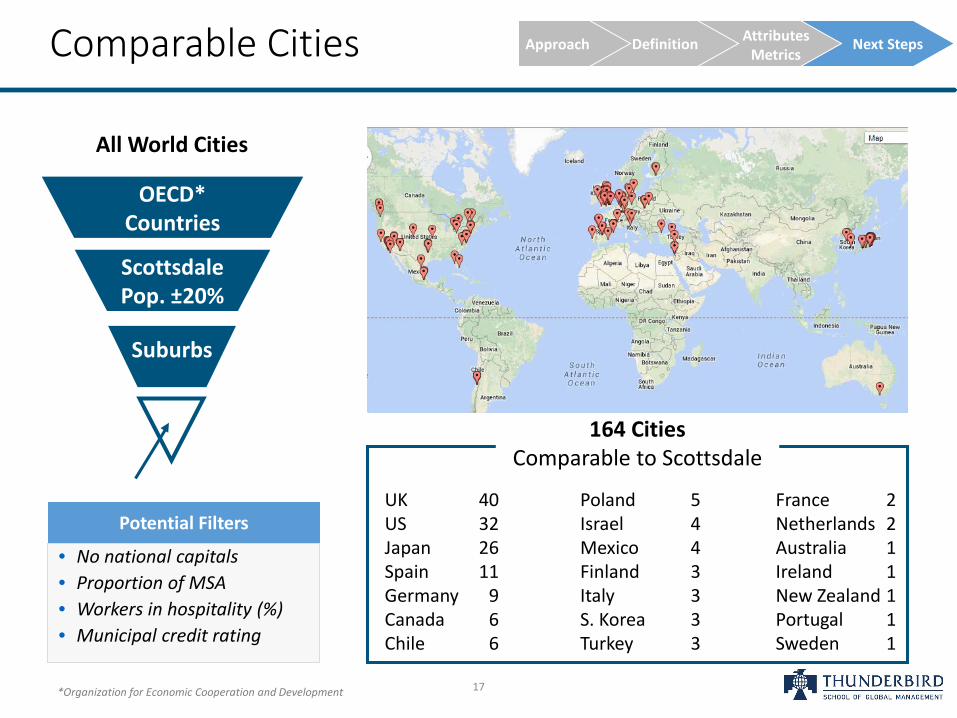
Comparable Cities
All World Cities
UK 40 US 32 Japan 26 Spain 11 Germany 9 Canada 6 Chile 6
Poland 5 Israel 4 Mexico 4 Finland 3 Italy 3 S. Korea 3 Turkey 3
France 2 Netherlands 2 Australia 1 Ireland 1 New Zealand 1 Portugal 1 Sweden 1
17
Approach Definition Attributes Metrics
Next Steps
Scottsdale Pop. ±20%
Suburbs
• No national capitals • Proportion of MSA • Workers in hospitality (%) • Municipal credit rating
Potential Filters
164 Cities Comparable to Scottsdale
*Organization for Economic Cooperation and Development
OECD* Countries

Next Steps
Survey customers to validate and prioritize attributes
Evaluate cost, data sources, process requirement for metrics
Select comparable cities and set benchmarks
18
Approach Definition Attributes Metrics
Next Steps

19
Thanks & Questions

Appendix
20
Attributes from Expert Sources
From Attributes to Definition
“Expert” sources
Bibliography
Notes and References
Contents
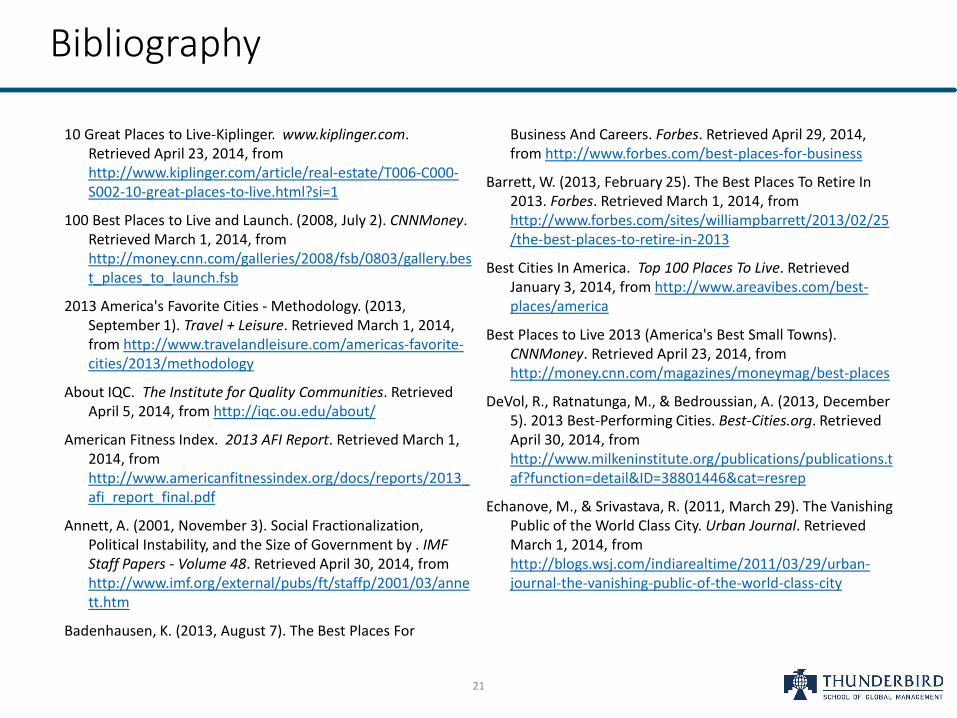
Bibliography
21
10 Great Places to Live-Kiplinger. www.kiplinger.com. Retrieved April 23, 2014, from http://www.kiplinger.com/article/real-estate/T006-C000-S002-10-great-places-to-live.html?si=1
100 Best Places to Live and Launch. (2008, July 2). CNNMoney. Retrieved March 1, 2014, from http://money.cnn.com/galleries/2008/fsb/0803/gallery.best_places_to_launch.fsb
2013 America's Favorite Cities - Methodology. (2013, September 1). Travel + Leisure. Retrieved March 1, 2014, from http://www.travelandleisure.com/americas-favorite-cities/2013/methodology
About IQC. The Institute for Quality Communities. Retrieved April 5, 2014, from http://iqc.ou.edu/about/
American Fitness Index. 2013 AFI Report. Retrieved March 1, 2014, from http://www.americanfitnessindex.org/docs/reports/2013_afi_report_final.pdf
Annett, A. (2001, November 3). Social Fractionalization, Political Instability, and the Size of Government by . IMF Staff Papers - Volume 48. Retrieved April 30, 2014, from http://www.imf.org/external/pubs/ft/staffp/2001/03/annett.htm
Badenhausen, K. (2013, August 7). The Best Places For
Business And Careers. Forbes. Retrieved April 29, 2014, from http://www.forbes.com/best-places-for-business
Barrett, W. (2013, February 25). The Best Places To Retire In 2013. Forbes. Retrieved March 1, 2014, from http://www.forbes.com/sites/williampbarrett/2013/02/25/the-best-places-to-retire-in-2013
Best Cities In America. Top 100 Places To Live. Retrieved January 3, 2014, from http://www.areavibes.com/best-places/america
Best Places to Live 2013 (America's Best Small Towns). CNNMoney. Retrieved April 23, 2014, from http://money.cnn.com/magazines/moneymag/best-places
DeVol, R., Ratnatunga, M., & Bedroussian, A. (2013, December 5). 2013 Best-Performing Cities. Best-Cities.org. Retrieved April 30, 2014, from http://www.milkeninstitute.org/publications/publications.taf?function=detail&ID=38801446&cat=resrep
Echanove, M., & Srivastava, R. (2011, March 29). The Vanishing Public of the World Class City. Urban Journal. Retrieved March 1, 2014, from http://blogs.wsj.com/indiarealtime/2011/03/29/urban-journal-the-vanishing-public-of-the-world-class-city

Bibliography
22
Fast Cities Blog. Fast Company. Retrieved April 1, 2014, from http://www.fastcompany.com/section/fast-cities
Florida, R. HRC's Municipal Equality Index. Human Rights Campaign. Retrieved April 30, 2014, from http://www.hrc.org/campaigns/municipal-equality-index
Fostering Innovation-led Clusters. Economist Intelligence Unit (EIU). Retrieved March 1, 2014, from http://www.economistinsights.com/sites/default/files/downloads/EIU-ATIC_Report2_Web_Revised.pdf
Gallup-Healthways Well-Being Index 2012. Gallup-Healthways Index 2012.. Retrieved March 1, 2014, from http://www.cdn1.hubspot.com/hub/162029/2012WBI-Composite.pdf
Gallup-Healthways Well-Being Index 2013. Gallup-Healthways. Retrieved April 23, 2014, from http://info.healthways.com/wbi2013
Garoogian, D. (2010). America's top-rated smaller cities a statistical handbook (8th ed.). Millerton, N.Y.: Grey House Pub.
Garoogian, D. (2011). America's top-rated cities: a statistical handbook (18th (2011) ed.). Amenia, NY: Grey House Pub.
Handbook for Measuring Cultural Participation. UNESCO. Retrieved April 1, 2014, from http://www.uis.unesco.org/culture/Documents/fcs-handbook-2-cultural-participation-en.pdf
Hot Spots 2012. National Insurance Crime Bureau. Retrieved March 1, 2014, from https://www.nicb.org/newsroom/nicb_campaigns/hot_spots
Konrad, A. (2012, September 28). America's 50 Best Cities. Businessweek. Retrieved April 23, 2014, from http://images.businessweek.com/slideshows/2012-09-26/americas-50-best-cities
Sabbadini, L. L., & Manninen, A. Cultural Statistics Framework and Measures of the Cultural Liveliness of Cities. www.stat.fi. Retrieved April 1, 2014, from http://www.stat.fi/isi99/proceedings/arkisto/varasto/sabb0824.pdf
Moonen, T., & Clark, G. (2013, November 1). Business of Cities 2013. Jones Lang & LaSalle. Retrieved March 18, 2014, from http://www.jll.com/Research/jll-city-indices-november-2013.pdf

Bibliography
23
Most Romantic Cities for Baby Boomers. Sperling's Best Places. Retrieved April 1, 2014, from http://www.bestplaces.net/docs/studies/romanticboomers.aspx
Okulicz-Kozaryn, A. (2011, September 30). City Life: Rankings (Livability) vs Perceptions (Satisfaction). (personal website). Retrieved March 1, 2014, from http://people.hmdc.harvard.edu/~akozaryn/myweb/docs/eurostat_cities.pdf
Quality of Living City Rankings. Mercer. Retrieved April 23, 2014, from http://www.mercer.com/qualityofliving
Raghavan, D. (2013, October 1). Most Diverse Cities in America. NerdWallet Blog. Retrieved March 1, 2014, from http://www.nerdwallet.com/blog/cities/lifestyle/most-diverse-cities-in-america/
RelocateAmerica.com Announces America's Top 100 Places to Live for 2010. (2010, April 20). PR Newswire. Retrieved April 30, 2014, from http://www.prnewswire.com/news-releases/relocateamericacom-announces-americas-top-100-places-to-live-for-2010-91603639.html
Robinson, M., & Buccigrossi, J. World-Class Communities. Workforce Diversity Network. Retrieved March 1, 2014, from http://www.workforcediversitynetwork.com/docs/Article_world_class.pdf
STAR Communities. The Rating System (Version 1.0). Retrieved April 23, 2014, from https://www.starcommunities.org/rating-system
Savitch, H. (2010, November 8). What Makes A City Great? An American Perspective. Planetizen: The Urban Planning, Design, and Development Network. Retrieved April 30, 2014, from http://www.planetizen.com/node/46776
Social Media Intelligence: Social Media Monitoring vs. Social Media Research. MotiveQuest.com. Retrieved April 1, 2014, from http://motivequest.com/wp-content/uploads/2013/03/Social-Media-Monitoring-Vs.-Research2.pdf
Sperling, B., & Sander, P. J. (2007). Cities ranked & rated: more than 400 metropolitan areas evaluated in the U.S. & Canada (2nd ed.). Hoboken, N.J.: Wiley.
Sternberg, Ph.D., D. A. Lumosity’s Smartest Cities 2013. Lumosity, Inc. Retrieved March 1, 2014, from http://asset1.lumosity.com/smartest-cities-2013/SmartestCities2013.pdf
Economist. Best Cities Ranking and Report. Economist Intelligence Unit (EIU). Retrieved March 1, 2014, from http://pages.eiu.com/rs/eiu2/images/EIU_BestCities.pdf

Bibliography
24
Quality of Life 2013: Top 25 Livable Cities. Monocle. Retrieved April 15, 2014, from http://monocle.com/search/top-25-cities
Trip, J. J. (2007). Assessing Quality Of Place: A Comparative Analysis Of Amsterdam And Rotterdam. Journal of Urban Affairs, 29(5), 501-517.
Varadarajan, T. (2009, September 3). What Makes A City World-Class?. Forbes. Retrieved April 23, 2014, from http://www.forbes.com/2009/09/02/new-york-paris-mumbai-rome-berlin-opinions-21-century-cities-09-world-class-cities.html
World Cities Culture Report 2013. World Cities Culture Forum. Retrieved April 1, 2014, from www.worldcitiescultureforum.com
Winden, W. v. Creating Liveliness and Diversity in Science Locations?. URBACT. Retrieved March 1, 2014, from http://urbact.eu/fileadmin/Projects/REDIS/outputs_media/Thematic_paper_1.pdf

References
Attribute Metrics References
1. Natural Assets
a. Trails available (miles per capita) b. Preserve areas (m2/ area) c. Golf courses (number) d. Spending on parks per capita
a. City records b. City records c. Data from “ArizonaGolf.com” (Link) d. City records
2. Ecological Quality
a. “Air Quality Index” (number of good days per year)
b. Maximum air pollutant concentrations
c. Drinking water quality (contaminant level)
a. Air Data Report (2010), US Environmental Protection Agency (Link) b. CBSA Air Quality Statistics by City (2012), US Environmental Protection Agency
(Link) c. Water Quality Report (2013), Scottsdale’s Water Quality Office (Link)
3. Cultural Assets
a. Performing arts venues (seats per capita)
b. Top ranked attractions (number of such museums, zoos/aquariums, art galleries, theaters, etc., MSA)
c. Professional sports teams (number in MSA)
d. Public spending on arts and culture ($ per capita)
a. City records (stadiums, arenas, auditoriums and convention centers) b. List of Accredited Zoos and Aquariums, Association of Zoos and Aquariums (Link)
Exhibition & Museum Attendance Survey (2012), The Art Newspaper (Link) c. Phoenix-Scottsdale Arizona Area Guide (Link) d. City records
25

Attribute Metrics References
4. Human Capital
a. Size of workforce (number) b. Educational attainment of
workforce (median) c. Educational attainment (standard
deviation) d. High worker engagement (% of
workforce)
a. Bureau of Labor Statistics: sum of employed and unemployed persons (Link) b. Bureau of Labor Statistics (Link) c. Bureau of Labor Statistics (Link) d. Global Workforce Study, Towers Watson (Link), 2012 study results (Link)
Employee Engagement, Gallup® (Link), 2013 study results (Link)
5. Lively People
a. Spending on leisure and recreation ($ per capita)
b. Participation in cultural or recreational activities (number of times per week)
c. Full-time students in higher education institutions (number)
d. City library loans (number per capita)
e. Resident performing groups in the city (number per capita)
f. Shows per year (number) g. Volunteerism (times volunteered
per 6 months)
a. Cultural Statistics Framework & Measures of Cultural Liveliness of Cities,
Tilastokeskus Statistics Finland (Link) b. Measuring Cultural Participation (2009), UNESCO Institute for Statistics (Link);
Citizen Surveys c. Educational institutions and city records and statistics d. City library records e. Local performing arts centers records f. Ticketmaster® (Link) g. Measuring Cultural Participation (2009), UNESCO Institute for Statistics (Link):
Citizen Surveys
6. Inclusive-ness
a. “Haas Inclusiveness Index” b. “Esri US Diversity Index” c. “Religious Diversity Index “ d. “Bohemian Index” e. “Gay Index”
a. The Haas Institute Inclusiveness Index (2013), University of California at Berkeley (Link)
b. Esri US Diversity Index (2013), Esri (Link) c. Global Religious Diversity – using Herfindahl–Hirschman Index (2014), Pew
Research Religion & Public Life Project (Link) d. Bohemian Index (2010), Richard Florida – The Atlantic (Link) e. The Geography of Tolerance (2012), Richard Florida – The Atlantic Cities (Link)
References continued
26

References continued
Attribute Metrics References
7. Specific Amenities
a. Hotels, night clubs, bars, and restaurants (number per capita, variety: distribution by price and type)
b. AAA Five and Four Diamond hotels and restaurants (number)
c. Michelin star restaurants (number)
d. “The Globe Shopper Index” e. Tourists inflow (number)
a. City records; Hotels – Expedia.com®; Booking.com; Kayak.com Restaurants, Bars, Night Clubs – Yelp®; Fodor’s Travel; Lonely Planet™
b. AAA News Room (Link) c. Michelin Selections, Michelin Travel & Lifestyle (Link) d. The Globe Shopper Index, The Economist Intelligence Unit (Link)
8. Tech Leadership
a. Innovation (number of patents per capita)
b. Economic output in high-tech sector (% of total GDP)
c. Workers involved in STEM (% of workforce)
a. US Patent and Trade Office: Patent Applications (Link) Tips on how to search USTPO (Link) OECD Statistics (Link) World Intellectual Property Indicators (Link) World Bank patent apps. by country (Link)
b. City records Bureau of Economic Analysis in the US Dept. of Commerce (Link)
c. Custom study Occupational Employment Statistics by the Bureau of Labor Statistics (Link)
9. Safety
a. Fire response time (minutes) b. Police response time (minutes) c. Crime rate (number per capita, %
of which violent) d. Identity theft consumer
complaints
a. City records b. City records c. Data from “City-data.com” (Link); City records d. Consumer Sentinel Network Data (2014), Federal Trade Commission (Link)
Refer to page 17
27
References continued
Attribute Metrics References
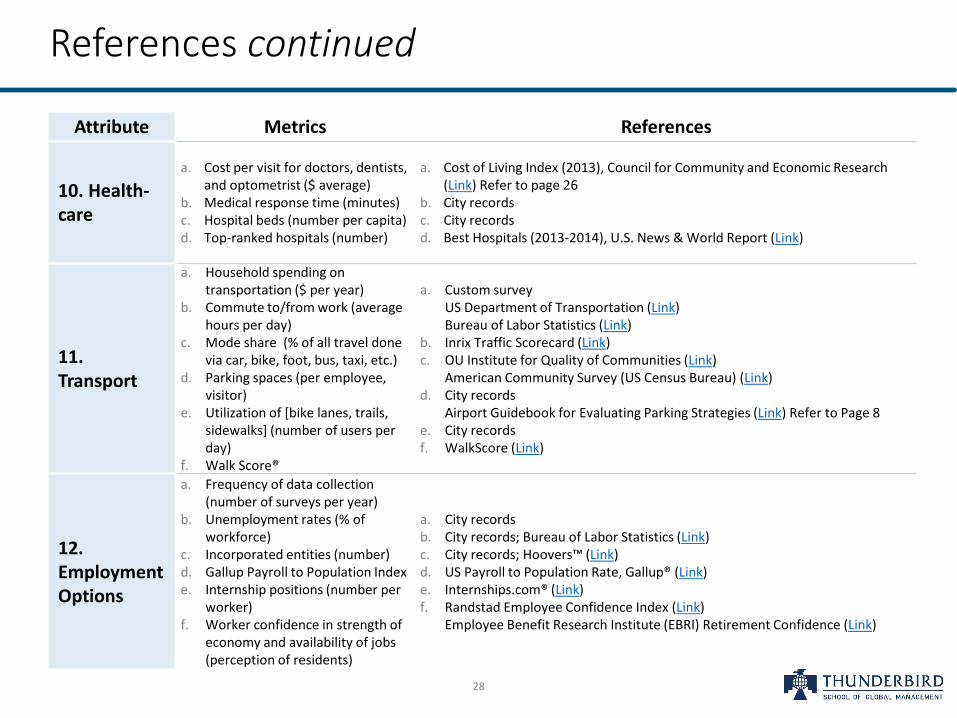
10. Health-care
a. Cost per visit for doctors, dentists, and optometrist ($ average)
b. Medical response time (minutes) c. Hospital beds (number per capita) d. Top-ranked hospitals (number)
a. Cost of Living Index (2013), Council for Community and Economic Research (Link) Refer to page 26
b. City records c. City records d. Best Hospitals (2013-2014), U.S. News & World Report (Link)
11. Transport
a. Household spending on transportation ($ per year)
b. Commute to/from work (average hours per day)
c. Mode share (% of all travel done via car, bike, foot, bus, taxi, etc.)
d. Parking spaces (per employee, visitor)
e. Utilization of [bike lanes, trails, sidewalks] (number of users per day)
f. Walk Score®
a. Custom survey US Department of Transportation (Link) Bureau of Labor Statistics (Link)
b. Inrix Traffic Scorecard (Link) c. OU Institute for Quality of Communities (Link)
American Community Survey (US Census Bureau) (Link) d. City records
Airport Guidebook for Evaluating Parking Strategies (Link) Refer to Page 8 e. City records f. WalkScore (Link)
12. Employment Options
a. Frequency of data collection (number of surveys per year)
b. Unemployment rates (% of workforce)
c. Incorporated entities (number) d. Gallup Payroll to Population Index e. Internship positions (number per
worker) f. Worker confidence in strength of
economy and availability of jobs (perception of residents)
a. City records b. City records; Bureau of Labor Statistics (Link) c. City records; Hoovers™ (Link) d. US Payroll to Population Rate, Gallup® (Link) e. Internships.com® (Link) f. Randstad Employee Confidence Index (Link)
Employee Benefit Research Institute (EBRI) Retirement Confidence (Link)
28

References continued
Attribute Metrics References
13. Beauty at Night
a. Electricity usage in commercial properties after sunset (kWh after sunset per square mile)
b. “DarknessMap” (experimental)
a. Electric utility records Original survey
b. DarknessMap (Link)
14. Social Brand
a. Mentions in social media (number per week)
b. Mentions outside Arizona, US, North America (number per week)
c. Positivity of sentiments (proprietary score)
d. Google Search Trends (percent difference versus comparable cities)
a. Available from numerous sources both for free and at cost: Socialmention.com – free (Link) HootSuite.com – fremium (Link) ViralHeat – $50-500 per month (Link)
b. Same as above c. Same as above d. Google trends site (Link)
29
Contact
30
Faculty Sponsor
Michael Finney, Ph.D. Email Professional Bio
Consulting Team
Landon Yoder Email LinkedIn Seiya Kato Email LinkedIn Akash Gupta Email LinkedIn

![[mangá] Saint seiya the lost canvas gaiden 13 - Shion](https://static.fdocuments.in/doc/165x107/579057df1a28ab900c9f0a69/manga-saint-seiya-the-lost-canvas-gaiden-13-shion.jpg)