Defense Threat Reduction Agency John J. Kingman. Road ... Defense Threat Reduction Agency 8725 John...
46
I . I Defense Threat Reduction Agency 8725 John J. Kingman.Road, MS 6201 Fort Belvoir, VA 22060-6201 Frequency Dependence of Q in the Crust and Upper Mantle of China and Surrounding Regions from Computations of Lg Q and the Attenuation of High-Frequency P- Waves Approved for public release; distribution is unlimited. May 2006 DTRAO 1 -00-C-02 13 B. J. Mitchell, et al. DARE Tracking # 73777 Prepared by: Saint Louis University Department of Earth and Atmospheric Sciences 3507 Laclede Avenue St. Louis, MO 63 103
Transcript of Defense Threat Reduction Agency John J. Kingman. Road ... Defense Threat Reduction Agency 8725 John...

I . I
Defense Threat Reduction Agency 8725 John J. Kingman. Road, MS 6201
Fort Belvoir, VA 22060-6201
Frequency Dependence of Q in the Crust and Upper Mantle of China and Surrounding Regions from Computations of Lg Q and the Attenuation of High-Frequency P- Waves
Approved for public release; distribution is unlimited.
May 2006
DTRAO 1 -00-C-02 13
B. J. Mitchell, et al. DARE Tracking # 73777
Prepared by: Saint Louis University Department of Earth and Atmospheric Sciences 3507 Laclede Avenue St. Louis, MO 63 103

DESTRUCTION NOTICE i
FOR CLASSIFIED documents, follbw the procedures in DoD 5550.22-MI National Industrial Security Program Operating Manual, Chapter 5, Section 7 (NISPOM) or DoD 5200.1-R, Information Security Program Regulation, Chapter 1X.
FOR UNCLASSIFIED limited~documents, destroyed by any method that will prevent disclosure of contents or reconstruction of the document.
Retention of this document by DoD contractors is authorized in accordance with DoD 5220.22MI lndustrial Security manual.
PLEASE NOTIFY THE DEFENSE THREAT REDUCTION AGENCY, AlTN: IMMI, 8725 JOHN J. KINGMAN ROAD, MS-6201, FT. BELVOIR, VA 22060-6201. IF YOUR ADDRESS IS INCORRECT, IF YOU WISH IT DELETED FROM THE DISTRIBUTION LIST, OR IF THE ADDRESSEE IS NO LONGER EMPLOYED BY YOUR ORGANIZATION.

DISTRIBUTION LIST UPDATE
This mailer is provided to enable DTRA to maintain current distribution lists for reports. W e would appreciate you providinq the requested information.]
o Add the individual listed to your distribution list.
o Delete the cited organizationlindividual.
a -*'Change of address.
Note: Please return the mailing label from the document so that any additions, changes, corrections or deletions can be made easily. For distribution cancellation or more information call DTWBDLMI (703) 767-4725. -
NAME:
ORGANIZATION:
OLD ADDRESS NEW ADDRESS
DTRA PUBLICATION NUMBERlTlTLE CHANGESIDELETIONSIADDITONS, etc. (Attach Sheet if more Space is Required)
DTRA or other GOVERNMENT CONTRACT NUMBER:
CERTIFICATION of NEED-TO-KNOW BY GOVERNMENT SPONSOR (if other than DTRA):
SPONSORING ORGANIZATION:
CONTRACTING OFFICER or REPRESENTATIVE:
SIGNATURE:

DEFENSE THREAT REDUCTION AGENCY ATTN. BDLMl 8725 John J Kingman Road, MS 6201 Fort Belvo~r, VA 22060-6201
DEFENSE THREAT REDUCTION AGENCY A lTN : BDLMl 8725 John J Kingman Road, MS 6201 Fort Belvoir, VA 22060-6201

Form Approved REPORT DOCUMENTATION PAGE OMB NO. 0704-0188
Publ~c reporting burden for thls collection of lnformatlon 1s esl~mated to average 1 hour per response, lnclud~ng the time for reviewing lnstructlons, searching exlstlng data sources, gathering and malntalnlng the data needed, and completing and revlewlng thls collect~on of informat~on Send comments regarding th~s burden est~mate or any other aspect of thls collection of lnformatlon lnclud~ng suggeStl0nS for reduclng this burden to Department of Defense. Washington Headquarters Services, D~rectorate for lnformat~on Operat~ons and Reports (0704-0188) 1215 Jefferson Dav~s H~ghway. Suite 1204 Arl~ngton VA 22202- 4302 Respondents should be aware that notw~thstand~ng any other provlslon of law, no person shall be subject to any penalty for falling to comply wlth a collect~on of lnformatlon lf lt does not d~splay a currently val~d OM0 control number PLEASE DO NOT RETURN YOUR FORM TO THE ABOVE ADDRESS.
1. REPORT DATE (DD-MM-YYY) 2. REPORT TYPE 3. DATES COVERED (From - To) May 2006 Technical Report
4. TITLE AND SUBTITL 5a. CONTRACT NUMBER Frequency Dependence of Q in the Crust and Upper Mantle of China DTRA 01 -00-C-0213
and Surrounding Regions from Computations of Lg Q and the 5b. GRANT NUMBER
Attenuation of High-Frequency P-Waves (U) 5c. PROGRAM ELEMENT NUMBER 139E 5d. PROJECT NUMBER ST 5e. TASK NUMBER XX 5f. WORK UNIT NUMBER DH02620
7. PERFORMING ORGANIZATION NAME(S) AND ADDRESS(ES) 8. PERFORMING ORGANIZATION REPORT NUMBER
Saint Louis University
10. SPONSORIMONITOR'S ACRONYM(S) DTRA
Fort Belvo~r, VA 22060-6201 11. SPONSORIMONITOR'S REPORT NOS.
TR-03-31
13: SUPPLEMENTARY NOTES This work was sponsored by the Defense Threat Reduction Agency under the RDT&E RMC Code B 139D R D500 ST XX 02620 25904D
14. ABSTRACT Startlng wlth fundamental-mode Rayle~gh-wave attenuat~on coeffic~ent values predicted by prev~ously determined frequency-~ndependent model of shear- wave Q we have obtalned frequency-dependent Q models that explaln both the measured values of yr as well as of Lg coda Q and ~ t s frequency dependence at 1 Hz (Q and n respectively) for Chlna and some adjacent reglons The process combines tr~al-and-error selection of a model for the depth dlstribut~on of the frequency parameter forQ with a formal lnverslon for the depth d~s t r~but~on of Q at 1 Hz. Fifteen of the derlved models have depth dlstrlbut~ons that are constant, or nearly constant, between the surface and a depth of 30 krn D~s t r~but~ons that vary w ~ t h depth are necessary to expla~n the remalnlng seven models. Values for the depth-~ndependent models vary between 0 4 and 0.7 everywhere except In the western portlon of the T~betan Plateau where they range between 0 1 and 0 3 for three paths: These low values Ile in a reglon where Q%and crustal Q are very low and suggest that they should also be low for high-frequenky propagat~on. The models In whlch C varles with depth all show a decrease In that value ranglng between 0 6 and 0 8 In the upper 15 km of the crust and (wlth one except~onwhere C = 0.0) between 0.3 and 0.55 In the depth range 15 - 30 krn The d~strlbutlon of h~ghest C values (0 G to 0.8) In the upper crust ~nd~cates that high-frequency waves will propagate.most efficiently, relatlve to low-frequency waves, In a band that Includes, and strlkes north-northeastward from, the path between event 212197 and KMI to the path between event 180195 and stat~on HIA In the north
15. SUBJECT TERMS
16. SECURITY CLASSIFICATION OF: 17. LIMITATION 18. NUMBER 19a. NAME OF RESPONSIBLE PERSON OF ABSTRACT OF PAGES
b. ABSTRACT C. THIS PAGE 19b. TELEPHONE NUMBER (fnclude area
Unclassified Unclassified SAR 42 code)
Standard Form 298 (Rev. 8-98) Prescr~bed by ANSI Std. 239.18

CONVERSION TABLE Conversion Factors for U.S. Customary to metric (SI) units of measurement.
MULTIPLY .BY . TO GET TO GET 4 BY 4 D I V I D E
*The bacquerel (Bq) is the SI unit of radioactivity; 1 Bq = 1 event/s. **The Gray (GY) is the SI unit of absorbed radiation.
meters (m) kilo pascal (kPa) kilo pascal (kPa) meter2 (m2) joule (J) joule (J) mega joule/m2 (MJ/~') *giga bacquerel (GBq) radian (rad) degree kelvin (K) joule (J) joule (J) watt ( W ) meter (m) joule (J) meter3 (m3) meter (m) joule (J)
Gray (Gy) tera joules newton (N) kilo pascal (kPa) newton-second/m2 (~-s/m') meter (m) meter (m) meter (m) kilogram (kg) newton (N) newton-meter (N-m) newton/meter (N/m) kilo pascal (kPa) kilo pascal (kPa) kilogram (kg) kilogram-meter2 ( kg-m2) kilogram-meter3 (kg/m3) **Gray (Gy) coulomb/kilogram (C/kg) second (s) kilogram (kg) kilo pascal (@a)
angst ran atmosphere (normal) bar barn British thermal unit (thennochemical) calorie (thennochemical) cal (thennochemical/cm2) curie degree (angle) degree Fahrenheit electron volt erg erg/second foot foot-pound-force gallon (U. S . liquid) inch jerk joule/kilogram (J/kg) radiation dose
absorbed kilotons kip (1000 lbf) kip/inch2 (ksi) ktap micron mil mile (international) ounce pound-force (lbs avoirdupois) pound-force inch pound-force/inch pound-force/foot2
- pound-£ orce/inch2 (psi) pound-mass (Lbm avoirdupois) pound-mass-footz (moment of inertia) pound-mass/foot3 rad (radiation dose absorbed) roentgen shake slug torr (m Hg, 0' C)
1.000 000 x E -10 1.013 25 x E +2 1.000 000 x E +2 1.000 000 x E -28 1.054 350 x E +3 4.184 000 4.184 000 x E -2 3.700 000 x E +1 1.745 329 x E -2 tk = (t"f + 459.67) /1.8 1.602 19 x E -19 1.000 000 x E -7 1.000 000 x E -7 3.048 000 x E -1 1.355 818 3.785 412 x E -3 2.540 000 x E -2 1.000 000 x E +9
1.000 000 4.183 4.448 222 x E +3 6.894 757 x E +3 1.000 000 x E +2 1.000 000 x E -6 2.540 000 x E -5 1.609 344 x E +3 2.834 952 x E -2 4.448 222 1.129 848 x E -1 1.751 268 x E +2 4.788 026 x E -2 6.894 757 4.535 924 x E -1 4.214 011 x E -2 1.601 846 x E +1 1.000 000 x E -2 2.579 760 x E -4. 1.000 000 x E -8 1.459 390 x E +1 1.333 22 x E -1

Table of Contents
I. Frequency-dependent shear-wave Q models for the crust of China and nearby regions - A.L. Jembene and B.J. Mitchell
Abstract 1
Introduction 3
Determination of Q,, structure using surface waves
Lg coda Q
Method
Results
Conclusions
Acknowledgments
References
Table Caption
Figure Captions
11. Computational study of high-frequency P-wave synthetics and their attenuation in the continental crust - F. Leyton, R. Chu, A. Fatehi and B.J. Mitchell
Abstract 2 6
Introduction 2 7
High-frequency P-wave attenuation for high-Q and low-Q crustal models 2 7
Conclusions 2 9
References
Table Caption
Figure Captions

Frequency Dependent Shear-wave Q Models for the Crust of China and Surrounding Regions
Alemayehu L. Jemberie and Brian J. Mitchell Department of Earth and Atmospheric Sciences
Saint Louis University
Abstract
Starting with fundamental-mode Rayleigh-wave attenuation coefficient values ( y ~ )
predicted by previously detennined frequency-independent models of shear-wave Q (Q,)
we have obtained frequency-dependent Q,, models that explain both the measured values
of y~ as well as of Lg coda Q and its frequency dependence at 1 Hz (Q, and 7
respectively) for China and some adjacent regions. The process combines trial-and-error
selection of a model for the depth distribution of the frequency dependence parameter (5;)
for Q,, with a formal inversion for the depth distribution of Q, at 1 Hz. Fifteen of the
derived models have depth distributions of <that are constant, or nearly constant,
between the surface and a depth of 30 km. 5;distributions that vary with depth are
necessary to explain the remaining seven models. 5: values for the depth-independent
models vary between 0.4 and 0.7 everywhere except in the western portion of the Tibetan
Plateau where they range between 0.1 and 0.3 for three paths. These low < values lie in a
region where QL, and crustal Q,, are very low and suggest that they should also be low for
high-frequency propagation. The models in which varies with depth all show a decrease
in that value ranging between 0.6 and 0.8 in the upper 15 km of the crust and (with one
exception where 5 = 0.0) between 0.3 and 0.55 in the depth range 15-30 km. The
distribution of highest values (0.6 - 0.8) in the upper crust indicates that high-frequency

waves will propagate most efficiently, relative to low-frequency waves, in a band that
includes, and strikes north-northeastward from, the path between event 212197 and KMI
to the path between event 180195 and station HIA in the north.

Intr'oduction
Almost all mechanisms for intrinsic Q in the Earth predict that it should vary with
frequency (e.g. Jackson and Anderson, 1970). The variation of Q with frequency is
usually considered to vary as Q - oa where the exponent a is termed the frequency
dependence parameter and may be different for different attenuating waves. In the
present study we represent that parameter for shear-wave Q (Q,,) by < and for Lg coda Q
( Q : ~ ) by 1. Several studies have addressed the question of frequency dependence of Q in
the mantle and have found it to be necessary for simultaneously explaining the
attenuation rate of both low- and high-frequency waves. Studies have invoked frequency
dependence to reconcile Q values observed for free oscillations of the Earth and 1-Hz
body waves (Jeffreys, 1967; Liu et al., 1976), to explain shear-wave Q observed for ScS
waves at low and high frequencies (Sipkin and Jordan, 1979), and to explain variations in
Q with frequency for teleseismic P- and S-waves in the range 0.02-4.0 Hz (Der et al.,
1982). Frequency dependence of Q for upper tiiantle material rock has also been
observed in laboratory experiments (e.g. Gueguen et al., 1989; Jackson et a]., 2003).
Fewer studies have addressed the question of frequency dependence for Q at crustal i
depths. Combined inversions of surface-wave attenuation at periods between about 5 and
50 s and of Lg coda Q at 1 Hz, have shown that Q,, in the continental crust varies with
frequency at least at frequencies of about 1 Hz and above (Mitchell, 1980; Mitchell and
Xie, 1994). Determinations of Lg Q (QLg) (e.g. Benz et al., 1997) or Lg coda Q (I?:,) (e.g. Xie and Mitchell, 1990a, 1990b) typically suggest the need for frequency-dependent
values. It, however, has also been found possible to explain frequency-dependent QLg or
Q:~ with a frequent-independent Qp model that contains a rapid increase in value at mid-
crustal depths (Mitchell, 1991).
Theoretical work has shown that Q frequency dependence may be associated with
intrinsic energy loss due to temperature (e.g. Gueguen, 1989) or to movements of fluid in
permeable rock (e.g. O'Connell and Budiansky, 1977). Recent studies (Hammond and
Humphreys, 2000;' Faul et al., 2003) have concluded that the latter mechanism is not
plausible at mantle depths where pressures are high, but research on this question, to our
knowledge, has not yet been conducted for crustal rock at lower pressures. Some

calculations, using realistic values for temperature and the frequency dependence
parameter for Q, as well as assumed values for Q activation energy, suggest that
temperature differences cannot explain regional differences between crustal Q values for
the eastern and western United States (Mitchell, 1995). If this result is correct it suggests
that regional Q variations in the upper crust are likely to be caused by regional variations
in fluid content in crustal rock. Frequency dependence of Q, at least at high frequencies,
may also be attributed to scattering from heterogeneities in material traversed by seismic
waves (e.g. Dainty et al., 1987).
That Q varies with frequency, at least in some portions of he crust and upper mantle
and over the frequency range that that relevant to seismic wave propagation over near and
regional distances, appears to be well established. Consequently this frequency
dependence may be of great practical consequence for magnitude determinations at near
and regional distances; and in nuclear test ban treaty monitoring, for determining
detection thresholds and for the implementation of methods for discriminating between
earthquakes and explosions.
In this study we determine frequency dependence values (c) for crustal Q,, that
simultaneously explain the attenuation observed for fundamental-mode Rayleigh waves
at intermediate periods (about 5-50 s) and values of observed in the southeastern
portion of Eurasia that includes China and some adjacent regions. This will allow us to
extend the applicability of previously determined frequency-independent Q , models
determined from surface waves to higher frequencies that characterize waves recorded at
near and regional distances.
Our approach differs from that used in previous surface-wave studies of Q,
frequency dependence in that we were able, for each path, to use fundamental-mode
Rayleigh-wave data and higher-frequency Lg coda data recorded by the same instrument.
Earlier studies, before the widespread availability of broadband data (e.g. Mitchell, 1980)
used different instruments for low- and high-frequency data. The top trace in Figure 1
shows ground motion recorded by the broadband station ULN in Mongolia for an
earthquake about 530 km distant near Lake Baikal. A seismogram, if recorded by a long-
period instrument of the World-Wide Standard Seismograph Stations (WWSSN), would
be similar to the middle trace of Figure 1 which is obtained by low-pass filtering the

upper trace at periods above 4 s. If recorded by a short-period instrument of the WWSSN
the seismogram would look like the bottom trace of Figure 1 which was obtained by
band-pass filtering the upper trace around 1 Hz.
Determination of Q, structure using fundamental-mode Rayleigh waves
Using a single-station multimode method, Jemberie and Mitchell (2003) determined
three-layer frequency-independent Q,, models for the southeastern portion of Asia that
includes China and some adjacent regions. It used surface-waves that were well-recorded
at surface-wave frequencies (about 5-50 s), an example of which appears in the middle
trace of Figure 1. They mapped Q,, variations for two depth ranges, 0- 10 and 10-30 km
and also estimated Q , in the depth range 30-60 km but with less reliability. They found
large regional variations of Q, in all of the layers. Q,, in layer 1 (the upper 10 km) varies
between about 250 in southeastern China to about 40 in thoughout most of the western
Tibetan Plateau. In layer 2 (10 - 30 krn depth) Q, varies between about 140 in central and
eastern China and about 60 in western Tibet and the Burma-Thailand region. The low Q,,
values in western Tibet are among the lowest found in any continental region and
correlate spatially with the lowest values of QL, ever to be reported (Xie, 2002).
In order to obtain frequency-dependent Q, models our process requires that we
invert curves of fundamental-mode Rayleigh-wave attenuation coefficient values (y)
versus period. We did not measure these directly, but instead computed y values for the
Q,, models of Jemberie and Mitchell (2003) along with appropriate velocity models. This
computation is the first step in the inversion process described in a later section.
Lg Coda Q
Lg is usually the most prominent high-frequency phase (-0.5 Hz and higher)
recorded on seismograms at regional distances in continents and can be observed at
distances as great as 3000 km. Because it is so well recorded it has been used to
determine magnitudes of small events at regional distances (Nuttli, 1973) and to study
regional variations 'of attenuative properties of the crust. In stable regions it is
characterized by group velocities of about 3.5 kmls and can be as low as 3.2 or 3.3 k d s
in tectonically active regions.
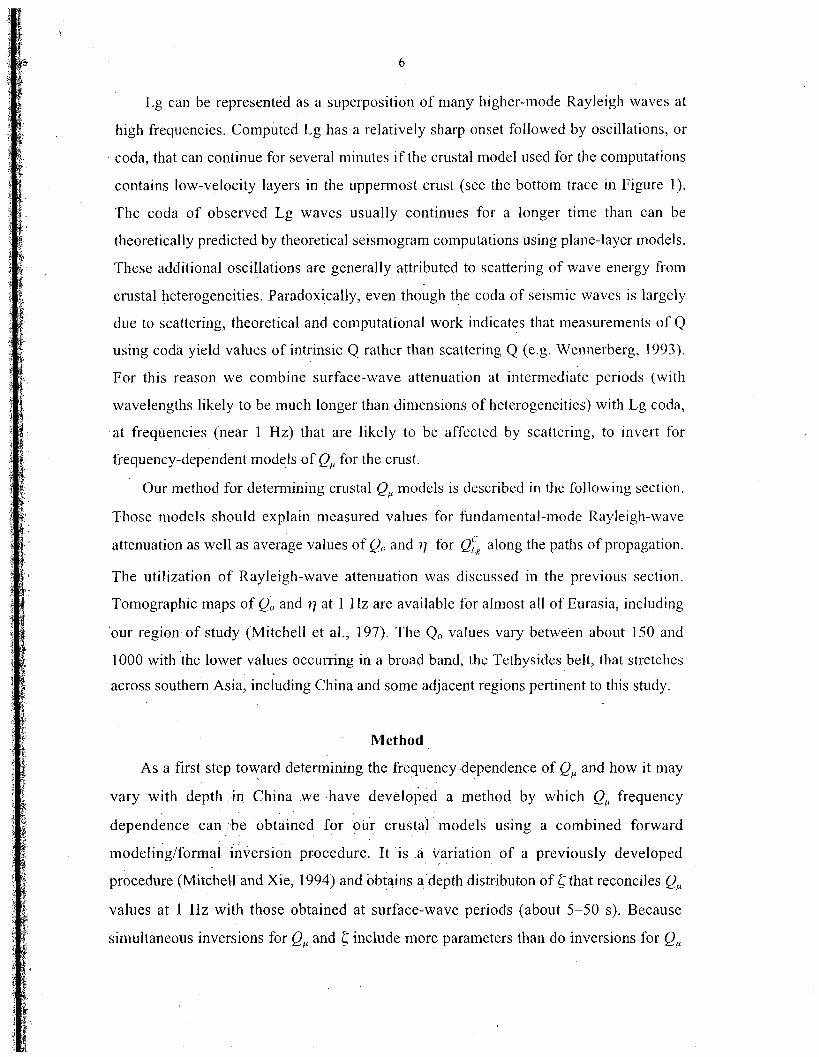
Lg can be represented as a superposition of many higher-mode Rayleigh waves at
high frequencies. Computed Lg has a relatively sharp onset followed by oscillations, or
coda, that can continue for several minutes if the crustal model used for the computations
contains low-velocity layers in the uppermost crust (see the bottom trace in Figure 1).
The coda of observed Lg waves usually continues for a longer time than can be
theoretically predicted by theoretical seismogram computations using plane-layer models.
These additional oscillations are generally attributed to scattering of wave energy from
crustal heterogeneities. Paradoxically, even though the coda of seismic waves is largely
due to scattering, theoretical and computational work indicates that measurements of Q
using coda yield values of intrinsic Q rather than scattering Q (e.g. Wennerberg, 1993).
For this reason we combine surface-wave attenuation at intermediate periods (with
wavelengths likely to be much longer than dimensions of heterogeneities) with Lg coda,
at frequencies (near 1 Hz) that are likely to be affected by scattering, to invert for
frequency-dependent models of Q,, for the crust.
Our method for determining crustal Q,, models is described in the following section.
Those models should explain measured values for fundamental-mode Rayleigh-wave
attenuation as well as average values of Qo and q for Q:, along the paths of propagation.
The utilization of Rayleigh-wave attenuation was discussed in the previous section.
Tomographic maps of Qo and q at 1 Hz are available for aln~ost all of Eurasia, including
'our region of study (Mitchell et al., 197). The Q, values vary between about 150 and
1000 with the lower values occurring in a broad band, the Tethysides belt, that stretches
across southern Asia, including China and some adjacent regions pertinent to this study.
Method
As a first step toward determining the frequency dependence of Q, and how it may
vary with depth in China we have developed a method by which Q, frequency
dependence can be obtained for our crustal models using a combined forward
modeling/formal inversion procedure. It is a variation of a previously developed
procedure (Mitchell and Xie, 1994) and obtains a depth distributon of that reconciles Q,
values at 1 Hz with those obtained at surface-wave periods (about 5-50 s). Because
simultaneous inversions for Q, and < include more parameters than do inversions for Q,
alone, an additional level of non-uniqueness is introduced in the models. The process
proceeds as follows:
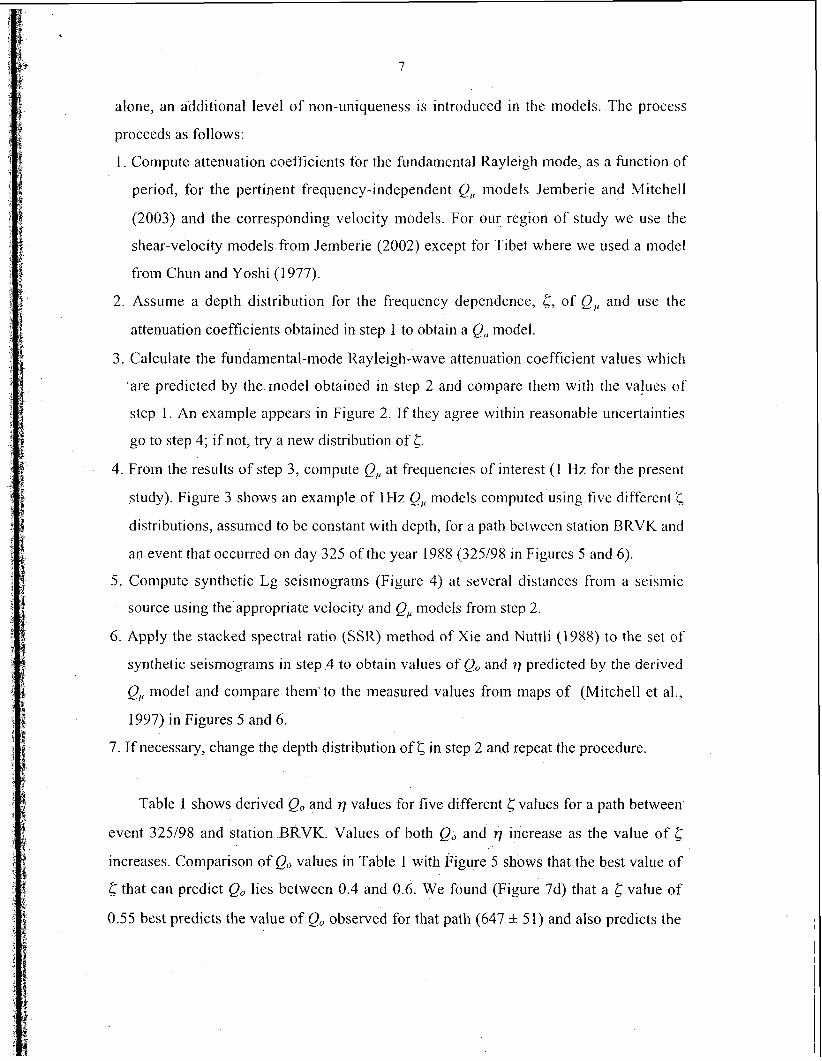
1 . Compute attenuation coefficients for the fundamental Rayleigh mode, as a function of
period, for the pertinent frequency-independent Q,, models Jemberie and Mitchell
(2003) and the corresponding velocity models. For our region of study we use the
shear-velocity models from Jemberie (2002) except for Tibet where we used a model
from Chun and Yoshi (1 977).
2. Assume a depth distribution for the frequency dependence, <, of Q,, and use the
attenuation coefficients obtained in step 1 to obtain a Q,, model.
3. Calculate the fundamental-mode Rayleigh-wave attenuation coefficient values which
$are predicted by the model obtained in step 2 and compare them with the values of
step 1. An example appears in Figure 2. If they agree within reasonable uncertainties
go to step 4; if not, try a new distribution of c. 4. From the results of step 3, compute Q,, at frequencies of interest (1 I-lz for the present
study). Figure 3 shows an example of 1Hz Q, models computed using five different < distributions, assumed to be constant with depth, for a path between station BRVK and
an event that occurred on day 32.5 of the year 1988 (325198 in Figures 5 and 6).
5 . Compute synthetic Lg seismograms (Figure 4) at several distances from a seismic
source using the appropriate velocity and Q, models from step 2.
6. Apply the stacked spectral ratio (SSR) method of Xie and Nuttli (1988) to the set of
synthetic seismograms in step 4 to obtain values of Q, and 11 predicted by the derived
Q,, model and compare them'to the measured values from maps of (Mitchell et al.,
1997) in Figures 5 and 6.
7. If necessary, change the depth distribution of < in step 2 and repeat the procedure.
Table 1 shows derived Q, and q values for five different S; values for a path between
event 325198 and station BRVK. Values of both Q, and q increase as the value of
increases. Con~parison of Q, values in Table 1 with Figure 5 shows that the best value of
that can predict Q, lies between 0.4 and 0.6. We found (Figure 7d) that a S; value of
0.55 best predicts the value of Q, observed for that path (647 * 51) and also predicts the

q value of 0.37 =k 0.03 This value is lower than the average S; value (about 0.5 on average)
for the path in Figure 6. In cases, such as this, where-Q,, and q cannot both be fit
precisely, we assume that Q, is more likely to be measured more accurately than 17. q
values may be inaccurate because they are obtained by differencing values of Q at two
different frequencies.
Results
The frequency-dependent models obtained using the above procedure appear in
Figures 7a-d. The solid lines on the left-hand side of each pair of boxes are frequency-
independent Q, models obtained using the single-station multimode method (Jemberie
and Mitchell, 2003) and the dashed lines show models at 1 Hz using our procedure for
obtaining Q,, frequency dependence. The boxes on the right-hand side of each pair show
the assumed distributions of with depth. For 15 of the 22 models, a constant value of <,
or a distribution that varies with depth by no more than 0.05, produced acceptable results.
Values for these models range between 0.4 and 0.7 everywhere in the region of study
except the western portion of the Tibetan Plateau where values lie in the range 0.1 - 0.3.
One path, 284194 to LSA in the eastern portion of the Tibetan Plateau has a S; value 0.45
which is intermediate between values for paths in the western part of the plateau and
paths outside, and to the east of, the plateau.
The remaining seven models require that S; values at depths greater than 15 krn be
smaller those in the upper 15 km of the crust. For the upper 15-km thick Sayer ranges
between 0.6 and 0.8, and for greater depths ranges (with one exception) between 0.3 and
0.55. The exceptional value is 0.0. Values of Q , and 7 for Lg attenuation at 1 Hz
predicted by the models appear with each pair of panels. Note that, as shown by the
model in the upper left of Figure 7a, a model with a nearly frequency-independent Q, can
still produce a frequency-dependent QL, value if Q, increases rapidly with depth at mid-
crustal depths. This phenomenon was shown to occur in the crust of the Basin and Range
province in the western United States (Mitchell, 1991).
The low values for 55 in the western Tibetan Plateau coincide with very low values of
Q, found in the crust of this region using multimode surface waves (Jemberie and

Mitchell, 2003), as well as with very low Q L ~ values at 1-Hz frequencies (Xie, 2003).
These results indicate that surface-waves at periods of -5-50 s as well as Lg or Lg coda
at 1 Hz, and probably higher frequencies, propagate less efficiently in western Tibet than
anywhere else in our region of study. The rates of attenuation in this region for both
surface-wave periods (-5-50 s) and Lg frequencies (-about 1 Hz) are the highest so far
measured for any continental region. An early study of Q in the central Tibetan Plateau
(Chang and Yao, 1979), using spectral rations of S and ScS waves, found a Q value of
about 25 that must pertain predominantly to upper mantle depths.
An interpretation of our results in terms of a continuous relaxation model for the
crust would indicate that the relaxation spectrum (Q; ' ) is shifted to higher frequencies
compared to other parts of our region of study, an effect that could be produced by higher
temperatures or elevated levels of tectonic stress. Sublithospheric mantle heat flow
estimated by Artemieva and Mooney (2001) is elevated throughout the western and
central parts of the Tibetan Plateau relative to surrounding regions. It is probably
pertinent that electrical resistivity values at mid- and lower-crustal depths are very low
there (Wei et al., 2001), suggesting the presence of melt or fluids that may been released
by hydrothermal reactions initiated by the high temperatures.
Conclusions
We have obtained frequency-dependent models of Q, that explain the variation of
fundamental-mode Rayleigh-wave attenuation coefficients with period predicted by the
Q, models of Jemberie and Mitchell (2003) as well as previously mapped values of Q,
and q in China and some adjacent regions. S; values for depth-independent models vary
between 0.4 and 0.7 through most of the region of study, but range between 0.1 and 0.3 in
the western portion of the Tibetan Plateau. The latter (low) <values coincide with regions
where QL, and crustal Q, were previously reported to be very low and indicate that high-
frequency propagation should also be low compared to other regions. The models in
which < varies with depth all show a decrease in that value ranging between 0.6 and 0.8
in the upper 15 km of the cnlst and between 0.3 and 0.55 (with one exceptionally value)
in the depth range 15-30 km. The distribution of highest <values (0.6 - 0.8) in the upper
crust indicates that high-frequency waves will propagate most efficiently, relative to low-
frequency waves, in a band that includes, and strikes north-northeastward from, the path
between event 2 12/97 and KMI to the path between event 180195 and station HlA in the
north.
Our results indicate that wave propagation at surface-wave periods (-5-50 s), at 1
Hz, and probably higher frequencies, are less efficient in western Tibet than anywhere
else in our region of study and that the region is characterized by the least efficient
propagation of seismic waves, at all seismic frequencies, yet known for any continental
region. The low Z; values can be explained if wave propagation in the cnlst of this region
can be characterized by a continuous relaxation model that has been displaced to higher
frequencies by temperatures andlor tectonic stress levels that are higher than they are in
surrounding regions.
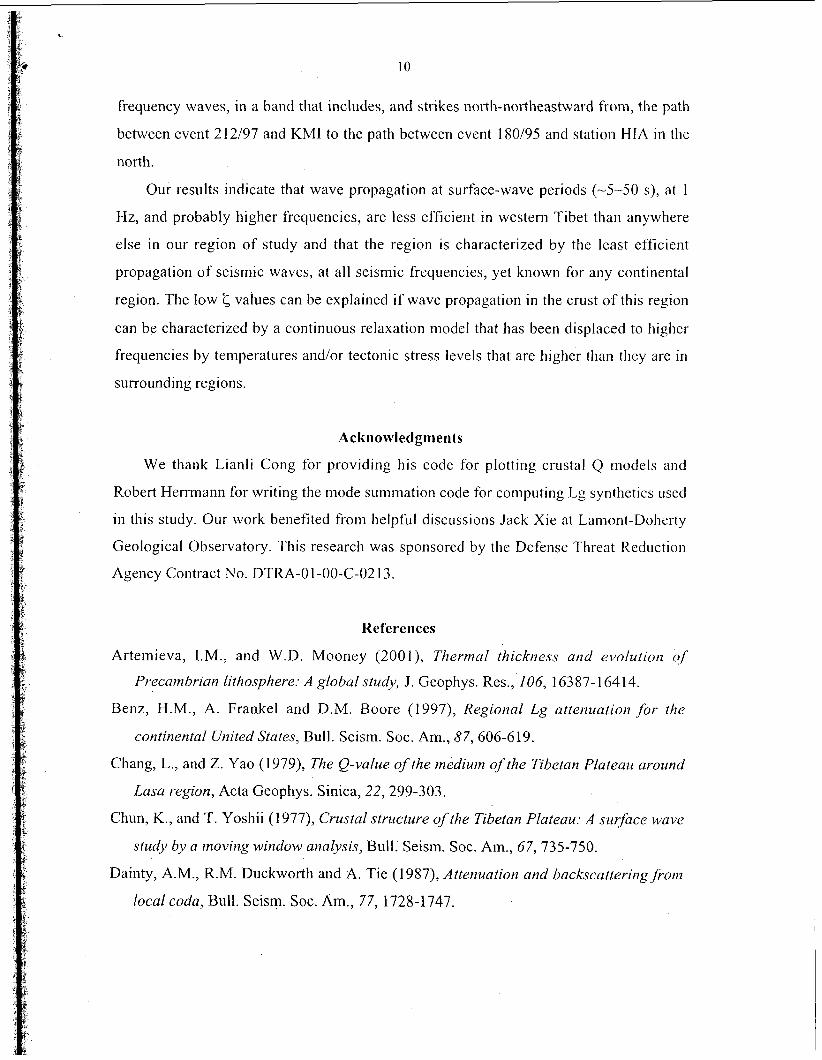
Acknowledgments
We thank Lianli Cong for providing his code for plotting crustal Q models and
Robert Herrmann for writing the mode summation code for computing Lg synthetics used
in this study. Our work benefited from helpful discussions Jack Xie at Lamont-Doherty
Geological Observatory. This research was sponsored by the Defense Threat Reduction
Agency Contract No. DTRA-0 1 -00-C-02 13.
References
Artemieva, I.M., and W.D. Mooney (2001), Thermal thickness and evolution o f
Precambi*ian litlzospher-e: A global study, J . Geophys. Res., 106, 16387- 16414.
Benz, H.M., A. Frankel and D.M. Boore (1997), Regional Lg attenuation for the
continental United States, Bull. Seism. Soc. Am., 87,606-619.
Chang, L., and Z. Yao (1979), The Q-value of the medium of the Tibetan Plateau around
Lasa region, Acta Geophys. Sinica, 22, 299-303.
Chun, K., and T. Yoshii (1977), Crustal structure ofthe Tibetan Plateau: A surface wave
study by a 171oving window analysis, Bull. Seism. Soc. Am., 67, 735-750.
Dainty, A.M., R.M. Duckworth and A. Tie (1987), Attenuation and backscattering from
local coda, Bull. Seism. Soc. Am., 77, 1728-1747.

Der, Z.A., T.W. McElfresh, and A. O'Donne11 (1982), An investigation of the regional
variations and fi-equency dependence of anelastic attenuation ofthe nzantle under the
United States in the 0.5-4 Hz band, Geophys. J . Roy. Soc., 69, 67-99.
Faul, U.H., J . D. Fitz Gerald and I . Jackson, Shear-wave attenuation and dispersion in
melt-bearing o l i v i~e polycrystals II. Microstructural interpretation and seismological
inzplications, J . Geophy. Res., in press, 2003.
Gueguen, Y. , M. Darot, P. Mazot and J . Woirgard ( 1 989), Q' ojyorsterite single cgvtals,
Phys. Earth Planet. Inter., 55, 254-258.
Hammond, W.C., and E.D. Humphreys (2000), Upper nzantle seisnzic wave velocity:
Effects ofrealistic partial melt geometries, J . Geophys. Res., 105, 10975- 10986.
Jackson, J . , U.H. Faul, J.D. Fitz Gerald and B.H. Tan (2003), Shear-wave attenuation and
dispersio~z in melt-bearing olive polycrystals 1. Specinzen fabrication and mechanical
testing, J. Geophys. Res., in press.
Jackson, D.D., and D.L. Anderson (1970), Plzysical nzechanisms for seisnzic wave
attenuation, Rev. Geophys., 8, 1-63.
Jeffreys, H . ((1967), Radius of the Earth 's core, Nature, 215, 1365-1 366.
Jemberie, A.L. (2002), Shear-wave attenuatiolz and velocity studies in southeastern Asia,
Ph.D. Diss., Saint Louis University, St. Louis, Missouri, USA, 2 18 pp.
Jemberie, A.L., and B.J. Mitchell (2003), Shear-wave Q structure and its lateral
variation in the crust of China and surrounding regioi~s, Geophys. J . Int., submitted.
Liu, H.P., D.L. Anderson, and H. Kanamori (1976), Velocity dispersion due to
anelasticity: I~nplications for seismology and ma~ztle coinposition, Geophys. J . Roy.
SOC!, 47,41-58.
Mitchell, B.J. (1980), Frequency dependence of shear wave internal friction in the
continental crust of eastern North America, J. Geophys. Res., 85,52 12-52 18.
Mitchell, B.J. (1991), Frequency dependence of QLg and its relation to crustal
anelasticity in the Basin and Range province, Geophys. Res. Lttrs., 18, 62 1-624.
Mitchell, B.J. ( 1 995), Anelastic structure and evolution of the continental crust and upper
mantle from seisnzic surface wave attenuation, Rev. Geophys., 33, 441-462.

Mitchell, B.J., and J. Xie (1 994), Attermation of multiylzase sutface waves in the Basin
and Range PI-ovince - dII. Inver-sion for cr-ustal anelasticity, Geophys. J. Int., 11 6,
468-484.
Mitchell, B.J., Y. Pan, J. Xie and L. Cong (1997), Lg coda Q variatior~ across Eurasia
and its relation to cr-ustal evolutiorz, J. Geophys. Res., 102, 22767-22779.
Nuttli, O.W. ( 1 973), Seismic wave attenuation and nzagrzitude relrltiorz.~ for eastern North
Amer-ica, J. Geophys. Res., 78, 876-885.
O'Connell, R.J., and B. Budiansky (1977), Viscoelastic proper-ties of,fluid -saturated
cracked solids, J. Geophys. Res., 82, 5719-5735.
Sipkin, S.A., and T.H. Jordan (1979), Frequency dependence of Qscs, Bull. Seism. Soc.
Am., 69, 1055-1079.
Wei, W., M. Unsworth, A. Jones, J. Booker, I-I. Tan, D. Nelson, L. Chen, S. Li, K. Solon,
P. Bedrosian, S. Jin, M. Deng, J. Ledo, D. Kay, and B. Roberts (2001), Detection of
~~idespread.fluids in the Tibetan crust by nzagr~etotelluric studies, Science, 292, 7 16-
718.
Wennerberg, L. ( 1 993), Multiple-scattering ir~tet-yretations of coda-Q merrsur-ements,
Bull. Seism. Soc. Am., 83, 279-290.
Xie, J. (2002), Lg Q i~ the eastern Tibetan Plateau, Bull. Seism. Soc. Am., 92, 871 -876.
Xie, J., and 0. W. Nuttli (1 988), lrzterpretatiotz of high-fiequeizcy coda a t large distutzces:
Stoclza.stic nzodelir~g and rlletlzod of irzversion, Geophys. J., 95, 579-595.
Xie, J., and B.J. Mitchell (1990a), A back-pr*ojection nzethod jo r inzagirzg large-scale
lateral variations of Lg coda Q with application to continental Africa, Geophys. J.
Int., 100, 161-181.
Xie, J., and B.J. Mitchell (1990b), Attenuation of nzultiphase surface waves in the Basitz
and Rarlgeprovince, I, Lg and Lg coda, Geophys. J. Int., 102, 12 1-137.

13
Table Caption
Table 1. Lg Q at 1 Hz (Qo) and frequency dependence ( q ) values derived from the
stacked spectral ratios (Xie and Nuttli, 1988) of the synthetic seismograms obtained
using the l-Hz shear-wave Q (Q,,) structure and its frequency dependence (c) for the
path between event 325198 and station BRVK. The numbers in column for F give the
frequency ranges utilized in the determinations.
Figure Captions
Figure 1 . Vertical-component seismogram recorded by the broadband instrument at
station ULN for an earthquake that occurred on 30 June 1995 at an epicentral
distance of about 530 km. The top trace shows the original broadband ground
motion, the middle trace is the original record after it has been low-pass filtered for
frequencies below 0.25 Hz (periods above 4 s), and the bottom trace is the original
record after it has been band-pass filtered around 1 I-lz.
Figure 2. Comparison of Rayleigh-wave attenuation coefficients prcdicted by the three-
layer frequency-independent model of Q, with a frequency-dependent model for
spectra obtained at station ULN for event 180195. The necessary values are 0.65
for depths between 0 and 15 km and 0.60 for depths greater than 15 k n ~ .
Figure 3. 1-Hz Q, models computed using five different values of Q,, frequency
dependence (c). Figure 4. Synthetic Lg seismograms generated using the Q,, structure obtained at 1 Hz
and the velocity model for a subregion of China.
Figure 5. Topographic map of Lg coda Q at 1 Hz (Q,) for most Eurasia (modified from
Mitchell et al., 1997) showing paths between events and stations where frequency-
independent models of Q,, structure were determined by Jemberie and Mitchell
(2003).
Figure 6. Tomographic map of the frequency dependence (q) of Lg coda Q at 1 Hz for
most of Eurasia (modified from Mitchell et al., 1997) showing paths between events
and stations.
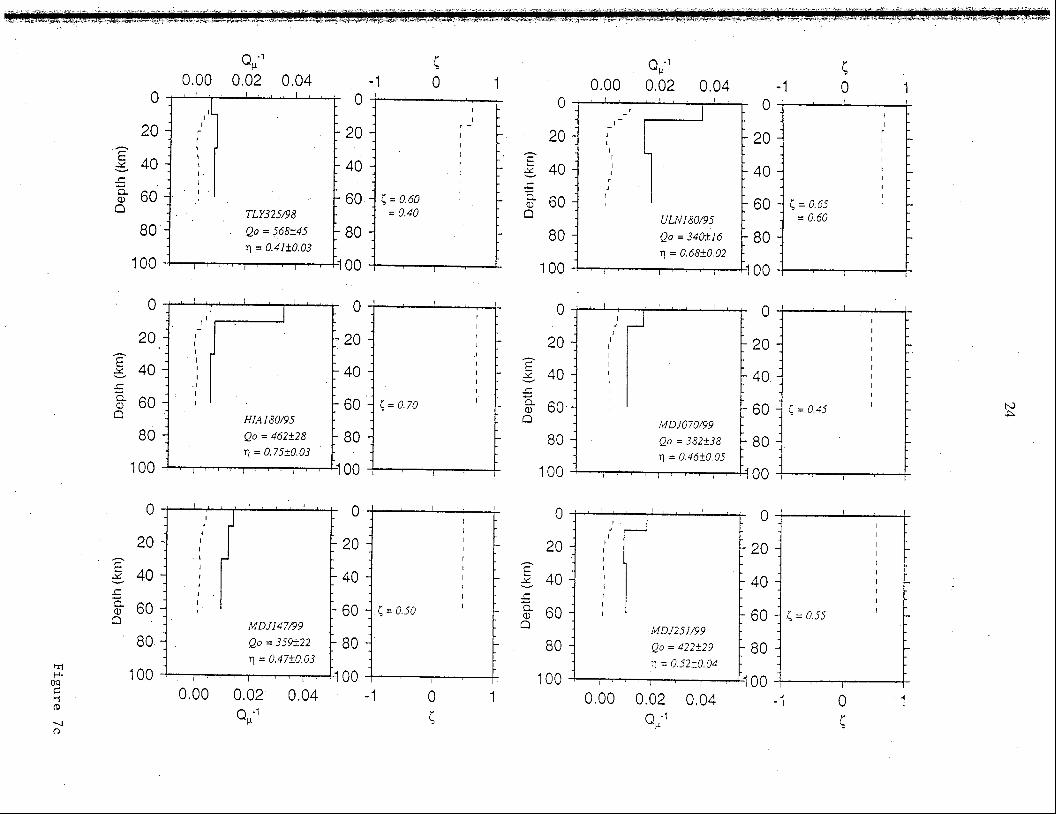
Figure 7a. Frequency-dependent models of Q,, structure for Tibet and the southernmost
portion of the study area. The solid line in left-hand panels for each path presents

frequency-independent Q,, models that explain measured Rayleigh-wave attenuation
at periods between about 5 and 50 s. The model delineated by the dashed line shows
a Q,, model at 1 Hz that explains both fundamental-mode Rayleigh-wave attenuation
and measured Lg coda Q values at 1 Hz. The caption identifies the recording station
and date of the event and gives values for Lg Q and its frequency dependence at 1
Hz that are predicted by the 1-Hz Q, model. The right-hand panel shows the depth
distribution of Q, frequency-dependence that explains the two models on the left.
The caption in this panel gives the value of for the upper 15 k111 of the rnodel (first
number) and for the depth range between 15 and 60 km (second number).
Figure 7b. Frequency-dependent models of Q,, structure for central and western China,
Mongolia and peripheral regions. See the caption for Figure 7a for an explanation of
the models and symbols.
Figure 7c. Frequency-dependent models of Q, structure for paths in northern China,
Mongolia and portions of southern Siberia. See the caption for Figure 7a for an
explanation of the models and symbols.
Figure 7d. Frequency-dependent lnodels of Q, structure for the western portion of the
study area. See the caption for Figure 7a for an explanation of the models and
symbols.

Table 1
5 Qo rl Frequency Range

Fig
ure
1

Figure 2
0.003
0.002 -
n F
2 0.001 - w
+
0.000 -
-0.001 0
Period (sec)
I I I I I I I I I
y values predicted by
freqliency-~rtcici~enderz~ Qp rnorlel
, , , freq~lerlcy-deperzcient Qp model (5 = 0 65 fop 15 km & 0.60 below 15 k171)
ULN180/95
I I I I I I I I I
10 20 30 40 50 60 70 80 90 100
-
-
-

Q;' (at 1 Hz)
0.00
F i g u r e 3

Fig
ure
4

F i g u r e 5

F i g u r e 6


uo
-
Fig
ure
7b
000000
cud-cocoa 000000 000000
ad-amo
ad-cocoa
-
Fig
ure
7
c

I.
.,
I,
.,
I.
,,
I,
,,
- - - - - - -
- - .
0 Y
'J
-llr,
do:
11 II
*J.
1"
~1
"~
11
'1
1"
'
-
Fig
ure
7d

Computational Study of High-frequency P-wave Synthetics and their Attenuation in Continental Crust
F. Leyton, R. Chu, A. Fatehi and B.J. Mitchell Department of Earth and Atmospheric Sciences
Saint Louis University
Abstract
We have completed preliminary studies of the effect that simple velocity and Q
models have on the attenuation of high-frequency P-waves for distances between 10 and
200 km from a source in the upper crust. We computed complete waveforms that might
propagate in simple high- and low-Q crustal models, one corresponding to a typical stable
region and the other to a low-Q model that approximates a portion of a region of plate
collision in China. Both models consist of a 10-krn thick upper crustal layer over a half-
space. Amplitudes were determined as a function of distance by computing record
sections of complete waveforms using a wave-number integration code. The computed
seismograms show that the rate of attenuation with distance is much more rapid for the
low-Q model than for the high-Q model at the higher frequencies but only slightly more
rapid at 1-Hz. Record sections show that the maximum amplitudes occur at epicentral
distances solnewhat smaller that the critical distance for the model we used. Maximum
amplitudes for waveforms that have been band-pass filtered at 1, 3 and 5 Hz shift to
lower frequencies with decreasing distance. Our computatiol~s show that the value
selected for the frequency-dependence parameter (5) will have a very large effect on the
computed amplitudes. For vertical-component ground motion our selected 1; value (0.5)
yields maximum amplitudes at 5 Hz that are about 4 times as large as those at 1 Hz and
1.5 times as large as those at 3 Hz. Computations of horizontal-component ground
motion yield similar results.

Introduction
Studies of seismic-wave attenuation have, over that past 20-30 years, greatly
enhanced our understanding of the anelastic properties of the crust and upper mantle at
surface-wave frequencies (-0.01 -0.2 Hz) as well as for some waves at higher frequencies,
such as Lg and its coda near 1 Hz. Much less is known about the attenuation of seismic
waves frequencies higher than 1 Hz. These waves have, however, taken on greater
importance as test-ban monitoring programs attempt to use shorter paths than ever before
in order to detect and locate small events and to distinguish them from earthquakes.
We need to study the attenuation of these phases if we are to understand all facets of
Q and its frequency dependence over broad frequency ranges. The purpose of this section
of our report is to describe preliminary results obtained from the computation of P-wave
synthetics for sinlple velocity and Q models that might be characterized by reasonable
values for velocity and Q at relatively high frequencies (1-10 1-12).
We computed waveforms for direct P-waves using a wave-number integration code
developed at Saint Louis University and MIT by B. Mandal (Mandal and Mitcllell, 1986;
Mandal and Toksoz, 1990). While the early codes synthesized con~plete waveforms for
the specialized case of transverse isotropy with a vertical axis of symmetry, the more
recent codes perform those computations for waves traversing generalized (up to 21
elastic constants) anisotropic media. While we have performed several types of
computation, some with the intention of investigating the possibility of anisotropic Q in
the continental crust, the present application restricts computations to wave propagation
in isotropic media.
We consider our colnputations to be preliminary but they have yielded results
suggesting that knowledge of high-frequency wave attenuation will be an important area
for future research directed toward monitoring a comprehensive nuclear-test-ban treaty or
CTBT.
High-frequency P-wave Attenuation for High-Q and Low-Q Crustal Models
In order to try to understand the attenuation of high-frequency (above 1 Hz) P-waves
we restricted our computations in these preliminary computations to direct waves at
relatively short distances. We constructed record sections for direct P-waves generated by

a 5-km deep source and that have traveled 200 km through simple two-layer models
(Table 1). The upper layer is 10 km thick and has a P-velocity typical of granitic rock,
with corresponding values for S-velocity and density.
For our computations we took two end-member cases, a l~igh-Q model that might be
representative of an old stable continental region and a low-Q model that might
characterize crust in a zone of continent-continent collision such as that occurring in the
Tethysides belt of southern Eurasia. We have based the low-Q model on values that
might be expected for a portion of southern Asia in which Jemberie and Mitchell (2003)
studied shear-wave Q variations using Rayleigl~ waves. For our cornputations we assume
that P-wave Q is twice as high as S-wave Q for those models. These considerations give a
high-Q P-wave model for which Q is 1000 in the upper 10 km of the model and 600 in
the lower layer and a low-Q model with a P-wave Q value of 100 in the upper layer and
140 in the lower layer.
For all computations we assume a value for the frequency dependence parameter of
Q (see part I of this report) to be 0.5. This value is a rough average of the upper crustal
frequency-dependence parameters found by Jemberie and Mitchell (2003b) for the crust
of southeastern Asia that includes China and surrounding regions. Our computational
results are likely to depend strongly on the value of this parameter, so it will be important
to determine its value and regional variation for frequency ranges that are important in
test ban monitoring.
After computing the P wavefom~ at each distance, we filtered the trace with narrow
band-pass filters centered at 1 Hz, 3 Iiz and 5 Hz. Record sections for these three cases
appear in Figures 1, 2 and 3, each showing seismograms for both the high-Q and low-Q
models. The record sections cover the distance range 10-200 km with a station spacing of
10 krn. The apparent velocities of the computed wave indicate that they begin seeing the
faster, deeper layer at distances between about 50 and 70 krn.
Noise was not added to the seismograms, but it is clear that P-waves in the low-Q
model would be difficult to detect in the presence of noise at all three frequencies at
distances greater than about 150 km for small events and that the onsets are so emergent
that they would not be useful for precise event location even at much shorter distances.
The high-Q model produces records in which amplitudes attenuate much more slowly

and could, at the higher frequencies, probably be detected at distances beyond 200 krn if
the noise level is not high. The sharpness of the wave onsets for the high-Q model also
makes those waves more useful for event location.
Figure 4 plots vertical-component P-wave amplitudes as a function of distance for
the three frequencies for both our high- and low-Q models. For each frequency the
amplitude maxima for the low- and high-Q models occurs at about the same distance,
where that distance increases with decreasing frequency. Atiiplitude variations with
distance show that 1-Hz waves have the largest amplitudes of the three frequencies at
distances begin at about 70 km for the high-Q model and at about 65 km for the low-Q
model. Amplitude for the 1-Hz waves are twice or more as large as for the other
frequencies at all greater distances. At distances of 40-50 km the amplitudes of the 5-Hz
waves are more than four times greater than the 1-I-iz waves and about 1.5 times greater
than the 3-Hz waves.
Similar distributions were obtained for the radial component of computed P-waves
(Figure 5). Peak amplitudes of radial-component waves are higher than for the vertical-
component, but this is only because of the constant velocity in the upper layer of the
model. With a more realistic tnodel in which velocities increase with depth the vertical-
component amplitudes would become much larger than those obtained in this preliminary
work.
Conclusions
Computations of vertical- and horizontal-component ground motion from a source at
5 km depth and an assumed value of 0.5 for the frequency dependency parameter in the
upper crust have allowed us to determine the variation of P-wave amplitudes with
distance in a simple two-layer model. Synthetic seismograms indicate that it may be
difficult to detect small events at larger distances, especially if noise is present, for the
low-Q model and that emergent waveforms, especially at 1 Hz, will degrade attempts to
locate the events over a large distance range. At higher frequencies (3 and 5 Hz) the
onsets are sharper, thus yielding better locations, but the waves attenuate very rapidly for
the low-Q relative to the high-Q model. Synthetics at the higher frequencies decay very

rapidly for the low-Q model relative to the high-Q model whereas synthetics at 1 1-12
show less difference for the model we have tested.
Amplitude maxima shift to larger distances with decrease in frequency. For our
selected model amplitude maxima occur at distances of 45, 60 and 75 km for frequencies
of 5, 3 and 1 Hz, respectively. Plotted amplitudes for the higher frequencies are large at
distances near and inside the critical distance but fall off rapidly at distances greater than
about 70 km. Selection of other values for the frequency dependence parameter are likely
to produce far difference results for amplitude attenuation with distance for the high-
frequency waves of this study. With our selected <value maximum amplitudes at 5 Hz
are 4 times and 1.5 times greater than at 1 Hz and 3 Hz, respectively.
References
Jemberie, A.L., and B.J. Mitchell (2003a), Shear-wave Q structure and its lateral
variation in the cnist of China and surrounding regions, Geoplzys. J. lnt., submitted.
Jemberie, A.L., and B.J. Mitchell (2003b), Frequency-dependent shear-wave Q
models for the crust of China and surrounding regions, Pure Appl. Geophys., submitted.
Mandal, B., and B.J. Mitchell (1986), Complete seismogratn synthesis for
transervsely isotropic media, J. Geophys., 59, 149- 156.
Mandal, B., and M.N. Toksos (1990), Computation of coniplete waveforms in
general anisotropic media - results from an explosion source in an anisotropic medium,
Geophys. J. Int., 103,33-45.

Table Caption
Table 1. Velocity-Q models utilized for the computations of this study.
Figure Captions
Figure 1 . Vertical-component seismograms bandpass filtered around 1 Hz.
Figure 2. Vertical-component seismograms bandpass filtered around 3 Hz.
Figure 3. Vertical-component seismograms bandpass filtered around 5 Hz.
Figure 4. Amplitude variation with distance of P-wave vertical-component ground
motion at frequencies of 1, 3 and 5 Hz for high- and low-Q models.
Figure 5 . Amplitude variation with distance of P-wave radial-component ground
motion at frequencies of 1, 3 and 5 Hz for high- and low-Q models.

Table 1
Thickness (km) P-wave vel. ( k d s ) S-wave vel. (kmls)
Density ( g d c c )
Layer 1 10 6.1 3.1 3.5 100 1000 50 500
QP
Qs
Layer 2 00
6.7 3.7 3.8 140 600 70 300
Low-Q model
High-Q model
Low-Q model
High-Q model

Vertical Components @ 1 Hz
time - distance/7 [sec]
F i g u r e 1

Vertical Components @ 3Hz
0 1 2 3 4 5 6
time - distancen [sec]
F i g u r e 2

Vertical Components @ 5Hz
Figure 3
- 1 5 0 - - - - - - - - - - - - - - - - - - - - - - - - - - - - - - - - - / \ , ' . - - - - - - - - - - - - - - - - - - - - - -V-
-
-
-
.E ,'\- - - - - - - - - - - - - - - - - - - - - - -
L. 90 - - - - - H i g h Q - - - ----.,.-., , , - _ --_.__ ~ - - - - - - - ~ - _ + c C1) 80 - - - - - - - - - - - - - - - _ _ _ _ _ _ - - - _ _ _ ~ _ _ _ , \ C - - - - - - - - - - - - - _ 0 . .- " 70 - - - - - - - - - - - - - - - - W .
60 -. - - - - - - - - - - -
50 - . - - - - - - - - - - - - - - - - - - - - - - - - - - - - A
d o - - - - - - - - - - - -
3 0 - - - - - - - - - - - -
20 - - - - - - - - - - - - - - - - - - - - - - - - - - - - - -
l o "I ;.-------- - - - - - - - - - - - - - - - - - - - - - - - - \ ' I I
\ I v I I I I
0 1 2 ' 3 , , 4 5 6
time - distancen [sec]
Y - 130- a> 0
cd 5 .- qoo 7
cd
2/-
- - - - - - - - - - - - - - - - - - - - - - - - - - - - , ' , , “ , - - - - - - - - - - - - - - - - - - - - - - - - - +
120---------------------------,\1,/------------------------- , . I I -
/ I I\ 1 ~ o - - - - - - - - - - - - - - - - - - - , . ~ - - - - I l l , - - - - - - - - - - - - - - - - - - . - - - - - - - - - \ I
-------------------.--- I t -"- 1: - - - - - - _ - - - _ - _ - - - - - - - - - - - - - - - - .
L o w 0 X I ! , *
I I
I I

Figure
4

Radial Component

DISTRIBUTION LIST DTRA-TR-03-3 1
DEPARTMENT OF DEFENSE
DEFENSE TECHNICAL INFORMATION CENTER 8725 JOHN J. KINGMAN ROAD, SUITE 0944 FT. BELVOIR, VA 22060-0944 2 CYS ATTN: DTICIOCA
DEFENSE THREAT REDUCTION AGENCY 8725 JOHN J. KINGMAN ROAD MS 6201 FT. BELVOIR, VA 22060-62 18 2 CYS ATTN: TDNDI D. BARBER
DEPARTMENT OF DEFENSE CONTRACTORS
ITT INDUSTRIES ITT SYSTEMS CORPORATION 1680 TEXAS STREET, SE KIRTLAND AFB, NM 871 17-5669 2 CYS ATTN: DTRIAC
ATTN: DARE
SAINT LOUIS UNIVERSITY DEPARTMENT OF EARTH AND ATMOSPHERIC SCIENCES ST. LOUIS, MO 63103 ATTN: B.J. MITCHELL
DL- 1