Deepening Seattle Footprint with Maiden Acquisition of ... · DBS Bank Ltd. was the sole financial...
28
24 September 2018 Deepening Seattle Footprint with Maiden Acquisition of Westpark Portfolio in Redmond, Washington
Transcript of Deepening Seattle Footprint with Maiden Acquisition of ... · DBS Bank Ltd. was the sole financial...

24 September 2018
Deepening Seattle Footprint with Maiden Acquisition of Westpark Portfolio in Redmond, Washington
Important Notice
This presentation is for information purposes only and does not constitute or form part of an offer, invitation or solicitation of anysecurities of Keppel-KBS US REIT in Singapore or any other jurisdiction nor should it or any part of it form the basis of, or be reliedupon in connection with, any contract or commitment whatsoever.
The value of the Units and the income derived from them may fall as well as rise. Units are not obligations of, deposits in,or guaranteed by, the Manager, Perpetual (Asia) Limited, in its capacity as trustee of Keppel-KBS US REIT, Keppel Capital HoldingsPte. Ltd. and KBS Pacific Advisors Pte. Ltd., as the sponsors of Keppel-KBS US REIT, or any of their respective affiliates.
An investment in the Units is subject to investment risks, including the possible loss of the principal amount invested. Holders ofUnits (“Unitholders”) have no right to request that the Manager redeem or purchase their Units while the Units are listed.It is intended that Unitholders may only deal in their Units through trading on Singapore Exchange Securities Trading Limited(the “SGX-ST”). Listing of the Units on the SGX-ST does not guarantee a liquid market for the Units.
This presentation is not to be distributed or circulated outside of Singapore. Any failure to comply with this restriction mayconstitute a violation of United States securities laws or the laws of any other jurisdiction.
The securities of Keppel-KBS US REIT will not be registered under the U.S. Securities Act of 1933, as amended (the "Securities Act")or under the securities laws of any state or other jurisdiction of the United States, and may not be offered or sold within the UnitedStates except pursuant to an exemption from, or transactions not subject to, the registration requirements of the Securities Act andin compliance with any applicable state securities laws. The Manager does not intend to conduct a public offering of any securitiesof Keppel-KBS US REIT in the United States. Neither this presentation nor any part thereof may be (a) used or relied upon by anyother party or for any other purpose, (b) copied, photocopied, duplicated or otherwise reproduced in any form or by any means, or(c) forwarded, published, redistributed, passed on or otherwise disseminated or quoted, directly or indirectly, to any other personeither in your organisation or elsewhere.
DBS Bank Ltd. was the sole financial adviser and issue manager for the initial public offering of Keppel-KBS US Real EstateInvestment Trust (the “Offering”). DBS Bank Ltd., Citigroup Global Markets Singapore Pte. Ltd., Credit Suisse (Singapore) Limited andMerrill Lynch (Singapore) Pte. Ltd. were the joint bookrunners and underwriters for the Offering.
1

Table of Contents
1
2
3
4
Transaction Overview
Market Overview
Key Rationale
Merits of Proposed Acquisition
5 Additional Information
1
2
3
4
5
2

SECTION 1 Transaction Overview
Westpark Portfolio, Redmond, Seattle

Agreed value of US$169.4m is lower thanindependent appraisals by Cushman and JLL
Acquisition will be funded with the proceeds from equity fund raising(2), debt financing and internal cash resources
Deepening Seattle Footprint with Maiden Acquisition
Business campus comprising 21 buildings in Redmond, Washington
Located in the supply-constrained Eastside suburban office market of Seattle
Good connectivity to key commercial hubsin Redmond and the Seattle-Bellevue area
Surrounded and supported by excellent amenities and infrastructure
The Westpark Portfolio Transaction Summary
US $169.4m
US $178.0mUS $181.4m
Agreed Value Cushman JLL
4.8% Discount 6.6% Discount
Attractive Discount to Independent Valuations(1)
(1) The Manager has commissioned an independent property valuer, Cushman & Wakefield of Washington, Inc. (“Cushman”), and Perpetual(Asia) Limited, in its capacity as trustee of Keppel-KBS US REIT, has commissioned another independent property valuer, JLL Valuation &Advisory Services, LLC (“JLL”, together with Cushman, the “Independent Valuers”), to value the Westpark Portfolio. Cushman in its reportdated 22 August 2018, stated that the open market value of the Westpark Portfolio is US$178.0 million and JLL in its report dated 20 August2018, stated that the open market value of the Westpark Portfolio is US$181.4 million
(2) Structure of the equity fund raising will be determined by the Manager at a later date, taking into account prevailing market conditions
4
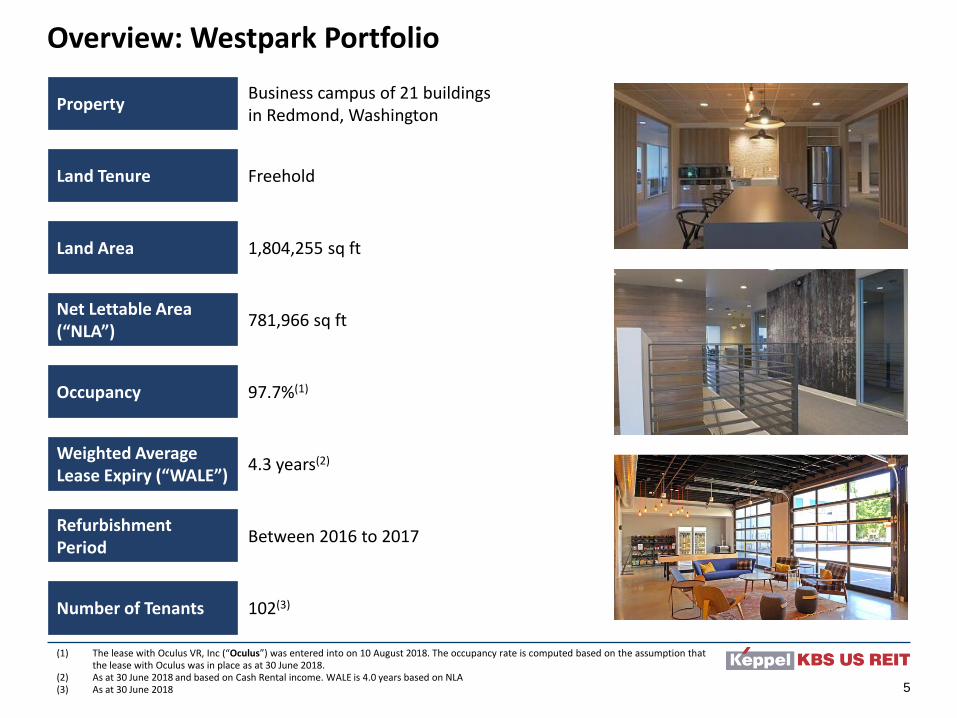
Overview: Westpark Portfolio
PropertyBusiness campus of 21 buildings in Redmond, Washington
Land Tenure Freehold
Land Area 1,804,255 sq ft
Net Lettable Area (“NLA”)
781,966 sq ft
Occupancy 97.7%(1)
Weighted Average Lease Expiry (“WALE”)
4.3 years(2)
Refurbishment Period
Between 2016 to 2017
Number of Tenants 102(3)
(1) The lease with Oculus VR, Inc (“Oculus”) was entered into on 10 August 2018. The occupancy rate is computed based on the assumption thatthe lease with Oculus was in place as at 30 June 2018.
(2) As at 30 June 2018 and based on Cash Rental income. WALE is 4.0 years based on NLA(3) As at 30 June 2018 5

Overview: Westpark Portfolio
Tenant Sector % of CRI (2)
Oculus VR, Inc. Technology 15.6%
Echonous, Inc. Technology 4.6%
Wildlife Computers, Inc. Technology 3.6%
Micronics, Inc. Medical and Healthcare 3.4%
Microsurgical Technology, Inc. Medical and Healthcare 3.4%
Helion Energy, Inc. Technology 3.2%
Majiq, Inc. Technology 3.2%
Xtreme Consulting Group Professional Services 2.8%
Seattle Aero, LLC Engineering 2.4%
Kone Inc. Engineering 1.9%
Total 44.1%
Technology-Centric Tenant Base
More than 30% of portfolio tenants from the high growth technology sector(1)
Large number of professional services tenants provide support services to the technology sector
Top 10 tenants have an average WALE of 5.3 years(1)
Average portfolio WALE of 4.3 years(2)
Professional Services, 38.2%
Finance and Insurance,
1.0%
Others, 16.9%Medical and
Healthcare, 6.8%
Media and Information,
2.3%
Technology, 34.8%
Sectorial Breakdown By NLA
(1) As at 30 June 2018 and based on NLA. Includes leases with Oculus VR, Inc.(2) As at 30 June 2018 and based on Cash Rental Income. Includes leases with Oculus VR, Inc.
6

SECTION 2 Market Overview
Seattle, Washington

Seattle, Washington: The Nation’s Rising Tech Hub
Primary Economic and Cultural Center of Washington
Largest metropolitan area in the Pacific Northwest
Thriving economy driven by rapid growth in the software and IT services sector
Anchored by tech titans such as Microsoft, Amazon and Google
Demand for office space fuelled by positive employment growth and outpaces supply
8

Seattle, Washington: The Nation’s Rising Tech Hub
Healthy employment
growthStrong GMP
growth trends
Young & educated workforce
Macroeconomic Indicators Outpace National Average
(1) According to Cushman & Wakefield Western, Inc. (the “Independent Market Research Consultant”)
• 4.6% (1) in 2017• Consistently above
national average since 2012
• 3.9 million residents in 2017
• 1.3% (1) growth p.a. from 2018 to 2022
• Stable growth of 1.1% (1) p.a. through 2020 in office-using industries
9

SECTION 3 Key Rationale
Westpark Portfolio, Redmond, Seattle

Accretive Acquisition Positioned for Long Term Growth2
Key Rationale
1 Deepen Presence in High Growth Seattle Market
Portfolio Diversification that Enhances Income Resilience3
11

Appeals to technology and professional services tenants due to close proximity to Microsoft World HQand key commercial hubs in Bellevue and Seattle.
Strategic Location with Good Connectivity
1 Deepen Presence in High Growth Seattle Market
Westpark PortfolioRedmond Downtown
Seattle Downtown
Bellevue Downtown
The Plaza Buildings
Bellevue Technology Center
Microsoft World HQ
Legend
Target acquisition
Existing assets
Key commercial areas
Source: Google Maps
12

6%
8%
10%
12%
14%
16%
18%
$25
$27
$29
$31
$33
$35
$37
2008 2009 2010 2011 2012 2013 2014 2015 2016 2017 2018F 2019F 2020F
Vac
ancy
Rat
e (
%)
An
nu
al R
ent
(US$
per
sq
ft)
Historical Average Asking Rent (LHS) Overall Vacancy Rate (RHS)
1 Deepen Presence in High Growth Seattle Market
Strong rental growth in the past 5 years accompanied by improvement in vacancy rate
Positive leasing activity backed by strong interest from technology corporations
Projected rent growth of circa 4% by 2020(1)
Positive Growth Momentum Sustained by Strong Office Fundamentals
Overall Vacancy Rate and Average Asking Rent by Year(1)
Eastside Suburban Office Market, 2008 – 2020F
(1) According to the Independent Market Research Consultant
13

2%
4%
6%
8%
10%
12%
14%
16%
18%
-450
-250
-50
150
350
550
750
950
1,150
2008 2009 2010 2011 2012 2013 2014 2015 2016 2017 2018F 2019F 2020F
Vac
ancy
Rat
e (
%)
Squ
are
Foo
t ('
00
0)
Historical Completions (LHS) Overall Net Absorptions (LHS) Overall Vacancy Rate (RHS)
Completions & Absorptions vs. Vacancy(1)
Eastside Suburban Office Market, 2008 – 2020F
Demand for high quality office space outpaces construction
Slow construction trends will drive prospective tenants to absorb existing spaces
No new office construction planned for Redmond submarket in the immediate future(1)
Positive Growth Momentum Sustained by Strong Office Fundamentals
1 Deepen Presence in High Growth Seattle Market
(1) According to the Independent Market Research Consultant
14

7.8%13.7%
20.9%
9.9% 8.1%
39.6%
7.2%12.0%
17.9%
9.9%7.3%
45.7%
2018 2019 2020 2021 2022 2023 andthereafterNLA CRI
Westpark Portfolio Lease Expiry Profile(1)
100% of leases have built-in rental escalations of 2% to 3% p.a.
Well-Spread Lease Expiry Positioned for Positive Rental Reversion
1 Deepen Presence in High Growth Seattle Market
(1) As at 30 June 2018. The lease expiry profile of the Westpark Portfolio includes the leases with Oculus VR, Inc.
15
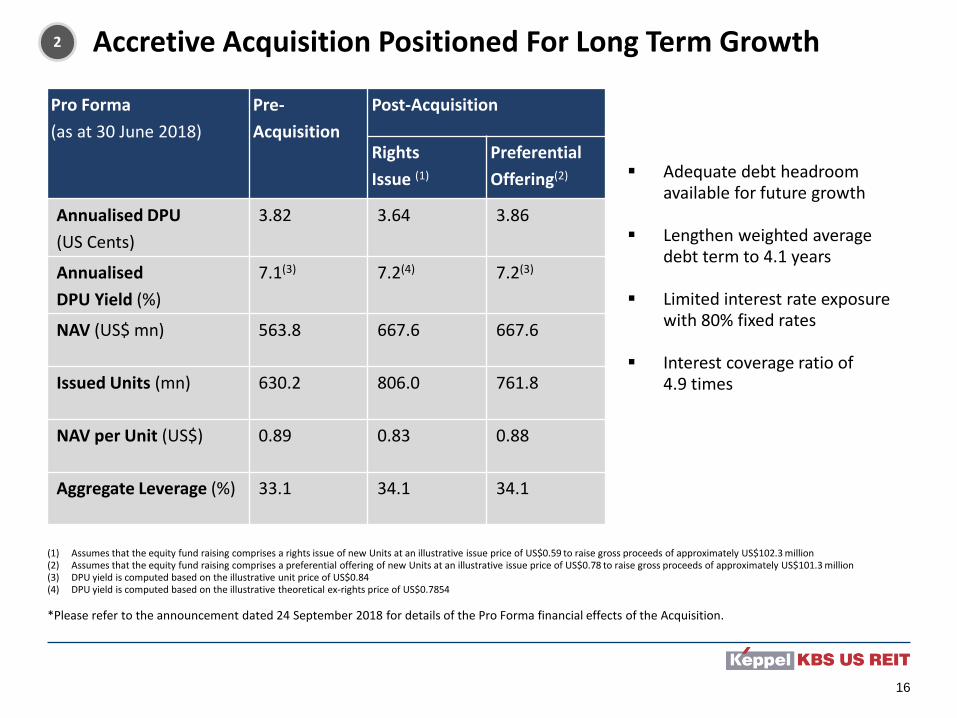
Pro Forma
(as at 30 June 2018)
Pre-
Acquisition
Post-Acquisition
Rights
Issue (1)
Preferential
Offering(2)
Annualised DPU
(US Cents)
3.82 3.64 3.86
Annualised
DPU Yield (%)
7.1(3) 7.2(4) 7.2(3)
NAV (US$ mn) 563.8 667.6 667.6
Issued Units (mn) 630.2 806.0 761.8
NAV per Unit (US$) 0.89 0.83 0.88
Aggregate Leverage (%) 33.1 34.1 34.1
(1) Assumes that the equity fund raising comprises a rights issue of new Units at an illustrative issue price of US$0.59 to raise gross proceeds of approximately US$102.3 million(2) Assumes that the equity fund raising comprises a preferential offering of new Units at an illustrative issue price of US$0.78 to raise gross proceeds of approximately US$101.3 million(3) DPU yield is computed based on the illustrative unit price of US$0.84(4) DPU yield is computed based on the illustrative theoretical ex-rights price of US$0.7854
*Please refer to the announcement dated 24 September 2018 for details of the Pro Forma financial effects of the Acquisition.
2 Accretive Acquisition Positioned For Long Term Growth
Adequate debt headroom available for future growth
Lengthen weighted average debt term to 4.1 years
Limited interest rate exposure with 80% fixed rates
Interest coverage ratio of 4.9 times
16
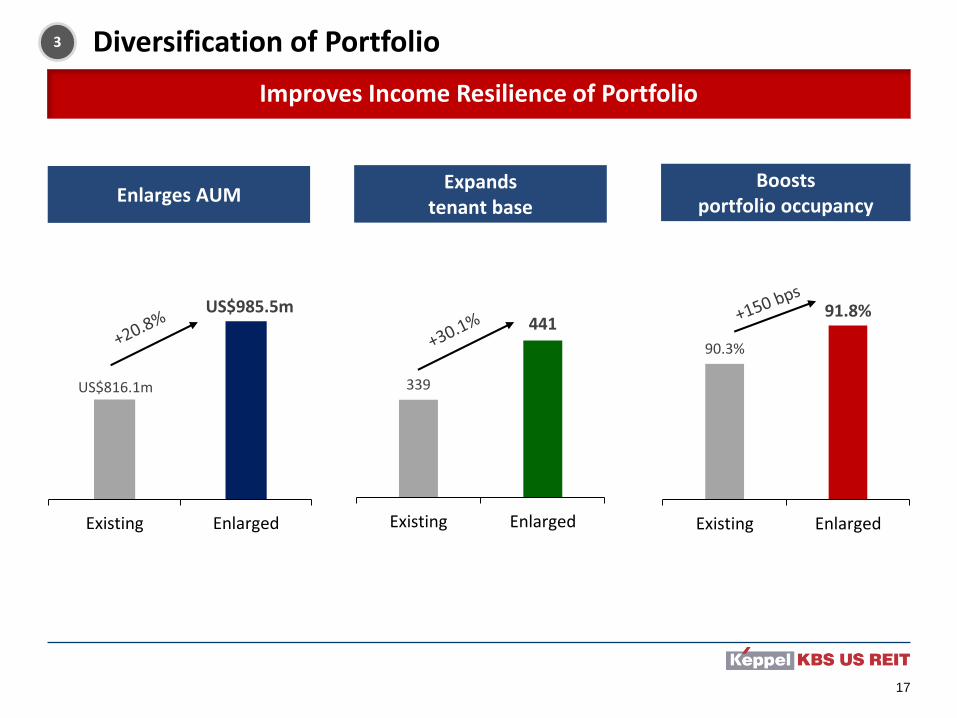
Improves Income Resilience of Portfolio
3 Diversification of Portfolio
US$816.1m
US$985.5m
Existing Enlarged
339
441
Existing Enlarged
Enlarges AUMExpands
tenant base
Boosts portfolio occupancy
90.3%
91.8%
Existing Enlarged
17

All information as at 30 June 2018.(1) Based on Net Lettable Area(2) Top tenant’s CRI contribution based on existing portfolio is 3.6%
Top 10 Tenants of the Enlarged Portfolio Sector Asset % CRI
Ball Aerospace & Tech Corp Professional Services Westmoor Center 3.0%
Oculus VR, Inc. Technology Westpark Portfolio 2.5%
Zimmer Biomet Spine, Inc. Technology Westmoor Center 2.5%
Unigard Insurance Company Finance and Insurance Bellevue Technology Center 2.1%
US Bank National Association Finance and Insurance The Plaza Buildings 2.0%
Blucora, Inc. Technology The Plaza Buildings 1.9%
Health Care Service Corp Finance and Insurance 1800 West Loop South 1.9%
Reed Group, Ltd Finance and Insurance Westmoor Center 1.7%
Regus PLC Professional Services Bellevue Technology Center 1.5%
Nintex USA LLC Technology The Plaza Buildings 1.4%
Total 20.5%
Increases portfolio exposure to high growth technology sector by 3.0%(1)
Increases portfolio WALE(1) to 3.8 years
Top 10 tenants of the enlarged portfolio will now account for 20.5% of CRI instead of 22.8%
Contribution from top tenant is now 3.0% of CRI(2)
Improves Tenant Diversification and Exposure to Tech Sector
3 Diversification of Portfolio
18

SECTION 4 Merits of Proposed Acquisition
Westpark Portfolio, Redmond, Seattle
Merits of Proposed Acquisition
Strategic addition that creates a stronger growth platform
Attractively priced acquisition with potential to benefit from the positive fundamentals in Seattle
Enhances income resilience through portfolio diversification
Creates long term value for Unitholders
20
Westpark Portfolio, Redmond, Seattle
THANK YOU
SECTION 5 Additional Information
Westpark Portfolio, Redmond, Seattle

Existing Portfolio Westpark Portfolio Enlarged Portfolio % Change
NLA (sq ft) 3,225,739 781,966 4,007,705 ▲24.2%
Valuation (US$ million)
816.1 169.4(1) 985.5 ▲20.8%
WALE by NLA (Years)
3.7 4.0 3.8 ▲0.1 years
Number of Tenants 339 102 441 ▲30.1%
Committed Occupancy
90.3% 97.7%(2) 91.8% ▲150bps
Keppel-KBS US REIT: Enlarged Portfolio
Enlarged Portfolio Valuation of US$985.5 million from US$816.1 million
(1) Valuation of the Westpark Portfolio is based on Purchase Consideration of US$169.4 million(2) The committed occupancy rate is computed based on the assumption that the lease with Oculus was in place as at 30 June 2018
23

Lease Expiry Profile
9.1%
15.5% 15.0%16.0%
8.5%
35.9%
9.1%
14.6%16.0% 16.1%
8.6%
35.6%
0.0%
10.0%
20.0%
30.0%
40.0%
2018 2019 2020 2021 2022 2023 andthereafterNLA CRI
Lease Expiry Profile for the Existing Portfolio(1)
8.8%
15.1% 16.3%14.7%
8.4%
36.7%
8.8%14.2%
16.3% 15.1%
8.4%
37.2%
0.0%
10.0%
20.0%
30.0%
40.0%
2018 2019 2020 2021 2022 2023 andthereafterNLA CRI
(1) As at 30 June 2018. The lease expiry profile of the Enlarged Portfolio includes the leases with Oculus VR, Inc.
Well-Spread Lease Expiry Profile
Lease Expiry Profile for the Enlarged Portfolio(1)
24

Portfolio Sector Breakdown
Well-Diversified Tenant Base
Professional Services,
36.4%
Finance and Insurance,
16.6%Others, 13.4%
Medical and Healthcare,
6.1%
Media and Information,
3.2%
Technology, 24.3%
Enlarged Portfolio By NLA
Professional Services,
35.9%
Finance and Insurance,
21.0%
Others, 12.5%
Medical and Healthcare,
5.9%
Media and Information,
3.4%
Technology, 21.3%
Existing Portfolio by NLA
NLA: 4.0 mn sq ftNLA: 3.2 mn sq ft
25
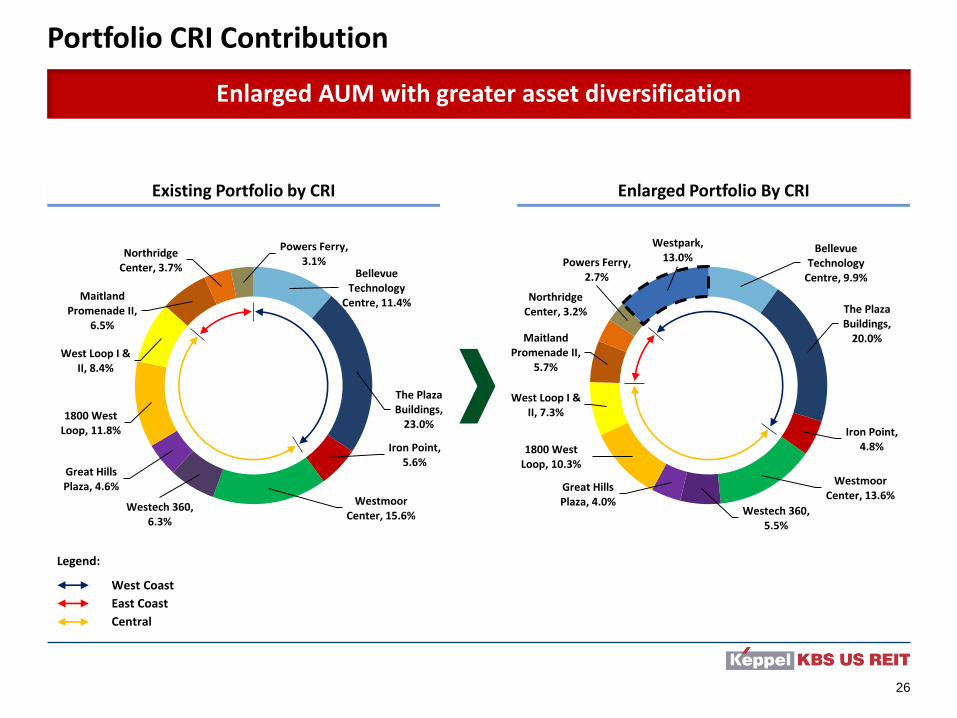
West Coast
East Coast
Central
Legend:
Bellevue Technology
Centre, 9.9%
The Plaza Buildings,
20.0%
Iron Point, 4.8%
Westmoor Center, 13.6%
Westech 360, 5.5%
Great Hills Plaza, 4.0%
1800 West Loop, 10.3%
West Loop I & II, 7.3%
Maitland Promenade II,
5.7%
Northridge Center, 3.2%
Powers Ferry, 2.7%
Westpark, 13.0%
Enlarged Portfolio By CRIExisting Portfolio by CRI
Portfolio CRI Contribution
Enlarged AUM with greater asset diversification
Bellevue Technology
Centre, 11.4%
The Plaza Buildings,
23.0%
Iron Point, 5.6%
Westmoor Center, 15.6%
Westech 360, 6.3%
Great Hills Plaza, 4.6%
1800 West Loop, 11.8%
West Loop I & II, 8.4%
Maitland Promenade II,
6.5%
Northridge Center, 3.7%
Powers Ferry, 3.1%
26

Top 10 Tenants
Tenant Sector Asset % of CRI
Ball Aerospace & Tech Corp Professional Services Westmoor Center 3.6%
Zimmer Biomet Spine, Inc. Technology Westmoor Center 2.9%
Unigard Insurance Company Finance and Insurance Bellevue Technology Center 2.5%
US Bank National Association Finance and Insurance The Plaza Buildings 2.4%
Blucora, Inc. Technology The Plaza Buildings 2.3%
Health Care Service Corp Finance and Insurance 1800 West Loop South 2.2%
Reed Group, Ltd Finance and Insurance Westmoor Center 2.0%
Regus PLC Professional Services Bellevue Technology Center 1.7%
Nintex USA LLC Technology The Plaza Buildings 1.7%
PointMarc LLC Technology The Plaza Buildings 1.5%
Total: 22.8%
Tenant Sector Asset % of CRI
Ball Aerospace & Tech Corp Professional Services Westmoor Center 3.0%
Oculus VR, Inc. Technology Westpark Portfolio 2.5%
Zimmer Biomet Spine, Inc. Technology Westmoor Center 2.5%
Unigard Insurance Company Finance and Insurance Bellevue Technology Center 2.1%
US Bank National Association Finance and Insurance The Plaza Buildings 2.0%
Blucora, Inc. Technology The Plaza Buildings 1.9%
Health Care Service Corp Finance and Insurance 1800 West Loop South 1.9%
Reed Group, LTD Finance and Insurance Westmoor Center 1.7%
Regus PLC Professional Services Bellevue Technology Center 1.5%
Nintex USA, LLC Technology The Plaza Buildings 1.4%
Total: 20.5%
Top 10 Tenants for the Existing Portfolio(1)
Top 10 Tenants for the Enlarged Portfolio(1)
(1) As at 30 June 2018 and includes leases with Oculus VR, Inc for the Enlarged Portfolio.
27