Deepak Nitrite Limited - researchandranking.com€¦ · Deepak Phenolics Ltd Subsidiary 100% Deepak...
25
1 Deepak Nitrite Limited Independent Equity Research Investment Note Equentis Wealth Advisory Services (P) Ltd Registered Office: A-603, Marathon Futurex, N. M. Joshi Marg, Lower Parel, Mumbai, 400013, India Tel: +91 22 61013800 Email: [email protected]
Transcript of Deepak Nitrite Limited - researchandranking.com€¦ · Deepak Phenolics Ltd Subsidiary 100% Deepak...
1
Deepak Nitrite Limited
Independent Equity Research
Investment Note
Equentis Wealth Advisory Services (P) Ltd
Registered Office:
A-603, Marathon Futurex, N. M. Joshi Marg, Lower Parel,
Mumbai, 400013, India
Tel: +91 22 61013800
Email: [email protected]
2
DEEPAK NITRITE LIMITED (DNL)
Disclaimer: This note has been prepared for the first time in November 2019 and is refreshed as and when deemed necessary. We would be tracking our recommended companies on regular basis. Any event update on the company or update in 15-18 months or 5-year target prices would be conveyed to clients accordingly.
I. BACKGROUND & BUSINESS
� Incorporation & Parentage – (Mcap Rs. 47.1bn, ($657mn @ Rs.71.74/$, FY19 Consolidated Revenues Rs. 26bn), Incorporated in 1970, DNL began as a fully indigenous manufacturer of Sodium Nitrite and Sodium Nitrate in Nandesari town in Vadodara district of Gujarat and has gradually widened its product portfolio, enjoying a leading market position in most of its products in the domestic as well as global markets. It has focused on the nitration, hydrogenation, diazotization and chlorination of benzene over the last 50 years. DNL commands a market share of 75% each in Sodium Nitrite, Nitro-Toluene and fuel additives in the domestic market. It is also amongst the top three players globally in Xylidine, Cumidine and Oximes.
� Business Segments – Deepak Nitrite is a multi-product company that manufactures a diversified product portfolio of Basic Chemicals (BC), Fine and Specialty Chemicals (FSC), Performance Products (PP) and Phenol and Acetone. DNL’s growth has been aided by strategic acquisitions of companies with complementary product lines, in the past periods. DNL is the market leader in almost all the products it manufactures. Even though DNL predominantly caters to the domestic markets, it has significant footprint offshore, especially into Europe, USA, Japan, Latin America, South East and Far East Asia. DNL exports its products to over 30 countries across 6 continents through 2 Subsidiaries. DNL is focused on expanding its footprint in high value intermediates.
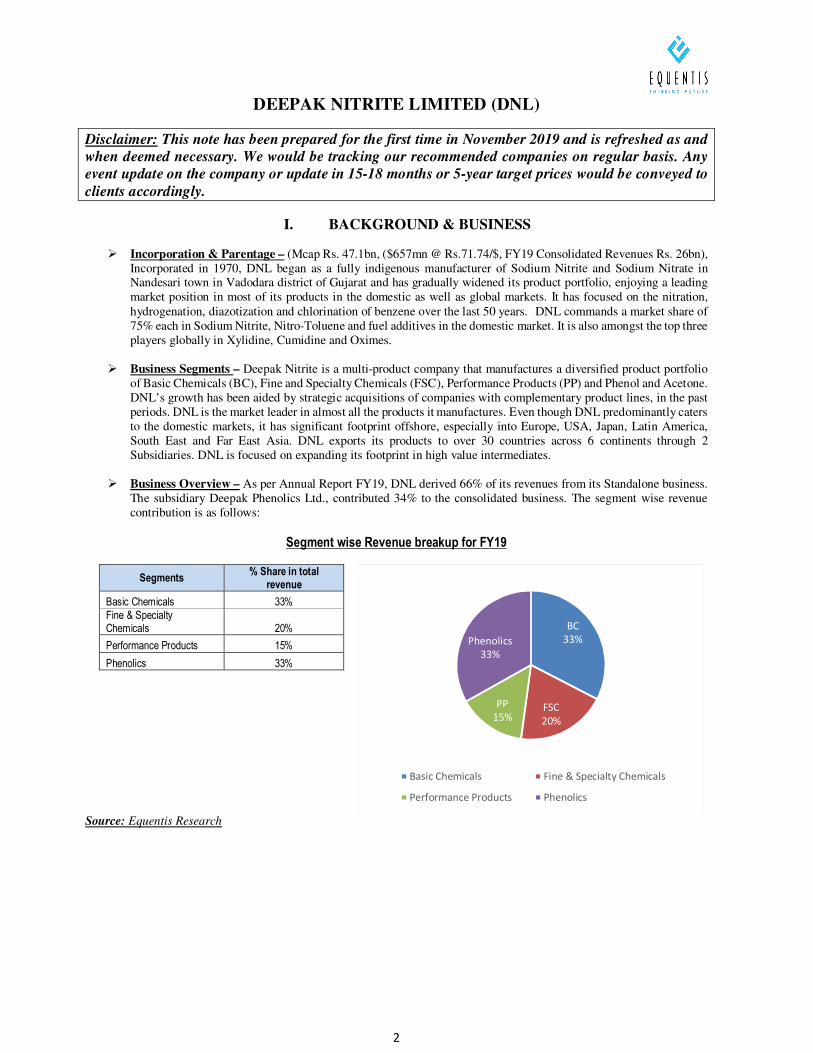
� Business Overview – As per Annual Report FY19, DNL derived 66% of its revenues from its Standalone business.
The subsidiary Deepak Phenolics Ltd., contributed 34% to the consolidated business. The segment wise revenue contribution is as follows:
Segment wise Revenue breakup for FY19
Segments % Share in total
revenue
Basic Chemicals 33%
Fine & Specialty Chemicals 20%
Performance Products 15%
Phenolics 33%
Source: Equentis Research
BC
33%
FSC
20%
PP
15%
Phenolics
33%
Basic Chemicals Fine & Specialty Chemicals
Performance Products Phenolics
3
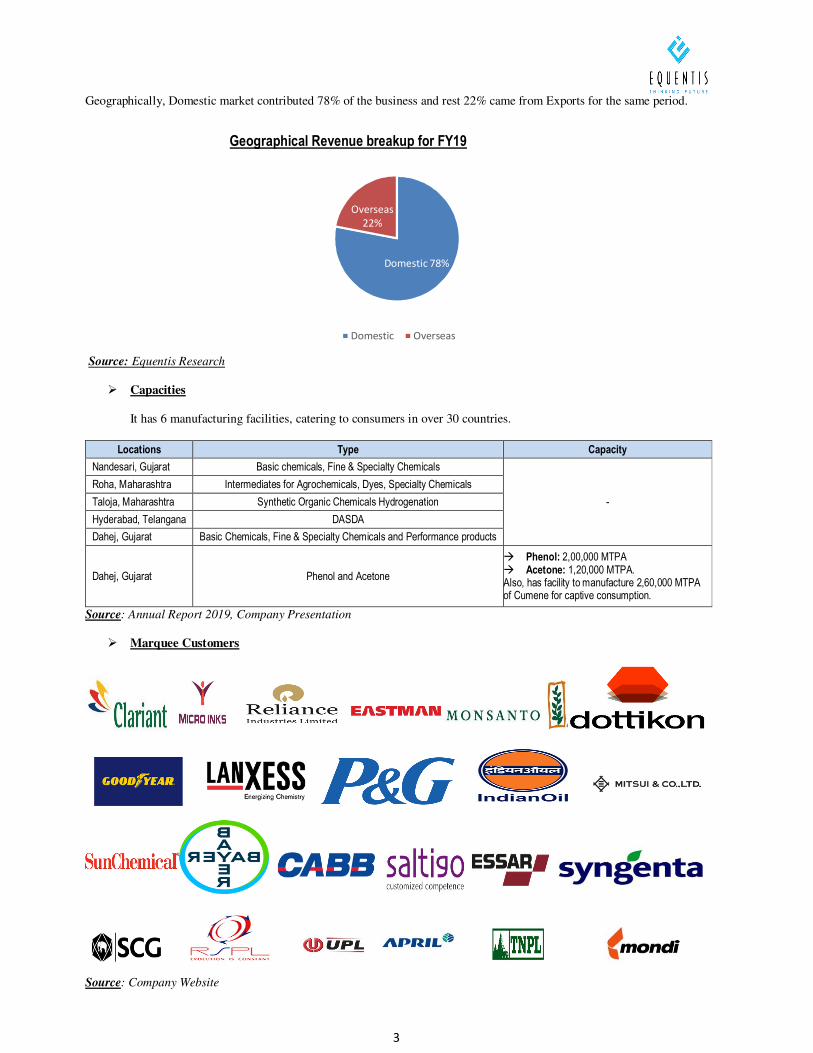
Geographically, Domestic market contributed 78% of the business and rest 22% came from Exports for the same period.
Source: Equentis Research
� Capacities
It has 6 manufacturing facilities, catering to consumers in over 30 countries.
Locations Type Capacity
Nandesari, Gujarat Basic chemicals, Fine & Specialty Chemicals
-
Roha, Maharashtra Intermediates for Agrochemicals, Dyes, Specialty Chemicals
Taloja, Maharashtra Synthetic Organic Chemicals Hydrogenation
Hyderabad, Telangana DASDA
Dahej, Gujarat Basic Chemicals, Fine & Specialty Chemicals and Performance products
Dahej, Gujarat Phenol and Acetone
� Phenol: 2,00,000 MTPA � Acetone: 1,20,000 MTPA. Also, has facility to manufacture 2,60,000 MTPA of Cumene for captive consumption.
Source: Annual Report 2019, Company Presentation
� Marquee Customers
Source: Company Website
Domestic 78%
Overseas
22%
Geographical Revenue breakup for FY19
Domestic Overseas
4
� Subsidiary / Associate Companies – DNL has two wholly owned subsidiaries as explained below:
Name of the Company Type of Subsidiary % Shareholding
Deepak Phenolics Ltd Subsidiary 100%
Deepak Nitrite Corporation Inc. Subsidiary 100%
Source: Annual Report 2019
DNL forayed into Phenol-Acetone production, which is an import substitute through its subsidiary Deepak Phenolics Ltd. DNL had commissioned in November 2018 a plant in Dahej, Gujarat which has capacity to manufacture 2,00,000 and 1,20,000 MTPA of Phenol and Acetone respectively entailing an overall capex of Rs. 1400 crores. In the first few months of commercialization, the plant achieved the highest utilization level of 100%. The operations are expected to standardize at 85% utilization levels going forward.
� Ownership Profile – As on 30th September, 2019, Promoter family and group companies / entities collectively own 45.64% in the company with Nil shares pledged. Institutional holding stands at 25.85% amongst which FII holding stands at 9.40% and DII at 16.45%. Some of the marquee investors in the company are Reliance Small Cap Fund (6.13%), Franklin India Smaller Companies fund (4.16%), Aditya Birla Sun Life Small Cap Fund (2.06%), SBI Magnum Multicap Fund (2.05%), IDFC Sterling Value Fund (3.44%), L&T India Value Fund (2.34%) etc.
� Management Effectiveness- Deepak Nitrite was founded in 1970 by Mr. C. K. Mehta and is currently run by his
son Mr. Deepak Mehta, who is the Chairman and Managing Director. The Group has interests spanning across the entire chemical and fertilizer space in India with total group revenues of $700mn. Mr. Deepak Mehta has been at the helm of company affairs for the past 40 years. He has also been the Chairman of the National Chemicals Committee at FICCI. Board of Directors of the company includes some very eminent persons from the corporate world – namely Mr. Sudhin Choksey (Managing Director of Gruh Finance), Mr. Sudhir Mankad (Retired IAS officer who has served in senior positions with the Government of Gujarat and Government of India) etc. to name a few.
� Financial Performance – A Glimpse –– Over past 3 years (FY16-19) DNL has reported Sales, EBITDA and PAT
CaGR of ~25%, ~36% and 40% respectively. DNL has debt equity ratio at 1.07xs for FY19. Average ROE and ROCE for DNL over past 3 years (FY16-19) has been 11.3% and 10.9% respectively. Also the stock price CaGR for 3 years, 5 years and 10 years stands at 32%, 40% and 55% respectively.
5
II. INVESTMENT THESIS
Recommendation – BUY Internal Rating Score – 3.71 out of 5
15-18M Review Price – Rs. 431 - 462 Upside: 25 - 34%
5yr Review Price - Rs. 688 – 737 Upside: 2.0xs – 2.1xs
ISIN INE288B01029
A. Sector Outlook
Chemical industry is the mainstay of industrial and agricultural development of the country and provides building blocks for several downstream industries such as textiles, papers, paints, soaps, detergents, pharmaceuticals, varnish etc. The global chemical industry has been expanding at a steady pace over the past couple of years. The US was the original home to innovation and production of chemicals and specialty chemicals. The industry then gradually transitioned to Europe, followed by developing countries such as China. In the recent times, Emerging Asian markets have become a new manufacturing hub for global chemical giants largely led by China where chemical sales have increased manifold. Global Economic Scenario:
The International Monetary Fund (IMF) has predicted that over the next decade, reverse globalisation will make the playing field of global economies uneven, resulting in reduced ability to leverage existing competitive advantages. The consequences of escalating trade actions between China and USA has resulted in higher prices in China and the U.S., less purchasing power for consumers in these countries, higher input costs, heightened financial market volatility, and possibly higher interest rates. This is expected to have a ripple effects in integrated markets. Trade tensions, including the imposition of tariffs by large economies, have resulted in a material impact on global commodity markets, leading to trade diversion and widening price differentials among countries. Asia to drive Global Economic Growth:
Asia is seen driving the global economy with economies such as India, Indonesia, Malaysia, China, Philippines, and Turkey leading the way. India is expected to grow at a faster pace than other growing economies in the world, with structural reforms and higher investments driving economic activity. China’s robust economic growth engine seems to have slowed down as it faces pressures such as the trade war with the U.S., a global economic slowdown and a decline in domestic consumption. Indian Economic Scenario and Domestic Chemical Industry:
In 2019, while the first half witnessed strong growth trends, growth in the second half was impacted by a liquidity crisis in the BFSI sector as well as global macro-economic events. Even as growth moderated, India remained the fastest growing large economy in the world. The domestic chemical sector continues to maintain its strong performance trajectory, driven by the increasing competency of Indian players across the globe as disruption in China’s chemical market continues to persist. The basic chemical players stand to benefit from high demand volumes and strong commodity chemical prices globally aiding them to sustain higher margins and higher volumes. Key Growth Enablers:
The chemical industry is expected to be the key contributor and a catalyst in achieving the target of US$ 1 Trillion manufacturing economy by 2028, from the current US$ 380 Billion. With nearly US$ 15 Trillion of Chinese exports in chemicals and plastics subject to US tariffs, India is set to gain market share in the global chemical industry, estimated to be around US$ 4.7 Trillion. Significant opportunities lie ahead for Indian chemical companies arising out of emerging possibilities in US-China trade war as well as shutting down of capacities in China. The domestic industry is also tapping the intermediates opportunity and exploiting meaningful demand. Given the mature market conditions of China, India is expected to be the next engine of growth rendering opportunities to players engaged in the chemical value chain – extending from agrochemicals, dyes, pigments, and specialty chemicals, which sees the strongest tailwinds along with petrochemicals at the same time. Further, Indian chemical companies are enhancing capabilities and investing greater amounts in R&D to elevate their offerings. India continues to gain traction from major countries and is likely to grow multi-fold in the coming decade. Specialty chemical companies have witnessed a sharp increase in demand for their products over the last few years. In the years ahead, the demand for Specialty Chemicals is expected to grow in line with gains in the industrial and construction sectors. Specialty chemical players, with presence across the value chain, have observed significant improvement in their operating margins. Future Industry Outlook:
The Indian chemical industry is 3rd largest producer in Asia and 6th largest by output in the world. It covers more than 80,000 commercial products. The sector has now moved from commodity based (sourcing of raw/refined chemicals) to need based (manufactured as per needs) and the industry is collaborating with manufacturers to create value-based products. However, there is a greater need to invest in technology platforms, R&D, and IPR, in order to differentiate, create greater customer value, and develop strategic partnerships with customers.
6
India is an ideal destination for Chemical manufacturing. Development of strong Intellectual Property regime backed by R&D focus is picking up pace, development of infrastructure is being made to enable chemical and manufacturing industry – warehouses, waste management facilities, ports etc. A complete revamp of the current Petroleum, Chemicals & Petrochemicals Investment Regions (PCPIRs) policy will encourage effective and long-term investments in the sector and boost margins for Indian chemical players. Currently, roughly 50% of the country’s demand for Poly Vinyl Chloride (PVC) is being met by imports. The current per capita consumption of chemicals is very low at 1/10th of global average. This is expected to increase in the coming decade with India’s expanding middle class creating an unparalleled end-user market. Further, China’s excessive restrictions on its chemicals industry has already made MNCs start thinking about India as an alternate source, resulting in rapid flow of foreign direct Investment (FDI) into India. With nearly US$ 15 Trillion of Chinese exports in chemicals and plastics subject to US tariffs, India is set to gain market share in the global chemical industry, estimated to be around US$ 4.7 Trillion. Significant opportunities lie ahead for Indian chemical companies arising out of emerging possibilities in US-China trade war as well as shutting down of capacities in China. We believe this could lead to consolidation and improve the operating efficiency of the fragmented Indian industry. Snapshot of Indian Chemical industry:
India’s Chemical industry is majorly broken down in the following categories:
Sr. No Segments Comprises of
1 Base Chemicals Petrochemicals, man-made fibres, industrial gases, fertilisers, chlor-alkali, other organic & inorganic chemicals.
2 Specialty Chemicals
Dyes and pigments, leather chemicals, construction chemicals, personal care ingredients & other specialty chemicals.
3 Pharmaceuticals Active Pharmaceutical Ingredients (APIs) & formulations.
4 Agrochemicals Insecticides, herbicides, fungicides & other crop protection chemicals.
5 Biotechnology Bio-pharma, bio-agri, bio-services & bio-industrial products
B. Detailed understanding on Business segments of DNL:
Broadly, the business segments of DNL can be categorized into 4 major segments:
Segments Description Product Portfolio User Industries
Basic Chemicals High volume and low margin products
Nitrites, Nitro Toluidines, Fuel Additives
Colorants, Rubber Chemicals, Explosives, Dyes, Pigments, Food Colors, Pharmaceuticals, Petrol and Diesel Blending and Agrochemicals.
Fine & Specialty Chemicals
Low volumes and high margin niche products that are customized to
specific customer requirements.
Specialty Chemicals like Xylidines, Oximes, Cumidines etc.
Agro Chemicals, Colorants, Pigments, Pharmaceuticals and personal wellness.
Performance Products
Only fully integrated manufacturer of OBA in the world with vertical integration from toluene to para nitro toluene (PNT) and further into DASDA and OBA.
Optical Brightening Agent (OBA) and its raw material Diamino Stilbene Disulfonic Acid (DASDA).
Paper, Detergents and textiles
Phenol & Acetone
� Phenol is a versatile industrial organic chemical used to produce a wide variety of chemical intermediates.
� Acetone is predominantly used in the production of pharmaceuticals. It is also a co-product of the phenol manufacturing process.
Phenol, Acetone and their derivatives
� Phenol: Laminates, paints, auto lining, adhesive.
� Acetone: Healthcare, paint, acrylic, inks.
Source: Company Website
I) Basic Chemicals (BC) Segment: Strong Entry barriers and to benefit from China’s environmental issues
� BC is a commoditized segment which is characterized by high volumes and moderate margins. BC can be further classified in organic chemicals such as nitro toluene, ortho toluene and inorganic chemicals such as sodium nitrites and sodium nitrates.
� Sodium Nitrite: Sodium Nitrite is the intermediary used in dyes/pigments, pharma, food colorants, electroplating and specialty chemicals. Raw materials used consists of caustic soda and ammonia. DNL commands a market share of 75% in this segment. Nitro Toluene: Nitro Toluene are used as an intermediary in colorants, rubber chemicals, dyes, agrochemicals, explosives etc. Nitro Toluene is prepared by nitration of toluene. Para Nitro Toluene, Meta Nitro Toluene and Ortho
7
Nitro Toluene are by-products produces by nitration of toluene. DNL uses Para Nitro Toluene produced in the process into forward integration for performance product DASDA. Fuel Additives: Fuel additives are compounds formulated to enhance the quality and efficiency of fuels. Fuel Additives act as anti-oxidizing agents and are useful in the improvement of cetane thereby reducing emissions, and improving the overall quality of different types of fuels like gasoline, diesel, aviation turbine fuel and lubricants.
� Cost leadership is the foremost competitive advantage required to drive growth and profitability in this segment as these chemicals are high-margin high-volume products with greater price sensitivity.
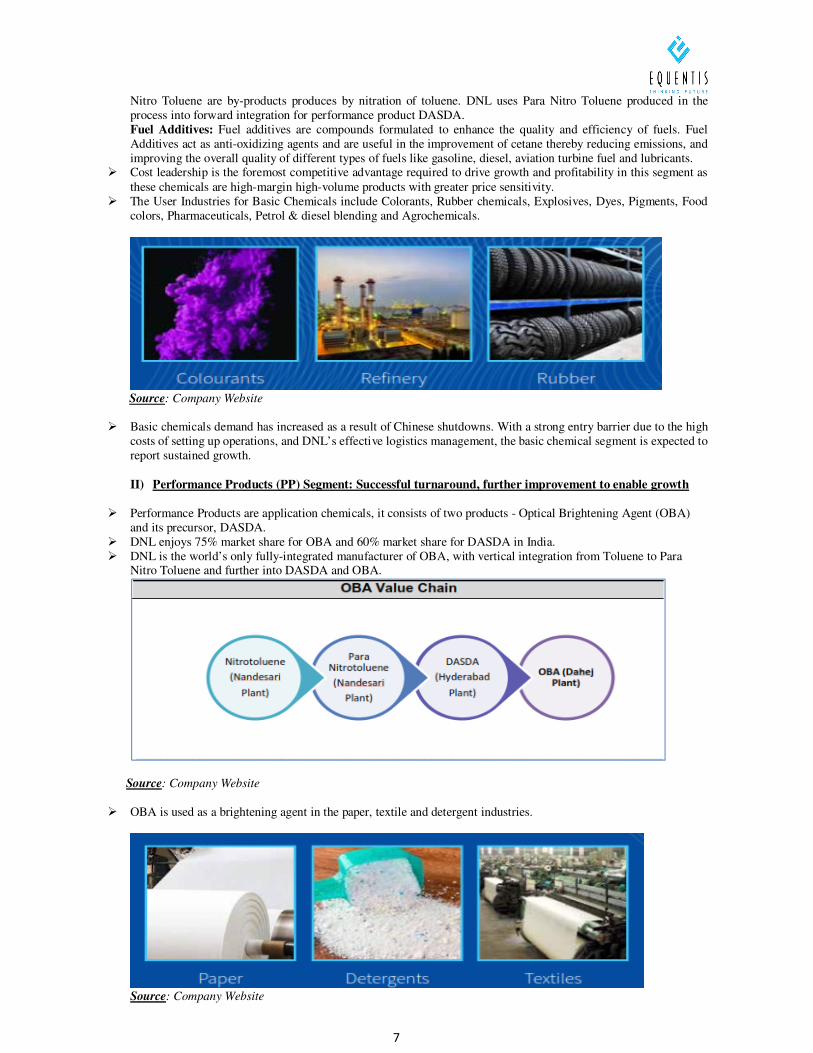
� The User Industries for Basic Chemicals include Colorants, Rubber chemicals, Explosives, Dyes, Pigments, Food colors, Pharmaceuticals, Petrol & diesel blending and Agrochemicals.
Source: Company Website
� Basic chemicals demand has increased as a result of Chinese shutdowns. With a strong entry barrier due to the high costs of setting up operations, and DNL’s effective logistics management, the basic chemical segment is expected to report sustained growth.
II) Performance Products (PP) Segment: Successful turnaround, further improvement to enable growth
� Performance Products are application chemicals, it consists of two products - Optical Brightening Agent (OBA) and its precursor, DASDA.
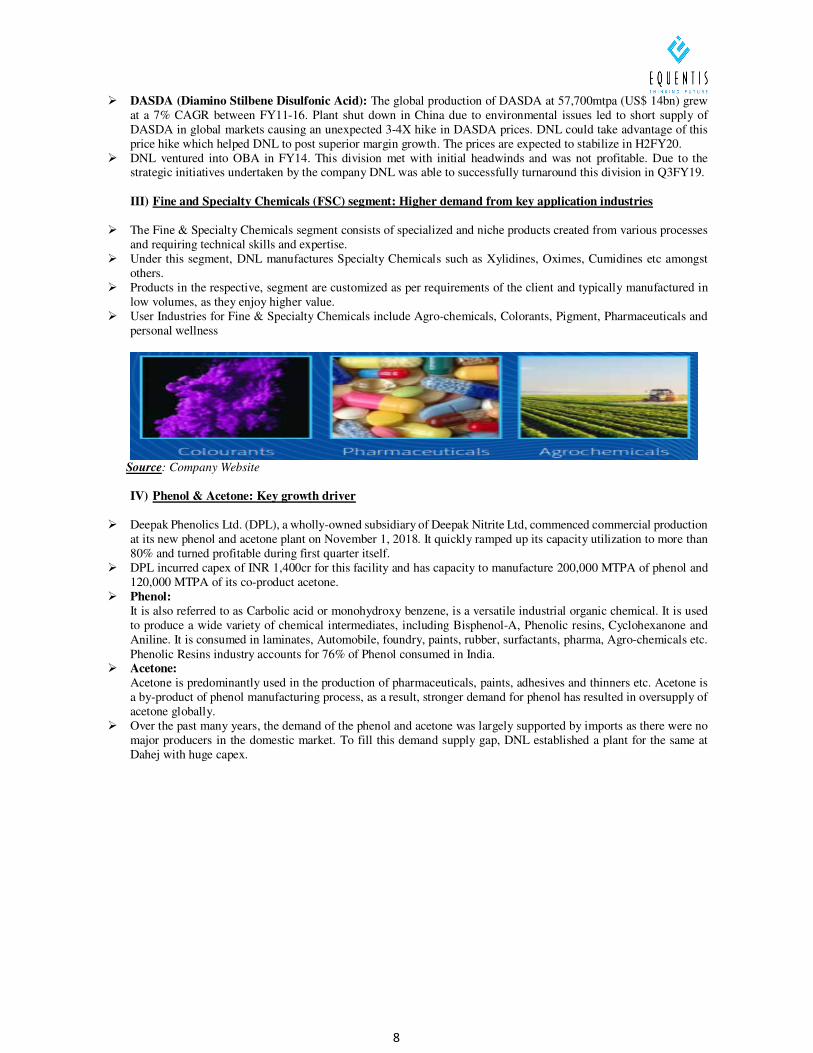
� DNL enjoys 75% market share for OBA and 60% market share for DASDA in India. � DNL is the world’s only fully-integrated manufacturer of OBA, with vertical integration from Toluene to Para
Nitro Toluene and further into DASDA and OBA.
Source: Company Website
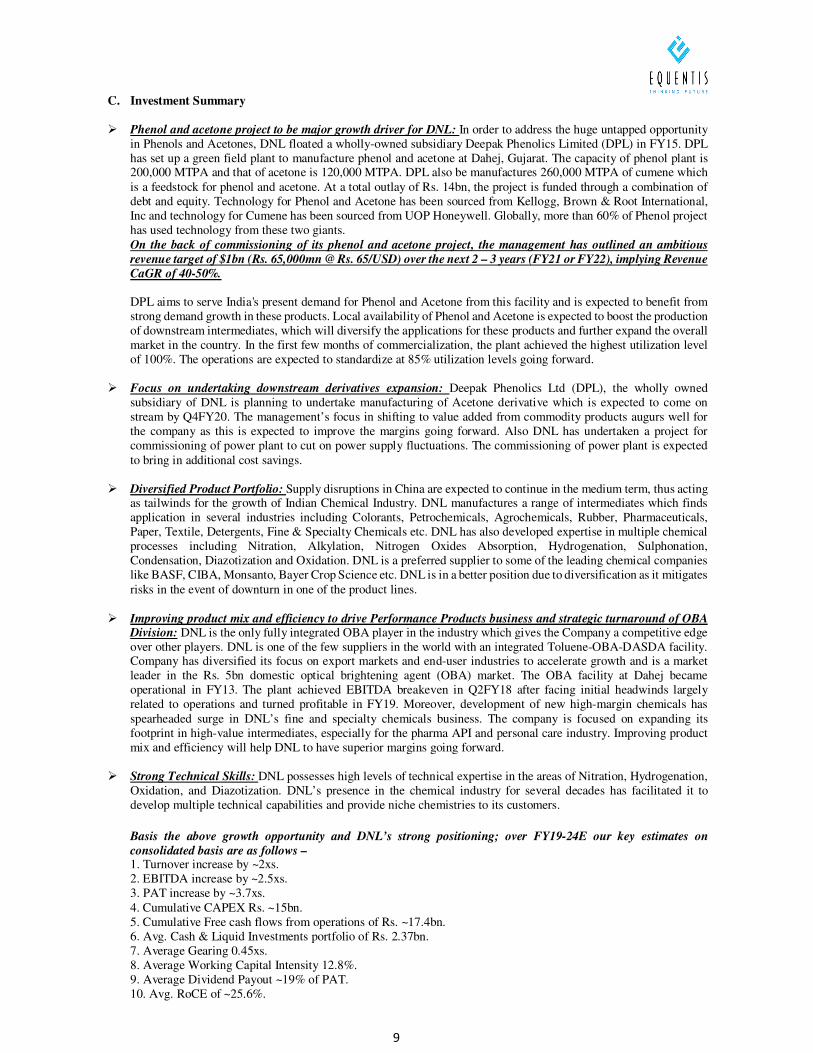
� OBA is used as a brightening agent in the paper, textile and detergent industries.
Source: Company Website
8
� DASDA (Diamino Stilbene Disulfonic Acid): The global production of DASDA at 57,700mtpa (US$ 14bn) grew at a 7% CAGR between FY11-16. Plant shut down in China due to environmental issues led to short supply of DASDA in global markets causing an unexpected 3-4X hike in DASDA prices. DNL could take advantage of this price hike which helped DNL to post superior margin growth. The prices are expected to stabilize in H2FY20.
� DNL ventured into OBA in FY14. This division met with initial headwinds and was not profitable. Due to the strategic initiatives undertaken by the company DNL was able to successfully turnaround this division in Q3FY19.
III) Fine and Specialty Chemicals (FSC) segment: Higher demand from key application industries
� The Fine & Specialty Chemicals segment consists of specialized and niche products created from various processes and requiring technical skills and expertise.
� Under this segment, DNL manufactures Specialty Chemicals such as Xylidines, Oximes, Cumidines etc amongst others.
� Products in the respective, segment are customized as per requirements of the client and typically manufactured in low volumes, as they enjoy higher value.
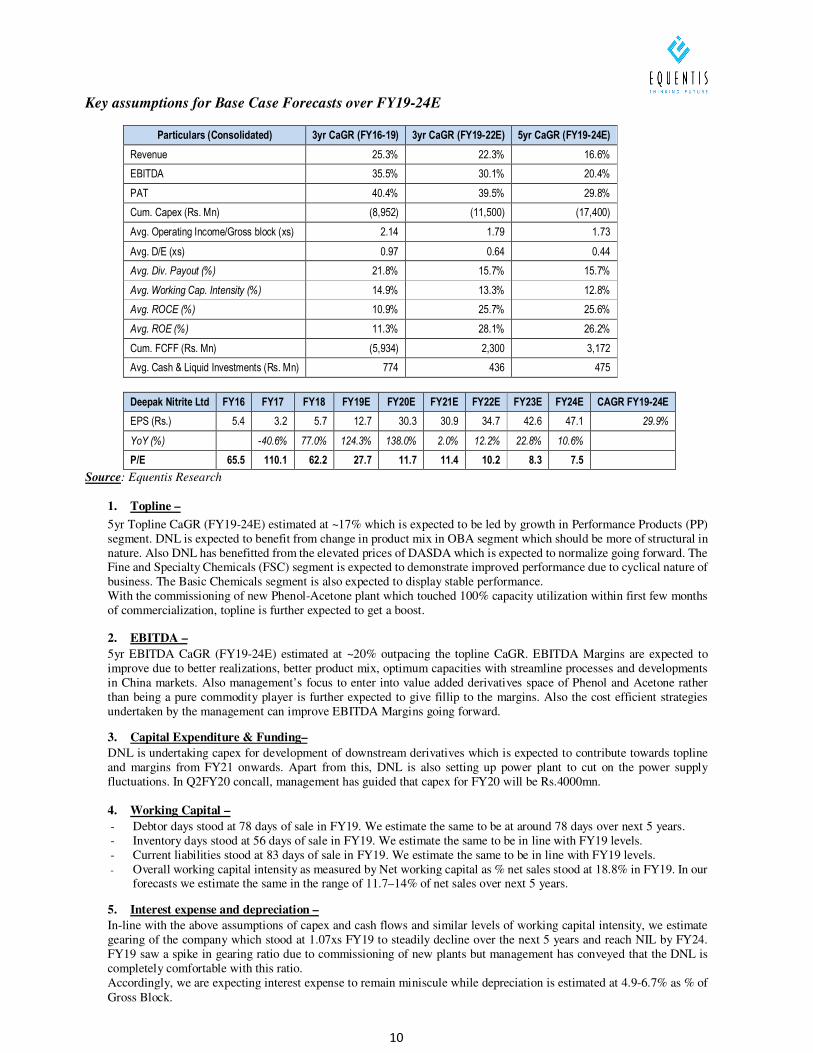
� User Industries for Fine & Specialty Chemicals include Agro-chemicals, Colorants, Pigment, Pharmaceuticals and personal wellness
Source: Company Website
IV) Phenol & Acetone: Key growth driver
� Deepak Phenolics Ltd. (DPL), a wholly-owned subsidiary of Deepak Nitrite Ltd, commenced commercial production at its new phenol and acetone plant on November 1, 2018. It quickly ramped up its capacity utilization to more than 80% and turned profitable during first quarter itself.
� DPL incurred capex of INR 1,400cr for this facility and has capacity to manufacture 200,000 MTPA of phenol and 120,000 MTPA of its co-product acetone.
� Phenol:
It is also referred to as Carbolic acid or monohydroxy benzene, is a versatile industrial organic chemical. It is used to produce a wide variety of chemical intermediates, including Bisphenol-A, Phenolic resins, Cyclohexanone and Aniline. It is consumed in laminates, Automobile, foundry, paints, rubber, surfactants, pharma, Agro-chemicals etc. Phenolic Resins industry accounts for 76% of Phenol consumed in India.
� Acetone:
Acetone is predominantly used in the production of pharmaceuticals, paints, adhesives and thinners etc. Acetone is a by-product of phenol manufacturing process, as a result, stronger demand for phenol has resulted in oversupply of acetone globally.
� Over the past many years, the demand of the phenol and acetone was largely supported by imports as there were no major producers in the domestic market. To fill this demand supply gap, DNL established a plant for the same at Dahej with huge capex.
9
C. Investment Summary
� Phenol and acetone project to be major growth driver for DNL: In order to address the huge untapped opportunity in Phenols and Acetones, DNL floated a wholly-owned subsidiary Deepak Phenolics Limited (DPL) in FY15. DPL has set up a green field plant to manufacture phenol and acetone at Dahej, Gujarat. The capacity of phenol plant is 200,000 MTPA and that of acetone is 120,000 MTPA. DPL also be manufactures 260,000 MTPA of cumene which is a feedstock for phenol and acetone. At a total outlay of Rs. 14bn, the project is funded through a combination of debt and equity. Technology for Phenol and Acetone has been sourced from Kellogg, Brown & Root International, Inc and technology for Cumene has been sourced from UOP Honeywell. Globally, more than 60% of Phenol project has used technology from these two giants. On the back of commissioning of its phenol and acetone project, the management has outlined an ambitious revenue target of $1bn (Rs. 65,000mn @ Rs. 65/USD) over the next 2 – 3 years (FY21 or FY22), implying Revenue CaGR of 40-50%. DPL aims to serve India's present demand for Phenol and Acetone from this facility and is expected to benefit from strong demand growth in these products. Local availability of Phenol and Acetone is expected to boost the production of downstream intermediates, which will diversify the applications for these products and further expand the overall market in the country. In the first few months of commercialization, the plant achieved the highest utilization level of 100%. The operations are expected to standardize at 85% utilization levels going forward.
� Focus on undertaking downstream derivatives expansion: Deepak Phenolics Ltd (DPL), the wholly owned subsidiary of DNL is planning to undertake manufacturing of Acetone derivative which is expected to come on stream by Q4FY20. The management’s focus in shifting to value added from commodity products augurs well for the company as this is expected to improve the margins going forward. Also DNL has undertaken a project for commissioning of power plant to cut on power supply fluctuations. The commissioning of power plant is expected to bring in additional cost savings.
� Diversified Product Portfolio: Supply disruptions in China are expected to continue in the medium term, thus acting as tailwinds for the growth of Indian Chemical Industry. DNL manufactures a range of intermediates which finds application in several industries including Colorants, Petrochemicals, Agrochemicals, Rubber, Pharmaceuticals, Paper, Textile, Detergents, Fine & Specialty Chemicals etc. DNL has also developed expertise in multiple chemical processes including Nitration, Alkylation, Nitrogen Oxides Absorption, Hydrogenation, Sulphonation, Condensation, Diazotization and Oxidation. DNL is a preferred supplier to some of the leading chemical companies like BASF, CIBA, Monsanto, Bayer Crop Science etc. DNL is in a better position due to diversification as it mitigates risks in the event of downturn in one of the product lines.
� Improving product mix and efficiency to drive Performance Products business and strategic turnaround of OBA
Division: DNL is the only fully integrated OBA player in the industry which gives the Company a competitive edge over other players. DNL is one of the few suppliers in the world with an integrated Toluene-OBA-DASDA facility. Company has diversified its focus on export markets and end-user industries to accelerate growth and is a market leader in the Rs. 5bn domestic optical brightening agent (OBA) market. The OBA facility at Dahej became operational in FY13. The plant achieved EBITDA breakeven in Q2FY18 after facing initial headwinds largely related to operations and turned profitable in FY19. Moreover, development of new high-margin chemicals has spearheaded surge in DNL’s fine and specialty chemicals business. The company is focused on expanding its footprint in high-value intermediates, especially for the pharma API and personal care industry. Improving product mix and efficiency will help DNL to have superior margins going forward.
� Strong Technical Skills: DNL possesses high levels of technical expertise in the areas of Nitration, Hydrogenation,
Oxidation, and Diazotization. DNL’s presence in the chemical industry for several decades has facilitated it to develop multiple technical capabilities and provide niche chemistries to its customers.
Basis the above growth opportunity and DNL’s strong positioning; over FY19-24E our key estimates on consolidated basis are as follows – 1. Turnover increase by ~2xs. 2. EBITDA increase by ~2.5xs. 3. PAT increase by ~3.7xs. 4. Cumulative CAPEX Rs. ~15bn. 5. Cumulative Free cash flows from operations of Rs. ~17.4bn. 6. Avg. Cash & Liquid Investments portfolio of Rs. 2.37bn. 7. Average Gearing 0.45xs. 8. Average Working Capital Intensity 12.8%. 9. Average Dividend Payout ~19% of PAT. 10. Avg. RoCE of ~25.6%.
10
Key assumptions for Base Case Forecasts over FY19-24E
Particulars (Consolidated) 3yr CaGR (FY16-19) 3yr CaGR (FY19-22E) 5yr CaGR (FY19-24E)
Revenue 25.3% 22.3% 16.6%
EBITDA 35.5% 30.1% 20.4%
PAT 40.4% 39.5% 29.8%
Cum. Capex (Rs. Mn) (8,952) (11,500) (17,400)
Avg. Operating Income/Gross block (xs) 2.14 1.79 1.73
Avg. D/E (xs) 0.97 0.64 0.44
Avg. Div. Payout (%) 21.8% 15.7% 15.7%
Avg. Working Cap. Intensity (%) 14.9% 13.3% 12.8%
Avg. ROCE (%) 10.9% 25.7% 25.6%
Avg. ROE (%) 11.3% 28.1% 26.2%
Cum. FCFF (Rs. Mn) (5,934) 2,300 3,172
Avg. Cash & Liquid Investments (Rs. Mn) 774 436 475
Deepak Nitrite Ltd FY16 FY17 FY18 FY19E FY20E FY21E FY22E FY23E FY24E CAGR FY19-24E
EPS (Rs.) 5.4 3.2 5.7 12.7 30.3 30.9 34.7 42.6 47.1 29.9%
YoY (%) -40.6% 77.0% 124.3% 138.0% 2.0% 12.2% 22.8% 10.6%
P/E 65.5 110.1 62.2 27.7 11.7 11.4 10.2 8.3 7.5
Source: Equentis Research
1. Topline –
5yr Topline CaGR (FY19-24E) estimated at ~17% which is expected to be led by growth in Performance Products (PP) segment. DNL is expected to benefit from change in product mix in OBA segment which should be more of structural in nature. Also DNL has benefitted from the elevated prices of DASDA which is expected to normalize going forward. The Fine and Specialty Chemicals (FSC) segment is expected to demonstrate improved performance due to cyclical nature of business. The Basic Chemicals segment is also expected to display stable performance. With the commissioning of new Phenol-Acetone plant which touched 100% capacity utilization within first few months of commercialization, topline is further expected to get a boost.
2. EBITDA –
5yr EBITDA CaGR (FY19-24E) estimated at ~20% outpacing the topline CaGR. EBITDA Margins are expected to improve due to better realizations, better product mix, optimum capacities with streamline processes and developments in China markets. Also management’s focus to enter into value added derivatives space of Phenol and Acetone rather than being a pure commodity player is further expected to give fillip to the margins. Also the cost efficient strategies undertaken by the management can improve EBITDA Margins going forward.
3. Capital Expenditure & Funding–
DNL is undertaking capex for development of downstream derivatives which is expected to contribute towards topline and margins from FY21 onwards. Apart from this, DNL is also setting up power plant to cut on the power supply fluctuations. In Q2FY20 concall, management has guided that capex for FY20 will be Rs.4000mn. 4. Working Capital –
- Debtor days stood at 78 days of sale in FY19. We estimate the same to be at around 78 days over next 5 years. - Inventory days stood at 56 days of sale in FY19. We estimate the same to be in line with FY19 levels. - Current liabilities stood at 83 days of sale in FY19. We estimate the same to be in line with FY19 levels. - Overall working capital intensity as measured by Net working capital as % net sales stood at 18.8% in FY19. In our
forecasts we estimate the same in the range of 11.7–14% of net sales over next 5 years.
5. Interest expense and depreciation –
In-line with the above assumptions of capex and cash flows and similar levels of working capital intensity, we estimate gearing of the company which stood at 1.07xs FY19 to steadily decline over the next 5 years and reach NIL by FY24. FY19 saw a spike in gearing ratio due to commissioning of new plants but management has conveyed that the DNL is completely comfortable with this ratio. Accordingly, we are expecting interest expense to remain miniscule while depreciation is estimated at 4.9-6.7% as % of Gross Block.
11
6. Tax Rates –
Tax as % of PBT stood at 35.2% in FY19. With the slashing of Corporate tax to 25.17% benefit is expected to accrue to DNL as it will improve profitability and will have positive impact on EPS.
7. Non-op income & expenditure –
We have assumed nominal non-op income at Rs. 150mn in line with the past. There is no non-op expense assumed. Our sense is that management will utilize cash for growth opportunities rather than investing in treasury.
8. Share count –
Has been assumed at current levels of 136mn shares. DNL in January 2018 had come up Qualified Institutional Placement (QIP) funding to complete a key portion of the equity for the new Phenol Acetone project. QIP saw participation from marquee domestic institutional investors such as ICICI Lombard General Insurance Company, Birla Sun Life Insurance Company, Reliance Mutual Fund, Birla Mutual Fund, ICICI Prudential Mutual Fund, IDFC Mutual Fund & L&T Mutual Fund
9. PAT CaGR –
Based on the assumptions, we estimate PAT CaGR of ~27.4% over our forecasted period of FY19-24E. There could be upside risks to our estimates on PAT CaGR led by EBITDA Margins higher than our estimates. 10. Dividend Pay-out –
Dividend as % of PAT stood at ~19% in FY19. We estimate the same to be at around 19% over next 5 years. 11. Return ratios –
Based on the above assumptions, we estimate average ROA in next 5 years to be 16.3% and with EBITDA margin expected to improve, average RoCE is expected to be ~27.2% in 5 years. 12. Other BS items –
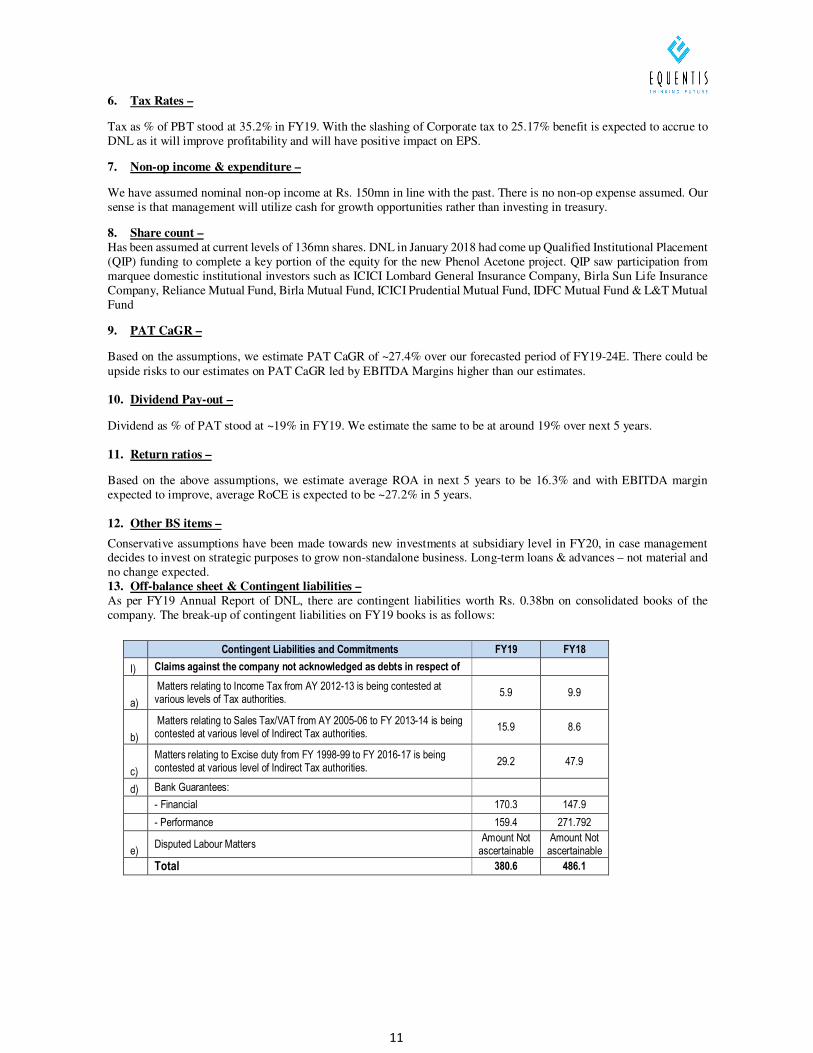
Conservative assumptions have been made towards new investments at subsidiary level in FY20, in case management decides to invest on strategic purposes to grow non-standalone business. Long-term loans & advances – not material and no change expected. 13. Off-balance sheet & Contingent liabilities –
As per FY19 Annual Report of DNL, there are contingent liabilities worth Rs. 0.38bn on consolidated books of the company. The break-up of contingent liabilities on FY19 books is as follows:
Contingent Liabilities and Commitments FY19 FY18
I) Claims against the company not acknowledged as debts in respect of
a)
Matters relating to Income Tax from AY 2012-13 is being contested at various levels of Tax authorities.
5.9 9.9
b)
Matters relating to Sales Tax/VAT from AY 2005-06 to FY 2013-14 is being contested at various level of Indirect Tax authorities.
15.9 8.6
c)
Matters relating to Excise duty from FY 1998-99 to FY 2016-17 is being contested at various level of Indirect Tax authorities.
29.2 47.9
d) Bank Guarantees:
- Financial 170.3 147.9
- Performance 159.4 271.792
e) Disputed Labour Matters
Amount Not ascertainable
Amount Not ascertainable
Total 380.6 486.1
12
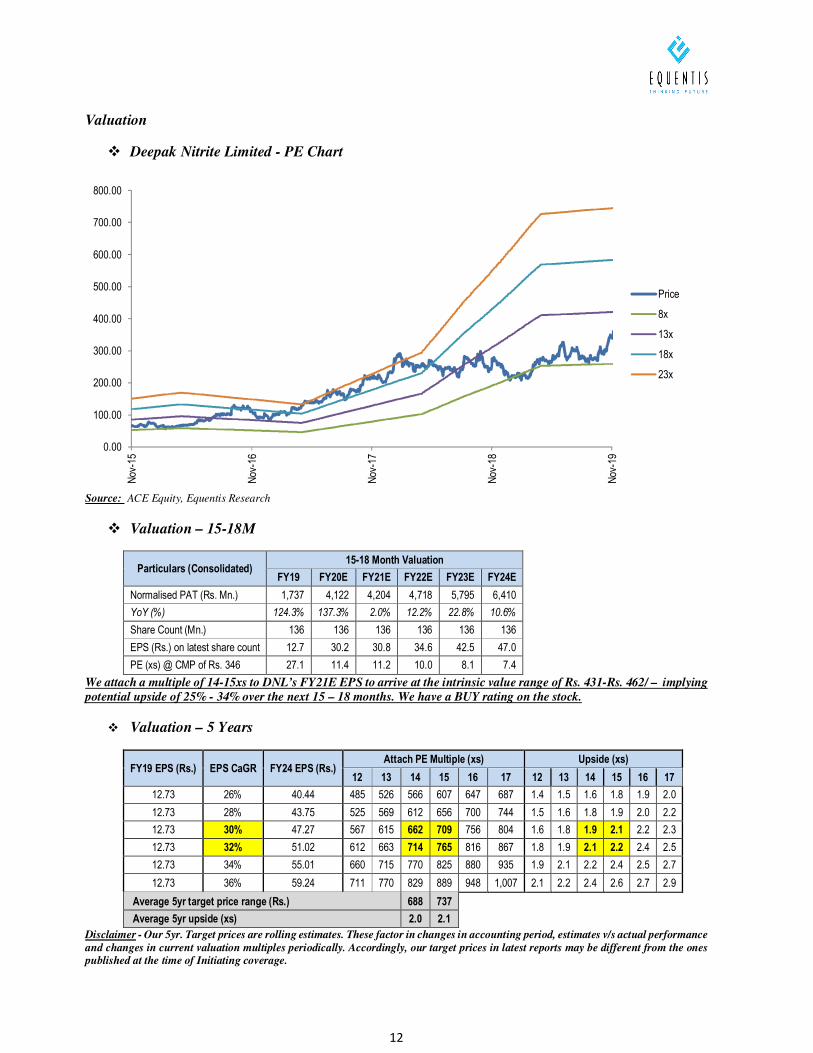
Valuation
� Deepak Nitrite Limited - PE Chart
Source: ACE Equity, Equentis Research
� Valuation – 15-18M
Particulars (Consolidated) 15-18 Month Valuation
FY19 FY20E FY21E FY22E FY23E FY24E
Normalised PAT (Rs. Mn.) 1,737 4,122 4,204 4,718 5,795 6,410
YoY (%) 124.3% 137.3% 2.0% 12.2% 22.8% 10.6%
Share Count (Mn.) 136 136 136 136 136 136
EPS (Rs.) on latest share count 12.7 30.2 30.8 34.6 42.5 47.0
PE (xs) @ CMP of Rs. 346 27.1 11.4 11.2 10.0 8.1 7.4
We attach a multiple of 14-15xs to DNL’s FY21E EPS to arrive at the intrinsic value range of Rs. 431-Rs. 462/ – implying potential upside of 25% - 34% over the next 15 – 18 months. We have a BUY rating on the stock.
� Valuation – 5 Years
FY19 EPS (Rs.) EPS CaGR FY24 EPS (Rs.) Attach PE Multiple (xs) Upside (xs)
12 13 14 15 16 17 12 13 14 15 16 17
12.73 26% 40.44 485 526 566 607 647 687 1.4 1.5 1.6 1.8 1.9 2.0
12.73 28% 43.75 525 569 612 656 700 744 1.5 1.6 1.8 1.9 2.0 2.2
12.73 30% 47.27 567 615 662 709 756 804 1.6 1.8 1.9 2.1 2.2 2.3
12.73 32% 51.02 612 663 714 765 816 867 1.8 1.9 2.1 2.2 2.4 2.5
12.73 34% 55.01 660 715 770 825 880 935 1.9 2.1 2.2 2.4 2.5 2.7
12.73 36% 59.24 711 770 829 889 948 1,007 2.1 2.2 2.4 2.6 2.7 2.9
Average 5yr target price range (Rs.) 688 737
Average 5yr upside (xs) 2.0 2.1
Disclaimer - Our 5yr. Target prices are rolling estimates. These factor in changes in accounting period, estimates v/s actual performance and changes in current valuation multiples periodically. Accordingly, our target prices in latest reports may be different from the ones published at the time of Initiating coverage.
0.00
100.00
200.00
300.00
400.00
500.00
600.00
700.00
800.00
Nov
-15
Nov
-16
Nov
-17
Nov
-18
Nov
-19
Price
8x
13x
18x
23x
13
Recommendation
DNL is favorably positioned to capture opportunities emerging across the chemicals and specialty chemicals landscape. The Greenfield project of the Company for manufacture of Phenol & Acetone started commercial operations less than a year back and is reporting positive EBITDA and PAT and is poised to become domestic market leader for Phenol & Acetone through its subsidiary Deepak Phenolics Ltd. Though the performance of Phenol and Acetone segment was impacted by slowing economic growth globally and the subdued activity in automotive and real estate sector in India. The outlook for Phenol remains favorable as the product is finding new applications resulting in increased local demand. Also the demand from the end user industry is expected to improve going forward. The downstream project for Acetone is progressing well and production is expected to commence by the end of this financial year. All this expected to provide sustained and profitable growth for the company. As regards BC and PP segments, the company continued to show resilient performance in these segments. Going forward, these segments are expected to have sustained growth over the near term due to planned capacity expansions undertaken by the management and product realizations and extensions. As regards BC and PP segments, the company continued to show resilient performance in these segments. Going forward, these segments are expected to have sustained growth over the near term due to planned capacity expansions undertaken by the management and product realizations and extensions. FSC segment continue to witness pressure. DNL is taking strategic positions on key products in FSC portfolio to enhance margin performance. DNL is also taking measures to enhance volumes going forward. FSC is expected to deliver an improved performance on the back of new product launches and capacity augmentation. We expect revenue CAGR of 16% and PAT CAGR of 27% over FY19-24E. We assign a BUY rating to the stock. Going ahead, we expect DNL to benefit strongly from healthy outlook of India Chemical industry which is growing at the rate of 8-10% annually. The growth is particularly expected to come from sub-sectors like specialty chemicals and agro-chemicals. To aid this industry further, the government is working on a draft chemical policy which would focus on meeting the rising demand of chemicals from domestic industry and reduce dependence on imports. Setting up of PCPIRs (Petroleum, Chemicals & Petrochemical Investment Regions) is another step to promote investment in this sector and make the country an important hub for both domestic and international markets
Near-term Catalysts
� There has been decline in exports from China due to shutdown of multiple plants due to crackdown by the government. Also with trade war going on between US and China, India stands to gain from this trade war. DNL can be beneficiary to this.
� Commencement of acetone-phenol plant will help address the supply deficit for these 2 compounds in India thereby reducing imports. Also management’s focus to enter downstream derivatives of Phenol and Acetone can beneficial for DNL as it is expected to improve margins.
� Ramp-up in sales of high-margin pharma, personal care and agrochemical intermediates. Also DNL is contemplating to add more pharmaceutical products into its portfolio.
� Improving margins in OBA as capacity utilization in the project improves
Risks to the recommendation
� The profitability in the acetone-phenol business is closely linked to the spread between global prices of acetone-phenol and benzene propylene which can impact earnings.
� Delay in order flow or slower ramp-up in new product-mix could impact growth. � Acetone-phenol project, being driven by import substitution demand, may face price competition from major
exporting countries such as China and Thailand.
14
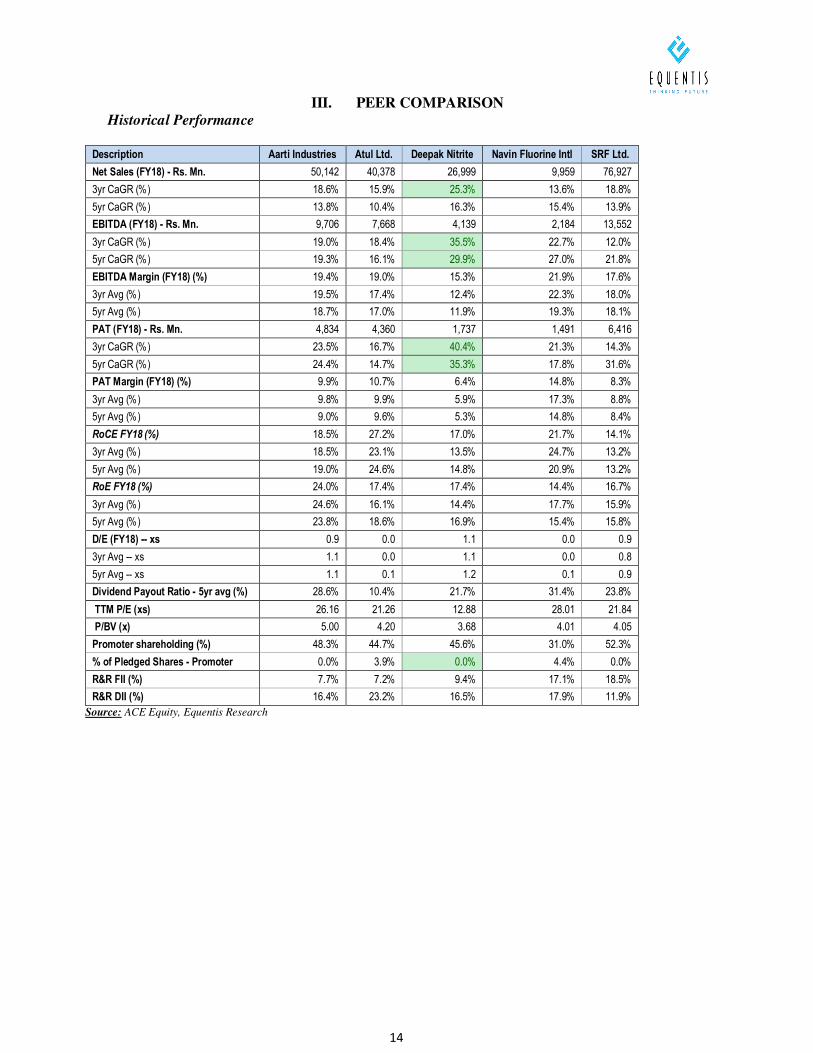
III. PEER COMPARISON
Historical Performance
Description Aarti Industries Atul Ltd. Deepak Nitrite Navin Fluorine Intl SRF Ltd.
Net Sales (FY18) - Rs. Mn. 50,142 40,378 26,999 9,959 76,927
3yr CaGR (%) 18.6% 15.9% 25.3% 13.6% 18.8%
5yr CaGR (%) 13.8% 10.4% 16.3% 15.4% 13.9%
EBITDA (FY18) - Rs. Mn. 9,706 7,668 4,139 2,184 13,552
3yr CaGR (%) 19.0% 18.4% 35.5% 22.7% 12.0%
5yr CaGR (%) 19.3% 16.1% 29.9% 27.0% 21.8%
EBITDA Margin (FY18) (%) 19.4% 19.0% 15.3% 21.9% 17.6%
3yr Avg (%) 19.5% 17.4% 12.4% 22.3% 18.0%
5yr Avg (%) 18.7% 17.0% 11.9% 19.3% 18.1%
PAT (FY18) - Rs. Mn. 4,834 4,360 1,737 1,491 6,416
3yr CaGR (%) 23.5% 16.7% 40.4% 21.3% 14.3%
5yr CaGR (%) 24.4% 14.7% 35.3% 17.8% 31.6%
PAT Margin (FY18) (%) 9.9% 10.7% 6.4% 14.8% 8.3%
3yr Avg (%) 9.8% 9.9% 5.9% 17.3% 8.8%
5yr Avg (%) 9.0% 9.6% 5.3% 14.8% 8.4%
RoCE FY18 (%) 18.5% 27.2% 17.0% 21.7% 14.1%
3yr Avg (%) 18.5% 23.1% 13.5% 24.7% 13.2%
5yr Avg (%) 19.0% 24.6% 14.8% 20.9% 13.2%
RoE FY18 (%) 24.0% 17.4% 17.4% 14.4% 16.7%
3yr Avg (%) 24.6% 16.1% 14.4% 17.7% 15.9%
5yr Avg (%) 23.8% 18.6% 16.9% 15.4% 15.8%
D/E (FY18) -- xs 0.9 0.0 1.1 0.0 0.9
3yr Avg -- xs 1.1 0.0 1.1 0.0 0.8
5yr Avg -- xs 1.1 0.1 1.2 0.1 0.9
Dividend Payout Ratio - 5yr avg (%) 28.6% 10.4% 21.7% 31.4% 23.8%
TTM P/E (xs) 26.16 21.26 12.88 28.01 21.84
P/BV (x) 5.00 4.20 3.68 4.01 4.05
Promoter shareholding (%) 48.3% 44.7% 45.6% 31.0% 52.3%
% of Pledged Shares - Promoter 0.0% 3.9% 0.0% 4.4% 0.0%
R&R FII (%) 7.7% 7.2% 9.4% 17.1% 18.5%
R&R DII (%) 16.4% 23.2% 16.5% 17.9% 11.9%
Source: ACE Equity, Equentis Research
15
INVESTOR EDUCATION SECTIONINVESTOR EDUCATION SECTIONINVESTOR EDUCATION SECTIONINVESTOR EDUCATION SECTION
16
BEYOND NUMBERS – FROM THE FUND MANAGER’S DESK
In our quest to ensure that our clients stay course on the path of ‘Wealth Creation” and not get unduly guided by near-term stock price swings (positive or negative), we have incorporated this section, through which we summarize the essence of our investment thought process; which in real world is mostly driven beyond numbers.
While in our reports and analysis, forecasting of earnings and valuation framework, form integral part of the investment process; however, every day and all over, we have seen that a stock could give the forecasted one- year return, in say a few trading sessions and thereafter test one’s patience, or the converse, that a stock corrects significantly with prolonged period of under-performance and then in a matter of say a quarter makes up for all this.
In a nutshell, if one’s investing decisions are routinely guided by stock price behavior, then one will surely end up in a vicious cycle of making some gains and some losses, which mostly even out. This is certainly not the path for steady long-term wealth creation.
This leads us to the next question, that – “What is really needed for long-term wealth creation”?
In our opinion, the answer simply is “CONVICTION”; with respect to the size of the business opportunity, the capability of the management team and top leadership to successfully innovate, scale-up and keep building sustainable competitive advantages, their philosophy of balancing growth and risks, level of transparency and overall approach towards all stakeholders.
Hence, while investing, if one keeps in mind, all these points and remains steadfast, then, as long as the underlying investment thesis is not broken, irrespective of certain periods of underperformance and outperformance; over the medium to long-term, wealth creation through compounding will be the end-product.
OUR HUNCH ON DEEPAK NITRITE NEAR-TERM STOCK PULSE
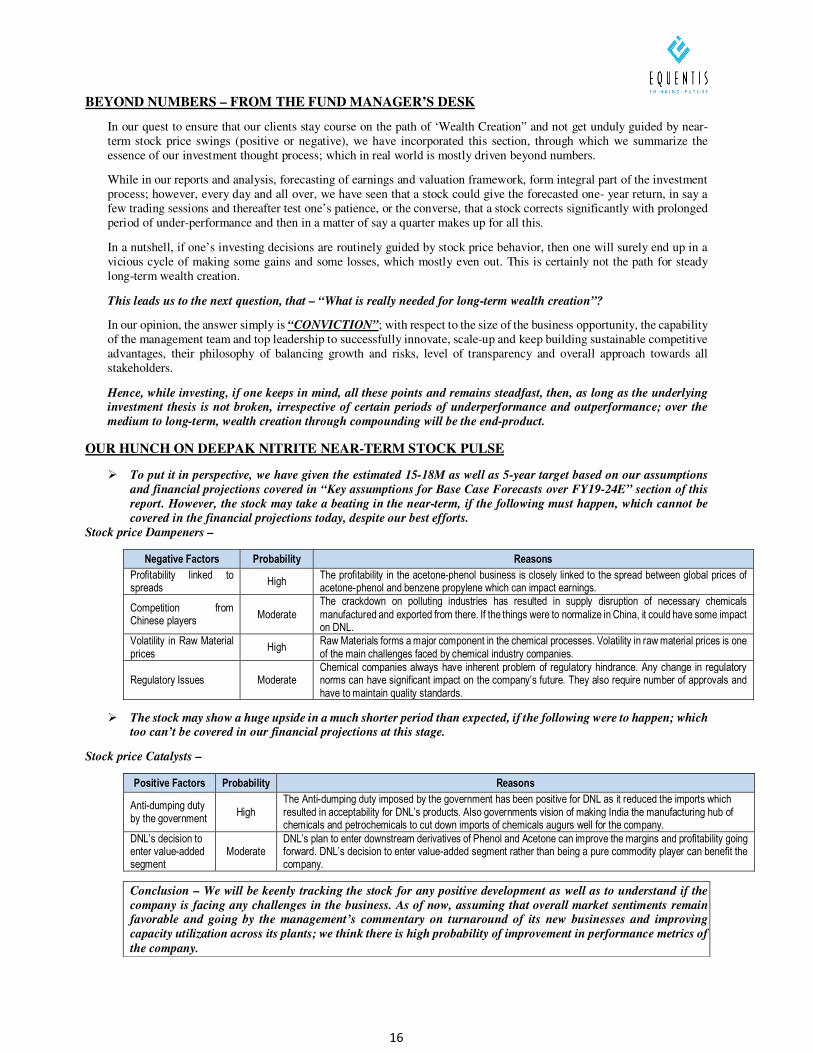
� To put it in perspective, we have given the estimated 15-18M as well as 5-year target based on our assumptions and financial projections covered in “Key assumptions for Base Case Forecasts over FY19-24E” section of this report. However, the stock may take a beating in the near-term, if the following must happen, which cannot be covered in the financial projections today, despite our best efforts.
Stock price Dampeners –
Negative Factors Probability Reasons
Profitability linked to spreads
High The profitability in the acetone-phenol business is closely linked to the spread between global prices of acetone-phenol and benzene propylene which can impact earnings.
Competition from Chinese players
Moderate
The crackdown on polluting industries has resulted in supply disruption of necessary chemicals
manufactured and exported from there. If the things were to normalize in China, it could have some impact on DNL.
Volatility in Raw Material prices
High Raw Materials forms a major component in the chemical processes. Volatility in raw material prices is one of the main challenges faced by chemical industry companies.
Regulatory Issues Moderate Chemical companies always have inherent problem of regulatory hindrance. Any change in regulatory norms can have significant impact on the company’s future. They also require number of approvals and have to maintain quality standards.
� The stock may show a huge upside in a much shorter period than expected, if the following were to happen; which too can’t be covered in our financial projections at this stage.
Stock price Catalysts –
Positive Factors Probability Reasons
Anti-dumping duty by the government
High The Anti-dumping duty imposed by the government has been positive for DNL as it reduced the imports which resulted in acceptability for DNL’s products. Also governments vision of making India the manufacturing hub of chemicals and petrochemicals to cut down imports of chemicals augurs well for the company.
DNL’s decision to enter value-added segment
Moderate DNL’s plan to enter downstream derivatives of Phenol and Acetone can improve the margins and profitability going forward. DNL’s decision to enter value-added segment rather than being a pure commodity player can benefit the company.
Conclusion – We will be keenly tracking the stock for any positive development as well as to understand if the company is facing any challenges in the business. As of now, assuming that overall market sentiments remain favorable and going by the management’s commentary on turnaround of its new businesses and improving capacity utilization across its plants; we think there is high probability of improvement in performance metrics of the company.
17
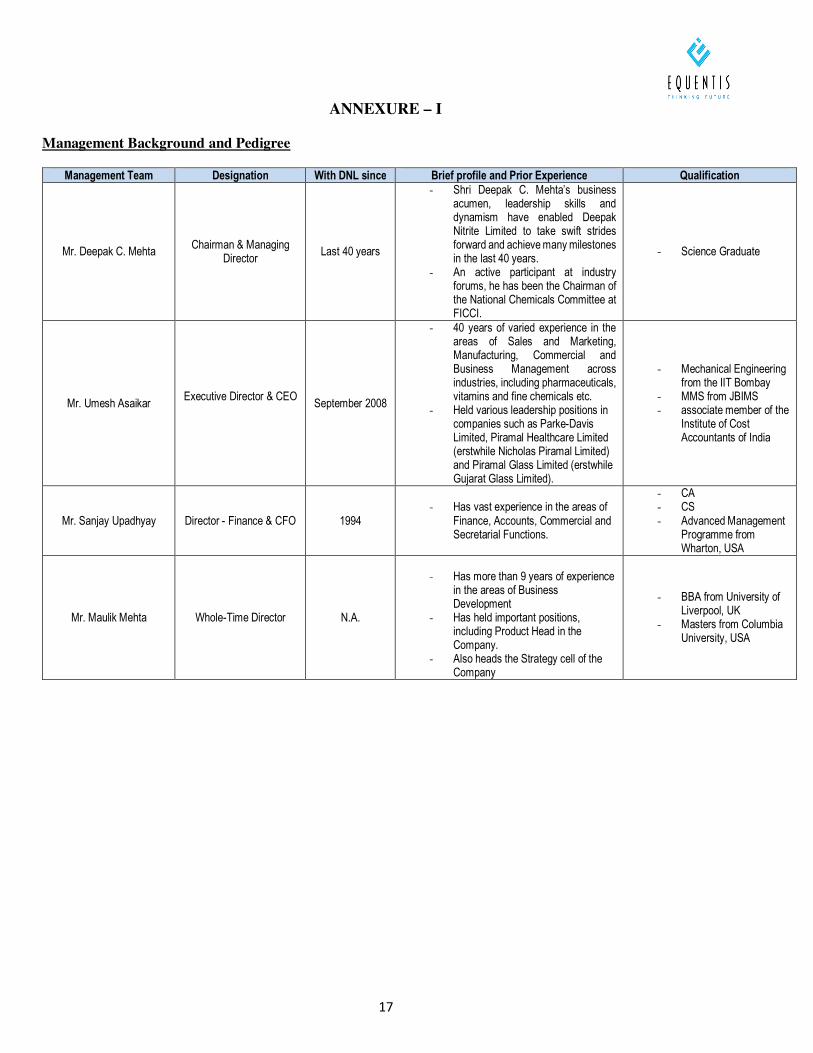
ANNEXURE – I
Management Background and Pedigree
Management Team Designation With DNL since Brief profile and Prior Experience Qualification
Mr. Deepak C. Mehta Chairman & Managing
Director Last 40 years
- Shri Deepak C. Mehta’s business acumen, leadership skills and dynamism have enabled Deepak Nitrite Limited to take swift strides forward and achieve many milestones in the last 40 years.
- An active participant at industry forums, he has been the Chairman of the National Chemicals Committee at FICCI.
- Science Graduate
Mr. Umesh Asaikar Executive Director & CEO
September 2008
- 40 years of varied experience in the areas of Sales and Marketing, Manufacturing, Commercial and Business Management across industries, including pharmaceuticals, vitamins and fine chemicals etc.
- Held various leadership positions in companies such as Parke-Davis Limited, Piramal Healthcare Limited (erstwhile Nicholas Piramal Limited) and Piramal Glass Limited (erstwhile Gujarat Glass Limited).
- Mechanical Engineering from the IIT Bombay
- MMS from JBIMS - associate member of the
Institute of Cost Accountants of India
Mr. Sanjay Upadhyay Director - Finance & CFO 1994 - Has vast experience in the areas of
Finance, Accounts, Commercial and Secretarial Functions.
- CA - CS - Advanced Management
Programme from Wharton, USA
Mr. Maulik Mehta Whole-Time Director N.A.
- Has more than 9 years of experience
in the areas of Business Development
- Has held important positions, including Product Head in the Company.
- Also heads the Strategy cell of the Company
- BBA from University of Liverpool, UK
- Masters from Columbia University, USA
18
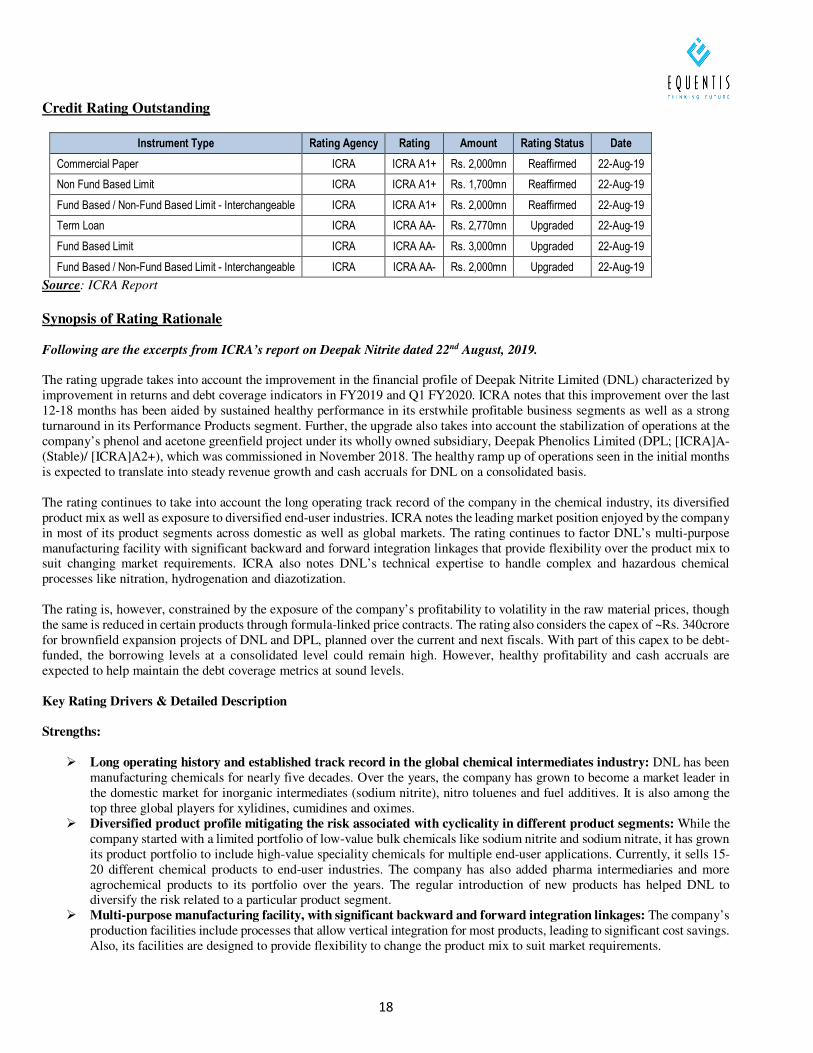
Credit Rating Outstanding
Instrument Type Rating Agency Rating Amount Rating Status Date
Commercial Paper ICRA ICRA A1+ Rs. 2,000mn Reaffirmed 22-Aug-19
Non Fund Based Limit ICRA ICRA A1+ Rs. 1,700mn Reaffirmed 22-Aug-19
Fund Based / Non-Fund Based Limit - Interchangeable ICRA ICRA A1+ Rs. 2,000mn Reaffirmed 22-Aug-19
Term Loan ICRA ICRA AA- Rs. 2,770mn Upgraded 22-Aug-19
Fund Based Limit ICRA ICRA AA- Rs. 3,000mn Upgraded 22-Aug-19
Fund Based / Non-Fund Based Limit - Interchangeable ICRA ICRA AA- Rs. 2,000mn Upgraded 22-Aug-19
Source: ICRA Report
Synopsis of Rating Rationale
Following are the excerpts from ICRA’s report on Deepak Nitrite dated 22nd August, 2019. The rating upgrade takes into account the improvement in the financial profile of Deepak Nitrite Limited (DNL) characterized by improvement in returns and debt coverage indicators in FY2019 and Q1 FY2020. ICRA notes that this improvement over the last 12-18 months has been aided by sustained healthy performance in its erstwhile profitable business segments as well as a strong turnaround in its Performance Products segment. Further, the upgrade also takes into account the stabilization of operations at the company’s phenol and acetone greenfield project under its wholly owned subsidiary, Deepak Phenolics Limited (DPL; [ICRA]A- (Stable)/ [ICRA]A2+), which was commissioned in November 2018. The healthy ramp up of operations seen in the initial months is expected to translate into steady revenue growth and cash accruals for DNL on a consolidated basis. The rating continues to take into account the long operating track record of the company in the chemical industry, its diversified product mix as well as exposure to diversified end-user industries. ICRA notes the leading market position enjoyed by the company in most of its product segments across domestic as well as global markets. The rating continues to factor DNL’s multi-purpose manufacturing facility with significant backward and forward integration linkages that provide flexibility over the product mix to suit changing market requirements. ICRA also notes DNL’s technical expertise to handle complex and hazardous chemical processes like nitration, hydrogenation and diazotization. The rating is, however, constrained by the exposure of the company’s profitability to volatility in the raw material prices, though the same is reduced in certain products through formula-linked price contracts. The rating also considers the capex of ~Rs. 340crore for brownfield expansion projects of DNL and DPL, planned over the current and next fiscals. With part of this capex to be debt-funded, the borrowing levels at a consolidated level could remain high. However, healthy profitability and cash accruals are expected to help maintain the debt coverage metrics at sound levels.
Key Rating Drivers & Detailed Description
Strengths:
� Long operating history and established track record in the global chemical intermediates industry: DNL has been manufacturing chemicals for nearly five decades. Over the years, the company has grown to become a market leader in the domestic market for inorganic intermediates (sodium nitrite), nitro toluenes and fuel additives. It is also among the top three global players for xylidines, cumidines and oximes.
� Diversified product profile mitigating the risk associated with cyclicality in different product segments: While the company started with a limited portfolio of low-value bulk chemicals like sodium nitrite and sodium nitrate, it has grown its product portfolio to include high-value speciality chemicals for multiple end-user applications. Currently, it sells 15-20 different chemical products to end-user industries. The company has also added pharma intermediaries and more agrochemical products to its portfolio over the years. The regular introduction of new products has helped DNL to diversify the risk related to a particular product segment.
� Multi-purpose manufacturing facility, with significant backward and forward integration linkages: The company’s production facilities include processes that allow vertical integration for most products, leading to significant cost savings. Also, its facilities are designed to provide flexibility to change the product mix to suit market requirements.
19
� Improvement in financial profile driven by increasing scale of operations and cash accruals: DNL has reported a significant revenue growth and improvement in operating profitability in FY2019, driven by a healthy performance across all its product segments and a turnaround in OBA operations. Further, a healthy revenue and cash flow generation from DPL’s recently commissioned project would also lead to an increase in the scale of operations for DNL on a consolidated basis.
Weaknesses:
� Profitability exposed to volatility in raw material prices, though the same is reduced in certain products through
formula-linked price contracts: Prices of most of the company’s key products are linked to the movement in crude oil prices. The change in price levels, however, varies across product categories and is not commensurate with the change in crude price due to formula-linked pricing. Also, the prices of certain key products, such as sodium nitrite, TFMAP, OBA and DASDA, which currently form about 75% of the company’s sales, are delinked with movement in crude oil prices.
� Moderate project risks; high borrowing at consolidated level: DNL’s borrowings at a consolidated level remain high owing to a debt of Rs. 840crore on the books of DPL, which was raised to fund the phenol/acetone project. Further, the company has a planned capex of ~Rs. 340crore for the brownfield expansion projects of DNL and DPL, which is expected 3 to fund the same partly through debt. ICRA notes the track record of DNL in completing its projects in a successful manner. Despite being modest in size, the projects are exposed to risks of any potential time or cost overruns.
� Liquidity: The company’s cash flow position improved in FY2019 vis-à-vis FY2018 with increase in operating profits and reduction in working capital intensity. Going ahead, the company’s liquidity profile will remain healthy supported by steady cash accruals and adequate working capital limits from the bank. Also, the company has met its entire equity commitment towards its phenol project, which frees up its future cash flows. DNL also has a sanctioned term loan facility of Rs. 250crore (Rs. 100 crore outstanding as of March 31, 2019), which further supports the company’s liquidity profile.
Outlook: Stable
ICRA expects DNL to continue to benefit from its leading presence in the domestic and global markets for bulk and specialty chemicals. The outlook could be revised to Positive if the company is able to sustain healthy revenue growth and profit margins, resulting in material deleveraging of its consolidated balance sheet and improvement in return metrics. The outlook may be revised to Negative if the company faces material weakening in its profitability owing to movements in product prices and/or raw material costs or undertakes any sizeable capex that delays the expected improvement in leveraging and coverage indicators.
20
ANNEXURE - II
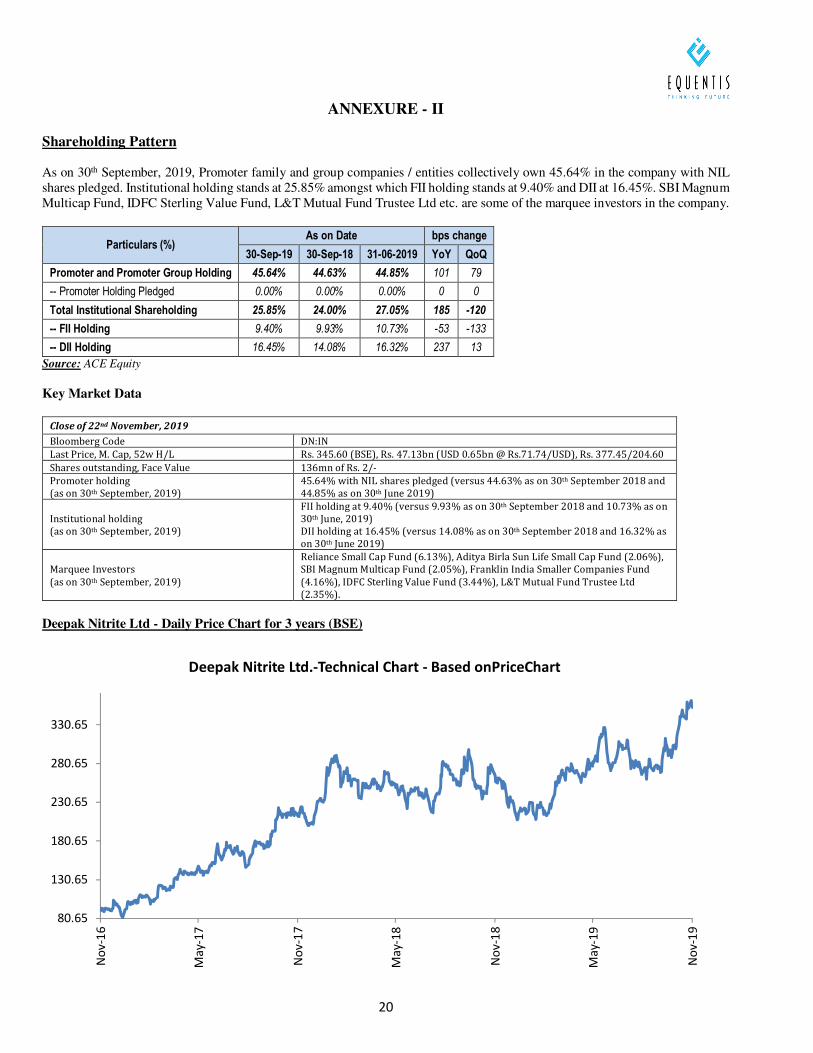
Shareholding Pattern As on 30th September, 2019, Promoter family and group companies / entities collectively own 45.64% in the company with NIL shares pledged. Institutional holding stands at 25.85% amongst which FII holding stands at 9.40% and DII at 16.45%. SBI Magnum Multicap Fund, IDFC Sterling Value Fund, L&T Mutual Fund Trustee Ltd etc. are some of the marquee investors in the company.
Particulars (%) As on Date bps change
30-Sep-19 30-Sep-18 31-06-2019 YoY QoQ
Promoter and Promoter Group Holding 45.64% 44.63% 44.85% 101 79
-- Promoter Holding Pledged 0.00% 0.00% 0.00% 0 0
Total Institutional Shareholding 25.85% 24.00% 27.05% 185 -120
-- FII Holding 9.40% 9.93% 10.73% -53 -133
-- DII Holding 16.45% 14.08% 16.32% 237 13
Source: ACE Equity
Key Market Data
Close of 22nd November, 2019
Bloomberg Code DN:IN
Last Price, M. Cap, 52w H/L Rs. 345.60 (BSE), Rs. 47.13bn (USD 0.65bn @ Rs.71.74/USD), Rs. 377.45/204.60
Shares outstanding, Face Value 136mn of Rs. 2/-
Promoter holding
(as on 30th September, 2019)
45.64% with NIL shares pledged (versus 44.63% as on 30th September 2018 and
44.85% as on 30th June 2019)
Institutional holding
(as on 30th September, 2019)
FII holding at 9.40% (versus 9.93% as on 30th September 2018 and 10.73% as on
30th June, 2019)
DII holding at 16.45% (versus 14.08% as on 30th September 2018 and 16.32% as
on 30th June 2019)
Marquee Investors
(as on 30th September, 2019)
Reliance Small Cap Fund (6.13%), Aditya Birla Sun Life Small Cap Fund (2.06%),
SBI Magnum Multicap Fund (2.05%), Franklin India Smaller Companies Fund
(4.16%), IDFC Sterling Value Fund (3.44%), L&T Mutual Fund Trustee Ltd
(2.35%).
Deepak Nitrite Ltd - Daily Price Chart for 3 years (BSE)
80.65
130.65
180.65
230.65
280.65
330.65
No
v-1
6
Ma
y-1
7
No
v-1
7
Ma
y-1
8
No
v-1
8
Ma
y-1
9
No
v-1
9
Deepak Nitrite Ltd.-Technical Chart - Based onPriceChart
21
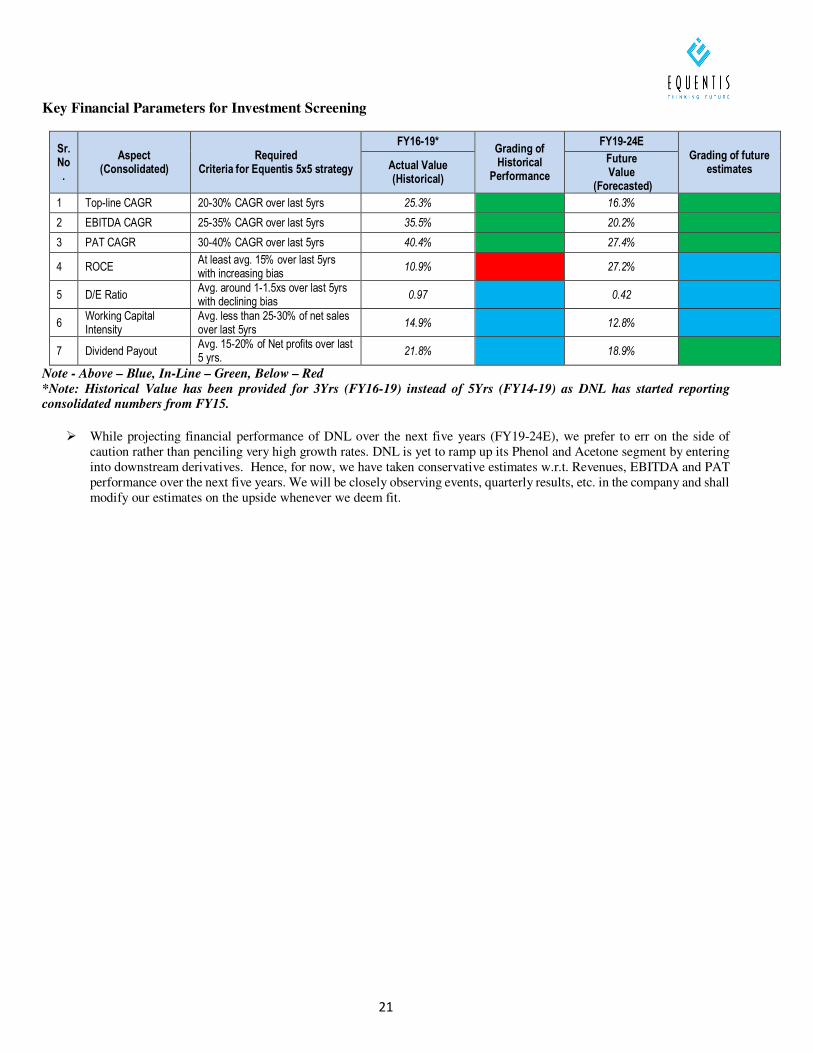
Key Financial Parameters for Investment Screening
Sr. No.
Aspect (Consolidated)
Required Criteria for Equentis 5x5 strategy
FY16-19* Grading of Historical
Performance
FY19-24E Grading of future
estimates Actual Value (Historical)
Future Value
(Forecasted)
1 Top-line CAGR 20-30% CAGR over last 5yrs 25.3% 16.3%
2 EBITDA CAGR 25-35% CAGR over last 5yrs 35.5% 20.2%
3 PAT CAGR 30-40% CAGR over last 5yrs 40.4% 27.4%
4 ROCE At least avg. 15% over last 5yrs with increasing bias
10.9% 27.2%
5 D/E Ratio Avg. around 1-1.5xs over last 5yrs with declining bias
0.97 0.42
6 Working Capital Intensity
Avg. less than 25-30% of net sales over last 5yrs
14.9% 12.8%
7 Dividend Payout Avg. 15-20% of Net profits over last 5 yrs.
21.8% 18.9%
Note - Above – Blue, In-Line – Green, Below – Red *Note: Historical Value has been provided for 3Yrs (FY16-19) instead of 5Yrs (FY14-19) as DNL has started reporting consolidated numbers from FY15.
� While projecting financial performance of DNL over the next five years (FY19-24E), we prefer to err on the side of caution rather than penciling very high growth rates. DNL is yet to ramp up its Phenol and Acetone segment by entering into downstream derivatives. Hence, for now, we have taken conservative estimates w.r.t. Revenues, EBITDA and PAT performance over the next five years. We will be closely observing events, quarterly results, etc. in the company and shall modify our estimates on the upside whenever we deem fit.
22
ANNEXURE – III
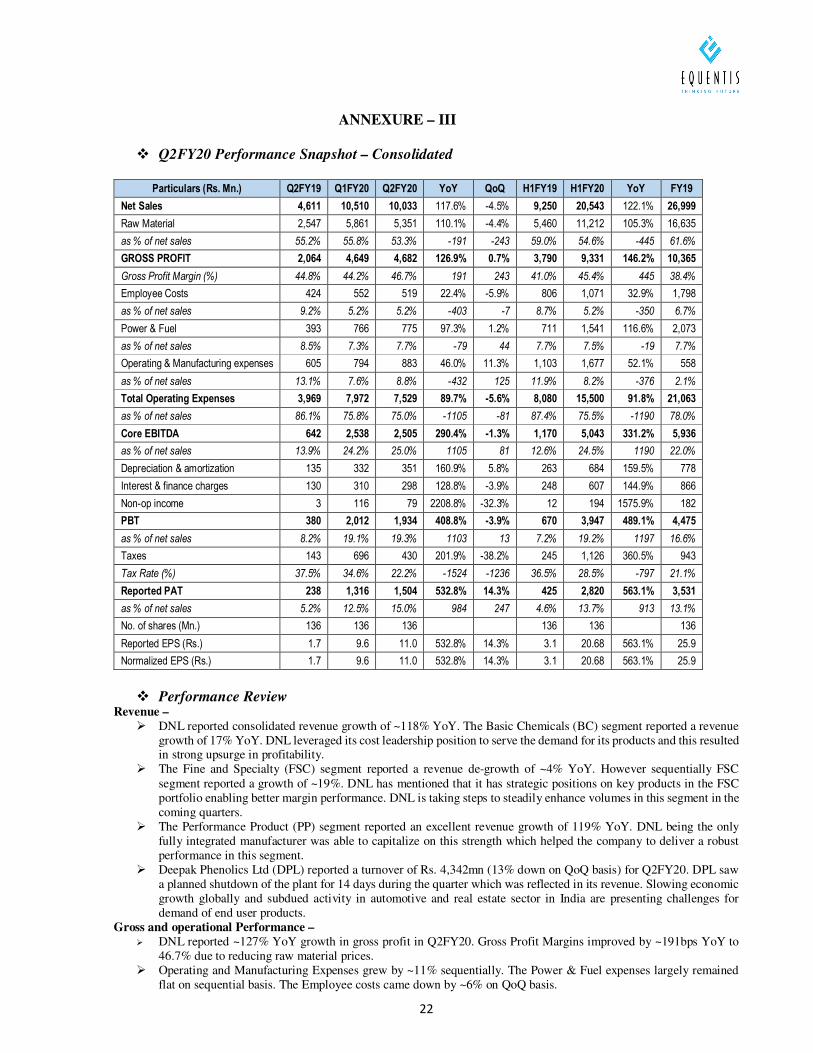
� Q2FY20 Performance Snapshot – Consolidated
Particulars (Rs. Mn.) Q2FY19 Q1FY20 Q2FY20 YoY QoQ H1FY19 H1FY20 YoY FY19
Net Sales 4,611 10,510 10,033 117.6% -4.5% 9,250 20,543 122.1% 26,999
Raw Material 2,547 5,861 5,351 110.1% -4.4% 5,460 11,212 105.3% 16,635
as % of net sales 55.2% 55.8% 53.3% -191 -243 59.0% 54.6% -445 61.6%
GROSS PROFIT 2,064 4,649 4,682 126.9% 0.7% 3,790 9,331 146.2% 10,365
Gross Profit Margin (%) 44.8% 44.2% 46.7% 191 243 41.0% 45.4% 445 38.4%
Employee Costs 424 552 519 22.4% -5.9% 806 1,071 32.9% 1,798
as % of net sales 9.2% 5.2% 5.2% -403 -7 8.7% 5.2% -350 6.7%
Power & Fuel 393 766 775 97.3% 1.2% 711 1,541 116.6% 2,073
as % of net sales 8.5% 7.3% 7.7% -79 44 7.7% 7.5% -19 7.7%
Operating & Manufacturing expenses 605 794 883 46.0% 11.3% 1,103 1,677 52.1% 558
as % of net sales 13.1% 7.6% 8.8% -432 125 11.9% 8.2% -376 2.1%
Total Operating Expenses 3,969 7,972 7,529 89.7% -5.6% 8,080 15,500 91.8% 21,063
as % of net sales 86.1% 75.8% 75.0% -1105 -81 87.4% 75.5% -1190 78.0%
Core EBITDA 642 2,538 2,505 290.4% -1.3% 1,170 5,043 331.2% 5,936
as % of net sales 13.9% 24.2% 25.0% 1105 81 12.6% 24.5% 1190 22.0%
Depreciation & amortization 135 332 351 160.9% 5.8% 263 684 159.5% 778
Interest & finance charges 130 310 298 128.8% -3.9% 248 607 144.9% 866
Non-op income 3 116 79 2208.8% -32.3% 12 194 1575.9% 182
PBT 380 2,012 1,934 408.8% -3.9% 670 3,947 489.1% 4,475
as % of net sales 8.2% 19.1% 19.3% 1103 13 7.2% 19.2% 1197 16.6%
Taxes 143 696 430 201.9% -38.2% 245 1,126 360.5% 943
Tax Rate (%) 37.5% 34.6% 22.2% -1524 -1236 36.5% 28.5% -797 21.1%
Reported PAT 238 1,316 1,504 532.8% 14.3% 425 2,820 563.1% 3,531
as % of net sales 5.2% 12.5% 15.0% 984 247 4.6% 13.7% 913 13.1%
No. of shares (Mn.) 136 136 136 136 136 136
Reported EPS (Rs.) 1.7 9.6 11.0 532.8% 14.3% 3.1 20.68 563.1% 25.9
Normalized EPS (Rs.) 1.7 9.6 11.0 532.8% 14.3% 3.1 20.68 563.1% 25.9
� Performance Review
Revenue –
� DNL reported consolidated revenue growth of ~118% YoY. The Basic Chemicals (BC) segment reported a revenue growth of 17% YoY. DNL leveraged its cost leadership position to serve the demand for its products and this resulted in strong upsurge in profitability.
� The Fine and Specialty (FSC) segment reported a revenue de-growth of ~4% YoY. However sequentially FSC segment reported a growth of ~19%. DNL has mentioned that it has strategic positions on key products in the FSC portfolio enabling better margin performance. DNL is taking steps to steadily enhance volumes in this segment in the coming quarters.
� The Performance Product (PP) segment reported an excellent revenue growth of 119% YoY. DNL being the only fully integrated manufacturer was able to capitalize on this strength which helped the company to deliver a robust performance in this segment.
� Deepak Phenolics Ltd (DPL) reported a turnover of Rs. 4,342mn (13% down on QoQ basis) for Q2FY20. DPL saw a planned shutdown of the plant for 14 days during the quarter which was reflected in its revenue. Slowing economic growth globally and subdued activity in automotive and real estate sector in India are presenting challenges for demand of end user products.
Gross and operational Performance –
� DNL reported ~127% YoY growth in gross profit in Q2FY20. Gross Profit Margins improved by ~191bps YoY to 46.7% due to reducing raw material prices.
� Operating and Manufacturing Expenses grew by ~11% sequentially. The Power & Fuel expenses largely remained flat on sequential basis. The Employee costs came down by ~6% on QoQ basis.
23
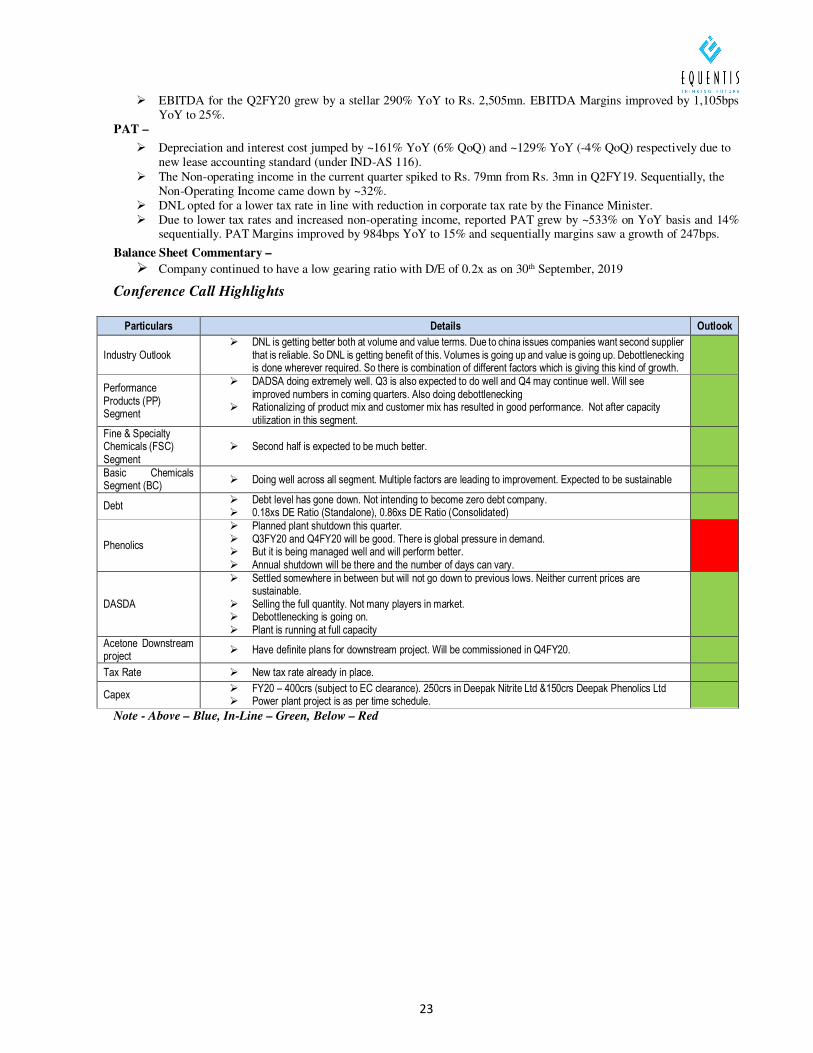
� EBITDA for the Q2FY20 grew by a stellar 290% YoY to Rs. 2,505mn. EBITDA Margins improved by 1,105bps YoY to 25%.
PAT –
� Depreciation and interest cost jumped by ~161% YoY (6% QoQ) and ~129% YoY (-4% QoQ) respectively due to new lease accounting standard (under IND-AS 116).
� The Non-operating income in the current quarter spiked to Rs. 79mn from Rs. 3mn in Q2FY19. Sequentially, the Non-Operating Income came down by ~32%.
� DNL opted for a lower tax rate in line with reduction in corporate tax rate by the Finance Minister. � Due to lower tax rates and increased non-operating income, reported PAT grew by ~533% on YoY basis and 14%
sequentially. PAT Margins improved by 984bps YoY to 15% and sequentially margins saw a growth of 247bps.
Balance Sheet Commentary –
� Company continued to have a low gearing ratio with D/E of 0.2x as on 30th September, 2019
Conference Call Highlights Particulars Details Outlook
Industry Outlook � DNL is getting better both at volume and value terms. Due to china issues companies want second supplier
that is reliable. So DNL is getting benefit of this. Volumes is going up and value is going up. Debottlenecking is done wherever required. So there is combination of different factors which is giving this kind of growth.
Performance Products (PP) Segment
� DADSA doing extremely well. Q3 is also expected to do well and Q4 may continue well. Will see improved numbers in coming quarters. Also doing debottlenecking
� Rationalizing of product mix and customer mix has resulted in good performance. Not after capacity utilization in this segment.
Fine & Specialty Chemicals (FSC) Segment
� Second half is expected to be much better.
Basic Chemicals Segment (BC)
� Doing well across all segment. Multiple factors are leading to improvement. Expected to be sustainable
Debt � Debt level has gone down. Not intending to become zero debt company. � 0.18xs DE Ratio (Standalone), 0.86xs DE Ratio (Consolidated)
Phenolics
� Planned plant shutdown this quarter. � Q3FY20 and Q4FY20 will be good. There is global pressure in demand. � But it is being managed well and will perform better. � Annual shutdown will be there and the number of days can vary.
DASDA
� Settled somewhere in between but will not go down to previous lows. Neither current prices are sustainable.
� Selling the full quantity. Not many players in market. � Debottlenecking is going on. � Plant is running at full capacity
Acetone Downstream project
� Have definite plans for downstream project. Will be commissioned in Q4FY20.
Tax Rate � New tax rate already in place.
Capex � FY20 – 400crs (subject to EC clearance). 250crs in Deepak Nitrite Ltd &150crs Deepak Phenolics Ltd � Power plant project is as per time schedule.
Note - Above – Blue, In-Line – Green, Below – Red
24
ANNEXURE –IV
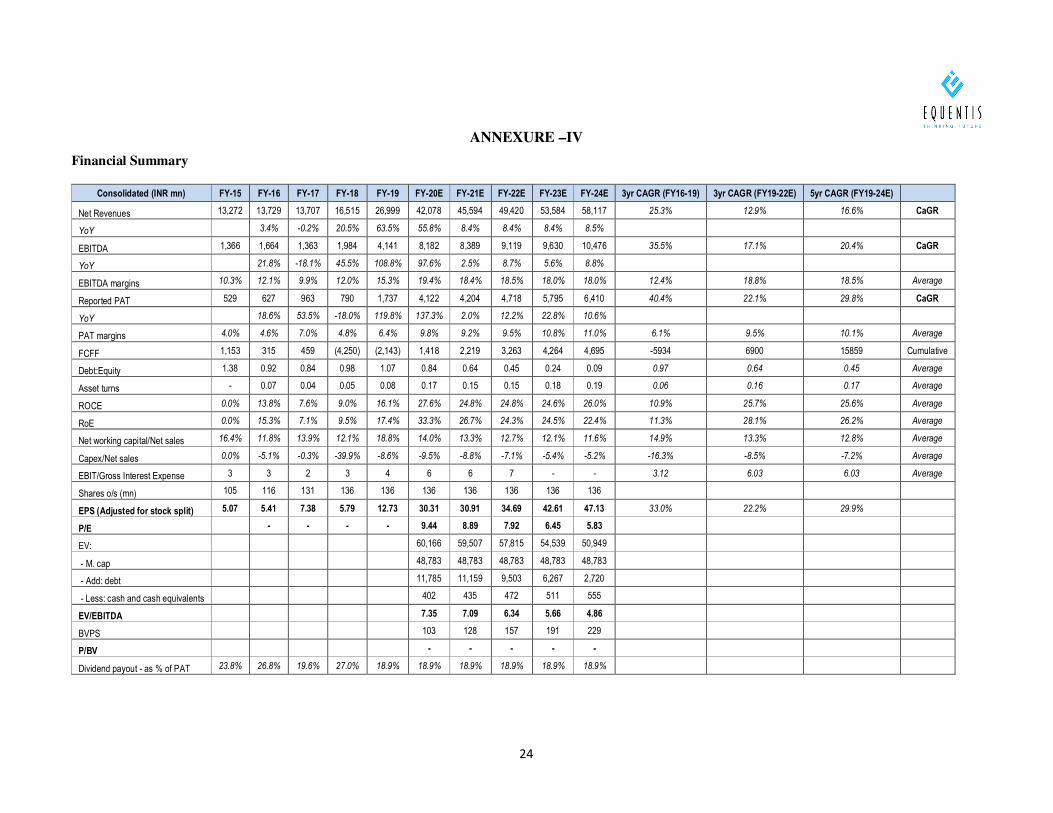
Financial Summary
Consolidated (INR mn) FY-15 FY-16 FY-17 FY-18 FY-19 FY-20E FY-21E FY-22E FY-23E FY-24E 3yr CAGR (FY16-19) 3yr CAGR (FY19-22E) 5yr CAGR (FY19-24E)
Net Revenues 13,272 13,729 13,707 16,515 26,999 42,078 45,594 49,420 53,584 58,117 25.3% 12.9% 16.6% CaGR
YoY 3.4% -0.2% 20.5% 63.5% 55.8% 8.4% 8.4% 8.4% 8.5%
EBITDA 1,366 1,664 1,363 1,984 4,141 8,182 8,389 9,119 9,630 10,476 35.5% 17.1% 20.4% CaGR
YoY 21.8% -18.1% 45.5% 108.8% 97.6% 2.5% 8.7% 5.6% 8.8%
EBITDA margins 10.3% 12.1% 9.9% 12.0% 15.3% 19.4% 18.4% 18.5% 18.0% 18.0% 12.4% 18.8% 18.5% Average
Reported PAT 529 627 963 790 1,737 4,122 4,204 4,718 5,795 6,410 40.4% 22.1% 29.8% CaGR
YoY 18.6% 53.5% -18.0% 119.8% 137.3% 2.0% 12.2% 22.8% 10.6%
PAT margins 4.0% 4.6% 7.0% 4.8% 6.4% 9.8% 9.2% 9.5% 10.8% 11.0% 6.1% 9.5% 10.1% Average
FCFF 1,153 315 459 (4,250) (2,143) 1,418 2,219 3,263 4,264 4,695 -5934 6900 15859 Cumulative
Debt:Equity 1.38 0.92 0.84 0.98 1.07 0.84 0.64 0.45 0.24 0.09 0.97 0.64 0.45 Average
Asset turns - 0.07 0.04 0.05 0.08 0.17 0.15 0.15 0.18 0.19 0.06 0.16 0.17 Average
ROCE 0.0% 13.8% 7.6% 9.0% 16.1% 27.6% 24.8% 24.8% 24.6% 26.0% 10.9% 25.7% 25.6% Average
RoE 0.0% 15.3% 7.1% 9.5% 17.4% 33.3% 26.7% 24.3% 24.5% 22.4% 11.3% 28.1% 26.2% Average
Net working capital/Net sales 16.4% 11.8% 13.9% 12.1% 18.8% 14.0% 13.3% 12.7% 12.1% 11.6% 14.9% 13.3% 12.8% Average
Capex/Net sales 0.0% -5.1% -0.3% -39.9% -8.6% -9.5% -8.8% -7.1% -5.4% -5.2% -16.3% -8.5% -7.2% Average
EBIT/Gross Interest Expense 3 3 2 3 4 6 6 7 - - 3.12 6.03 6.03 Average
Shares o/s (mn) 105 116 131 136 136 136 136 136 136 136
EPS (Adjusted for stock split) 5.07 5.41 7.38 5.79 12.73 30.31 30.91 34.69 42.61 47.13 33.0% 22.2% 29.9%
P/E - - - - 9.44 8.89 7.92 6.45 5.83
EV: 60,166 59,507 57,815 54,539 50,949
- M. cap 48,783 48,783 48,783 48,783 48,783
- Add: debt 11,785 11,159 9,503 6,267 2,720
- Less: cash and cash equivalents 402 435 472 511 555
EV/EBITDA 7.35 7.09 6.34 5.66 4.86
BVPS 103 128 157 191 229
P/BV - - - - -
Dividend payout - as % of PAT 23.8% 26.8% 19.6% 27.0% 18.9% 18.9% 18.9% 18.9% 18.9% 18.9%
25
DISCLAIMER
Equentis Wealth Advisory Services Private Limited (EWASPL) is registered under the SEBI (Investment Advisers)
Regulations, 2013.
“Research & Ranking” is the brand under which the Research Division of EWASPL render’s its Research Services.
General Disclaimers: This Research Report (hereinafter called ‘Report’) is prepared and distributed by EWASPL for information purposes only. The recommendations, if any, made herein are expression of views and/or opinions and
should not be deemed or construed to be neither advice for the purpose of purchase or sale of any security, derivatives or any other security through EWASPL nor any solicitation or offering of any investment /trading opportunity on behalf
of the issuer(s) of the respective security(ies) referred to herein. These information / opinions / views are not meant to serve as a professional investment guide for the readers. No action is solicited based upon the information provided
herein. Recipients of this Report should rely on information/data arising out of their own investigations. Readers are
advised to seek independent professional advice and arrive at an informed trading/investment decision before executing
any trades or making any investments. This Report has been prepared on the basis of publicly available information,
internally developed data and other sources believed by EWASPL to be reliable. EWASPL or its directors, employees,
affiliates or representatives do not assume any responsibility for, or warrant the accuracy, completeness, adequacy and
reliability of such information / opinions / views. While due care has been taken to ensure that the disclosures and
opinions given are fair and reasonable, none of the directors, employees, affiliates or representatives of EWASPL shall
be liable for any direct, indirect, special, incidental, consequential, punitive or exemplary damages, including lost profits
arising in any way whatsoever from the information / opinions / views contained in this Report.
Risks: Trading and investment in securities are subject to market risks. There are no assurances or guarantees that the
objectives of any of trading / investment in securities will be achieved. The trades/ investments referred to herein may
not be suitable to all categories of traders/investors. The names of securities mentioned herein do not in any manner
indicate their prospects or returns. The value of securities referred to herein may be adversely affected by the
performance or otherwise of the respective issuer companies, changes in the market conditions, micro and macro factors
and forces affecting capital markets like interest rate risk, credit risk, liquidity risk and reinvestment risk. Derivative
products may also be affected by various risks including but not limited to counter party risk, market risk, valuation risk,
liquidity risk and other risks. Besides the price of the underlying asset, volatility, tenor and interest rates may affect the
pricing of derivatives.
Disclaimers in respect of jurisdiction: The possession, circulation and/or distribution of this Report may be restricted
or regulated in certain jurisdictions by appropriate laws. No action has been or will be taken by EWASPL in any jurisdiction
(other than India), where any action for such purpose(s) is required. Accordingly, this Report shall not be possessed,
circulated and/or distributed in any such country or jurisdiction unless such action is in compliance with all applicable
laws and regulations of such country or jurisdiction. EWASPL requires such recipient to inform himself about and to
observe any restrictions at his own expense, without any liability to EWASPL. Any dispute arising out of this Report shall
be subject to the exclusive jurisdiction of the Courts in Mumbai (India).
Disclosure of Interest: The Research Analyst(s) who have prepared this Report hereby certify that the views /opinions
expressed in this Report are their personal independent views/opinions in respect of the securities and their respective
issuers. None of EWASPL, Research Analyst(s), or their relatives had any known direct /indirect material conflict of
interest including any long/short position(s) in any specific security on which views/opinions have been made in this
Report, during its preparation. EWASPL, the Research Analyst(s), or their relatives do not have financial interest in the
issuer company(ies) of the said securities nor have ownership of 1% or more individually or jointly till the date of this
Report. EWASPL, the Research Analyst(s), or their relatives have not received any compensation or other benefits from
the said issuer company(ies) in last 12 months in any respect whatsoever.
Copyright: The copyright in this Report belongs exclusively to EWASPL. This Report shall only be read by those persons
to whom it has been delivered. No reprinting, reproduction, copying, distribution of this Report in any manner
whatsoever, in whole or in part, is permitted without the prior express written consent of EWASPL.
EWASPL’s activities were never suspended by SEBI or any other authority. Further, there does not exist any material
adverse order/judgments/strictures assessed by any regulatory, government or public authority or agency or any law
enforcing agency in last three years. Further, there does not exist any material enquiry of whatsoever nature instituted
or pending against EWASPL as on the date of this Report.
Important These disclaimers, risks and other disclosures must be read in conjunction with the information / opinions /
views of which they form part of.
CIN: U74999MH2015PTC262812; SEBI Registration No.: INA000003874