Deep Structure of the Eastern Malita Graben and Adjacent ... · PDF file• AUSTRALIAN...
79
- ."..,.--: ==--, I,: 1- ... _ Deep structure of the eastern Malita Graben and adjacent areas in the Timor and western Arafura Seas: Survey 118 operational report by P ] Hill, D C Ramsay and Survey 118 Shipboard Party RECORD 1993/47 '1'0: 0P. . '":('h q>p' <?J-: C)c '1<jj' - 9tAA ''<£ ' ?'J: 19.6 , Q 1'<'"J"u : '<-fA-,: rtQ '-"'l -,=-" 'Z -4A,. '- Vo; - _. ____ . . - --,,- - c1, - "sa ' <.r:J: II _ - - 9c - "'-- 01'(;; -.-' "'6 ' . ..:. :t''6! .. '. - yu<\> ; *:J . . "P :. ., _= ",-:JIG °en.. . v/c:; , '4-V it"" _ - ,
Transcript of Deep Structure of the Eastern Malita Graben and Adjacent ... · PDF file• AUSTRALIAN...
\\~~141 ~4- -- ."..,.--: ~- ==--,
I,: 1- ... _
Deep structure of the eastern Malita Graben and adjacent areas in the Timor and western Arafura Seas:
Survey 118 operational report
by
P ] Hill, D C Ramsay and Survey 118 Shipboard Party
RECORD 1993/47
'1'0: ~
~;v.
0P. ~<n... "'1~ . '":('h
~c; ~<5'u ~o/ ~ q>p' ~a~ <?J-:
C)c .~ ~ '1<jj' - 9tAA
~t: ''<£ ' ?'J: ~);1J
19.6 , ~c&~ ~-t: ~
Q ~ ~
1'<'"J"u :
~rQ
'<-fA-,: <~
~~ ~ rtQ
~n '-"'l ~a"" -,=-" 'Z
~oc; -4A,. ~/ '-Vo; <~ '1'49~. - ~~-o...._ _. --~l1?r
,'f~ ____ _(,~: . ~ . - --,,- - c1, ~"" - "sa
' ~{--A <.r:J:
II -~_ , _ ~~_ ~_ =~=..:=;-~. . ~ - - 9c - "'-- 01'(;;
-.-' "'6 ' . ..:. :t''6! .. ~~_ '. - yu<\>
~ ~'tl · ~r .: ~ ; *:J ~ . ~ ~ . "P :. ~._~::::-~~ "i;& , ~ ~,.. ., _= ~ ",-:JIG °en.. . ~J: ~~Q
v/c:; ~_ , '4-V it"" _
~Q -, ~. ~
• AUSTRALIAN GEOLOGICAL SURVEY ORGANISATION
Marine Geoscience and Petroleum Geology Program
Project 121.39
AGSO Record 1993/47
Deep structure of the eastern Malita Graben and adjacent areas in the Timor and western Arafura
• Seas: Survey 118 operational report
by
P.J. Hill, D.C. Ramsay and Survey 118 Shipboard Party*
*M. Alcock, S. Baldwin, J. Bedford, M. Callaway, E. Chudyk, A. Hislop, M. James, T. McNamara, R. Mleczko, S. Milnes, K. Revill,
C. Saroch, R. Schuler, D. Sewter
• IIII ~ IIII ~II ~ *R9304701*
© Australian Geological Survey Organisation, 1993
DEPARTMENT OF PRIMARY INDUSTRIES AND ENERGY
Minister for Resources: Hon. Michael Lee Secretary: Greg Taylor
AUSTRALIAN GEOLOGICAL SURVEY ORGANISATION
Executive Director: Harvey Jacka
© Commonwealth of Australia
ISSN: 1039-0073
ISBN: 0 642 19358 4
This work is copyright. Apart from any fair dealings for the purposes of study, research, criticism or review, as permitted under the Copyright Act, no part may be reproduced by any process without written permission. Copyright is the responsibility of the Executive Director, Australian Geological Survey Organisation. Inquiries should be directed to the Principal Information Officer, Australian Geological Survey Organisation, GPO Box 378, Canberra City, ACT, 2601.
•
•
•

• CONTENTS Page
EXECUTIVE SUMMARY ................................................................................................ 5
IN'1RODUCfION ............................................................................................................. 7
BACKGROUND TO PROJECT AND SEISMIC PROGRAM ........................................... 7
GEOLOGICAL SETTING OF THE MALIT A GRABEN AREA ...................................... 9 Structure ................................................................................................................... 9 Stratigraphy ............................................................................................................ 10
PE1ROLEUM EXPLORATION OF THE MALITA GRABEN AREA ........................... 10
PE1ROLEUM GEOLOGY OF ADJACENT AREAS - WESTERN GOULBURN GRABEN AND PETREL SUB-BASIN ........................................................................... 11
Goulburn Graben Area ............................................................................................ 11 Petrel Sub-basin ...................................................................................................... 12
PROJECT OBJECTIVES IN THE MALITA GRABEN AREA ....................................... 12
EXECUTION OF SEISMIC PROGRAM ........................................................................ 13 • Modifications to Pre-cruise Progrrun ....................................................................... 13
CRUISE NARRATIVE ................................................................................................... 14
DATA ACQUIRED AND SURVEY PARAMETERS ..................................................... 21 Seismic Aquisition Details ....................................................................................... 21 Non-seismic Acquisition Details .............................................................................. 21
SYSTEMS AND EQUIPMENT PERFORMANCE ......................................................... 22 Navigation / Geophysical (Non-seismic) Data Acquisition System (DAS) ................ 22 Seismic Acquisition System ..................................................................................... 23 Electronic Engineering Report ................................................................................ 25 Mechanical Equipment ............................................................................................ 28
PRELIMIN"ARY RESULTS ............................................................................................ 30
ACKNOWLEDGEMENTS ............................................................................................. 31
REFERENCES ................................................................................................................ 32
• 1
© Australian Geological Survey Organisation, 1993
FIGURES
Page
1. Survey 118 ship's track and seismic lines ................................................................. 34
2. Map of the Timor Sea region showing the main structural elements, petroleum accumulations and the Australia / Indonesia Zone of Co-operation (after Williamson and Lavering, 1990) ................................................................................................ 35
3. Eastern Malita Graben survey area, exploration well locations and 100/200 m bathymetry contours ............................................................................ 36
4. Structural framework of the eastern Malita Graben region (Northern Territory Geological Survey, 1989; 1990) ............................................................... 37
5. Stratigraphy of the eastern Malita Graben region (Northern Territory Geological Survey, 1990) ......................................................................................................... 38
6. Generalised stratigraphy, main seismic horizons and source/reservoir/seal characteristics of the NE Bonaparte Basin (West and Passmore, 1993) .................... 39
•
7. Pennian to Cainozoic stratigraphy, tectonics and hydrocarbon reservoirs of the Bonaparte Basin (after Williamson and Lavering, 1990; modified after • Mory, 1988) ............................................................................................................ 40
8. Typical noise levels along length of streamer during favourable sea conditions ......... 41
9. Navigational modes in use during Survey 118 - percentage per day and per line ....... 42
10. Depth controller wing angles and streamer lead ....................................................... 43
11. Shipboard monitor seismic section and interpretation of part of line 118/1501 through Kulka-l well, Money Shoal Basin / Goulbum Graben ................................. 44
12. Shipboard monitor seismic section and interpretation of part of line 118/0002 through Beluga-l well, eastern Malita Graben ......................................................... 45
13. Shipboard monitor seismic section and interpretation of part of line 118/1001 through Lynedoch-l well, eastern Malita / Calder Graben ....................................... 46
14. Shipboard monitor seismic section and interpretation of part of line 118/0901 across the Sahul Platform and southern flank of the Timor Trough. The section shows intense Tertiary high-angle (?normal) faulting .......................................................... 47
15. Shipboard monitor seismic section and interpretation of part of line 118/1802 • across the NE margin of the Petrel Sub-basin. The Permian dips steeply basinward (SW) to more than 3 seconds TWT ........................................................ 48
2 © Australian Geological Survey Organisation, 1993
•
•
.'
16. Shipboard monitor seismic section and interpretation of part of line 118/1802 through Fishburn-1 well, western Petrel Sub-basin .................................................. 49
17. Shipboard monitor seismic section and interpretation of part of line 118/2101 through Londonderry-1 well, NE Browse Basin. Basement (Proterozoic) is relatively shallow - at .... 1150 m depth ...................................................................... 50
ENCLOSURES
1. Survey 118 time-annotated ship's tracks: Malita - western Goulbum Graben area (1:500000).
2. Survey 118 time-annotated ship's tracks: NE Browse Basin - Petrel Sub-basin area (1:500000).
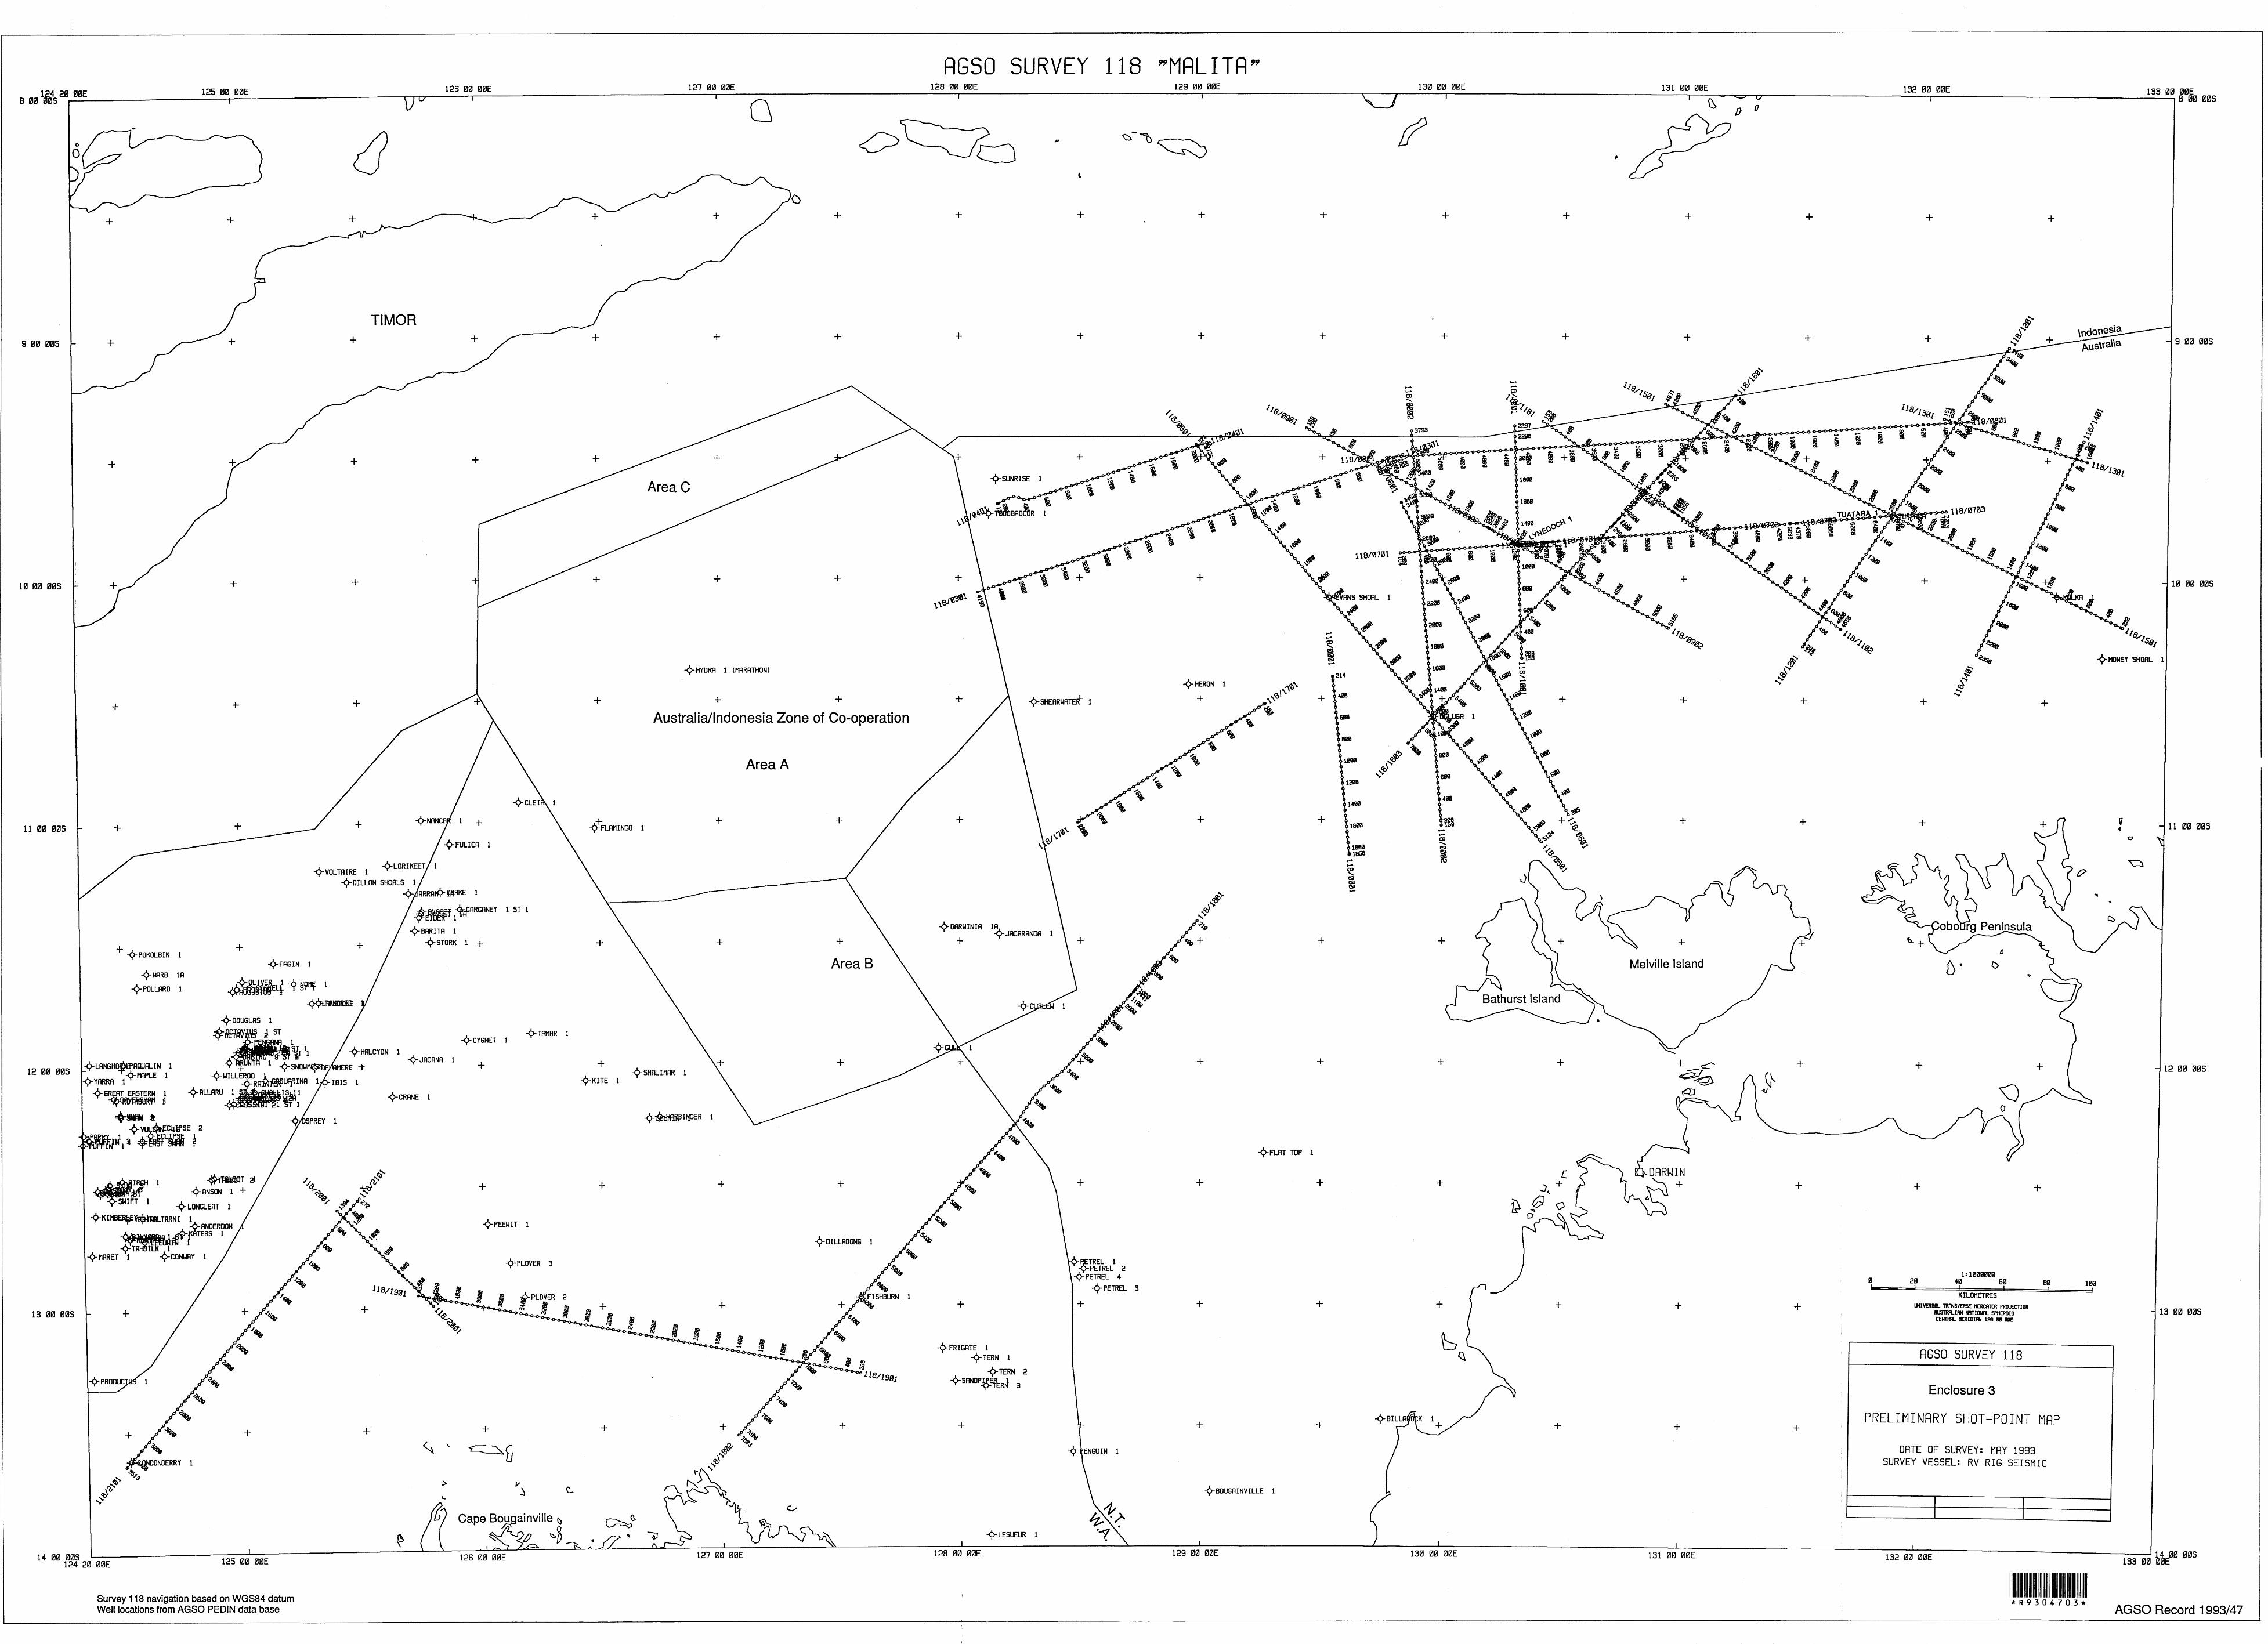
3. Preliminary shot-point map (Survey 118, 1:1 000000)
4. Deep seismic surveys in the Timor Sea region (Survey 118/ other AGSO surveys / BIRPS lines - plus tectonic elements, 1: 1 000 000).
APPENDICES
Page
1. Information on Research Vessel Rig Seismic ........................................................... 51
2. Scientific equipment on Rig Seismic ........................................................................ 52
3. Crew list - Survey 118 ............................................................................................ 54
4. Exploration wells tied during Survey 118 ................................................................ 55
5. Way points used in Survey 118 ............................................................................... 56
6. Survey 118line summary ........................................................................................ 58
7. S ·· . .. 59 eIsrruc acquISItiOn parameters ............................................................................... .
8. Seismic acquisition geometry ........... , ...................................................................... 60
9. Seismic streamer parameters and noise levels ................................................. '" ...... 61
10. Water depths at start and end of seismic lines .......................................................... 63
11. Seisnric tape listing .................................................................................................. 64
3 © Australian Geological Survey Organisation, 1993
12. Magnetic data acquisition details ............................................................................. 65
13. Locations of GPS aerials and echo-sounder transducers .......................................... 66 •
14. Non-seismic data acquisition channels ..................................................................... 67
15. Gravity tie data, pre Survey 118 .............................................................................. 70
16. Gravity tie data, post Survey 118 ............................................................................ 71
17. Magnetometer cable length ..................................................................................... 72
•
4 © Australian Geological Survey Organisation, 1993

•
•
•
EXECUTIVESU~ARY
The objectives of Survey 118 were twofold. The primary objective was the acquisition of high quality deep seismic data and other geophysical data over the eastern Malita Graben region (including the Calder Graben and western part of the Goulburn Graben) in the northern Timor and western Arafura Seas (Project 121.39). The secondary objective was to collect deep seismic data on several long regional traverses in the Petrel Sub-basin -Londonderry Arch - NE Browse Basin region. The cruise was part of a continuing major program by AGSO designed to establish the structural architecture of the northwest Australian continental margin, examine reactivation histories and develop models for basin evolution in the region. The program aims to assist petroleum exploration and development of offshore resources.
The Rig Seismic left Darwin at 1700 hrs (local time) on Friday 30 April 1993 and transited to the Malita Graben survey area to the northwest. Seismic acquisition began at 0800 hrs on Monday 3 May. The survey progressed well and without major interruption. Survey operations were suspended on two occasions due to bad weather; total time lost was about one day. Seismic cable inspection and maintenance, including replacement of batteries in depth controllers, also resulted in some down-time. The survey ended in the NE Browse Basin at 0300 hrs Saturday 29 May. The ship transited back to Darwin, arriving at 0815 hrs on Monday 31 May .
There was no significant damage to the streamer, and apart from 3 Norwegian buoys (from the gun arrays), there was no loss of equipment When the seismic cable was retrieved at the end of the survey, it was found to be in very good condition and no sections had to be replaced. Breakdown of the ship's shaft generator and failure of the UPS (Uninterruptible Power Supply) early in the survey had little impact on productivity, apart from the loss of 6 hours survey time incurred in looping back on line. A total of 5 gun maintenance loops were required during the crUise; an additional loop was needed to free a tangle on one array between towing chain and gun bundle.
Both the seismic and non-seismic (DAS) acquisition systems ran without problems and there were no system crashes. The onboard, real-time monitoring systems gave good QC on the data as they were collected. Navigational data were of very good quality, with differential GPS positioning being available at least 95% of the time.
Data collected on Survey 118 comprised:-• Deep seismic reflection data, 48-fold, 16 second record-length. These were acquired
with a 4800 m active length streamer and dual tuned arrgun arrays (20 sleeve-guns of 50 litres total capacity).
• Gravity data on all lines, i.e. on all seismic lines and all transit lines. • Magnetic data on .... 90% of seismic lines and most transits. • Bathymetry data on all lines .
A total of 17 seismic lines were shot in the Malita - Goulburn Graben region, and 4 lines were shot in the Petrel Sub-basin - NE Browse Basin area. The lines were tied to 7 exploration wells. The total seismic production was 3602 line-km. Of this, 2858 km were
5 © Australian GeolOgical Survey Organisation, 1993

collected in the Malita - Goulburn Graben region and the rest (744 km) were collected on the 4 regional lines in the Petrel Sub-basin - NE Browse Basin area.
Survey 118 was a very successful operation with all lines in the planned core seismic program completed and a further two lines (on the Sahul Platform and across the western Goulburn Graben) added.
6 © Australian Geological Survey Organisation, 1993
•
•
•
•
•
•
INTRODUCTION
The Australian Geological Survey Organisation (AGSO) conducted a deep crustal seismic survey, AGSO Survey 118, in the Timor and western Arafura Sea area (Figures 1 and 2) in May 1993. The survey was the data acquisition phase of Project 121.39 'Deep structure of the eastern Malita Graben region' (pigram, 1992a). The survey vessel, RV Rig Seismic (Appendices 1 and 2), left Darwin on 30 April and returned to the same port at the end of the cruise on 31 May 1993. The shipboard personnel comprised 15 AGSO scientists and technicians, a university student and 14 Australian Maritime Safety Authority (AMSA) crew (Appendix 3).
The primary purpose of the Survey 118 data acquisition program was to collect new deep seismic and other geophysical data that would: -(1) establish the regional structural framework of the eastern Timor Sea region by
examining the boundaries between the major structural elements along a series of transects,
(2) provide modem regional seismic tie lines through the wells in the region to facilitate province-wide correlations,
(3) determine the deep crustal structure of the Malita and Calder Grabens, (4) examine the effects of the deep crustal structure and its reactivation on the location of
the known petroleum accumulations.
Data were collected on 17 lines in the eastern Malita Graben / Calder Graben / western Goulbum Graben region. This part of the survey area extends west to the Australia / Indonesia Zone of Co-operation and north to the Indonesian border. In addition, data were acquired on 4 regional lines in the Petrel Sub-basin I Londonderry Arch area north of the Kimberley coast The extent of the survey coverage and precise locations of the survey lines are shown in the accompanying time-annotated track maps (Enclosures 1 and 2) and seismic shot-point maps (Enclosures 3 and 4). The seismic lines were tied to 7 exploration wells (Appendix 4).
The data collected comprise, (i) 16 second record-length, 48-fold seismic (shot using a 4800 m streamer and 50 litre dual airgun array), (ii) bathymetry, (iii) gravity and (iv) magnetics.
This Record is a post-cruise operational report on Survey 118.
BACKGROUND TO PROJECT AND SEISMIC PROGRAM
In 1990 the Marine Geoscience and Petroleum Geology Program (MGPG) of AGSO began a program of deep seismic acquisition (record length to 16 seconds) along the northwestern continental margin of Australia. The aim was to have a complete regional data set that covered the region from North West Cape to the western Arafura Sea by 1994. This sector of the Australian margin was seen to be the most prospective region outside of the Bass Strait basins, and the likely source of Australia's future hydrocarbon supplies. Portions of this margin have been explored in detail since the 1960's, but there has been little recent analysis of the regional structural framework using either modern extensional tectonic
7 © Australian Geological Survey Organisation, 1993
concepts for the fonnation of the margin (eg. Lister et aI., 1991) or modem collisional tectonic concepts (eg. Beaumont, 1980; Allen and Homewood, 1986) for the deformation • of parts of this margin.
The MGPG program on the northwest margin of Australia is designed to establish the gross architecture of the margin by imaging the margin forming structures and examining their reactivation histories through time. This infonnation will be critical in developing new exploration strategies, and will assist future basin framework and resource studies of the region.
A number of cruises under this MGPG program, designed to address the margin structural framework problems of this region, have already taken place and several others are planned for the period mid-1993 to late 1994. Those planned include Browse Basin, offshore Canning Basin and Scott Plateau - Roti Basin. Cruises that have already taken place are: i) Vulcan Graben - 1900 km of deep seismic data - acquisition completed December
1990 (O'Brien and Williamson, 1990), ii) Bonaparte Basin (petrel Sub-basin) - 2200 km of deep seismic data - acquisition
completed May 1991 (Willcox and Ramsay, 1991), iii) North Carnarvon Basin I - 1654 km of deep seismic data - acquisition completed June
1991 (Stagg et aI., 1991), iv) North Carnarvon Basin II - 2868 km of deep seismic data - acquisition completed July
1992 (Stagg et al.,1992).
In addition, AGSO recently completed a deep seismic survey (Survey 116) in the Australia / Indonesia Zone of Co-operation (ZOC) and adjacent areas (pigram, 1992b). This survey, • conducted in association with N opec Australia Pty Ltd, took place between 22 January and 8 March 1993 and resulted in the acquisition of 3768 km of seismic data (Enclosure 4). Of this, 1020 km were collected to the east of the Zone of Co-operation - on lines of the proposed East Malita Graben program (pigram, 1992a). These data were acquired earlier than originally planned because shooting of proposed lines across ZOC Area C and the Timor Trough in Indonesian waters could not proceed as a result of delays in finalisation of the requisite agreement between AGSO and PERT AMINA.
It was hoped that the agreement would be in place by the scheduled start of Survey 118, or at least early in this cruise, so that the proposed survey work in Indonesian waters could be undertaken as part of the cruise. This was not to be, however. Modifications to the Survey 118 program were made to compensate for this.
Immediately pre-cruise, with the assumption that the Indonesian work would not go ahead, the Survey 118 program was as follows:-• Completion of the eastern Malita seismic program as proposed by Pigram (1992a). • Enlargement of the above program, involving (a) addition of lines MA17 and MA18 in
the Calder / Goulbum Graben area (tying to the Tuatara-1 well and AGSO Survey 106 grid in the Arafura Basin (Enclosure 4; Moore and Ramsay, 1992)), and (b) lengthening of lines MA05, MA08, MA14 and MA15.
• Collection of deep seismic data on regional lines in the Petrel Sub-basin - NE Browse Basin area. These lines comprised, (a) a NE-oriented dip line (PSB) across the Petrel • Sub-basin through the Fishburn-1 well-site (this line would fill a major gap in AGSO Survey 100 coverage of the Sub-basin), (b) a WNW-oriented line (GRA) at the
8 © Australian Geological Survey Organisation, 1993

•
•
•
western margin of the Petrel Sub-basin that would investigate a major gravity low in this area, and (c) a line to tie the Survey 116 network to the Londonderry-1 well in the NE Browse Basin (and thus to the proposed AGSO deep seismic survey in the Browse Basin).
GEOLOGICAL SETTING OF THE MALIT A GRABEN AREA (modified after Pigram, 1992a)
STRUCTURE
The Malita Graben region lies within that part of the northwestern margin of Australia that now forms the foreland to the Timor collision zone. It is bounded on its northern side by the Timor Trough (Figure 4). The Timor Trough generally trends northeasterly adjacent to Timor, but changes to an ENE trend at the eastern end of Timor adjacent to the Sunrise -Troubadour (Figure 3) region. This change in trend is clear in the 200 m bathymetric contour (Figure 3). The southern edge of the trough again swings around to a NE trend at about 1300 20'E. These marked changes in trend suggest an underlying structural control inherited from the structuring associated with formation of the margin.
The eastern Malita Graben region is regarded as the northeasterly part of the Bonaparte Basin. McLennan et al. (1990) place the boundary between the Bonaparte and Money Shoal Basin along the NNE-SSW Lynedoch Bank Fault system (Figure 4), which is assumed to be a reactivated offshore extension of the Proterozoic Tom Turner Fault Zone (McLennan et al., 1990). The principal depocentre in the region is the Malita Graben which trends in a ENE-WSW direction except on its northern end where it swings around to a more NE trend, which is referred to as the Calder Graben. The Malita Graben is asymmetric, with bounding structures of the northwest margin of the graben dipping southeasterly (Northern Territory Geological Survey, 1990; West et al., 1992).
The Graben is surrounded by platforms comprising relatively shallow basement with thin Mesozoic and Cainozoic cover. The Sahul Platfonn occurs to the north, the Darwin Platfonn/Shelf (and adjoining Bathurst Terrace) to the south and the Money Shoal Platform to the east (Figure 4). The Money Shoal Platfonn separates the Malita/Calder Graben from the Goulburn Graben to the east (Figure 4).
The Malita Graben is thought to be either a Late Paleozoic or Mesozoic structure. The timing of the initiation of the Malita Graben is controversial with Botten and Wulff (1990) and Northern Territory Geological Survey (1990) suggesting that it was initiated during the Jurassic, whereas McLennan et al. (1990) favour a late Permian initiation. The total sediment thickness is not known. It may be up to 10 km thick (Northern Territory Geological Survey, 1990; West et al., 1992). The basin-forming structures are not imaged on conventional 5 or 6 second seismic records. It may also have a Paleozoic structural and depositional precursor, as does the Petrel Sub-basin to the south. The graben is thought to be the kitchen for hydrocarbon generation is this region .
9 © Australian Geological Survey Organisation, 1993
STRATIGRAPHY
The stratigraphy of the region is poorly known due to the sparsity of wells, and the • nomenclature used is usually that applied to the Bonaparte Basin. The thickness and age of sedimentary packages vary with structural provinces. The Darwin Shelf has a thin cover of Jurassic to Cainozoic sediments overlying basement (Northern Territory Geological Survey, 1990; Mory, 1991). The Sahul Platform has less than 5000 m of late Permian to Recent section and the Money Shoal Platform is thought to be covered by a Mesozoic and younger section (Mory, 1991; McLennan et al., 1990). The middle of the Mallta Graben has only been drilled at Heron-I, which bottomed at 4208 m depth in mid Jurassic sediments.
The major sediment groups encountered during drilling in the eastern Mallta region are: (i) the Permian Kinmore Group, (ii) the Triassic to Jurassic Troughton Group, (iii) the Jurassic Flamingo Group, (iv) the Cretaceous Bathurst Island Group (BIG) and (v) Cainozoic carbonate and siliciclastic sediments (Figures 5 and 6). The oldest sediments encountered by drilling so far are late Permian carbonate sediments in Troubadour-I. The Troughton Group was intersected in the Troubadour-l and Shearwater-l wells. The Troughton and Flamingo Groups are separated by a Callovian unconformity, which is attributed to a major tectonic event associated with the breakup of the margin (Mory, 1991). The Flamingo Group varies from 867 m of mainly grey silty pyritic claystone in Heron-1 to 25 m of mainly siltstone in Evans Shoal-I. The Flamingo Group pinches out laterally on the Darwin Shelf and the Sahul Platform. It is less than 8 m thick in Troubadour-1 and consists of coarse sand. The Flamingo Group is separated from the overlying Bathurst Island Group by a Valanginian unconformity. Elsewhere in the region the basal Bathurst Island Group consists of a greensand-rich condensed section. The Bathurst Island Group in the Malita Graben consists • of over 2000 m of section (Botten and Wulff, 1990).
The Cainozoic sediments consist of basal sandy units that grade up into shallow-water carbonate sediments. There is a major hiatus in the Oligocene and probably also in the Miocene, but the section has not been well sampled.
PETROLEUM EXPLORATION OF THE MALIT A GRABEN AREA (modified after Pigram, 1992a)
Exploration began in the eastern Malita Graben region during the 1960's when Shell collected regional seismic data and aeromagnetics in the eastern part of the region and Woodside and Arco led consortia collected regional seismic data in the western part. Woodside and Arco collected over 9000 km of regional data from 1969 to 1974. This led to the drilling of several wells. In 1971 Arco drilled Heron-1 just north of the middle of the Malita Graben. The well had gas shows at several levels (including Lower Cretaceous limestone and claystone, and in Jurassic sandstone), but was not tested. In 1973, Shell drilled Lynedoch-1 also on the northern flank of the graben. It was plugged and abandoned after recording gas shows. Arco drilled a dry hole at Shearwater-l in 1974 and a Woodsideled consortium made gas and condensate discoveries at Sunrise-1 and Troubadour-1 located on the Sahul Platform. These hydrocarbons are reservoired in the middle Jurassic Plover • Formation. Troubadour flowed 279 000 l'lY of gas and 38.8 kL of condensate per day (Northern Territory Geological Survey, 1990; Mory 1991).
10 © Australian Geological Survey Organisation, 1993
•
•
•
During the mid 1980's, Western Mining Corporation (WMC) collected 2500 Ian of seismic data (Durrant and Young, 1988). This led to the drilling of Evans Shoal-l by BHP Petroleum (BHPP) in 1988. Evans Shoal discovered gas in Mesozoic sands. During the late 1980's, BHPP collected regional aeromagnetics and seismic data in permit NT/P41 and further east. In 1990 BHPP drilled Tuatara-l in the western part of the area and Beluga-l on the southern flank of the graben in 1991. Beluga had gas shows but Tuatara was dry.
In early 1992 the British Institutions Reflection Profiling Syndicate (BIRPS), in conjunction with Marine Geoscience Institute of Indonesia (MGI), conducted a deep crustal survey (20 second records) across the Banda Arc to the east of Timor (Enclosure 4). These lines finished on the outer shelf just within Australian waters.
PETROLEUM GEOLOGY OF ADJACENT AREAS· WESTERN GOULBURN GRABEN AND PETREL SUB·BASIN
GOULBURN GRABEN AREA
Recent accounts of the petroleum geology of the western Arafura Sea area are provided by Northern Territory Geological Survey (1989), Bradshaw et al. (1990), McLennan et aI. (1990) and Labutis et al. (1992). This area is underlain by the Arafura Basin, which contains a thick Cambrian to Penno-Triassic sedimentary sequence. The Goulburn Graben (Figure 4) is a deep northwest-trending structure within the basin. It has over 10 Ian of faulted and folded Paleozoic section. The Arafura Basin is overlain by relatively flat-lying, mid-Jurassic to Cainozoic sediments of the Money Shoal Basin.
The Arafura Basin was a stable platform dominated by carbonate deposition during the Cambrian and Ordovician (Bradshaw et al., 1990). Marine and non-marine clastics, with minor carbonates, were deposited during Late Devonian and Late Carboniferous. Movement on bounding faults of the Goulburn Graben fIrst took place in the early Carboniferous (Bradshaw et al., 1990) or early to middle Devonian (Labutis et al., 1992). However, major graben development and deformation did not occur until the PermoTriassic. Westward tilting accompanied this structural development. Uplift produced largescale erosion in the Late Triassic to Early Jurassic.
Eight exploration wells have been drilled in the Goulburn Graben. All were sited on structural targets and most recorded oil shows. Good quality source rocks occur at Cambrian, Carboniferous and Middle Jurassic to Lower Cretaceous levels (McLennan, 1990).
PETREL SUB-BASIN
The geology and hydrocarbon potential of the Bonaparte Basin, and specifically the Petrel Sub-basin, are described by Lee and Gunn (1988), Northern Territory Geological Survey (1990), Mory (1991), and O'Brien et al. (1993). The Late Carboniferous to Cainozoic stratigraphy is shown in Figure 7.
11 © Australian Geological Survey Organisation, 1993
The northwesHrending Petrel Sub-basin developed by rifting in the Late Devonian to Early Carboniferous. The rift system was compartmentalised by northeast-trending accommodation (transfer fault) zones. Part of this rift system (particularly the northwest) • was overprinted in the Late Carboniferous to Early Pennian by the Westralian Super-basin rift system, which developed on a northeast trend. Thermal subsidence continued until Late Triassic, resulting in deposition of 10-14 km of relatively unstructured sediments.
There followed 3 important, but low magnitude, reactivation events (O'Brien et al., 1993): (i) compression in Late Triassic to Early Jurassic (expressed as uplift and folding ego Tern structure -see below), (li) extension in late Middle to early Late Jurassic (associated with continental rifting and breakup), and (iii) compression in Late Jurassic I Early Cretaceous (which slowed or stopped seafloor spreading in the Argo Abyssal Plain).
Sedimentation during the Mesozoic rift and margin sag phase resulted in deposition of a mix of terrestrial and marine facies. Northwesterly tilting of the basin in the late Cretaceous and Tertiary led to deposition of thick, fme-grained siliciclastic and prograding carbonate wedges.
A significant thickness of evaporites is believed to lie in the basal (? Siliurian) section of the basin. Seismic data show salt diapiric penetration of the late Paleozoic to Tertiary section at several locations in the sub-basin.
Large gas-condensate fields, Petrel and Tern, were discovered in the central Petrel Sub-basin in 1969 and 1971, respectively. The hydrocarbon reservoirs of both fields occur in • sands of the Late Permian Hyland Bay Formation (Figure 7).
PROJECT OBJECTIVES IN THE MALIT A GRABEN AREA (after Pigram, 1992a)
The major objectives of the Malita Graben project are to:-1) detennine the regional structural framework of the eastern Timor Sea region by
examining the boundaries between the major structural elements along a series of transects;
2) provide modern regional seismic tie lines through the wells in the region to facilitate province wide correlations;
3) determine the deep crustal structure of the Malita and Calder Grabens; 4) examine the effects of the deep crustal structure and their various phases of
reactivation on the known petroleum accumulations.
More specifically, the project has been designed to:-• examine the structural relationship of the Malita and Calder Grabens to their
surrounding platforms • examine the structural development of the Darwin, Sahul and Money Shoal Platfonns • determine the timing and style of reactivation of the major structures • examine the age and nature of the movement on the bounding structures of the
Malita Graben. In particular, detennine the nature of the northern bounding fault • system. On conventional industry data sets the graben-fonning structures are not evident and several ages have been suggested for the formation of the graben.
12 © Australian Geological Survey Organisation, 1993
•
•
•
•
•
•
•
detennine the extent and nature of any Paleozoic underpinning, and its influence on both the structural and depositional history of the graben attempt to detennine the distribution and stratigraphic level of evaporites in the Mallta and Calder Grabens and their role, if any, in the structural history of the basin determine the nature and movement history of the Lynedoch Bank Fault Zone. This structure appears to be the eastern boundary to the Bonaparte Basin and the eastern boundary to the Mesozoic passive margin. determine the pre-collisional nature of this segment of the margin in terms of its upper or lower plate affinities as described in detachment models for margin formation (Lister et al., 1990). Detennining the pre-collisional nature of the margin may be essential for predicting the nature of the collision-induced reactivation of the margin-fonning structures. .,
EXECUTION OF SEISMIC PROGRAM
Mter leaving Darwin and reaching the Malita Graben survey area, the seismic cable was deployed, tested and adjusted to achieve correct balance. Seismic acquisition commenced at 0800 hrs on Monday 3 May. The survey progressed well and without major interruption, though acquisition conditions were often marginal due to rough seas. The last line was completed in the NE Browse Basin at 0300 hrs Saturday 29 May.
Sea conditions were generally not as favourable as one would have wished for the type of seismic work undertaken. Calm seas would have been a bonus in shooting the long recordlength data. As it was, seas were moderate or calmer on fewer than about 6 days. Rough seas, driven by persistent 20-30 knot east or southeast trade winds, were frequently experienced. The strong winds were caused by reinforcement of the easterly trades by a succession of high pressure systems located over southern Australia. Modifications to the acquisition program were made when high streamer noise levels or potential damage to outboard gear were a possibility due to very rough seas and large swell. Survey operations were suspended on two occasions due to bad weather. Total time lost while waiting for weather conditions to improve was about 1 day.
During times of rough seas and short, steep swell, it was our experience that noise levels were lowest when heading across the prevailing seas, and at their highest when heading directly into the seas. The difference was quite significant Following seas were only marginally better than oncoming seas. The higher noise levels encountered when heading into, or running with the seas, are attributed to heavy tugging on the tow leader as the ship pitches in the swell. On some lines where streamer noise was a potential problem, it was reduced to a satisfactory level by increasing the depth of the streamer from 10 m to 12 m and slowing the ship to about 4.4 knots.
MODIFICATIONS TO PRE-CRUISE PROGRAM
The seismic acquisition program was executed as planned, except for the following additions and changes.
13 © Australian Geological Survey Organisa tion, 1993
1. Line 118/0401 (MAXI) was added. This line runs in a NNE direction from the vicinity of the Troubadour-l and Sunrise-l wells (NE Sahul Platfonn) to the border with Indonesia (Enclosure 3). It ties the northern ends of several AGSO deep seismic lines • (Survey 116 and 118) and also ties the BIRPS-D line into the AGSO regional network for the first time. It allowed useful data to be collected on what would otherwise have been a long transit between the end of 118/0301 and the start of 118/0501.
2. Line 118/1401 (MAX2) was added. This line runs SSW across the Goulburn Graben just west of Kulka-I. It is the first deep crustal (16 second) seismic line to be shot across the Goulburn Graben. It was shot when sea conditions were too rough to commence the only Survey 118 line (MA14 - 118/1501) left to do in the area. Noise levels during shooting of 118/1401 were relatively low since the line was oriented across the prevailing wind and swell direction (ESE).
3. Line 118/2001 (MAX3) was added to replace a westward continuation of 118/1901. This 'dog-leg' in the original line GRA significantly reduced transit time to the start of the final line (118/2101), allowing just enough time to tie to the Londonderry-l well and complete the full seismic program before returning to Darwin.
Way points used for navigation during Survey 118 are given in Appendix 5.
CRUISE NARRATIVE
A chronology of the main events during Survey 118 is provided below. Times indicated are • local, i.e. Central Australian Time. 0000 UTC(GMT) == 0930 hrs local.
Friday 30 April
Rig Seismic left Darwin at 1700 hrs and steamed northwest at -9.7 knots towards fIrst seismic line (MA13N) to be shot in Malita Graben. Pre-survey and safety meeting was conducted at 1830 hrs.
Saturday 1 May
The tailbuoy went over the side at 0745 hrs; the seismic cable was deployed progressively throughout the day. Fire drill / muster was held at 1230 hrs. Standard pre-survey calibrations and tests carried out. Seas rough with easterly wind to 30 knots.
Sunday 2 May
Seismic cable fully deployed by 0400 hrs. Two sections found to be 'heavy' during preceding Trials (S 117) were replaced during deployment Cable perfonnance was monitored while running at different angles to prevailing seas. Began retrieving front end of cable at 1200 hrs in order to improve balance by adding and • redistributing lead. Damaged stretch section was replaced. On redeployment, cable balance
14 © Australian Geological Survey Organisation, 1993
•
•
•
still not satisfactory at front end. Problem was traced to faulty DT in depth controller (bird #2). Bird was replaced; subsequently cable ran well and within depth specifications . Proceeded to the start of line MA 13N. Had to loop back because of minor gun problems.
Monday 3 May The last group on one gun array was still inoperative so a second loop was necessary. Seismic acquisition began at 0805 hrs in moderate sea state. Finished the first line (118/0001) at 1657 hrs. Started line MA12 (118/0002) at 2353 hrs.
Tuesday 4 May
Magnetometer was deployed and operating at -0900 hrs. Completed line MA12 (118/0002) at 1924 hrs.
Wednesday 5 May
Started line MA 1 OA (118/0301) at 0148 hrs and completed the line at 2238 hrs.
Thursday 6 May
Began shooting line MAXI (118/0401) at 0457 hrs, starting at the NE end of line 116/0902. Encountered a group of 3 Indonesian long-line fishing boats about 10 Ian from the start of line. Their movements were erratic and unpredictable, so had to deviate off the planned line. The line was relocated (2 new way points - 09° 40.663' 128° 16.974' and 09° 27.000' 1290 00.000') and shooting continued. Seas were moderate. but streamer was run at 12 m depth to reduce noise. MAXI was completed at 1622 hrs.
At the start of line MA05 (118/0501). a number of the starboard array guns failed to fire correctly. The problem was fixed soon after (at 2258 hrs). By this time, however, the first S.6 Ian of line had been missed. Because this small segment of the line was not critical to the program, it was decided not to do are-run - which would have meant a 6-hour loop. The guns were fully operational in time for a full-fold tie to line MAXI (118/0401).
Friday 7 May
Shooting MA05 (118/0501). At - 0900 hrs two fishing boats were close to the tailbuoy -managed to make contact by radio just in time and warn them to stay clear.
Saturday 8 May
Line MADS (118/0501) was completed at OOSO hrs. Line MA06 (118/0601) was started at 0710 hrs. The magnetometer output had become increasingly noisy. Consequently the
15 © Australian Geological Survey Organisation, 1993
sensor fish was recovered at 1245 hrs for inspection. The fish had a 2 em tear in the diaphragm and some salt-water was found in the fluid (white spirit). The diaphragm was • replaced, the sensor re-filled and redeployed at 1610 hrs. The noise level returned to a low 1-2 nT.
Sunday 9 May
Finished line MA06 (118/0601) at 0001 hrs. Started MA1S (118/0701) at 0508 hrs. Operations came to a temporary halt at 1256 hrs when the ship's shaft generator broke down. Power went off in the Instrument Room. Because of a fault the UPS (Uninterruptible Power Supply) did not take over immediately. Power was restored using the ship's emergency and auxiliary generators. The acquisition systems were rebooted and shooting recommenced after looping back on the line. The new segment of line MA15 (118/0702) was started at 1848 hrs.
Monday 10 May
Shooting of this segment ended at 0810 hrs when gun maintenance was required. The ship was back on line and shooting the third segment of MA15 (118/0703) at 1428 hrs It was completed at 2239 hrs.
Tuesday 11 May
Shooting ofline MAlOB (118/0801) started at 0450 hrs.
Wednesday 12 May
The line was completed at 0915 hrs. The seas, which had been moderate-rough since the start of the survey, finally calmed down. It was an opportune time to inspect the streamer and tailbuoy and to exchange 4 birds (cable levellers) whose batteries were getting low. This work was done in the early afternoon (1200-1430 hrs) after the streamer had been sUIfaced, using the ship's Zodiac (rubber dinghy).
The streamer was seen to be in good condition; a piece of old netting was removed from the tailbuoy. Because of some gun timing problems experienced on the previous line, the solenoids were re-built as per pre-Trials (Le. ZOCA S116 etc). This work was done while in transit to the start of the next line MA07 (118/0901). This line was begun at 2019 hrs.
Thursday 13 May
Shooting of MA07 had to be interrupted mid-line at 0639 hrs for gun maintenance. The second segment of the line (118/0902) was begun at 1307 hrs, and completed by 2313 hrs.
16 © Australian Geological Survey Organisation, 1993
•
•

• Friday 14 May
•
•
Line MAll (118/1001) was started at 0717 hrs and completed at 1837 hrs.
Saturday 15 May
Line MA08 (118/1101) was begun at 0040 hrs. Acquisition was tenninated at 0935 hrs because several air leaks had developed, dropping the air pressure below 1600 psi. Shooting of the line (segment 118/1102) was resumed at 1533 hrs after gun repair. The weather had been deteriorating - seas were rough with a large swell; the southeasterly winds had risen to 25-30 knots. To reduce streamer noise, the streamer was driven to 12 m depth and ship's speed was reduced to 4.4 knots. Despite this, noise levels remained high (often in the order of 5 microbars mean RMS) due to cable tug as the ship pitched in the head-on seas.
Sunday 16 May
MA08 was completed at 0321 hrs. Seismic acquisition began on line MA17 (118/1201) at 0914 hrs. Seas continued to be rough with a short, steep swell. Winds were east to southeast at 25-30 knots. Streamer noise levels were reasonable (2-3 microbars) since the line was oriented across, rather than in, the direction of the prevailing seas. Ship's speed was initially reduced to 4.4 knots and the streamer run at 12 m depth to reduce noise. In the late afternoon the wind eased and speed was increased to about 5.0 - 5.2 knots. A magnetic anomaly of -15 nT was recorded over the Tuatara-l well site; as seen on the earlier crossing, the anomaly in the area is of low amplitude and unexpectedly broad
Monday 17 May
In the early hours of the morning there were rain squalls and seas were very rough. Line MA17 was finished at 0428 hrs. The seismic cable was partly retrieved (while steaming WNW, i.e. with seas from behind) to replace batteries on birds # 1 and 2. The seas were still rough as the ship headed to the start of MA18 (118/1301). Shooting commenced at 1325 hrs. As expected, noise levels were high because of the oncoming seas and the short, steep swell (similar conditions to those encountered on line MAG8). The line was completed at 2154 hrs.
Tuesday 18 May
To allow time for the weather to moderate before shooting the next important line, MA14, it was decided to shoot a new line, MAX2, across the western Goulburn Graben. The streamer (and tailbuoy) would then be retrieved for general inspection and maintenance, but
17 © Australian Geological Survey Organisation, 1993
especially to renew batteries on all the birds. The bird batteries had run down more quickly than usual because the birds had to 'work' harder in the rough seas. Line MAX2 (118/1401) was begun at 0211 hrs, and completed at 1354 hrs. Cable noise • levels were satisfactory at 2-3 microbars despite rough seas and 20 knot easterly winds Recovery of the streamer commenced at 1800 hrs. It was done with the ship slowly steaming downwind. i.e. with following seas, to reduce the strain on the streamer. Balance of the streamer was fine-tuned by adding and taking off lead as it came aboard.
Wednesday 19 May
The streamer and tailbuoy were onboard by 0300 hrs. Electronics maintenance work was done on the tailbuoy and its dGPS as the ship proceeded towards the start of the next line, MA14. Weather conditions remained bad, with strong winds, rough seas and a large breaking swell. Consequently, re-deployment of the streamer was delayed until some improvement in the weather was evident. Weather conditions eased about mid-day, and at 1300 hrs the redeployment began - with the ship slowly steaming up-wind During the deployment, 5 active sections (# 47, 40, 39, 28 & 5) had minor damage and were replaced. After deployment, bird #2 was found to be defective. The front of the streamer was pulled in and the bird replaced
Thursday 20 May
Seismic acquisition recommenced at 1010 hrs on line MA14 (118/1501). The seas and swell had moderated. The mean RMS noise on the seismic cable was typically 3-4 microbars along the fIrst part of the line, later decreasing. A sharp 25 nT magnetic anomaly was recorded over Kulka-I.
Friday 21 May
Line MA14 (118/1501) was completed at 1119 hrs. Shooting of line MA09 (118/1601) started at 1946 hrs. Seas were moderate with easterly winds of 10-15 knots; the weather was showing signs of improvement Streamer noise was down to - 2.2 microbars.
Saturday 22 May
The gun bundle and main towing chain of the port array were seen to be wrapped around each other. The guns were shut down and brought aboard - there was no significant visible damage. The line segment was terminated at 0121 hrs and the ship looped back to recontinue the line. The second segment (118/1602) was started at 0611 hrs.
•
Mter several hours of shooting, 4 of the 5 guns of the second group of the port array had problems (1 olc solenoid, 1 air leak & 2 with timing problems). The line was terminated for • maintenance (last good shot at 1000 hrs). Having looped back on line, the third segment of the line (118/1603) was commenced at 1617 hrs.
18 © Australian Geological Survey Organisation, 1993

• Sunday 23 May
•
•
The line (MA09) was completed at 0710 hrs in moderate-rough seas on a moderate swell. Shooting of line MA16N (118/1701) began at 1432 hrs in similar sea state and fine weather conditions.
Monday 24 May
Line MA16N (118/1701), the final line of the Malita Graben seismic program, was completed at 0138 hrs. Line PSB, the first of the regional lines to be shot in the Petrel Sub-basin / Londonderry Arch area, was begun at 1013 hrs. Acquisition conditions were good - slight to moderate seas on a low swell. Auto-fIring of a gun on the port array about quarter way down line PSB meant that it was necessary to stop acquisition (at 1530 hrs) and loop back on the line. The auto-fIres were due to the combination of 2 faults - a leaking gun and a U/S Hoke valve. About 7 hours survey time were lost Line PSB was restarted at 2158 hrs as line segment 118/1802.
Tuesday 25 May
A 1.05 nautical mile deviation had to be made in 118/1802 in the early hours of the morning (-0330 hrs) to avoid an anchored RAN warship. Two submarines were also in the area. The vessels were part of a naval fleet on exercise in the Timor Sea. By mid-day, seas were moderate to rough. Streamer noise levels were 1.9 - 2.4 microbars. The ship crossed over the Fishburn-1 well site at 1743 hrs (S.P. 6197) - a distinct 45 nT magnetic anomaly was registered Towards the end of line, noise levels were down to 1.9 microbars; the tailbuoy feather angle was up to 15° to starboard because of strong tidal currents.
Wednesday 26 May
Line PSB (118/1802) was finished at 0233 hrs. During the transit to the next line (GRA) the weather deteriorated, with the seas rising to very rough on a short, steep swell; winds were 30 knots. The start of shooting on GRA (118/1901) was delayed by about 5 hours until there was an improvement in the sea state. Streamer noise levels and shortage of gun spares were factors in deciding to hold back on shooting. The line was started at 1632 hrs in following seas. Streamer noise was about 2.5 microbars mean RMS with the streamer at 12 m depth .
19 © Australian Geological Survey Organisation, 1993

Thursday 27 May
Moderate seas with 15-20 knot winds; there was little ship movement (pitching/rolling) in • the following seas. Ship's speed ranged from 4.4 to 5.5 knots, depending upon direction and strength of tidal flow. Line GRA (118/1901) was tenninated at 1400 hrs to allow maintenance to be done on the gun arrays. To allow enough time to complete the tie to the Londonderry-l well, it was decided to shoot a new line (MAX3, 118/2001) direct from the gun maintenance point to the start of the next (and last) line LON. The start of LON corresponds (i.e. ties) to the end of line 116/0702. Shooting ofMAX3 (118/2001) began at 2231 hrs.
Friday 28 May
MAX3 was finished at 0512 hrs. Acquisition on line LON (118/2101) commenced at 0932 hrs. An air leak developed at the U-tube at the base of the starboard array Xmas tree. In an attempt to fIx the problem, the starboard array was briefly shut down at 1603 hrs and the Utube replaced by a high-pressure hose. 11 shots on the starboard array were missed. The leak: proved to be in the fitting. To replace the fitting would have taken some time, and meant a time-consuming loop to resume the line. Since the leak: had no significant effect on • the air pressure to the guns, it was decided to keep shooting to the end of the line. Moderate seas with 15-18 knot ESE wind.
Saturday 29 May
Soon after the tie to the Londonderry-l well was made, an air leak: also developed at the port array Xmas tree. The line was terminated at 0236 hrs about 1.9 nm past the well site. No pronounced magnetic anomaly was registered over the well site. Recovery of the seismic cable began at 0330 hrs and was completed by 0815 hrs. The cable was in very good condition and no sections needed replacing. The transit back to Darwin began as soon as the gear was aboard.
Sunday 30 May
Transit to Darwin across northern Joseph Bonaparte Gulf.
Monday 31 May
Rig Seismic berthed at Stokes Hill Wharf, Darwin, at 0815 hrs. This marked the successful • completion of Survey 118.
20 © Australian Geological Survey Organisation, 1993
•
•
•
DATA ACQUIRED AND SURVEY PARAMETERS
Data collected on Survey 118 comprised:-1. Deep seismic reflection data, 48-fold, 16 second record length. These were acquired
with a 4800 m active length streamer and dual tuned airgun arrays (20 sleeve-guns of 50 litres total capacity).
2. Gravity data on all lines, i.e. on all seismic lines and all transit lines (Figure 1 and Enclosures 1 and 2).
3. Magnetic data on -90% of seismic lines and most transits. 4. Bathymetry data on all lines.
Survey equipment details are given in Appendix 2.
A total of 17 seismic lines were shot in the Malita - Goulburn Graben region, and 4 lines were shot in the Petrel Sub-basin - NE Browse Basin area (Enclosure 3). The lines were tied to 7 exploration wells (Appendix 4). Total seismic production was 3602 line-km, with 2858 Ian collected in the Malita - Goulburn Graben region and 744 Ian in the Petrel Subbasin - NE Browse Basin area. Seismic line infonnation is summarised in Appendix 6.
The total magnetic profile data collected (on seismic lines plus transits and loops) amounted to approximately 4800 Ian (Appendix 12). The total gravity and bathymetric profile data acquired was in the order of 5500 km.
SEISMIC ACQUISITION DETAILS
The seismic acquisition parameters are shown in Appendix 7, and the acquisition geometry (streamer / source configuration) in Appendix 8.
Streamer depth data and tow leader length data (for calculation of offsets) for the entire survey are provided in Appendix 9. Appendix 9 also shows maximum deviations in tailbuoy feather angle for each line, as well as the mean RMS streamer noise for each line. Streamer noise was 2.4 microbars or less on all lines except 118/1101, 1102, 1301 and 1501. Noise levels on these lines, located in the western Arafura Sea, were higher due to the combination of rough seas and unfavourable line orientation (Le. WNW-ESE, in the direction of prevailing wind and swell). When sea conditions were good (slight to moderate seas), the streamer perfonned very well in tenns of noise levels (Figure 8). Under such conditions, noise on most channels at the front end of the streamer was 1.5 microbars or less, and less than about 1.0 microbar towards the rear. Channels at birds (depth controllers) had higher noise levels because of the additional turbulance generated at these locations.
Water depths at the start and end of all the seismic lines are shown in Appendix 10. Tape numbers, together with first and last shot points, are listed for all lines in Appendix 11.
NON-SEISMIC ACQUISmON DETAILS
The locations on the ship of GPS aerials and echo-sounder transducers are indicated in Appendix 13. This infonnation will allow precise positioning corrections to be made to the data.
21 © Australian Geological Survey Organisation, 1993

A list of channel allocations for the non-seismic data is provided in Appendix 14.
Magnetic data acquisition details are tabled in Appendix 12. Shown are start and stop times • of acquisition, the distance the sensor was towed behind the ship during these periods, and also the approximate profile coverage. Magnetic anomalies (?due to steel casing, well head and drilling junk) were recorded over Tuatara-l, Kulka-l and Fishburn-l well-sites. The fact that no significant anomalies were registered over some of the other well-sites may be because of deeper water at these locations.
Gravity ties were made to gravity base stations in Darwin immediately before and after the survey. The pre-survey and post-survey gravity tie data and reductions are presented in Appendices 15 and 16, respectively.
SYSTEMS AND EQUIPMENT PERFORMANCE
NAVIGATION / GEOPHYSICAL (NON-SEISMIC) DATA ACQUISmON SYSTEM (DAS) (Condensed and edited version of report by Richard Mleczko)
There was only one interruption to the operation of the DAS, that was the power black-out associated with failure of the ship's shaft generator on 9 May. There were no problems with the printers, the Roland plotter or the EPC recorders. The tape writing was switched from Unit 1 to Unit 0 because of a few bad blocks encountered on Unit 1. On one occasion Unit o went down and was then brought up again. No data were lost. The system console for the HP failed and was replaced with a spare VT220. At the beginning of the cruise the GED clocks were synchronised with the clock on the Trimble receiver. By the end of the cruise the clocks were 0.5 seconds out as compared with the Trimble.
Navigation
Differential GPS positioning was available most of the time. There was only one lengthy period (58 minutes) when there was no such coverage. On another occasion differential GPS was lost for 14 minutes. Figure 9 shows the percentage of navigation modes in use for each day and for each line.
GPSldGPS (Racal Systems) The two Racal systems had only minor problems. The operation of the software on the two Compaq computers, the operation of the two Trimble receivers and the two demodulators was without incident
The antenna control unit (ACU) of the Racal dome did lose track on about ten occasions during turns and was re-aligned on the manual setting. Every day at the same time the HDOP on Racal #1 became greater than 3 and the navigation switched to Racal #2. This period was between 1400 and 1600 GMT.
•
Dead Reckoning • Dead reckoning was used for very brief periods (less than ten minutes) when the HOOP on both Racal #1 and #2 was high.
22 © Australian Geological Survey Organisation, 1993
•
•
•
Sonar Dopplers The Magnavox sonar doppler operated without incident; the Raytheon DSN-4S0 continued to have a minor instability problem.
(Tyro-cor.npasses There were no problems with the gyros.
Magnetics
The magnetometer was deployed for most of the survey. On a few occasions it was retrieved due to shallow water and shoals.
The sensor was flushed with white spirit at the start of the survey because noisy signal had been reported the last time the magnetometer was used (Survey 116).
The magnetometer worked well initially, but noise levels gradually increased after a few days. The sensor was retrieved, dismantled and closely examined. The diaphragm was found to have a small tear, which allowed entry of a small amount of saltwater. The diaphragm was replaced and the sensor re-filled. Noise levels were very low for the remainder of the cruise.
Gravity
The gyro in the gravity meter was replaced just before leaving Darwin. There was no problem with the gravity meter for the entire survey.
Bathymetly
Both the 3.S and 12 kHz echo sounders worked well. At the end of the trials (Survey 117) a card in the 3.S kHz correllator was replaced and this unit gave no further trouble. Water depths of 20 to SOD m were encountered. In rough weather the 3.5 kHz was turned off due to the continual loss of tracking.
SEISMIC ACQUISmON SYSTEM (Condensed and edited version of report by Ed Chudyk)
The seismic acquisition system ran throughout the survey without problems, other than that caused by the shaft generator/UPS failure. During the survey the minimum shot rate for 16 second record was just over 17 seconds which is a tribute to the Vax system.
Phoenix A-D Converter
IFP number 009, sample and hold number 002, C19/2 and C18/3 were used throughout the survey. The offset of the first 8 IFP stages and the overall offset P2 were set before the start of the survey, as was the offset of the sample and hold card. As the survey progressed the sample and hold offset was adjusted, if necessary, at the start of each line and line part. A dynamic range test was run between lines.
23 © Australian Geological Survey Organisation, 1993

On 13 May the dynamic range test showed the maximum mean signal DC offset to be approximately 400 /lV. P2 was adjusted and the DRT re-run; the maximum offset was • measured at less than 100 /lV at 36.9 DC. There was no further need to adjust P2 during the cruise.
Amplifiers
The usual tests were run on the amplifiers before the start of the cruise. A couple of groups of channels were observed to have low output on the high-cut filter test. These channels were within specification, but gave the appearance of a systematic fault. To remove the . problem, channels 34-50 were changed with channels 130-146 and 174-180 were swapped with 148,158,160 and 156. A check was made to ensure that the DC offset of the swapped channels was not upset. The amplifier tests were re-run and checked and a normalization parameter fIle created.
3480 Tape Drives
The tape drives worked nearly flawlessly all cruise. There was one very minor tape jam on rewind, which was cleared without a problem. Several tapes gave bad block errors; two of these were read without mishap. After the frequency of drive cleaning was increased to three times per shift (day shift), few errors were noted. Several short tapes were discovered; however, these did not adversely affect data acquisition.
Syntron Controller and Depth Controllers <Birds)
The Syntron controller ran very well for the entire cruise. On the other hand, the depth controllers gave some problems. Five birds were changed out by rubber boat when they prematurely flattened their batteries. Later in the survey, the front two birds were changed by partially retrieving the cable. Several days later the entire cable was retrieved and all the birds changed. All the birds, but number 23, worked well until the end of the survey. Bird 23 suffered from intennittent communication problems.
Depth Controller Wing Angles and Cable Lead
A total 5000 wing angles were averaged to produce the graph in Figure 10. As can be seen, the angles were generally negative. Birds 6, 8, 12 and 19 had positive wing angles while birds 9 and 23 had very small negative wing angles. The situation would be better if there was lead on all the sections. However, as the cable lead graph (Figure 10) shows, this is not the case. No lead is present on the cable at birds 6, 8, 9, 12 and 19. Two kilos could be removed near bird number 23.
Gun Array Depth Detectors
•
Two types of depth detectors, analogue and' digital, were used during the cruise. There • appeared to be little difference between the two types of detector. The analogue detectors tended to show larger errors at times, but both types drifted.
24 © Australian Geological Survey Organisation, 1993
• Gun Controller
During the survey a digital storage CRO was used extensively to investigate apparent bad gun timing, when it occurred. Bad timing was generally found to be due to poor sleeve sensor signals (resulting from damage to the sensor lines or pigtails), worn-out guns or worn-out solenoids. The gun controller itself behaved very well.
The gun trigger times were closely observed once the guns had settled down on line. Trigger times varied between 38.5 ms and 49.0 ms. To compensate for very slow firing guns, the trigger target and window were changed to 45.0 ms and 7.5 ms' respectively. A narrower window of say 7.0 and a target of 44.5 would probably work slightly better. At no time did the modified window and target cause any problems with gun timing.
Source Sensors
The source sensors worked well at the start, but lost sensitivity as the cruise progressed. Spurious signals were occasionally seen on the sensor traces. All the guns in the group were observed with the digital CRO and none could be found auto-firing. It was concluded that the apparent auto fires were in fact some form of cross-feed in the bundle.
ELECfRONIC ENGINEERING REPORT (Condensed and edited version of report by Martin Callaway)
• Instrument Room and DAS
Phoenix A-D Converter
•
FPC assembly FPC008/B 1, originally operational after trials 117, was adjustable well within the 300 JlV DC mean offset specifications, but performed badly in terms of linearity (up to 1.8% spread on dynamic range test). This figure could not be improved upon, due partly to last stage offset adjustment (R36) coming to full adjustment before offset null, but also due to the 5th stage offset adjustment (R20) being noisy and unstable. The card was replaced by card FPC009/B3, brought from Canberra. It required only minimal adjustment to achieve overall DC mean offset < 87 Jl V with linearity of 0.31 % over the full dynamic range.
Only a small drift (DC mean offset to <190 JlV at 0.37%) occurred throughout the first two weeks during which time the temperature of the unit ranged from 35.2 to 38.0°C.
The unit was re-tuned for overall mean DC offset on 13 May due to an extended airconditioning failure resulting in a drift of 368 Jl V, well outside specifications.
Gravity Meter As indicated in an earlier section, the gyro was replaced before the survey. The meter operated without problem for the entire survey.
Depth Transducers The Teledyne reader showed improved performance; a more stable display was the result of longer transducer signal integration periods.
25 © Australian Geological Survey Organisation, 1993
A newer set of digital DTs was fitted to the bundle for evaluation. They seemed to be easier to tune.
Magnetometer As reported in an earlier section, the sensor was flushed twice - before initial deployment and again during the survey after the signal had become noisy. The rupture in the diaphragm discovered during the second opening/inspection may have been present pre Survey 118. The damage may have resulted from numerous deployment I retrieval cycles past the arrays whilst the guns were firing.
Cable length measurements (Appendix 17) were made early in the survey. The available cable allows towing of the sensor up to 265 m astern.
Echo Sounders Both the 3.5 and 12 kHz echo sounders worked well. At the end of the trials (Survey 117), a card in the 3.5 kHz correlator was replaced and no further trouble was experienced.
Uninterruptible Power Supply NPS)
The ship's shaft generator failed on 9 May, resulting in a total power outage.
At the time of the power outage, i.e. between shaft generator failure and auxiliary generator
•
coming on line, the recently installed UPS system failed to provide backup to the Instrument • Room for about 8 seconds. Once general power had been restored the UPS perfonned well in tenns of converting a crudely regulated 60 Hz diesel backup supply to a clean, reliable 240 volt, 50 Hz supply to the Instrument Room. It is not clear why the UPS failed to provide backup power during the critical 8 seconds power outage. A number of over-voltage protection devices (varisters) within the UPS had been ruptured during the final stages of the sea trials (Survey 117), apparently as a result of some power switching activities at that time. This may have caused the UPS malfunction.
Rear Deck
Seismic Cable Only one channel, #111, was dead. Three channels were reversed within the cable (channels 1, 69 and 105). These reversals were rectified at the Zip plugs at the rear of the amplifiers. This is nonnally a temporary measure which is usually returned to pre-cruise status at the end of the survey. However, it was decided to leave these reversals so that the next survey (Browse Basin) could go ahead without further action.
Active Tailbuoy The prototype tailbuoy equipment and GPS performed well for about the first three days. Transmissions from the tailbuoy after this period became intermittent, particularly during periods of higher sea states. The tailbuoy electronic equipment failed to function reliably for • any appreciable length of time during the remainder of the cruise. Wiring problems and poor electrical connections appear to be the cause.
26 © Australian Geological Survey Organisation, 1993
•
•
•
Depth Controllers (Birds) Four birds were rejected for various reasons during initial cable deployment. When checked later, two were found to be okay and returned to service as spares.
During final cable retrieval, all bird DTs were read by the Syntron at zero and 10 metres pressure to check transducer accuracy. The results appear below:-
Bird Zero 10 metres Bird Zero 10 metres
1 0 10.1 14 0 10.2 2 0 9.9 15 0 9.4 3 0 10.0 16 0 10.0 4 0 9.9 17 0 10.0 5 0 9.6 18 0 9.9 6 0 10.2 19 0 10.2 7 0 9.9 20 0 9.8 8 0 10.0 21 0 10.0 9 0 10.0 22 0 9.7
10 0 9.9 23 0 10.0 11 0 9.6 24 0.4 10.4 12 0 10.3 25 0 10.3 13 0 9.7
Bundle
The insulation resistance of up to 25% of all lines were at 40 kQ (some approaching 10 kQ) by the end of the third seismic line, despite recent bundle refurbishment
It is considered that this may be as a result of either:-(a) Poor quality heatshrink splices (Sucofit is brittle; also not snug shrinking i.e. internal voids remain), (b) The previous lines not being cut back far enough thus inheriting an already leaky bundle.
As many as 10 pigtails were changed at one time in response to bad timing. While this did increase overall bundle insulation resistance, some lines remained much the same throughout the remainder of the survey.
To increase bundle life, it is recommended that future bundle refurbishment incorporate a final loop around the bundle before leading off to the pigtail splice. This would have two positive effects:-1. The final lead out would not exit the bundle at right angles, thus avoiding rapid fatigue and development of open circuits, and 2. More length of rhino between bundle and pigtail would be available for future re-splicing.
Pigtails used: Solenoids Sensors
23 16
© Australian Geological Survey Organisation, 1993 27

MECHANICAL EQUIPMENT (Condensed and edited version of report by Mark James)
Gun Arrays
The gun arrays were towed from the magnetometer booms at a distance of -45 m. These arrays consisted of thirty-two 150 cubic inch sleeve guns. Twenty-three of these were rebuilt during the survey.
Prior to the cruise both the port and starboard arrays were fitted with bottom plates. These allow the bottom of the sleeve guns to be joined together via chains. The biggest advantage of this configuration is that the base of the sleeve guns suffer minimal damage due to guns hitting each other while being towed. Sympathetic firing is increased, however.
The shackles used on the bottom plates will need to be upgraded on the first two groups of each array. Parts of the arrays have been fitted with higher grade chain and this results in breakage of the 2.5 tonne bow shackles - at an average rate of 2-3 shackles per array each time the arrays are retrieved.
The new upper clamping plates on the sleeve guns have been very successful, with six more being fitted to the guns on this cruise. The thickness of any additional plates that are manufactured and fitted in the future should be upgraded to 19 mm to prevent dishing.
•
During the cruise, three A6 polyform (Norwegian) buoys were lost from the arrays. TIlls • was due to the buoy ropes tangling and abrading through. One other A6 buoy was punctured. After the third A6 buoy was lost approximately half-way through the survey, it was decided to only use five buoys on each array. TIlls did not alter the gun depths greatly and provided more spares for backup.
The bundle clamps and hooks are significantly worn and will need replacing in the near future. The hooks and chains are still responsible for bundle damage. A change in design could ease this problem.
Solenoids
At the start of the survey all the sleeve guns were fitted with the modified solenoids. They had been shown to reduce timing errors during the preceding sea trials (Survey 117). However, their reliability after the first week of shooting on Survey 118 was found to be questionable. While shooting line 118/0801, the system developed an unusually high number of "no fire" and "bad timing " signals. When inspected, it appeared that the modified solenoid components were partly responsible for these conditions.
To eliminate possible errors it was decided to rebuild all of the SV-2 solenoids to standard specifications, to test them and refit them to the arrays. While doing this, it was found that four of the solenoid coils had leaked water into the windings. The coils were tested, dried • out and reused. They need to be replaced, however, to ensure reliable perfonnance.
28 © Australian Geological Survey Organisation, 1993
•
•
•
Compressor Units
Compressor #1 This unit was found to be in regular need of clutch adjustment during the first half of the survey. This condition is thought to have contributed to the failure of the low stage crankshaft. When the crankshaft broke one piston and connecting rod were badly damaged. The crankshaft was replaced and the unit brought back into service. A new clutch assembly was fitted.
Piston damage in the 3rd stage meant it had to be rebuilt - it was fitted with new rings, piston and wrist pin.
Compressor #2 The auto-drain valves on the second stage were replaced and a new actuator supply line fitted.
The fourth stage inlet valve seat was found to be leaking, causing the third stage relief valve to blow off. A new cylinder head was fitted, the cylinder honed and new rings fitted.
Compressor #3 The auto-drain was not operating on all stages. When checked, the electric solenoid was found to have burnt out. It was replaced.
Compressor #4 No problems.
Compressor #5 The diesel had burnt-out exhaust valves in cylinders 3 and 5. The cylinder head was reconditioned.
Compressor #6 The fourth stage booster piston picked up on the cylinder. The unit was shut down before any major damage occurred. The cylinder was removed and was found to be scored in the centre of the stroke and the ring lands worn on the booster piston. The cylinder was honed and fitted with a new piston and rings.
All of the compressor units had regular preventive maintenance for the duration of the cruise. This included clutch adjustment, greasing of PTO and couplings, cleaning of heat exchangers, oils and filter replacement
High Pressure Air System
Three of the flexible high pressure supply lines from the receivers to the supply manifold were replaced. This was done because one of the hydraulic fittings was found to be cracked and corroded. The steel fittings currently used cannot cope with prolonged high velocity and high volumes of compressed air. Stainless steel fitting are needed .
Two of the supply lines to the Xmas tree also require new fittings. On the last day of shooting a large air leak developed on the starboard Xmas tree. When the system was aired
29 © Australian Geological Survey Organisation, 1993
down, the mild steel jic fitting was found to be severely corroded. Such fittings need to be replaced, preferably with stainless steel.
Thirty Hoke valve kits were used during the survey. These valves need to be replaced as soon as possible since they cannot handle the large volumes of air used.
Gun Bundles
The bundles were refurbished during the preceding sea trials (Survey 117). There was no evidence of significant problems until after the flrst week of shooting. When problems did occur, many were related to faulty electrical components such as leaking wire splices, pigtails and solenoid coils. Only 50% of rebuilt sleeve guns developed mechanical faults.
Down-time during surveys could be reduced by concentrating fault-fmding efforts on the bundles rather than the guns.
Seismic Reels
Early in the survey, some minor trouble with the Danfoss proportional control valves was experienced. The remote control unit does not allow speed control, therefore reels should be operated manually until further technical information for rectifying the problem is available.
PRELIMINARY RESULTS
The shipboard seismic monitor records provide some insight into the sub-bottom geology. Seismic sections are displayed on line-printer as single trace (channel 2 on this survey) records. Being unprocessed, there is no suppression of multiples or reverberation in the data. Any definitive seismic interpretation will have to wait until the field data are properly processed. Nevertheless, some examples of monitor sections and corresponding preliminary interpretations are presented below. The sections demonstrate aspects of the basin geology in the region and give some indication of what the final processed data will reveal. All the monitor sections presented show only the flrst 3 seconds of the 16 second data collected.
(a) Part of strike line 118/1501 through Kulka-l well, Money Shoal Basin / Goulburn Graben (Figure 11). About 2 seconds (twt) of mainly Mesozoic section of the Money Shoal Basin overlies the Paleozoic Goulburn Graben of the Arafura Basin. The Money Shoal Basin thickens along the line to the northwest, i.e. towards the Calder Graben; the sediments are relatively flatlying. The Arafura Basin section beneath the prominent base Jurassic unconformity shows major faulting. The fault blocks have undergone appreciable relative movement, as seen by contrasting dips (often relatively steep) in adjacent blocks.
(b) Part of line 118/0002 through Beluga-l well, eastern Malita Graben (Figure 12).
•
•
This profile is located across the south-east margin of the eastern Malita Graben. The Mesozoic section extends down to a time-depth of at least 2 seconds (twt) in the south, and • deepens to more than 3 seconds (twt) in the north.
30 © Australian Geological Survey Organisation, 1993

•
•
•
(c) Part of line 118/1001 through Lynedoch-1 well. eastern Malita / Calder Graben (Figure 13) . At least 2.5 seconds (twt) of gently-dipping Jurassic and younger section is seen in this S-N profile in the middle of the Calder Graben. The upper part of the sedimentary section comprises a relatively thick, 1.0 second (twt), succession of Cainozoic carbonates.
(d) Part of line 118/0901 across the Sahul Platform and southern flank of the Timor Trou gh (Figure 14). The profile shows intense Tertiary high-angle, ?extensional faulting on the southern flank of the Trough. Water depth here is up to 500 m. The sedimentary section, consisting of Cretaceous and younger sediments, is more than 2.5 seconds (twt) thick. Most of the faults terminate at a prominent late Tertiary (?Middle Miocene - Apthorpe (1988)) angular unconfonnity. Some minor faulting appears to extend into the overlying prograding beds. almost to the seafloor. The faulting is attributed to tectonics associated with convergence of the Eurasian and Australian plates.
(e) Part of dip line 118/1802 across the NE margin of the Petrel Sub-basin (Figure 15). The great thickness of late Phanerozoic sedimentary deposits contained in the Sub-Basin is illustrated by this profIle. A faulted Permian section underlies a prominent unconfonnity, and dips relatively steeply basinward (SW) to a time-depth of more than 3 seconds (twt).
(t) Part of dip line 118/1802 through Fishburn-l well. western Petrel Sub-basin (Figure 16). As on the NE margin of the Petrel Sub-basin, at least 3 seconds (twt) of Phanerozoic section is evident in this profIle. The strata dip NE towards the central axis of the basin . The Tertiary section thins significantly at the basin margin. Faulting extends upward at least as far as the Valanginian unconfonnity.
(g) Part of line 118/2101 through Londonderry-l well. NE Browse Basin (Figure 17). Basement (Proterozoic rhyodacite) is relatively shallow at ..... 1150 m depth (,...1.0 second twt). The overlying sediments are flat-lying and Cretaceous to Cainozoic in age.
ACKNOWLEDGEMENTS
The Master. Bob Hardinge. and AMSA crew of the RV Rig Seismic are thanked for their help and close co-operation during the execution of Survey 118. Their expert skills and demonstrated professionalism made a vital contribution to the successful completion of the scientific program .
31 © Australian Geological Survey Organisation, 1993
REFERENCES
Allen, P.A. and Homewood P., 1986 - Foreland Basins. International Association of • Sedimentologist Special Publication No.8, Oxford (Blackwell), 453pp.
Apthorpe, M., 1988 - Cainozoic depositional history of the North West Shelf. In Purcell, P.G. and RR (Eds.), The North West Shelf, Australia. Proceedings of Petroleum Exploration Society Australia Symposium, Perth, 55-84.
Beaumont, C., 1981. Foreland Basins. Geophysical Journal of the Royal Astronomical Society 65, 291-329.
Botten, P. and Wulff, K., 1990 - Exploration potential of the Timor Gap Zone of Cooperation. APEA Journal 30(1), 68-90.
Bradshaw, J., Nicoll RS. and Bradshaw, M., 1990 - The Cambrian to Penno-Triassic Arafura Basin, northern Australia. APEA Journal 30(1), 107-127.
Durrant, J. and Young, A., 1988 - A case study of seismic exploration in the Offshore Bonaparte Basin. In Purcell, P.G. and RR (Eds.), The North West Shelf, Australia. Proceedings of Petroleum Exploration Society Australia Symposium, Perth, 489-498.
Labutis, V., Moore, A. and Bradshaw, J., 1992 - Petroleum prospectivity evaluation, Arafura Basin. Australian Geological Survey Organisation, Record 1992/84.
Lee, RJ. and Gunn, P.J., 1988 - Bonaparte Basin. In Petroleum in Australia: The First Century. APEA Publication, 252-269.
Lister, G.S., Etheridge, M.A. and Symonds, P.A., 1991 - Detachment models for the formation of passive continental margins. Tectonics 10, 1038-1064.
McLennan, J.M., Rasidi, J.S., Holmes, RL. and Smith G. C., 1990 - The geology and petroleum potential of the western Arafura Sea. APEA Journal 30(1), 91-106.
Mory, A.J., 1991 - Geology of the offshore Bonaparte Basin, North Western Australia. Geological Survey of Western Australia Report 29,47 pp.
Moore, A.M.O. and Ramsay, D.C., 1992 - East Arafura reconnaissance survey operational report. Bureau of Mineral Resources, Australia, Record 1992/10.
Northern Territory Geological Survey, 1989 - Petroleum basin study: Arafura Basin. Northern Territory Geological Survey Report.
Northern Territory Geological Survey, 1990 - Petroleum basin study: Bonaparte Basin. Northern Territory Geological Survey Report, 210 pp.
O'Brien, G.W. and Williamson, P.E., 1990 - Research cruise proposal. Vulcan Graben, Timor Sea: deep crustal structure, structural reactivation, aeromagnetics, and hydrocarbon migration. Bureau of Mineral Resources, Australia, Record 1990/91.
32 © Australian Geological Survey Organisation, 1993
•
•
•
•
•
O'Brien, G.W., Etheridge, M.A., Willcox, J.B., Morse, M., Symonds, P., Nonnan, C. and Needham, DJ., 1993 - The structural architecture of the Timor Sea, north-western Australia: implications for basin development and hydrocarbon exploration. APEA Journal 93, 258-278.
Pigram, C.J., 1992a - Deep structure of the East Malita Graben Region - western Arafura and northern Timor Seas: cruise proposal. Australian Geological Survey Organisation, Record 1992/94.
Pigram, C.J., 1992b - Deep structure of the Joint Development Zone and adjacent areas, Timor Sea: cruise proposal. Australian Geological Survey Organisation, Record 1992/95.
Stagg, H.MJ. and Survey 110 Shipboard Party, 1992 - Deep structure of the southern North West Shelf: SNOWS-II (Survey 110) post-cruise report. Bureau Mineral Resources, Australia Record 1992/60.
Stagg, H. M. J., Brassil, F.M. and Survey 101 Shipboard Party, 1991 - Deep structure of the southern Northwest shelf - post cruise report. Bureau Mineral Resources, Australia Record 1991n9.
West, B. G., Connolly, lR., Blevin, J.E., Miyazaki, S., Struckmeyer, and Vuckovic, V., 1992. Petroleum prospectivity of the east Malita Graben area, Bonaparte Basin. Bureau of Mineral Resources, Australia, Record 1992/24 .
West, B.G. and Passmore, V.L., 1993 - Northeastern Bonaparte Basin petroleum prospectivity bulletin, Bureau of Resource Sciences, Canberra.
Willcox, J.B. and Ramsay, D.C., 1991 - Deep structure of the Bonaparte Basin region, Petrel Sub-basin cruise operational report. Bureau of Mineral Resources, Australia, Record 1991/45.
Williamson, P.E. and Lavering, I.H., 1990 - Mesozoic prospectivity of Area A of the Timor Gap Zone of Co-operation. Proceedings of the Indonesian Petroleum Association, 19th Annual Convention, 107-129 .
33 © Australian Geological Survey Organisation, 1993

AGSO SURVEY 1 1 8 © Australian Geological Survey Organisation, 1993
MAL I T A GRABEN 100km
124'00' 125'00' 126'00' 121'00' 12"00' 129'00' 130'00' 131'00' 132'00' '33'00' 133'30'
::::- r r;1 ~;==y ~ 8' so'
+ + + + + +/'J + a'oo'
~ 1-0(
~ r ~r;§ Cj «\: :;:d tI'j
t-' en I 10'00' ~
~ /' + + + -A:~ + '" I'" .~ + ""lIIIo... I + -:........ + -I 10'00'
(»
'< I-" I-" 00 en :::r ..... ~- I "'00' ~ + + + + , + . \ • '" ~- + + ~n f + -f 1"00'
q ~
R-§
TIMOR w 0. I ~~ .....
§. I "'00' I n
+ + + + / + +~ ~ f\'f + + -f 12'00'
J:;': ::l (» en
13'00' ~ +1 V., + ______ ,
+ + +bl
+ + + -I 13'00'
• A
Fine line: Rig Seismic track Heavy line: S 118 seismic line
I ./1 1~ ~ { 14'00' I~~ "9. .:;:' 1~ I 14"00'
12"'00' 12S'00' 126'00' 121'00' 12S'OO' 120'00' 130'00' 13,'00' 132"00' 133'00' 133'30'
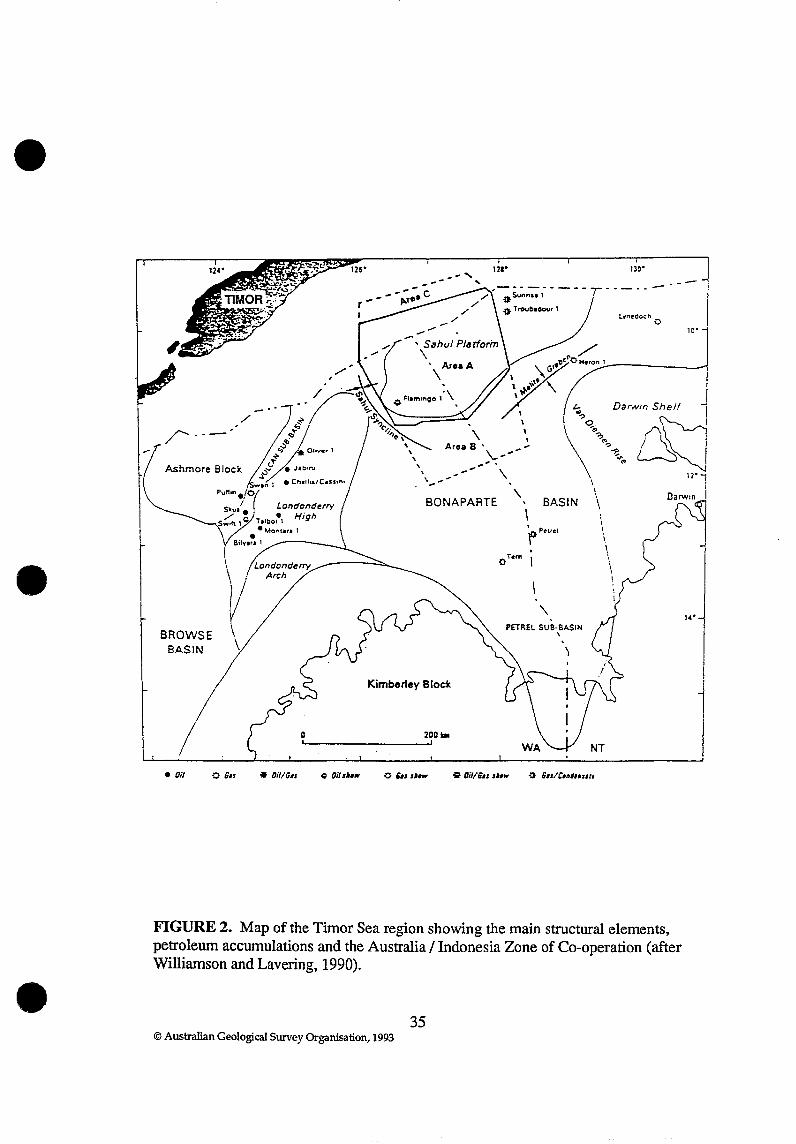
•
•
•
12.' 130' ~~ ....
-~ .. -~-
BROWSE BASIN
• Oil Olin
ilSunn .. 1
il T roubodou' 1
.......... -, Sahul Platform
\ , AreaA \
, Area B • -,,"-,' .,-
, \_- ".".~ ..
BONAPARTE
Kimberley Block
o ~D~ ~I~~~~~--~--~I
-0 ... ,j ••
\
\
(ITem
BASIN \ . rPttrel
PETREL SUB-BA.SIN \
l.,neOOCh 0
Dar.vm Shelf
\
\ \
\. \.
NT
\ i \ \
FIGURE 2. Map of the Timor Sea region showing the main structural elements, petroleum accumulations and the Australia / Indonesia Zone of Co-operation (after Williamson and Lavering, 1990) .
35 © Australian Geological Survey Organisation, 1993
10'
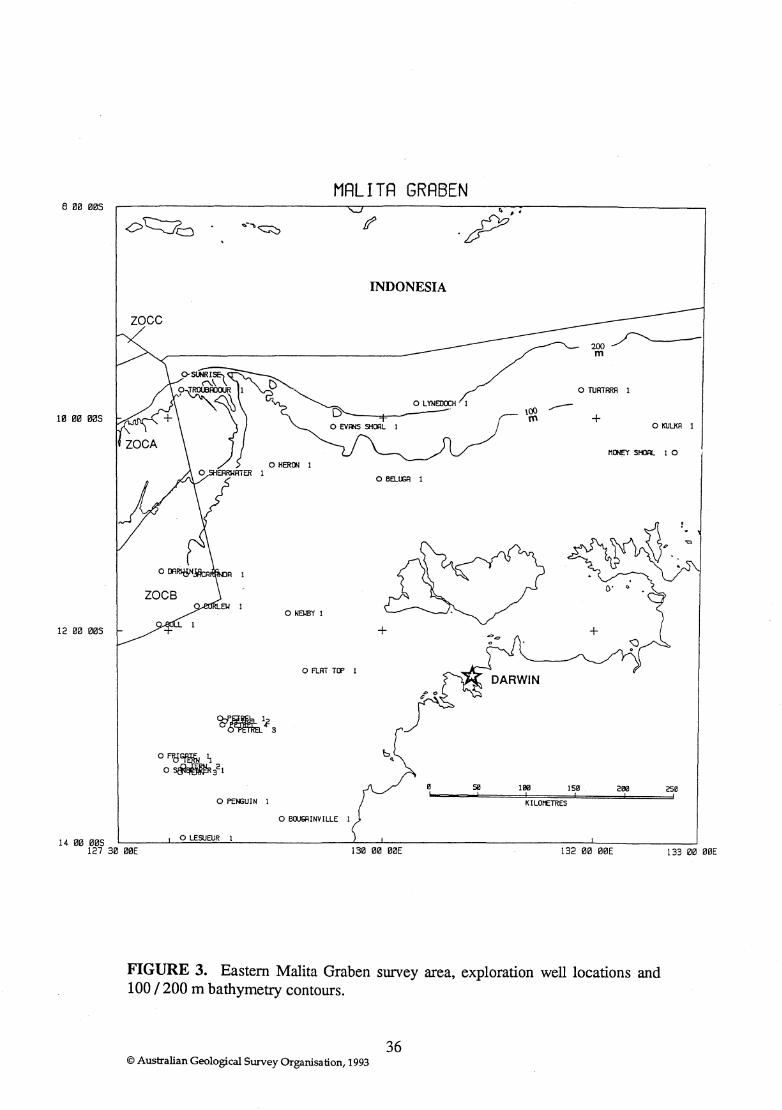
8 00 00S
zocc
10 00 OOS
12 00 ems
14 00 005
MALITA GRABEN
o HER!Jl 1 1
o NEIlBY 1
o flAT TtJ' 1
o PEIIlUIN I
o BOU6AINVILLE 1
o LESUEUR 1
INDONESIA
o BELu;R 1
+
o TUATARA 1
o KULKA I
11~ StilAL 10
51! !
100 !
Ise !
200 !
2SB !
K I LOI'ETRES
127 30 00E 130 00 00E 132 00 00E 133 00 00E
FIGURE 3. Eastern Malita Graben survey area, exploration well locations and 100 /200 m bathymetry contours.
36 © Australian Geological Survey Organisation, 1993

•
•
•
8 00 005
10 00 005
12 00 1Z10S
14 1Z10 005
\ J
127 30 !'l0E
MRLITR GRABEN
PLATFORM
Il 50 100 ISIl 200 ! ! ! , !
KILOMETRES
132 00 00E
FIGURE 4. Structural framework of the eastern Mal~ta Graben region (Northern Territory Geological Survey, 1989; 1990).
37 © Australian Geological Survey Organisa tion, 1993
2S1l !
133 00 00E
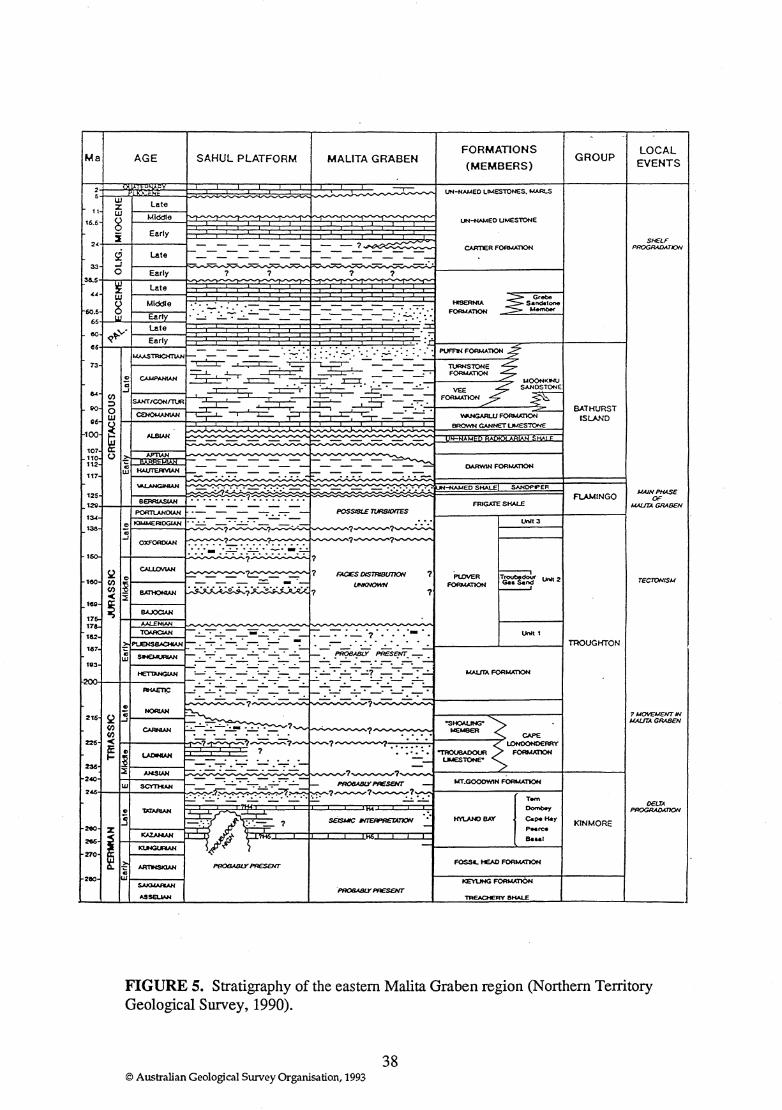
Ma AGE SAHUL PLATFORM MAlITA GRABEN FORMATIONS
(MEMBERS) GROUP
LOCAL EVENTS
"ill~~~~ 16.6
2< I- _ _ _ __ -I- 7 ~ SHtiLF
PROGRADATION
60.6 65
00
.6
73
a.
PO
86
100
107 110 112
117
125
= 13-(
136
182
la7
'83
200
:M6
210
280
(/) ::l 0 W
~ U
Z
I
- - - - - - i=-~ ::-:
c --I1J ~ --:. -:.-:-:- - - •• :-7 -
.. "A.. ... ... ,-:: ••••••••• 7 •••••••••
" VJAAIAH
3 IC.I:LNUJ-I
~
~ AA"I"HS>CIAN
" I1J ~
... -
?
?
0AAW1N FORw;n()t<
-tU-MEO SHALE SANOPIPER
FRIGATE SHALE
UnIt 3
BATHURST ISLAND
KINMORE
TECTONISM
FIGURE 5. Stratigraphy of the eastern Malita Graben region (Northern Territory Geological Survey, 1990).
38 © Australian Geological Survey Organisation, 1993
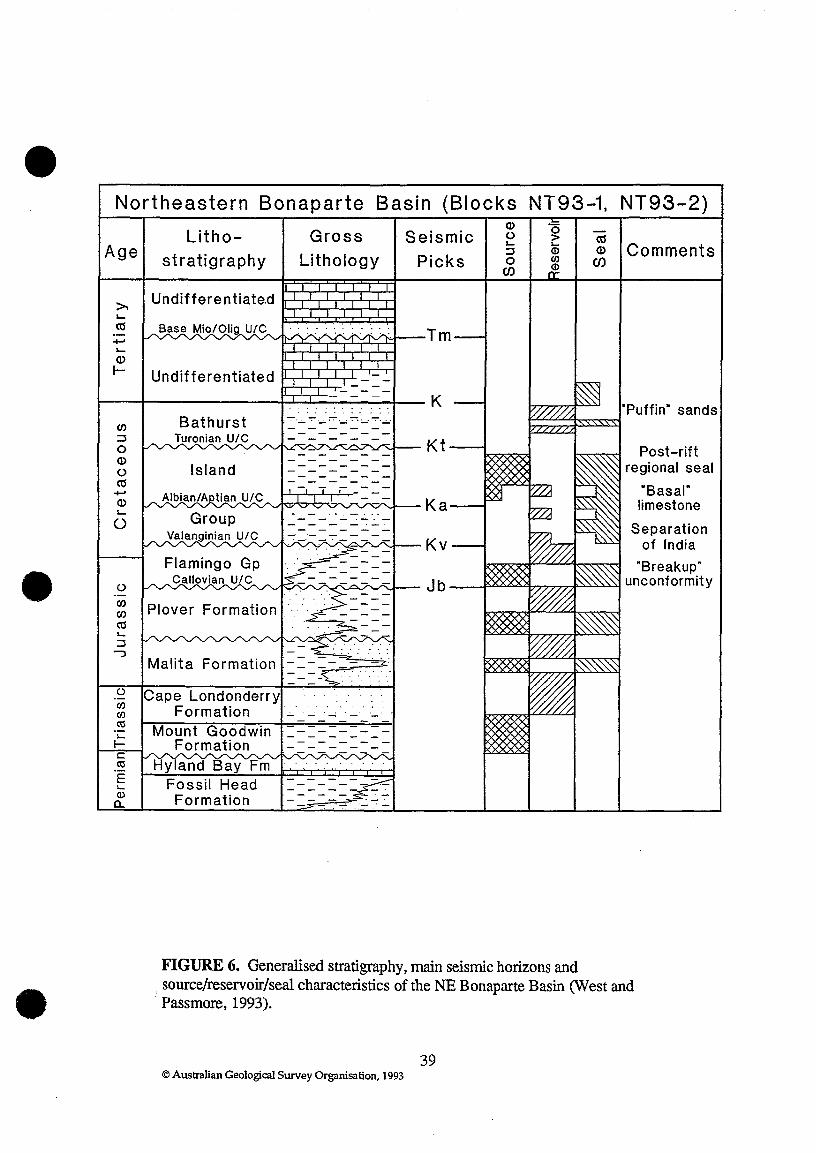
•
•
•
Northeastern Bonaparte Basin (Blocks NT93-1, NT93-2)
Age
>. L-
m ..... .... (])
I-
(J)
:J 0 (]) ()
m ..... Q) .... 0
()
(J)
(J)
ctl I-
:::l ....,
()
(JJ (JJ
ctS '-I-c ctS
E .... Q)
0..
(]) '0 Litho- Gross Seismic 0 > m I- .... Comments :J (!) (])
stratigraphy Lithology Picks 0 en Cf) Cf) (!)
Undifferentiate.d · ... . . . . . .. · ...........
Tm
Undifferentiated -- -- - -- - - K · .. ......... "Puffin" sands . . . . . . .. . . .
Bathurst ~''';'' -=-:-:,.:-:"".--:-:-:.;....:-:"" ... : .... ;
- - - - -Turonian Ute - - - - -- - - - - Kt Post-rift
regional seal
"Basal" - - Ka limestone -
Separation Kv of India
"Breakup" Jb unconformity
Malita Formation
Cape Londonderry Formation - --' - - -- - - - -
Mount Goodwin - - - - -- - - - -- - - - -Formation - - - - -
Hyland Bay Fm Fossil Head Formation
FIGURE 6. Generalised stratigraphy, main seismic horizons and source/reservoir/seal characteristics of the NE Bonaparte Basin (West and
. Passmore, 1993).
39 © Australian Geological Survey Organisa lion, 1993
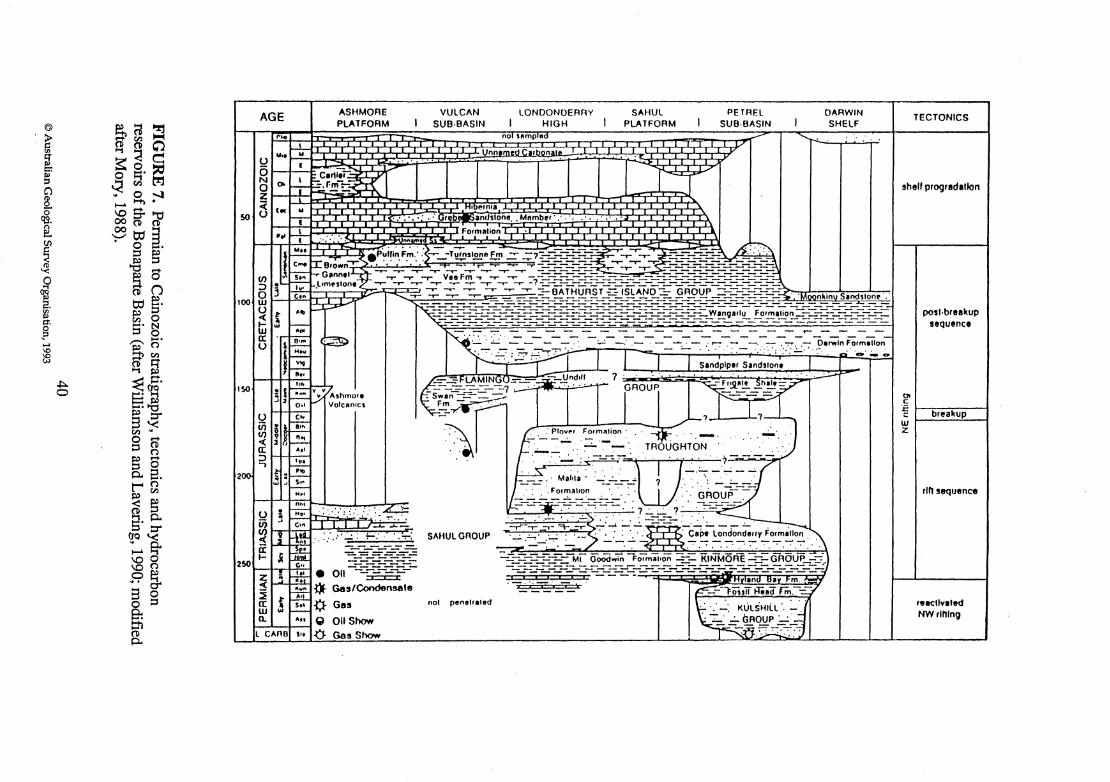
@
~ ~ t::: § C')
~ o
'19. g, !Jl
j ~ 2. Kl PO.
~ ..... \C
(S
.j:::o. o
~~~ ~ ~ ~ ~~~ ;:::., 1:1' ~ ~CIl~ ~ 0 ......
I-t> •
tOS-"'O ~o:; 00 G G§ • 0 .
::J § .§ r+
~ 0 G (J
t:d S· ~ 0 ...... N ::J 0 ...... '§;~
~ g . S~ ...... 'i::I ~ ::r 3« CIl ~
o ct ::J (") § 8 p,. e. l'~ ~ §
~. ~ ~~ ...... 0 ~(") 98-3 0 o ::J &. ::n G p,.
AGE
., .. o·M,. M
ASHMORE PLATFORM
~ ~r~~" ()oo L -.I'm:-- : _1- --
VULCAN SUB· BASIN
LONDONDERRY HIGH
nol .. mploa I I I I I
Unn.rnel! Clrbon.l~
SAHUl PLATFORM
:r
PETREl SUB· BASIN
?
DARWIN SHELF
y....:... . ..,...,,~~
Z ;(
WI~ u
. .. ,', Hlbp.,ma
'O!1...~~nljsl~niJ .. Mnmber . : .'. . ..
Form~lion
.p~i!j~.F!" .. :.: -;::'-T~.~f..!!1.= "::;:7=-==t:~-
100
150
200
~ __ '-:- -r- -r -:..,.. r __ -,--r ---r--r ==t:====== -,- -r ________ _
~ ~ "T'-r -r-r--r -r V!!-F!!!-"T-r""-.,.... -T"'-r :-?-:===tf======-=-;:-_-::-::==::~--:i=~=======-o ..,... -.- ~ -r ...,... ...,... ==8AiHuRST~,§lANO-£:: GROUP~-=-=-;::-%: k I I
~ ~-~~~~i~~l~~~~l~~~~~~~~~~~~~~ o - - .. - ~.' 'r--:.- -'.0:- .~ .. - O."",lnForm.llon
u in VI <{ a: ::J -,
0 in VI <{
it
. 3
r,.
nhl .... c'"
: . ,': .'.::-L..:.2::: '.~'~'.~ .
r~ '_: .. : ' ..... -.-. +-,'. '.~:
-----
~ ?~7-
-___=---' TROUGHTON . ...:.. :s---:-:-..;.cu·.... ,,---___ . Maiolo' ._-:...~,,~ -.~--:--
- - FOfmilhon - - :-. " --=-=-__ .:.... _ ...:.. ____ . GROUP
:~: -,- :-~;-~~-: ~.:~ ~~ .' ~=----SAHUl GROUP ''''':' <:::::.:_ .. :..,; ..
-:::=~:j:===MI GoOdwTn "Q;';"iii,;'; =t:= KINMORE =t:;:: cThOUP_-::7· -------~=--_;::-=-=__c-:::__=-=_=__==~~---=-=.-=-==_=~~~
25011--=- -= =--.::::".:=-.= -=-....:------=---
Oll-=t:~=-••• iIi • ----~~~~J!li:E~
Gas/Condensate Z - itt •
~ .. :!; 'w· * ~ A" ex: i s.. rt. GIIS W '" ¥
not penelrlted
0. All g 011 Show
l CARB SIt {} Gos Show
TECTONICS
shell progrlldallon
00 c
posl·br8llkup SIIQuence
:g I breakup w z
rill sequence
reKtlv.led NWrlnlng

(') ~ 0 10-4 ::s c;:, e:~ e. o . ::s tr:l Yl ?C ~ ~ ..... (')
e. ::s 0 ..... til 0
~ g. til
e. ~ 0 ..... ::s
(Jq
0' ::s g. a, til
~ S 0 '"1
Po g. (Jq
~ 0 ~ J:I) cr' ....... 0 til 0 J:I)
uhrs 1~.0
1M 14.0 13.5 13.0 12.5 12.0 11.5 11.0 lo.s 10.0 9.5 9.0 8.5 0.0 7.~
7.0 6.5 6.0 5.5 5.0 4.5 4.0 3.5 3.0 2.5 2.0 1.5 1.0 0.5
BIRDS
Channel
• • • F=====================Rns Values =======================iI
I. r
1 T
Line 118/1901 Shot 1787
RMS noise levels (micro bars) for channels 1-192 oyer record interval 15-16 seconds
Note higher noise levels at birds (depth controllers).
noise = 1.58 microbars III
JI. .II. I. I. I. 1 J. I. .II. J. I. I. 1 1 II. J. JI. I. 1 1 II. JI. ! , , , I' , , , 11' , , r 1 r 1 r I r 1 r l' 1 T f ' 1 r l' 11'
1 2 3 4 ~ 6 7 8 9 0 1 2 3 4 5 6 7 8 99 123456789012345678901234567890123456789012345678901234567890123456789012345678901234567890123456789012345678901234567890123456789012345678901234567890123456789012345678901234567890123456789012
© Australian Geological Survey Organisa tion, 1993

cD 0) 0 -c: (I)
~ (I) A.
CD t» 0 -c co () ... co Q.
80
70
40
30
20
100
90
80
60
50
40
Daily Navigation Modes for Survey 118
Line Navigation Modes for Survey 118
.- ..- ~, 0 0 '-0 r- .
~"C"') .... OON C"') 10-0 ...... 0 00.-.
............ CO~80N.-.-.-S20 0 '-'-.-
'-.-.-NC"')@OONC"') .-.- ..... IO-o°0 0 .- N
Seismic Line .- .- ~ ~ !::: § ~ ~ 8 0 ~r-NN
III-l--dGPS2
a-,---GPS1
GPS2
Dead Reckoning
dGPS2
GPSl
GPS2
Dead Reckoning
FIGURE 9. Navigational modes in use during Survey 118 - percentage per day and per line.
42 © Australian Geological Survey Organisation, 1993
•
•
•
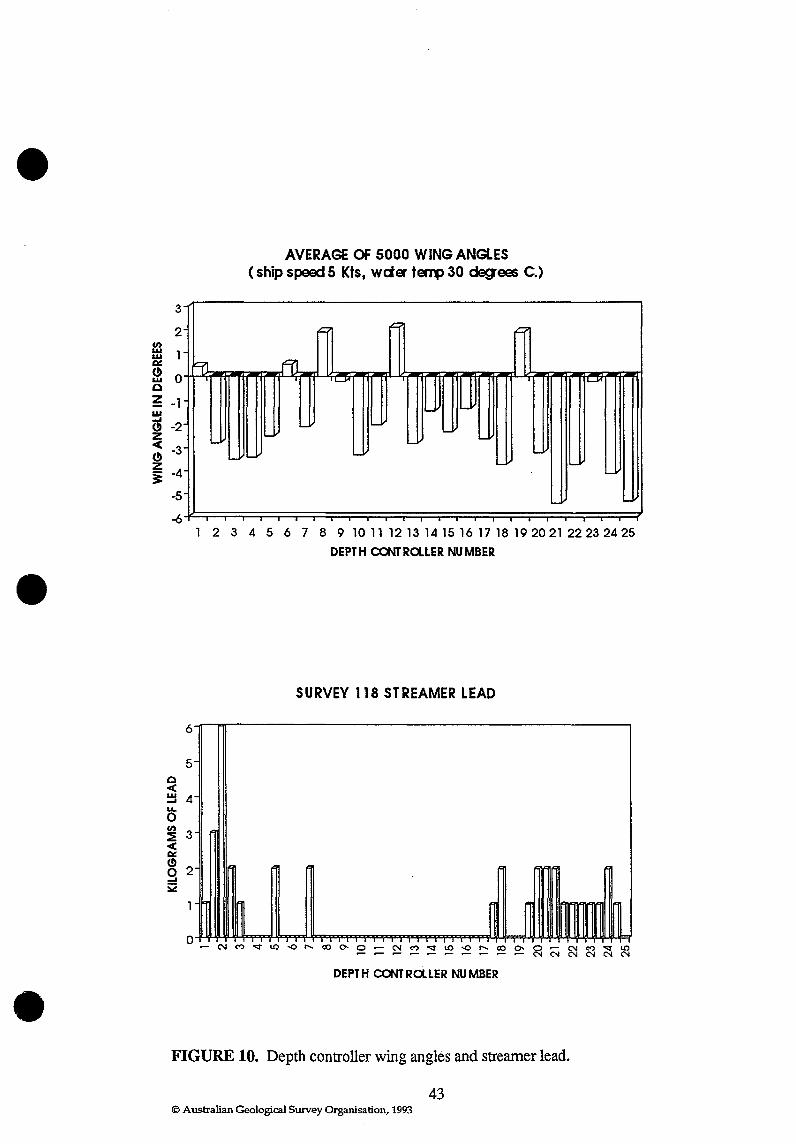
•
C/') w w
'" ~ w Q
~ UI .... ~ z < ~ z i
•
•
AVERAGE OF 5000 WING ANGlES ( ship speed 5 Kts, was tel'll> 30 degees c.)
3
2 L tc- .c.
0
-1
Ffl f1l ...........
IUJ I ........
-2
-3 '-
-4
-5
-6 1 2 3 4 5 6 7 8 9 10 11 12 13 14 15 16 17 18 19 20 21 22 23 24 25
DEPTH CONTROllER NUMBER
Q <
6
5
~ 4 u.. o ~ 3 < '" ~ 9 2 S2
SURVEY 118 STREAMER LEAD
119 t1 I"!
DEPT H CONT ROllER NU MBER
FIGURE 10. Depth controller wing angles and streamer lead.
43 © Australian Geological Survey Organisation, 1993
1t1

Survey. Julian day. UTe. Line 11811501 Kulka-1 ·'0 . ..,
~
Shot' Skm
FIG URE 11. Shipboard monitor seismic section and interpretation of part of line .118/1501 through Kulka-l well, Money Shoal Basin I Goulbum Graben. © Australian Geological Survey Organisation, 1993 44
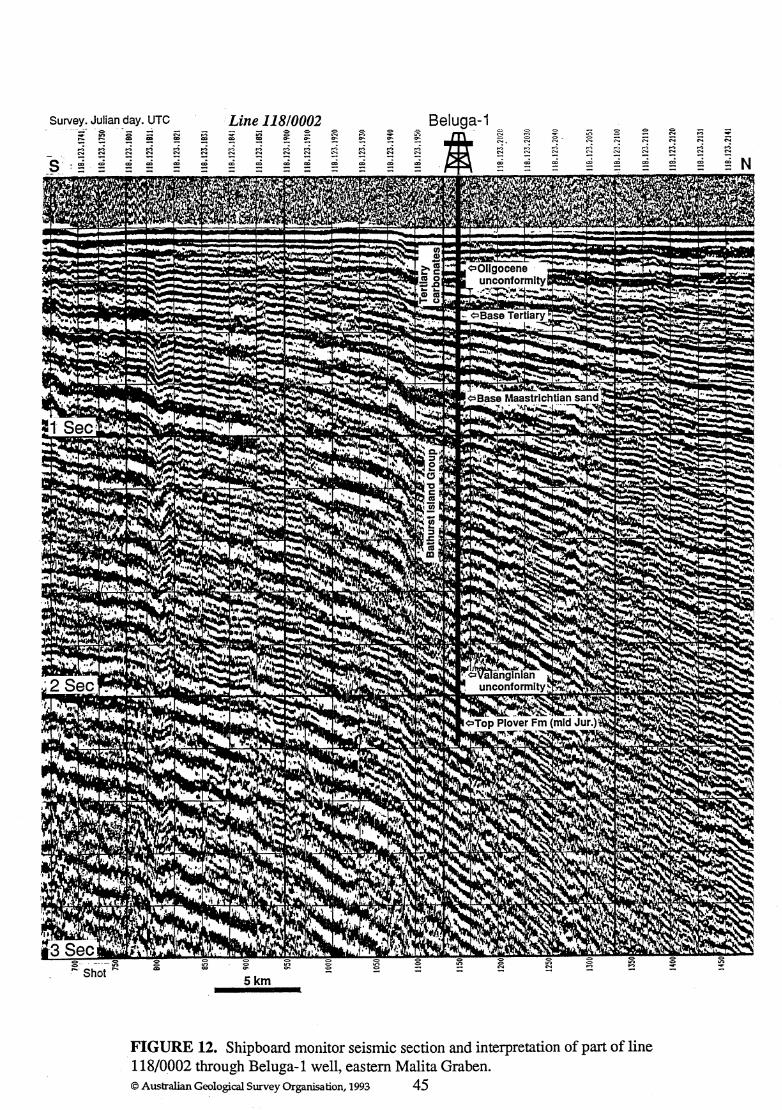
Survey. Julian day. UTe Line 11810002 8eluga-1 ~ ~ ~
~ = ~ = ~ = = = ""
= '" m ~
'" 1>': ~ ~ ~
~ "-, = 0,
~.
m '" '" '" ~ ~ ,~, ,~ ~ ;;:; ~
~ a ~ ~ ~ ~ a a ~ ~ ~ "' a ~ ~ a ~ ON ~ ON ON ~ ~ ,~
FIGURE 12. Shipboard monitor seismic section and interpretation of part of line 118/0002 through Beluga-1 well, eastern Malita Graben. © Australian Geological Survey Organisation, 1993 45
~ ~ -~ ~
E a
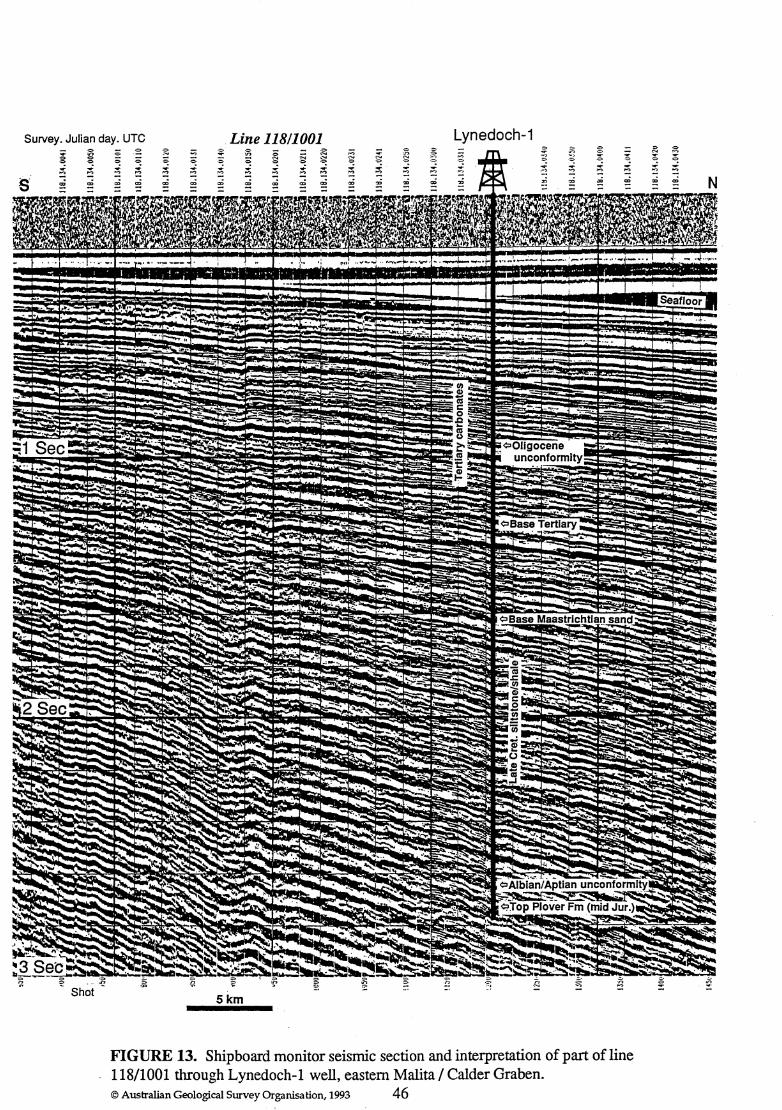
Survey. Julian day. UTC . Line 118/1001 Lynedoch-1 0 !g
~ ::: <>
~ '" <>
~ '" '" '" '" .~ .., '" ~
N ,., - 0 ~
~ -~ ~ c;
~ ~ ~ ~ N ~
,., -, 0 '" .:. :> ~
.;> - - ~ - ~ - "' ~ -,., .., ,., .., ::! ,., ~.
,.,
FIGURE 13. Shipboard monitor seismic section and interpretation of part of line 118/1 001 through Lynedoch-1 well, eastern Malita I Calder Graben. © Australian Geological Survey Organisation, 1993 46
~
~
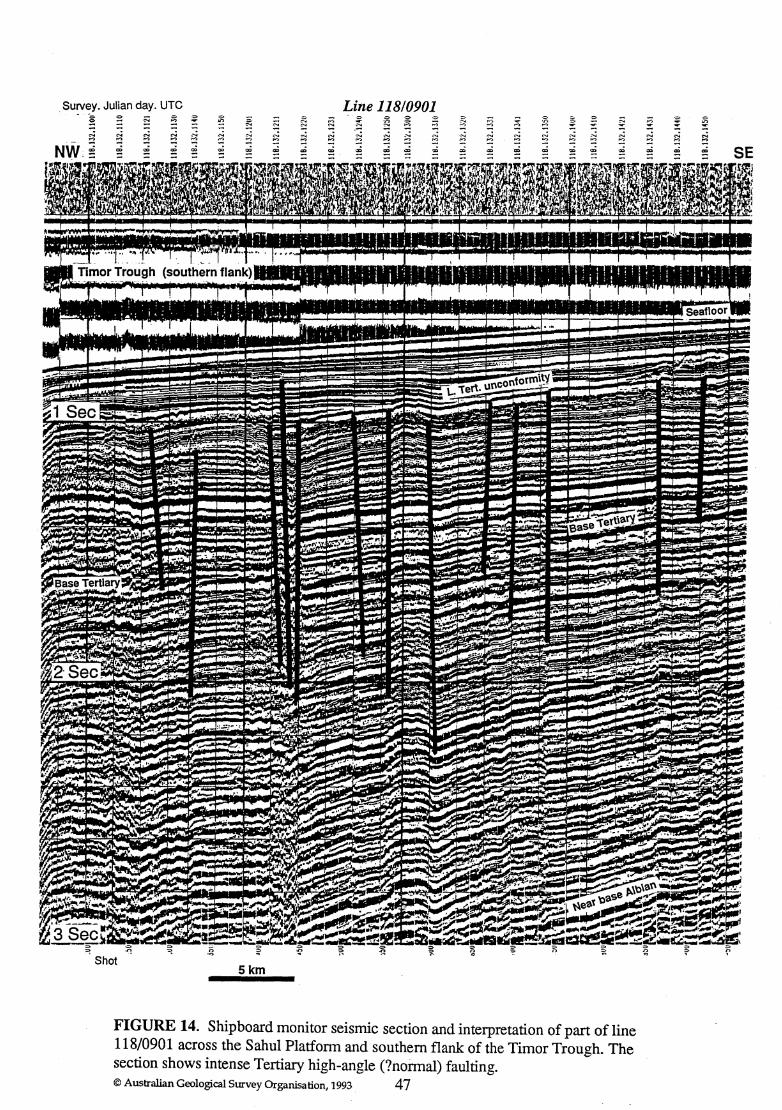
Survey.
~
-- E
Julian day. UTe Line 11810901 0 0 = ~ " ~
.~ ." :::> 0
~ " ~ =
" ~, ." ' ..... 4 "' 'r, N '" ~ ~. ~ ,.., ., ~ ,.., ,.., ,.., ~ N N N
~ N ~ ,~ .~ N ~ N N ,~ ~ .~ ,~ ".. ".. ,~
~, '" ..., '" ~, .., '" '" ..,
'" '" ,..,
'" ~ ;2 '" '"
Skm
FIGURE 14. Shipboard monitor seismic section and interpretation of part of line 118/0901 across the Sahul Platform and southern flank of the Timor Trough. The section shows intense Tertiary high-angle (?normal) faulting. © Australian Geological Survey Organisation, 1993 47
~ ." ~ -".. ~ "..
'" ...,
~ "" "" SE

-Survey. JUlian day. UTe Line 11811802 NE PETREL SUB-BASIN
e- o on "'" ~ ~
.... ,
-NE~ -
'"
,Shot
e '" '" '" .", '" '" .~-. '" ." '" .=~ '" '" ~ on '" ~ ..., -=, ~ ~, on ." '"
.., .., .... , .., - - on ..., ..., ""
,-, "" ~
..., ..., ..., -- - - -- - - - - - - - - - - - - - - - -
co '" ~ '" '"
5km
FIGURE 15. Shipboard monitor seismic section and interpretation of part of line 118/1802 across the NE margin of the Petrel Sub-basin. The Permian dips steeply basinward (SW) to more than 3 seconds TWT. © Australian Geological Survey Organisation, 1993 48
." ..., ..., ..., - -::: ",', SW

_.-.- .~.-
Line 11811802 Fishburn-1 Survey. Julian day. UTe = = '" !
= .", .", ~, ~ = ~ -=
~ ~
~ ~ ~ ~ ~ = =
~ ~ ~
<> <> <> '" <:> <> = '" 0 !i 0 ~ ~ 0 .,., ~ ~ ~ .,., .,., -
FIGURE 16. Shipboard monitor seismic section and interpretation of part of line 118/1802 through Fishburn-1 well, western Petrel Sub-basin. © Australian Geological Survey Organisation, 1993 49
<> .,.,

Survey. Julian day. UTe Line 11812101 Londonderry-1 00 0 0 0 0 '" 00
~ 0 0 ..., ~ 0 '" ~ '" 0 ~ ..., 0 ~ .., ..., - '" ", ... '" ... ~ ~ ~
'" '" '" '" ! '" '" '" '" '" '" '" '" '" '" '" - - - - - - - -'" '" ~
FIGURE 17. Shipboard monitor.seismic section and interpretation of part of line 118/2101 through Londonderry-l well, NE Browse Basin. Basement (proterozoic) is relatively shallow - at ,...1150 m depth. © Australian Geological Survey Organisation, 1993 50
SW
Miocene calcarenite
¢:IOligocene unconformity
¢:ITop Paleocene
NeocomlanMaastrichtian sandstone! claystone
¢:ITop Basement Proterozoic (1600 Ma) rhyodacite
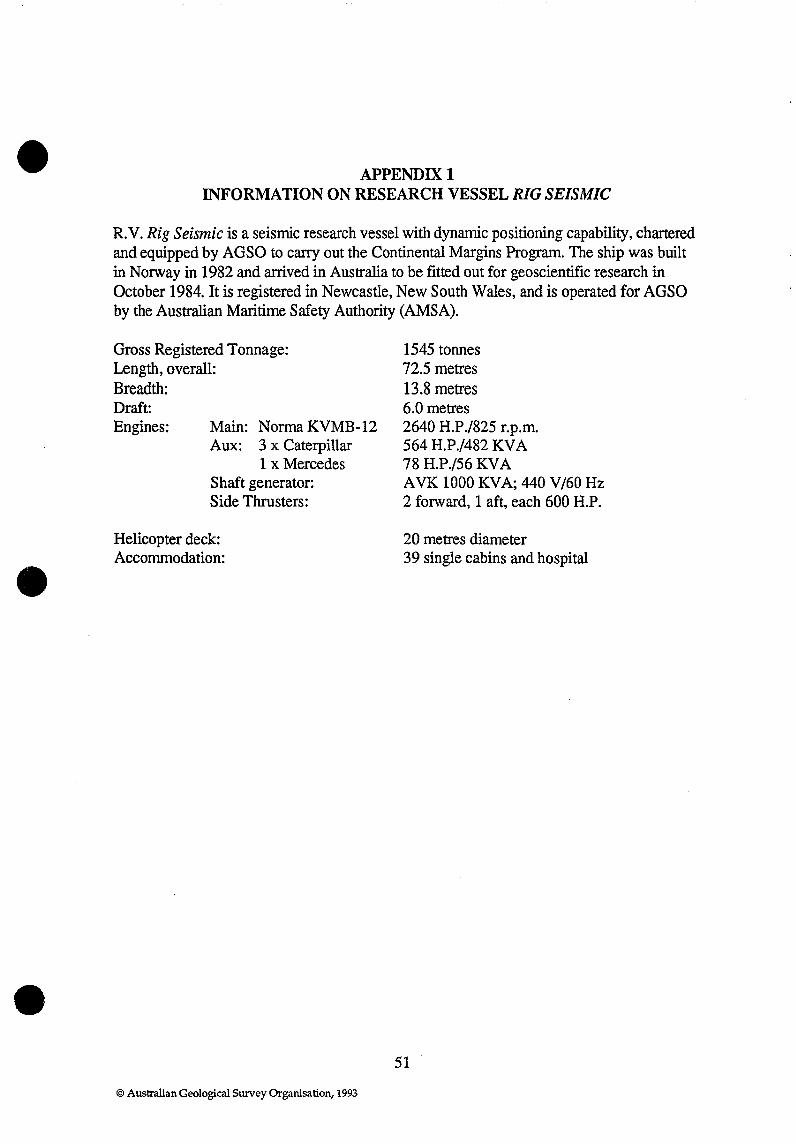
•
•
•
APPENDIXl INFORMATION ON RESEARCH VESSEL RIG SEISMIC
R.V. Rig Seismic is a seismic research vessel with dynamic positioning capability, chartered and equipped by AGSO to carry out the Continental Margins Program. The ship was built in Norway in 1982 and arrived in Australia to be fitted out for geoscientific research in October 1984. It is registered in Newcastle, New South Wales, and is operated for AGSO by the Australian Maritime Safety Authority (AMSA).
Gross Registered Tonnage: Length, overall: Breadth: Draft: Engines: Main: Norma KVMB-12
Aux: 3 x Caterpillar 1 x Mercedes
Shaft generator: Side Thrusters:
Helicopter deck: Accommodation:
© Australian Geological Survey Organisation, 1993
1545 tonnes 72.5 metres 13.8 metres 6.0 metres 2640 H.P./825 r.p.m. 564 H.P ./482 KV A 78 H.P./56 KV A A VK 1000 KVA; 440 V/60 Hz 2 forward, 1 aft, each 600 H.P.
20 metres diameter 39 single cabins and hospital
51
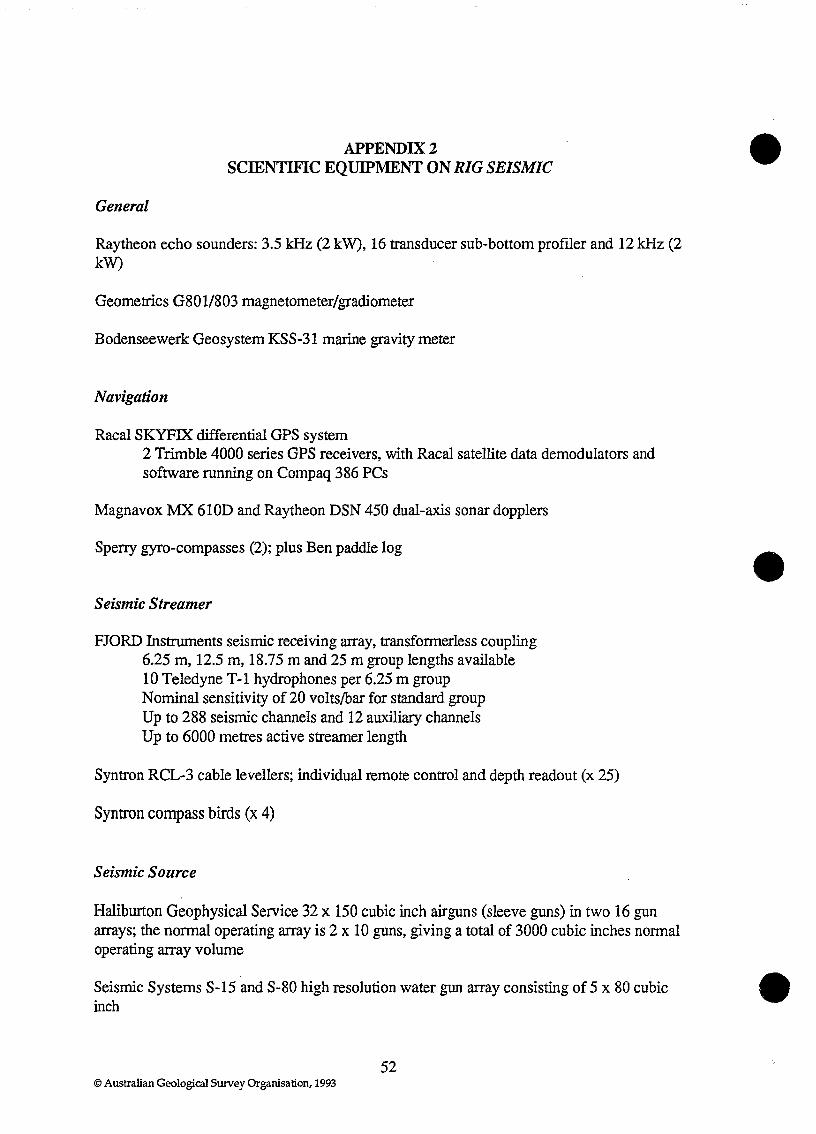
APPENDIX 2 SCIENTIFIC EQUIPMENT ON RIG SEISMIC
General
Raytheon echo sounders: 3.5 kHz (2 kW), 16 transducer sub-bottom profiler and 12 kHz (2 kW)
Geometries 08011803 magnetometer/gradiometer
Bodenseewerk Geosystem KSS-31 marine gravity meter
Navigation
Racal SKYFIX differential GPS system 2 Trimble 4000 series GPS receivers, with Racal satellite data demodulators and software running on Compaq 386 PCs
Magnavox MX 610D and Raytheon DSN 450 dual-axis sonar dopplers
Sperry gyro-compasses (2); plus Ben paddle log
Seismic Streamer
FJORD Instruments seismic receiving array, transfonnerless coupling 6.25 m, 12.5 m, 18.75 m and 25 m group lengths available 10 Teledyne T-1 hydrophones per 6.25 m group Nominal sensitivity of 20 volts/bar for standard group Up to 288 seismic channels and 12 auxiliary channels Up to 6000 metres active streamer length
Syntron RCL-3 cable levellers; individual remote control and depth readout (x 25)
Syntron compass birds (x 4)
Seismic Source
Haliburton Geophysical Service 32 x 150 cubic inch airguns (sleeve guns) in two 16 gun arrays; the nonnal operating array is 2 x 10 guns, giving a total of 3000 cubic inches normal operating array volume
Seismic Systems S-15 and S-80 high resolution water gun array consisting of 5 x 80 cubic inch
52 © Australian Geological StuVey Organisation, 1993
•
•
•

•
•
•
Air compressor system: 6 x A-300 Price compressors, each providing 300 scfm at 2000 psi (62litres/min at 14 MPa)
Recording Instrumentation & Recording Options
Digital seismic acquisition system designed and built by AGSO running on DEC ~ VAX 3500:
0.5, 1, 2 and 4 millisecond sampling rate 2 to 20 second record length Low noise charge-coupled preamplifiers Phoenix AID converter and instantaneous floating point amplifier (operating at 200 kHz) Maximum of 320 channels including seismic and auxiliaries LC fIlters: 8, 12,24 and 48 Hz at 18 dB/octave HC filters: 64, 128, and 512 Hz at 72 dB/octave Data stored on Fujitsu 3480 cartridge tape drives Data in demultiplexed (modified) SEG-Y format
Non-seismic data acquisition system (DAS) based on Hewlett-Packard 2117 F-series computer, 2 Mbyte memory and 290 Mbyte disk storage
Other Equipment
Reftek and Yaesu sonobuoy receivers
EG & G model 990 sidescan sonar with 1000 m of cable
Nichiyu Giken Kogyo model NTS-IIAU heatflow probe
Geological & Geochemical
Australian Winch and Haulage deepsea winch with 10 000 metres of 18 mm wire rope and hydrographic winch with 4000 m of 6 mm wire rope
Coring and rock dredging systems (various) and vibracorer
Light hydrocarbon extractor and gas chromatographs for continuous DHD (direct hydrocarbon detection) in bottom water
Hydrocarbon gas analyses in sediments
Geochemical analysis equipment for environmental monitoring
15 metre A-frame with a 12.5 ton load capability, using a variety of winches, supporting towed arrays and future capability for large scale deep coring and drilling
53 © Australian Geological Survey Organisation, 1993
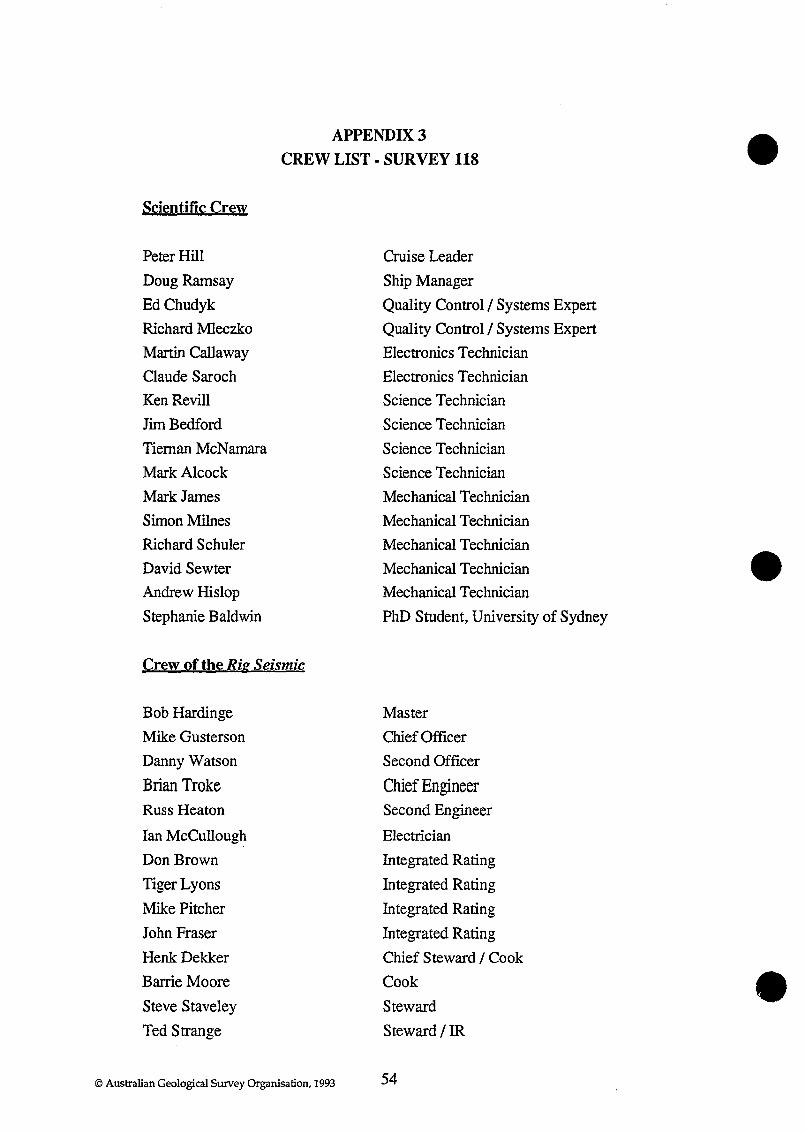
APPENDIX 3
CREW LIST. SURVEY 118
Scientific Crew
Peter Hill
Doug Ramsay
EdChudyk
Richard Mleczko
Martin Callaway
Claude Saroch
Ken Revill
Jim Bedford
Tiernan McNamara
Mark Alcock
Mark James
Simon Milnes
Richard Schuler
David Sewter
Andrew Hislop
Stephanie Baldwin
Crew of the Ri~ Seismic
Bob Hardinge
Mike Gusterson
Danny Watson
Brian Troke Russ Heaton
Ian McCullough
Don Brown
Tiger Lyons
Mike Pitcher
John Fraser
HenkDekker
Barrie Moore
Steve Staveley
Ted Strange
© Australian Geological Survey Organisation, 1993
Cruise Leader
Ship Manager
Quality Control/Systems Expert
Quality Control/Systems Expert
Electronics Technician
Electronics Technician
Science Technician
Science Technician
Science Technician
Science Technician
Mechanical Technician
Mechanical Technician
Mechanical Technician
Mechanical Technician
Mechanical Technician
PhD Student, University of Sydney
Master
Chief Officer
Second Officer
Chief Engineer Second Engineer
Electrician
Integrated Rating
Integrated Rating
Integrated Rating
Integrated Rating
Chief Steward / Cook
Cook
Steward
Steward/IR
54
•
•
•

• APPENDIX 4
EXPLORATION WELLS TIED DURING SURVEY 118
WELL OPERATOR DATE TD OLDEST STATUS (m) SEQUENCE
LYNEDOCHl Shell 1973 3967 Jurassic (plover Minor gas in Early
Fm) Cretaceous
limestones, P&A
LONDONDERRY 1 BOe of Australia 1973 1145 Neocomian Dry,P&A
sandstone over
Proterozoic
rhyodacite
KULKAl Diamond 1984 3998 Late Oil shows in
Shamrock Oil Carboniferous Jurassic
Co. sandstones and
Carboniferous
• clastics, P&A
EVANS SHOAL 1 BHP Petroleum 1988 3712 Middle Jurassic Gas in M. Jurassic
(PloverFm) sandstones, P&A
TUATARAl BHP Petroleum 1990 3875 Devonian Dry,P&A
(? Arafura Go)
BELUGA 1 BHP Petroleum 1991 3100 ?Jurassic Gas shows, P&A
FISHBURN 1 BHP Petroleum 1992 2780 mid Permian Shows,P&A
• 55
© Australian Geological Survey Organisation, 1993

APPENDIX 5 • WAY POINTS USED IN SURVEY 118
Line nQ, Reference no. Latitude Longitude (pre-cruise) (deg/min S) (deg/min E)
118/0001 MA13N SOL(end 116/1501) 10 26.401 12933.038 EOL 11 07.200 12936.800
118/0002 MA12 SOL 11 00.000 12959.700 BELUGA 10 34.338 12957.912 EOL (Indo bord) 0925.000 12952.200
118/0301 MAlOA SOL 0930.000 12948.000 EOL(ZOCA) 10 03.000 12806.300
118/0401 MAXI SOL(end 116/0902) 0940.636 128 11.724 EOL (Indo bord) 0925.000 12843.975
118/0501 MA05 SOL (Indo bord) 0925.000 12857.100 EVANS SHOAL lO 04.805 12931.993 BELUGA 10 34.338 12957.912 EOL 1104.250 13023.800 • 118/0601 MA06 SOL 10 55.700 13030.000 EOL 0942.600 12950.400
118/0701 MA15 SOL 0953.700 12950.950 &0702 LYNEDOCH 0951.630 130 18.822 &0703 TUATARA 0944.000 13151.675
EOL 0943.000 13203.550
118/0801 MAlOB SOL 0920.700 13208.550 EOL 0930.000 12948.000
118/0901 MA07 SOL (Indo bord) 0925.000 12930.000 &0902 LYNEDOCH 0951.630 13018.822
EOL 10 11.500 13054.900
118/1001 MAll SOL 10 17.400 130 19.800 LYNEDOCH 0951.630 13018.822 EOL(Indo bord) 0923.700 13017.700
118/1101 MA08 SOL (Indo bord) 0922.300 13026.500 & 1102 EOL 10 11.400 131 37.900 • 118/1201 MA17 SOL 1012.400 131 32.400
TUATARA 0944.000 131 51.675 EOL (Indo bord) 0903.400 132 19.300
© Australian Geological Survey Organisation, 1993 56
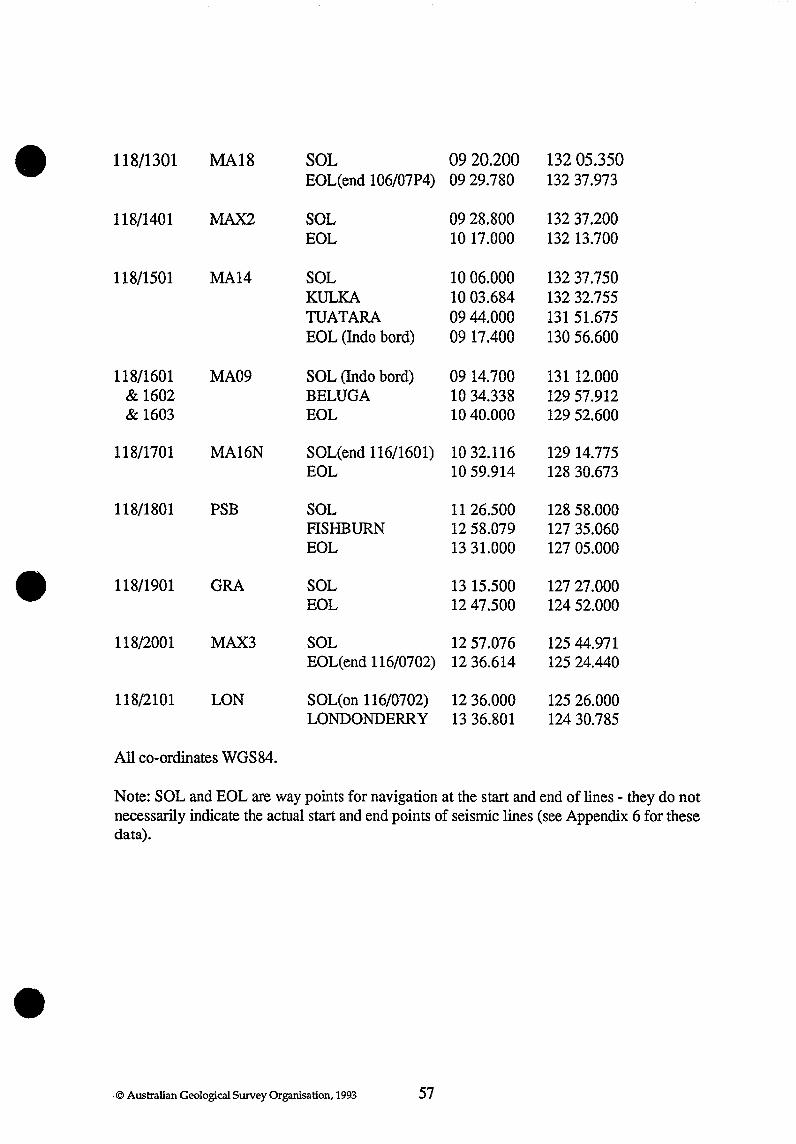
• 118/1301 MA18 SOL 0920.200 13205.350 EOL(end 106/07P4) 0929.780 13237.973
118/1401 MAX2 SOL 0928.800 13237.200 EOL 10 17.000 13213.700
118/1501 MA14 SOL 10 06.000 13237.750 KULKA 10 03.684 13232.755 TUATARA 0944.000 13151.675 EOL (Indo bard) 0917.400 13056.600
118/1601 MA09 SOL (Indo bord) 0914.700 13112.000 & 1602 BELUGA 10 34.338 12957.912 & 1603 EOL 10 40.000 12952.600
118/1701 MA16N SOL(end 116/1601) 10 32.116 12914.775 EOL 10 59.914 12830.673
118/1801 PSB SOL 1126.500 12858.000 FISHBURN 1258.079 12735.060 EOL 13 31.000 12705.000
• 118/1901 GRA SOL 13 15.500 12727.000 EOL 1247.500 12452.000
118/2001 MAX3 SOL 1257.076 12544.971 EOL(end 116/0702) 1236.614 12524.440
118/2101 LON SOL(on 116/0702) 1236.000 12526.000 LONDONDERRY 13 36.801 12430.785
All co-ordinates WGS84.
Note: SOL and EOL are way points for navigation at the start and end of lines - they do not necessarily indicate the actual start and end points of seismic lines (see Appendix 6 for these data) .
• .© Australian Geological Survey Organisation, 1993 57

SURVEY 118 LINE SUMMARY
© Australian Geological Survey Organisation, 1993
APPENDIX 6
• • •
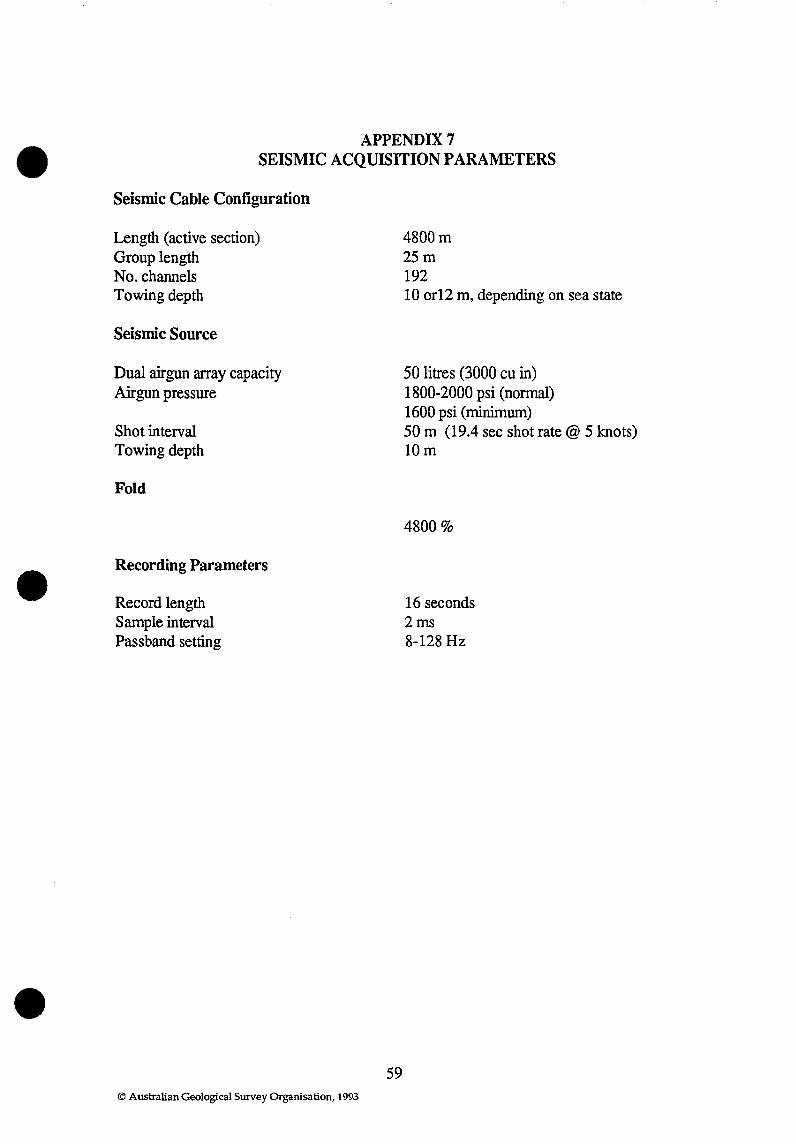
•
•
•
APPENDIX 7 SEISMIC ACQUISITION PARAMETERS
Seismic Cable Configuration
Length (active section) Group length No. channels Towing depth
Seismic Source
Dual airgun array capacity Airgun pressure
Shot interval Towing depth
Fold
Recording Parameters
Record length Sample interval Passband setting
© Australian Geological Survey Organisation, 1993
59
4800m 25m 192 10 or12 m, depending on sea state
50 litres (3000 cu in) 1800-2000 psi (normal) 1600 psi (minimum) 50 m (19.4 sec shot rate @ 5 knots) 10m
4800%
16 seconds 2ms 8-128 Hz
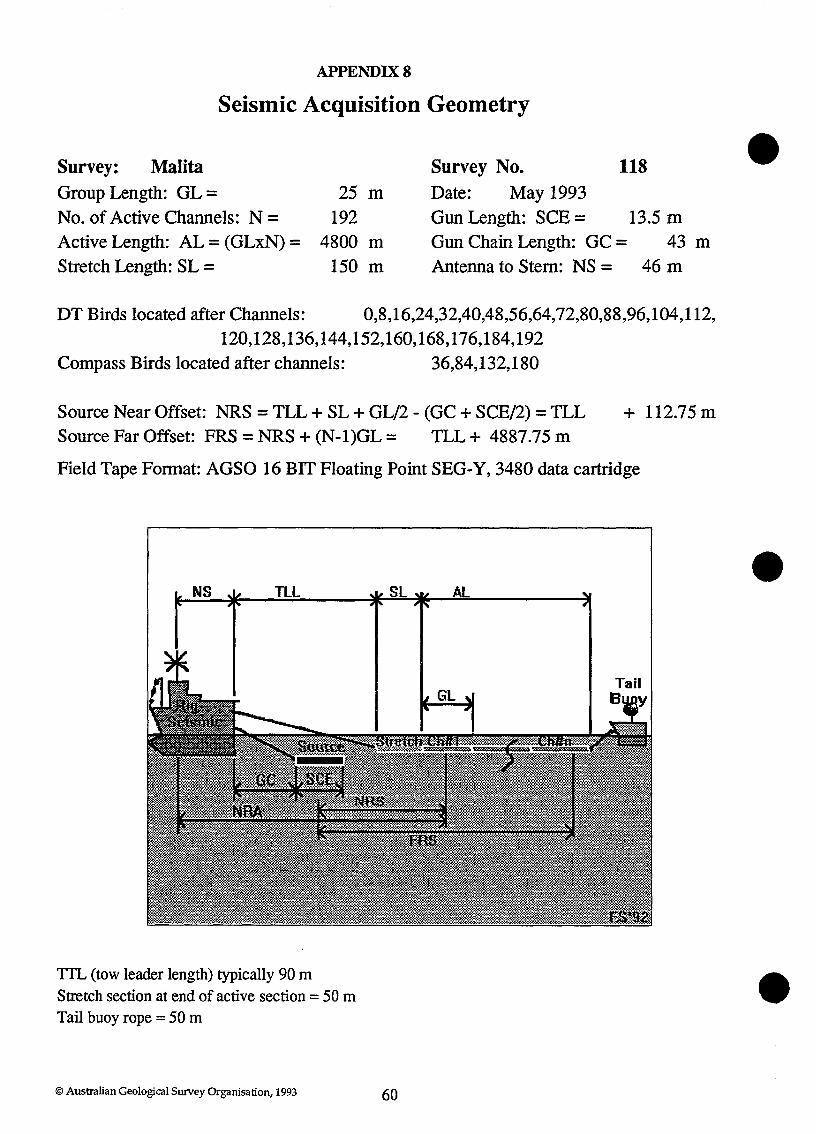
APPENDIX 8
Seismic Acquisition Geometry
Survey: Malita Survey No. 118 Group Length: GL = Date: May 1993 No. of Active Channels: N = Active Length: AL = (GLxN) = Stretch Length: SL =
25 m 192
4800 m 150 m
Gun Length: SCE = 13.5 m Gun Chain Length: GC = 43 m Antenna to Stem: NS = 46 m
DT Birds located after Channels: 0,8,16,24,32,40,48,56,64,72,80,88,96,104,112, 120,128,136,144,152,160,168,176,184,192
Compass Birds located after channels: 36,84,132,180
Source Near Offset: NRS = TLL + SL + GL/2 - (GC + SCE/2) = TLL + 112.75 m Source Far Offset: FRS = NRS + (N-1)GL = TLL + 4887.75 m
Field Tape Fonnat: AGSO 16 BIT Floating Point SEG·Y, 3480 data cartridge
NS
TIL (tow leader length) typically 90 m Stretch section at end of active section = 50 m Tail buoy rope = 50 m
© Australian Geological Survey Organisation, 1993 60
•
•
•

APPENDIX 9
SEISMIC STREAMER PARAMETERS & NOISE LEVELS
• ••• .•••.• •.. ..• ... ..••. ..... ....•. ..•..•....•...•..•••.•• . .............. , ••••..••..•• ,.::',.·· ...•.. F.· .. ·:.· .•.• :' .• ·"' •.••.•• · .•. :,.·{.:· t· o'.·.··.·· ... w·'.'.·.·.··.·' .. ··.·.::.··.I·.·e·.:.·'.·,·.·a' .. ·"d·.' .·e' .. :.··.·,··.·.r·' .. ·' .. ·.·".·:·.·I.·e·'·.·.·.:'.·n·.·.··.'·g",·,·t··.·.·h· .. ·.,·'.·,}'. ':·."r.:·.·.·.a:'.··.·.·'.·.··I .. ·.·(·.b·.'·.·,'u··.·,'·.···.··o·.·· .. ·'·.·'y·.·:'··.·.·,.····,.···:',:·.~ .. ·.:·e.".:.·.·.:a:.·.:.·.··.t···.·h·.'.'.'e:.'.·'·.·.·r .........•... ' •.. ·M.·'· .. ·e·'·. ·a:·.".·.·n ... ··.'.'.'·.',.·R·.· .·M' .·S·.·. ··.·.·'.·.N·.'.·.· .. ·O·.:,·,:.··.I··.·s·'·.·'e'···'. ···~ine·~~~}~~~~m~r:R!p~. ~~ ·:1, r' ....... :\ ••.•.••• :.': •• : •.•• : .••.••.• : ••••• ··•·· •• {,&:Si=J.Rarige.'· •• : •• ·· •• ·i' .:.·C·it&'·sPRaHge.·H)?t.···. ·· •• ·'AHgt~··(d~gl).S/P·. y.·.· ... ·' .. ·(mictobarS):.· ••••• ·••
118/0001 10m SP 102 to EOl 95m SP 102 to 385 3.55 to 7S 2 90m SP 386 to 419 85m SP 420 to 480 80m SP 481 to 524 75m SP 525 to EOl
118/0002 10m SP 101 to EOl 95m SP 101 to 478 4.55 to 7.5P 2.3 100m SP 479 to 996 95m SP 997 to EOl
118/0301 10m SP 103 to 379 95m SP 103 to 211 l1Sto 2P 2.2 12m SP 380 to 1040 90m SP 212 to 2452
92.5m SP 2453 to 3597 85m SP 3598 to EOl
118/0401 12m SP 102 to EOl 90m SP 102 to 60 1 7.5S to lS 2.2 95m SP 602 to EOl
118/0501 10m SP 102 to EOl 95m SP 102 to EOl 11.5Sto 6P 2.3 118/0601 10m 5P 103 to EOl 95m SP 103 to 2643 8.55 to 0.5S 2.2
90m SP 2644 to 2648 85m SP 2649 to 3178 90m SP 3179 to EOl
118/0701 10m SP 102 to EOl 90m SP 102 to EOl 9Sto 0.5S 2 118/0702 10m SP 2003 to EOl • 118/0703 10m SP 5502 to 5723
12m SP 5723 to EOl
90m SP 2003 to EOl 105 to 5P 2.1 90m SP 5502 to 5769 7Sto 0.5S 2.3 80m SP 5770 to 6877 90m SP 6878 to EOl
118/0801 12m SP 103 to EOl 90m SP 103 to 744 2Sto 4P 1.9 95m SP 745 to 2220 90m SP 2221 to EOl
118/0901 10m SP 101 to EOl 90m SP 101 to EOl 4.55 to 0.55 2 118/0902 10m SP 3202 to EOl 90m SP 3202 to 4663 5Sto 2.5P 1.8
85m SP 4664 to EOl 118/1001 10m 5P 102 to EOl 90m SP 102 to 1301 7Sto 1.5P 1.9
85m SP 1302 to EOl 118/1101 10m SP 102 to 585 85m SP 102 to 199 8.55 to 6.55 -3
12m SP586to EOl 90m SP 200 to EOl 118/1102 12m SP 2702 to EOl 95m SP 2702 to 2916 6.55 to 3.55 -4
90m SP 2917 to EOl 118/1201 12m SP 102 to EOl 100m SP 102 to 803 25 to 8P 2
90m SP 804 to 1511 95m SP 1512 to 2836 100m SP 2837 to EOl
118/1301 12m SP 101 to EOl 90m SP 101 to 1354 3.55 to 2.55 -3 85m 5P 1355 to EOl
118/1401 10m SP 101 to EOl 95m SP 101 to 479 65 to 1P 2.3 100m SP 480 to 572 105m SP 573 to EOl •
© Australian Geological Survey Organisation, 1993 61
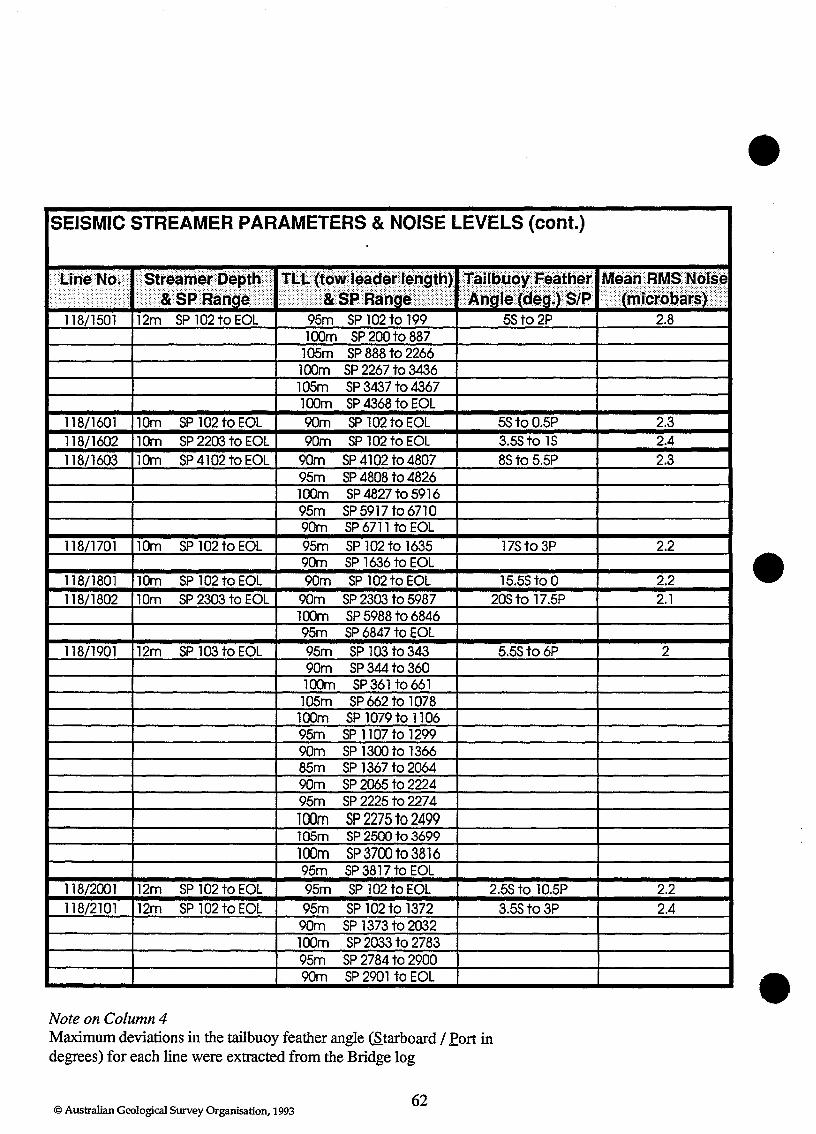
SEISMIC STREAMER PARAMETERS & NOISE LEVELS (cont.)
95m SP 102 to 199 118/1501 12m SP102toEOl SSto2P 2.8 100m SP 200 to 887
105m SP 888 to 2266 100m SP 2267 to 3436 105m SP 3437 to 4367 100m SP 4368 to EOl
118/1601 10m SP102toEOl 90m SP 102 to EOl SStoO.5P 118/1602 10m SP 2203 to EOl 90m SP 102 to EOl 3.5Sto 1$ 118/1603 10m SP 4102 to EOl 90m SP 4102 to 4807 8Sto 5.5P
95m SP 4808 to 4826 100m SP 4827 to 5916 95m SP 5917 to 6710 90m SP 6711 to EOl
118/1701 10m SP 102 to EOl 95m SP 102 to 1635 17S to 3P 90m SP 1636 to EOl
118/1801 10m SP 102 to EOl 90m SP 102 to EOl 15.5Sto 0 118/1802 10m SP 2303 to EOl 90m SP 2303 to 5987 20Sto 17.5P
100m SP 5988 to 6846 95m SP 6847 to EOl
118/1901 12m SP 103 to EOl 95m SP 103 to 343 5.5St06P 90m SP344 to 360 100m SP361 to 661 105m SP 662 to 1078 100m SP 1079 to 1106 95m SP 1107 to 1299 90m SP 1300 to 1366 85m SP 1367 to 2064 90m SP 2065 to 2224 95m SP 2225 to 2274 100m SP 2275 to 2499 105m SP 2500 to 3699 100m SP 3700 to 3816 95m SP 3817 to EOl
118/2001 12m SP102toEOl 95m SP 102 to EOl 2.5S to 10.5P 118/2101 12m SP 102 to EOl 95m SP 102 to 1372 3.5Sto 3P
90m SP 1373 to 2032 100m SP 2033 to 2783 95m SP 2784 to 2900 90m SP 2901 to EOl
Note on Column 4 Maximum deviations in the tailbuoy feather angle CS,tarboard / fort in degrees) for each line were extracted from the Bridge log
© Australian Geological Survey Organisation, 1993 62
2.3 2.4 2.3
2.2
2.2 2.1
2
2.2 2.4
•
•
•
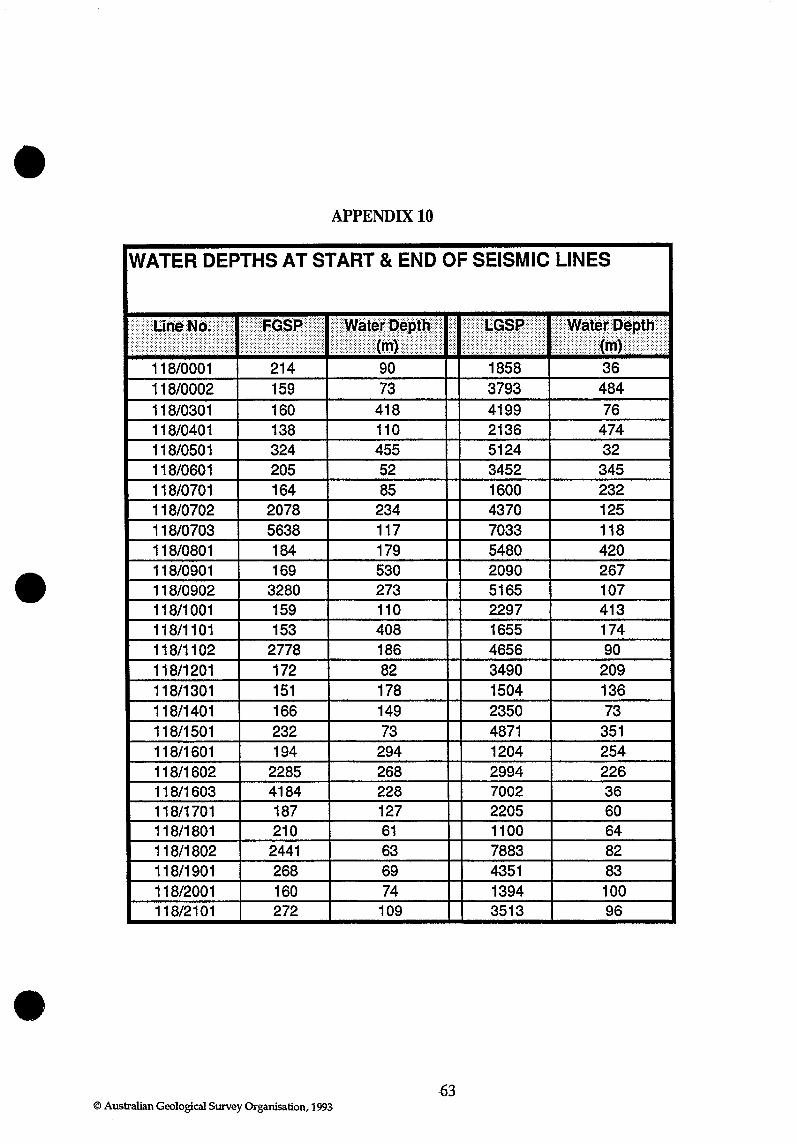
• APPENDIX 10
WATER DEPTHS AT START & END OF SEISMIC LINES
118/0002
118/0703 5638 118/0801 184
•
11 118/1901 268 118/2001 160
• -63
© Australian Geological Survey Organisation, 1993

• APPENDIX 11
SEISMIC TAPE LISTING
•
• 64
© Australian Geological Survey Organisation, 1993
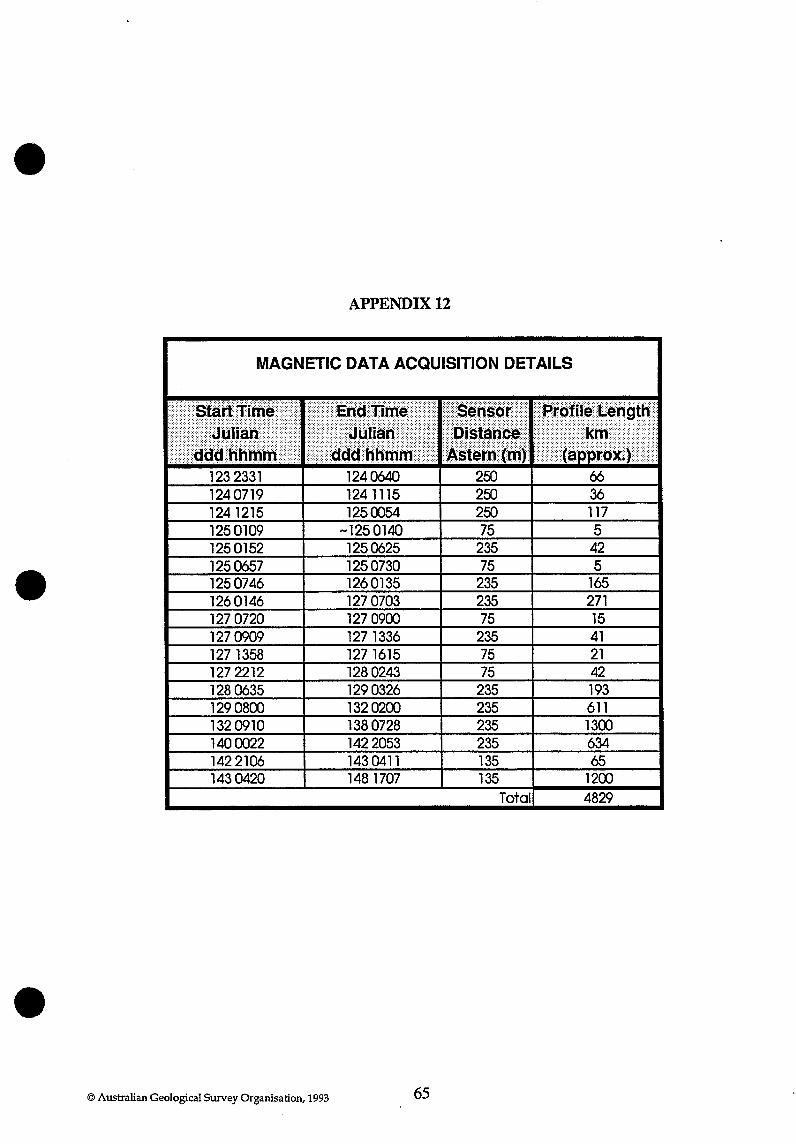
• APPENDIX 12
MAGNETIC DATA ACQUISITION DETAILS
•
• © Australian Geological Survey Organisation, 1993 65

APPENDIX 13 LOCATIONS OF GPS AERIALS AND ECHO·SOUNDER TRANSDUCERS •
Distance from stern Height above Distance from (m) waterline (m) centreline (m)
Racal #1 Trimble 47 14.8 5.4 port aerial
Racal #2 Trimble 53.3 14.9 4.8 port aerial
MXI00 aerial - 46 Instrument Room
MXI00 aerial - 48 bridge
3.5 kHz echo- 60 n/a 0.5 starboard sounder
transducer (forward)
12 kHz echo- 38.4 n/a 0 sounder
transducer (HDR stem)
•
66
© Australian Geological Survey Organisation, 1993
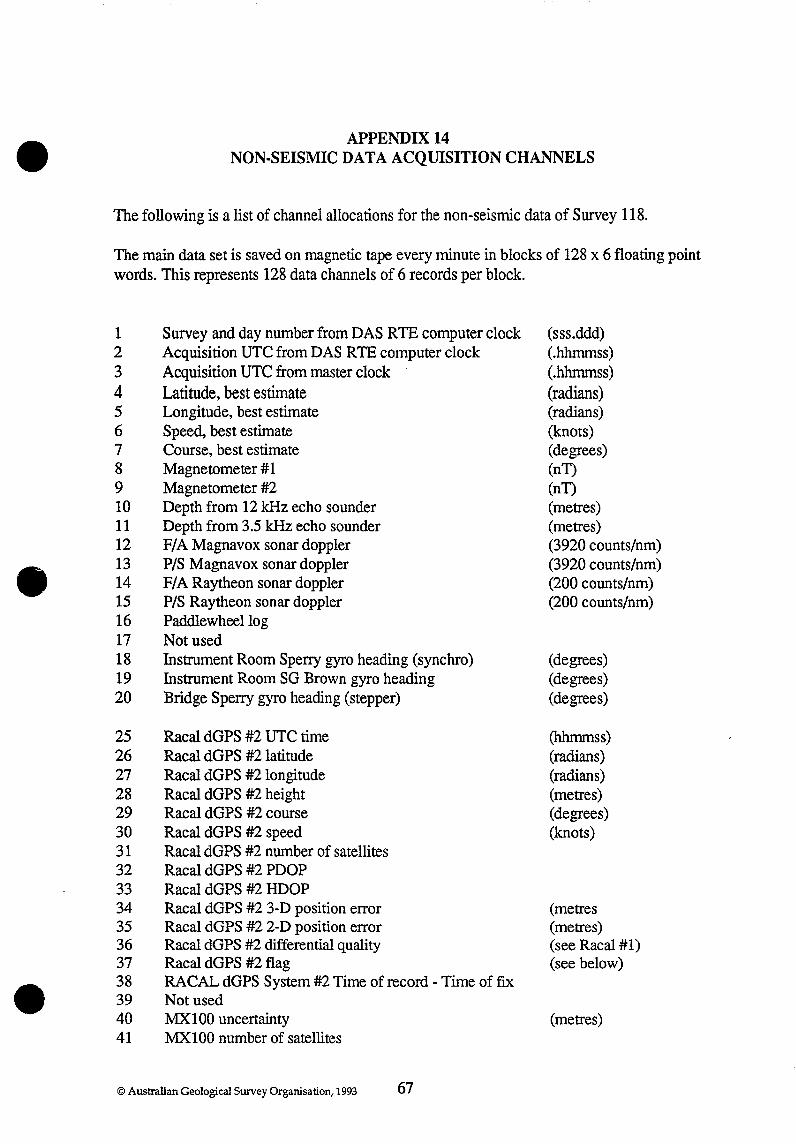
•
•
•
APPENDIX 14 NON·SEISMIC DATA ACQUISITION CHANNELS
The following is a list of channel allocations for the non-seismic data of Survey 118.
The main data set is saved on magnetic tape every minute in blocks of 128 x 6 floating point words. This represents 128 data channels of 6 records per block.
1 Survey and day number from DAS RTE computer clock (sss.ddd) 2 Acquisition UTC from DAS RTE computer clock (.hhmmss) 3 Acquisition UTe from master clock (.hhmmss) 4 Latitude, best estimate (radians) 5 Longitude, best estimate (radians) 6 Speed, best estimate (knots) 7 Course, best estimate (degrees) 8 Magnetometer #1 (nT) 9 Magnetometer #2 (nT) 10 Depth from 12 kHz echo sounder (metres) 11 Depth from 3.5 kHz echo sounder (metres) 12 FI A Magnavox sonar doppler (3920 counts/nm) 13 PIS Magnavox sonar doppler (3920 counts/nm) 14 F/A Raytheon sonar doppler (200 counts/nm) 15 PIS Raytheon sonar doppler (200 counts/nm) 16 Paddlewheello g 17 Not used 18 Instrument Room Sperry gyro heading (synchro) (degrees) 19 Instrument Room SG Brown gyro heading (degrees) 20 Bridge Sperry gyro heading (stepper) (degrees)
25 Racal dGPS #2 UTC time (hhmmss) 26 Racal dGPS #2 latitude (radians) 27 Racal dGPS #2 longitude (radians) 28 Racal dGPS #2 height (metres) 29 Racal dGPS #2 course (degrees) 30 Racal dGPS #2 speed (knots) 31 Racal dGPS #2 number of satellites 32 Racal dGPS #2 POOP 33 Racal dGPS #2 HOOP 34 Racal dGPS #2 3-D position error (metres 35 Racal dGPS #2 2-D position error (metres) 36 Racal dGPS #2 differential quality (see Racal #1) 37 Racal dGPS #2 flag (see below) 38 RACAL dGPS System #2 Time of record - Time of fix 39 Not used 40 MXI00 uncertainty (metres) 41 MXlOO number of satellites
© Australian Geological Survey Organisation, 1993 67
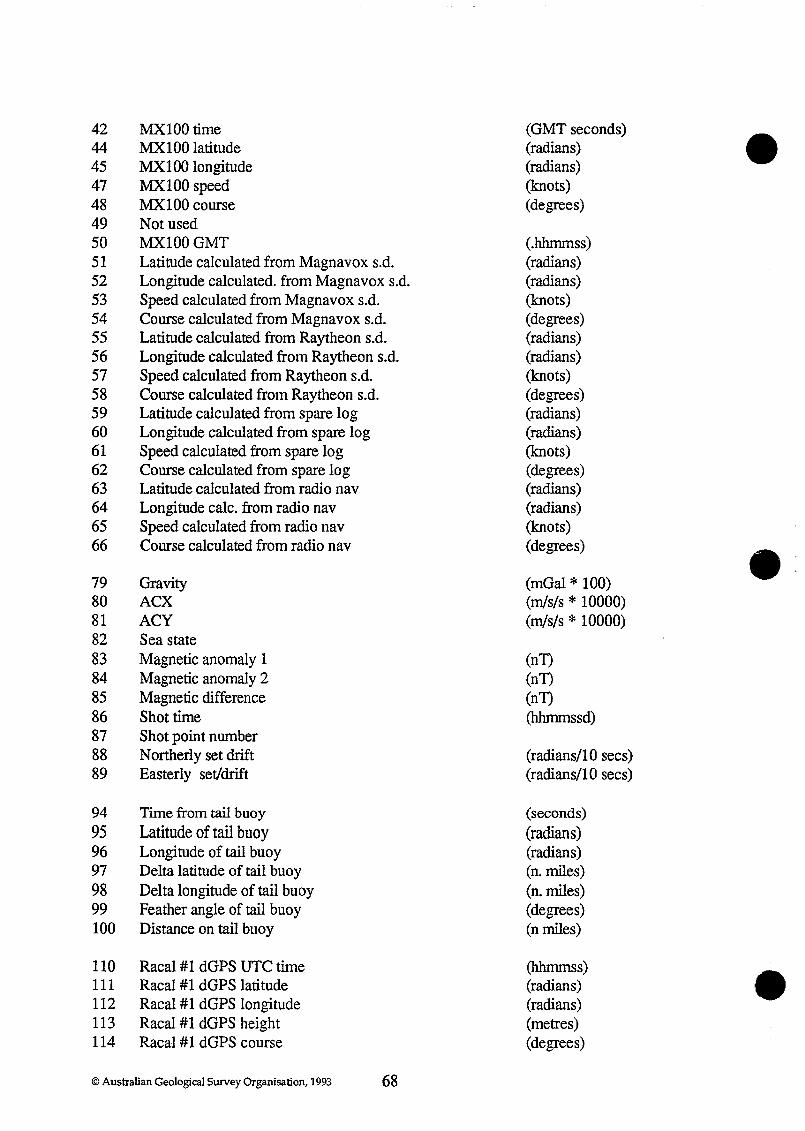
42 MXlOOtime (GMT seconds) • 44 MXlOO latitude (radians) 45 MX100 longitude (radians) 47 MXlOO speed (knots) 48 MXlOO course (degrees) 49 Not used 50 MXlOOGMT (.hhmmss) 51 Latitude calculated from Magnavox s.d. (radians) 52 Longitude calculated. from Magnavox s.d. (radians) 53 Speed calculated from Magnavox s.d. (knots) 54 Course calculated from Magnavox s.d. (degrees) 55 Latitude calculated from Raytheon s.d. (radians) 56 Longitude calculated from Raytheon s.d. (radians) 57 Speed calculated from Raytheon s.d. (knots) 58 Course calculated from Raytheon s.d. (degrees) 59 Latitude calculated from spare log (radians) 60 Longitude calculated from spare log (radians) 61 Speed calculated from spare log (knots) 62 Course calculated from spare log (degrees) 63 Latitude calculated from radio nay (radians) 64 Longitude calc. from radio nay (radians) 65 Speed calculated from radio nay (knots) 66 Course calculated from radio nay (degrees) • 79 Gravity (mGal * 100) 80 ACX (m/s/s * 10000) 81 ACY (m/s/s * 10000) 82 Sea state 83 Magnetic anomaly 1 (nT) 84 Magnetic anomaly 2 (nT) 85 Magnetic difference (nT) 86 Shot time (hhmmssd) 87 Shot point number 88 Northerly set drift (radians/l0 sees) 89 Easterly set/drift (radians/lO sees)
94 Time from tail buoy (seconds) 95 Latitude of tail buoy (radians) 96 Longitude of tail buoy (radians) 97 Delta latitude of tail buoy (n. miles) 98 Delta longitude of tail buoy (n. miles) 99 Feather angle of tail buoy (degrees) 100 Distance on tail buoy (n miles)
110 Racal #1 dGPS UTC time (hhmmss) • 111 Racal #1 dGPS latitude (radians) 112 Racal #1 dGPS longitude (radians) 113 Racal #1 dGPS height (metres) 114 Racal #1 dGPS course (degrees)
© Australian Geological Survey Organisation, 1993 68
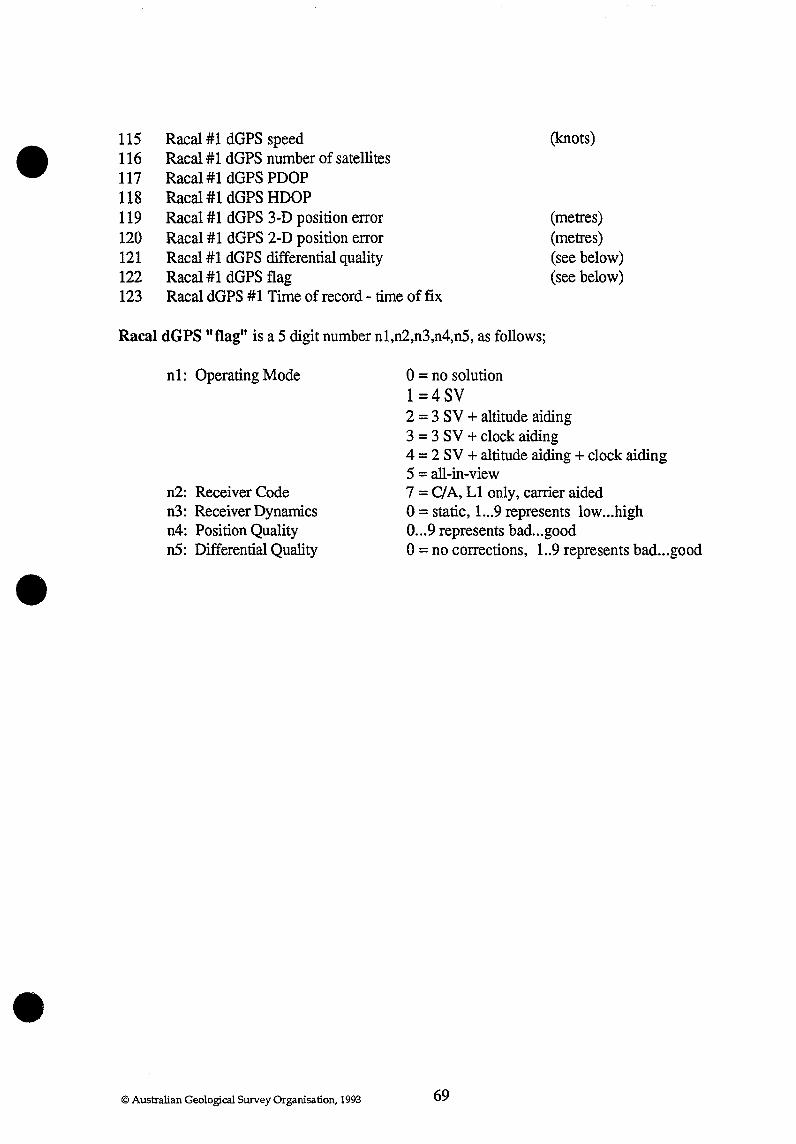
•
•
•
115 Racal #1 dGPS speed 116 Racal #1 dGPS number of satellites 117 Racal #1 dGPS PDOP 118 Racal #1 dGPS HOOP 119 Racal #1 dGPS 3-D position error 120 Racal #1 dGPS 2-D position error 121 Racal #1 dGPS differential quality 122 Racal #1 dGPS flag
(knots)
(metres) (metres) (see below) (see below)
123 Racal dGPS #1 Time of record - time of fix
Racal dGPS "flag" is a 5 digit number n1,n2,n3,n4,nS, as follows;
nl: Operating Mode
n2: Receiver Code n3: Receiver Dynamics n4: Position Quality n5: Differential Quality
© Australian Geological Survey Organisation, 1993
o = no solution 1 =4SV 2 = 3 SV + altitude aiding 3 = 3 SV + clock aiding 4 = 2 SV + altitude aiding + clock aiding 5 = all-in-view 7 = CIA, L1 only, carrier aided o = static, 1...9 represents low ... high 0 ... 9 represents bad ... good o = no corrections, 1..9 represents bad ... good
69
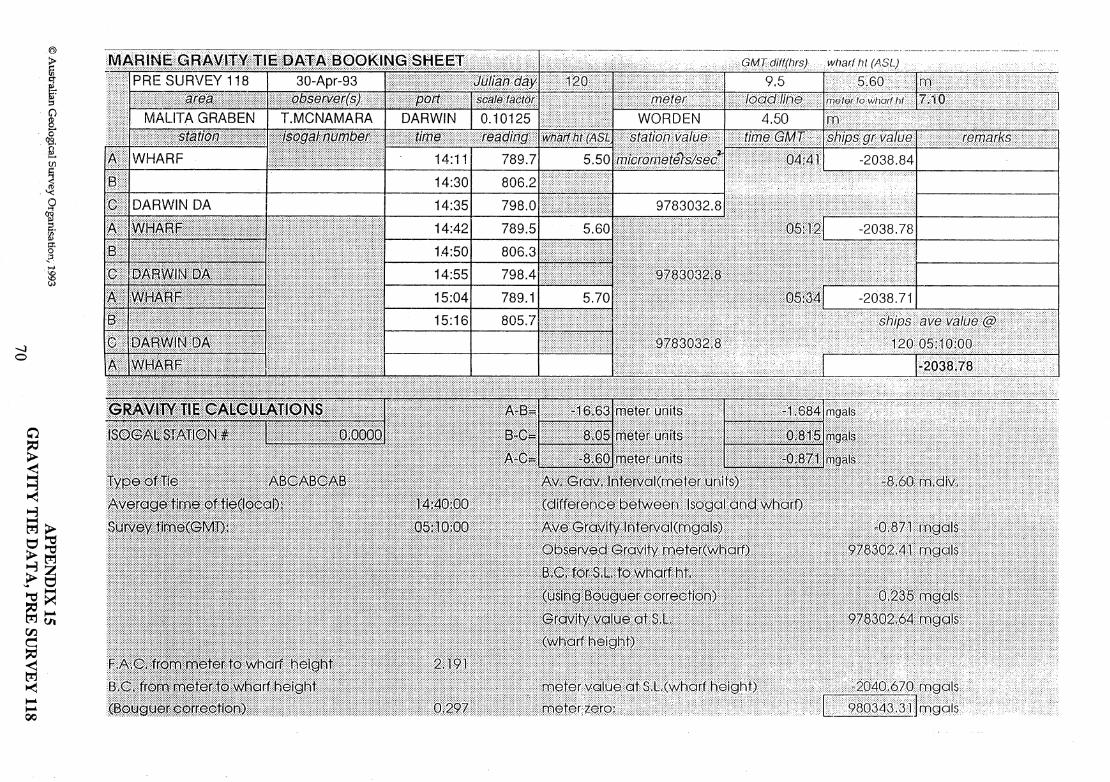
-...) o
Ci ~
~ ~
@
~ q-
~ ::l C)
~ o
<:t9. ~ Vl
j ~ ~. !:l". o ? ..... 'D \0 (;J
~ ~> ~~ I:::'~ >~
~~ ~ ~
~~ ~~ ~th CJ'.l e
~ ~ ~ 00
M~B.!~§@B~M~mM.illl~!?8m~I?QQK!N@§BI$I;[·> ~'--"------'---' -.. -.-........ _............. ....... .. ...... _ ..... .. }.' PRE SURVEY 118
-.---------+=====~-=+===='+
T.MCNAMARA
········································qrJ~!tJ}l/ijljiif '.IE£fill11wg2lilli!i$±k:5E[g!£!E£t\lTIf~f!:lli1~ j)('g~r.YU\':@H1 jih~~~~~====~==== WHARF 14:11
14:30
~.I DARWIN DA 14:351 798.0'.·.,.·,·· ••••••.••. · •• ·.'.· •.• , •• ·.•• II. , IA'(!1;;,
tBI1('
•.. \.:i:l i,na.' '4 }}l(
.C '·'WiPQp!9.
5J ...... .
,'0:'·· .• p .. Jr}}~;:::::'·
;:;:::;:::;:;:;:;:;:;:;:::::;:;:;:;:;:::;::;::::::::::::::;:::.: ....... .
".:.:.:.:.:.:.:.:::::::::::::::;.::::::::::::::;::::':::::.::::=::::::::::.:.; •.. ... <{:;:::.:-: ....... .
.. :::::::.;.;. ...... .
:;:;:;:;:::;:::::;:::::;:.;:::::::.;.;.;.; ........
::j

-.l -
@
~ ~ ~
~ Cl 2-o
C!9. g.
I o
em 2. ~ !:T.
? .... \0
(B
C1 ~
~ ~ ~ ~ t:r1.> t::I~ >~ ~tr.1
?~ ~~ O~ en I-" -3"'en e ~ ~ tr.1 ~ I-" I-" 00
M~BI~j;~B~&,lill·M.ill!§:··~~ill~@,@~K..!~§·$.HI;E;m?<· •. ··•··•·•· •.•••• li.···.·······}}(·t.·..ii§Mt~!(((ljrj);)rxh~tff1tM§L) .i,;c POST SURVEY 118 31-May-93
:@R§.~£V§[(:~).J MALITA GRABEN T.MCNAMARA
'I I'" nr-1%:.lWntmr PEARL MUSEUM
DARWIN DA
i }').
.. ').§~ .. ~.(!R ......... .
· .. )18·.·"'·.····.,..· .... •· .-... -.;.;.;.;::;::::;::::::::.:-: ... -....
.. ",.=J.::t!ll~il~~:lJ:::::::::: .• ...... :;:;:.;.: ... ; ..... .
:}::::;::::::::::.:.: ........................................ :.:.;.:.:::::;:::::::.: ...... .
t;g;nr9/TlWll"'T",r .• r, ..
12:35
12:41
12:51
13:00
13:06
13:20
13:28
13:35
13:43
~!lmlg~t§glt§9,,,y,,.'l{···· .-.-.-.-.:.:.:.::::.:::::::::::::::::::::::::::;:~:::~:~:::::::::::::?:::::;::::;:::::::::::::::::::;:::::::::::':.~ : .. ~ ... ::.;-; ...
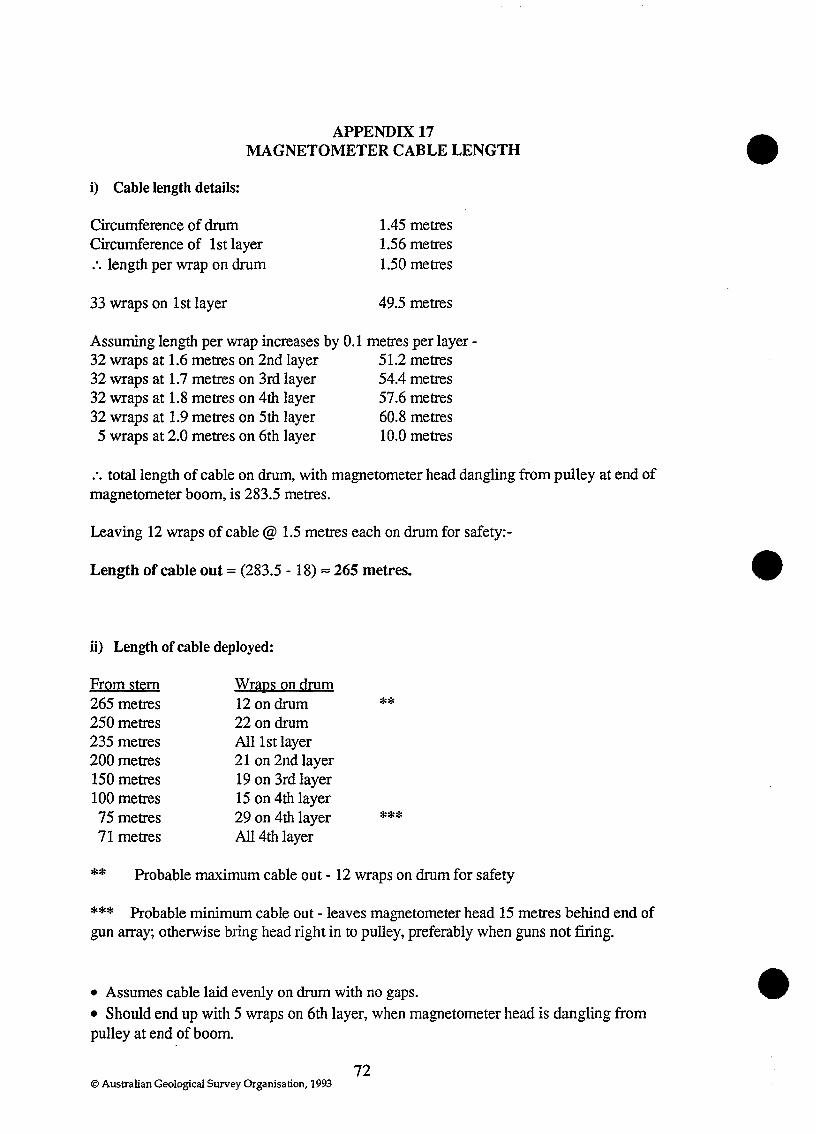
APPENDIX 17 MAGNETOMETER CABLE LENGTH
i) Cable length details:
Circumference of drum Circumference of 1st layer :. length per wrap on drum
33 wraps on 1st layer
1.45 metres 1.56 metres 1.50 metres
49.5 metres
Assuming length per wrap increases by 0.1 metres per layer -32 wraps at 1.6 metres on 2nd layer 51.2 metres 32 wraps at 1.7 metres on 3rd layer 54.4 metres 32 wraps at 1.8 metres on 4th layer 57.6 metres 32 wraps at 1.9 metres on 5th layer 60.8 metres 5 wraps at 2.0 metres on 6th layer 10.0 metres
:. total length of cable on drum, with magnetometer head dangling from pulley at end of magnetometer boom, is 283.5 metres.
Leaving 12 wraps of cable @ 1.5 metres each on drum for safety:-
Length of cable out = (283.5 - 18) ... 265 metres.
ii) Length of cable deployed:
From stern 265 metres 250 metres 235 metres 200 metres 150 metres 100 metres 75 metres 71 metres
Wraps on drum 12 on drum 22 on drum All 1 st layer 21 on 2nd layer 19 on 3rd layer 15 on 4th layer 29 on 4th layer All 4th layer
**
***
** Probable maximum cable out - 12 wraps on drum for safety
*** Probable minimum cable out - leaves magnetometer head 15 metres behind end of gun array; otherwise bring head right in to pulley, preferably when guns not fIring.
• Assumes cable laid evenly on drum with no gaps .
• Should end up with 5 wraps on 6th layer, when magnetometer head is dangling from pulley at end of boom.
72 © Australian Geological Survey Organisation, 1993
•
•
•
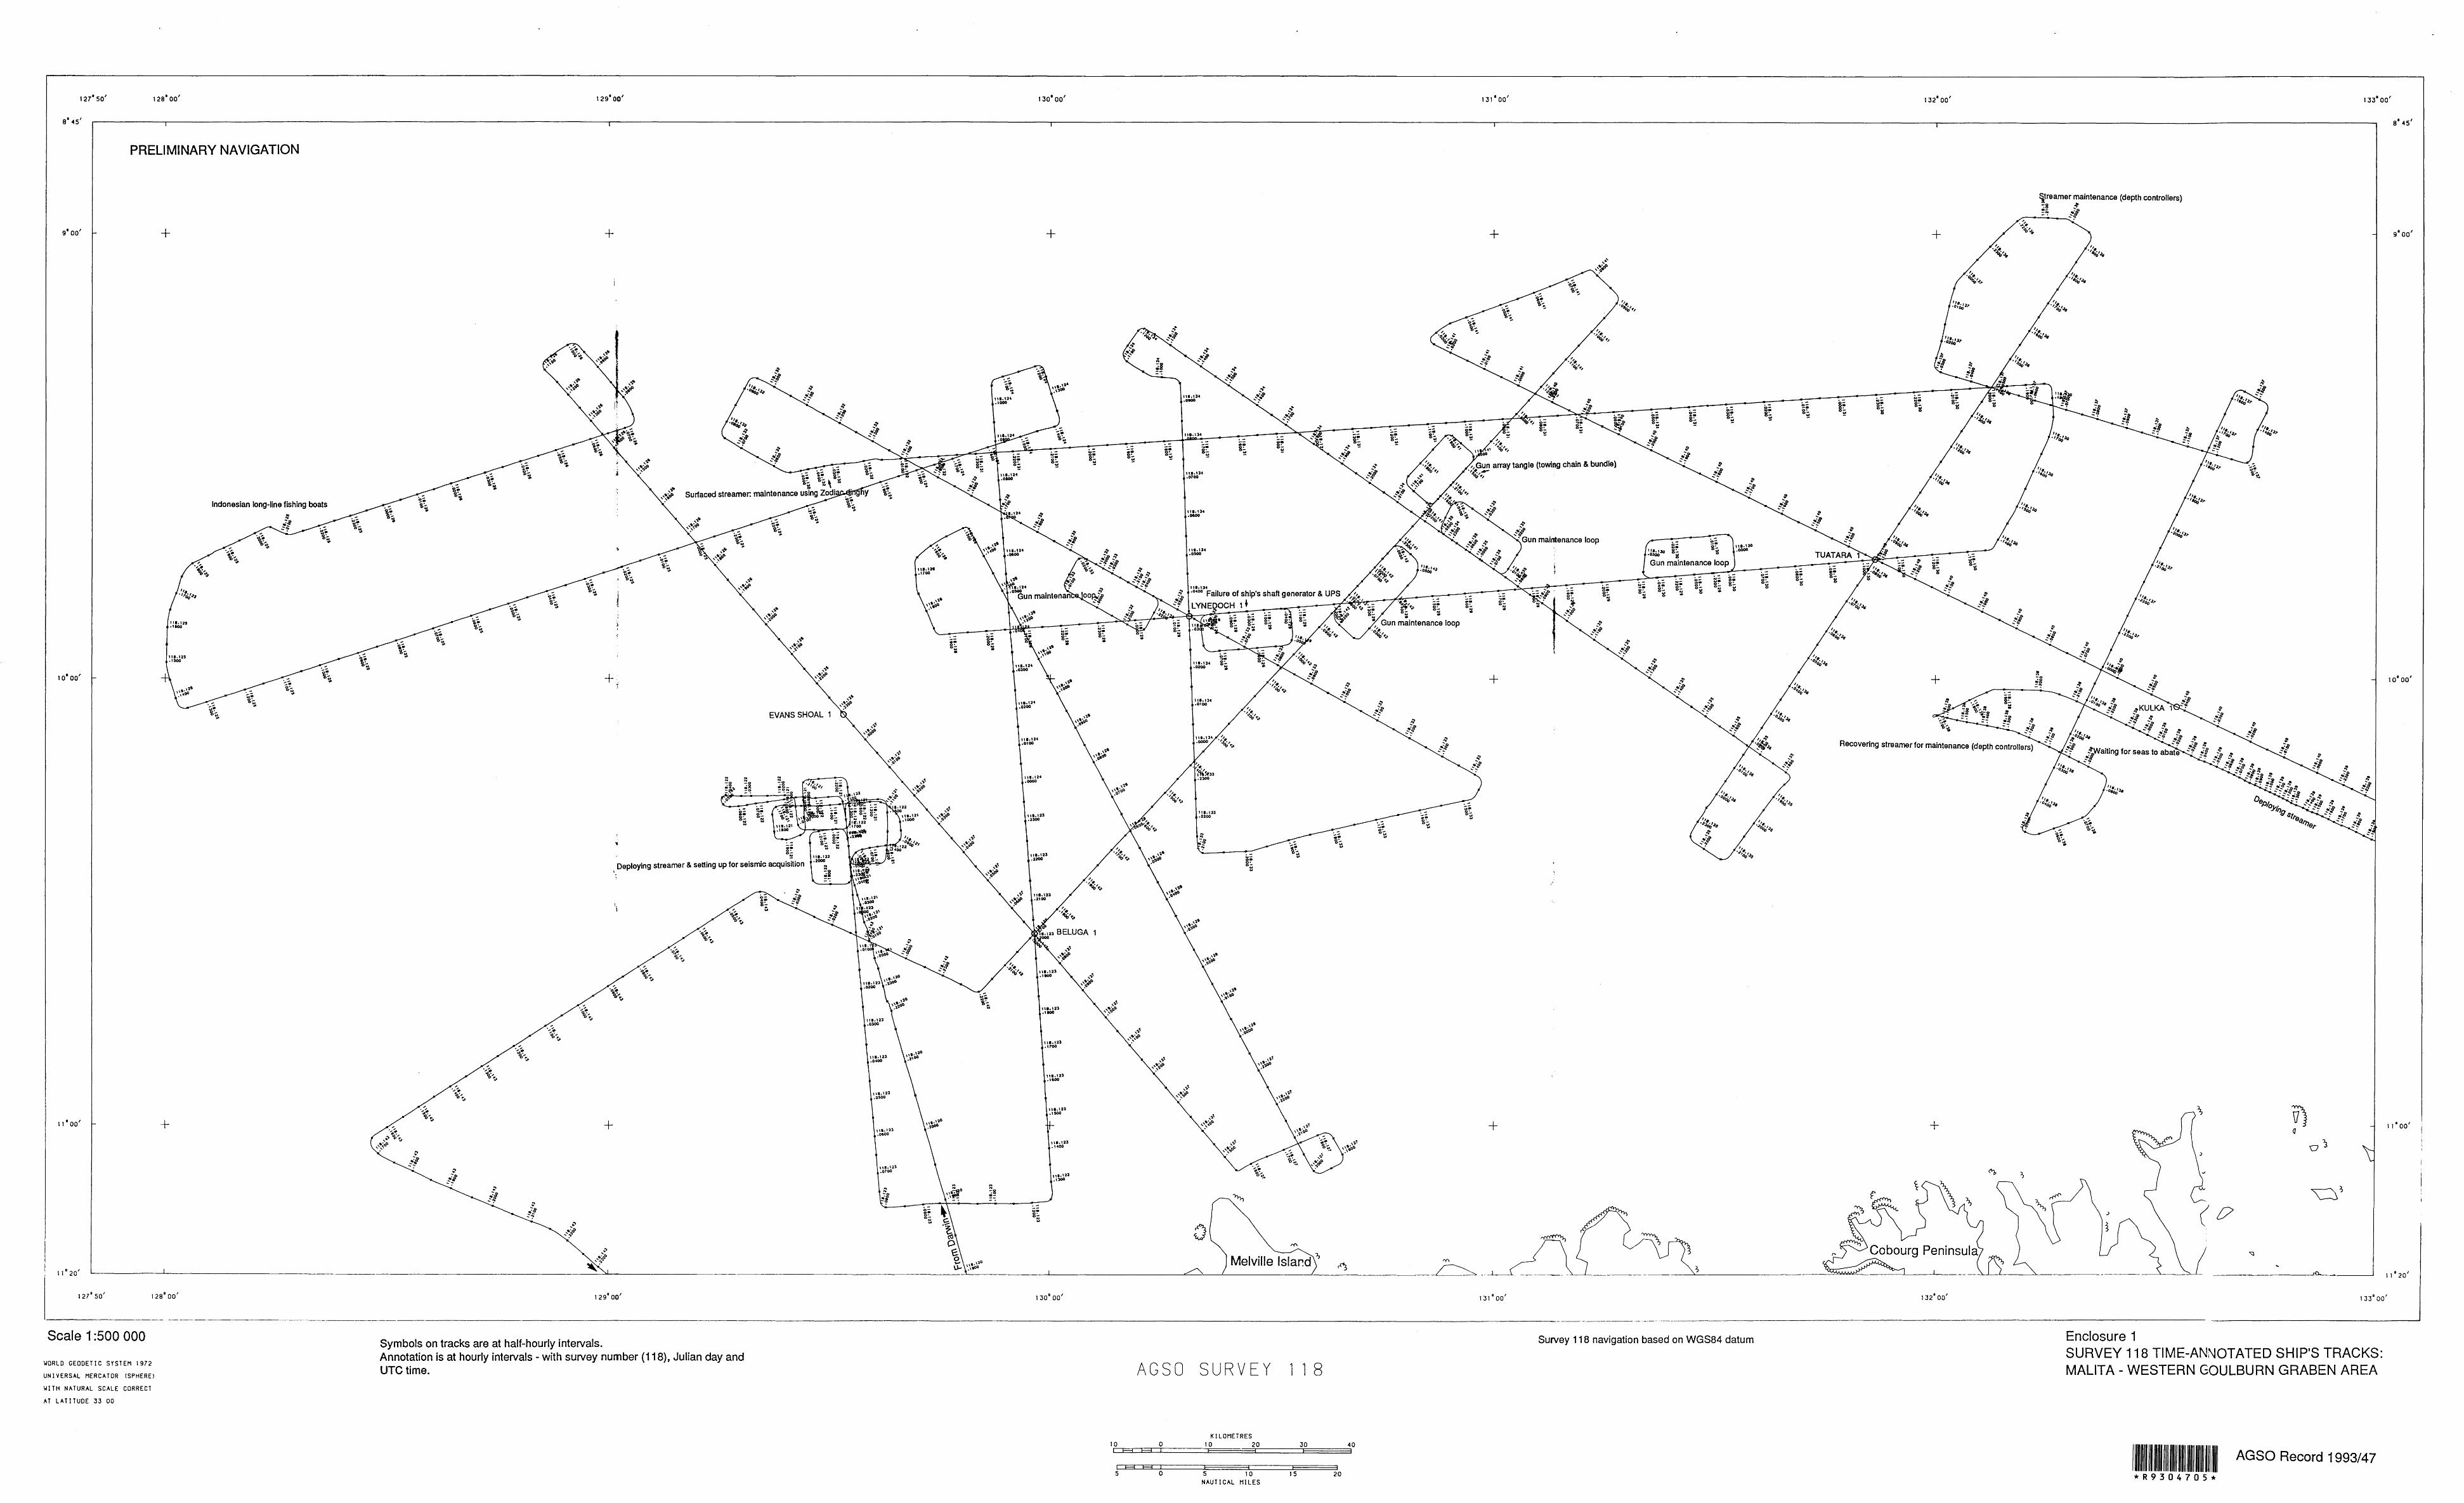
'27' SO' '28' 00'
8' .015'
PRELIMINARY NAVIGATION
9' 00'
10' 00'
"·00'
\ \' 20'
127' 50'
+
'''.". .. -"'.,n .. -
+
128" 00'
Indonesian long-line fishing boats
'-------_._---- ._-----------
Scale 1 :500 000
WORLD GEODETlC SYSTEM 1972
UNIVERSAL MERCATOR (SPHERE)
WITH NATURAL SCALE CORRECT
~T LATITUDE 33 DO
\29'00'
+
"~ f
,,:;; 'l~ i; ii &~\ ~
Surtaced streamer: maintenance using Zo,cd!ili 1Co.'~j1iy \!
+
,
~g ~8 ;:.~ ... ;:~
..
EVANS SHOAL 1
·_'''c t'~:1
" •. '2' . Itoo
, Deploying streamer & setting up for seismic acquisition
.~~~
"
> ,~# , ,
, I
+
129' 00'
Symbols on tracks are at half-hourly intervals. Annotation is at hourly intervals - with survey number (118). Julian day and UTCtime.
•
~j. ",y
" .. , .G' "I"
.~~ ..
" •. 'D .' rOll
", ,~~
" •. Ul .. -,,..,n .. ~
",.'~l .0,1)0
",:.'..10 .J"'"
. . ".-;1f .I~
", ,~~~
~:~ ,'..-
" 0:.::: .111.'21
130' 00'
+
.- . Gun malntenan
",.121 .. -" •• nl .0":'"
.., :5;
,,' ,:~
", ,~~
11.·'2' .-
",.Ul .. -,,..'n .2'0<>
" .,.!-, ",
-, "/;, , "
121 BELUGA
~j. ,'..-
" •• '23 .. -" •• '21 .. -
" .... 1 .,100
" •• 12> .. -"'.n1 ... 00
" •.• u .. ~
130· DO'
,., ,,~.;dI
.'
" .. ,,. .. -
" •• 13' .~~
,,, •• JI .-",.u. .0500
,,'.In .O{OO Failure of shlp's shaft generator & UPS
LYNE OCH l'
, ".131 .. -
. '. ~'t\~"'l) .2~0<>
,,' ,,~ ...... . '
"
,c ,
., ...... , . "
,,' ,~~
", ,~
" . . , .
Melville Islar.d '
AGSO SURVEY 1 1 8
lO I E3
o E3 I
H H I 5 0
KILOMETRES lO 20 30
5 lO l5 20 NAUTICAL MlLES
40
.... --~'~.. 8~ .. ~ ~
'-Gun maintenance loop
·"L·, ~ "
\ 31' 00'
+
-',
-, . "~ ."'f'
.~., .... ,
.-8~ .; -.
"Gun array tangle (towing chain & bundle) ";'.,.... ,
+
+
131" 00'
'" d . Gun maintenance loop
"','Jcr ~! .0;\00 I!l
,,,.110 .-- '" :,~,,,,,~ .. ,
Gun maintenance loop
,
-----
.-lS'!' .. ~ " •
Survey 118 navigation based on WGS84 datum
i! ,
TUATARA 1
IJ2'00'
'" .,~,.t,.
+
.. - R;;_ s! z;
". "'4{"o
+ • ;8
. ' " "~~
'" .,~"o
" ·,.'a,jltJ
~treamer maintenance (depth controllers) -:8 ~ ;:~ .;:~I
" "(,'.to
'" "OOQ"G
'" '~'';;.J,>
> /1
'" ".,;..'~"
> it -,
1 33' 00'
8" 45'
10" 00'
Recovering streamer for maintenance (depth controllers)
+ 1 I' 00'
'0 3 ,
(0 Cobourg Peninsula I 11" 20'
132' 00' 133" 00'
Enclosure 1 SURVEY 118 TIME-ANNOTATED SHIP'S TRACKS: MALITA - WESTERN GOULBURN GRABEN AREA
AGSO Record 1993/47
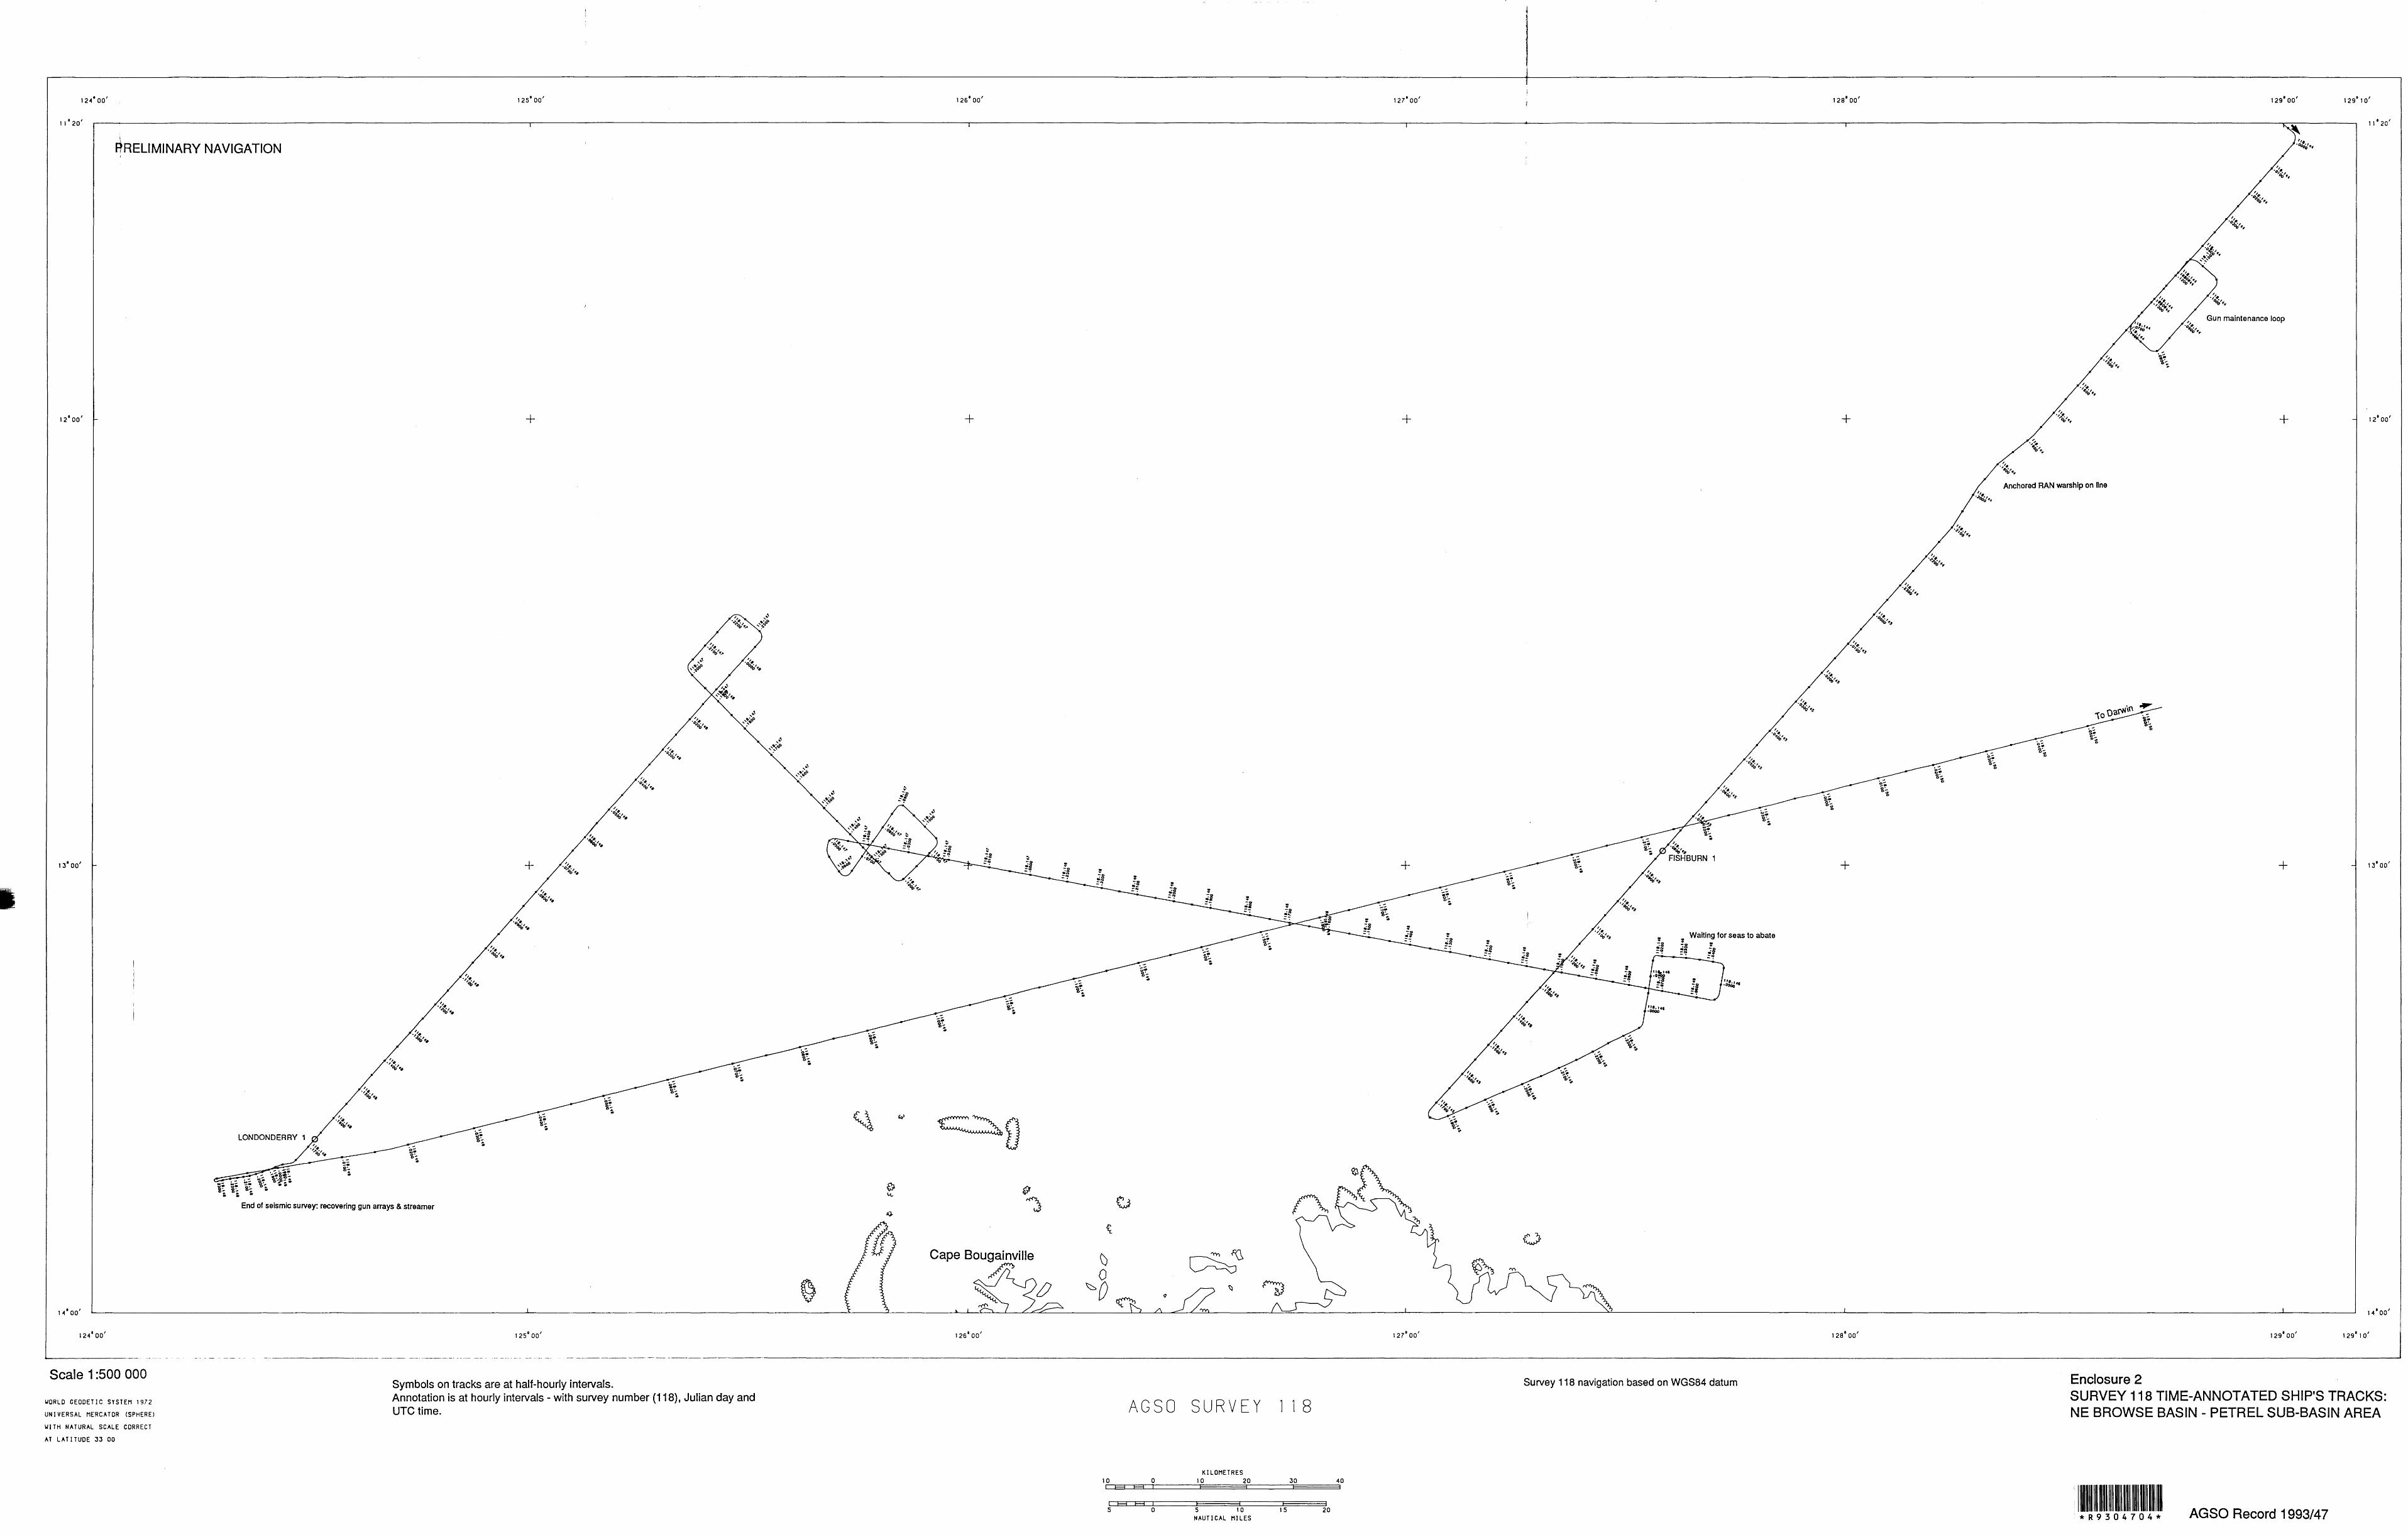
I
12'" 00'
1 I' 20'
\ FlRELIMINARY NAVIGATION ,
12'00'
13' 00'
. :~, ".
LONDONDERRY 1
. ;' . . ', , '.
" OIL-, ~' .
.:~, ~'.
125'00'
+
.;~., ~'.
, .. :;; , .,or
. ,,~, ~"
.,::.. , ..., '.
+
'"'''' ~"
.k.~, .....
End of seismic survey: recovering gun arrays & streamer
1 ~. 00'
12"'00'
Scale 1 :500 000
WORLD GEODETIC SYSTEM 1972
UNIVERSAL MERCATOR (SPI"EREJ
WITH NATURAL SCALE CORRECT
AT LATITUDE J3 00
125' DO'
Symbols on tracks are at half-hourly intervals. Annotation is at hourly intervals - with survey number (118), Julian day and UTCtime.
126'00'
+
Cape Bougainville
M ~
126' DO'
, -. .. =~
10 I
I 5
,
AGSO
0 E3 E3 I
E3 H I 0
12"· DO'
+
+
: .. .d
•
.;:,;, . ' .
127'00'
SURVEY 1 1 8
KILOMETRES 10 20 30 40
5 10 15 20 NAUT I CAL MILES
, -. ~?
·;z.,
" "'~""
, .; .~., :
~'. H
". ""'" .-
.;:~, .....
.;:~., ..... FISHBURN 1
.. Waiting for seas 10 abate '. ' .:.. ";8 ;:'! =~
, if
Survey 118 navigation based on WGS84 datum
12S' 00'
+
+
128'00'
" '''L-, , '.
·;z., , '.
129'00' 129' 1 0'
Gun maintenance loop
+
.:~, ". Anchored RAN warship on line
+ 1 J' 00'
14'00'
129' DO' 129' 1 0'
Enclosure 2 SURVEY 118 TIME-ANNOTATED SHIP'S TRACKS: NE BROWSE BASIN - PETREL SUB-BASIN AREA
AGSO Record 1993/47