VERITAS Observations of Supernova Remnants and Pulsar Wind Nebulae in the Fermi Era

MNRAS 489, 1986–1994 (2019) doi:10.1093/mnras/stz2282Advance Access publication 2019 August 19
Deep late-time observations of the supernova impostors SN 1954Jand SN 1961V
Rachel A. Patton,1‹ C. S. Kochanek1,2 and S. M. Adams3
1Department of Astronomy, The Ohio State University, 140 West 18th Ave, Columbus OH 43210, USA2Centre for Cosmology and AstroParticle Physics, The Ohio State University, 191 West Woodruff Avenue, Columbus OH 43210, USA3Cahill Centre for Astrophysics, California Institute of Technology, Pasadena CA 91125, USA
Accepted 2019 August 14. Received 2019 August 13; in original form 2018 November 16
ABSTRACTSN 1954J in NGC 2403 and SN 1961V in NGC 1058 were two luminous transients whosedefinitive classification as either non-terminal eruptions or supernovae remains elusive. Acritical question is whether a surviving star can be significantly obscured by dust formed frommaterial ejected during the transient. We use three lines of argument to show that the candidatesurviving stars are not significantly optically extinct (τ � 1) by dust formed in the transients.First, we use SED fits to new HST optical and near-IR photometry. Secondly, neither sourceis becoming brighter as required by absorption from an expanding shell of ejected material.Thirdly, the ejecta masses implied by the Hα luminosities are too low to produce significantdust absorption. The latter two arguments hold independent of the dust properties. The Hα
fluxes should also be declining with time as t−3, and this seems not to be observed. As a result,it seems unlikely that recently formed dust can be responsible for the present faintness ofthe sources compared to their progenitors, although this can be verified with the James WebbSpace Telescope. This leaves three possibilities: (1) the survivors were misidentified; (2) theyare intrinsically less luminous; (3) SN 1954J and SN 1961V were true supernovae.
Key words: supernovae: general – supernovae: individual: SN 1954J, SN 1961V.
1 INTRODUCTION
There are a subset of massive stars that appear to experienceviolent eruptions, some of which are spectroscopically similar toType IIn supernovae (SNe; Schlegel 1990; Filippenko 1997) due totheir moderate line widths (vej � 2000 km s−1). The brightest ofthese eruptions are not easily distinguishable from the faintest SNe,leading to the term SN ‘impostor’ (Van Dyk, Filippenko & Li 2002)and the potential for misclassification. The only certain differencebetween the most luminous eruptions and the least luminous SNeis that these eruptions are non-terminal. These eruptions remainpoorly understood and so accurate classification of these events iscritical to understanding outburst mechanisms and rates.
Two of the most famous examples are SN 1954J in NGC 2403and SN 1961V in NGC 1058. SN 1954J was originally classified asan SN but was later identified as the luminous blue variable (LBV)V12 and reclassified as an eruption (Tammann & Sandage 1968).The progenitor remained fairly quiescent at MB ≈ −6.6 mag until itbecame highly variable a few years prior to its eruption, sometimesfluctuating by as much as two magnitudes over a few days. Thepeak of the transient was not observed due to its proximity to the
� E-mail: [email protected]
Sun. When next observed, its magnitude had increased from MB ≈−8.5 mag to MB ≈ −11.3 mag before settling at MB ≈ −5.6 mag,a full magnitude fainter than the progenitor (Tammann & Sandage1968). The survivor never regained its pre-eruption luminosity andhas not significantly varied since the eruption (Smith, Humphreys &Gehrz 2001; Van Dyk et al. 2005; Kochanek, Szczygiel & Stanek2012; Humphreys et al. 2017). Van Dyk et al. (2005) resolved theregion around SN 1954J into four stars (see Fig. 1) and identifiedstar 4 as the most likely survivor candidate due to its strong Hα
emission. Follow-up spectroscopy by Humphreys et al. (2017)shows no significant change in the Hα emission between 2014and 2017.
SN 1961V was originally classified as a ‘Type V’ supernovae(Zwicky 1964), and its true nature remains disputed. The progenitorof SN 1961V was one of the brightest stars in NGC 1058. Pre-transient, it had MB ≈ −12 mag until brightening to MB ≈ −14mag around a year prior to the peak. In the following months itbrightened to MB ≈ −16 mag before reaching a peak at MB ≈ −18mag in 1961 December. The star’s brightness decreased over a fewmonths before briefly plateauing at MB ≈ −13 mag and then fadingto MB ≈ −11.5 mag where it remained for 4 yr until droppingbelow the point of visibility in 1968 (see the various summaries inGoodrich et al. 1989; Humphreys & Davidson 1994; Humphreyset al. 1999; Kochanek et al. 2011; Smith et al. 2011).
C© 2019 The Author(s)Published by Oxford University Press on behalf of the Royal Astronomical Society
Dow
nloaded from https://academ
ic.oup.com/m
nras/article-abstract/489/2/1986/5551496 by Serials Division user on 23 June 2020
Late-time observations 1987
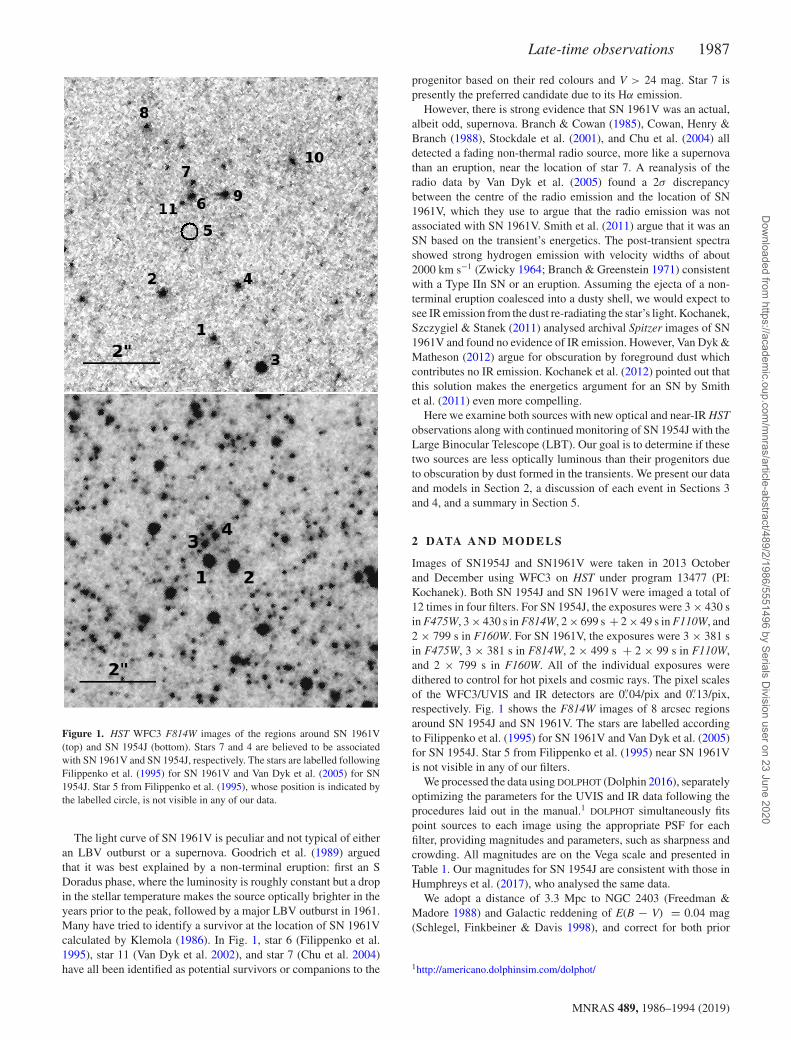
Figure 1. HST WFC3 F814W images of the regions around SN 1961V(top) and SN 1954J (bottom). Stars 7 and 4 are believed to be associatedwith SN 1961V and SN 1954J, respectively. The stars are labelled followingFilippenko et al. (1995) for SN 1961V and Van Dyk et al. (2005) for SN1954J. Star 5 from Filippenko et al. (1995), whose position is indicated bythe labelled circle, is not visible in any of our data.
The light curve of SN 1961V is peculiar and not typical of eitheran LBV outburst or a supernova. Goodrich et al. (1989) arguedthat it was best explained by a non-terminal eruption: first an SDoradus phase, where the luminosity is roughly constant but a dropin the stellar temperature makes the source optically brighter in theyears prior to the peak, followed by a major LBV outburst in 1961.Many have tried to identify a survivor at the location of SN 1961Vcalculated by Klemola (1986). In Fig. 1, star 6 (Filippenko et al.1995), star 11 (Van Dyk et al. 2002), and star 7 (Chu et al. 2004)have all been identified as potential survivors or companions to the
progenitor based on their red colours and V > 24 mag. Star 7 ispresently the preferred candidate due to its Hα emission.
However, there is strong evidence that SN 1961V was an actual,albeit odd, supernova. Branch & Cowan (1985), Cowan, Henry &Branch (1988), Stockdale et al. (2001), and Chu et al. (2004) alldetected a fading non-thermal radio source, more like a supernovathan an eruption, near the location of star 7. A reanalysis of theradio data by Van Dyk et al. (2005) found a 2σ discrepancybetween the centre of the radio emission and the location of SN1961V, which they use to argue that the radio emission was notassociated with SN 1961V. Smith et al. (2011) argue that it was anSN based on the transient’s energetics. The post-transient spectrashowed strong hydrogen emission with velocity widths of about2000 km s−1 (Zwicky 1964; Branch & Greenstein 1971) consistentwith a Type IIn SN or an eruption. Assuming the ejecta of a non-terminal eruption coalesced into a dusty shell, we would expect tosee IR emission from the dust re-radiating the star’s light. Kochanek,Szczygiel & Stanek (2011) analysed archival Spitzer images of SN1961V and found no evidence of IR emission. However, Van Dyk &Matheson (2012) argue for obscuration by foreground dust whichcontributes no IR emission. Kochanek et al. (2012) pointed out thatthis solution makes the energetics argument for an SN by Smithet al. (2011) even more compelling.
Here we examine both sources with new optical and near-IR HSTobservations along with continued monitoring of SN 1954J with theLarge Binocular Telescope (LBT). Our goal is to determine if thesetwo sources are less optically luminous than their progenitors dueto obscuration by dust formed in the transients. We present our dataand models in Section 2, a discussion of each event in Sections 3and 4, and a summary in Section 5.
2 DATA AND MODELS
Images of SN1954J and SN1961V were taken in 2013 Octoberand December using WFC3 on HST under program 13477 (PI:Kochanek). Both SN 1954J and SN 1961V were imaged a total of12 times in four filters. For SN 1954J, the exposures were 3 × 430 sinF475W, 3 × 430 s inF814W, 2 × 699 s + 2 × 49 s inF110W, and2 × 799 s in F160W. For SN 1961V, the exposures were 3 × 381 sin F475W, 3 × 381 s in F814W, 2 × 499 s + 2 × 99 s in F110W,and 2 × 799 s in F160W. All of the individual exposures weredithered to control for hot pixels and cosmic rays. The pixel scalesof the WFC3/UVIS and IR detectors are 0.′′04/pix and 0.′′13/pix,respectively. Fig. 1 shows the F814W images of 8 arcsec regionsaround SN 1954J and SN 1961V. The stars are labelled accordingto Filippenko et al. (1995) for SN 1961V and Van Dyk et al. (2005)for SN 1954J. Star 5 from Filippenko et al. (1995) near SN 1961Vis not visible in any of our filters.
We processed the data using DOLPHOT (Dolphin 2016), separatelyoptimizing the parameters for the UVIS and IR data following theprocedures laid out in the manual.1 DOLPHOT simultaneously fitspoint sources to each image using the appropriate PSF for eachfilter, providing magnitudes and parameters, such as sharpness andcrowding. All magnitudes are on the Vega scale and presented inTable 1. Our magnitudes for SN 1954J are consistent with those inHumphreys et al. (2017), who analysed the same data.
We adopt a distance of 3.3 Mpc to NGC 2403 (Freedman &Madore 1988) and Galactic reddening of E(B − V) = 0.04 mag(Schlegel, Finkbeiner & Davis 1998), and correct for both prior
1http://americano.dolphinsim.com/dolphot/
MNRAS 489, 1986–1994 (2019)
Dow
nloaded from https://academ
ic.oup.com/m
nras/article-abstract/489/2/1986/5551496 by Serials Division user on 23 June 2020
1988 R. A. Patton, C. S. Kochanek and S. M. Adams
Table 1. HST photometry of stars near SN 1954J and SN 1961V.
Event Object F475W err F814W err F110W err F160W err
SN 1954J Star 1 24.157 0.021 20.714 0.006 19.573 0.002 18.618 0.002Star 2 24.101 0.020 20.820 0.006 19.710 0.002 18.729 0.002Star 3 23.190 0.012 23.073 0.021 23.109 0.018 22.940 0.034Star 4a 24.084 0.022 22.630 0.017 22.023 0.008 21.591 0.012
SN 1961V Star 6 26.399 0.089 23.752 0.033 22.695 0.012 21.823 0.012Star 7a 25.808 0.058 25.198 0.103 24.418 0.045 23.831 0.056Star 11 27.946 0.302 25.218 0.089 24.174 0.035 23.310 0.036
aThe most likely eruption survivor.
to any modelling. We adopt a distance of 10 Mpc to NGC 1058(Boroson 1981) and Galactic reddening of E(B − V) = 0.06mag (Schlegel et al. 1998) and again make the requisite reddeningcorrections before modelling. We assume a minimum error of10 per cent on the photometry. We model the stars’ spectral energydistributions (SEDs) in two ways: a simple model with additionalforeground extinction by an RV = 3.1; Cardelli, Clayton & Mathis(1989) extinction law and with DUSTY (Ivezic & Elitzur 1997;Ivezic, Nenkova & Elitzur 1999; Elitzur & Ivezic 2001). In bothcases we model the stars using Castelli & Kurucz (2003) modelatmospheres convolved with the appropriate filter functions. Theparameters and their uncertainties are determined using MarkovChain Monte Carlo (MCMC) methods. We do not include theSpitzer mid-IR data analysed in Kochanek et al. (2011, 2012) inour SEDs because no IR emission was observed at the site of SN1961V and only upper limits were found at the site of SN 1954J.
The simple model minimizes the fit statistic:
χ2 =∑
i
(log Li − log Lmod
i (L∗, T∗)
+0.4RλE(B − V ))2
/σ 2i , (1)
where Li and Lmodi are the observed and model band luminosities
(λLλ), to estimate the total luminosity L∗, temperature T∗, andadditional foreground reddening E(B − V) beyond the Galacticcontribution. The χ2 is calculated and minimized in log space.DUSTY solves for radiation transfer from the star through a dustyshell. We embed DUSTY in an MCMC driver (Adams & Kochanek2015) that allows for a dusty circumstellar shell plus a variableamount of foreground extinction. This model has the V-band opticaldepth τV and dust temperatureTd as additional parameters. We againoptimize the same fit statistic (equation 1) but in this model, the bandluminosities, Lmod
i (L∗, T∗, τV , Td ) have more parameters. We fix thedust temperature Td at 50 K for all our models since the optical andnear-IR bands we use have no contribution from the dust emission.For all DUSTY models we treat the dust as purely silicate as this isthe type of dust expected from massive stars (Speck et al. 2000).Changes in dust composition have only modest effects on our results(see Kochanek et al. 2012, for further discussion on the effects ofdust composition).
Circumstellar absorption due to dust formed in the transientrequires that the dust optical depth is time variable (see Kochaneket al. 2012). The dust forms as the ejecta cools to form a dustycircumstellar shell. As time passes, the optical depth drops as τ =τ 0(t0/t)2 due to its geometric expansion. If the shell fragments orbecomes clumpy, the drop in optical depth will accelerate. A clumpdirectly in our line of sight does not prevent a steady drop in theeffective optical depth because most of the escaping emission isscattered light from a broad region across the shell. As the optical
depth drops, we should see the surviving star brighten with time, asis the case with η Carinae (see Humphreys & Davidson 1994). Thatη Carinae had an extended period of constant optical flux means thatit must have also been forming a dusty, optically thick wind in thatperiod (Kochanek et al. 2012). A constant optical depth requires asteady dust forming wind and emission by hot dust, which is notseen for either SN 1954J or SN 1961V (Kochanek et al. 2011, 2012).
Consider a source with intrinsic band luminosity L inside a dustyshell of optical depth τ 0 at time t0. The observed band luminosityis then
Lobs(t) = Le−τ0(t0/t)2. (2)
If we detect the source at two epochs, t0 and t1, we can determinethe optical depth without reference to the object’s SED or the typeof dust since
Lobs(t1) − Lobs(t0)
Lobs(t0)= eτ0(1−(t0/t1)2) − 1. (3)
Given the optical depth τ 0, we then know the true luminosity.Detection of a change in luminosity determines τ 0, and limits onchanges in luminosity set upper bounds on τ 0.
Crowding, particularly in ground-based observations, means itis only possible to measure changes in luminosity. In particular,difference imaging eliminates crowding, but all you measure isL(t1, t0) = Lobs(t1) − Lobs(t0). Given a long enough light curve,one can still determine both L and τ 0, but our observations havetoo short a time baseline to do so. If a change in luminosity isobserved, then there is a joint constraint on L and τ 0. An upper limiton the change in luminosity Lmax, provides an upper limit on theluminosity of the source,
L <Lmax
e−τ0(t0/t1)2 − e−τ0, (4)
as a function of the optical depth.For SN 1954J, we have HST observations separated by roughly
10 yr, with t0 ≈ 50 and t1 ≈ 60, corresponding to a fractionalchange in optical depth of t2
0 /t21 ≈ 0.7. We also have R-band LBT
data covering a similar baseline with t0 ≈ 54 and t1 ≈ 64 so againt20 /t2
1 ≈ 0.7. For SN 1961V we have HST observations separatedby roughly 20 yr, with t0 ≈ 40 and t1 ≈ 60, so the fractionalchange in the optical depth, t2
0 /t21 ≈ 0.4, is large. This will make it
difficult to invoke a significant optical depth without also requiringan intrinsically low-luminosity source.
Finally, both star 4 near SN 1954J and star 7 near SN 1961V havestrong, broad Hα emission, which Van Dyk & Matheson (2012)and Humphreys et al. (2017) use to argue that both transients hadsurvivors. For a fully ionized, constant density, thin hydrogen shell
MNRAS 489, 1986–1994 (2019)
Dow
nloaded from https://academ
ic.oup.com/m
nras/article-abstract/489/2/1986/5551496 by Serials Division user on 23 June 2020

Late-time observations 1989
of mass M and radius R = vt, the Hα recombination luminosity is
LHα = M2αHαEHα
4πR3m2p
, (5)
where αHα � 10−13 cm3 s−1, EHα = 1.89 eV, mp is the proton mass, is the fractional shell thickness, v is the expansion velocity, andt is the expansion time. This assumes that the outbursts were singleevents with no continuous outflows. For SN 1961V, this assumptionfollows a previous analysis by Van Dyk & Matheson (2012). For SN1954J, we consider the possibility of dense stellar wind below. Notethat the Hα luminosity is not constant, but decays asLHα ∝R−3 ∝ t−3
with time. If the Hα emission comes from photoionizing the ejecta,then the luminosity provides an estimate of the mass with
M � 0.1v3/23 t
3/250 L
1/236
1/20.1 M�, (6)
where t = 50 t50 yr, v = 1000 v3 km s−1, LHα = 1036 L36 erg s−1,and = 0.1 0.1.
Any dust formed in the ejecta is mixed with the hydrogen, so thedust optical depth of the ejecta is
τ = Mκ
4πR2, (7)
where κ is the dust opacity. We can solve for the total Hα luminosityin terms of the optical depth τ and ejection velocity v to find that
LHα = 4πvtτ 2αHαEHα
κ2m2p
. (8)
Note that this scaling only depends on dust properties like sizedistribution and composition only through the opacity. This does notaccount for dust absorption in the shell. While there is no analyticexpression for a shell, the observed luminosity from a cube of side2R is smaller by (1−e−2τ )/2τ , which goes to 1/2τ in the limit oflarge optical depth. The τ−1 scaling is generic because you only seeradiation from the regions where the optical depth to the observeris τ � 1, which is a fraction τ−1 of the overall volume. Thus, in thehigh optical depth limit
LHα � 4πvtταHαEHα
κ2m2p
. (9)
Solving for τ we find,
τ = 0.07 κ2 t−1/250 v3
−1/2 L1/236
1/20.1 , (10)
for τ ≤ 1, and
τ � 0.00 κ22 t−1
50 v3−1L36 0.1, (11)
for τ ≥ 1, where κ = 100κ2 cm2 g−1. If the material is in a uniformsphere, then the optical depth is larger by (3/)1/2 or (3/) forthe low and high τ cases, respectively. We also note that the dustdestruction time in such a photoionized nebula is �102 yr (see e.g.Draine 1995). Dust formed in the ejecta will continue to be presentif the ejecta is photoionized at a later time.
Finally, we consider a scenario put forth by Humphreys et al.(2017), where the Hα emission comes from a dense stellar wind ofa binary companion. The Hα luminosity of the wind is
LHα = M2αEHα
4πv2wμ2m2
pR∗. (12)
where M is the mass loss rate, vw is the wind speed, and R∗ is thestellar radius. The Thomson optical depth of the wind is
τT = MκT
4πR∗v, (13)
where the Thomson opacity is κT � 0.5 cm2 g−1. Humphreys et al.(2017) want τ T � 1 to explain the shape of the line profile of SN1954J. The Hα luminosity is then
LHα = 4πR∗αEHατ2T
μ2m2pκ2
T
, (14)
in terms of its Thomson optical depth. Finally, we can express thestellar radius R2
∗ = L∗/4πσT 4∗ in terms of the stellar luminosity L∗
and effective temperature T∗, to find that
LHα = 84L1/2∗2 T −2
∗2 τ 2T L� (15)
for L∗ = 100L∗2 L�, T∗ = 20 000T∗2 K, κ = 0.5 cm2 g−1, α =10−13 cm3 s−1, and μ = 1.
Adding dusts obscuration has an interesting consequence due tothe LHα ∝ L
1/2∗2 scaling of equation (15). Let LHα0 and L∗0 be the
Hα luminosity inferred from the line flux and the stellar luminosityinferred from equation (15) assuming there is no dust. Supposewe add a dust optical depth τα at the wavelength of Hα. Thenthe true line luminosity is LHα = LHα0exp (τα) and we must haveL∗ = L∗0exp (2τα). This means that the expected flux of the star,F∗ ∝ L∗exp (− τα) ∝ L∗0exp (τα) actually increases rather thandecreases as you try to obscure the star behind dust because ofhow the Hα luminosity depends on L∗ when you hold the Thomsonoptical depth of the wind constant. Note that if we consider the fluxof the star near Hα this is completely independent of dust properties.
3 SN 1954J IN NGC 2403
All four stars in the environment of SN 1954J are well fit as singlestars. Table 2 lists the best-fitting parameters for each star andFig. 2 shows each star’s SED after being corrected for the modelforeground extinction. We assumed the same foreground extinctionfor the archival and current band luminosities. Humphreys et al.(2017) argue that an additional AV of 0.8–0.9 beyond Galactic isnecessary to properly fit each star, which is consistent with ourfindings. Stars 1 and 2 appear to be red giants and star 3 is an A orB star.
The candidate counterpart to SN 1954J, star 4, has an intermediatetemperature. Humphreys et al. (2017) note that their blackbody fitgives T≈ 6600 K, while their spectroscopic estimate is 5000 K. Ourfits based on model atmospheres have uncertainties large enough tobe consistent with either estimate (T∗ ≈ 6600+3300
−1500 K). If we con-strain its temperature to lie within 10 per cent of their spectroscopictemperature by including a penalty of (T∗ − 5000)2/σ 2
T with σ T
= 500 K in the fit statistic, the difference in the fit statistic betweenthe two models (χ2 = 0.42) shows that the SED is consistent withthe spectroscopic temperature (see Table 2).
We again modelled star 4 with DUSTY, this time including thetemperature prior and allowing the circumstellar optical depth(τ v) to vary. If we allow both the foreground and circumstellarextinction to vary, we, not surprisingly, find degenerate solutions.If we fix the foreground extinction to E(B − V) = 0.25 to matchthe neighbouring stars, we find τV = 0.03+0.73
−0.03, consistent with theresults from Kochanek et al. (2012), while if we fix E(B − V) = 0,we find τV = 1.26+0.75
−1.08.Humphreys et al. (2017) ultimately propose that the system
consists of two stars, a ‘cold’ star with TC � 5000 K and log L∗ �4.6 and a ‘hot’ star with TH � 20 000 K and logL∗ � 5.3. To explorethis model further, we constrained the temperature of the cooler starby our temperature prior of TC = 5000 ± 500 K and consider fixedtemperatures for the hot star of TH = 10 000, 15 000, 20 000, and
MNRAS 489, 1986–1994 (2019)
Dow
nloaded from https://academ
ic.oup.com/m
nras/article-abstract/489/2/1986/5551496 by Serials Division user on 23 June 2020

1990 R. A. Patton, C. S. Kochanek and S. M. Adams
Table 2. Best-fitting DUSTY models.
Event Object Teff log L∗ E(B−V) χ2/dof Priors(K) (mag)
SN 1954J Star 1 3730+3230−190 4.63+0.89
−0.10 0.25+1.20−0.19 0.077
Star 2 3810+12760−240 4.59+2.03
−0.11 0.26+1.60−0.20 0.049
Star 3 12470+1480−3280 4.18+0.98
−0.39 0.14+0.19−0.11 0.392
Star 4a 6590+3290−1540 4.01+0.62
−0.34 0.39+0.41−0.35 0.047 No T∗ prior
Star 4a 5230+290−350 3.71+0.06
−0.07 0.09+0.07−0.08 0.468 T∗ prior
SN 1961V Star 6 4740+760−880 4.58+0.19
−0.31 0.56+0.23−0.52 0.000
Star 7a 5860+10570−180 3.78+1.40
−0.00 0.04+0.70−0.01 8.228 All bands
Star 7a 7510+830−770 3.78+0.06
−0.06 0.06+0.03−0.05 0.00 Optical bands only
Star 11 4830+1010−950 4.01+0.25
−0.30 0.59+0.32−0.50 0.046
aThe most likely eruption survivor.Errors reflect the 90 per cent confidence interval. The extinction represents additional absorption beyond the Galactic contribution.
Figure 2. The SEDs of stars 1, 2, 3, and 4 near SN 1954J for our current data (circles) and the archival ACS/WFC F475W, F606W, and F814W photometry(stars) from Humphreys et al. (2017). The model SED for star 4 includes the temperature prior T∗ = 5000 ± 500 K. The F475W and F814W points are offset by± 0.01 μm from the mean filter wavelength so that they do not overlap. These models assume the foreground extinction for the best-fitting single star models(i.e. Table 2).
MNRAS 489, 1986–1994 (2019)
Dow
nloaded from https://academ
ic.oup.com/m
nras/article-abstract/489/2/1986/5551496 by Serials Division user on 23 June 2020
Late-time observations 1991
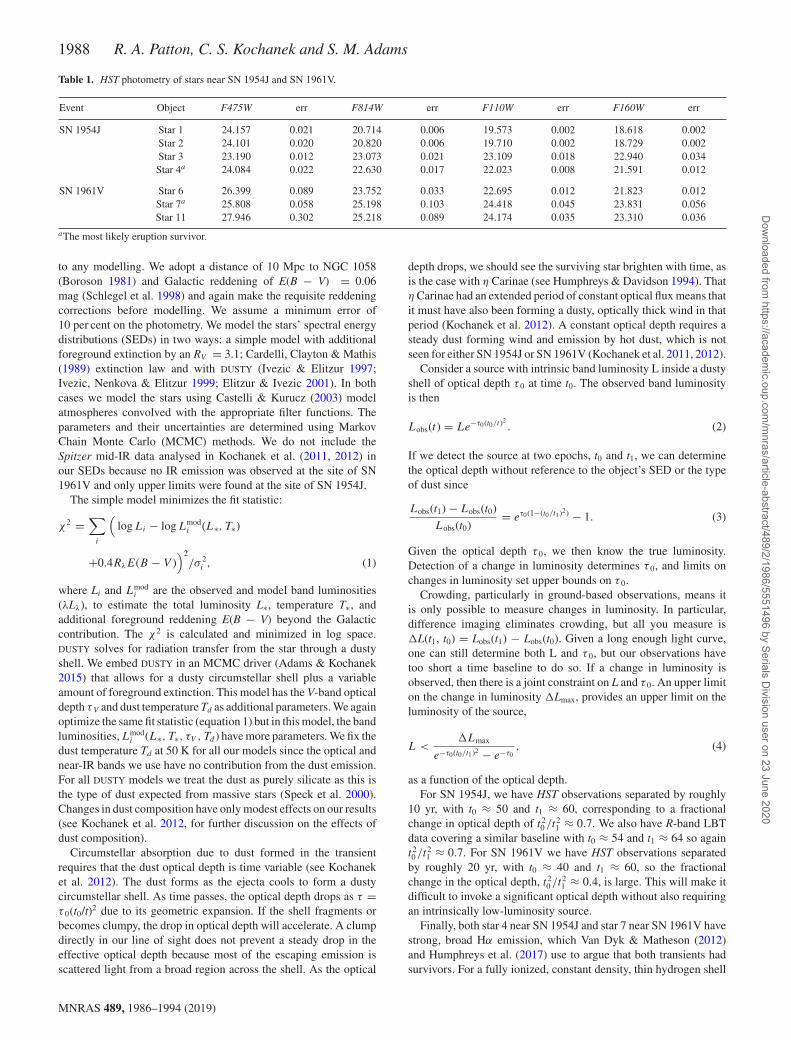
Table 3. 2-star models of star 4 near SN 1954J.
Model type TH TC log LH log LC E(B−V) χ2/dof(K) (K) (mag)
2 stars fixed TH and TC 10 000 5180+470−450 0.30+2.76
−0.16 3.70+0.11−0.10 0.08+0.15
−0.08 0.233
2 stars fixed TH and TC 15 000 5190+480−460 0.40+3.22
−0.21 3.70+0.12−0.09 0.08+0.18
−0.08 0.233
2 stars fixed TH and TC 20 000 5200+440−460 1.00+2.57
−0.82 3.70+0.11−0.10 0.08+0.13
−0.08 0.233
2 stars fixed TH and TC 25 000 5180+470−430 1.06+2.76
−0.90 3.70+0.11−0.09 0.08+0.15
−0.07 0.233
Note. Here H refers to the hot star and C to the cooler star. Errors reflect the 90 per cent confidence interval.
25 000 K. The luminosities of the two stars were free to vary, butwith a conservative penalty in the fit statistic of (LH/LC)2 for theF475W and F814W band luminosities, if LH > LC. We know fromthe Humphreys et al. (2017) spectrum that the observed optical fluxhas to be dominated by the cooler star, so we (conservatively) shouldnot allow the hot star to dominate the optical emission. Both starsare subject to the same extinction.
The results for these models are shown in Table 3. One can neverrule out the presence of a hot star, but all of our models requirethe hot star to have a negligible luminosity which cannot producesufficient ionizing photons to explain the line emission. If we tryto put in a hot star with a luminosity of LH = 105.3 L� and TH
= 20 000 K, as proposed by Humphreys et al. (2017), we findunacceptable fits with χ2 = 4.4.
While we agree with Humphreys et al. (2017) on the amount ofdust, either foreground or circumstellar, needed to reproduce thestellar colours, Humphreys et al. (2017) then add AV = 2.5 of greydust to allow star 4 to be intrinsically more luminous. They arguethat the grains formed in the eruption might be large enough to beeffectively grey. Such dust cannot be identified in the SED fits, butit is constrained by the time variability of the source and the Hα
luminosity.As discussed in Section 2, we can use variability to constrain the
optical depth of any dust formed in the transient. For SN 1954J,we can do this in two ways. First, we have archival R-band imagesfrom the Large Binocular Telescope from 2008 March through 2018May (Gerke, Kochanek & Stanek 2015; Adams et al. 2017). We seeno variability at its location. To set a limit on the variability, weselected a nine-point grid with 2 arcsec offsets from the locationof SN 1954J and measured the brightness in each epoch at eachpoint over the 9 yr time span. The average slope at the site of SN1954J was 30 ± 90 counts yr−1. Taking our 1σ upper limit as theestimate, the average slope was 120 counts yr−1, which at 0.36 L�per count, corresponds to approximately 43 L� yr−1, or an upperlimit of L = 430 L� over the 10 yr baseline.
We know from the HST data and the SED fits to star 4 that theobserved R band luminosity in 2013.9 was LR = 7527 L�. TheLBT data span from 2008.5 (ta � 54 yr) to 2018.4 (tb � 64 yr), sothe change in luminosity should be
L = LReτHST [e−τHST (tHST /tb)2 − e−τHST (tHST /ta )2], (16)
where tHST � 60 yr. The observed lack of variability implies an upperlimit on the R-band optical depth of τHST < 0.16 at R-band at thetime of the HST observations. The second approach is to compareour new HST photometry to that from Humphreys et al. (2017),who present photometry updated from the initial results reported inVan Dyk et al. (2005). They report F475W and F814W magnitudesof 24.11 and 22.73 mag, respectively, as shown in Fig. 2. Thesecorrespond to changes of 0.03 and 0.10 mag, both in the sense ofthe star brightening. If we treat these as upper limits on the star
becoming brighter, equation (3) implies τF475W < 0.07 and τF814W
< 0.25 at the time of the first HST epoch near the end of 2013. Thelack of variability strongly implies that star 4 cannot be surroundedby a dusty expanding medium with any significant optical depth.
Finally, Van Dyk et al. (2005) argued that star 4 was the mostlikely survivor of SN 1954J due to its strong Hα emission. Like thelack of optical variability, the lack of Hα variability is difficult toreconcile with material ejected in 1954. Recall that Hα emissioncoming from the ionized ejecta should fall off like t−3 (equation 5).Humphreys et al. (2017) report no significant change in the Hα fluxbetween 2014.0 and 2017.1, a period over which we would expectthe Hα flux to drop by ∼ 14 per cent. More significantly, the Hα fluxfound by Humphreys et al. (2017) appears to be significantly greaterthan that reported by Van Dyk et al. (2005) at 2002.9, a period overwhich the Hα luminosity should have dropped by a factor of ∼2.Van Dyk et al. (2005) did report poor seeing conditions, which mayaccount for the difference in luminosity.
We can also use the observed Hα luminosity of LHα = 1.3 × 1036
erg s−1 (Humphreys et al. 2017) to constrain the dust optical depth.Following the arguments in Section 2, we find that the amount ofdust associated with the Hα emission can be at most
τ ≈ 0.073κ2t−1/250 v
−1/23
1/20.1 , (17)
in the low-optical depth limit and
τ ≈ 0.004κ22 t−1
50 v−13 0.1, (18)
in the high-optical depth limit. Here we set t50 = 1.26, correspondingto the optical depth in 2017. Both of these results are consistent withour upper limits on circumstellar absorption from the variability,and neither implies a high optical depth. If additional absorption isplaced outside the Hα emitting region, the limits on τ increase asL
1/2Hα (LHα) in the low- (high-) optical depth limit. However, such
dust would have to be pre-existing and not formed in the transient.Finally, in the hot binary companion with a wind scenario used by
Humphreys et al. (2017) to explain the broad asymmetric wings ofstar 4’s Hα profile with Thompson scattering, equation (15) meansthat LHα = 340 L� corresponds to a stellar luminosity of L∗ = 1600L� for a Thompson optical depth of τ T = 1 and no dust extinction.This already appears to rule out this hypothesis, as it is very difficultto see how a star could emit a fifth of its total luminosity in Hα
emission. The luminosity is also above our limits for the luminosityof a hot companion (Table 3). If we now add extinction, not onlyare the luminosity limits on a companion violated even further, butthe constraint of a constant Hα luminosity would actually force theoptical continuum flux from the companion upwards rather thandownwards, in further conflict with the data. In summary, our SEDfits, the lack of variability, and the Hα luminosity and its evolution ineither a shell or a wind scenario all suggest that star 4 has negligiblecircumstellar extinction associated with the transient or any present
MNRAS 489, 1986–1994 (2019)
Dow
nloaded from https://academ
ic.oup.com/m
nras/article-abstract/489/2/1986/5551496 by Serials Division user on 23 June 2020
1992 R. A. Patton, C. S. Kochanek and S. M. Adams
day wind. Aside from the SED fits, these constraints apply even togrey dust.
4 SN 1961V IN NGC 1058
Table 1 also includes the photometry of stars 6, 7, and 11 (see Fig. 1)near SN 1961V, where star 7 is believed to be the counterpart of SN1961V. The SEDs of the stars are shown in Fig. 3. Both the archivaland current band luminosities have been corrected for foregroundGalactic extinction. We modelled the stars with DUSTY, with theresults in Table 2 and Fig. 3. Stars 6 and 11 are well fit, but star 7is not, as might be expected given the SED. The issue appears tobe crowding in the WFC3/IR images, where stars 7 and 6 are notwell resolved. This is reflected in the DOLPHOT crowding parameterfor star 7. Crowding measures how much brighter a star would bein magnitudes for a given filter if all of the stars in the image werenot fit simultaneously. Star 7 has crowding corrections of 0.501 and0.712 mag in F110W and F160W, respectively, compared to 0.050and 0.099 mag in F475W and F814W. This likely makes the near-IRphotometry of star 7 unreliable.
Since we were unable to ‘fix’ the photometry, we first workedto obtain upper limits on the luminosity of star 7. We calculate thetotal stellar luminosity normalized to the star’s luminosity atF475Wover a grid of temperature and E(B − V). We let temperature runfrom 3500 to 25 000 K in increments of 500 K. We let the reddeningrun from E(B − V) = 0 to 1 in increments of 0.05 mag and from1 to 2 in increments of 0.1 mag. Given the total luminosity wecalculate the band luminosities for the other three filters and set χ2 =∑
i(Li/Lmod)2, keeping only the points with χ2 ≤ 12, correspondingto the model exceeding (on average) the flux in each of the otherthree filters by a factor of two. We then repeat the process, this timenormalizing to the luminosity in F160W.
Fig. 4 shows the allowed luminosities as a function of E(B −V) and fixed temperature for both the blue- and red-normalizedmodels. The progenitor had L∗ ≈ 106.4 L� (Goodrich et al. 1989),so we expect the survivor to be comparably luminous. Only thehottest stars with the highest reddening come close to reaching theprogenitor luminosity. The measured stellar luminosity and E(B −V) for stars 6 and 11 are shown for comparison. In these models,hot stars can be luminous because they need only pass through theF475W band point, while lying below all the other bands. In the red-normalized case, with the right amount of extinction, the observedSED can be matched to the extinct Rayleigh–Jeans tail of a hot star,allowing the very high total luminosities for the red-normalizedcase.
However, we trust both the F475W and F814W band luminositiesand so should have our models fit both. Unlike the IR data, thereare no flags indicating any problems, and star 7 is nicely visible andisolated in both images. If we ignore star 7’s near-IR photometry andjust model the optical photometry with DUSTY (see Fig. 3), we findmuch tighter constraints on the star’s temperature, luminosity, andforeground extinction. Table 2 shows the results. The luminosity isrequired to be nearly three orders of magnitude less than that of theprogenitor of SN 1961V.
Fig. 3 also shows the F606W data from 1994 (PI: Illingworthunder program 5446) and the F450W and F814W data from 2001(PI: Smartt under program 9042) reported in Van Dyk et al. (2002).Star 7 appears to have systematically faded by 1.7 mag in F475W.It would require an increasing optical depth of τF475W = 1.74to explain this change with dust. In F814W, there is a systematicfading of 1.4 mag, which corresponds to a change in optical depthof τF814W = 1.17. For comparison, stars 4, 6, and 9 show no
significant changes, and any changes for stars 2 and 11 (Fig. 3) arefar less significant. However, the quality of the old data is poor andthe region around SN 1961V is only barely on the detector (see figs2 and 3 in Van Dyk et al. 2002). Examining the images, we haddifficulty convincing ourselves that the fading is actually real, but itis at least clear that there is no significant brightening of the source.If we pretend that the change in magnitude is reversed and that thesource could have at most brightened by 1.7 and 1.4 mag in F475Wand F814W, we find that τF475W < 1.02 and τF814W < 0.89 basedon equation (4).
Van Dyk & Matheson (2012) argue for the existence of a survivorof SN 1961V based partially on the Hα emission. If the Hα emissioncomes from the ionized ejecta, then LHα should fall off with time,in this case, by a factor of 4.4 between the last two spectra takenof star 7. We examined the reported Hα fluxes from Goodrich et al.(1989) and Chu et al. (2004) looking for signs of variability, but wecould not identify any directly comparable estimates of the Hα flux.
Using the most recent measurement of LHα , we can still placelimits on the dust optical depth. Van Dyk & Matheson (2012) reportthat LHα for SN 1961V is 6.5 × 1036 erg s−1, implying that
τ ≈ 0.19κ2v3−1/2
1/20.1 , (19)
in the low-optical depth limit, and
τ ≈ 0.04κ22 t−1
50 v3−10.1, (20)
in the high-optical depth limit using equations (9) and (10). Wehave set t50 = 0.82 corresponding to the optical depth in 2002. Asbefore, adding additional extinction external to the Hα emissioncan weaken these limits as L
1/2Hα (LHα) for the low (high) optical
depths. However, as emphasized by Kochanek et al. (2012), addingany additional distant extinction essentially forces the event to be asupernova on energetic grounds.
We also considered the wind scenario from Humphreys et al.(2017) for SN 1961V. With LHα = 1700 L�, equation (15) impliesL∗ = 41 000 L� for τ T = 1, T∗ = 20 000 K and no dust. Reducing T∗to 7500 K to reflect the best-fitting SED model (optical bands only)gives L∗ = 810 L�, although such a star is also too cool to ionizethe wind. As discussed in Section 2 and for SN 1954J, while addingdust increases the stellar luminosity, doing so at fixed Hα flux alsomeans that the observed continuum flux of the star increases ratherthan decreases as the dust optical depth is increased, violating theobserved flux limits on the star.
5 SUMMARY
SN 1954J and SN 1961V were peculiar events, and the wealthof literature on the two over the past 60 yr is a testament to thedifficulty of classifying them. The fundamental challenge is thatthe candidate counterparts have present day optical magnitudessignificantly fainter than the progenitors. We know from Spitzerobservations that neither source can be obscured by hot dust formingin a present day wind (Kochanek et al. 2011, 2012). This leavesthree options for reconciling the fluxes if these are the survivingstars. First, the stars can become obscured by cold dust formed inthe transient. Secondly, the star can be comparably luminous buthave a much higher temperature so that bolometric corrections allowthe optical fluxes to be larger. Thirdly, the star could have becomeintrinsically fainter. We are currently unaware of any mechanismwhich would cause the surviving star to become intrinsically fainter,so the latter explanation is the least likely of the three.
Here we have used four different probes of the optical depth ofany dust formed in the transient: SED fits, photometric variability,
MNRAS 489, 1986–1994 (2019)
Dow
nloaded from https://academ
ic.oup.com/m
nras/article-abstract/489/2/1986/5551496 by Serials Division user on 23 June 2020

Late-time observations 1993
Figure 3. The measured SED of stars 6 (top left), star 11 (bottom left), and candidate counterpart star 7 (right) near SN 1961V with our current data (circles)and the archival photometry (stars and triangles) from Van Dyk et al. (2002). In the top right panel we show the best fit to the full SED, while the bottom panelshows the fit to just the optical bands. Star 7 appears to have significantly faded, but this may be an artefact (see the text).
Figure 4. Constraints on the luminosity and E(B−V) of star 7 from ourphotometry normalized at either F475W (solid) or F110W (dot–dashed).Stars 11 (magenta) and 6 (orange) are shown for comparison. E(B − V) isthe extinction in excess of the Galactic contribution.
and the Hα luminosity and its evolution. All four probes imply littledust optical depth associated with the transient for both sources, fartoo little to significantly modify the luminosity of either star. Thisincludes any significant grey opacity as invoked by Humphreys et al.(2017) in order to bring the luminosity of star 4 near SN 1954J backto its pre-transient level. While our SED fits have no sensitivity togrey dust, the time variability, and the Hα luminosity limits holdregardless of the extinction curve.
The last spectra taken of stars 4 and 7 were in 2017 and 2002,respectively. New spectra of these targets could verify any Hα
variability. By 2020, we would expect to see any Hα luminosityfrom the ionized ejecta fade by ∼13 per cent for SN 1954J and∼66 per cent for SN 1961V. While we argue that the data alreadyrule out a significant dust optical depth associated with the ejecta,there is also a problem with the required ejecta mass. For a thinshell, expanding at velocity v, the shell mass needed to produce anoptical depth of τ is
M = 4πv2t2
κτ = 1.6κ−1
2 v23 t
250τ M�, (21)
which means that both SN 1954J and SN 1961V require ejectamasses of ∼ 10 M� to have a significant amount of absorption
MNRAS 489, 1986–1994 (2019)
Dow
nloaded from https://academ
ic.oup.com/m
nras/article-abstract/489/2/1986/5551496 by Serials Division user on 23 June 2020

1994 R. A. Patton, C. S. Kochanek and S. M. Adams
(τ � 3). This is not impossible, as it roughly matches estimates forη Carinae (e.g. Morris et al. 1999). Note, however, that the massimplied by the Hα luminosity (equation 6) is just 0.2v
3/23
1/20.1 M� for
both SN 1954J and SN 1961V. As time passes, all these variabilityarguments become stronger since they have a minimum scaling thatis quadratic in time. As noted earlier, fragmentation of the ejectaonly accelerates the evolution. JWST observations at ∼20 μm wouldalso end any further speculation about dust.
Our DUSTY models favour relatively low temperatures of 5000–7000 K for both stars, so at least the observed stars cannot use a hottemperature to conceal a luminosity comparable to the progenitor.There is some room to have a hot companion, although not one asluminous as the progenitor. Particularly for very hot stars (Wolf–Rayet) stars, it is also important to remember that stellar atmospheremodels greatly underestimate the optical luminosities because theydo not include reprocessing of the UV radiation by the stellar windinto optical emission and emission lines (see e.g. Groh et al. 2013).It is marginally possible to have the hot companion suggested byHumphreys et al. (2017) for SN 1954J. HST observations at shorterwavelengths would easily constrain these possibilities.
The Hα emission lines still seem a relatively compelling reasonfor the association of these stars with the transients. However, in thecase of SN 1954J, Humphreys et al. (2017) argue against the Hα
emission arising from ejecta produced in the transient. They insteadrequire a hot companion star with a dense stellar wind (see section4.4 of their paper). The apparent lack of evolution, at least in the caseof SN 1954J, and the lack of any obvious source of ionizing photonssuggests that the line emitting material may not be associated withthe observed transients. Instead, it could be material ejected in someearlier event that was then photoionized in 1954 or 1961. By placingthe material further away, the evolution is slowed and it is easierto have long recombination times. For example, a solar mass ofmaterial at R ∼ 1/3 pc in a thin shell ( = 0.1) can produce roughlyLHα � 1036 erg s−1 with a recombination time of about 200 yr.At 1000 km s−1, the shell would have been ejected nearly 300 yrago. Shells, on smaller scales, quickly require a source of ionizingphotons because the recombination times become shorter. We alsofound that the wind scenario considered by Humphreys et al. (2017)also requires the present day stars to be much less luminous thanthe progenitors, independent of the dust properties.
This appears to leave only the options of survivors that areintrinsically less luminous than their progenitors, or that thesestars are not the survivors. While we have not explicitly carriedout the full calculations, it seems clear that we would reach thesame conclusions for any of the historical progenitor candidates.Continued monitoring of both the broad-band fluxes and theemission lines should steadily strengthen these conclusions.
ACKNOWLEDGEMENTS
RAP would like to thank B. Shappee for his guidance in settingup the photometry and K.Z. Stanek for confirming the infraredcontamination of star 7. CSK is supported by National ScienceFoundation (NSF) Grants AST-1515876, AST-1515927, and AST-1814440. This work is based in part on observations made withthe NASA/ESA Hubble Space Telescope under program HST-GO-13477, and obtained from the Hubble Legacy Archive, whichis a collaboration between the Space Telescope Science Institute(STScI/VASA), the Space Telescope European Coordinating Fa-cility (ST-ECF/ESA), and the Canadian Astronomy Data Centre(CADC/NRC/CSA). This work is based in part on observations
made with the Large Binocular Telescope (LBT). The LBT isan international collaboration among institutions in the UnitedStates, Italy, and Germany. The LBT Corporation partners are theUniversity of Arizona on behalf of the Arizona university system,;the Istituto Nazionale di Astrofisica, Italy; the LBT Beteiligungs-gesellschaft, Germany, representing the Max Planck Society, theAstrophysical Institute Potsdam, and Heidelberg University; theOhio State University; and the Research Corporation, on behalfof the University of Notre Dame, University of Minnesota, andUniversity of Virginia.
REFERENCES
Adams S. M., Kochanek C. S., 2015, MNRAS, 452, 2195Adams S. M., Kochanek C. S., Gerke J. R., Stanek K. Z., 2017, MNRAS,
469, 1445Boroson T., 1981, ApJS, 46, 177Branch D., Cowan J. J., 1985, ApJ, 297, L33Branch D., Greenstein J. L., 1971, ApJ, 167, 89Cardelli J. A., Clayton G. C., Mathis J. S., 1989, ApJ, 345, 245Castelli F., Kurucz R. L., 2003, preprint (arXiv:0405087)Chu Y.-H., Gruendl R. A., Stockdale C. J., Rupen M. P., Cowan J. J., Teare
S. W., 2004, AJ, 127, 2850Cowan J. J., Henry R. B. C., Branch D., 1988, ApJ, 329, 116Dolphin A., 2016, Astrophysics Source Code Library. record ascl:1608.013Draine B. T., 1995, Ap&SS, 233, 111Elitzur M., Ivezic Z., 2001, MNRAS, 327, 403Filippenko A. V., 1997, ARA&A, 35, 309Filippenko A. V., Barth A. J., Bower G. C., Ho L. C., Stringfellow G. S.,
Goodrich R. W., Porter A. C., 1995, AJ, 110, 2261Freedman W. L., Madore B. F., 1988, ApJ, 332, L63Gerke J. R., Kochanek C. S., Stanek K. Z., 2015, MNRAS, 450, 3289Goodrich R. W., Stringfellow G. S., Penrod G. D., Filippenko A. V., 1989,
ApJ, 342, 908Groh J. H., Meynet G., Georgy C., Ekstrom S., 2013, A&A, 558, 24Humphreys R. M., Davidson K., 1994, PASP, 106, 1025Humphreys R. M., Davidson K., Smith N., 1999, PASP, 111, 1124Humphreys R. M., Davidson K., Van Dyk S. D., Gordon M. S., 2017, ApJ,
848, 86Ivezic Z., Elitzur M., 1997, MNRAS, 287, 799Ivezic Z., Nenkova M., Elitzur M., 1999, Astrophysics Source Code Library,
record ascl:9911.001Klemola A. R., 1986, PASP, 98, 464Kochanek C. S., Szczygiel D. M., Stanek K. Z., 2011, ApJ, 737, 76Kochanek C. S., Szczygiel D. M., Stanek K. Z., 2012, ApJ, 758, 131Morris P. W. et al., 1999, Nature, 402, 502Schlegel D. J., Finkbeiner D. P., Davis M., 1998, ApJ, 500, 525Schlegel E. M., 1990, MNRAS, 244, 269Smith N., Humphreys R. M., Gehrz R. D., 2001, PASP, 113, 692Smith N., Li W., Silverman J. M., Ganeshalingam M., Filippenko A. V.,
2011, MNRAS, 415, 773Speck A. K., Barlow M. J., Sylvester R. J., Hofmeister A. M., 2000, A&AS,
146, 437Stockdale C. J., Rupen M. P., Cowan J. J., Chu Y.-H., Jones S. S., 2001, AJ,
122, 283Tammann G. A., Sandage A., 1968, ApJ, 151, 825Van Dyk S. D., Filippenko A. V., Chornock R., Li W., Challis P. M., 2005,
PASP, 117, 553Van Dyk S. D., Matheson T., 2012, ApJ, 746, 179Van Dyk S. D., Filippenko A. V., Li W., 2002, PASP, 114, 700Zwicky F., 1964, ApJ, 139, 514
This paper has been typeset from a TEX/LATEX file prepared by the author.
MNRAS 489, 1986–1994 (2019)
Dow
nloaded from https://academ
ic.oup.com/m
nras/article-abstract/489/2/1986/5551496 by Serials Division user on 23 June 2020


![Progenitor constraints on the Type Ia supernova SN 2014J ... · Progenitor constraints on the Type Ia supernova SN 2014J from Hubble Space Telescope H and [OIII] observations Or Graur1;2?yand](https://static.fdocuments.in/doc/165x107/5e17dfd6f1c2460c5945b5d7/progenitor-constraints-on-the-type-ia-supernova-sn-2014j-progenitor-constraints.jpg)