Deep-Focus Repeating Earthquakes in the Tonga Fiji...
21
Deep-Focus Repeating Earthquakes in the Tonga–Fiji Subduction Zone by Wen-che Yu and Lianxing Wen * Abstract Deep-focus earthquakes in the Tonga–Fiji subduction zone make up greater than 66% of the globally recorded deep seismicity. The high number of deep-focus seismicity in this active subduction zone allows us to search for deep-focus similar earthquake pairs and repeating earthquakes. We compile a waveform dataset for deep earthquakes with magnitude above 4.7 occurring in the Tonga–Fiji–Kermadec subduction zone recorded teleseismically between 1990 and 2009. We identify 8 si- milar clusters and 18 similar doublets with an average cross-correlation coefficient greater than 0.8 among more than 45,000 potential earthquake pairs. These similar doublets and clusters are located in the central part of the Tonga–Fiji slab at the depth range of 480–650 km. A master event relocation algorithm is used to determine the precise relative location and depth among these similar earthquake pairs. We estimate and superpose circular fault areas for these similar clusters and doublets and find that one similar doublet appears to be a deep repeating earthquake pair. This deep doublet has a small separation less than 0.4 km and overlapping rupture areas, indicating that the same fault appears to slip. Other deep similar earthquake pairs are spatially offset or do not exhibit overlapping rupture areas. Time separation is on the order of years for the majority of similar earthquake pairs. Thermal (plastic) shear instability is more likely to explain these deep repeating earthquakes and similar earthquake pairs. Introduction Earthquakes occurring below 60 km depth are confined to the inclined planar regions of the subducting slab termed Wadati–Benioff zones. Intermediate-focus (depth range of 60–300 km) and deep-focus (depth range of 300–660 km) earthquakes are unexpected, because the slab should have already passed through the brittle-ductile transition. As pres- sure and temperature increase with depth, high normal stres- ses should inhibit fracture and frictional sliding and the material should deform by ductile flow. Models proposed to explain the physical mechanisms of intermediate- and deep-focus earthquakes include dehydration embrittlement (Meade and Jeanloz, 1991; Jung et al., 2004; Zhang et al., 2004), thermal and plastic shear instability (Ogawa, 1987; Hobbs and Ord, 1988; Kanamori et al., 1998; Karato et al., 2001; Weidner et al., 2001; Wiens and Snider, 2001), and shear instability induced by phase transformational faulting (Green and Burnley, 1989; Green et al., 1990; Kirby et al., 1996). Recent deformation experiments applicable to intermediate depths showed that dehydration of antigorite serpentinite produces faults delineated by superplastic, very fine-grained aggregates (Jung et al., 2004). Others have pro- posed that intermediate and deep earthquakes occur due to activation of thermal shear instability that lowers viscosity and promotes a positive feedback process in which further slip and heat are generated (Ogawa, 1987; Kanamori et al., 1998; Karato et al., 2001; Wiens and Snider, 2001). The plastic shear instability model differs from the thermal shear instability model in that the interplay between strain rate hardening (softening) and stress relaxation can account for the occurrence of earthquakes in the transition zone and ces- sation of seismicity in the lower mantle (Hobbs and Ord, 1988; Weidner et al., 2001; Wiens, 2001). To explain deep earthquakes, the phase transformational faulting model pre- dicts that superplastic, very fine-grained anticracks are formed at a narrow pressure range of 1–2 GPa and a temperature in- terval of 1100°–1200° K during the phase transition from metastable olivine to a spinel structure. The propagation and linking-up of spinel-filled anticracks can account for the double-couple component of deep earthquakes (Green and Burnley, 1989). The phase transformational faulting model implies formation of new faults and predicts no deep repeating earthquakes. The thermal (plastic) shear instability model bears no assumption on the formation of faults and more likely accounts for the occurrence of deep repeating earthquakes. Subduction zone seismicity is characterized by a bimo- dal depth distribution: a high level of seismicity in the upper- most 60 km, followed by an exponential decrease below 60 km down to 400 km depth, with another increase occurring in the transition zone (in the depth range of 410–660 km), *Also at School of Earth and Space Sciences, University of Science and Technology of China, Hefei, Anhui 230026, China. 1829 Bulletin of the Seismological Society of America, Vol. 102, No. 4, pp. 1829–1849, August 2012, doi: 10.1785/0120110272
Transcript of Deep-Focus Repeating Earthquakes in the Tonga Fiji...

Deep-Focus Repeating Earthquakes in the Tonga–Fiji Subduction Zone
by Wen-che Yu and Lianxing Wen*
Abstract Deep-focus earthquakes in the Tonga–Fiji subduction zone make upgreater than 66% of the globally recorded deep seismicity. The high number ofdeep-focus seismicity in this active subduction zone allows us to search for deep-focussimilar earthquake pairs and repeating earthquakes. We compile a waveform datasetfor deep earthquakes with magnitude above 4.7 occurring in the Tonga–Fiji–Kermadecsubduction zone recorded teleseismically between 1990 and 2009. We identify 8 si-milar clusters and 18 similar doublets with an average cross-correlation coefficientgreater than 0.8 among more than 45,000 potential earthquake pairs. These similardoublets and clusters are located in the central part of the Tonga–Fiji slab at the depthrange of 480–650 km. A master event relocation algorithm is used to determine theprecise relative location and depth among these similar earthquake pairs. We estimateand superpose circular fault areas for these similar clusters and doublets and find thatone similar doublet appears to be a deep repeating earthquake pair. This deep doublethas a small separation less than 0.4 km and overlapping rupture areas, indicating thatthe same fault appears to slip. Other deep similar earthquake pairs are spatially offset ordo not exhibit overlapping rupture areas. Time separation is on the order of years forthe majority of similar earthquake pairs. Thermal (plastic) shear instability is morelikely to explain these deep repeating earthquakes and similar earthquake pairs.
Introduction
Earthquakes occurring below 60 km depth are confinedto the inclined planar regions of the subducting slab termedWadati–Benioff zones. Intermediate-focus (depth range of60–300 km) and deep-focus (depth range of 300–660 km)earthquakes are unexpected, because the slab should havealready passed through the brittle-ductile transition. As pres-sure and temperature increase with depth, high normal stres-ses should inhibit fracture and frictional sliding and thematerial should deform by ductile flow. Models proposedto explain the physical mechanisms of intermediate- anddeep-focus earthquakes include dehydration embrittlement(Meade and Jeanloz, 1991; Jung et al., 2004; Zhang et al.,2004), thermal and plastic shear instability (Ogawa, 1987;Hobbs and Ord, 1988; Kanamori et al., 1998; Karato et al.,2001; Weidner et al., 2001; Wiens and Snider, 2001), andshear instability induced by phase transformational faulting(Green and Burnley, 1989; Green et al., 1990; Kirby et al.,1996). Recent deformation experiments applicable tointermediate depths showed that dehydration of antigoriteserpentinite produces faults delineated by superplastic, veryfine-grained aggregates (Jung et al., 2004). Others have pro-posed that intermediate and deep earthquakes occur due toactivation of thermal shear instability that lowers viscosity
and promotes a positive feedback process in which furtherslip and heat are generated (Ogawa, 1987; Kanamori et al.,1998; Karato et al., 2001; Wiens and Snider, 2001). Theplastic shear instability model differs from the thermal shearinstability model in that the interplay between strain ratehardening (softening) and stress relaxation can account forthe occurrence of earthquakes in the transition zone and ces-sation of seismicity in the lower mantle (Hobbs and Ord,1988; Weidner et al., 2001; Wiens, 2001). To explain deepearthquakes, the phase transformational faulting model pre-dicts that superplastic, very fine-grained anticracks are formedat a narrow pressure range of 1–2 GPa and a temperature in-terval of 1100°–1200° K during the phase transition frommetastable olivine to a spinel structure. The propagationand linking-up of spinel-filled anticracks can account for thedouble-couple component of deep earthquakes (Green andBurnley, 1989). The phase transformational faulting modelimplies formation of new faults and predicts no deep repeatingearthquakes. The thermal (plastic) shear instability modelbears no assumption on the formation of faults andmore likelyaccounts for the occurrence of deep repeating earthquakes.
Subduction zone seismicity is characterized by a bimo-dal depth distribution: a high level of seismicity in the upper-most 60 km, followed by an exponential decrease below60 km down to 400 km depth, with another increase occurringin the transition zone (in the depth range of 410–660 km),
*Also at School of Earth and Space Sciences, University of Science andTechnology of China, Hefei, Anhui 230026, China.
1829
Bulletin of the Seismological Society of America, Vol. 102, No. 4, pp. 1829–1849, August 2012, doi: 10.1785/0120110272

and abrupt cessation in the lower mantle (Frohlich, 1989).Hypocentral locations refine the morphology of the down-going slab (Hasegawa et al., 1978;Kawakatsu, 1985; Engdahlet al., 1998; Chen and Brudzinski, 2001; Frohlich, 2006), andfocalmechanisms constrain the state of stress and strain rate inthe slab (Isacks and Molnar, 1969, 1971; Giardini and Wood-house, 1984; Kawakatsu, 1985; Giardini and Woodhouse,1986; Holt, 1995; Christova and Scholz, 2003). The large1994 Tonga deep earthquake (Mw 7.6, 564 km depth) andthe 1994 Bolivia deep earthquake (Mw 8.3, 636 km depth)provide a cornerstone for our understanding of source pro-cesses and mechanisms of deep earthquakes. The rupturedimensions of these large deep earthquakes can be inferredfrom the spatial extent of early aftershocks (Wiens et al.,1994; Myers et al., 1995; Wiens and McGuire, 2000) andwaveform directivity (Kikuchi and Kanamori, 1994; Becket al., 1995; Chen, 1995; Silver et al., 1995; Chen et al.,1996;McGuire et al., 1997). The 1994Tonga deep earthquakehad an extensive aftershock sequence comparedwith previouslarge deep earthquakes (Frohlich, 1987; Willemann andFrohlich, 1987; Wiens et al., 1994). The moment release ofthe 1994 Tonga deep earthquake was mainly along a near-vertical nodal plane (Wiens et al., 1994). The 1994 Boliviadeep earthquake was characterized by at least four subevents,significant moment release along a near-horizontal nodalplane, and relatively low aftershock activities. Moreover,the slow rupture velocity, high stress drop, and low seismicefficiency of the Bolivia event suggested that frictionalmelting likely promoted fault slip (Kanamori et al., 1998).Seismological properties and physical models of intermediateand deep earthquakes are discussed in detail in several reviewpapers (Frohlich, 1989; Green and Houston, 1995; Kirbyet al., 1996; Karato et al., 2001; Wiens, 2001; Houston,2007) and the book Deep Earthquakes (Frohlich, 2006).
Seismically inferred source parameters can be used toassess the physical models of deep earthquakes. Rupturedimensions of large deep earthquakes have been shown tobe wider than the estimated dimensions of the metastableolivine wedge, essential for the initiation of phase transfor-mational faulting (Wiens et al., 1994; Beck et al., 1995;Chen, 1995; Silver et al., 1995; McGuire et al., 1997). Thisindicates that transformational faulting may initiate ruptureinside the metastable olivine wedge, but thermal (plastic)shear instability is likely responsible for the continuationof rupture in the spinel regime. Identifying nodal planes forlarge intermediate and deep earthquakes can address whetherintermediate and deep earthquakes are reactivated from thepreexisting weak zones (Jiao et al., 2000; Warren and Silver,2006; Warren et al., 2007; Warren et al., 2008). Identificationof nodal planes reveals that intermediate earthquakes exhibitsubhorizontal fault planes and oceanward rupture propaga-tion, orientations that are inconsistent with the preexistingsubvertical normal fault planes created in the outer-rise aftercorrection of the subduction angle. This inconsistency sug-gests that new faults are created at intermediate depth(Warren et al., 2007; Warren et al., 2008). For deep earth-
quakes occurring in the depth range of 300–600 km, the no-dal planes are either subvertical or subhorizontal, indicatingboth reactivation of the preexisting weak zones and creationof new faults. Deep earthquakes occurring close to the bot-tom of the transition zone exhibit subhorizontal nodal planesthat may indicate formation of new faults and support thetransformational faulting model (Warren et al., 2007). In ad-dition, the discovery of deep repeating earthquakes would beincompatible with the transformational faulting model(Wiens and Snider, 2001).
The Tonga–Fiji subduction zone is characterized by thehighest intensity of moderate size (body-wave magnitude,mb 4–6) deep-focus earthquakes among the circum-Pacificsubduction zones. The rapid convergence rate between thePacific plate and Australian plate (∼24 cm=year) resultingfrom the rapid back arc extension of the Lau Basin can ac-count for the highest level of deep seismicity (Bevis et al.,1995). Previous seismic studies reported deep repeatingearthquakes and similar earthquake pairs using a temporaryseismic experiment deployed in the southwest Pacific be-tween 1993 and 1995 (Wiens et al., 1994; Wiens et al., 1997;Wiens and Snider, 2001). In this study, we search for similardeep earthquake pairs occurring along the Tonga–Fiji–Kermadec subduction zone recorded by the Global Seismo-graphic Network (GSN) from 1990 to 2009. A master eventrelocationalgorithm is applied todetermine theprecise relativelocation and depth between similar earthquake pairs. We thenestimate the rupture areas of earthquakes by assuming aBrunesource model. This allows us to address whether the earth-quakes have overlaying rupture areas and identify possibledeep repeating earthquakes. The physical models of deepearthquakes are discussed in the context of repeating earth-quakes and similar earthquake pairs. The term “repeatingearthquakes” is hereafter defined as events where the faultareas overlie one another, whereas the term “similar earth-quake pairs” describes events whose waveforms are highlycorrelated but do not have overlapping rupture zones. Wewilldemonstrate that deep similar earthquake pairs are not neces-sarily equivalent to deep repeating earthquakes.
Searching for Deep-Focus Similar Earthquake Pairsalong the Tonga–Fiji–Kermadec Subduction Zone
Spatial separation and waveform cross-correlation (cc)coefficient are used as the initial and secondary constraintsto screen the potential earthquake pairs. We first divide deepevents withmb above 4.7 in the PDE catalog into a 0:5° × 0:5°grid in the Tonga–Fiji–Kermadec regions (178° E–166° Wand 10° S–48° S). We compute spatial separation betweenany two events within a grid element and in the neighboringgrid elements. Events separated by less than 60 km areconsidered as potential event pairs. There are 2168 deepevents with mb above 4.7 in our database between 1990and 2009; more than 45,000 potential pairs satisfy the initialspatial separation constraint. We collect seismic waveformsfor each event recorded by the GSN and regional seismic
1830 W. Yu and L. Wen

networks (see Data and Resources). We band-pass filter the Pand PKP waveforms in a 30-s time window in the frequencyrange of 0.8–2 Hz and calculate the cross-correlation (cc)coefficient for all 45,000 potential pairs. More than 6 million
times of waveform cc are computed to search for deep similarearthquake pairs. We find 8 similar clusters (consisting ofmultiple events) and 18 similar doublets with an average cccoefficient above 0.8 in the central part of the Tonga–Fiji slab
300km
400km
500km
600km
700km
Fiji
Tonga
LauBasin
200 km
Fiji
Tonga
LauBasin
200 km
2002/08/22 (C4)
2006/09/07 (C4)
1994/07/30 (C8)
2005/07/20 (C2)
2000/12/29 (C7)
2003/09/30 (C7)
2006/02/01 (C7,D13)
1996/10/07 (D13)
1994/09/30 (C5)
2000/12/18 (C5)
2000/12/25 (C5)
2001/10/22 (D10)
2004/11/18 (D10)2002/08/25 (D7)
2005/04/04 (D7)
1994/07/02 (D9)
1997/11/29 (D9)
1994/11/04 (D11)
2009/03/20 (D11)
1995/06/16 (D4)
1999/07/21 (D4)
1999/04/24 (C1)
1991/10/14 (C1)
1999/07/09 (D5)
2001/07/11 (D5)
2000/03/16 (D2)
2002/01/09 (D17)2003/11/20 (D17)
2002/02/11 (C2)
2009/06/07 (C6)
2008/12/18 (D16)
178° 180° -178° -176°-26°
-24°
-22°
-20°
-18°
-16°
C3
D12
D1D3
D6
D8
D14
D15
D18
175° 180° -175° -170°
-35°
-30°
-25°
-20°
-15°
-10°
Tong
atre
nch
Ker
mad
ectre
nch
Tong
atre
nch
Ker
mad
ectre
nch
Figure 1. Regional map of deep-focus similar earthquake pairs and seismicity near the Tonga–Fiji subduction zone. Deep similar earth-quake pairs (black stars) and their available Global Centroid Moment Tensor (CMT) (Dziewonski et al., 1981; Ekstrom et al., 2003) arelabeled with event date and doublet/cluster ID where applicable. Source parameters of the doublets/clusters are listed in Tables 1, 2. Back-ground deep seismicity is shown as gray dots. Black lines indicate the slab contours below 300 km depth (Gudmundsson andSambridge, 1998), with an interval of 100 km. Regional map of the Tonga–Fiji–Kermadec subduction zone is shown in the inset, withgray dotted box indicating the region blow-up in the main figure. Black lines are the slab contours below 300 km depth and the Tonga–Kermadec trench (Bird, 2003). The color version of this figure is available only in the electronic edition.
Deep-Focus Repeating Earthquakes in the Tonga–Fiji Subduction Zone 1831

Table1
Deep-Fo
cusSimilarDoubletsin
theTo
nga–FijiSlab*
OriginDate
(yyyy/mm/dd)
OriginTim
e(hh:mm:ss.ss)
Latitu
de(°N)
Longitude
(°E)
Depth
(km)
mb†
dt(yr)‡
cc§
Nph
rms∥
(ms)
dhc#
(km)
dzc#
(km)
dhr#
(km)
dzr#
(km)
ellp
maj**
(km)
ellp
min**
(km)
TD-D
1 1994/11/30
06:37:14.80
−18.001
−178.374
565.0
5.2
–1.00
––
––
––
––
1996/01/08
13:40:59.24
−18.012
−178.386
567.2
4.8
1.1
0.80
1896
13.36
32.00
1.76
2.20
14.09
6.55
TD-D
2 2000/03/16
01:42:36.44
−17.887
−178.676
630.0
4.9
–1.00
––
––
––
––
2007/05/23
15:59:27.16
−17.891
−178.680
627.4
4.8
7.2
0.88
7213
27.78
−57.00
0.61
−2.60
2.33
1.33
TD-D
3 1997/12/13
04:39:06.50
−18.090
−178.178
582.0
5.3
–1.00
––
––
––
––
2002/04/10
07:11:03.79
−18.051
−178.204
599.0
4.7
4.3
0.82
3224
9.96
18.00
5.13
17.00
4.45
3.50
TD-D
4 1995/06/16
13:49:49.30
−18.269
−178.010
566.0
5.6
–1.00
––
––
––
––
1999/07/21
03:10:44.46
−18.193
−177.871
560.0
5.4
4.1
0.86
7189
10.79
−6.00
16.94
−6.00
4.20
2.67
TD-D
5 1999/07/09
18:16:20.93
−20.095
−178.160
567.0
5.0
–1.00
––
––
––
––
2001/07/11
15:11:49.79
−20.154
−178.115
553.5
5.0
2.0
0.83
7522
20.44
−5.00
8.07
−13.50
1.42
0.77
TD-D
6 1994/09/02
17:46:16.80
−20.349
−178.028
539.0
5.0
–1.00
––
––
––
––
1995/10/31
06:20:39.76
−20.316
−178.032
541.6
4.8
1.2
0.83
199
32.73
58.00
3.69
2.60
14.96
7.23
TD-D
7 2002/08/25
04:42:11.56
−20.543
−178.409
554.0
5.4
–1.00
––
––
––
––
2005/04/04
08:16:21.93
−20.510
−178.415
558.8
5.2
2.6
0.89
105
1210.37
−12.00
3.72
4.80
2.57
1.22
TD-D
8 2004/07/10
16:16:32.94
−20.913
−178.722
584.0
4.7
–1.00
––
––
––
––
2005/04/22
11:25:46.31
−20.955
−178.814
592.5
4.7
0.8
0.80
5924
17.47
5.00
10.63
8.50
1.48
0.43
TD-D
9 1994/07/02
05:46:54.10
−21.071
−178.695
567.0
5.3
–1.00
––
––
––
––
1997/11/29
02:42:27.34
−21.013
−178.729
584.0
5.2
3.4
0.87
4425
8.52
14.00
7.35
17.00
7.09
6.26
TD-D
10 2001/10/22
06:46:48.07
−20.908
−179.125
622.0
5.5
–1.00
––
––
––
––
2004/11/18
12:27:08.86
−20.928
−179.125
618.2
5.2
3.1
0.83
9315
17.80
3.00
2.22
−3.80
1.53
1.11
TD-D
11 1994/11/04
08:27:30.60
−21.473
−179.341
616.0
5.3
–1.00
––
––
––
––
2009/03/20
12:26:03.66
−21.470
−179.342
616.2
5.0
14.4
0.88
6019
4.29
6.30
0.35
0.20
1.67
1.00
(contin
ued)
1832 W. Yu and L. Wen

Table1(Con
tinued)
OriginDate
(yyyy/mm/dd)
OriginTim
e(hh:mm:ss.ss)
Latitu
de(°N)
Longitude
(°E)
Depth
(km)
mb†
dt(yr)‡
cc§
Nph
rms∥
(ms)
dhc#
(km)
dzc#
(km)
dhr#
(km)
dzr#
(km)
ellp
maj**
(km)
ellp
min**
(km)
TD-D
12 1996/07/12
13:31:10.00
−22.030
−179.520
573.0
4.8
–1.00
––
––
––
––
2003/08/20
23:54:02.01
−22.028
−179.515
572.2
4.8
7.1
0.90
2322
16.10
18.00
0.56
−0.80
2.33
2.00
TD-D
13 1996/10/07
09:23:56.90
−22.113
−179.577
606.0
5.2
–1.00
––
––
––
––
2006/02/01
18:28:50.80
−22.195
−179.621
587.5
5.2
9.3
0.85
6719
11.45
−7.00
10.18
−18.50
6.76
3.34
TD-D
14 1998/01/24
17:57:54.60
−22.173
−179.628
600.0
4.7
–1.00
––
––
––
––
2003/03/15
07:03:04.72
−22.191
−179.640
599.8
4.7
5.1
0.80
2417
14.60
−5.00
2.35
−0.20
4.51
2.06
TD-D
15 1996/11/10
06:26:21.71
−23.212
179.925
600.0
5.1
–1.00
––
––
––
––
1997/05/21
09:29:53.92
−23.192
179.932
604.0
4.9
0.5
0.82
1419
13.47
−50.00
2.34
4.00
2.23
1.18
TD-D
16 2008/12/18
20:57:39.00
−23.495
−179.996
542.6
5.3
–1.00
––
––
––
––
2004/05/22
14:33:52.19
−23.611
−180.077
538.4
5.0
−4.6
0.80
2022
3.78
−15.60
15.31
−4.20
1.27
0.38
TD-D
17 2002/01/09
01:03:38.58
−24.338
−179.743
489.0
5.2
–1.00
––
––
––
––
2003/11/20
02:01:24.40
−24.332
−179.749
485.0
5.4
1.9
0.86
7120
4.51
− 9.00
0.90
−4.00
1.70
1.18
TD-D
18 2004/11/06
07:04:38.48
−24.347
−179.785
497.0
4.7
–1.00
––
––
––
––
2009/10/31
10:38:12.11
−24.327
−179.804
493.8
4.9
5.0
0.80
3256
6.02
2.50
2.94
−3.20
1.51
1.16
*The
firstevent
foreach
doubletrefersto
themaster(reference)eventw
ithorigin
timefixedto
thatof
thePD
Ecatalog.
Event
origin
timeof
thesecond
eventiscorrectedfortheorigin
timeerrorbetweenthe
doublet,inferred
from
themastereventrelocatio
n.† m
bis
body-w
avemagnitude.
‡ dtis
thetim
eseparatio
nbetweenthemasterandsecond
events
inyears(yr).
§ ccis
theaveragecross-correlationcoefficientcalculated
bythenumberof
seismic
phases
(Nph)used
forthemastereventrelocatio
n.∥rm
sistheroot-m
ean-square
timeresidual
betweenthedoubletpredictedbasedon
theoptim
umlocatio
nanddepthof
thesecond
eventrelativ
eto
themastereventin
theunitof
millisecond(m
s).
#dh
canddz
ccorrespond
tohorizontalandverticalseparatio
nbetweenthedoubletb
ased
onthePD
Ecatalog,
respectiv
ely;
dhranddz
rindicatehorizontalandverticalseparatio
nbetweenthedoubletafter
the
mastereventrelocatio
n,respectiv
ely.
**ellp
majandellp
minarethemajor
andminor
axes
ofthe95%
confidence
ellip
se,respectiv
ely.
Deep-Focus Repeating Earthquakes in the Tonga–Fiji Subduction Zone 1833

Table2
Deep-Fo
cusSimilarClustersin
theTo
nga–FijiSlab*
OriginDate
(yyyy/mm/dd)
OriginTim
e(hh:mm:ss.ss)
Latitu
de(°N)
Longitude
(°E)
Depth
(km)
mb
dt(yr)
ccN
ph
rms
(ms)
dhc
(km)
dzc
(km)
dhr
(km)
dzr
(km)
ellp
maj
(km)
ellp
min
(km)
TD-C1 1999/04/24
08:45:16.88
−18.043
−178.449
567.0
5.2
–1.00
––
––
––
––
1991/10/14
14:35:57.81
−18.072
−178.478
568.8
5.3
−7.5
0.82
16108
5.66
16.00
4.45
1.80
25.87
11.02
1995/10/01
16:38:37.74
−18.011
−178.470
564.4
4.8
−3.6
0.83
2435
16.16
20.00
4.19
−2.60
3.34
1.67
1997/02/13
12:12:34.28
−18.064
−178.370
568.2
4.7
−2.2
0.78
3633
8.53
17.00
8.67
1.20
4.06
2.67
TD-C2 1999/02/15
09:41:52.90
−18.065
−178.530
624.0
4.7
–1.00
––
––
––
––
1994/11/09
14:41:39.03
−18.040
−178.536
632.4
4.9
−4.3
0.86
298
11.84
−34.00
2.85
8.40
9.77
2.33
2000/04/01
12:14:57.67
−18.016
−178.594
621.0
4.8
1.1
0.86
4019
28.55
15.00
8.69
−3.00
4.45
3.34
2002/02/11
03:39:32.46
−18.079
−178.532
627.2
4.9
3.0
0.89
3915
4.60
−33.00
1.57
3.20
5.78
2.56
2005/07/20
04:48:11.44
−18.037
−178.549
623.7
4.9
6.4
0.91
449
7.39
−40.00
3.70
−0.30
7.78
1.66
TD-C3 1999/10/05
14:40:22.40
−21.084
−179.173
600.0
4.8
–1.00
––
––
––
––
2002/06/29
11:14:01.66
−21.075
−179.156
602.8
4.9
2.7
0.81
5021
12.41
38.00
2.03
2.80
0.91
0.47
2007/11/21
06:48:32.01
−21.085
−179.190
599.1
4.9
8.1
0.82
3417
6.17
7.00
1.77
−0.90
2.67
1.67
TD-C4 1997/04/10
10:43:01.90
−21.168
−179.227
624.0
4.8
–1.00
––
––
––
––
2001/06/18
14:50:56.39
−21.138
−179.245
633.5
4.8
4.2
0.83
910
11.88
−24.00
3.82
9.50
13.37
4.24
2002/08/22
23:58:09.58
−21.102
−179.115
617.2
5.2
5.4
0.85
1018
15.57
−6.00
13.74
−6.80
33.35
16.32
2006/09/07
21:23:00.12
−21.075
−179.203
617.5
5.0
9.4
0.82
1519
16.93
−25.00
10.64
−6.50
2.51
1.20
2007/12/02
15:57:40.78
−21.187
−179.236
623.4
4.8
10.6
0.85
1222
18.18
−22.00
2.31
−0.60
3.79
1.78
TD-C5 1994/09/30
19:30:18.40
−21.217
−179.293
643.0
5.3
–1.00
––
––
––
––
2000/12/18
01:19:20.14
−21.170
−179.159
642.2
6.4
6.2
0.88
6346
18.18
−15.00
14.84
−0.80
4.53
2.20
2000/12/25
05:11:57.99
−21.183
−179.199
648.8
5.3
6.2
0.86
6280
18.17
1.00
10.45
5.80
4.03
3.79
2006/03/03
12:54:18.21
−21.162
−179.172
649.0
4.8
11.4
0.84
4657
30.08
−15.00
13.96
6.00
15.51
7.02
TD-C5-00a-00b
2000/12/18
01:19:21.65
−21.178
−179.124
628.0
6.4
–1.00
––
––
––
––
2000/12/25
05:12:00.21
−21.195
−179.152
627.1
5.3
0.0
0.91
185
138.90
16.00
3.46
−0.90
2.00
0.78
TD-C6 2009/06/07
12:46:30.00
−22.037
−179.583
590.0
5.1
–1.00
––
––
––
––
2004/01/13
09:40:33.47
−22.059
−179.585
591.6
5.0
−5.4
0.82
7451
4.68
19.00
2.46
1.60
3.67
2.45
2008/01/15
18:00:54.02
−22.036
−179.584
587.4
5.2
−1.4
0.81
8839
12.18
−17.20
0.15
−2.60
3.34
2.00
(contin
ued)
1834 W. Yu and L. Wen

Table2(Con
tinued)
OriginDate
(yyyy/mm/dd)
OriginTim
e(hh:mm:ss.ss)
Latitu
de(°N)
Longitude
(°E)
Depth
(km)
mb
dt(yr)
ccN
ph
rms
(ms)
dhc
(km)
dzc
(km)
dhr
(km)
dzr
(km)
ellp
maj
(km)
ellp
min
(km)
TD-C7 2000/12/29
23:33:53.07
−22.253
−179.672
584.0
5.1
–1.00
––
––
––
––
1993/11/19
04:37:56.60
−22.275
−179.675
583.6
5.3
−7.1
0.89
5219
22.99
7.00
2.47
−0.40
1.96
1.18
2003/09/30
02:01:05.11
−22.202
−179.672
586.2
5.0
2.8
0.86
8824
2.34
4.00
5.67
2.20
3.34
2.22
2006/02/01
18:28:49.39
−22.183
−179.658
600.0
5.2
5.1
0.84
8918
6.98
15.00
7.92
16.00
2.46
1.33
TD-C8 1994/07/30
14:34:08.70
−23.227
179.137
545.0
5.1
–1.00
––
––
––
––
1993/12/14
13:21:25.61
−23.266
179.073
545.0
4.8
−0.6
0.82
139
40.46
42.00
7.85
0.00
36.27
12.94
2006/04/08
08:04:08.88
−23.195
179.123
546.4
4.7
11.7
0.82
2211
8.37
30.00
3.83
1.40
9.82
5.94
*Colum
nheadings
arethesameas
Table1.
Deep-Focus Repeating Earthquakes in the Tonga–Fiji Subduction Zone 1835

at the depth range of 480–650 km (Fig. 1; Tables 1, 2). Timeseparation is on the order of years for themajority of the earth-quake pairs (Fig. 2).
Master Event Algorithm
A master event algorithm (Wen, 2006) is applied to de-termine the precise relative location and depth between thedeep event pairs. This algorithm treats one event of the pairas the master (or reference) event whose origin time and hy-pocenter are fixed to those of the PDE catalog. The origintime error and relative location and depth of the second eventare solved via a grid searching technique. The data are thetravel time residuals of the seismic phase pairs calculated bywaveform cc of the high-frequency P and PKP waveformpairs filtered in the frequency range of 0.8–2.0 Hz. The traveltime residual is sensitive to the time shift due to differentiallocation and depth and event origin time error between twoearthquakes, and it is insensitive to heterogeneous velocitystructures along the ray paths because the event pair shouldbe close in space and have nearly identical ray paths. Whilethe absolute location and depth of the master event might bebiased by the 3D heterogeneous velocity structures near the
source, the relative location between earthquake pairs shouldbe more precise. Event origin time error is treated as a con-stant and is calculated by averaging the travel time residualsfor a given earthquake pair. The optimum location and depthof the second event relative to the master event are solved bygrid searching the region near the master event that yields theminimum root mean square (rms) time residual. The box forthe grid search is 30 km (east–west) × 30 km (north–south)× 30 km (vertical) centered at the hypocenter of the masterevent (Fig. 3). The interval of grid search is 100 meters in theeast–west, north–south, and vertical directions. We use P,PKP (bc or ab), and PKKPbc phases to determine the relativelocation and depth between earthquake pairs. Surface re-flected pP phases sampling the upper focal hemisphere areused to improve the precision of relative depth when thephase pair are well recorded. However, surface reflected pPphases often cannot be identified simultaneously for bothearthquakes due to background noise or unfavorable focalmechanism for the excitation of pP phases. To achieve sub-sample precision, the time series are interpolated to 5 mssampling rate before cc.
To estimate the location uncertainties, we compute the95% confidence ellipse for each earthquake pair with 200
TD-D1
TD-D2
TD-D3
TD-D4
TD-D5
TD-D6
TD-D7
TD-D8
TD-D9
TD-D10
TD-D11
TD-D12
TD-D13
TD-D14
TD-D15
TD-D16
TD-D17
TD-D18
0
2
4
6
8
10
12
14
16
18
1990 1992 1994 1996 1998 2000 2002 2004 2006 2008 2010
Time (calendar years)
(a)
TD-C1
TD-C2
TD-C3
TD-C4
TD-C5
TD-C6
TD-C7
TD-C8
0
2
4
6
8
1990 1992 1994 1996 1998 2000 2002 2004 2006 2008 2010
Time (calendar years)
(b)
Figure 2. Time window for deep-focus similar (a) doublets and (b) clusters. The abbreviations TD-D and TD-C refer to Tonga deepdoublet and Tonga deep cluster, respectively. The digits of the doublet ID and cluster ID increase as latitude of the reference event increases.
1836 W. Yu and L. Wen
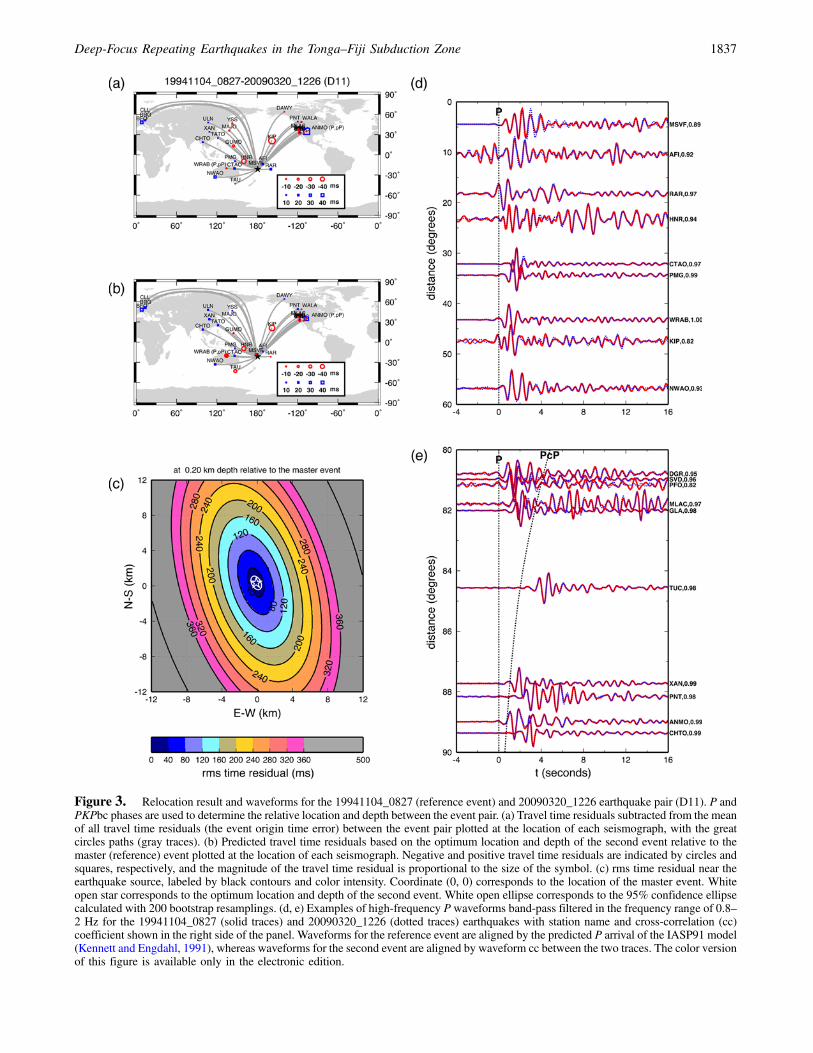
Figure 3. Relocation result and waveforms for the 19941104_0827 (reference event) and 20090320_1226 earthquake pair (D11). P andPKPbc phases are used to determine the relative location and depth between the event pair. (a) Travel time residuals subtracted from the meanof all travel time residuals (the event origin time error) between the event pair plotted at the location of each seismograph, with the greatcircles paths (gray traces). (b) Predicted travel time residuals based on the optimum location and depth of the second event relative to themaster (reference) event plotted at the location of each seismograph. Negative and positive travel time residuals are indicated by circles andsquares, respectively, and the magnitude of the travel time residual is proportional to the size of the symbol. (c) rms time residual near theearthquake source, labeled by black contours and color intensity. Coordinate (0, 0) corresponds to the location of the master event. Whiteopen star corresponds to the optimum location and depth of the second event. White open ellipse corresponds to the 95% confidence ellipsecalculated with 200 bootstrap resamplings. (d, e) Examples of high-frequency P waveforms band-pass filtered in the frequency range of 0.8–2 Hz for the 19941104_0827 (solid traces) and 20090320_1226 (dotted traces) earthquakes with station name and cross-correlation (cc)coefficient shown in the right side of the panel. Waveforms for the reference event are aligned by the predicted P arrival of the IASP91 model(Kennett and Engdahl, 1991), whereas waveforms for the second event are aligned by waveform cc between the two traces. The color versionof this figure is available only in the electronic edition.
Deep-Focus Repeating Earthquakes in the Tonga–Fiji Subduction Zone 1837

bootstrap resamplings. Eighty percent of the travel time re-siduals of the seismic phases are randomly selected and usedin each bootstrap calculation. The 95% confidence ellipse is
estimated using the least squares fit to the 200 locations.Aside from the trade-off between accuracy and computa-tional labor among various methods to determine the location
0 10 20 300 10 20 300 10 20 300 10 20 30
(a)
(b)
(c)
(d)
(e)
(f)
(g)
D11 MSVF ∆= 4.5 cc=0.90
P
-200-100
0100200
0 10 20 30-200-100
0100200
0 10 20 30-200-100
0100200
0 10 20 30
t (seconds)
τ(t)
(m
s)
70 80 90 10070 80 90 10070 80 90 10070 80 90 100
D11 MSVF ∆= 4.5 cc=0.95
S
-200-100
0100200
70 80 90 100-200-100
0100200
70 80 90 100-200-100
0100200
70 80 90 100
t (seconds)
0 10 20 300 10 20 300 10 20 300 10 20 30
D11 AFI ∆= 10.4 cc=0.89
P
-200-100
0100200
0 10 20 30-200-100
0100200
0 10 20 30-200-100
0100200
0 10 20 30
t (seconds)
τ(t)
(m
s)
110 120 130 140110 120 130 140110 120 130 140110 120 130 140
D11 AFI ∆= 10.4 cc=0.94
S
-200-100
0100200
110 120 130 140-200-100
0100200
110 120 130 140-200-100
0100200
110 120 130 140
t (seconds)
0 10 20 300 10 20 300 10 20 300 10 20 30
D11 WRAB ∆= 43.2 cc=0.99
P
-200-100
0100200
0 10 20 30-200-100
0100200
0 10 20 30-200-100
0100200
0 10 20 30t (seconds)
τ (t)
(m
s)
350 360 370 380350 360 370 380350 360 370 380350 360 370 380
D11 WRAB ∆= 43.2 cc=0.98
S
-200-100
0100200
350 360 370 380-200-100
0100200
350 360 370 380-200-100
0100200
350 360 370 380t (seconds)
-200-100
0100200
0 10 20 30-200-100
0100200
0 10 20 30-200-100
0100200
0 10 20 30
t (seconds)
τ(t)
(m
s)
synthetic τ(t) ∆= 4.5
P
dx 0 km dz 0.4 km-200-100
0100200
0 10 20 30-200-100
0100200
0 10 20 30-200-100
0100200
0 10 20 30
t (seconds)
τ(t)
(m
s)
synthetic τ(t) ∆= 4.5
Pdx 0.4 km dz 0 km
-200-100
0100200
70 80 90 100-200-100
0100200
70 80 90 100-200-100
0100200
70 80 90 100
t (seconds)
synthetic τ(t) ∆= 4.5
S
-200-100
0100200
70 80 90 100-200-100
0100200
70 80 90 100-200-100
0100200
70 80 90 100
t (seconds)
synthetic τ(t) ∆= 4.5
S
Figure 4. Observed high-frequency (0.8–2 Hz) waveforms and lag time τ�t� between the D11 doublet and synthetic test for the effect ofdifferential location and differential depth between an earthquake pair. High-frequency P-coda (left panels) and S-coda (right panels) wave-forms in a 40-s time window and their measured lag time series τ�t� at seismographs (a, b) MSVF, (c, d) AFI, and (e, f) WRAB. Solid tracesand dotted traces correspond to the 19941104_0827 (reference event) and 20090320_1226 earthquakes of the D11 doublet, respectively.Station name, epicentral distance, and average waveform cc coefficient of the P or S coda between the doublet are displayed at the top of thepanel. (g) Synthetic τ�t� due to a lateral separation of 0.4 km (labeled with “dx 0:4 km dz 0 km”, gray line) and a vertical separation of 0.4 km(labeled with “dx 0 km dz 0:4 km”, black line). Synthetic τ�t� are calculated from moving window cc between the synthetics based on a focaldepth of 600 km and those with a lateral and vertical separation of 0.4 km at the synthetic hypocenter. Note that the vertical separation of0.4 km produces about 90 ms in lag time near the onset of the P coda (black line), which is not observed at MSVF. Note also the observed lagtime of the S coda at MSVF is generally less than 60 ms, consistent with the synthetic ones of 70 ms based on a horizontal separation of0.4 km (gray line). The color version of this figure is available only in the electronic edition.
1838 W. Yu and L. Wen

-4 0 4 8-4 0 4 8-4 0 4 8-4 0 4 8
94
-4 0 4 8
09
-4 0 4 8
ref:19941104_0827
20090320_1226
(D11, 0.40 km, 0.88)
-4 0 4 8-4 0 4 8-4 0 4 8
00a
-4 0 4 8
00b
-4 0 4 8
ref:20001218_0119
20001225_0511
(C5-00a-00b, 3.75 km, 0.91)
-4 0 4 8-4 0 4 8-4 0 4 8
ref:19960712_1331
20030820_2354
(D12, 1.00 km, 0.9)
-4 0 4 8-4 0 4 8-4 0 4 8
ref:19980124_1757
20030315_0703
(D14, 2.41 km, 0.8)
-4 0 4 8-4 0 4 8-4 0 4 8
ref:19941130_0637
19960108_1340
(D1, 2.85 km, 0.8)
-4 0 4 8-4 0 4 8-4 0 4 8
ref:20000316_0142
20070523_1559
(D2, 2.68 km, 0.88)
-4 0 4 8-4 0 4 8-4 0 4 8
02
-4 0 4 8
03
-4 0 4 8
ref:20020109_0103
20031120_0201
(D17, 4.11 km, 0.86)
-4 0 4 8-4 0 4 8-4 0 4 8
01
-4 0 4 8
04
-4 0 4 8
ref:20011022_0646
20041118_1227
(D10, 4.40 km, 0.83)
spatial separation (km)-8 0 8 16 24-8 0 8 16 24-8 0 8 16 24-8 0 8 16 24
ref:20041106_0704
20091031_1038
(D18, 4.43 km, 0.8)
-8 0 8 16 24-8 0 8 16 24-8 0 8 16 24
ref:19940902_1746
19951031_0620
(D6, 4.52 km, 0.83)
-8 0 8 16 24-8 0 8 16 24-8 0 8 16 24
ref:19961110_0626
19970521_0929
(D15, 4.64 km, 0.82)
-8 0 8 16 24-8 0 8 16 24-8 0 8 16 24
02
-8 0 8 16 24
05
-8 0 8 16 24
ref:20020825_0442
20050404_0816
(D7, 6.08 km, 0.89)
-8 0 8 16 24-8 0 8 16 24-8 0 8 16 24
ref:20040710_1616
20050422_1125
(D8, 14.10 km, 0.8)
-8 0 8 16 24-8 0 8 16 24-8 0 8 16 24
99
-8 0 8 16 24
01
-8 0 8 16 24
ref:19990709_1816
20010711_1511
(D5, 15.82 km, 0.83)
-8 0 8 16 24-8 0 8 16 24-8 0 8 16 24
ref:20081218_2057
20040522_1433
(D16, 16.28 km, 0.8)
-8 0 8 16 24-8 0 8 16 24-8 0 8 16 24
ref:19971213_0439
20020410_0711
(D3, 17.78 km, 0.82)
-8 0 8 16 24-8 0 8 16 24-8 0 8 16 24
94
-8 0 8 16 24
97
-8 0 8 16 24
ref:19940702_0546
19971129_0242
(D9, 18.57 km, 0.87)
-8 0 8 16 24-8 0 8 16 24-8 0 8 16 24
95
-8 0 8 16 24
99
-8 0 8 16 24
ref:19950616_1349
19990721_0310
(D4, 18.61 km, 0.86)
-8 0 8 16 24-8 0 8 16 24-8 0 8 16 24
96
-8 0 8 16 24
06
-8 0 8 16 24
ref:19961007_0923
20060201_1828
(D13, 21.20 km, 0.85)
spatial separation (km)
Figure 5. Spatial separation for the 18 deep similar doublets and the C5-00a-00b pair of the cluster C5 in the Tonga–Fiji region. Thereference events are placed at 0 km. Black circles refer to the estimated circular source areas, whereas gray dashed ellipses are the locationuncertainties of the second event computed from bootstrap resamplings. Size of the circles and ellipses is scaled based on their separationalong the x coordinate. In the right side of the panel labeled with the reference event ID (“ref” top row), the second event ID (middle row), andthe doublet ID, spatial separation in kilometers, and average cc coefficient (bottom row). Two earthquake pairs that have overlap in their faultareas are the D11 and C5-00a-00b pairs. Note that the large difference in source size between the C5-00a-00b pair due to the events 00a and00b with an mb 6.4 and 5.3, respectively. The source parameters, precise location, and depth relative to the reference event, time separation,and average cc coefficient of the doublets are displayed in Table 1.
Deep-Focus Repeating Earthquakes in the Tonga–Fiji Subduction Zone 1839

-8
-4
0
4
8
-8 -4 0 4 8
-8
-4
0
4
8
-8 -4 0 4 8
-8
-4
0
4
8
-8 -4 0 4 8
-8
-4
0
4
8
-8 -4 0 4 8
-8
-4
0
4
8
-8 -4 0 4 8
-8
-4
0
4
8
-8 -4 0 4 8
-8
-4
0
4
8
-8 -4 0 4 8
-8
-4
0
4
8
-8 -4 0 4 8
-8
-4
0
4
8
-8 -4 0 4 8
-8
-4
0
4
8
-8 -4 0 4 8
-8
-4
0
4
8
-8 -4 0 4 8
99
-8
-4
0
4
8
-8 -4 0 4 8
91
-8
-4
0
4
8
-8 -4 0 4 8
95
97
E-W (km)
C1
N-S
(km
)
-8
-4
0
4
8
-8 -4 0 4 8
-8
-4
0
4
8
-8 -4 0 4 8
-8
-4
0
4
8
-8 -4 0 4 8
-8
-4
0
4
8
-8 -4 0 4 8
-8
-4
0
4
8
-8 -4 0 4 8
99
-8
-4
0
4
8
-8 -4 0 4 8
-8
-4
0
4
8
-8 -4 0 4 8
91
-8
-4
0
4
8
-8 -4 0 4 8
-8
-4
0
4
8
-8 -4 0 4 8
95
-8
-4
0
4
8
-8 -4 0 4 8
-8
-4
0
4
8
-8 -4 0 4 8
97
E-W (km)
C1
dep
th (
km)
-8
-4
0
4
8
-8 -4 0 4 8
-8
-4
0
4
8
-8 -4 0 4 8
-8
-4
0
4
8
-8 -4 0 4 8
-8
-4
0
4
8
-8 -4 0 4 8
-8
-4
0
4
8
-8 -4 0 4 8
99
-8
-4
0
4
8
-8 -4 0 4 8
-8
-4
0
4
8
-8 -4 0 4 8
91
-8
-4
0
4
8
-8 -4 0 4 8
-8
-4
0
4
8
-8 -4 0 4 8
95
-8
-4
0
4
8
-8 -4 0 4 8
-8
-4
0
4
8
-8 -4 0 4 8
97
N-S (km)
C1
dep
th (
km)
-8
-4
0
4
8
-8 -4 0 4 8
-8
-4
0
4
8
-8 -4 0 4 8
-8
-4
0
4
8
-8 -4 0 4 8
-8
-4
0
4
8
-8 -4 0 4 8
-8
-4
0
4
8
-8 -4 0 4 8
99
-8
-4
0
4
8
-8 -4 0 4 8
-8
-4
0
4
8
-8 -4 0 4 8
94
-8
-4
0
4
8
-8 -4 0 4 8
-8
-4
0
4
8
-8 -4 0 4 8
00
-8
-4
0
4
8
-8 -4 0 4 8
-8
-4
0
4
8
-8 -4 0 4 8
02
-8
-4
0
4
8
-8 -4 0 4 8
-8
-4
0
4
8
-8 -4 0 4 8
05
E-W (km)
C2
N-S
(km
)
-8
-4
0
4
8
-8 -4 0 4 8
-8
-4
0
4
8
-8 -4 0 4 8
-8
-4
0
4
8
-8 -4 0 4 8
-8
-4
0
4
8
-8 -4 0 4 8
-8
-4
0
4
8
-8 -4 0 4 8
99
-8
-4
0
4
8
-8 -4 0 4 8
-8
-4
0
4
8
-8 -4 0 4 8
94
-8
-4
0
4
8
-8 -4 0 4 8
-8
-4
0
4
8
-8 -4 0 4 8
00
-8
-4
0
4
8
-8 -4 0 4 8
-8
-4
0
4
8
-8 -4 0 4 8
02
-8
-4
0
4
8
-8 -4 0 4 8
-8
-4
0
4
8
-8 -4 0 4 8
05
E-W (km)
C2
dep
th (
km)
-8
-4
0
4
8
-8 -4 0 4 8
-8
-4
0
4
8
-8 -4 0 4 8
-8
-4
0
4
8
-8 -4 0 4 8
-8
-4
0
4
8
-8 -4 0 4 8
-8
-4
0
4
8
-8 -4 0 4 8
99
-8
-4
0
4
8
-8 -4 0 4 8
-8
-4
0
4
8
-8 -4 0 4 8
94
-8
-4
0
4
8
-8 -4 0 4 8
-8
-4
0
4
8
-8 -4 0 4 8
00
-8
-4
0
4
8
-8 -4 0 4 8
-8
-4
0
4
8
-8 -4 0 4 8
02
-8
-4
0
4
8
-8 -4 0 4 8
-8
-4
0
4
8
-8 -4 0 4 8
05
N-S (km)
C2
dep
th (
km)
-4
-2
0
2
4
-4 -2 0 2 4-4
-2
0
2
4
-4 -2 0 2 4-4
-2
0
2
4
-4 -2 0 2 4-4
-2
0
2
4
-4 -2 0 2 4-4
-2
0
2
4
-4 -2 0 2 4
99
-4
-2
0
2
4
-4 -2 0 2 4-4
-2
0
2
4
-4 -2 0 2 4
02
-4
-2
0
2
4
-4 -2 0 2 4-4
-2
0
2
4
-4 -2 0 2 4
07
E-W (km)
C3
N-S
(km
)
-4
-2
0
2
4-4 -2 0 2 4
-4
-2
0
2
4-4 -2 0 2 4
-4
-2
0
2
4-4 -2 0 2 4
-4
-2
0
2
4-4 -2 0 2 4
-4
-2
0
2
4-4 -2 0 2 4
99
-4
-2
0
2
4-4 -2 0 2 4
-4
-2
0
2
4-4 -2 0 2 4
02
-4
-2
0
2
4-4 -2 0 2 4
-4
-2
0
2
4-4 -2 0 2 4
07
E-W (km)
C3
dep
th (
km)
-4
-2
0
2
4-4 -2 0 2 4
-4
-2
0
2
4-4 -2 0 2 4
-4
-2
0
2
4-4 -2 0 2 4
-4
-2
0
2
4-4 -2 0 2 4
-4
-2
0
2
4-4 -2 0 2 4
99
-4
-2
0
2
4-4 -2 0 2 4
-4
-2
0
2
4-4 -2 0 2 4
02
-4
-2
0
2
4-4 -2 0 2 4
-4
-2
0
2
4-4 -2 0 2 4
07
N-S (km)
C3
dep
th (
km)
-16
-8
0
8
16
-16 -8 0 8 16-16
-8
0
8
16
-16 -8 0 8 16-16
-8
0
8
16
-16 -8 0 8 16-16
-8
0
8
16
-16 -8 0 8 16-16
-8
0
8
16
-16 -8 0 8 16-16
-8
0
8
16
-16 -8 0 8 16-16
-8
0
8
16
-16 -8 0 8 16-16
-8
0
8
16
-16 -8 0 8 16-16
-8
0
8
16
-16 -8 0 8 16-16
-8
0
8
16
-16 -8 0 8 16-16
-8
0
8
16
-16 -8 0 8 16-16
-8
0
8
16
-16 -8 0 8 16-16
-8
0
8
16
-16 -8 0 8 16
02
-16
-8
0
8
16
-16 -8 0 8 16
06
-16
-8
0
8
16
-16 -8 0 8 16
97
01
07
E-W (km)
C4
N-S
(km
)
-16
-8
0
8
16-16 -8 0 8 16
-16
-8
0
8
16-16 -8 0 8 16
-16
-8
0
8
16-16 -8 0 8 16
-16
-8
0
8
16-16 -8 0 8 16
-16
-8
0
8
16-16 -8 0 8 16
97
-16
-8
0
8
16-16 -8 0 8 16
-16
-8
0
8
16-16 -8 0 8 16
01
-16
-8
0
8
16-16 -8 0 8 16
-16
-8
0
8
16-16 -8 0 8 16
02
-16
-8
0
8
16-16 -8 0 8 16
-16
-8
0
8
16-16 -8 0 8 16
06
-16
-8
0
8
16-16 -8 0 8 16
-16
-8
0
8
16-16 -8 0 8 16
07
E-W (km)
C4
dep
th (
km)
-16
-8
0
8
16-16 -8 0 8 16
-16
-8
0
8
16-16 -8 0 8 16
-16
-8
0
8
16-16 -8 0 8 16
-16
-8
0
8
16-16 -8 0 8 16
-16
-8
0
8
16-16 -8 0 8 16
97
-16
-8
0
8
16-16 -8 0 8 16
-16
-8
0
8
16-16 -8 0 8 16
01
-16
-8
0
8
16-16 -8 0 8 16
-16
-8
0
8
16-16 -8 0 8 16
02
-16
-8
0
8
16-16 -8 0 8 16
-16
-8
0
8
16-16 -8 0 8 16
06
-16
-8
0
8
16-16 -8 0 8 16
-16
-8
0
8
16-16 -8 0 8 16
07
N-S (km)
C4
dep
th (
km)
(a)
(b)
(c)
(d)
Figure 6. Relative location and depth for the 8 deep similar clusters (a) C1, (b) C2, (c) C3, (d) C4, (e) C5, (f) C6, (g) C7, and (h) C8. Left,middle, and right panels display east–west and north–south plane view, east–west depth plane view, and north–south depth plane view,respectively, among the clusters. Reference events of the clusters are located at coordinate (0, 0). Black circles and gray dashed ellipsesrefer to the estimated circular source areas and location uncertainties, respectively. Individual earthquakes within each cluster are denoted byyear. Only available CMTs are plotted. Note that the estimate of location uncertainties is robust in the east–west north–south plane. Thus,location uncertainties are displayed only in the left panels. The source parameters of the clusters C1–C8 are displayed in Table 2.(Continued)
1840 W. Yu and L. Wen

-16
-8
0
8
16
-16 -8 0 8 16
-16
-8
0
8
16
-16 -8 0 8 16
-16
-8
0
8
16
-16 -8 0 8 16
-16
-8
0
8
16
-16 -8 0 8 16
-16
-8
0
8
16
-16 -8 0 8 16
-16
-8
0
8
16
-16 -8 0 8 16
-16
-8
0
8
16
-16 -8 0 8 16
-16
-8
0
8
16
-16 -8 0 8 16
-16
-8
0
8
16
-16 -8 0 8 16
-16
-8
0
8
16
-16 -8 0 8 16
-16
-8
0
8
16
-16 -8 0 8 16
94
-16
-8
0
8
16
-16 -8 0 8 16
00a
-16
-8
0
8
16
-16 -8 0 8 16
00b
-16
-8
0
8
16
-16 -8 0 8 16
06
E-W (km)
C5
N-S
(km
)
-16
-8
0
8
16
-16 -8 0 8 16
-16
-8
0
8
16
-16 -8 0 8 16
-16
-8
0
8
16
-16 -8 0 8 16
-16
-8
0
8
16
-16 -8 0 8 16
-16
-8
0
8
16
-16 -8 0 8 16
94
-16
-8
0
8
16
-16 -8 0 8 16
-16
-8
0
8
16
-16 -8 0 8 16
00a
-16
-8
0
8
16
-16 -8 0 8 16
-16
-8
0
8
16
-16 -8 0 8 16
00b
-16
-8
0
8
16
-16 -8 0 8 16
-16
-8
0
8
16
-16 -8 0 8 16
06
E-W (km)
C5
dep
th (
km)
-16
-8
0
8
16
-16 -8 0 8 16
-16
-8
0
8
16
-16 -8 0 8 16
-16
-8
0
8
16
-16 -8 0 8 16
-16
-8
0
8
16
-16 -8 0 8 16
-16
-8
0
8
16
-16 -8 0 8 16
94
-16
-8
0
8
16
-16 -8 0 8 16
-16
-8
0
8
16
-16 -8 0 8 16
00a
-16
-8
0
8
16
-16 -8 0 8 16
-16
-8
0
8
16
-16 -8 0 8 16
00b
-16
-8
0
8
16
-16 -8 0 8 16
-16
-8
0
8
16
-16 -8 0 8 16
06
N-S (km)
C5
dep
th (
km)
-4
-2
0
2
4
-4 -2 0 2 4-4
-2
0
2
4
-4 -2 0 2 4-4
-2
0
2
4
-4 -2 0 2 4-4
-2
0
2
4
-4 -2 0 2 4-4
-2
0
2
4
-4 -2 0 2 4
09
-4
-2
0
2
4
-4 -2 0 2 4-4
-2
0
2
4
-4 -2 0 2 4
04
-4
-2
0
2
4
-4 -2 0 2 4-4
-2
0
2
4
-4 -2 0 2 4
08
E-W (km)
C6
N-S
(km
)
-4
-2
0
2
4-4 -2 0 2 4
-4
-2
0
2
4-4 -2 0 2 4
-4
-2
0
2
4-4 -2 0 2 4
-4
-2
0
2
4-4 -2 0 2 4
-4
-2
0
2
4-4 -2 0 2 4
09
-4
-2
0
2
4-4 -2 0 2 4
-4
-2
0
2
4-4 -2 0 2 4
04
-4
-2
0
2
4-4 -2 0 2 4
-4
-2
0
2
4-4 -2 0 2 4
08
E-W (km)
C6
dep
th (
km)
-4
-2
0
2
4-4 -2 0 2 4
-4
-2
0
2
4-4 -2 0 2 4
-4
-2
0
2
4-4 -2 0 2 4
-4
-2
0
2
4-4 -2 0 2 4
-4
-2
0
2
4-4 -2 0 2 4
09
-4
-2
0
2
4-4 -2 0 2 4
-4
-2
0
2
4-4 -2 0 2 4
04
-4
-2
0
2
4-4 -2 0 2 4
-4
-2
0
2
4-4 -2 0 2 4
08
N-S (km)
C6
dep
th (
km)
-4
0
4
8
12
16
-4 0 4 8 12 16-4
0
4
8
12
16
-4 0 4 8 12 16-4
0
4
8
12
16
-4 0 4 8 12 16-4
0
4
8
12
16
-4 0 4 8 12 16-4
0
4
8
12
16
-4 0 4 8 12 16-4
0
4
8
12
16
-4 0 4 8 12 16-4
0
4
8
12
16
-4 0 4 8 12 16-4
0
4
8
12
16
-4 0 4 8 12 16-4
0
4
8
12
16
-4 0 4 8 12 16-4
0
4
8
12
16
-4 0 4 8 12 16-4
0
4
8
12
16
-4 0 4 8 12 16
00
-4
0
4
8
12
16
-4 0 4 8 12 16
03
-4
0
4
8
12
16
-4 0 4 8 12 16
06
-4
0
4
8
12
16
-4 0 4 8 12 16
93
E-W (km)
C7
N-S
(km
)
-4
0
4
8
12
16
-4 0 4 8 12 16
-4
0
4
8
12
16
-4 0 4 8 12 16
-4
0
4
8
12
16
-4 0 4 8 12 16
-4
0
4
8
12
16
-4 0 4 8 12 16
-4
0
4
8
12
16
-4 0 4 8 12 16
00
-4
0
4
8
12
16
-4 0 4 8 12 16
-4
0
4
8
12
16
-4 0 4 8 12 16
93
-4
0
4
8
12
16
-4 0 4 8 12 16
-4
0
4
8
12
16
-4 0 4 8 12 16
03
-4
0
4
8
12
16
-4 0 4 8 12 16
-4
0
4
8
12
16
-4 0 4 8 12 16
06
E-W (km)
C7
dep
th (
km)
-4
0
4
8
12
16
-4 0 4 8 12 16
-4
0
4
8
12
16
-4 0 4 8 12 16
-4
0
4
8
12
16
-4 0 4 8 12 16
-4
0
4
8
12
16
-4 0 4 8 12 16
-4
0
4
8
12
16
-4 0 4 8 12 16
00
-4
0
4
8
12
16
-4 0 4 8 12 16
-4
0
4
8
12
16
-4 0 4 8 12 16
93
-4
0
4
8
12
16
-4 0 4 8 12 16
-4
0
4
8
12
16
-4 0 4 8 12 16
03
-4
0
4
8
12
16
-4 0 4 8 12 16
-4
0
4
8
12
16
-4 0 4 8 12 16
06
N-S (km)
C7
dep
th (
km)
-8
-4
0
4
8
-8 -4 0 4 8-8
-4
0
4
8
-8 -4 0 4 8-8
-4
0
4
8
-8 -4 0 4 8-8
-4
0
4
8
-8 -4 0 4 8-8
-4
0
4
8
-8 -4 0 4 8
94
-8
-4
0
4
8
-8 -4 0 4 8-8
-4
0
4
8
-8 -4 0 4 8
93
-8
-4
0
4
8
-8 -4 0 4 8-8
-4
0
4
8
-8 -4 0 4 8
06
E-W (km)
C8
N-S
(km
)
-8
-4
0
4
8-8 -4 0 4 8
-8
-4
0
4
8-8 -4 0 4 8
-8
-4
0
4
8-8 -4 0 4 8
-8
-4
0
4
8-8 -4 0 4 8
-8
-4
0
4
8-8 -4 0 4 8
94
-8
-4
0
4
8-8 -4 0 4 8
-8
-4
0
4
8-8 -4 0 4 8
93
-8
-4
0
4
8-8 -4 0 4 8
-8
-4
0
4
8-8 -4 0 4 8
06
E-W (km)
C8
dep
th (
km)
-8
-4
0
4
8-8 -4 0 4 8
-8
-4
0
4
8-8 -4 0 4 8
-8
-4
0
4
8-8 -4 0 4 8
-8
-4
0
4
8-8 -4 0 4 8
-8
-4
0
4
8-8 -4 0 4 8
94
-8
-4
0
4
8-8 -4 0 4 8
-8
-4
0
4
8-8 -4 0 4 8
93
-8
-4
0
4
8-8 -4 0 4 8
-8
-4
0
4
8-8 -4 0 4 8
06
N-S (km)
C8
dep
th (
km)
(e)
(f)
(g)
(h)
Figure 6. Continued.
Deep-Focus Repeating Earthquakes in the Tonga–Fiji Subduction Zone 1841

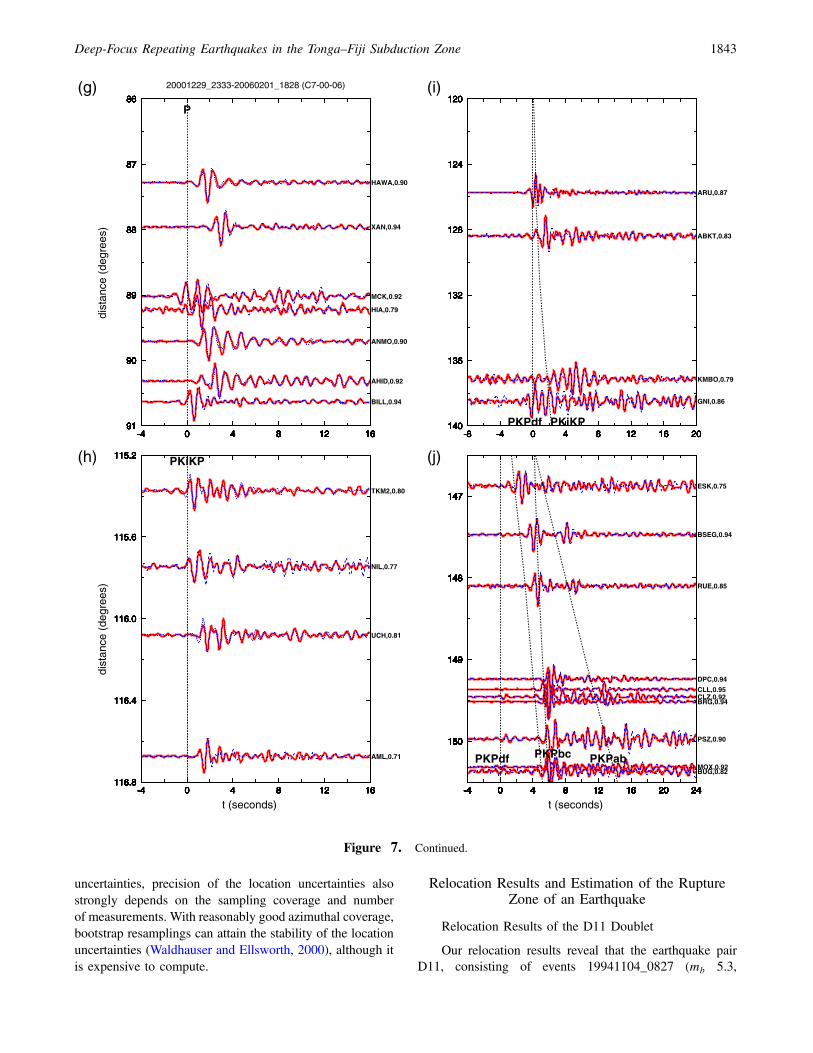
Figure 7. Relocation result and waveforms for the 20001229_2333 (reference event) and 20060201_1828 earthquake pair (C7-00-06pair) of the cluster C7. (a–c) are same as those in Figure 3. (d) Sampling paths for the display of the phase pairs that have identical polarity(gray solid lines) and reverse polarity (gray dashed lines) between the pair. (e–j) High frequency P and PKP waveforms band-pass filtered inthe frequency range of 0.8–2 Hz at various distance ranges. Solid traces are waveforms of the 20001229_2333 event, whereas dotted tracesand dashed traces indicate waveforms of the 20060201_1828 event that have identical and reverse polarity compared with those of the20001229_2333 event, respectively. Note that waveform cc coefficients of many phase pairs can approach 0.8 after reversing the polarity(solid traces versus dashed traces). Alignment of the waveforms is same as that in Figure 3. Note also the discrepancy in sampling pathsbetween (a) and (d) is that the inner core related phases PKPdf and PKiKP are not included in the relocation displayed in (a). The colorversion of this figure is available only in the electronic edition. (Continued)
1842 W. Yu and L. Wen
uncertainties, precision of the location uncertainties alsostrongly depends on the sampling coverage and numberof measurements. With reasonably good azimuthal coverage,bootstrap resamplings can attain the stability of the locationuncertainties (Waldhauser and Ellsworth, 2000), although itis expensive to compute.
Relocation Results and Estimation of the RuptureZone of an Earthquake
Relocation Results of the D11 Doublet
Our relocation results reveal that the earthquake pairD11, consisting of events 19941104_0827 (mb 5.3,
86
87
88
89
90
91-4 0 4 8 12 16
86
87
88
89
90
91-4 0 4 8 12 16
86
87
88
89
90
91-4 0 4 8 12 16
XAN,0.94
86
87
88
89
90
91-4 0 4 8 12 16
86
87
88
89
90
91-4 0 4 8 12 16
ANMO,0.90
86
87
88
89
90
91-4 0 4 8 12 16
86
87
88
89
90
91-4 0 4 8 12 16
HIA,0.79
86
87
88
89
90
91-4 0 4 8 12 16
86
87
88
89
90
91-4 0 4 8 12 16
AHID,0.92
86
87
88
89
90
91-4 0 4 8 12 16
86
87
88
89
90
91-4 0 4 8 12 16
MCK,0.92
86
87
88
89
90
91-4 0 4 8 12 16
86
87
88
89
90
91-4 0 4 8 12 16
HAWA,0.90
86
87
88
89
90
91-4 0 4 8 12 16
86
87
88
89
90
91-4 0 4 8 12 16
BILL,0.94
20001229_2333-20060201_1828 (C7-00-06)
dist
ance
(de
gree
s)P
115.2
115.6
116.0
116.4
116.8-4 0 4 8 12 16
115.2
115.6
116.0
116.4
116.8-4 0 4 8 12 16
115.2
115.6
116.0
116.4
116.8-4 0 4 8 12 16
UCH,0.81
115.2
115.6
116.0
116.4
116.8-4 0 4 8 12 16
115.2
115.6
116.0
116.4
116.8-4 0 4 8 12 16
NIL,0.77
115.2
115.6
116.0
116.4
116.8-4 0 4 8 12 16
115.2
115.6
116.0
116.4
116.8-4 0 4 8 12 16
AML,0.71
115.2
115.6
116.0
116.4
116.8-4 0 4 8 12 16
115.2
115.6
116.0
116.4
116.8-4 0 4 8 12 16
TKM2,0.80
t (seconds)
dist
ance
(de
gree
s)
PKiKP
120
124
128
132
136
140-8 -4 0 4 8 12 16 20
120
124
128
132
136
140-8 -4 0 4 8 12 16 20
120
124
128
132
136
140-8 -4 0 4 8 12 16 20
ABKT,0.83
120
124
128
132
136
140-8 -4 0 4 8 12 16 20
120
124
128
132
136
140-8 -4 0 4 8 12 16 20
ARU,0.87
120
124
128
132
136
140-8 -4 0 4 8 12 16 20
120
124
128
132
136
140-8 -4 0 4 8 12 16 20
KMBO,0.79
120
124
128
132
136
140-8 -4 0 4 8 12 16 20
120
124
128
132
136
140-8 -4 0 4 8 12 16 20
GNI,0.86
PKPdf PKiKP
147
148
149
150
-4 0 4 8 12 16 20 24
147
148
149
150
-4 0 4 8 12 16 20 24
147
148
149
150
-4 0 4 8 12 16 20 24
BRG,0.94
147
148
149
150
-4 0 4 8 12 16 20 24
147
148
149
150
-4 0 4 8 12 16 20 24
MOX,0.92
147
148
149
150
-4 0 4 8 12 16 20 24
147
148
149
150
-4 0 4 8 12 16 20 24
BSEG,0.94
147
148
149
150
-4 0 4 8 12 16 20 24
147
148
149
150
-4 0 4 8 12 16 20 24
ESK,0.75
147
148
149
150
-4 0 4 8 12 16 20 24
147
148
149
150
-4 0 4 8 12 16 20 24
PSZ,0.90
147
148
149
150
-4 0 4 8 12 16 20 24
147
148
149
150
-4 0 4 8 12 16 20 24
DPC,0.94
147
148
149
150
-4 0 4 8 12 16 20 24
147
148
149
150
-4 0 4 8 12 16 20 24
RUE,0.85
147
148
149
150
-4 0 4 8 12 16 20 24
147
148
149
150
-4 0 4 8 12 16 20 24
CLL,0.95
147
148
149
150
-4 0 4 8 12 16 20 24
147
148
149
150
-4 0 4 8 12 16 20 24
BUG,0.82
147
148
149
150
-4 0 4 8 12 16 20 24
147
148
149
150
-4 0 4 8 12 16 20 24
CLZ,0.92
t (seconds)
PKPdf PKPabPKPbc
(g)
(h)
(i)
(j)
Figure 7. Continued.
Deep-Focus Repeating Earthquakes in the Tonga–Fiji Subduction Zone 1843

Figure 8. Synthetic relocation result and waveforms based after the 20001229_2333 and 20060201_1828 earthquake pair (syn C7-00-06). We compute two sets of P-wave synthetic seismograms using focal mechanism of the 20001229_2333 and 20060201_1828 earthquakesin the Global CMT. Synthetic P-wave seismograms are computed at an epicentral distance of 45° and a focal depth of 600 km with azimuthincreasing from 0° to 340° with 20° increment. (a–d) are same as those in Figure 7. In (d), cc coefficients are labeled in the parenthesis.(e) Synthetic P-wave seismograms filtered in the frequency range of 0.8–2 Hz are aligned by azimuth. Solid traces are the synthetics usingfocal mechanism of the 20001229_2333 event, whereas dotted traces and dashed traces are the synthetics using focal mechanism of the20060201_1828 event that have identical and reverse polarity compared with those of the 20001229_2333 event, respectively. In the rightside of the panel labeled with azimuth, cc coefficient, and time residual in the unit of millisecond between two traces. Given focal mechanismof the two events in the Global CMT, the unchanged or flipped polarities from the synthetics (d) are similar to the observations (Fig. 7d) to thefirst order. Note also variations in focal mechanism have negligible effects on the travel time residual and the relocation results (travel timeresidual of 0 millisecond between solid traces and dashed traces in [e]). The color version of this figure is available only in the electronicedition.
1844 W. Yu and L. Wen

616 km depth) and 20090320_1226 (mb 5.0, 616.2 kmdepth), is the spatially closest pair among all deep similardoublets and clusters (Fig. 3). The D11 pair has samplingsat stations MSVF and AFI at epicentral distance 4.5° and10.4°, respectively, and good azimuthal sampling coverageat teleseismic distances (Fig. 3a). The surface reflected pPphases at stations WRAB and ANMO are incorporated inthe relocation analysis (Fig. 3b), because the pP phasescan be clearly identified for both events, and their cc coeffi-cients are greater than 0.8. The seismographs in Antarcticadid not record both the 1994 and 2009 events. This event pairwas recorded by station SPA in 1994 and by station QSPAfor the 2009 event; SPA was moved to QSPA (offset by7.9 km) in 2003–2004. The master event relocation showsthat the D11 doublet is separated by 0.35 km and 0.2 kmin horizontal and vertical space, respectively (Fig. 3c;Table 1). The major and minor axes of the 95% confidenceellipse are 1.67 km and 1 km, respectively (white ellipse inFig. 3c; Table 1). Besides the high waveform cc coefficient atall distances and along various sampling azimuth (Fig. 3d,e),the relocation results show that: (1) the travel time residualssubtracted from the average of all travel time residuals(equivalent to the event origin time error of the catalog)(Fig. 3a) are generally similar to those predicted based onthe best-fitting location of the second event (Fig. 3b), whichsimply reflects that the travel time residuals are dominated bythe event origin time error; (2) the travel time residuals at theclosest stations MSVF and AFI are −13 ms and 11 ms, re-spectively (Fig. 3b); and (3) the rms time residual predictedbased on the optimum location and depth of the second eventis 19 ms. The previously stated characteristics inferred fromthe master event relocation resemble those for shallow-focusrepeating earthquakes (Wen, 2006; Yu et al. unpublishedmanuscript, 2012).
Assessment of Differential Location and DifferentialDepth Using Lag-Time Series
The effect of differential location and differential depthbetween two earthquakes can also be studied by comparingthe lag time series, τ�t�, between observations and synthetics(Niu et al., 2003; Yu et al. unpublished manuscript, 2012).For the measurement of the observed τ�t�, we first inter-polate the time series of high-frequency waveforms to a sam-pling rate of 5 ms. A moving window cc of 8 s with a 95%window overlap is used to obtain smooth and stable measure-ments in delay time of the coda waves between two events.By subtracting the delay time determined solely from cc ofthe first 4 s of high-frequency P wave between two events,we obtain the τ�t� where t is lapse time (Fig. 4b,d,f). Thecalculation can be expressed in the form of �tcoda2−tcoda1� − �tP2 − tP1�. Lag time series in the time windowof the S-wave coda are equivalent to S–P lag time. We com-pute 2D finite difference synthetic seismograms (Helmbergerand Vidale, 1988) based on the preliminary reference Earthmodel velocity model (Dziewonski and Anderson, 1981) at a
focal depth of 600 km and based on the same model with alateral and vertical separation of 0.4 km at the synthetic hy-pocenter. Synthetic τ�t� are computed from moving windowcc between two sets of synthetic seismograms (Fig. 4g).
We examine waveform similarity and compare τ�t� be-tween observations and synthetics with a lateral separation of0.4 km and a vertical separation of 0.4 km (Fig. 4). Thehigh-frequency P- and S-coda waveforms recorded at seis-mographs MSVF, AFI, and WRAB in a 40-s time windowbetween D11 have an average cc coefficient approaching 0.9and above (Fig. 4a,c,e), and the lag time of the early part ofthe S-wave coda is generally less than 60 ms in absolutevalue (Fig. 4b,d,f). Similar to the demonstration of Yu et al.(unpublished manuscript, 2012), a horizontal separation of0.4 km between an earthquake pair produces a step increasein the synthetic lag time near the onset of the S wave of about70 ms in absolute value (gray line in Fig. 4g), whereas avertical separation of 0.4 km produces a step increase in syn-thetic lag time near the onset of the direct P wave of about90 ms (black line in Fig. 4g). Because the coda wavesimmediately after the direct P wave have a similar verticalslowness as the P wave, the difference in depth would havea greater influence on the time delay of the coda waves im-mediately after the direct Pwave. On the other hand, the laterpart of the coda has a similar horizontal slowness as the directP wave and is more sensitive to the effect of differential lo-cation. The observed lag time of about 60 ms near the onsetof the S wave is consistent with the synthetic lag time with ahorizontal separation of 0.4 km. Furthermore, the nonob-served step increase in lag time near the onset of the directPwave indicates that the D11 doublet is essentially located atthe same focal depth (Fig. 4b,d,g).
Estimating the Circular Rupture Zoneof an Earthquake
To determine whether similar earthquake pairs are re-peating earthquakes, that is, the earthquake pairs are colo-cated and their rupture areas overlap, it is essential toestimate the rupture area of an individual earthquake and plotthe rupture areas relative to the hypocenter. We use the em-pirical relationshipM0 � �16=7�Δσa3 to estimate the radiusof a circular fault (Kanamori and Anderson, 1975), whereM0 is seismic moment, Δσ is stress drop, and a is the radiusof a circular fault. For the 1994 Tonga deep earthquake(Mw 7.6), several seismic studies estimate stress drop torange from 13 to 26 MPa (Wiens, 2001). To be conservativein estimating the fault area, we take an upper bound of25 MPa to estimate the size of a circular fault for all deepearthquakes in the Tonga–Fiji region. While estimated stressdrop can have an uncertainty of a factor of 2, the resultantuncertainty for the estimation of the circular fault is small.For instance, for an mb 5.2 earthquake, the radius is1.11 km using Δσ of 25 MPa. The radius increases to1.38 km withΔσ of 13 MPa. The circular fault area increasesonly by 6% if we decrease Δσ from 25 MPa to 13 MPa.
Deep-Focus Repeating Earthquakes in the Tonga–Fiji Subduction Zone 1845
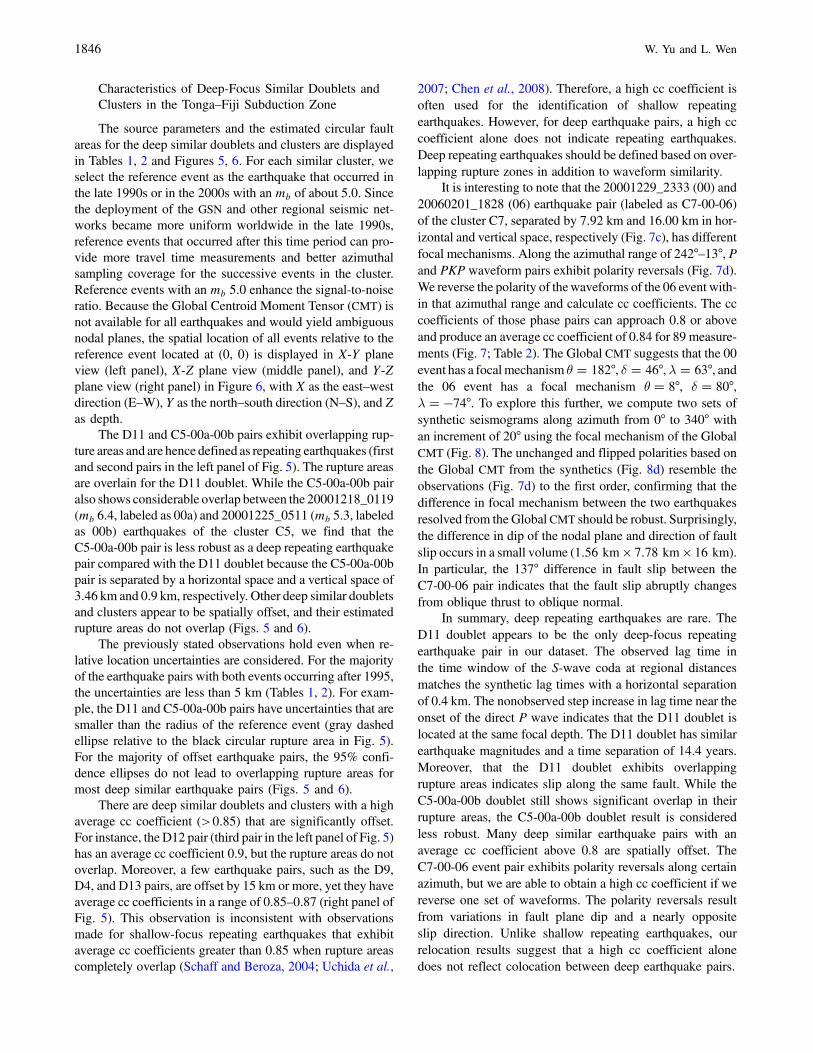
Characteristics of Deep-Focus Similar Doublets andClusters in the Tonga–Fiji Subduction Zone
The source parameters and the estimated circular faultareas for the deep similar doublets and clusters are displayedin Tables 1, 2 and Figures 5, 6. For each similar cluster, weselect the reference event as the earthquake that occurred inthe late 1990s or in the 2000s with an mb of about 5.0. Sincethe deployment of the GSN and other regional seismic net-works became more uniform worldwide in the late 1990s,reference events that occurred after this time period can pro-vide more travel time measurements and better azimuthalsampling coverage for the successive events in the cluster.Reference events with an mb 5.0 enhance the signal-to-noiseratio. Because the Global Centroid Moment Tensor (CMT) isnot available for all earthquakes and would yield ambiguousnodal planes, the spatial location of all events relative to thereference event located at (0, 0) is displayed in X-Y planeview (left panel), X-Z plane view (middle panel), and Y-Zplane view (right panel) in Figure 6, with X as the east–westdirection (E–W), Y as the north–south direction (N–S), and Zas depth.
The D11 and C5-00a-00b pairs exhibit overlapping rup-ture areas and are hence defined as repeating earthquakes (firstand second pairs in the left panel of Fig. 5). The rupture areasare overlain for the D11 doublet. While the C5-00a-00b pairalso shows considerable overlap between the 20001218_0119(mb 6.4, labeled as 00a) and 20001225_0511 (mb 5.3, labeledas 00b) earthquakes of the cluster C5, we find that theC5-00a-00b pair is less robust as a deep repeating earthquakepair compared with the D11 doublet because the C5-00a-00bpair is separated by a horizontal space and a vertical space of3.46 km and 0.9 km, respectively. Other deep similar doubletsand clusters appear to be spatially offset, and their estimatedrupture areas do not overlap (Figs. 5 and 6).
The previously stated observations hold even when re-lative location uncertainties are considered. For the majorityof the earthquake pairs with both events occurring after 1995,the uncertainties are less than 5 km (Tables 1, 2). For exam-ple, the D11 and C5-00a-00b pairs have uncertainties that aresmaller than the radius of the reference event (gray dashedellipse relative to the black circular rupture area in Fig. 5).For the majority of offset earthquake pairs, the 95% confi-dence ellipses do not lead to overlapping rupture areas formost deep similar earthquake pairs (Figs. 5 and 6).
There are deep similar doublets and clusters with a highaverage cc coefficient (>0:85) that are significantly offset.For instance, the D12 pair (third pair in the left panel of Fig. 5)has an average cc coefficient 0.9, but the rupture areas do notoverlap. Moreover, a few earthquake pairs, such as the D9,D4, and D13 pairs, are offset by 15 km or more, yet they haveaverage cc coefficients in a range of 0.85–0.87 (right panel ofFig. 5). This observation is inconsistent with observationsmade for shallow-focus repeating earthquakes that exhibitaverage cc coefficients greater than 0.85 when rupture areascompletely overlap (Schaff and Beroza, 2004; Uchida et al.,
2007; Chen et al., 2008). Therefore, a high cc coefficient isoften used for the identification of shallow repeatingearthquakes. However, for deep earthquake pairs, a high cccoefficient alone does not indicate repeating earthquakes.Deep repeating earthquakes should be defined based on over-lapping rupture zones in addition to waveform similarity.
It is interesting to note that the 20001229_2333 (00) and20060201_1828 (06) earthquake pair (labeled as C7-00-06)of the cluster C7, separated by 7.92 km and 16.00 km in hor-izontal and vertical space, respectively (Fig. 7c), has differentfocal mechanisms. Along the azimuthal range of 242°–13°, Pand PKP waveform pairs exhibit polarity reversals (Fig. 7d).We reverse the polarity of thewaveforms of the 06 event with-in that azimuthal range and calculate cc coefficients. The cccoefficients of those phase pairs can approach 0.8 or aboveand produce an average cc coefficient of 0.84 for 89 measure-ments (Fig. 7; Table 2). The Global CMT suggests that the 00event has a focal mechanism θ � 182°, δ � 46°, λ � 63°, andthe 06 event has a focal mechanism θ � 8°, δ � 80°,λ � −74°. To explore this further, we compute two sets ofsynthetic seismograms along azimuth from 0° to 340° withan increment of 20° using the focal mechanism of the GlobalCMT (Fig. 8). The unchanged and flipped polarities based onthe Global CMT from the synthetics (Fig. 8d) resemble theobservations (Fig. 7d) to the first order, confirming that thedifference in focal mechanism between the two earthquakesresolved from the Global CMT should be robust. Surprisingly,the difference in dip of the nodal plane and direction of faultslip occurs in a small volume (1:56 km × 7:78 km × 16 km).In particular, the 137° difference in fault slip between theC7-00-06 pair indicates that the fault slip abruptly changesfrom oblique thrust to oblique normal.
In summary, deep repeating earthquakes are rare. TheD11 doublet appears to be the only deep-focus repeatingearthquake pair in our dataset. The observed lag time inthe time window of the S-wave coda at regional distancesmatches the synthetic lag times with a horizontal separationof 0.4 km. The nonobserved step increase in lag time near theonset of the direct P wave indicates that the D11 doublet islocated at the same focal depth. The D11 doublet has similarearthquake magnitudes and a time separation of 14.4 years.Moreover, that the D11 doublet exhibits overlappingrupture areas indicates slip along the same fault. While theC5-00a-00b doublet still shows significant overlap in theirrupture areas, the C5-00a-00b doublet result is consideredless robust. Many deep similar earthquake pairs with anaverage cc coefficient above 0.8 are spatially offset. TheC7-00-06 event pair exhibits polarity reversals along certainazimuth, but we are able to obtain a high cc coefficient if wereverse one set of waveforms. The polarity reversals resultfrom variations in fault plane dip and a nearly oppositeslip direction. Unlike shallow repeating earthquakes, ourrelocation results suggest that a high cc coefficient alonedoes not reflect colocation between deep earthquake pairs.
1846 W. Yu and L. Wen

Discussion
Comparison with Previous Studies
Wiens and Snider (2001) discovered several deep repeat-ing earthquake clusters with short time separation using datarecorded by a regional seismographic network in theTonga–Fiji region. Several deep similar earthquakes foundin our study also appear in their study: the 19940702_0546event (mb 5.3) of the doublet D9, the 19951001_1638 event(mb 4.9) of the cluster C1, and the 19941109_1441 event(mb 4.9) of the cluster C2. But several deep repeating earth-quakes with magnitude above 4.7 found in their study are notincluded in our study. The inconsistency in deep repeatingearthquakes between the two studies may result from theinconsistent earthquake magnitude among various eventcatalogs, different datasets, and different frequency rangesused to band-pass filter the waveforms. For instance, the19950525_1645 and 19951001_1638 events are paired intheir cluster 2. But the 19950525_1645 event is not includedin this study, because the PDE catalog mb is 4.6, below ourmagnitude threshold of 4.7. Wiens and Snider (2001) pairedthe 19940702_0643 event (mb 5.1) with the 19940702_0546event in their cluster 1, but this pair is not found by ourscreening procedure. We band-pass filter the waveforms re-corded by the southwest Pacific seismographic network atregional distances and at teleseismic distances using the fre-quency range analyzed in their study (0.5– 2Hz) and our study(0.8–2 Hz) and calculate the average cc coefficient. The aver-age cc coefficient computed at 6 regional stations and 48 tele-seismic stations are 0.78 and 0.83, respectively, in thefrequency range of 0.5– 2 Hz. But the average cc coefficientcalculated at the same regional and teleseismic stations de-creases to 0.73 and 0.76, respectively, in the frequency rangeof 0.8–2Hz, below our average cc coefficient threshold of 0.8.This suggests that additional deep similar earthquake pairscan be identified if we band-pass filter the waveforms differ-ently. The strength of the Wiens and Snider (2001) study isthat they are able to identify deep repeating earthquakesand similar earthquake pairs with smaller magnitudes, and theseismographs at closer distance range greatly improve the pre-cision of relative location among deep earthquake pairs. Ourstudy has the advantage of finding similar earthquake pairswith a longer time separation by exploiting the GSNwaveformrecords.
Uncertainty in Relative Location between an EventPair due to Variations in Focal Mechanism
Variations in focal mechanism have little influence onthe travel time residual, and ultimately, the relocation results.Our procedures for searching for similar earthquake pairspreclude pairing events with large differences in waveformsand/or focal mechanisms. We find that the time error due tosmall differences in waveforms and focal mechanism is onthe order of 1–2 samples of Δt. Thus, the relocation resultsshould not be affected by this small time error. Using the
synthetic C7-00-06 pair as an example, most travel time re-siduals are 0 ms, including those phase pairs with reversepolarity (Fig. 8e). Only synthetics at azimuths of 80° and300° have a travel time residual of �10 ms (2 samples ofΔt) due to the numerical noise produced by the syntheticscomputation (small oscillations after the P wave in the solidtraces at distance of 80° and 300° in Fig. 8e). Relocation re-sults for the synthetics with different focal mechanisms be-tween the C7-00-06 pair show that the synthetic C7-00-06pair is colocated (Fig. 8c), suggesting that variations in focalmechanisms do not influence the relocation results.
Possible Interpretations
The phase transformational faulting model predicts that,after the transformation of metastable olivine to spinel, spinelbecomes superplastic, and no repeated rupture occurs at thesame spinel-filled anticracks (Green and Burnley, 1989). Thepresence of deep repeating earthquakes is not compatiblewith the prediction of the transformational faulting model.
The thermal (plastic) shear instability model can explaintemporal and spatial separation of deep similar earthquakepairs and repeating earthquakes. Thermal conductive coolingand temperature-sensitive rheology are proposed to explainthe repeating earthquakes with short time separation on theorder of days (Wiens and Snider, 2001). To account for long-er time separation on the order of years, strain heating due tointernal deformation of the descending slab is likely to lowerviscosity and allow shear instability to develop. Deep-focusrepeating earthquakes are rare compared with shallow-focusrepeating earthquakes, probably due to the fact that deepearthquakes have higher stress drop (13 MPa and above)compared with shallow-focus interplate earthquakes (1 MPa)(Kanamori and Anderson, 1975). This may explain why thesuccessive deep earthquakes occur in the adjacent areas oftheir preceding events. On the other hand, the presence ofdeep repeating earthquakes does not indicate lower stressdrop. The close proximity of events may be explained by thelocalized high strain and the associated strain heating, whichin turn facilitates thermal shear instability and produces deeprepeating earthquakes in certain regions.
Conclusion
We search for deep-focus similar earthquake pairs in theTonga–Fiji–Kermadec subduction zone using waveformsrecorded by the GSN and other regional seismic networksbetween 1990 and 2009. We find a total of 8 deep-focussimilar clusters and 18 similar doublets with an averagecc coefficient above 0.8 among more than 45,000 event pairs.These similar clusters and doublets are located in the centralpart of the Tonga–Fiji slab at the depth range of 480–650 km.Our analyses reveal that the D11 doublet satisfies the defini-tion of repeating earthquakes in that the closeness, overlap-ping rupture areas, and similarity in earthquake magnitudefor D11 are similar to those for shallow-focus repeating
Deep-Focus Repeating Earthquakes in the Tonga–Fiji Subduction Zone 1847

earthquakes. Other similar clusters and doublets are spatiallyoffset or do not have considerable overlapping rupture areas.Time separation is on the order of years for the majority ofsimilar earthquake pairs. Thermal (plastic) shear instabilitymore likely explains the presence of deep repeating earth-quakes relative to other models proposed to explain deepearthquake occurrence. To account for the wide range of timeseparation (days to years), temperature-sensitive rheology,thermal conductive cooling, and strain heating from internaldeformation of the slab jointly play important roles to reac-tivate faults or weaken adjacent areas along a shear zone.
Data and Resources
Our seismic data include: the Global SeismographicNetwork (GSN); the Global Telemetered Seismograph Net-work (GT); the GEOSCOPE (G); the new China DigitalSeismograph Network (CD, IC); the Kazakhstan SeismicNetwork (KZ); the Kyrgyz Seismic Telemetry Network(KN); the Pacific 21 Seismic Network (PS); XB 1993–1995, XP 2000–2003, YI 1998–2001, and YC 2000–2002from the Incorporated Research Institutions for SeismologyConsortium Data Management Center (IRIS-DMC) (http://www.iris.edu/hq/); the German regional seismic network(GRSN) and Grafenberg seismic network (GRF) fromthe SZGRF (http://www.szgrf.bgr.de/); and the CanadianNational Seismographic Network (CNSN) (http://earthquakescanada.nrcan.gc.ca/stnsdata/wf_index-eng.php).Earthquake focal mechanisms are obtained from the GlobalCentroid Moment Tensor Project (www.globalcmt.org/CMTsearch.html). Figures were prepared with the GenericMapping Tools software (Wessel and Smith, 1998) availableat http://www.soest.hawaii.edu/gmt/. All the cited web linkswere last accessed in February 2012.
Acknowledgments
W. Yu thanks Un Joe and Anh Ngo of the IRIS-DMC and KlausStammler of the SZGRF for access to the waveforms. Thoughtful sugges-tions from the associate editor Heather DeShon and two anonymous re-viewers greatly improved the presentation of the paper. W. Yu benefitedfrom discussions with Jiuhua Chen, David James, Alan Linde, LaetitiaMozziconacci, Selwyn Sacks, Paul Silver, Sean Solomon, Teh-Ru AlexSong, Linda Warren, and Don Weidner. This study is partially supported byDepartment of Terrestrial Magnetism, Carnegie Institution of Washington,U.S.A.; Institute of Earth Sciences, Academia Sinica, Taiwan; and theNational Science Council grants NSC- 99-2116-M-001-003- and NSC-100-2119-M-001-018-, Taiwan. The TEC contribution number is 00079.
References
Beck, S. L., P. Silver, T. C. Wallace, and D. James (1995). Directivityanalysis of the deep Bolivian earthquake of June 9, 1994, Geophys.Res. Lett. 22, 2257–2260.
Bevis, M., F. W. Taylor, B. E. Schutz, J. Recy, B. L. Isacks, S. Helu,R. Singh, E. Kendrick, J. Stowell, B. Taylor, and S. Calmant (1995).Geodetic observations of very rapid convergence and back-arcextension at the Tonga arc, Nature 374, 249–251.
Bird, P. (2003). An updated digital model of plate boundaries, Geochem.Geophys. Geosyst. 4, doi 10.1029/2001GC000252.
Chen, W. P. (1995). En-echelon ruptures during the great Bolivianearthquake of 1994, Geophys. Res. Lett. 22, 2261–2264.
Chen, W. P., and M. R. Brudzinski (2001). Evidence for a large-scale rem-nant of subducted lithosphere beneath Fiji, Science 292, 2475–2479.
Chen, K. H., R. M. Nadeau, and R. J. Rau (2008). Characteristic repeatingearthquakes in an arc-continent collision boundary zone: TheChihshang fault of eastern Taiwan, Earth Planet. Sci. Lett. 276,262–272, doi 10.1016/J.Epsl.2008.09.021.
Chen, W. P., L. R. Wu, and M. A. Glennon (1996). Characteristics ofmultiple ruptures during large deep-focus earthquakes, in Subduction:Top to Bottom, E. Bebout, W. Scholl, H. Kirby, and P. Platt (Editors),American Geophysical Union, Washington, D.C., 357–368.
Christova, C., and C. H. Scholz (2003). Stresses in the Vanuatu subductingslab: A test of two hypotheses, Geophys. Res. Lett. 30, doi 10.1029/2003GL017701.
Dziewonski, A. M., and D. L. Anderson (1981). Preliminary reference Earthmodel, Phys. Earth Planet. In. 25, 297–356.
Dziewonski, A. M., T. A. Chou, and J. H. Woodhouse (1981). Determinationof earthquake source parameters from waveform data for studies ofglobal and regional seismicity, J. Geophys. Res. 86, 2825–2852.
Ekstrom, G., A. M. Dziewonski, N. N. Maternovskaya, and M. Nettles(2003). Global seismicity of 2001: Centroid-moment tensor solutionsfor 961 earthquakes, Phys. Earth Planet. In. 136, 165–185, doi10.1016/S0031-9201(03)00030-X.
Engdahl, E. R., R. van der Hilst, and R. Buland (1998). Global teleseismicearthquake relocation with improved travel times and procedures fordepth determination, Bull. Seismol. Soc. Am. 88, 722–743.
Frohlich, C. (1987). Aftershocks and temporal clustering of deepearthquakes, J. Geophys. Res. 92, 13944–13956.
Frohlich, C. (1989). The nature of deep-focus earthquakes, Annu. Rev. EarthPlanet. Sci. 17, 227–254.
Frohlich, C. (2006). Deep Earthquakes, Cambridge University Press, NewYork, 573 pp.
Giardini, D., and J. H. Woodhouse (1984). Deep seismicity and modes ofdeformation in Tonga subduction zone, Nature 307, 505–509.
Giardini, D., and J. H. Woodhouse (1986). Horizontal shear-flow in themantle beneath the Tonga arc, Nature 319, 551–555.
Green, H. W., and P. C. Burnley (1989). A new self-organizing mechanismfor deep-focus earthquakes, Nature 341, 733–737.
Green, H. W., and H. Houston (1995). The mechanics of deep earthquakes,Annu. Rev. Earth Planet. Sci. 23, 169–213.
Green, H. W., T. E. Young, D. Walker, and C. H. Scholz (1990). Anticrack-associated faulting at very high-pressure in natural olivine, Nature 348,720–722.
Gudmundsson, O., and M. Sambridge (1998). A regionalized upper mantle(RUM) seismic model, J. Geophys. Res. 103, 7121–7136.
Hasegawa, A., N. Umino, and A. Takagi (1978). Double-planed structureof deep seismic zone in northeastern Japan arc, Tectonophysics 47,43–58.
Helmberger, D. V., and J. E. Vidale (1988). Modeling strong motionsproduced by earthquakes with two-dimensional numerical codes, Bull.Seismol. Soc. Am. 78, 109–121.
Hobbs, B. E., and A. Ord (1988). Plastic instabilities: Implications for theorigin of intermediate and deep-focus earthquakes, J. Geophys. Res.93, 10521–10540.
Holt, W. E. (1995). Flow-fields within the Tonga slab determined from themoment tensors of deep earthquakes,Geophys. Res. Lett. 22, 989–992.
Houston, H. (2007). Deep earthquakes, in Treatise on Geophysics 4: Earth-quake Seismology, G. Schubert and H. Kanamori (Editors), Elsevier,Amsterdam, 321–350.
Isacks, B., and P. Molnar (1969). Mantle earthquake mechanisms and sink-ing of lithosphere, Nature 223, 1121–1124.
Isacks, B., and P. Molnar (1971). Distribution of stresses in descending litho-sphere from a global survey of focal-mechanism solutions of mantleearthquakes, Rev. Geophys. Space Phys. 9, 103–174.
Jiao, W. J., P. G. Silver, Y. W. Fei, and C. T. Prewitt (2000). Do intermediate-and deep-focus earthquakes occur on preexisting weak zones? An
1848 W. Yu and L. Wen

examination of the Tonga subduction zone, J. Geophys. Res. 105,28125–28138.
Jung, H., H. W. Green, and L. F. Dobrzhinetskaya (2004). Intermediate-depth earthquake faulting by dehydration embrittlement with negativevolume change, Nature 428, 545–549, doi 10.1038/nature02412.
Kanamori, H., and D. L. Anderson (1975). Theoretical basis of some em-pirical relations in seismology, Bull. Seismol. Soc. Am. 65, 1073–1095.
Kanamori, H., D. L. Anderson, and T. H. Heaton (1998). Frictionalmelting during the rupture of the 1994 Bolivian earthquake, Science279, 839–842.
Karato, S., M. R. Riedel, and D. A. Yuen (2001). Rheological structure anddeformation of subducted slabs in the mantle transition zone: Implica-tions for mantle circulation and deep earthquakes, Phys. Earth Planet.In.. 127, 83–108.
Kawakatsu, H. (1985). Double seismic zone in Tonga, Nature 316, 53–55.Kennett, B. L. N., and E. R. Engdahl (1991). Travel times for global earth-
quake location and phase identification,Geophys. J. Int. 105, 429–465.Kikuchi, M., and H. Kanamori (1994). The mechanism of the deep Bolivia
earthquake of June 9, 1994, Geophys. Res. Lett. 21, 2341–2344.Kirby, S. H., S. Stein, E. A. Okal, and D. C. Rubie (1996). Metastable mantle
phase transformations and deep earthquakes in subducting oceaniclithosphere, Rev. Geophys. 34, 261–306.
McGuire, J. J., D. A. Wiens, P. J. Shore, and M. G. Bevis (1997). The March9, 1994 (Mw 7.6), deep Tonga earthquake: Rupture outside the seis-mically active slab, J. Geophys. Res. 102, 15163–15182.
Meade, C., and R. Jeanloz (1991). Deep-focus earthquakes and recycling ofwater into the Earth’s mantle, Science 252, 68–72.
Myers, S. C., T. C. Wallace, S. L. Beck, P. G. Silver, G. Zandt, J. Vandecar,and E. Minaya (1995). Implications of spatial and temporal develop-ment of the aftershock sequence for the Mw 8.3 June 9, 1994 deepBolivian earthquake, Geophys. Res. Lett. 22, 2269–2272.
Niu, F. L., P. G. Silver, R. M. Nadeau, and T. V. McEvilly (2003). Migrationof seismic scatterers associated with the 1993 Parkfield aseismic tran-sient event, Nature 426, 544–548, doi 10.1038/nature02151.
Ogawa, M. (1987). Shear instability in a viscoelastic material as the cause ofdeep-focus earthquakes, J. Geophys. Res. 92, 13801–13810.
Schaff, D. P., and G. C. Beroza (2004). Coseismic and postseismic velocitychanges measured by repeating earthquakes, J. Geophys. Res. 109, doi10.1029/2004JB003011.
Silver, P. G., S. L. Beck, T. C. Wallace, C. Meade, S. C. Myers, D. E. James,and R. Kuehnel (1995). Rupture characteristics of the deep Bolivianearthquake of 9 June 1994 and the mechanism of deep-focus earth-quakes, Science 268, 69–73.
Uchida, N., T. Matsuzawa, W. L. Ellsworth, K. Imanishi, T. Okada, and A.Hasegawa (2007). Source parameters of aM 4.8 and its accompanyingrepeating earthquakes off Kamaishi, NE Japan: Implications for thehierarchical structure of asperities and earthquake cycle, Geophys.Res. Lett. 34, doi 10.1029/2007GL031263.
Waldhauser, F., and W. L. Ellsworth (2000). A double-difference earthquakelocation algorithm: Method and application to the northern Haywardfault, California, Bull. Seismol. Soc. Am. 90, 1353–1368.
Warren, L. M., and P. G. Silver (2006). Measurement of differential rupturedurations as constraints on the source finiteness of deep-focus earth-quakes, J. Geophys. Res. 111, doi 10.1029/2005JB004001.
Warren, L. M., A. N. Hughes, and P. G. Silver (2007). Earthquake mechanicsand deformation in the Tonga-Kermadec subduction zone from faultplane orientations of intermediate- and deep-focus earthquakes, J.Geophys. Res. 112, doi 10.1029/2006JB004677.
Warren, L. M., M. A. Langstaff, and P. G. Silver (2008). Fault plane orienta-tions of intermediate-depth earthquakes in the Middle America Trench,J. Geophys. Res. 113, doi 10.1029/2007JB005028.
Weidner, D. J., J. H. Chen, Y. Q. Xu, Y. J. Wu, M. T. Vaughan, and L. Li(2001). Subduction zone rheology, Phys. Earth Planet. In.. 127,67–81.
Wen, L. (2006). Localized temporal change of the Earth’s inner core bound-ary, Science 314, 967–970, doi 10.1126/science.1131692.
Wessel, P., andW. H. F. Smith (1998). New, improved version of the GenericMapping Tools released, Eos Trans. AGU 79, 579.
Wiens, D. A. (2001). Seismological constraints on the mechanism of deepearthquakes: Temperature dependence of deep earthquake sourceproperties, Phys. Earth Planet. In. 127, 145–163.
Wiens, D. A., and J. J. McGuire (2000). Aftershocks of the March 9, 1994,Tonga earthquake: The strongest known deep aftershock sequence, J.Geophys. Res. 105, 19067–19083.
Wiens, D. A., and N. O. Snider (2001). Repeating deep earthquakes: Evi-dence for fault reactivation at great depth, Science 293, 1463–1466.
Wiens, D. A., H. J. Gilbert, B. Hicks, M. E. Wysession, and P. J. Shore(1997). Aftershock sequences of moderate-sized intermediate and deepearthquakes in the Tonga subduction zone, Geophys. Res. Lett. 24,2059–2062.
Wiens, D. A., J. J. McGuire, P. J. Shore, M. G. Bevis, K. Draunidalo, G.Prasad, and S. P. Helu (1994). A deep earthquake aftershock sequenceand implications for the rupture mechanism of deep earthquakes,Nature 372, 540–543.
Willemann, R. J., and C. Frohlich (1987). Spatial patterns of aftershocks ofdeep-focus earthquakes, J. Geophys. Res. 92, 13927–13943.
Zhang, J. F., H. W. Green, K. Bozhilov, and Z. M. Jin (2004). Faultinginduced by precipitation of water at grain boundaries in hot subductingoceanic crust, Nature 428, 633–636, doi 10.1038/Nature02475.
Institute of Earth SciencesAcademia SinicaNo. 128 Section 2, Academia RoadNangang, Taipei, 11529, [email protected]
(W.Y.)
Department of GeosciencesState University of New York at Stony BrookStony Brook, New York [email protected]
(L.W.)
Manuscript received 28 September 2011
Deep-Focus Repeating Earthquakes in the Tonga–Fiji Subduction Zone 1849