DEEP FINANCIAL INTEGRATION AND...
29
DEEP FINANCIAL INTEGRATION AND VOLATILITY Sebnem Kalemli-Ozcan University of Maryland, CEPR and NBER Bent Sorensen University of Houston and CEPR Vadym Volosovych Erasmus University Rotterdam, Tinbergen Institute and Erasmus Research Institute of Management Abstract We investigate the relationship between foreign direct ownership of firms and firm- and region- level output volatility using a novel panel data set for European countries. We document a positive, highly robust, relationship between firm-level foreign ownership and volatility of value added. This relationship holds cross-sectionally and in panels with firm fixed effects where the relationship captures within firm variation over time. Considering domestic firms with assets in foreign countries, we document that it is international diversification, rather than the nationality of the owner, that explains this positive correlation. Our results can also be found at the aggregate-level, where we show that region-level volatility is correlated positively with foreign investment in the region. We show that this positive relation between aggregate volatility and foreign investment can be explained by the the granularity of the firm size distribution and the fact that foreign ownership is concentrated among the largest firms. (JEL: E32, F15, F36, O16) Keywords: firm output volatility, foreign ownership, regional integration, aggregate output volatility. Acknowledgments: We thank Nick Bloom, Nicola Cetorelli, Philipp Harms, Jean Imbs, Jens Iversen, Jan De Loecker, Eswar Prasad, Romain Ranciere, Jae Sim, Robert Vermeulen, seminar participants at numerous universities, participants in the 5th Annual CEPR Workshop on Global Interdependence, the 2009 UCLA-DEGIT XIV Workshop, the 2009 Summer Meetings of Econometric Society in Boston, the 7th INFINITI conference in Dublin, the 2009 Midwest Macro Meetings (International Trade), the Globalization Conference at Trinity College, the 2009 NBER Universities Research Conference, the 2009 Spring Meeting of NBER-IFM group, the 2009 NBER Summer Institute-Productivity group, and the 2008 IEFS World Congress. Five thorough referees helped us improve the paper substantially. Essential parts of this paper were prepared while Sebnem Kalemli-Ozcan was visiting Bilkent University in 2007 and the European Central Bank as 2008 Duisenberg Fellow. She thanks the economists at both institutions for providing a stimulating research environment. Sebnem Kalemli-Ozcan is also grateful for financial support during 2008 from the Marie Curie Actions of the 7th Framework Programme for EU Enlargement. E-mail: [email protected] (Kalemli-Ozcan); [email protected] (Sorensen); [email protected] (Volosovych) Journal of the European Economic Association Preprint prepared on 18 October 2013 using jeea.cls v1.0.
Transcript of DEEP FINANCIAL INTEGRATION AND...
DEEP FINANCIAL INTEGRATION ANDVOLATILITY
Sebnem Kalemli-OzcanUniversity of Maryland, CEPR andNBER
Bent SorensenUniversity of Houston and CEPR
Vadym VolosovychErasmus University Rotterdam,Tinbergen Institute and Erasmus ResearchInstitute of Management
AbstractWe investigate the relationship between foreign direct ownership of firms and firm- and region-level output volatility using a novel panel data set for European countries. We document a positive,highly robust, relationship between firm-level foreign ownership and volatility of value added. Thisrelationship holds cross-sectionally and in panels with firm fixed effects where the relationshipcaptures within firm variation over time. Considering domestic firms with assets in foreign countries,we document that it is international diversification, rather than the nationality of the owner, thatexplains this positive correlation. Our results can also be found at the aggregate-level, where weshow that region-level volatility is correlated positively with foreign investment in the region. Weshow that this positive relation between aggregate volatility and foreign investment can be explainedby the the granularity of the firm size distribution and the fact that foreign ownership is concentratedamong the largest firms. (JEL: E32, F15, F36, O16)
Keywords: firm output volatility, foreign ownership, regional integration, aggregate output volatility.
Acknowledgments: We thank Nick Bloom, Nicola Cetorelli, Philipp Harms, Jean Imbs, Jens Iversen,Jan De Loecker, Eswar Prasad, Romain Ranciere, Jae Sim, Robert Vermeulen, seminar participants atnumerous universities, participants in the 5th Annual CEPR Workshop on Global Interdependence, the2009 UCLA-DEGIT XIV Workshop, the 2009 Summer Meetings of Econometric Society in Boston,the 7th INFINITI conference in Dublin, the 2009 Midwest Macro Meetings (International Trade), theGlobalization Conference at Trinity College, the 2009 NBER Universities Research Conference, the 2009Spring Meeting of NBER-IFM group, the 2009 NBER Summer Institute-Productivity group, and the 2008IEFS World Congress. Five thorough referees helped us improve the paper substantially. Essential partsof this paper were prepared while Sebnem Kalemli-Ozcan was visiting Bilkent University in 2007 andthe European Central Bank as 2008 Duisenberg Fellow. She thanks the economists at both institutions forproviding a stimulating research environment. Sebnem Kalemli-Ozcan is also grateful for financial supportduring 2008 from the Marie Curie Actions of the 7th Framework Programme for EU Enlargement.
E-mail: [email protected] (Kalemli-Ozcan); [email protected] (Sorensen);[email protected] (Volosovych)
Journal of the European Economic AssociationPreprint prepared on 18 October 2013 using jeea.cls v1.0.

Kalemli-Ozcan et al. Deep Financial Integration and Volatility 2
1. Introduction
We investigate the relationship between financial integration and volatility. Financialintegration may take many forms, such as bank lending, portfolio investment, andforeign direct investment, and the impact on volatility may differ depending onthe exact form of financial integration. We focus on foreign equity investment andestablish stylized facts about the relationship between foreign equity investment andvolatility at the firm level and at the regional level during 1996–2008. Aggregatingour firm-level data to the regional level, rather than the country level, leaves us withenough degrees of freedom for testing the statistical significance of relations andallows us to use fixed effects to neutralize effects of country-level variables, such asmonetary and fiscal policy.
We examine if foreign investors are relatively more willing to invest in risky firmsand projects by testing if there is a positive relationship between firm-level foreigninvestment and firm-level volatility. We find with very high statistical significance thatthis is so, robust to the set of countries considered and the types of firms considered.The positive relation can be a result of foreigners investing in highly volatile firms orof foreigners tilting investment towards risky, high return, projects once they invest ina firm.1 We do not sort out directions of causality but notice that either direction ofcausality requires foreign investors to be willing to accept more volatility of output.Our interpretation of the result is that foreigners are willing to accept higher volatilityof domestic firms because they are diversified internationally. As a further test of thediversification story, we investigate if domestic owners with international assets alsohold relatively more volatile domestic firms. We find that they do, consistent with ourinterpretation.2
We employ an extensive firm-level data set, the AMADEUS database (AnalyzeMajor Databases from European Sources), provided by Bureau van Dijk ElectronicPublishing (BvD) for the period 1996–2008. The data set encompasses all Europeancountries, 100+ regions and 4+ million unique firms, covering the universe oflisted firms and most privately-held firms. We define a measure of “deep” financialintegration by calculating the share of assets in our dataset, for each region, owned byforeigners. This measure captures foreign direct investment (FDI) and portfolio equityfinancing.
We first study the relation between foreign ownership and firm-level volatility anddocument a significant positive relation between the two. We find an effect which isboth statistically and economically significant: if the largest owner of a given firm is aforeign company, value added growth is 30% more volatile, where sales and operatingrevenue growth is 20% more volatile. We verify that this result is strongly robust andnot purely cross-sectional. It survives the inclusion of firm-specific dummies with the
1. See Obstfeld (1994) and Acemoglu and Zilibotti (1997).
2. Faccio, Marchica, and Mura (2011) empirically verify, using AMADEUS data, that companies withdiversified owners take more risk, as measured by return on assets.
Journal of the European Economic AssociationPreprint prepared on 18 October 2013 using jeea.cls v1.0.

Kalemli-Ozcan et al. Deep Financial Integration and Volatility 3
implication that positive changes in foreign ownership are associated with increasingvolatility.
Foreign owners are likely to own property in their domestic economy and thereforehave internationally diversified assets and we interpret their higher willingness totake on risk as a reflection of this diversification. We can examine if internationaldiversification is associated with investment in more volatile firms by testing ifdomestic firms who own foreign subsidiaries also are more volatile than otherdomestic firms. We find that such domestic firms are significantly more volatile(15% more in terms of operating revenue) implying that volatility is correlated withinternational diversification, per se.3 Verifying our results from the side of foreignassets is of interest because there is almost no country-level evidence on this issue dueto the low quality of country-level foreign asset data compared to foreign liability datafrom Balance-of-Payments Statistics.
Finally, we aggregate value added over the firms in a given region in our data inorder to examine if the volatility of our aggregated data correlates with our measure ofdeep financial integration at the regional level. Alternatively, we examine if volatilityof regional GDP from Eurostat correlates with deep financial integration. In bothcases, we find that the micro-level patterns carry over to the “macro-regional” level.The macro-level estimates from the regional analysis, using both forms of aggregation,are economically significant, explaining about one-third of the variation in the data.
We examine why the micro-level relationship survives aggregation: if foreignownership is randomly allocated across firms and firms “typically” are small, thefirm-level pattern will not carry over to aggregated data due to the law of largenumbers. However, if firm sizes are “granular,” as put forward by Gabaix (2011),with the largest firms being so large that their volatility mechanically explains partof aggregate volatility, then we expect to see firm-level patterns carry over to theaggregate level. We estimate power laws for firm sizes for each country and we findevidence of granular firm size distributions in all countries. Further, we show thatforeign ownership is concentrated in large firms. Together, these findings imply thatthe firm-level foreign-ownership/volatility relation should carry over to aggregateddata, possibly with even higher correlations, consistent with our findings.
At the macro-level, there is an extensive literature on volatility and economicintegration/development. Several theoretical papers, such as Obstfeld (1994), andAcemoglu and Zilibotti (1997), have focused on financial diversification. Thesemodels incorporate a trade-off between productivity and risk at the microeconomiclevel: firms (or owners) must choose between safe low-productivity production andrisky high-productivity production. Firms in developed countries can pool risks viafinancial assets and therefore pick high-return high-risk projects more often comparedto firms in financially underdeveloped countries. This type of model implies a negativerelationship between aggregate and firm-level volatility but a positive relationship
3. In online Appendix B, we develop a simple model illustrating this mechanism.
Journal of the European Economic AssociationPreprint prepared on 18 October 2013 using jeea.cls v1.0.
Kalemli-Ozcan et al. Deep Financial Integration and Volatility 4
between development and firm-level volatility. It also implies a steady increase in firm-level volatility and a steady decline in aggregate volatility as countries develop. Korenand Tenreyo (2013) show that firm-level volatility have declined along with aggregatevolatility (see also Davis, Haltiwanger, Jarmin, and Miranda (2007)) and develop amodel of technological diversification which can explain this.4 Levchenko, Ranciere,and Thoenig (2009) find a positive effect of financial liberalization on volatility ofproduction across industries while Kose, Prasad, and Terrones (2009) find a positiveeffect of financial liberalization on risk sharing, implying that consumption volatilitydecreases relative to output volatility and they find that output volatility increased withfinancial liberalization.
Micro-level studies focusing on real output volatility are rather rare. Thesmar andThoenig (2004) find an increase in firm-level volatility for listed French companiesfollowing financial deregulation. Correa and Suarez (2009) find the opposite result—firm-level sales and employment in a sample of listed firms become less volatile afterbank deregulation in the United States. Studies connecting micro and macro levelobservations in terms of foreign investment and volatility are non-existing till now.
Overall, we uncover a highly robust, highly significant, relation between foreignownership and volatility. Considering the size of our data set as well as the robustnessacross (European) countries and types of firms, these are stylized facts that theoreticalmodels need to confront.
The paper proceeds as follows. Section 2 describes our data. Section 3 presentsour results and Section 4 concludes.
2. Data and Construction of Variables
We construct a unique data set composed of firm-level observations from AMADEUSand region-level observations corresponding to the Nomenclature of Territorial Unitsfor Statistics of Europe (NUTS-2), provided by Eurostat. AMADEUS providesfinancial information, information on foreign and domestic owners of each firm, andlocational information which allows us to assign firm-level data to Eurostat’s NUTS-2level regions. We focus on a homogenous sample of 16 countries: Austria, Belgium,Denmark, Finland, France, Germany, Greece, Ireland, Italy, Netherlands, Norway,Portugal, Spain, Sweden, Switzerland, and the United Kingdom, for the years 1996–2008.
2.1. Firm-Level Variables
For our 16 countries, AMADEUS lists 4.7 million firms which have at least one yearwith reported assets and an outcome variable—either sales, revenue, or employment.Table A.3 in the online appendix lists the exact number of firms available by year and
4. In earlier work, Koren and Tenreyro (2007) find a robust negative relation between country-levelvolatility and development.
Journal of the European Economic AssociationPreprint prepared on 18 October 2013 using jeea.cls v1.0.
Kalemli-Ozcan et al. Deep Financial Integration and Volatility 5
variable. From the AMADEUS Financials database, we draw information for 1996–2008 and combine these data with data on foreign ownership from the AMADEUSOwnership database, using firm IDs. During this process, we lose firms for which dataare not available in both samples, as documented in Table A.3.
We work with two types of samples. In the sample of permanent firms over aspecified period, we keep all firms with outcomes non-missing in every year. In thesample of all firms, we allow firms to have missing outcomes at the beginning or theend of any given regression sample but we drop firms that have “holes” in the time-series.
Assets, sales, and operating revenue are measured in euros while employment isin persons. The distribution of these (logged) variables does not change much overtime and is very close to normal; i.e., the distribution of the data before the log-transformation is very close to log-normal. The distribution of employment is skewedwith many firms having only one employee (lawn service, painters, etc.). To limitthe potential impact of outliers, we winsorize the variables before performing ourempirical analysis.5
Volatility Measures. For robustness and comparability with previous work,we experimented with several measures of volatility. The literature on firm-levelvolatility, which mostly focuses on large publicly traded firms from data sets suchas COMPUSTAT, uses the standard deviation of outcome growth (“SD”) and this isour first measure.6 The distribution of (winsorized) standard deviations of operatingrevenue is displayed in Panel A of Figure 1. The distribution is close to normal exceptfor the pile-ups at the points of winsorizing. For small firms, measures based onstandard deviations may have bad properties because, say, a firm growing from 1 to 2employees have a growth rate of 100%.7
We study how volatility changes over time but, because our time-series dimensionis very limited, we cannot construct rolling windows of regular standard deviationsand instead we follow Morgan, Rime, and Strahan (2004) and construct a year-by-year volatility measure that can be used for panel-data analysis. First, we regress firm-level outcome growth on firm-fixed effects and year-fixed effects: (Yit−Yit−1)/Yit−1 =ϕi + γt + vit . The residuals vit reflect how much outcome growth differs from theaverage growth (across all firms) in year t and from the average growth (over time) offirm i. For each firm, we use the absolute value of these residuals as our time-varying
5. Figure A.1 in the online appendix presents the distribution, with the number of firms on the verticalaxis, of the logarithm of the firm-level operating revenue for four different years while Figure A-2 in theonline appendix shows total assets (before and after winsorizing) and other outcomes for 2006.
6. We calculate firm outcome growth as the rate of change (rather than log-differences because growth-rates at the firm-level often are so large that the usual logarithmic approximation is a bad approximationto the growth-rate.
7. In the working paper version of this article, we verify that the results are robust to using the coefficientof variation (“CV”) as an alternative measure of volatility.
Journal of the European Economic AssociationPreprint prepared on 18 October 2013 using jeea.cls v1.0.
Kalemli-Ozcan et al. Deep Financial Integration and Volatility 6
volatility measure: SDt ≡ |vit |. Intuitively, the SDt measure is the one year equivalentof the standard deviation measure, SD.8
Foreign Ownership. The AMADEUS Ownership database contains detailedinformation on owners of both listed and private firms including name, country ofresidence, and type (e.g., bank, industrial or financial company). The database refersto each record of ownership as an “ownership link” and BvD traces a link betweentwo entities even when the ownership percentage is very small (sometimes less than1%). For listed firms, very small stock holders are typically unknown.9 We computeForeign Ownership (FO) as follows. For a firm i, FOi is the sum of all percentagesof direct ownership by foreigners. For example, if a Company A has three foreignowners with stakes 10%, 15%, and 35%, respectively, FO for this company is 60%.Owners of unknown origin (typically small) are assigned to the home country. Panel Bof Figure 1 shows the distribution of foreign ownership in 2002.
The distribution is concentrated around 0 with less than 1% of firms 100% foreignowned (fully-owned affiliate of multinationals or greenfield investment). There is anoticeable spike in the number of firms around 50% ownership which likely reflectsthe desire of large investors to obtain a controlling share over 50%.10
Other Measures of Ownership. We measure each firm’s Foreign MinorityOwnership (FMO) by computing the sum of all percentages of foreign directownership after excluding the largest stake in the company; Domestic MinorityOwnership (DMO) is computed analogously, for domestic owners. If a Company Ahas two foreign owners with stakes 50% and 15%, and two domestic owners withstakes 25% and 10%, the largest owner for this company is foreign (with stake 50%),FMO is 15%, and DMO is 35%. We define a binary variable Largest Owner is Foreign(LOF) taking the value unity if the largest owner is foreign and zero otherwise.11 Themajority of these firms have a foreign ownership share of 100% while few firms havea foreign ownership share under 40% and there is a spike around 50%.
8. Using data from the ZEPHYR database, we dropped firms involved in a full merger or acquisitionwhen the merger resulted in spuriously high growth for the acquirer. The number of firms involved inM&A activity as defined in ZEPHYR is, however, a small fraction of our sample so our results do notdepend on whether we drop such firms or not.
9. Countries have different rules for when the identity of a minority owner needs to be disclosed; forexample, France, Germany, the Netherlands, and Sweden demand that listed firms disclose all ownerswith more than a 5% stake, while disclosure is required at 3% in the United Kingdom, and at 2% in Italy.See Schouten and Siems (2010).
10. In the online appendix, Figure A.3 presents the distribution of foreign ownership for different yearswhile Figure A.4 presents the distribution of foreign ownership for the subset of firms with strictly positiveforeign ownership.
11. In the rare case of a tie between the largest foreign and the largest domestic investor, we assign thevalue 1 to the LOF-dummy. Figure A.5 in the online appendix shows the distribution of foreign ownershipfor the sample of firms where the largest owner is foreign.
Journal of the European Economic AssociationPreprint prepared on 18 October 2013 using jeea.cls v1.0.
Kalemli-Ozcan et al. Deep Financial Integration and Volatility 7
Most companies have a very small degree of minority ownership and firmsare more diversified domestically than internationally.12 Domestic minority owners’share (DMO) exhibits much more variation as can be seen from the lower rightpanel. Finally, we use the number of foreign and domestic owners, respectively, asalternative measures of ownership. The number of owners can also be thought of as aconcentration measure.
Firm-Level Controls. We use firms’ total assets as a size control because largefirms potentially are better able to smooth shocks through averaging of shocks todifferent products, processes, etc. We control for firm age because young firms tend tobe more volatile. Davis, Haltiwanger, Jarmin, and Miranda (2007) show that size andage are important determinants of firm dynamics.
2.2. Region-Level Variables
We use regional NUTS-2 level data for 100+ regions from our 16 countries. Countrieswith only one NUTS-2 region during the years of our analysis, such as Denmark, areleft out of the regional analysis.
Regional Volatility Measures. We measure regional volatility in two ways. First,we aggregate firm-level outcomes (sales, operating revenue, value added) to theregional-level and calculate the volatility of the aggregated outcomes. Second, wecalculate regional volatility using data on regional GDP from Eurostat. We usenominal GDP per capita in euros, deflated by national CPI.13 Volatility is calculatedfrom formulas similar to those used at the firm-level.
Deep Financial Integration. Our measure of deep financial integration is the shareof aggregated assets owned by foreign investors FI j = ∑i FOi jTOASi j /TOAST j ,where FOi j is the percentage foreign ownership at the firm-level for a firm i located inregion j and TOAST j = ∑i TOASi j, where TOASi j is the total assets of company i.14
We proxy region size by the sum of total assets of the firms in that region and, asanother control, use annual average population series from Eurostat. It is importantto control for region size because volatility may be lower in large regions due toaveraging over a larger number of firms. These variables also partially control forselection problems in AMADEUS where some countries, such as Germany, are lesslikely to collect data for smaller firms.
2.3. Descriptive Statistics
Table 1 shows means, standard deviations, min and max values of our (filtered andwinsorized) variables at the firm and regional levels. Volatility has a mean of 0.359
12. Online Appendix Figure A.6 presents the distribution of FMO and DMO in a given year, 2006. Theupper right graph shows that among all firms with non-zero foreign ownership, the amount of foreignminority ownership is concentrated at ownership shares up to 20%.
13. We use the Harmonized Consumer Price Index from Eurostat.
14. Figure A.7 in the online appendix shows the distribution of this measure for two typical regions.
Journal of the European Economic AssociationPreprint prepared on 18 October 2013 using jeea.cls v1.0.
Kalemli-Ozcan et al. Deep Financial Integration and Volatility 8
with a standard deviation of 0.62 with a maximum of 4.66 and a minimum very closeto 0. Foreign ownership is 1.27% on average with a standard deviation of 10.8. Foreignminority ownership is typically small while domestic minority ownership is larger at4.09% with a large standard error of 14%. Firm age is 20 years on average with alarge standard deviation and a maximum of 909.15 Average firm assets are 3.8 millioneuros but the standard deviation of assets is very large and the winsorized maximumis 45.8 billion euros. Average assets of foreign owned firms are much larger, 31.78million and the maximum is 20.2 billion. Clearly foreign owned firms are typicallymuch larger than domestically owned firms.
4.3% of all firms have some foreign ownership while 6.5% are exporters and0.05% are listed. Exporters appear to have lower volatility on average, maybe dueto diversified markets. Of firms with some foreign ownership, 25.8% are fully ownedby foreigners while 17.8% are “subsidiaries;” i.e., firms with only one foreign owner.More than half of the firms with some foreign ownership have majority foreignownership.
Panel B displays region-level statistics. The time varying volatility measure, usingAMADEUS data, has a mean of 6.1% with a standard deviation of 8.5%, a minimumnear 0 and a maximum of 67%. Average volatility and its dispersion is much lowerwhen calculated from Eurostat data, likely due to the inclusion of the governmentsector in the regional GDP data. On average, about 7.16% of companies’ assets ina region are majority-owned by foreigners, with one region have more than 50%of assets controlled by foreign majority owners). Asset-weighted foreign minorityownership is small on average while domestic minority ownership is 7.15% of assets.The average amount of assets in a given region is about 15.3 billion euros. We alsoreport statistics that gauge the importance of the foreign owned firms for regionalvolatility—foreign-owned firms make up a significant share of regional economicactivity as shown; 13% of the regional assets are owned by firms that have someforeign ownership with the maximum being 69%.
3. Empirical Analysis
We start by examining the relation between firm-level ownership and volatility. Wefocus on value added, operating revenue, and sales. Value added is our preferredmeasure because GDP is the sum of the value added of agents in the economy andwhile we do not have all agents in the economy, aggregating over the value added ofthe firms that we do have, results in a significant fraction of regional GDP. Sales areoften used to study volatility, so we briefly show results for sales, but besides value
15. We checked on some of the firms of very high age and it appears that some European firms indeedare extremely old. The oldest firm is an Italian publishing house in Rome “A.T.S. Italia Editrice S.R.L."while the hotel “Hotel Pichlmayrgut Gmbh & CO KG" in Austria is incorporated in 1117 according toAMADEUS. The latter date corresponds to the date given on the coat of arms displayed at the hotel’sWEB-page (www.pichlmayrgut.at).
Journal of the European Economic AssociationPreprint prepared on 18 October 2013 using jeea.cls v1.0.

Kalemli-Ozcan et al. Deep Financial Integration and Volatility 9
added we, due to data availability, mainly show results for operating revenue whichbehaves quite similarly to sales.16
3.1. Firm-Level Specifications and Results
We regress volatility of firm outcomes on indicators of foreign and domesticownership and firm size and age. We include country (or region, see onlineAppendix A) and sector dummies implying that these regressions solely exploit firm-level variation. The firm-level regression data are winsorized at the 99% level toremove large outliers.17
3.1.1. Cross-Sectional Regressions. We estimate cross-sectional regressions usingvarious samples for calculating volatility and foreign ownership. The majority of theresults are presented for firm-level volatility measured over 2002–2008 and ownershipvariables measured in 2002. We first perform a specification search. We considera regression of volatility on the share of foreign ownership and a semi-logarithmicregression of log-volatility on (the share of) foreign ownership (where the logarithmictransformation downweigh large values). We further examine the validity of the semi-logarithmic form by including a quadratic term in foreign ownership, as in twofollowing models:
VOLi jc [log(VOLi jc)] = µc +µs +α FOi jc +β FO2i jc +X′i jcδ + εi jc , (1)
VOLi jc [log(VOLi jc)] = µc +µs +α log(1+FOi jc)+X′i jcδ + εi jc , (2)
where VOLi jc is volatility of firm i in region j in country c. µc is a country or region-specific constant and µs is a set of industry dummies that are based on the firm’sprimary industry code at the 2-digit NACE level. FOi jc is percent foreign ownership,and X′i jc is a vector of controls, namely, firm size and age. In equation (2), a number1 is added to foreign ownership before taking logs, because many firms have zeroforeign ownership. FO is measured in percent, so that the addition of unity have littleeffect (except on the very smallest ownership shares) on the interpretation of α as theelasticity of volatility with respect to the ownership share.18
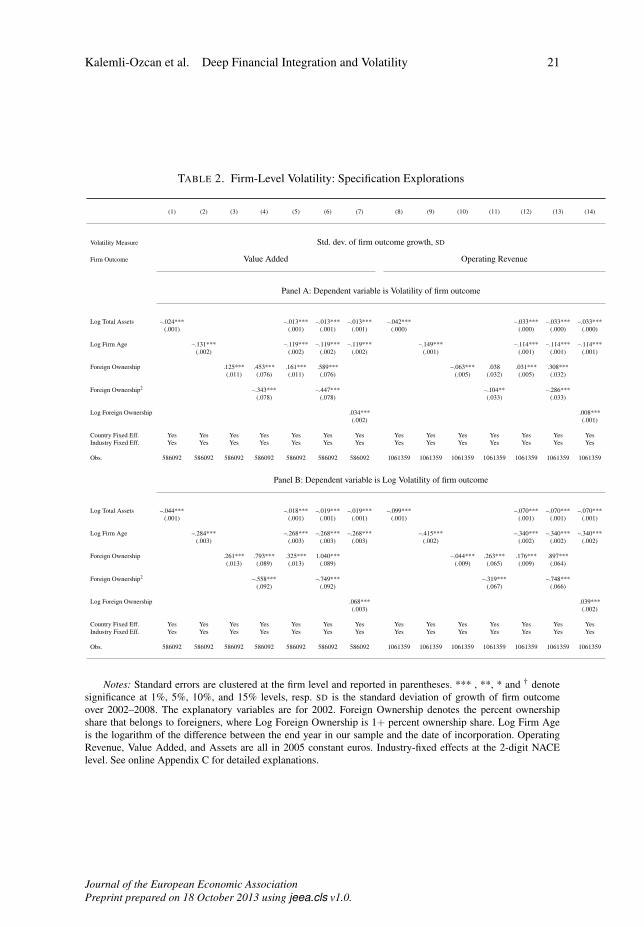
The results of Ordinary Least Squares (OLS) regressions of equations (1) and (2)are displayed in Table 2 with the left-hand side being volatility in panel A and log-volatility in panel B. The first seven columns display results for value added and thelast seven columns display results for operating revenue.
16. Sales are not available for firms in Denmark, Ireland, Norway, and the United Kingdom. We alsobriefly show results for employment, which is less appropriate for our purposes since many Europeancountries have labor regulations aimed at limiting employment volatility.
17. Direct inspection of the raw data reveals occasional large errors, such as numbers coded in, say,kroners, rather than in the millions of kroners claimed in the documentation.
18. If we did not add unity, we would need to truncate very tiny ownership shares as log(x) tends tominus infinity for x approaching 0.
Journal of the European Economic AssociationPreprint prepared on 18 October 2013 using jeea.cls v1.0.
Kalemli-Ozcan et al. Deep Financial Integration and Volatility 10
We first verify that volatility significantly declines unconditionally with firm sizein columns (1) and (8) and with firm age in columns (2) and (9). Columns (3) and(10) show that, unconditionally, volatility of value added increases significantly withforeign ownership while volatility of operating revenue declines. Columns (4) and(11) demonstrate that the relations are not linear in the foreign ownership share as thequadratic term is negative and highly significant. Columns (6) and (12) show that whenwe condition on size and age, the relation between volatility and foreign ownershipis robustly increasing and concave for both value added and operating revenue. Thisleads us to substitute the quadratic form with the logarithmic in columns (7) and (13).Comparing panels A and B, we see a more significant relation between volatility andforeign ownership in panel B and as the log-log specification is also a priori attractivebecause it downweighs outliers and provide simple elasticities, we proceed with thisspecification.
The correlation between foreign ownership and volatility will partly be due foreignowners’ production choices. Foreign owners may have more influence the largertheir ownership share is but if they already are majority owners, further increases inownership will not increase their influence as they are likely to have almost full controlalready. We therefore examine the role of majority ownership. We define LOFi jc asa dummy that takes the value 1 if the largest owner is foreign and we estimate therelation
log(VOLi jc) = µc +µs +α LOFi jc +β log(1+FOi jc) (3)
+γ LOFi jc · log(1+FOi jc)+X′i jcδ + εi jc .
This relation allows us to test if the correlation of foreign ownership with volatilitychanges when the majority owner is foreign together with the incremental effect offoreign ownership over majority ownership. For minority foreign owned companies,the marginal effect of log foreign ownership is β , while for majority foreign ownedcompanies, the marginal effect is β + γ . For robustness, we estimate the similarregression
log(VOLi jc) = µc +µs +α LOFi jc +βFOi jc + γ LOFi jc ·FOi jc +X′i jcδ + εi jc , (4)
where the share of foreign ownership is used directly.The results from estimating equation (4) are reported in columns (1) and (3)
of Table 3 for the volatility of value added and operating revenue; respectively.We observe that β + γ ≈ 0 implying that correlations don’t increase further withforeign ownership if the majority owner is already foreign. More precisely, thesemi-elasticities for firms where the largest owner is foreign implied by the resultsin columns (1) and (3) are 0.048 and –0.080, respectively, and the elasticitiesin columns (2) and (4) are 0.023 and -0.007, respectively. These numbers areeconomically small.19 The coefficient to foreign ownership is 0.474 while the
19. A formal test cannot reject that the first and fourth of those elasticities are zero.
Journal of the European Economic AssociationPreprint prepared on 18 October 2013 using jeea.cls v1.0.

Kalemli-Ozcan et al. Deep Financial Integration and Volatility 11
coefficient to the largest owner is foreign dummy is 0.258—the former coefficientimplies that a minority owner with a 49% share has a correlation of 0.232, so there isno significant discontinuity at 50% ownership.
The results, for our preferred log-log specification in columns (2) and (4), aresimilar except the results indicate some jump in the correlations with majorityownership as the coefficient to the largest owner is foreign dummy is 0.205,for value added, while the coefficient to log foreign ownership is 0.066 and0.066*log(1+49)=0.116. The results are robust and doesn’t change much if we insteaduse operating revenue in order to have a larger sample.
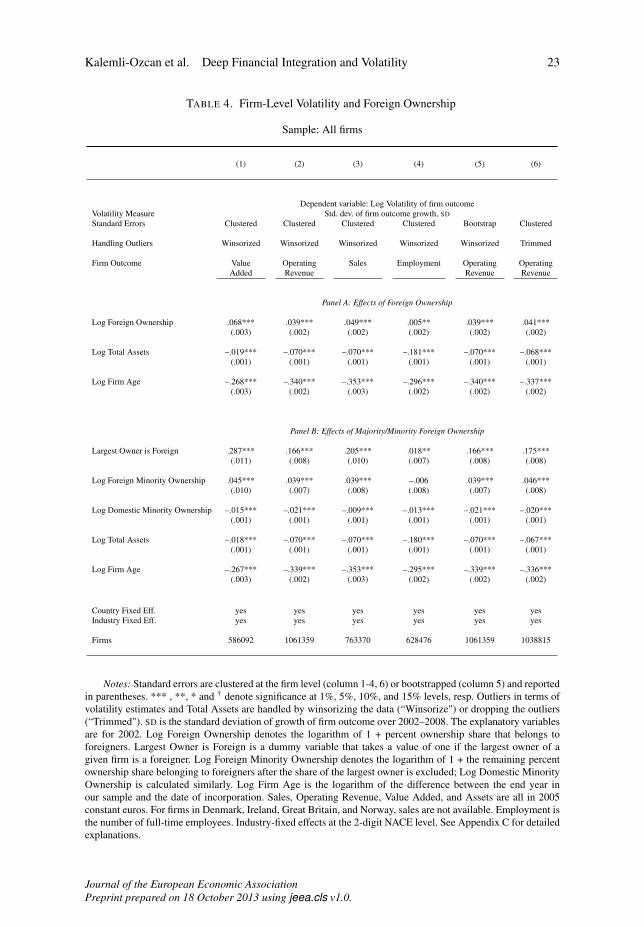
Table 4 explores if the results are robust to various choices we have made as well asexplores volatility of sales and employment. Columns (1) and (2) of panel A repeatsearlier results while column (3) considers the volatility of sales—sales are used inGabaix’s (2011) study of granularity of fluctuations. The impact of foreign ownershipon sales is fairly similar to that of operating revenue with a larger coefficient, reflectingthe operating revenue is likely to be less volatile than sales. Volatility of employment,in column (4), has a low correlation with foreign ownership which, mechanically,is consistent with the coefficient to value added being higher than that to sales: ifoperating revenue is approximately value added plus wages and employment andwages display low variance, then the volatility of operating revenue is likely to belower than that of value added. Because we have short samples, one may worryabout the precision of the estimated standard errors, so column (5) report resultswith bootstrapped standard errors for operating revenue. Those standard errors arevirtually similar to the clustered standard errors reported in other columns. The finalcolumn, (6), drops outliers (“trims”) rather than winsorizes. Trimming is better ifoutliers mainly reflect errors while winsorizing, which keeps, but downweighs, theinformation in the outliers are better if such outliers are correctly measured largevalues. It is not obvious for our data which approach is better but fortunately theestimates are little affected by the choice.
In panel B of Table 4, we repeat the regressions of panel A, but ask furtherif domestic diversification is correlated with higher volatility by including in theregression the log-share of assets owned by domestic minority owners. The coefficientto that variable is robustly negative across all the columns. The estimated coefficient isnumerically smaller than the positive coefficient for foreign minority ownership, butwe do not have an interpretation of this finding.
Our interpretation of the findings regarding foreign ownership is that foreignowners are willing to take more risk in a given domestic firm because they areinternationally diversified. It is reasonable to expect most foreign owners to holdforeign assets but we can not easily verify this with our data. However, we can examinethis hypothesis as we can identify domestic owners who hold foreign assets, andwe explore a number of specifications which include variables that capture domesticforeign ownership in Table 5 using volatility of operating revenue. Column (1) ofpanel A includes a dummy for whether the domestic firm holds foreign assets. Thepoint estimate for this variable is large at 0.142 with a very large t-statistic over12. This provides strong evidence that international diversification, rather than the
Journal of the European Economic AssociationPreprint prepared on 18 October 2013 using jeea.cls v1.0.
Kalemli-Ozcan et al. Deep Financial Integration and Volatility 12
actual nationality of owners, allow owners to take more risk in the domestic firm. (It isimportant to keep in mind here that we use unconsolidated data, which implies that wedo not examine volatility of the consolidated multinational firm; rather, we show thatthe domestic operations of multinational firms are more volatile.) In column (2), weinstead use the log of foreign assets and find a coefficient of 0.021 with high statisticalsignificance—if a domestic firm owns a significant part of a foreign firm, both firmsare more volatile than purely domestic firms in each country. (The latter statementextrapolate our results a little, because we consider foreign assets in all countries anddo not restrict the foreign asset measure to the countries we study.) In panel B ofTable 5, we use the specification with a dummy for largest owner is foreign and theresults regarding domestic foreign ownership are very similar to what we found inpanel A.
An issue with the AMADEUS data set is that coverage varies by countries,mainly in the coverage of small firms. We, therefore, in Table 6, consider a batteryof robustness checks involving different samples. In panel A, column (1), we considerexporting (typically larger) firms only—the coefficients for this, quite different, set offirms are similar, though slightly smaller. Limited liability firms in column (2) giveresults very close to our previous results. Column (3) considers firms that have non-zero foreign ownership and this column is not directly comparable with the othercolumns because we select on our variable of interest; however, we still find thatvolatility increases with the share of foreign ownership. Independent companies, incolumn (4), are similar to our base sample and firms with a single majority owner, incolumn (5), again give similar results with slightly lower estimates for the coefficientto foreign ownership. Excluding public firms, in column (6), results in a slightly largercoefficient to foreign ownership.
Panel B studies if differences in coverage across countries may impact on ourresults. Countries with good coverage only (many small firms), in column (1), giveresults very close to the baseline results and poor coverage countries, in column (2),give virtually similar results. We pick only emerging countries in Central and EasternEurope in column (3), and even for this sample our qualitative results hold: thecoefficient to foreign ownership is a little smaller (although similar for value addedas reported in the online appendix), compared to the baseline sample.
In addition to these exercises, we built several random samples which reflectthe countries economic size.20 We repeat our main regressions using three, quitedifferent, methods of sampling from the data in such a way that no countries areover-represented. We select three stratified samples, giving the countries weights inthe sampling equal to their relative GDP. The first sample is a 3% stratified samplewhere the number of firms from each country is proportional to the GDP of thatcountry (3% turn out to be number that exhausts the number of firms in the countrieswith the poorest coverage) and the second sample is a 25% stratified sample, wherethe firms from poor coverage countries are drawn with replacement (i.e., they may
20. We thank an anonymous referee for suggesting this.
Journal of the European Economic AssociationPreprint prepared on 18 October 2013 using jeea.cls v1.0.
Kalemli-Ozcan et al. Deep Financial Integration and Volatility 13
enter the sample more than once). The second method has been used in the literature.Both these methods ascertains that the results are not caused by some countries beingover-weighted. We suggest a third, propensity score, sampling method: if Germanyhas the smallest number of firms, relative to GDP, we sample the same number offirms, relative to GDP, for all other countries. However, we sample firms that aremost similar to those of Germany in terms of size and assets. This is done by usingpropensity scores which have become a popular method to obtain observationallysimilar samples, but we believe this particular use of the method is new. Either of thesesampling methods delivers estimated coefficients to foreign ownership that are verysimilar to those reported in previous tables as shown in columns (4)–(6) of panel B ofTable 6. Overall, non-random sampling across countries is unlikely to be the cause ofour findings.
3.1.2. Propensity Score Matching. Foreign owned firms differ systematically fromother firms; for example, they are larger, older, and concentrated in certain sectorsor countries. However, we can compare foreign firms to domestic firms, which areobservationally similar using propensity score matching. Propensity score matchingaddresses a self-selection problem arising if firms’ foreign-owned status is non-random. In particular, systematic correlations between foreign-ownership and otherfirm characteristics could lead to biased estimates. The matching procedure controlsfor this potential selection bias by creating an appropriate control group of domesticfirms. We then repeat our regressions using this, smaller, matched sample. This isparticularly relevant in our case as only a minority of firms have foreign owners. Thematching proceeds as follows.
We match domestic firms with no foreign ownership to the set of firms withnon-zero foreign ownership. The matching is done for the year 2002 and is basedon the estimated “propensity score,” the logistic probability of having some foreignownership. We allow the probabilities to depend on firm age, total assets, country-and industry-dummies at the 2-digit NACE level. The coefficients obtained fromthe logistic estimation reveal, not surprisingly, that firm size is the most importantdeterminant of foreign ownership (with a t-statistic of 175), age is a negative predictorof foreign ownership (with a t-statistic of around 9), and certain countries and sectorsare significantly more likely to attract foreign ownership.
Based on the estimated propensity scores, we select the sample of firmswith no foreign ownership which best match the sample of firms with non-zeroforeign ownership. We apply nearest neighbor propensity score matching withoutreplacement, a procedure which matches each firm with foreign ownership to the firmwithout foreign ownership that have the closest propensity scores.21 Average age andaverage size are similar in the matched samples.22
21. We use Stata’s psmatch2 command, version 3.0.0 written by Leuven and Sianesi (2003).
22. In Figure A.10 in the online appendix, we display the frequency distributions of estimated propensityscores for firms with non-zero foreign ownership, for the matched firms with no foreign ownership, and forthe un-matched firms with no foreign ownership. The sample of matched firms with no foreign ownership
Journal of the European Economic AssociationPreprint prepared on 18 October 2013 using jeea.cls v1.0.

Kalemli-Ozcan et al. Deep Financial Integration and Volatility 14
The results of the volatility regression using the matched sample, in Table 7,indicate that our findings are not spurious due to certain observable characteristicsbeing different for foreign owned firms because the results for the matched sampleare very similar to those obtained using the full sample. The average effect of foreignownership is estimated to be about 0.1—close to our un-matched estimates. We have24,879 firms with foreign ownership in the matched sample resulting in a matchedsample of 49,758 firms.
3.1.3. Dynamic Regressions. We explore the dynamic patterns in the data by usinga panel of permanent firms and the specification:
log(SDi jct) = µi +µt +µc ·µt +µs ·µt +α LOFi jct (5)
+β log(1+FMOi jct)+ γ log(1+DMOi jct)+X′i jctδ + εi jct ,
where SDi jct is the time-varying volatility measure for firm i in region j in country c attime t and the foreign ownership variables are time-varying and indexed similarly. µi
is a firm-specific constant which absorbs cross-sectional differences between plants,µt is a time-fixed effect, and µc · µt and µs · µt are country×year (or region×year)and industry×year fixed effects. We also include country×year and industry×yeardummies—if foreigners invest in countries/regions or sectors that they correctlyanticipate will be volatile over the relevant years, the interacted dummies will absorbthe impact of this. Of course, by including these effects we stack the cards againstfinding results because some sectors may become more volatile because they havegained in foreign diversification. If increased foreign ownership causes more volatileoutput, we should find a positive coefficient to foreign ownership. We cannot rule outcausality in the other direction, but if we found coefficients of zero in the dynamicregressions, it would hint at no causality from foreign ownership.
Table 8 shows the results. The first column in Table 8 includes year dummiesbut no other dummies. Domestic cross-ownership is now estimated to be positive—an estimate which reverses sign when we include dummy variables for country×yearand industry×year. This may reflect that domestic investors prefer certain sectors.Overall, the first two columns establish that the results found in the cross-sectionalregressions are quite robust to the change in measure and inclusion of country×yearand industry×year fixed effects.
The focus of Table 8 is columns (3)–(9), where firm-specific fixed effectsare included—these fixed effects remove permanent differences between firms andtherefore remove most of the variation in the data. The results are then driven bychanges over time and reveal if increasing foreign ownership goes hand-in-hand withincreasing volatility. It does: the largest foreign owner dummy is significant at the
displays a distribution of propensity scores that is very similar to that of firms with some foreign ownershipindicating that these samples are observationally similar. The mean of log-assets in the sample with foreignownership is 15.29 and in the matched sample of firms with no foreign ownership it is 15.33, comparedto 13.69 in the sample of unmatched firms. Formally doing the balancing tests, we find that 40 out of 48variables, that we match on, pass the test at the 5% level.
Journal of the European Economic AssociationPreprint prepared on 18 October 2013 using jeea.cls v1.0.

Kalemli-Ozcan et al. Deep Financial Integration and Volatility 15
5% level with a positive sign although the coefficient is smaller than found in thecross-section. The economic effect is not that big but considering the limited timevariation this coefficient is identified from, this result is about as strong as one couldexpect. Firm size remains significant, indicating that volatility becomes smaller asassets grow.
One may worry that the largest-owner-is-foreign dummy variable has limited timevariation and we therefore also show results, in columns (6) and (9), using overallforeign ownership.23 The dummy for largest foreign ownership takes a value of about0.03, significant at about the 5% level. The relation between foreign ownership andvolatility therefore survives in the dynamic setting but it is clearly weaker than in thecross-section. For log foreign ownership the result is similar, although significancedeclines when year 2008 is included.
In columns (8) and (9), we include the number of domestic owners, which weinterpret as a measure of ownership concentration. We find a negative effect fordomestic diversification with a t-statistic which is significant at the 10 (near 5)% level.We find a negative significant coefficient to the number of foreign owners which weinterpret to mean that foreign ownership correlates with volatility but the correlationgets watered down if foreign ownership is diffuse.
3.2. Region-Level Aggregation and Results
3.2.1. Granular Size Distributions. Next, we study if the firm-level correlationssurvive aggregation. Foreign ownership can correlate with volatility in aggregate datafor many reasons but we want to examine if aggregate volatility is a direct effect of firmlevel volatility. Firm-specific patterns may wash out in aggregated data due to the lawof large numbers if firm size is approximately normally distributed. However, Gabaix(2011) demonstrates for listed U.S. firms, that the size distribution is “granular;” i.e.,follows a power with law P(S > x) = x−ζ . If ζ is unity, size (S) will follow Zipf’s lawbut as long as ζ is numerically less than 2, the size distribution will be heavy tailedwith infinite variance and convergence of averages across firm to the theoretical meanwill be slow. In this case, the features of individual large firms may survive aggregationin moderate sized samples.
We estimated the parameter −ζ for each of the countries in the sample and theseare reported in panel A of Table 9. We find ζ ≈ 1.3 with little variation acrosscountries: firm size is robustly granular in our data. If foreign ownership is relativelylarge in the largest firms, which directly affect aggregates, we expect to see the relationbetween foreign ownership and volatility survive aggregation. Columns (3)-(5) showthat the average amount of foreign ownership is clearly larger in large firms, whilecolumn (6) confirms this using a regression which delivers standard errors, which wedo not report, but the relation is significant in all countries.
23. We found that over a two-year period, about 17% of firms change from domestic to foreign majorityowner, while about 12% changes from foreign to domestic owner, so the worry is somewhat unfounded.
Journal of the European Economic AssociationPreprint prepared on 18 October 2013 using jeea.cls v1.0.
Kalemli-Ozcan et al. Deep Financial Integration and Volatility 16
Granularity can be tested at any level of aggregation and in panel B we reportsummaries of regressions at the regional level. These estimates have coefficients closerto minus unity on average. We do not detail the findings but clearly the regional resultssupport the granularity hypothesis.
3.2.2. Aggregate Volatility. Figure A.8 in the online appendix compares thevolatility of our aggregated data and the Eurostat data. Both measures are high in2001 and decline in 2002; the trend for both measures is downwards although Eurostatvolatility has a peak in 2003 which is not found in the AMADEUS aggregate. Thevolatility of the Eurostat output data is the lowest, which is intuitive as this is theaverage over a much larger set of firms (including the government sector).
We estimate the effect of regional financial integration on aggregate volatilityusing:
log(SDAGGjct ) = µ j +µt +µc ·µt +α log(1+FI) jct +X′jctδ + ε jct , (6)
where SDAGGjct is the time-varying standard deviation of aggregated firm outcome
growth. We use value added, which can be summed over firm without double countingand for which the aggregate over our firms constitute a subset of regional GDP, andoperating revenue as an approximation to value added, which is available for morefirms (Gabaix (2011) uses sales). As before, µ j is a region-specific constant, µt is ayear-specific constant, and µc ·µt is a country×time dummy. FI is the asset-weightedaverage of the total foreign ownership (or majority foreign ownership). X′jct is thevector of controls.
The left-most three columns of Table 10 display results for the volatility ofAMADEUS aggregated outcomes while the right-most column displays results forthe volatility of regional GDP from Eurostat. Using asset-weighted foreign ownershipfor financial integration we find a coefficient of 0.784 for value added and 0.468 foroperating revenue, with sales in between. These coefficients are all significant at the5% level. We evaluate the economic significance of the coefficient by comparingthe implied variation in volatility when financial integration moves from the 10thpercentile to the 90th percentile, evaluated after controlling for other regressors, inparticular the dummy variables, to the actual variation in volatility.24 We find that the90%–10% range of integration (after controlling for other regressors) explains 12% ofthe 90%–10% range in the (raw) volatility data.
For volatility of GDP from Eurostat, we find a coefficient of 0.939, also significantat the 5% level which is quite similar to the result found for aggregated value added.The economic significance is that, for the last column, the 90-10 range of financialintegration (after controlling for other regressors) explains about 10% of the 90-10 range of volatility. The similarity of the Eurostat results to the results using the
24. If X90 and X10 denote the 90th and 10th percentile of the residual of log(1 + FI), respectively,m is mean log-volatility, and the regression coefficient is α , we consider the predicted variation to beexp(m+α ∗X90)−exp(m+α ∗X10). The variation needs to be evaluated around the mean of log-volatilitybecause the exponential function is highly non-linear.
Journal of the European Economic AssociationPreprint prepared on 18 October 2013 using jeea.cls v1.0.
Kalemli-Ozcan et al. Deep Financial Integration and Volatility 17
AMADEUS aggregate is reassuring because the Eurostat data set contains the outputof all establishments in a region while AMADEUS is a sample of firms. The maindrawback of our aggregation is that there are few firms in some regions and outlierscan therefore potentially distort the results. Another issue is that the location of afirm’s headquarters may not indicate where most of the firm’s output is produced. Thesimilarity of the two sets of results indicates that our results are not spuriously drivenby these issues. In the case of Eurostat volatility, we, with high significance, find lowervolatility in large populous regions, likely due to averaging over a larger number offirms.
4. Conclusion
We uncover a highly significant positive association between firm-level volatility andforeign ownership. A firm whose largest owner is foreign has about 30% more volatilevalued added. The positive association between foreign ownership and volatilitycarries over to the regional-level where we show that our measure of financialintegration can explain up to 12% of the variation in aggregate volatility. Our resultsalso hold in dynamic regressions with firm- and region-fixed effects.
We interpret our results as a reflection of foreign investors being more tolerant ofrisk. The positive correlation between foreign ownership and volatility can be a resultof foreigners investing in volatile firms or of foreign owners altering the productionstructure causing firms to be more volatile. We are not able to pin down directionsof causality in this paper, but both mechanisms require foreign owners to be moretolerant of domestic firm risk than average domestic owners. To sort out if the higherrisk tolerance is due to the identity of the owner (i.e., the parameters of his or her utilityfunction) or rather due to international diversification, we test if it is internationaldiversification, per se, which correlates with higher volatility. We do this by testingif domestic owners who hold foreign assets also own domestic firms with relativelyhigh volatility. The results confirm this with high statistical significance, implying thatinternational diversification allows owners to take more risk in the domestic firm.
Finally, we interpret the relation between our firm-level results and our“aggregate” level findings (positive correlation between volatility and foreignownership at the regional level) using the granularity theory developed by Gabaix(2011). Volatility of large firms will directly impact the aggregate volatility if suchfirms are very large; i.e., if the distribution of firm sizes is granular (heavy tailed). Weverify that the distributions are robustly granular across countries and we further showthat foreign ownership is concentrated among relatively large firms. Together thesefindings imply that the firm-level correlations will survive aggregation.
Our results do not imply that financial integration is undesirable because of highervolatility. Foreigners likely invest in high return-high variance projects which increasegrowth and volatility can be seen as a side-effect. It is an important avenue for futureresearch to fill in the many unexplored relations between foreign ownership and firm-level outcomes.
Journal of the European Economic AssociationPreprint prepared on 18 October 2013 using jeea.cls v1.0.
Kalemli-Ozcan et al. Deep Financial Integration and Volatility 18
REFERENCES
Acemoglu, Daron and Fabrizio Zilibotti. (1997). “Was Prometheus Unbound byChance? Risk, Diversification and Growth." Journal of Political Economy, 105,709–51.
Correa, Ricardo and Gustavo Suarez. (2009). “Firm Volatility and Banks: Evidencefrom U.S. Banking Deregulation.” Finance and Economics DiscussionSeries 2009-46. Washington, DC: Federal Reserve Board.
Davis, Steven J., John Haltiwanger, Ron Jarmin, and Javier Miranda. (2007). “Volatil-ity and Dispersion in Business Growth Rates: Publicly Traded versus PrivatelyHeld Firms.” In NBER Macroeconomics Annual 2006, ed. Daron Acemoglu,Kenneth Rogoff, and Michael Woodford, 107–80. Cambridge, MA: MIT Press.
Faccio, Mara, Maria-Teresa Marchica, and Roberto Mura. (2011). “Large Share-holder Diversification and Corporate Risk-Taking,” Review of Financial Studies,24, 3601–3641.
Gabaix, Xavier. (2011). “The Granular Origins of Aggregate Fluctuations."Econometrica, 79, 733–772.
Koren, Miklos and Silvana Tenreyro. (2007). “Volatility and Development,” Quar-terly Journal of Economics, 122, 243–87.
Koren, Miklos and Silvana Tenreyro. (2013). “Technological Diversification." Amer-ican Economic Review, 103, 378–414.
Kose, Ayhan M., Eswar Prasad, and Marco E. Terrones. (2009). “Does FinancialGlobalization Promote Risk Sharing?” Journal of Development Economics, 89,258–270.
Leuven, Edwin and Barbara Sianesi. (2003). “PSMATCH2: Stata Module to Per-form Full Mahalanobis and Propensity Score Matching, Common Support Graph-ing, and Covariate Imbalance Testing."http://ideas.repec.org/c/boc/bocode/s432001.html.
Levchenko Andrei A., Romain Ranciere, and Mathias Thoenig. (2009). “Growth andRisk at the Industry-level: The Real Effects of Financial Liberalization.” Journalof Development Economics, 89, 210–222.
Morgan, Donald, Bertrand Rime, and Philip E. Strahan. (2004). “Bank Integrationand State Business Cycles." Quarterly Journal of Economics, 119, 1555–85.
Obstfeld, Maurice. (1994). “Risk-Taking, Global Diversification, and Growth."American Economic Review, 84, 1310–29.
Schouten, Michael C. and Mathias M. Siems. (2010). “The Evolution of OwnershipDisclosure Rules Across Countries," Journal of Corporate Law Studies, 10, 451–483.
Thesmar, David and Mathias Thoenig. (2004). “Financial Market Development andthe Rise in Firm Level Uncertainty." CEPR Discussion Paper 4761.
Journal of the European Economic AssociationPreprint prepared on 18 October 2013 using jeea.cls v1.0.

Kalemli-Ozcan et al. Deep Financial Integration and Volatility 19
Panel A: Distribution of Volatility (Operating Revenue)
0
10000
20000
30000
40000N
umbe
r of F
irms
−4 −2 0 2Log Volatility, SD
skewness 0.410
kurtosis 3.572
Panel B: Distribution of Foreign Ownership
20
25
30
35
40
45
50
ntage Share of Firms
Zero Foreign
Owne
rship
0
5
10
15
up to 20 21‐40 41‐60 61 ‐ 80 81‐99.99 '100
Percen
with Non
‐Z
Ownership Percentage
FIGURE 1. Distribution of Firm-Level Volatility and Foreign OwnershipNotes: Volatility is the standard deviation of sales-growth 2002–2008, winsorized at 1 and 99%.
Distribution of Foreign Ownership is for the sub-sample of firms with non-zero foreign ownership in2002.
Journal of the European Economic AssociationPreprint prepared on 18 October 2013 using jeea.cls v1.0.
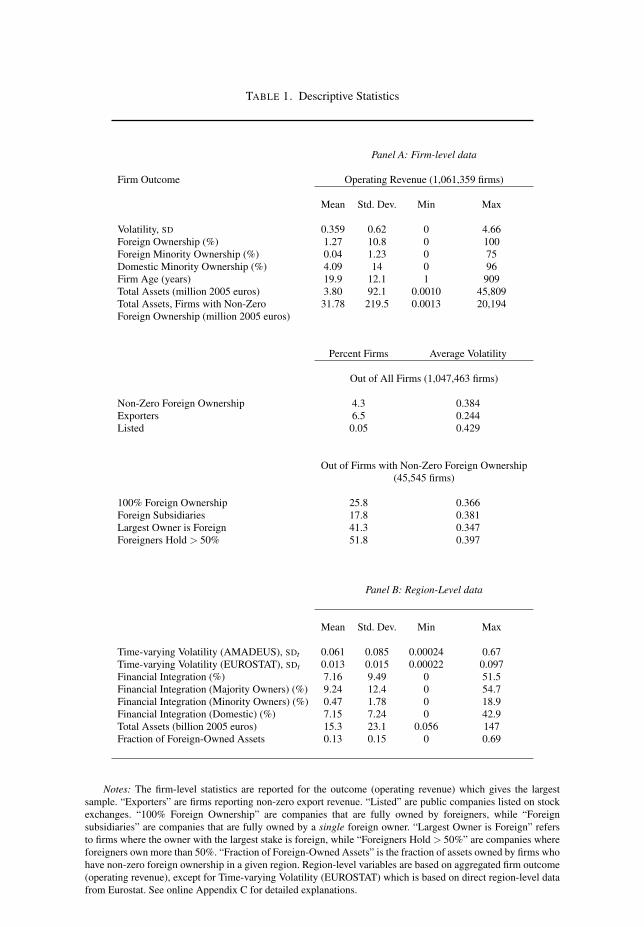
TABLE 1. Descriptive Statistics
Panel A: Firm-level data
Firm Outcome Operating Revenue (1,061,359 firms)
Mean Std. Dev. Min Max
Volatility, SD 0.359 0.62 0 4.66Foreign Ownership (%) 1.27 10.8 0 100Foreign Minority Ownership (%) 0.04 1.23 0 75Domestic Minority Ownership (%) 4.09 14 0 96Firm Age (years) 19.9 12.1 1 909Total Assets (million 2005 euros) 3.80 92.1 0.0010 45,809Total Assets, Firms with Non-Zero 31.78 219.5 0.0013 20,194Foreign Ownership (million 2005 euros)
Percent Firms Average Volatility
Out of All Firms (1,047,463 firms)
Non-Zero Foreign Ownership 4.3 0.384Exporters 6.5 0.244Listed 0.05 0.429
Out of Firms with Non-Zero Foreign Ownership(45,545 firms)
100% Foreign Ownership 25.8 0.366Foreign Subsidiaries 17.8 0.381Largest Owner is Foreign 41.3 0.347Foreigners Hold > 50% 51.8 0.397
Panel B: Region-Level data
Mean Std. Dev. Min Max
Time-varying Volatility (AMADEUS), SDt 0.061 0.085 0.00024 0.67Time-varying Volatility (EUROSTAT), SDt 0.013 0.015 0.00022 0.097Financial Integration (%) 7.16 9.49 0 51.5Financial Integration (Majority Owners) (%) 9.24 12.4 0 54.7Financial Integration (Minority Owners) (%) 0.47 1.78 0 18.9Financial Integration (Domestic) (%) 7.15 7.24 0 42.9Total Assets (billion 2005 euros) 15.3 23.1 0.056 147Fraction of Foreign-Owned Assets 0.13 0.15 0 0.69
Notes: The firm-level statistics are reported for the outcome (operating revenue) which gives the largestsample. “Exporters” are firms reporting non-zero export revenue. “Listed” are public companies listed on stockexchanges. “100% Foreign Ownership” are companies that are fully owned by foreigners, while “Foreignsubsidiaries” are companies that are fully owned by a single foreign owner. “Largest Owner is Foreign” refersto firms where the owner with the largest stake is foreign, while “Foreigners Hold > 50%” are companies whereforeigners own more than 50%. “Fraction of Foreign-Owned Assets” is the fraction of assets owned by firms whohave non-zero foreign ownership in a given region. Region-level variables are based on aggregated firm outcome(operating revenue), except for Time-varying Volatility (EUROSTAT) which is based on direct region-level datafrom Eurostat. See online Appendix C for detailed explanations.
Kalemli-Ozcan et al. Deep Financial Integration and Volatility 21
TABLE 2. Firm-Level Volatility: Specification Explorations
(1) (2) (3) (4) (5) (6) (7) (8) (9) (10) (11) (12) (13) (14)
Volatility Measure Std. dev. of firm outcome growth, SD
Firm Outcome Value Added Operating Revenue
Panel A: Dependent variable is Volatility of firm outcome
Log Total Assets –.024*** –.013*** –.013*** –.013*** –.042*** –.033*** –.033*** –.033***(.001) (.001) (.001) (.001) (.000) (.000) (.000) (.000)
Log Firm Age –.131*** –.119*** –.119*** –.119*** –.149*** –.114*** –.114*** –.114***(.002) (.002) (.002) (.002) (.001) (.001) (.001) (.001)
Foreign Ownership .125*** .453*** .161*** .589*** –.063*** .038 .031*** .308***(.011) (.076) (.011) (.076) (.005) (.032) (.005) (.032)
Foreign Ownership2 –.343*** –.447*** –.104** –.286***(.078) (.078) (.033) (.033)
Log Foreign Ownership .034*** .008***(.002) (.001)
Country Fixed Eff. Yes Yes Yes Yes Yes Yes Yes Yes Yes Yes Yes Yes Yes YesIndustry Fixed Eff. Yes Yes Yes Yes Yes Yes Yes Yes Yes Yes Yes Yes Yes Yes
Obs. 586092 586092 586092 586092 586092 586092 586092 1061359 1061359 1061359 1061359 1061359 1061359 1061359
Panel B: Dependent variable is Log Volatility of firm outcome
Log Total Assets –.044*** –.018*** –.019*** –.019*** –.099*** –.070*** –.070*** –.070***(.001) (.001) (.001) (.001) (.001) (.001) (.001) (.001)
Log Firm Age –.284*** –.268*** –.268*** –.268*** –.415*** –.340*** –.340*** –.340***(.003) (.003) (.003) (.003) (.002) (.002) (.002) (.002)
Foreign Ownership .261*** .793*** .325*** 1.040*** –.044*** .263*** .176*** .897***(.013) (.089) (.013) (.089) (.009) (.065) (.009) (.064)
Foreign Ownership2 –.558*** –.749*** –.319*** –.748***(.092) (.092) (.067) (.066)
Log Foreign Ownership .068*** .039***(.003) (.002)
Country Fixed Eff. Yes Yes Yes Yes Yes Yes Yes Yes Yes Yes Yes Yes Yes YesIndustry Fixed Eff. Yes Yes Yes Yes Yes Yes Yes Yes Yes Yes Yes Yes Yes Yes
Obs. 586092 586092 586092 586092 586092 586092 586092 1061359 1061359 1061359 1061359 1061359 1061359 1061359
Notes: Standard errors are clustered at the firm level and reported in parentheses. *** , **, * and † denotesignificance at 1%, 5%, 10%, and 15% levels, resp. SD is the standard deviation of growth of firm outcomeover 2002–2008. The explanatory variables are for 2002. Foreign Ownership denotes the percent ownershipshare that belongs to foreigners, where Log Foreign Ownership is 1+ percent ownership share. Log Firm Ageis the logarithm of the difference between the end year in our sample and the date of incorporation. OperatingRevenue, Value Added, and Assets are all in 2005 constant euros. Industry-fixed effects at the 2-digit NACElevel. See online Appendix C for detailed explanations.
Journal of the European Economic AssociationPreprint prepared on 18 October 2013 using jeea.cls v1.0.

Kalemli-Ozcan et al. Deep Financial Integration and Volatility 22
TABLE 3. Firm-Level Volatility and Foreign Ownership: Interaction Effects
(1) (2) (3) (4)
Dependent variable is Log Volatility of firm outcomeVolatility Measure Std. dev. of firm outcome growth, SDFirm Outcome Value Added Operating Revenue
Log Total Assets –.019*** –.019*** –.071*** –.071***(.001) (.001) (.001) (.001)
Log Firm Age –.268*** –.268*** –.340*** –.340***(.003) (.003) (.002) (.002)
Largest Owner is Foreign .258*** .205*** .241*** .201***(.028) (.034) (.020) (.024)
Foreign Ownership .474*** .426***(.112) (.087)
Foreign Ownership× –.426*** –.506***Largest Owner is Foreign (.116) (.090)
Log Foreign Ownership .066*** .052***(.012) (.009)
Log Foreign Ownership× –.043** –.059***Largest Owner is Foreign (.014) (.011)
Country Fixed Eff. Yes Yes Yes YesIndustry Fixed Eff. Yes Yes Yes Yes
Obs. 586092 586092 1061359 1061359
Notes: Standard errors are clustered at the firm level and reported in parentheses. *** , **, * and † denotesignificance at 1%, 5%, 10%, and 15% levels, resp. SD is the standard deviation of growth of firm outcome over2002–2008. The explanatory variables are for 2002. Largest Owner is Foreign is a dummy variable that takes avalue of one if the largest owner of a given firm is a foreigner. Foreign Ownership denotes the percent ownershipshare that belongs to foreigners. Log Firm Age is the logarithm of the difference between the end year in oursample and the date of incorporation. Operating Revenue, Value Added, and Assets are all in 2005 constant euros.Industry-fixed effects at the 2-digit NACE level. See Appendix C for detailed explanations.
Journal of the European Economic AssociationPreprint prepared on 18 October 2013 using jeea.cls v1.0.
Kalemli-Ozcan et al. Deep Financial Integration and Volatility 23
TABLE 4. Firm-Level Volatility and Foreign Ownership
Sample: All firms
(1) (2) (3) (4) (5) (6)
Dependent variable: Log Volatility of firm outcomeVolatility Measure Std. dev. of firm outcome growth, SDStandard Errors Clustered Clustered Clustered Clustered Bootstrap Clustered
Handling Outliers Winsorized Winsorized Winsorized Winsorized Winsorized Trimmed
Firm Outcome Value Operating Sales Employment Operating OperatingAdded Revenue Revenue Revenue
Panel A: Effects of Foreign Ownership
Log Foreign Ownership .068*** .039*** .049*** .005** .039*** .041***(.003) (.002) (.002) (.002) (.002) (.002)
Log Total Assets –.019*** –.070*** –.070*** –.181*** –.070*** –.068***(.001) (.001) (.001) (.001) (.001) (.001)
Log Firm Age –.268*** –.340*** –.353*** –.296*** –.340*** –.337***(.003) (.002) (.003) (.002) (.002) (.002)
Panel B: Effects of Majority/Minority Foreign Ownership
Largest Owner is Foreign .287*** .166*** .205*** .018** .166*** .175***(.011) (.008) (.010) (.007) (.008) (.008)
Log Foreign Minority Ownership .045*** .039*** .039*** –.006 .039*** .046***(.010) (.007) (.008) (.008) (.007) (.008)
Log Domestic Minority Ownership –.015*** –.021*** –.009*** –.013*** –.021*** –.020***(.001) (.001) (.001) (.001) (.001) (.001)
Log Total Assets –.018*** –.070*** –.070*** –.180*** –.070*** –.067***(.001) (.001) (.001) (.001) (.001) (.001)
Log Firm Age –.267*** –.339*** –.353*** –.295*** –.339*** –.336***(.003) (.002) (.003) (.002) (.002) (.002)
Country Fixed Eff. yes yes yes yes yes yesIndustry Fixed Eff. yes yes yes yes yes yes
Firms 586092 1061359 763370 628476 1061359 1038815
Notes: Standard errors are clustered at the firm level (column 1-4, 6) or bootstrapped (column 5) and reportedin parentheses. *** , **, * and † denote significance at 1%, 5%, 10%, and 15% levels, resp. Outliers in terms ofvolatility estimates and Total Assets are handled by winsorizing the data (“Winsorize") or dropping the outliers(“Trimmed"). SD is the standard deviation of growth of firm outcome over 2002–2008. The explanatory variablesare for 2002. Log Foreign Ownership denotes the logarithm of 1 + percent ownership share that belongs toforeigners. Largest Owner is Foreign is a dummy variable that takes a value of one if the largest owner of agiven firm is a foreigner. Log Foreign Minority Ownership denotes the logarithm of 1 + the remaining percentownership share belonging to foreigners after the share of the largest owner is excluded; Log Domestic MinorityOwnership is calculated similarly. Log Firm Age is the logarithm of the difference between the end year inour sample and the date of incorporation. Sales, Operating Revenue, Value Added, and Assets are all in 2005constant euros. For firms in Denmark, Ireland, Great Britain, and Norway, sales are not available. Employment isthe number of full-time employees. Industry-fixed effects at the 2-digit NACE level. See Appendix C for detailedexplanations.
Journal of the European Economic AssociationPreprint prepared on 18 October 2013 using jeea.cls v1.0.

TABLE 5. Firm-Level Volatility and Ownership of Foreign Assets
(1) (2) (3)
Dependent Variable: Log Volatility of Firm Outcome
Volatility Measure Std. dev. of firm outcome growth, SDFirm Outcome Operating Revenue
Panel A: Effects of Foreign Liabilities and Foreign Assets
Log Foreign Ownership .040*** .039*** .039***(.002) (.002) (.002)
Domestic Firm with Foreign Assets .142***(.011)
Log Foreign Assets of Domestic Firm .021***(.005)
Log Number of Foreign Firms Owned .121***by Domestic Firm (.023)
Log Total Assets –.071*** –.071*** –.071***(.001) (.001) (.001)
Log Firm Age –.340*** –.340*** –.340***(.002) (.002) (.002)
Country Fixed Eff. Yes Yes YesIndustry Fixed Eff. Yes Yes YesFirms 1,061,359 1,061,359 1,061,359
Panel B: Effects of Minority Foreign Liabilities and Foreign Assets
Largest Owner is Foreign .170*** .166*** .167***(.008) (.008) (.008)
Log Foreign Minority Ownership .040*** .039*** .039***(.007) (.007) (.007)
Log Domestic Minority Ownership –.021*** –.021*** –.021***(.001) (.001) (.001)
Domestic Firm with Foreign Assets .144***(.011)
Log Domestic Minority Ownership× .025**Domestic Firm with Foreign Assets (.009)
Log Foreign Assets of Domestic Firm .021***(.005)
Log Total Assets –.071*** –.070*** –.070***(.001) (.001) (.001)
Log Firm Age –.339*** –.339*** –.339***(.002) (.002) (.002)
Country Fixed Eff. Yes Yes YesIndustry Fixed Eff. Yes Yes YesFirms 1,061,359 1,061,359 1,061,359
Notes: Standard errors are clustered at the firm level and reported in parentheses. *** , **, * and † denotesignificance at 1%, 5%, 10%, and 15% levels, resp. SD is the standard deviation of growth of firm outcomeover 2002–2008. The explanatory variables are for 2002, unless specified otherwise. Log Foreign Ownershipdenotes the logarithm of 1 + percent ownership share that belongs to foreigners. Largest Owner is Foreign is adummy variable that takes a value of one if the largest owner of a given firm is a foreigner. Log Foreign MinorityOwnership denotes the logarithm of 1 + the remaining percent ownership share belonging to foreigners after theshare of the largest owner is excluded; Log Domestic Minority Ownership is calculated similarly. Domestic Firmwith Foreign Assets is a dummy variable that takes a value of one if a given domestic company owns companiesoverseas in at least one year over 2002–2008. Log Foreign Assets of Domestic Firm the logarithm of 1 + averagepercent ownership share that belongs to a given domestic company overseas, the latter computed as the sum ofall ownership stakes divided by number of overseas companies owned. Log Number of Foreign Firms Owned byDomestic Firm is 1 + the number of overseas companies owned by a given domestic company. Log Firm Ageis the logarithm of the difference between the end year in our sample and the date of incorporation. OperatingRevenue and Assets are in 2005 constant euros. Industry-fixed effects at the 2-digit NACE level. See Appendix Cfor detailed explanations.

TABLE 6. Firm-Level Volatility and Foreign Ownership: RobustnessSample: All firms, 2002–2008
(1) (2) (3) (4) (5) (6)
Dependent Variable: Log Volatility of firm outcomeVolatility Measure Std. dev. of firm outcome growth, SDFirm Outcome Operating Revenue
Panel A: Types of Companies
Firm Sub-sample Exporters Limited Foreign Independent Majority ExcludingLiability Owned Companies stake Public
>50% Sectors
Log Foreign Ownership .026*** .036*** .005** .046*** .029*** .039***(.003) (.002) (.003) (.008) (.002) (.002)
Log Total Assets –.105*** –.072*** –.076*** –.071*** –.087*** –.071***(.002) (.001) (.003) (.002) (.002) (.001)
Log Firm Age –.315*** –.342*** –.346*** –.392*** –.209*** –.339***(.007) (.002) (.009) (.006) (.005) (.002)
Firms 68440 973516 45545 159633 206456 1010348
Panel B: Selection Issues
Firm Sub-sample Good Poor CEE 3% Random 25% Random 25% RandomCoverage Coverage Countries Sample Sample with P.S.MatchingCountries Countries Replacement Sample
Log Foreign Ownership .039*** .035*** .023*** .057*** .067*** .045***(.002) (.005) (.006) (.007) (.002) (.005)
Log Total Assets –.070*** –.072*** –.078*** –.073*** –.074*** –.060***(.001) (.003) (.003) (.004) (.001) (.003)
Log Firm Age –.350*** –.227*** –.254*** –.238*** –.217*** –.253***(.002) (.007) (.013) (.012) (.004) (.010)
Firms 987841 73518 23923 30678 265613 41252
Country Fixed Eff. Yes Yes Yes Yes Yes YesIndustry Fixed Eff. Yes Yes Yes Yes Yes Yes
Notes: Standard errors are clustered at the firm level and reported in parentheses. *** , **, * and †
denote significance at 1%, 5%, 10%, and 15% levels, resp. SD is the standard deviation of growth of firmoutcome over 2002–2008. The explanatory variables are for 2002, unless noted otherwise. Outcomes are inin 2005 constant euros. The EXPORTERS sample consists of firms reporting non-zero export revenue in 2002.The LIMITED LIABILITY sample are public or private limited liability companies; the excluded companiescorrespond to partnerships, sole proprietorships, and cooperatives. The FOREIGN OWNED sample is composedof firms with non-zero foreign ownership. The INDEPENDENT COMPANIES sample consists of firms classifiedby BvD as “independent." These companies have no shareholder owning more than 50%. For the MAJORITYSTAKE >50% sample, we drop firms where the ownership percentage of largest owner is less than 50%.The EXCLUDING PUBLIC SECTORS sample drops firms in government and public-regulated sectors, whichare: Electricity, gas and water (NACE1=E), Public administration and defence, compulsory social security(NACE1=L), Other community, social and personal service activities (NACE1=O), Extra-territorial organizationsand bodies (NACE1=Q). The columns Good/Poor Coverage Countries split the sample into companies fromcountries with relatively good AMADEUS firm coverage (Belgium, Denmark, Finland, France, Norway, Spain,Sweden, and the United Kingdom.) and from countries with relatively poor coverage (Austria, Germany, Greece,Ireland, Italy, Netherlands, Portugal, and Switzerland). Central and Eastern European (CEE) countries are CzechRepublic, Estonia, Hungary, Latvia, Lithuania, Poland, and Slovakia; age data is missing for Slovenia. 3%Random Sample is is a 3% stratified sample where the number of firms from each country is proportional to theGDP of that country. 25% Random Sample with Replacement is a 25% stratified sample, where the firms frompoor coverage countries are drawn with replacement. 25% Random P.S. Matching Sample is a 25% propensityscore, sampling method where we select a country with the smallest number of firms, relative to GDP, and thenwe sample the same number of firms, relative to GDP, for all other countries using propensity score matching oncompany size, age, industry and foreign ownership. See online Appendix D for more details on random sampling.

Kalemli-Ozcan et al. Deep Financial Integration and Volatility 26
TABLE 7. Firm-Level Vol. and Foreign Ownership: Propensity Score Matching
(1) (2)
Dependent Variable:Log Volatility of Firm Outcome
Volatility Measure Std. dev. of firm outcome growth, SDFirm Outcome Operating Revenue
Firm Sample All firms Large firmsAverage Effect of .137*** .121***Foreign Ownership (.006) (.009)
Regressions using Matched Sample
Largest Owner is Foreign .105*** .088***(.010) (.014)
Log Foreign Minority Ownership .029*** .024**(.008) (.011)
Log Domestic Minority Ownership –.014*** –.008(.005) (.007)
Log Total Assets –.076*** –.148***(.003) (.010)
Log Firm Age –.235*** –.165***(.009) (.011)
Country Fixed Eff. yes yesIndustry Fixed Eff. yes yes
Firms 49,758 19,426
Notes: Standard errors are clustered at the firm level and reported in parentheses. *** , **, * and † denotesignificance at levels 1%, 5%, 10%, resp. Matching is performed by Stata psmatch2 command (version 4.0.6)on firm age, total assets, country, and industry at the 2-digit NACE level. In col (1), the matching is based on the“All firms" sample; in col (2) it is based on the “Large firms" sample. SD is the standard deviation of growth ofthe firm outcome over 2002–2008. The explanatory variables are for 2002. The upper panel reports the estimateof the treatment effect on the treated. In the lower panel, we estimate our main OLS specification using thematched sample. Foreign Ownership denotes the percent ownership share that belongs to foreigners. LargestOwner is Foreign is a dummy variable that takes a value of one if the largest owner of a given firm is a foreigner.Log Foreign Minority Ownership denotes the logarithm of 1 + the remaining percent ownership share belongingto foreigners after the share of the largest owner is excluded; Log Domestic Minority Ownership is calculatedsimilarly. Log Firm Age is the logarithm of the difference between the end year in our sample and the date ofincorporation. Operating Revenue and Assets are in 2005 constant euros. Industry-fixed effects at the 2-digitNACE level. See online Appendix C for detailed explanations.
Journal of the European Economic AssociationPreprint prepared on 18 October 2013 using jeea.cls v1.0.
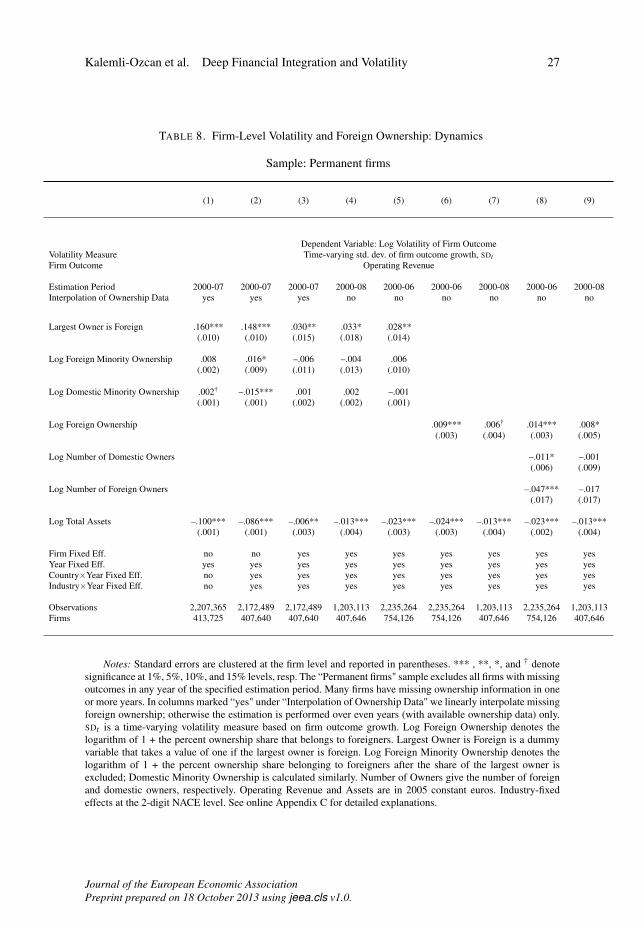
Kalemli-Ozcan et al. Deep Financial Integration and Volatility 27
TABLE 8. Firm-Level Volatility and Foreign Ownership: Dynamics
Sample: Permanent firms
(1) (2) (3) (4) (5) (6) (7) (8) (9)
Dependent Variable: Log Volatility of Firm OutcomeVolatility Measure Time-varying std. dev. of firm outcome growth, SDtFirm Outcome Operating Revenue
Estimation Period 2000-07 2000-07 2000-07 2000-08 2000-06 2000-06 2000-08 2000-06 2000-08Interpolation of Ownership Data yes yes yes no no no no no no
Largest Owner is Foreign .160*** .148*** .030** .033* .028**(.010) (.010) (.015) (.018) (.014)
Log Foreign Minority Ownership .008 .016* –.006 –.004 .006(.002) (.009) (.011) (.013) (.010)
Log Domestic Minority Ownership .002† –.015*** .001 .002 –.001(.001) (.001) (.002) (.002) (.001)
Log Foreign Ownership .009*** .006† .014*** .008*(.003) (.004) (.003) (.005)
Log Number of Domestic Owners –.011* –.001(.006) (.009)
Log Number of Foreign Owners –.047*** –.017(.017) (.017)
Log Total Assets –.100*** –.086*** –.006** –.013*** –.023*** –.024*** –.013*** –.023*** –.013***(.001) (.001) (.003) (.004) (.003) (.003) (.004) (.002) (.004)
Firm Fixed Eff. no no yes yes yes yes yes yes yesYear Fixed Eff. yes yes yes yes yes yes yes yes yesCountry×Year Fixed Eff. no yes yes yes yes yes yes yes yesIndustry×Year Fixed Eff. no yes yes yes yes yes yes yes yes
Observations 2,207,365 2,172,489 2,172,489 1,203,113 2,235,264 2,235,264 1,203,113 2,235,264 1,203,113Firms 413,725 407,640 407,640 407,646 754,126 754,126 407,646 754,126 407,646
Notes: Standard errors are clustered at the firm level and reported in parentheses. *** , **, *, and † denotesignificance at 1%, 5%, 10%, and 15% levels, resp. The “Permanent firms" sample excludes all firms with missingoutcomes in any year of the specified estimation period. Many firms have missing ownership information in oneor more years. In columns marked “yes" under “Interpolation of Ownership Data" we linearly interpolate missingforeign ownership; otherwise the estimation is performed over even years (with available ownership data) only.SDt is a time-varying volatility measure based on firm outcome growth. Log Foreign Ownership denotes thelogarithm of 1 + the percent ownership share that belongs to foreigners. Largest Owner is Foreign is a dummyvariable that takes a value of one if the largest owner is foreign. Log Foreign Minority Ownership denotes thelogarithm of 1 + the percent ownership share belonging to foreigners after the share of the largest owner isexcluded; Domestic Minority Ownership is calculated similarly. Number of Owners give the number of foreignand domestic owners, respectively. Operating Revenue and Assets are in 2005 constant euros. Industry-fixedeffects at the 2-digit NACE level. See online Appendix C for detailed explanations.
Journal of the European Economic AssociationPreprint prepared on 18 October 2013 using jeea.cls v1.0.
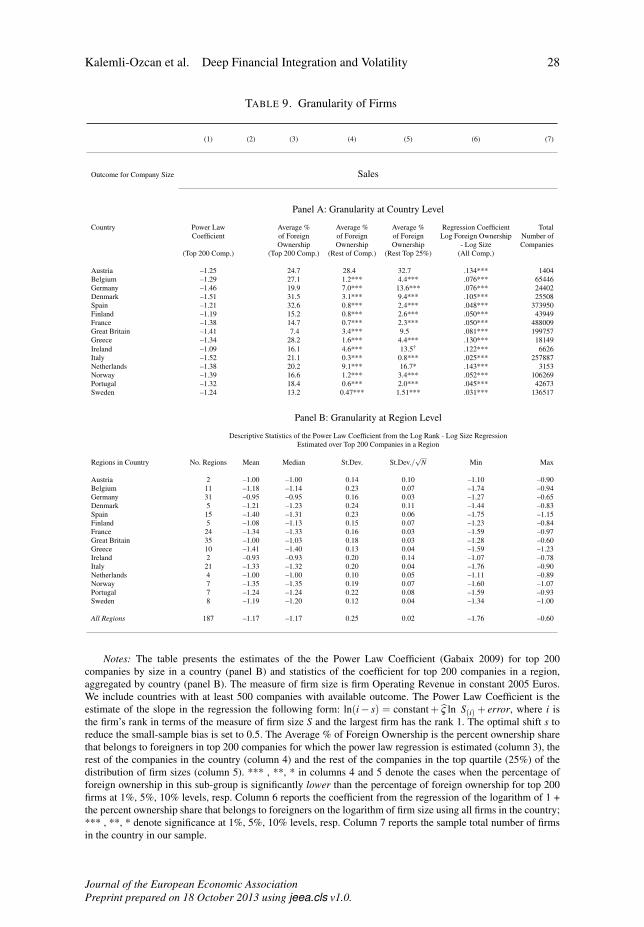
Kalemli-Ozcan et al. Deep Financial Integration and Volatility 28
TABLE 9. Granularity of Firms
(1) (2) (3) (4) (5) (6) (7)
Outcome for Company Size Sales
Panel A: Granularity at Country Level
Country Power Law Average % Average % Average % Regression Coefficient TotalCoefficient of Foreign of Foreign of Foreign Log Foreign Ownership Number of
Ownership Ownership Ownership - Log Size Companies(Top 200 Comp.) (Top 200 Comp.) (Rest of Comp.) (Rest Top 25%) (All Comp.)
Austria –1.25 24.7 28.4 32.7 .134*** 1404Belgium –1.29 27.1 1.2*** 4.4*** .076*** 65446Germany –1.46 19.9 7.0*** 13.6*** .076*** 24402Denmark –1.51 31.5 3.1*** 9.4*** .105*** 25508Spain –1.21 32.6 0.8*** 2.4*** .048*** 373950Finland –1.19 15.2 0.8*** 2.6*** .050*** 43949France –1.38 14.7 0.7*** 2.3*** .050*** 488009Great Britain –1.41 7.4 3.4*** 9.5 .081*** 199757Greece –1.34 28.2 1.6*** 4.4*** .130*** 18149Ireland –1.09 16.1 4.6*** 13.5† .122*** 6626Italy –1.52 21.1 0.3*** 0.8*** .025*** 257887Netherlands –1.38 20.2 9.1*** 16.7* .143*** 3153Norway –1.39 16.6 1.2*** 3.4*** .052*** 106269Portugal –1.32 18.4 0.6*** 2.0*** .045*** 42673Sweden –1.24 13.2 0.47*** 1.51*** .031*** 136517
Panel B: Granularity at Region Level
Descriptive Statistics of the Power Law Coefficient from the Log Rank - Log Size RegressionEstimated over Top 200 Companies in a Region
Regions in Country No. Regions Mean Median St.Dev. St.Dev./√
N Min Max
Austria 2 –1.00 –1.00 0.14 0.10 –1.10 –0.90Belgium 11 –1.18 –1.14 0.23 0.07 –1.74 –0.94Germany 31 –0.95 –0.95 0.16 0.03 –1.27 –0.65Denmark 5 –1.21 –1.23 0.24 0.11 –1.44 –0.83Spain 15 –1.40 –1.31 0.23 0.06 –1.75 –1.15Finland 5 –1.08 –1.13 0.15 0.07 –1.23 –0.84France 24 –1.34 –1.33 0.16 0.03 –1.59 –0.97Great Britain 35 –1.00 –1.03 0.18 0.03 –1.28 –0.60Greece 10 –1.41 –1.40 0.13 0.04 –1.59 –1.23Ireland 2 –0.93 –0.93 0.20 0.14 –1.07 –0.78Italy 21 –1.33 –1.32 0.20 0.04 –1.76 –0.90Netherlands 4 –1.00 –1.00 0.10 0.05 –1.11 –0.89Norway 7 –1.35 –1.35 0.19 0.07 –1.60 –1.07Portugal 7 –1.24 –1.24 0.22 0.08 –1.59 –0.93Sweden 8 –1.19 –1.20 0.12 0.04 –1.34 –1.00
All Regions 187 –1.17 –1.17 0.25 0.02 –1.76 –0.60
Notes: The table presents the estimates of the the Power Law Coefficient (Gabaix 2009) for top 200companies by size in a country (panel B) and statistics of the coefficient for top 200 companies in a region,aggregated by country (panel B). The measure of firm size is firm Operating Revenue in constant 2005 Euros.We include countries with at least 500 companies with available outcome. The Power Law Coefficient is theestimate of the slope in the regression the following form: ln(i− s) = constant+ ς̂ ln S(i) + error, where i isthe firm’s rank in terms of the measure of firm size S and the largest firm has the rank 1. The optimal shift s toreduce the small-sample bias is set to 0.5. The Average % of Foreign Ownership is the percent ownership sharethat belongs to foreigners in top 200 companies for which the power law regression is estimated (column 3), therest of the companies in the country (column 4) and the rest of the companies in the top quartile (25%) of thedistribution of firm sizes (column 5). *** , **, * in columns 4 and 5 denote the cases when the percentage offoreign ownership in this sub-group is significantly lower than the percentage of foreign ownership for top 200firms at 1%, 5%, 10% levels, resp. Column 6 reports the coefficient from the regression of the logarithm of 1 +the percent ownership share that belongs to foreigners on the logarithm of firm size using all firms in the country;*** , **, * denote significance at 1%, 5%, 10% levels, resp. Column 7 reports the sample total number of firmsin the country in our sample.
Journal of the European Economic AssociationPreprint prepared on 18 October 2013 using jeea.cls v1.0.
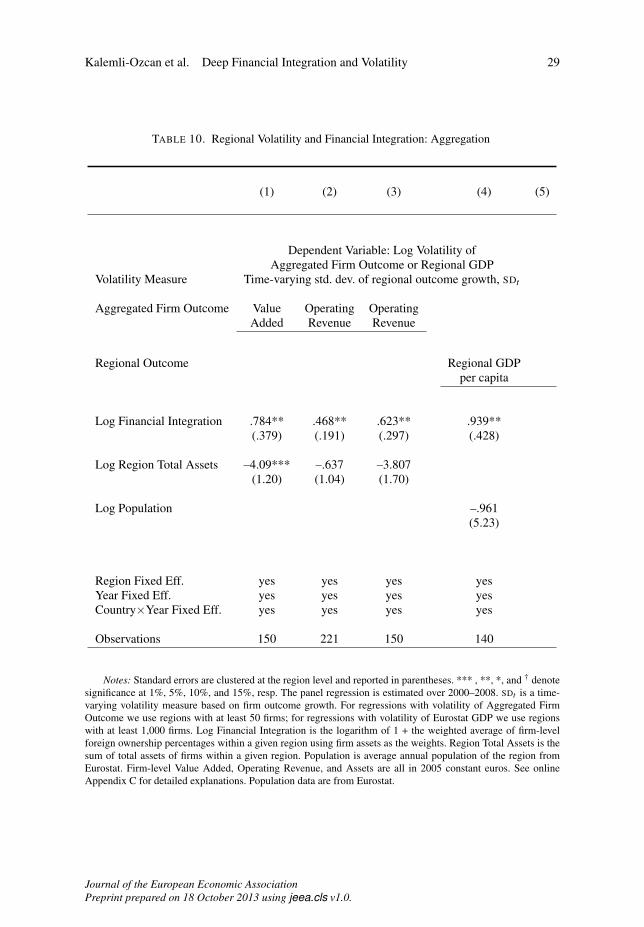
Kalemli-Ozcan et al. Deep Financial Integration and Volatility 29
TABLE 10. Regional Volatility and Financial Integration: Aggregation
(1) (2) (3) (4) (5)
Dependent Variable: Log Volatility ofAggregated Firm Outcome or Regional GDP
Volatility Measure Time-varying std. dev. of regional outcome growth, SDt
Aggregated Firm Outcome Value Operating OperatingAdded Revenue Revenue
Regional Outcome Regional GDPper capita
Log Financial Integration .784** .468** .623** .939**(.379) (.191) (.297) (.428)
Log Region Total Assets –4.09*** –.637 –3.807(1.20) (1.04) (1.70)
Log Population –.961(5.23)
Region Fixed Eff. yes yes yes yesYear Fixed Eff. yes yes yes yesCountry×Year Fixed Eff. yes yes yes yes
Observations 150 221 150 140
Notes: Standard errors are clustered at the region level and reported in parentheses. *** , **, *, and † denotesignificance at 1%, 5%, 10%, and 15%, resp. The panel regression is estimated over 2000–2008. SDt is a time-varying volatility measure based on firm outcome growth. For regressions with volatility of Aggregated FirmOutcome we use regions with at least 50 firms; for regressions with volatility of Eurostat GDP we use regionswith at least 1,000 firms. Log Financial Integration is the logarithm of 1 + the weighted average of firm-levelforeign ownership percentages within a given region using firm assets as the weights. Region Total Assets is thesum of total assets of firms within a given region. Population is average annual population of the region fromEurostat. Firm-level Value Added, Operating Revenue, and Assets are all in 2005 constant euros. See onlineAppendix C for detailed explanations. Population data are from Eurostat.
Journal of the European Economic AssociationPreprint prepared on 18 October 2013 using jeea.cls v1.0.