Deep Dive into SQL Tuning -Expanded by: Gary Gordhamer
67
rmoug.org Deep Dive into SQL Tuning - Expanded by: Gary Gordhamer
Transcript of Deep Dive into SQL Tuning -Expanded by: Gary Gordhamer

rmoug.org
Deep Dive into SQL Tuning - Expandedby: Gary Gordhamer

Gary GordhamerManaging Principal Consultant
Viscosity North America
29 years of IT experience 28 years with Oracle (6.x up to 19c)
Worked in many different industries including healthcare, manufacturing, utilities, banking, and marketing
@ggordhamlinkedin.com/in/ggordhamer/oraontap.blogspot.com
Note: The views in this presentation are my own and do represent the views of the company I work for.
Oracle 19c Hands-On ExperiencePublications coming soon
@ViscosityNAviscosityna.com
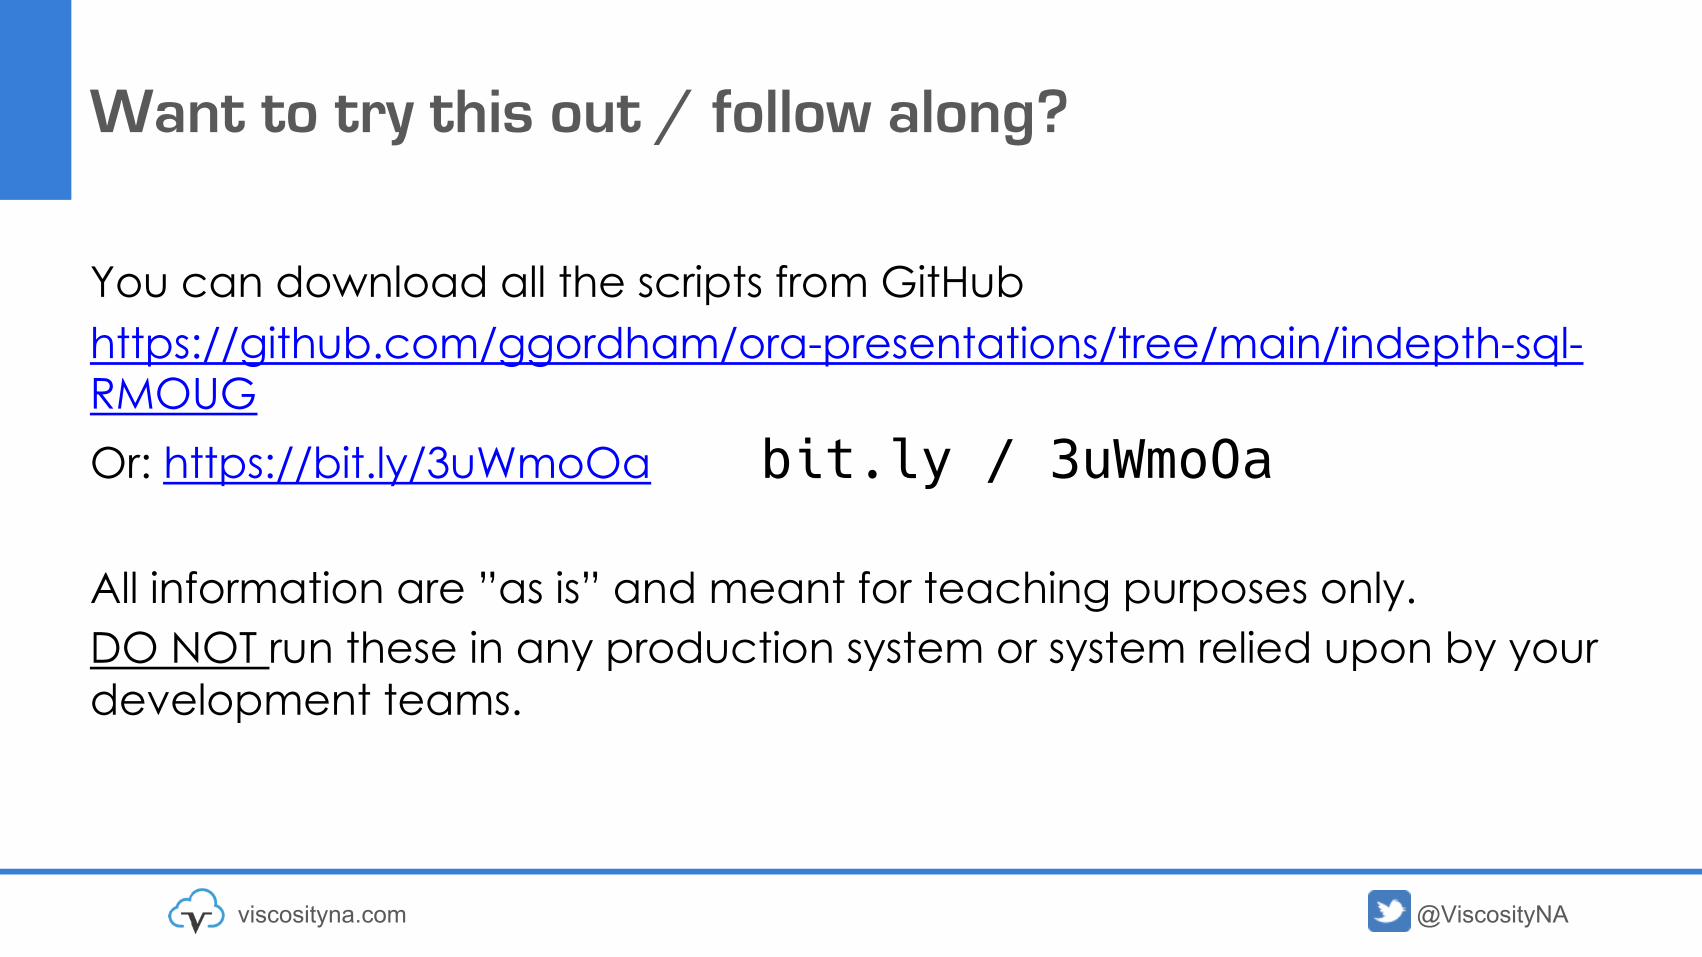
Want to try this out / follow along?
You can download all the scripts from GitHubhttps://github.com/ggordham/ora-presentations/tree/main/indepth-sql-RMOUGOr: https://bit.ly/3uWmoOa bit.ly / 3uWmoOa
All information are ”as is” and meant for teaching purposes only.DO NOT run these in any production system or system relied upon by your development teams.
@ViscosityNAviscosityna.com
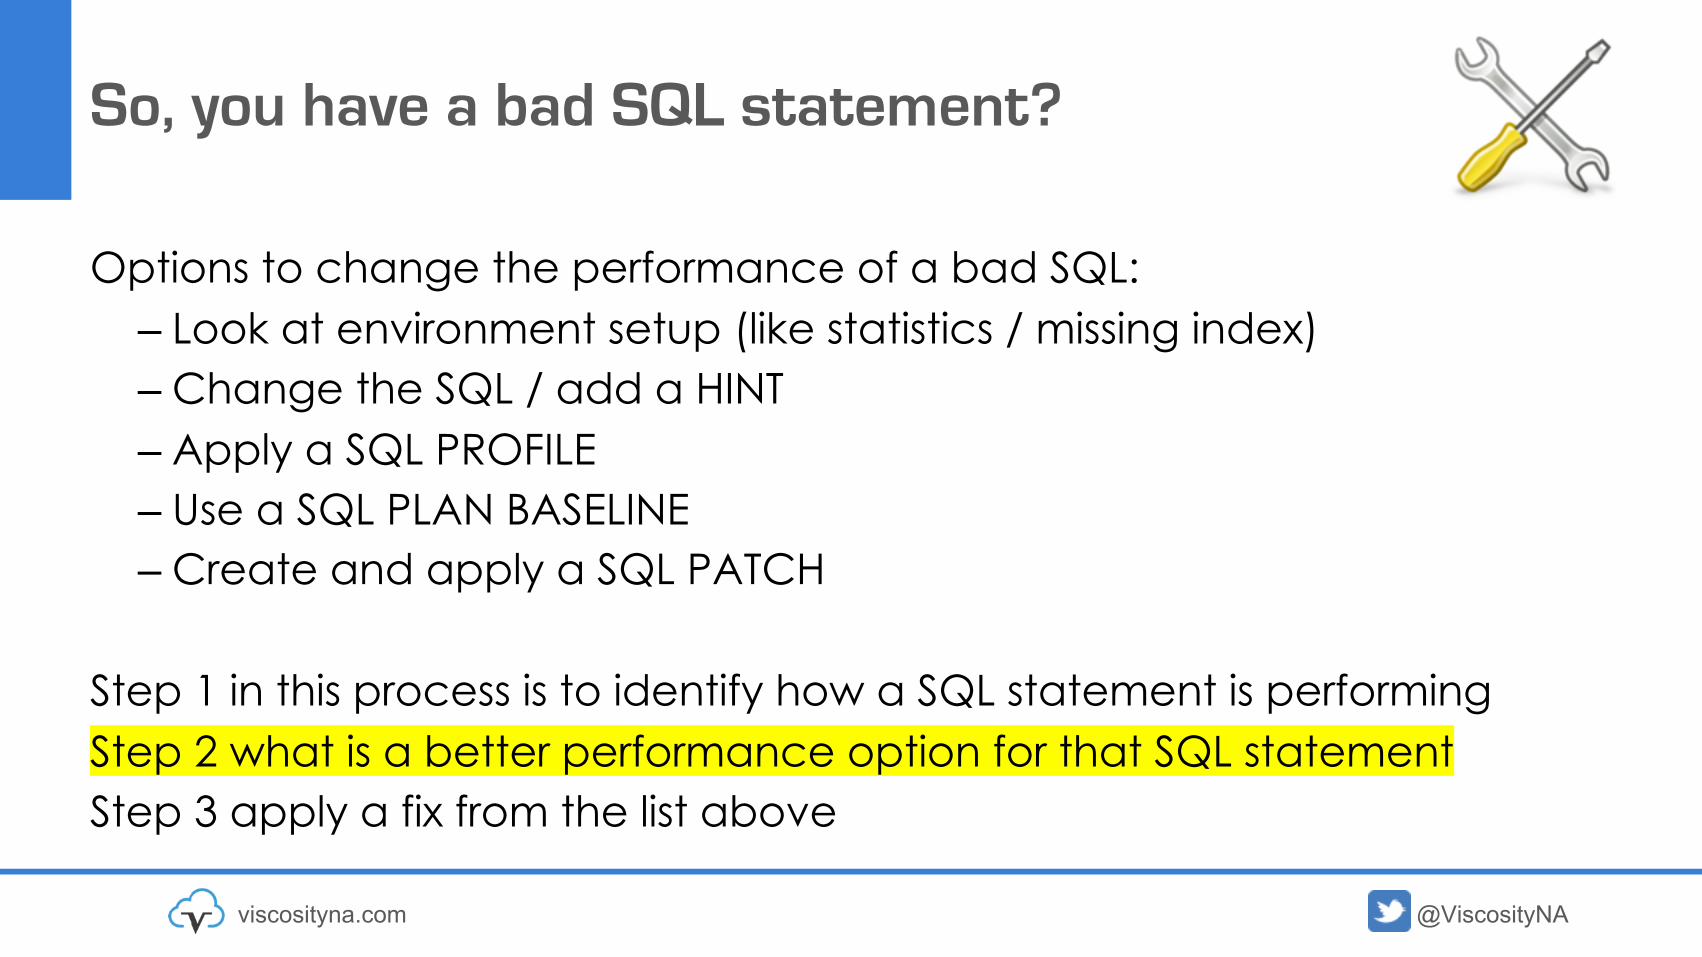
So, you have a bad SQL statement?
Options to change the performance of a bad SQL:– Look at environment setup (like statistics / missing index)– Change the SQL / add a HINT– Apply a SQL PROFILE– Use a SQL PLAN BASELINE– Create and apply a SQL PATCH
Step 1 in this process is to identify how a SQL statement is performingStep 2 what is a better performance option for that SQL statementStep 3 apply a fix from the list above

@ViscosityNAviscosityna.com
Agenda
• SQL Tuning Intro• SQL T• Cost Based Optimizer Tracing• Digging into the Optimizer• Reading Trace Files• Tricks to Force the Optimizer
@ViscosityNAviscosityna.com
SQL Tuning Intro

@ViscosityNAviscosityna.com
SQL Tuning
SQL Statement – what data you want Oracle to retrieveExecution Plan – method Oracle will use to retrieve the data
SELECT sum(t1.c), sum(t2.c)FROM t1, t2WHERE t1.a = t2.aAND t1.d = :1
Oracle Optimizer
Object Metadata Object Statistics
System Statistics
SQL BaselinePlan1 --2 –-3 –-4 --
SQL Profile(execution Statistics) Plan
1 --2 –-3 –-4 --
Plan List
Plan1 --2 –-3 –-4 --
Plan1 --2 –-3 –-4 --
Plan1 --2 –-3 –-4 --
Plan1 --2 –-3 –-4 --
Plan1 --2 –-3 –-4 --
Plan1 --2 –-3 –-4 --
Plan1 --2 –-3 –-4 --
Plan1 --2 –-3 –-4 --
Plan1 --2 –-3 –-4 --
Plan1 --2 –-3 –-4 --
Plan1 --2 –-3 –-4 --
Plan1 --2 –-3 –-4 --
ExecuteOptimizer
Environment
SQL Tuning – the art of affecting one or more parts of this process to decrees execution time or resource consumption
1. Submit SQL 2. Collect Information 3. Generate Possible Plans 4. Check Baselines 5. Pick PlanExecute!
@ViscosityNAviscosityna.com
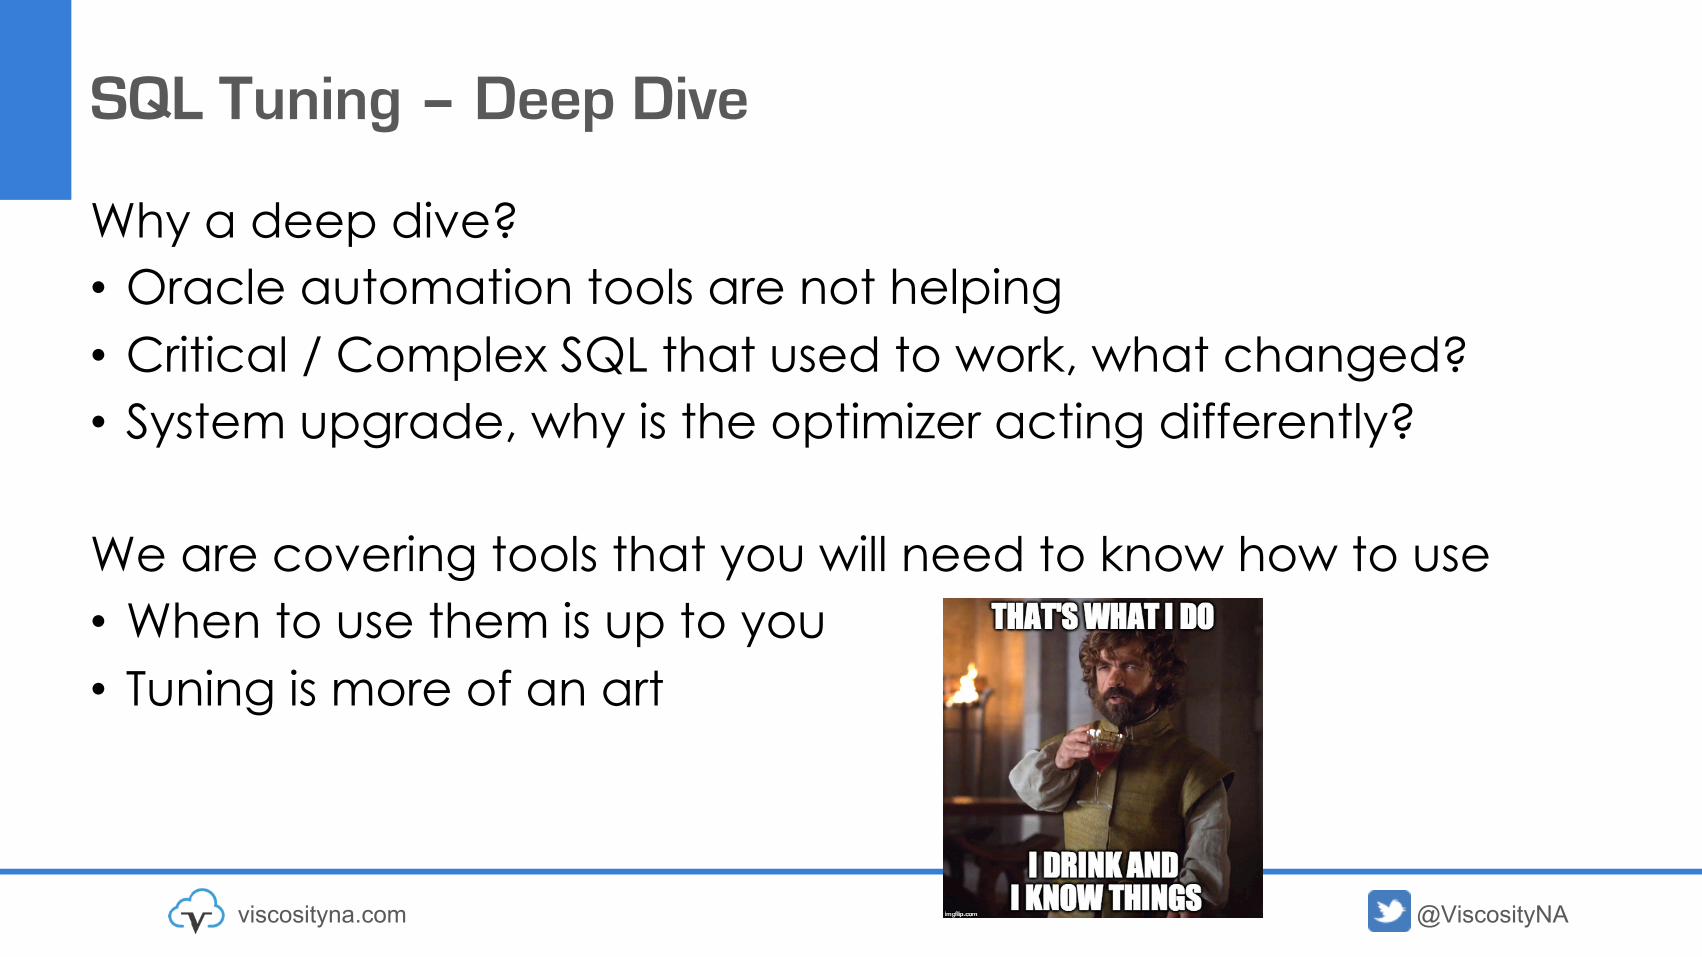
SQL Tuning – Deep Dive
Why a deep dive?• Oracle automation tools are not helping• Critical / Complex SQL that used to work, what changed?• System upgrade, why is the optimizer acting differently?
We are covering tools that you will need to know how to use• When to use them is up to you• Tuning is more of an art

@ViscosityNAviscosityna.com
SQL Tuning – Basic Steps
1. Document the issue (capture information)a) SQL Statement IDb) Current Execution planc) Current performance / Resource usage
2. Identify the goal (target performance)3. Try the standard tools
a) Explain plan – look for bad decisions (ignoring indexes, etc)b) Statistics – look for missing or stale statisticsc) SQL Profile – provide the optimizer more informationd) SQL Baseline – force a specific plan that is already available
4. Deep DiveNote: take lots of notes, the deeper you go the more lost you will get!
@ViscosityNAviscosityna.com
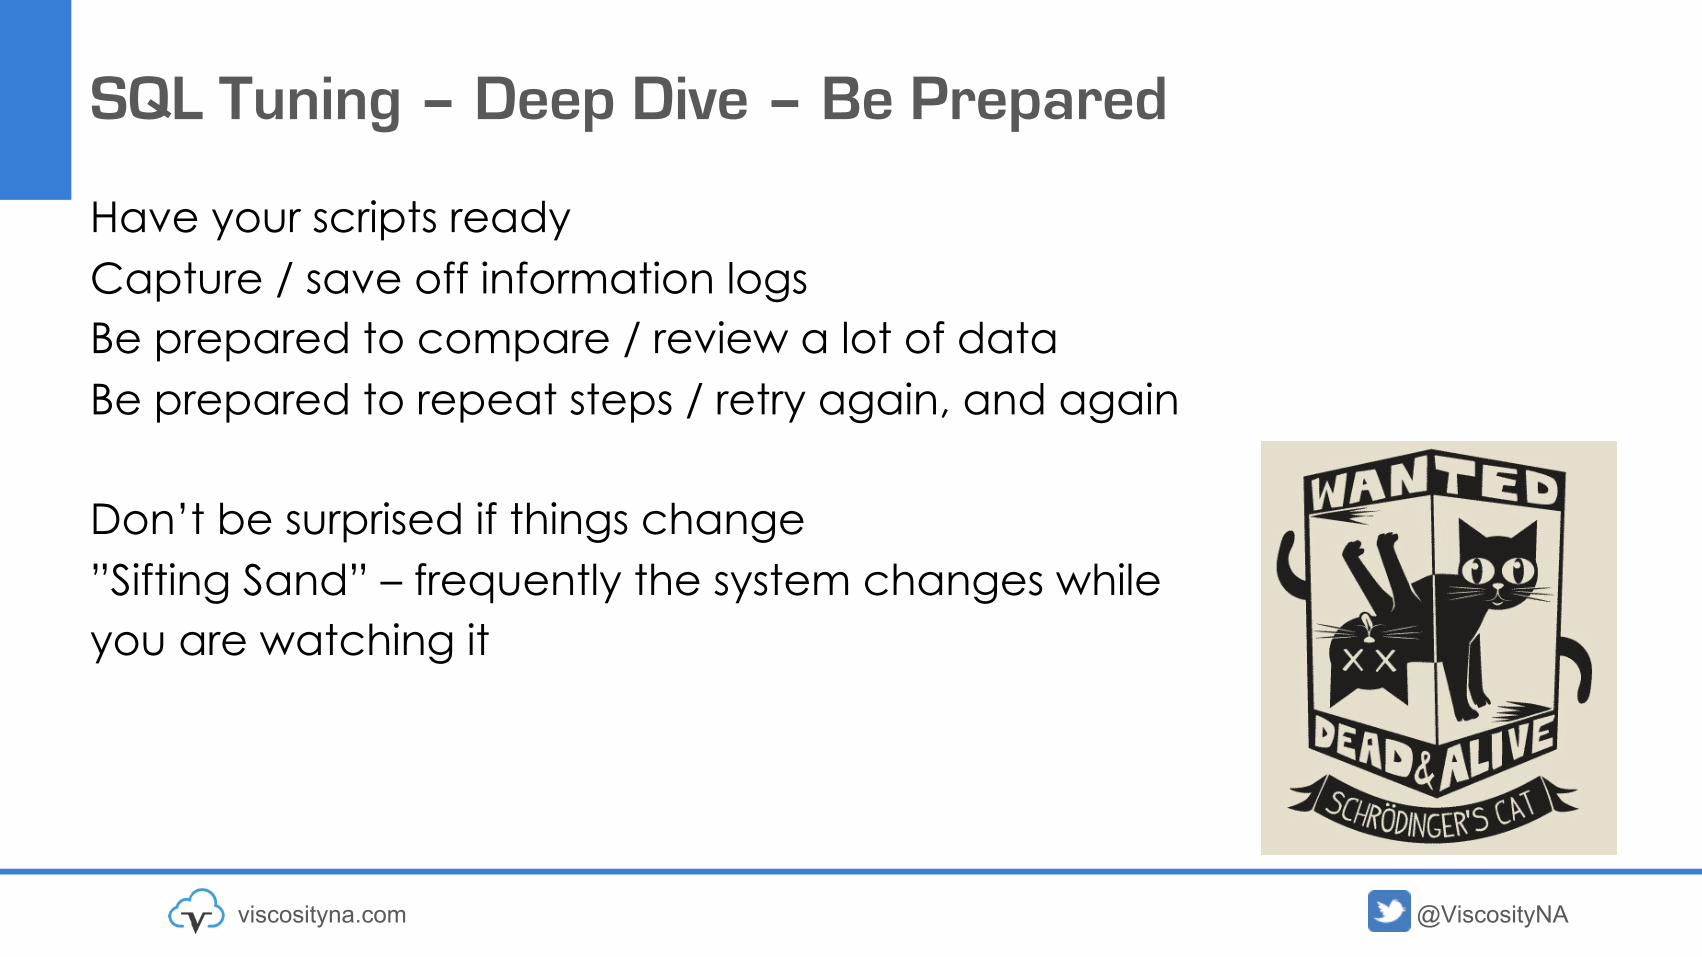
SQL Tuning – Deep Dive – Be Prepared
Have your scripts readyCapture / save off information logsBe prepared to compare / review a lot of dataBe prepared to repeat steps / retry again, and again
Don’t be surprised if things change”Sifting Sand” – frequently the system changes while you are watching it

@ViscosityNAviscosityna.com
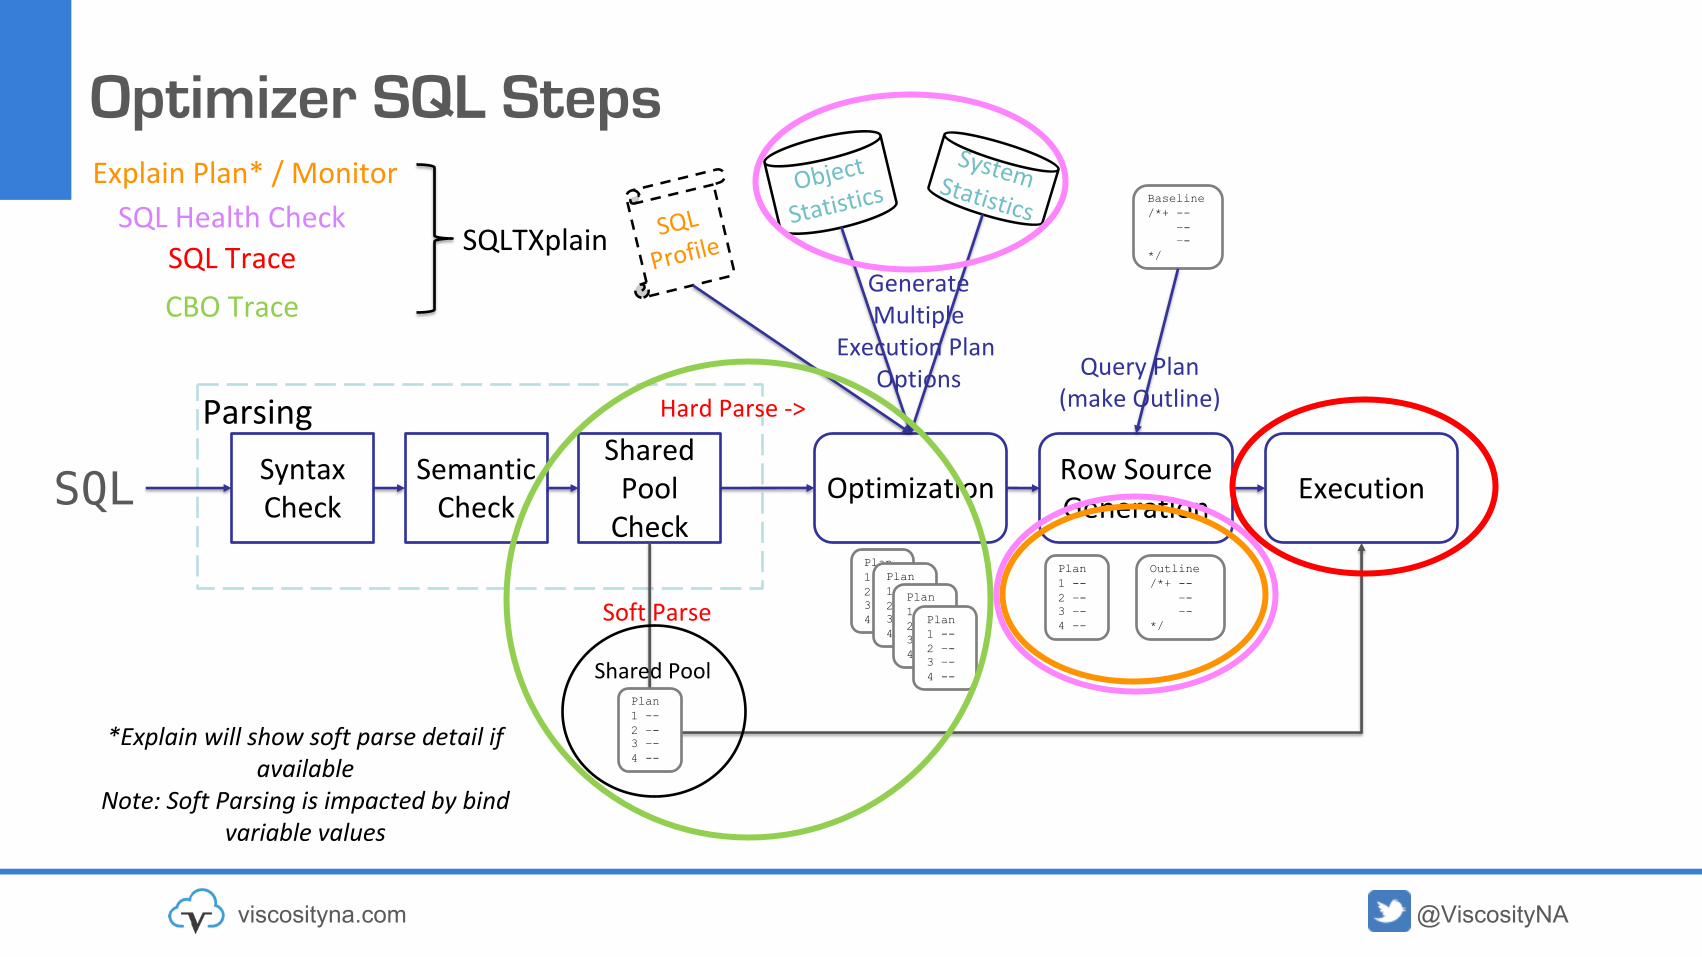
Optimizer SQL Steps
SQL Syntax Check OptimizationSemantic
Check
Shared Pool
Check
ParsingRow Source Generation Execution
Plan1 --2 –-3 –-4 --
Plan1 --2 –-3 –-4 --
Plan1 --2 –-3 –-4 --
Plan1 --2 –-3 –-4 --
Plan1 --2 –-3 –-4 --
GenerateMultiple
Execution Plan Options Query Plan
(make Outline)
Shared Pool
Soft Parse
Hard Parse ->
Plan1 --2 –-3 –-4 --
Object
StatisticsSystem Statistics
SQL
Profile
Baseline/*+ --
–-–-
*/
Outline/*+ --
–-–-
*/
Note: Soft Parsing is impacted by bind variable values
@ViscosityNAviscosityna.com
SQL Tuning – These Tools Show Me What?
Explain Plan – What steps will be taken to execute the SQL
SQL Health Check – What is the status / details of all the objects touched by the SQL
SQL Trace – What happened when the SQL was executed
CBO Trace – How did the Optimizer decide to execute the SQL
SQLT – Everything + some “Observations”

@ViscosityNAviscosityna.com
SQL Tuning – Deep Dive – Tools
Runs Statement
SQL Execution
StepsObject
InformationDatabase
EnvironmentHTML
ReportsEasy to
readRequires
Install Explain Plan Maybe Yes No No Maybe Yes NoSQL Monitor Maybe Yes No No Yes Yes NoSQL Health Check (HC) No Yes Extensivie Yes Yes Yes NoSQL Trace Yes Yes Little Maybe No No NoCBO Trace Yes Yes Extensivie Some No No NoSQLT Maybe Yes Extensivie Extensivie Yes Yes Yes
Number of tools to choose from, using the right tool for the situation

@ViscosityNAviscosityna.com
SQL T

@ViscosityNAviscosityna.com
SQLT or SQLTXPlain
Set of scripts from Oracle – SQLT is diagnostics or debugging information– SQLT needs to be installed in the database– To use SQLT, the parsing schema needs to be granted SQLT_USER_ROLE
Captures:– Database environment and configuration– All statistics related to the SQL run– Object detailed information (definitions, statistics, etc..)– SQL text, explain plan– Observations– Store's data so it can be transferred to another DB for testing / comparison
@ViscosityNAviscosityna.com
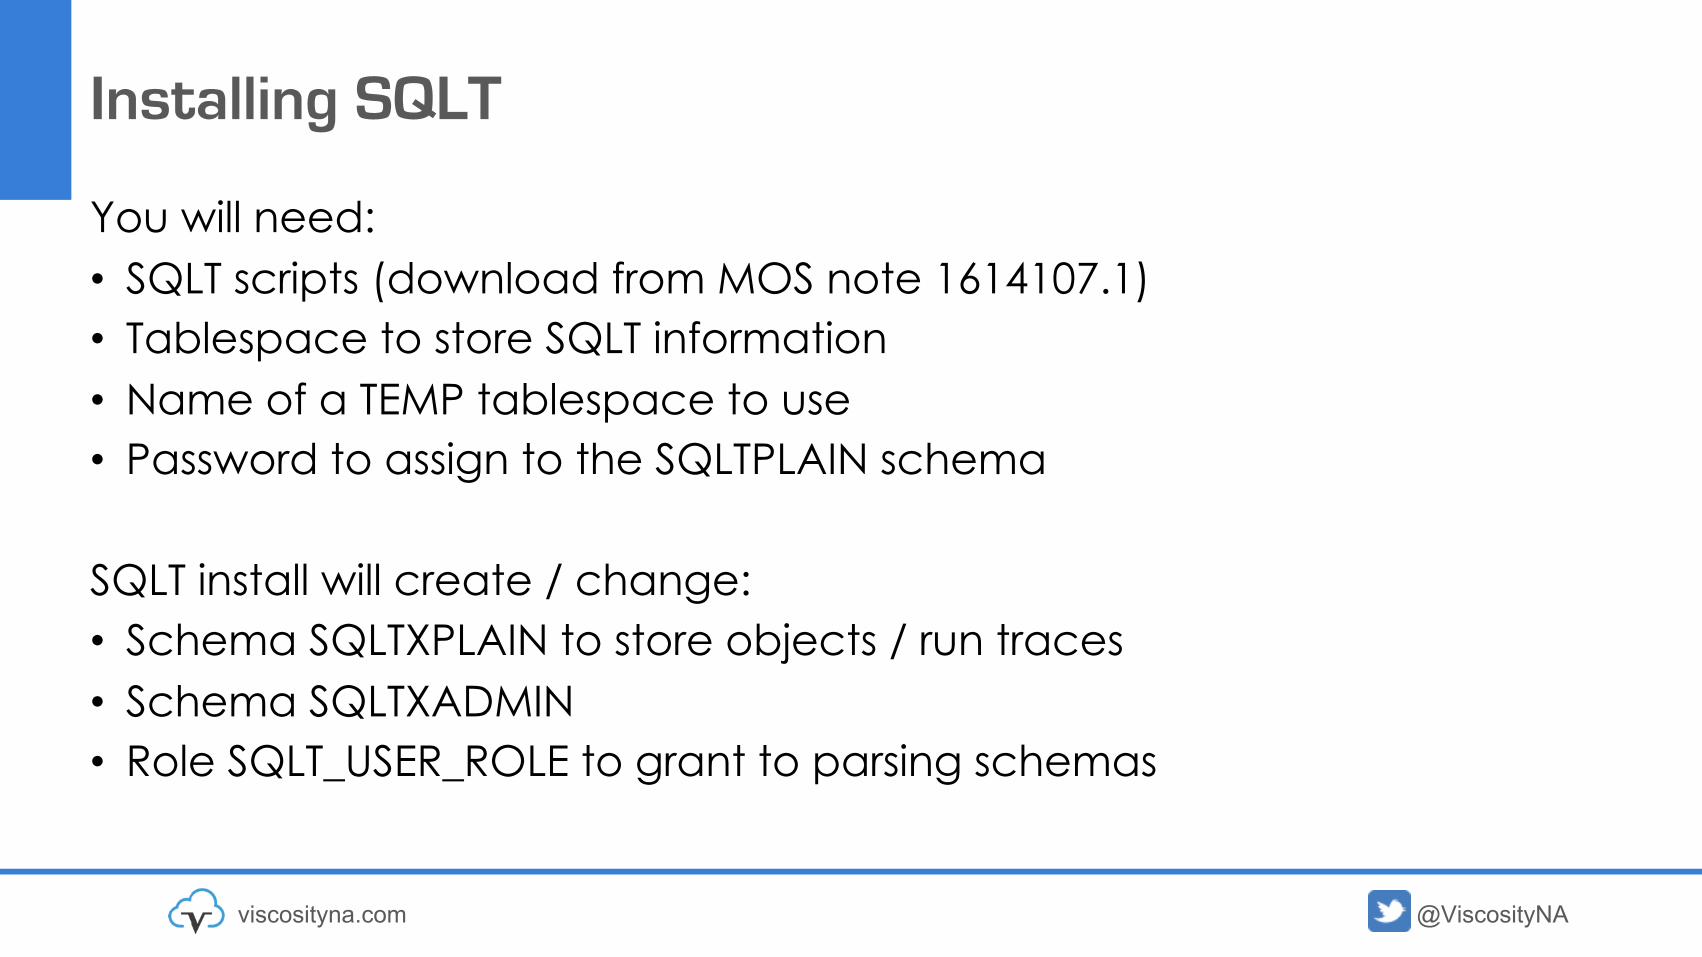
Installing SQLT
You will need:• SQLT scripts (download from MOS note 1614107.1)• Tablespace to store SQLT information• Name of a TEMP tablespace to use• Password to assign to the SQLTPLAIN schema
SQLT install will create / change:• Schema SQLTXPLAIN to store objects / run traces• Schema SQLTXADMIN • Role SQLT_USER_ROLE to grant to parsing schemas
@ViscosityNAviscosityna.com
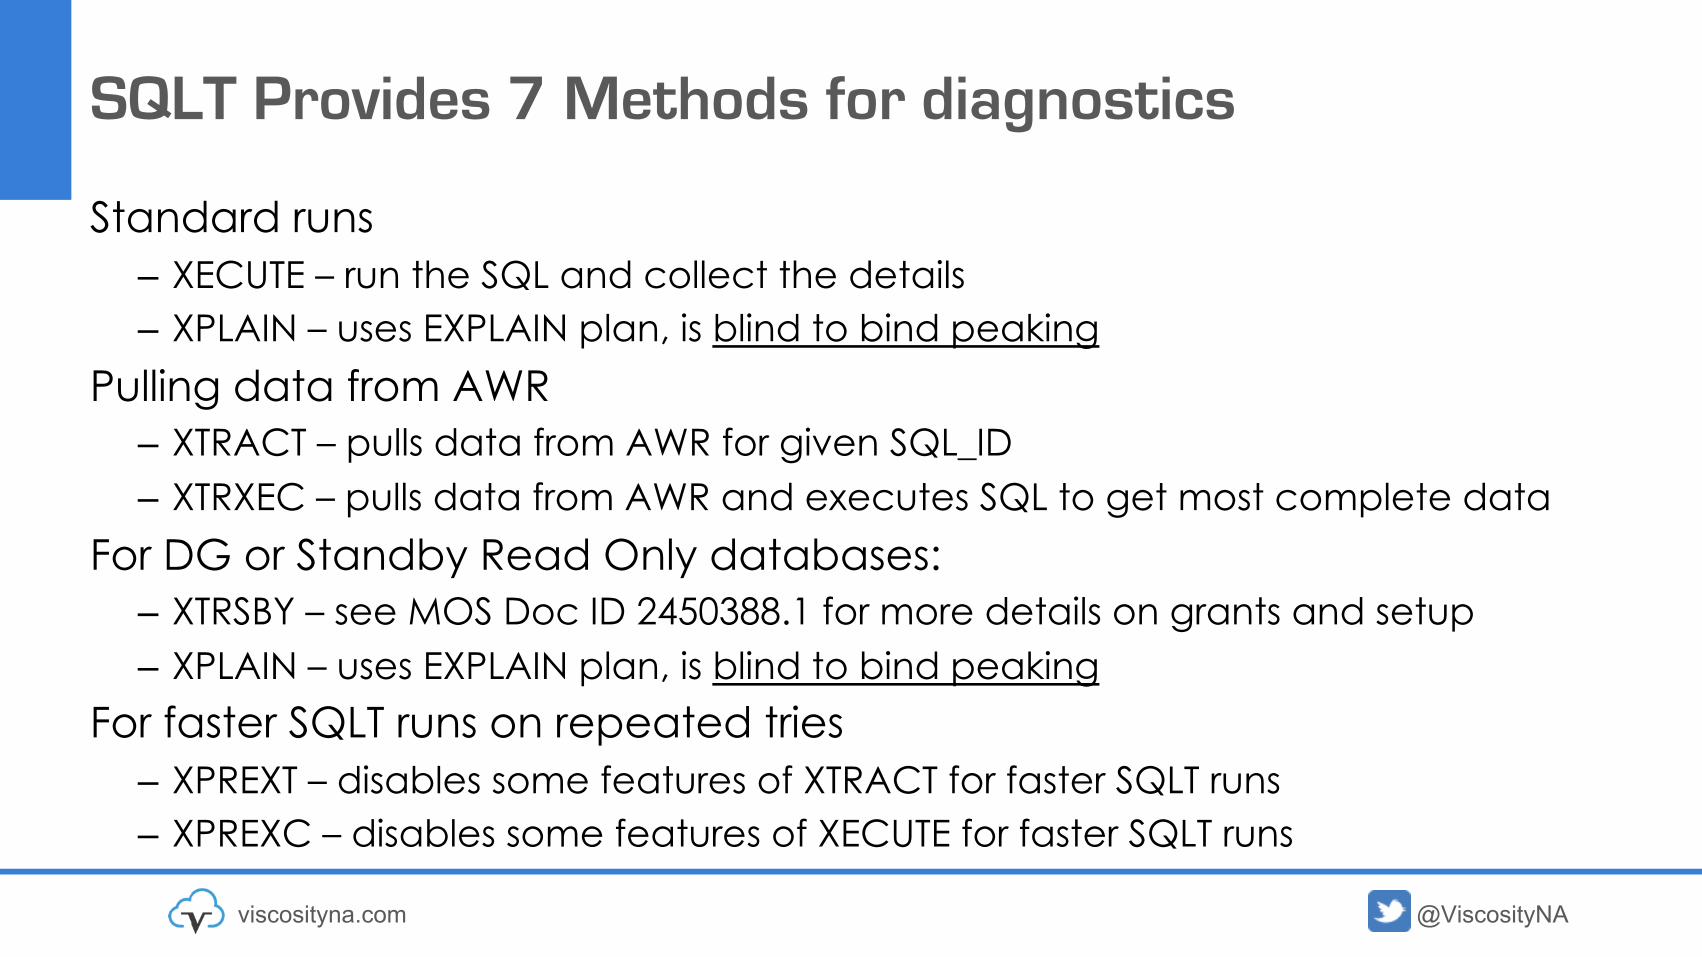
SQLT Provides 7 Methods for diagnostics
Standard runs– XECUTE – run the SQL and collect the details– XPLAIN – uses EXPLAIN plan, is blind to bind peaking
Pulling data from AWR– XTRACT – pulls data from AWR for given SQL_ID– XTRXEC – pulls data from AWR and executes SQL to get most complete data
For DG or Standby Read Only databases:– XTRSBY – see MOS Doc ID 2450388.1 for more details on grants and setup– XPLAIN – uses EXPLAIN plan, is blind to bind peaking
For faster SQLT runs on repeated tries– XPREXT – disables some features of XTRACT for faster SQLT runs– XPREXC – disables some features of XECUTE for faster SQLT runs

@ViscosityNAviscosityna.com
SQLT Basic Steps to Run
Scripts are in the sqlt/run directorySQL> start sqltxplain.sql my_sql.txt my_sqltxplain_password
Note: sql_fua0hb5hfst77.txt is a file with a single SQL statement in it.This example uses “Explain Plan” and does not actually run the SQL statement and provides less details.
For extensive details, use XTRACT method that executes the statement:SQL> start sqltxtract.sql sql_id my_sqltxplain_password
SQL> start sqltxplain.sql sql_fua0hb5hfst77.txt Oracle_4U
SQL> start sqltxtract.sql fua0hb5hfst77 Oracle_4U

@ViscosityNAviscosityna.com
SQLT - Files / Reportssqlt_s39942_log.zip – database alert logsqlt_s39943_purge.sql – SQL script to purge this statement from SQLT tablessqlt_20210309_1117_fua0hb5hfst77_H.zip – This is your trace
Length Date Time Name--------- ---------- ----- ----
256869 03-09-2021 11:12 sqlt_s39943_10053_explain.trc - Explain Plan trace843 03-09-2021 11:16 sqlt_s39943_addmrpt_0002.zip - ADDM Report
147460 03-09-2021 11:15 sqlt_s39943_awrrpt_0002.zip - AWR Report710 03-09-2021 11:16 sqlt_s39943_cell_state.zip - Exadata Storage Cell status7769 03-09-2021 11:16 sqlt_s39943_driver.zip - Scripts used during SQLT25623 03-09-2021 11:12 sqlt_s39943_lite.html - Simple report (Like SQLHC)
2220853 03-09-2021 11:16 sqlt_s39943_log.zip - Logs from steps of SQLT1443813 03-09-2021 11:12 sqlt_s39943_main.html - Main SQLT Report149613 03-09-2021 11:16 sqlt_s39943_opatch.zip - OPatch logs captured14729 03-09-2021 11:12 sqlt_s39943_readme.html - Additional Instructions1872 03-09-2021 11:12 sqlt_s39943_sql_detail_active.html – SQL Monitor Report391 03-09-2021 11:16 sqlt_s39943_tc_script.sql - Script to re-run same SQL124 03-09-2021 11:16 sqlt_s39943_tc_sql.sql - Just the SQL traced
79072 03-09-2021 11:16 sqlt_s39943_tcx.zip - SQLT full data exported436250 03-09-2021 11:16 sqlt_s39943_tc.zip - SQLT test case scripts104192 03-09-2021 11:16 sqlt_s39943_trc.zip - SQL Trace files113927 03-09-2021 11:17 sqlt_s39943_sqldx.zip - CSV of SQLT information
@ViscosityNAviscosityna.com
Looking at SQLT
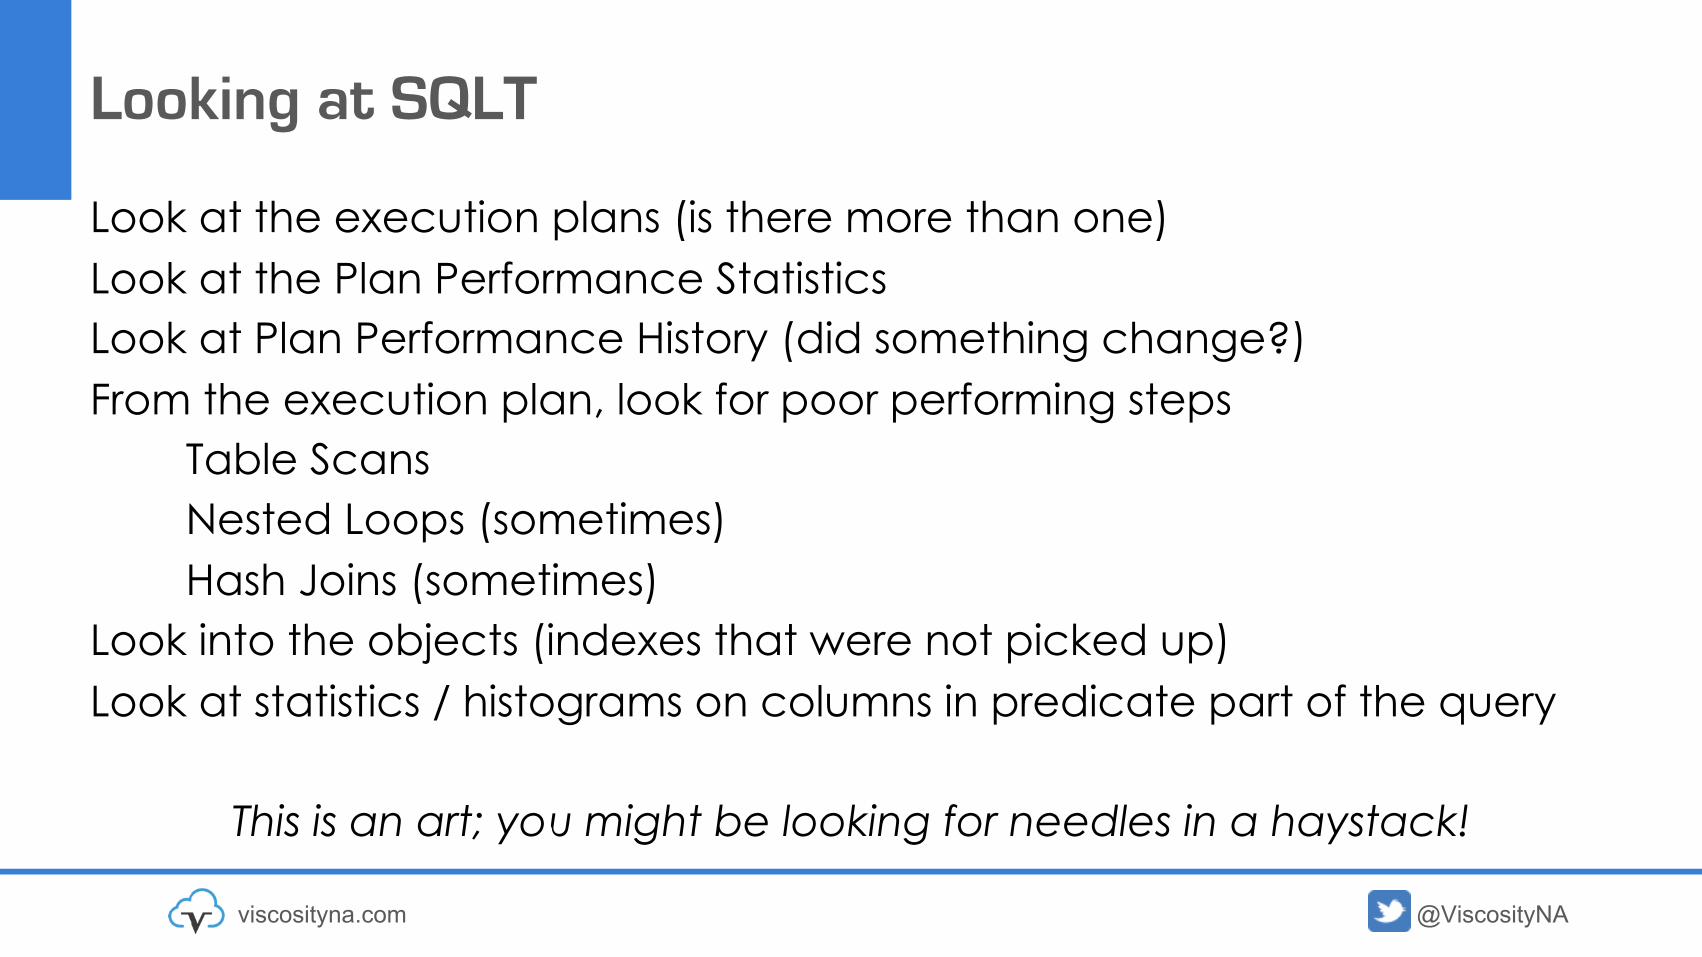
Look at the execution plans (is there more than one)Look at the Plan Performance StatisticsLook at Plan Performance History (did something change?)From the execution plan, look for poor performing steps
Table ScansNested Loops (sometimes)Hash Joins (sometimes)
Look into the objects (indexes that were not picked up)Look at statistics / histograms on columns in predicate part of the query
This is an art; you might be looking for needles in a haystack!

@ViscosityNAviscosityna.com
SQLT Report
@ViscosityNAviscosityna.com
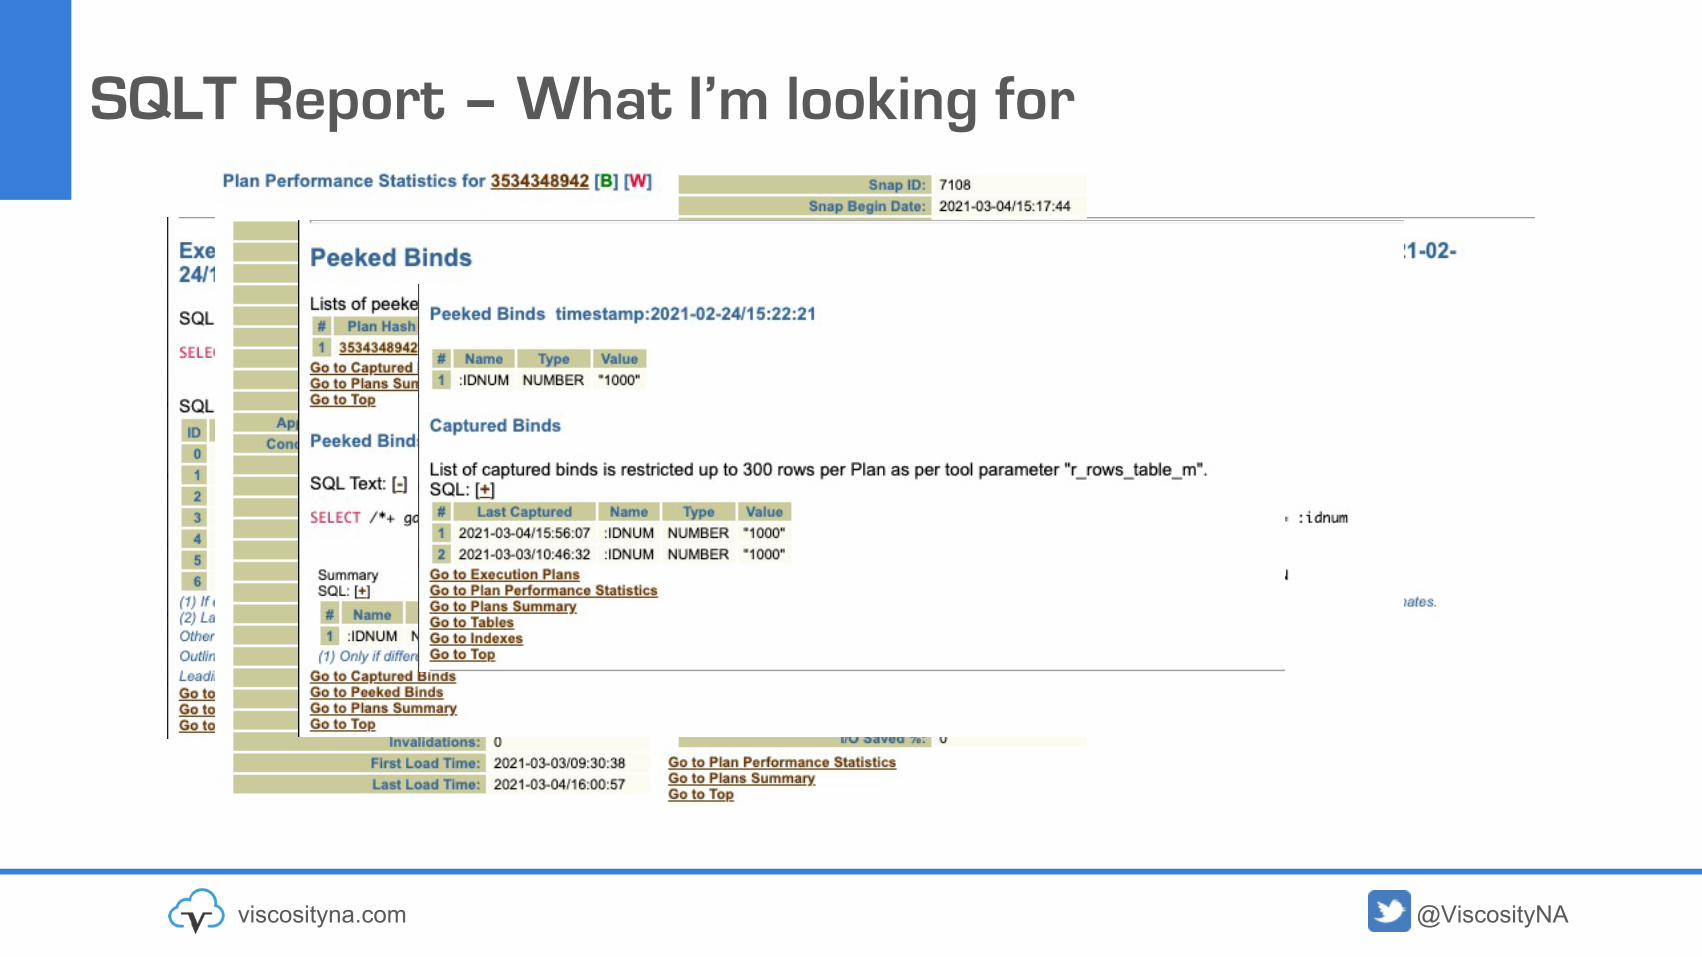
SQLT Report – What I’m looking for

@ViscosityNAviscosityna.com
Why SQLT vs Explain Plan?
Provides all the details when the query was traced– DB environment– SQL history
Provides bind variable details, and bind peaking informationEach part of the report links to the data you need– On plan, need to see statistics for that object, click ->
Multiple plans if they existExtreme details on ”other” information– Baselines / Profiles / Patches etc..
Provides some nice SQL / other useful items
@ViscosityNAviscosityna.com
SQL Trace

@ViscosityNAviscosityna.com
Why SQL Trace
Collects information on a SQL runningData is collected in a trace file (external to DB)Trace file needs to be processed with TKPROF toolNo additional items to installRequires some access to the database server to get trace file
Requires “ALTER SESSION” privilege
DBA can trace an active or in process session

@ViscosityNAviscosityna.com
What’s in a SQL Trace?
What happened during the execution of the statementProcess with TKPROF tool (normally in DB home directory)
Helpful to see where time was spentCan give a “limited” explain plan (requires DB login)
I would always get a full explain plan for the statement as well(DBMS_XPLAN functions based on where you are capturing it from)

@ViscosityNAviscosityna.com
Running a Trace
Set the trace file name (easier to find in DIAGNOSTIC_DEST)ALTER SESSION SET tracefile_identifier = 'mytrace01';
Turn tracing onEXEC DBMS_SESSION.SET_SQL_TRACE(sql_trace => true);
Execute one or more SQL statementsSQL>Be sure to turn tracing off!EXEC DBMS_SESSION.SET_SQL_TRACE(sql_trace => false);
Find the trace file in the database trace directory (DIAGNOSTIC_DEST)<SID>_ora_<PID>_<ID>.trc

@ViscosityNAviscosityna.com
Run trace through TKPROF
On the DB server run TKPROF$ tkprof t1db_ora_32683_tdemo2.trc t1db_ora_32683_tdemo2.out explain=perflab
TKPROF: Release 19.0.0.0.0 - Development on Fri Mar 19 16:18:24 2021
Copyright (c) 1982, 2019, Oracle and/or its affiliates. All rights reserved.
password =
You will be prompted for the user password provided after explain=Look at the .out file
$ Less t1db_ora_32683_tdemo2.out
@ViscosityNAviscosityna.com
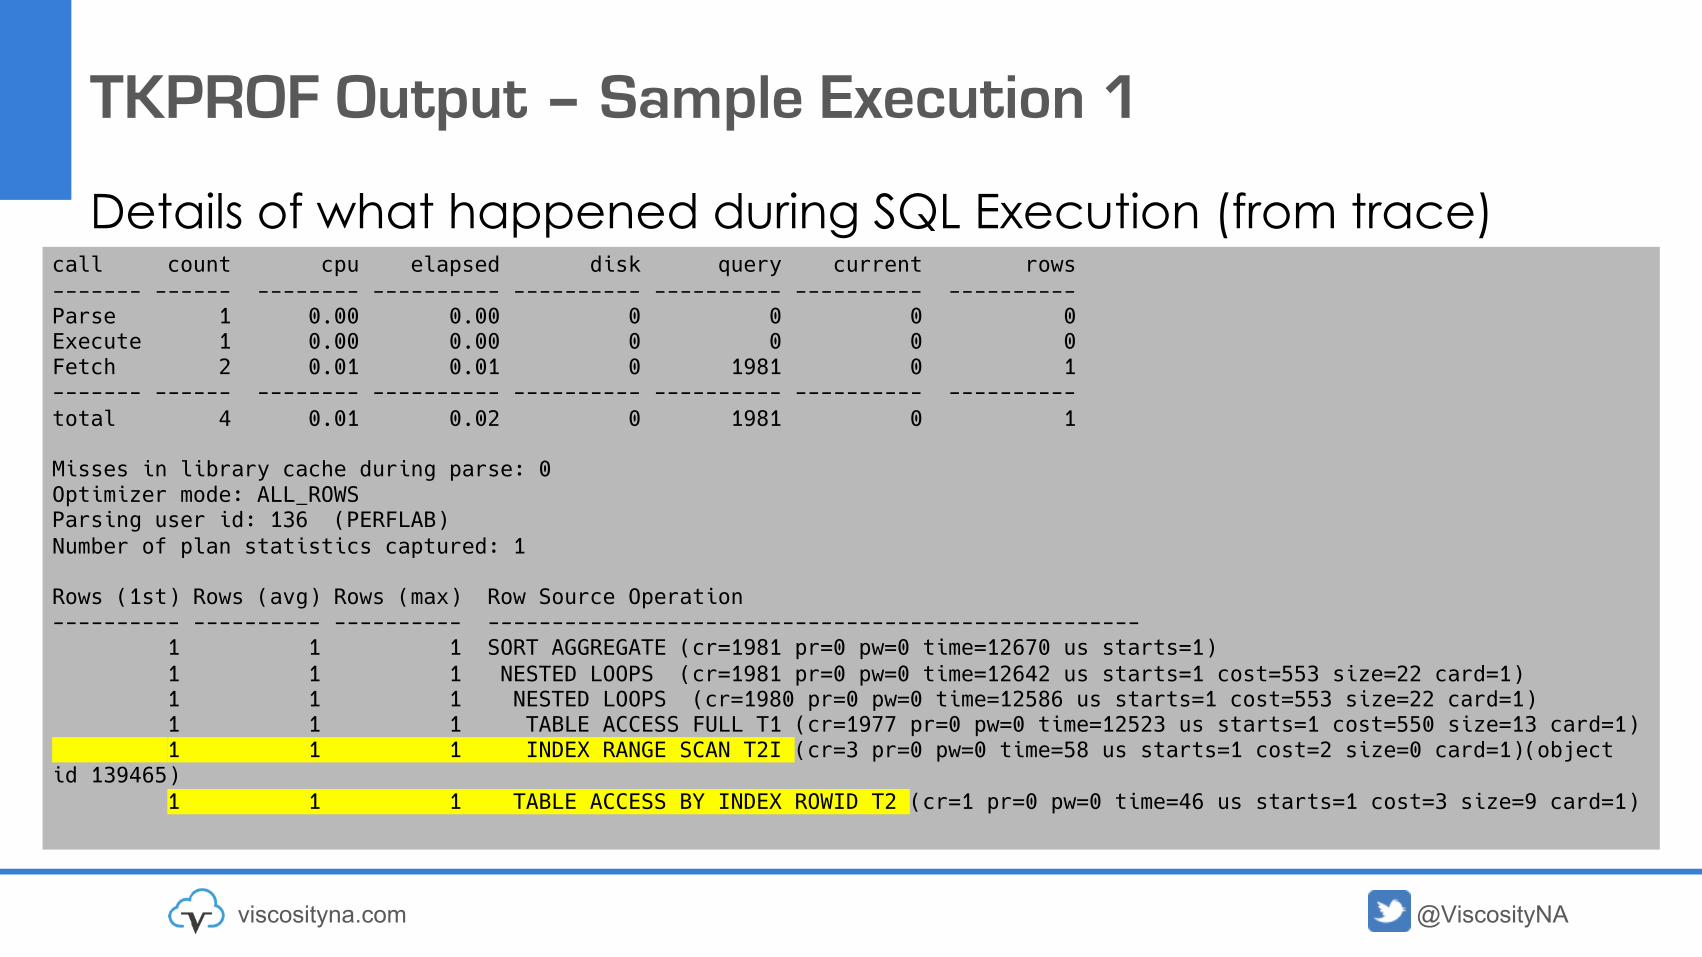
TKPROF Output – Sample Execution 1
Details of what happened during SQL Execution (from trace)call count cpu elapsed disk query current rows------- ------ -------- ---------- ---------- ---------- ---------- ----------Parse 1 0.00 0.00 0 0 0 0Execute 1 0.00 0.00 0 0 0 0Fetch 2 0.01 0.01 0 1981 0 1------- ------ -------- ---------- ---------- ---------- ---------- ----------total 4 0.01 0.02 0 1981 0 1
Misses in library cache during parse: 0Optimizer mode: ALL_ROWSParsing user id: 136 (PERFLAB)Number of plan statistics captured: 1
Rows (1st) Rows (avg) Rows (max) Row Source Operation---------- ---------- ---------- ---------------------------------------------------
1 1 1 SORT AGGREGATE (cr=1981 pr=0 pw=0 time=12670 us starts=1)1 1 1 NESTED LOOPS (cr=1981 pr=0 pw=0 time=12642 us starts=1 cost=553 size=22 card=1)1 1 1 NESTED LOOPS (cr=1980 pr=0 pw=0 time=12586 us starts=1 cost=553 size=22 card=1)1 1 1 TABLE ACCESS FULL T1 (cr=1977 pr=0 pw=0 time=12523 us starts=1 cost=550 size=13 card=1)1 1 1 INDEX RANGE SCAN T2I (cr=3 pr=0 pw=0 time=58 us starts=1 cost=2 size=0 card=1)(object
id 139465)1 1 1 TABLE ACCESS BY INDEX ROWID T2 (cr=1 pr=0 pw=0 time=46 us starts=1 cost=3 size=9 card=1)

@ViscosityNAviscosityna.com
TKPROF Output – Sample Execution 2
Explain plan vs:Plan hash value: 3534348942--------------------------------------------------------------------------------------| Id | Operation | Name | Rows | Bytes | Cost (%CPU)| Time |--------------------------------------------------------------------------------------| 0 | SELECT STATEMENT | | | | 741K(100)| || 1 | SORT AGGREGATE | | 1 | 22 | | || 2 | NESTED LOOPS | | 246K| 5305K| 741K (1)| 00:00:29 || 3 | NESTED LOOPS | | 246K| 5305K| 741K (1)| 00:00:29 ||* 4 | TABLE ACCESS FULL | T1 | 246K| 3134K| 550 (1)| 00:00:01 ||* 5 | INDEX RANGE SCAN | T2I | 1 | | 2 (0)| 00:00:01 || 6 | TABLE ACCESS BY INDEX ROWID| T2 | 1 | 9 | 3 (0)| 00:00:01 |--------------------------------------------------------------------------------------
Rows (1st) Rows (avg) Rows (max) Row Source Operation---------- ---------- ---------- ---------------------------------------------------
1 1 1 SORT AGGREGATE (cr=11089 pr=0 pw=0 time=426057 us starts=1)250001 250001 250001 NESTED LOOPS (cr=11089 pr=0 pw=0 time=444330 us starts=1 cost=741506 size=5432438 card=246929)250001 250001 250001 NESTED LOOPS (cr=9118 pr=0 pw=0 time=290903 us starts=1 cost=741506 size=5432438 card=246929)250001 250001 250001 TABLE ACCESS FULL T1 (cr=1976 pr=0 pw=0 time=36524 us starts=1 cost=550 size=3210077 card=246929)250001 250001 250001 INDEX RANGE SCAN T2I (cr=7142 pr=0 pw=0 time=185318 us starts=250001 cost=2 size=0 card=1)(object id 139465)250001 250001 250001 TABLE ACCESS BY INDEX ROWID T2 (cr=1971 pr=0 pw=0 time=93985 us starts=250001 cost=3 size=9 card=1)
Trace
@ViscosityNAviscosityna.com
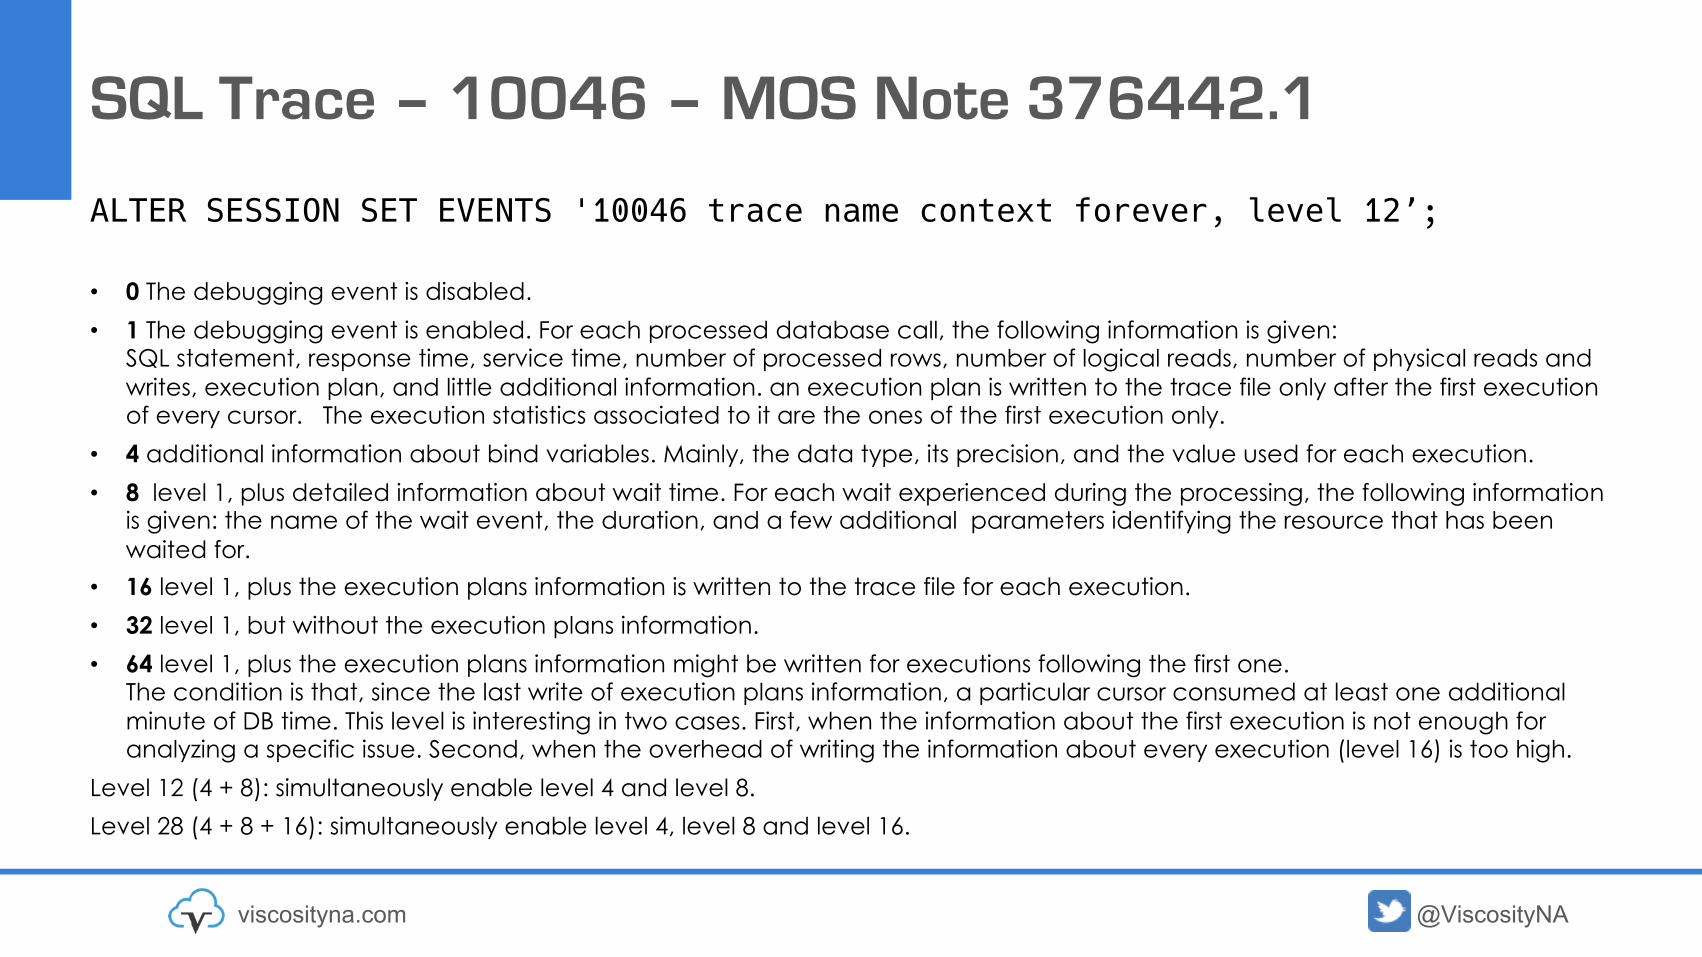
SQL Trace – 10046 – MOS Note 376442.1
ALTER SESSION SET EVENTS '10046 trace name context forever, level 12’;
• 0 The debugging event is disabled.• 1 The debugging event is enabled. For each processed database call, the following information is given:
SQL statement, response time, service time, number of processed rows, number of logical reads, number of physical reads and writes, execution plan, and little additional information. an execution plan is written to the trace file only after the first execution of every cursor. The execution statistics associated to it are the ones of the first execution only.
• 4 additional information about bind variables. Mainly, the data type, its precision, and the value used for each execution.• 8 level 1, plus detailed information about wait time. For each wait experienced during the processing, the following information
is given: the name of the wait event, the duration, and a few additional parameters identifying the resource that has been waited for.
• 16 level 1, plus the execution plans information is written to the trace file for each execution. • 32 level 1, but without the execution plans information.• 64 level 1, plus the execution plans information might be written for executions following the first one.
The condition is that, since the last write of execution plans information, a particular cursor consumed at least one additionalminute of DB time. This level is interesting in two cases. First, when the information about the first execution is not enough for analyzing a specific issue. Second, when the overhead of writing the information about every execution (level 16) is too high.
Level 12 (4 + 8): simultaneously enable level 4 and level 8.Level 28 (4 + 8 + 16): simultaneously enable level 4, level 8 and level 16.

@ViscosityNAviscosityna.com
SQL CBO Trace

@ViscosityNAviscosityna.com
Why SQL Cost Based Optimizer (CBO) Trace
Collects information on all steps the Optimizer takes– How the explain plans are generated– How the cost of the plan is generated–What object and system information was used
No additional items to installRequires some access to the database server to get trace file
Requires “ALTER SESSION” privilege
You need to flush the statement from cursor cache before trace!

@ViscosityNAviscosityna.com
Running a CBO Trace
Set the trace file name (easier to find in DIAGNOSTIC_DEST)ALTER SESSION SET tracefile_identifier = 'mycbotrace01';
Turn tracing onALTER SESSION SET timed_statistics = TRUE;ALTER SESSION SET statistics_level = all;ALTER SESSION SET max_dump_file_size = unlimited;-- CBO tracingALTER SESSION SET EVENTS '10053 trace name context forever, level 1'; -- Additional SQL trace informationALTER SESSION SET EVENTS '10046 trace name context forever, level 12';
Execute one or more SQL statementsSQL>

@ViscosityNAviscosityna.com
Running a CBO Trace – Cont.
Be sure to turn tracing off!ALTER SESSION SET EVENTS '10053 trace name context off'; ALTER SESSION SET EVENTS '10046 trace name context off';
Find the trace file in the database trace directory (DIAGNOSTIC_DEST)<SID>_ora_<PID>_<ID>.trc
This file can be very large! (10MB, 26MB etc.)
Another way to find the trace file:SQL> SELECT value
FROM v$diag_infoWHERE name = 'Default Trace File';

@ViscosityNAviscosityna.com
Running a CBO Trace – second method
CBO trace based on SQL ID (based on SQL ID in cursor cache)SQL> execute DBMS_SQLDIAG.DUMP_TRACE(-
p_sql_id=>'cjk13xfm8ybh7', -p_child_number=>0, -p_component=>'Optimizer', -p_file_id=>’mycbotrace02');
Find the trace file in the database trace directory (DIAGNOSTIC_DEST)<SID>_ora_<PID>_<ID>.trc
@ViscosityNAviscosityna.com
Digging into the Optimizer
@ViscosityNAviscosityna.com
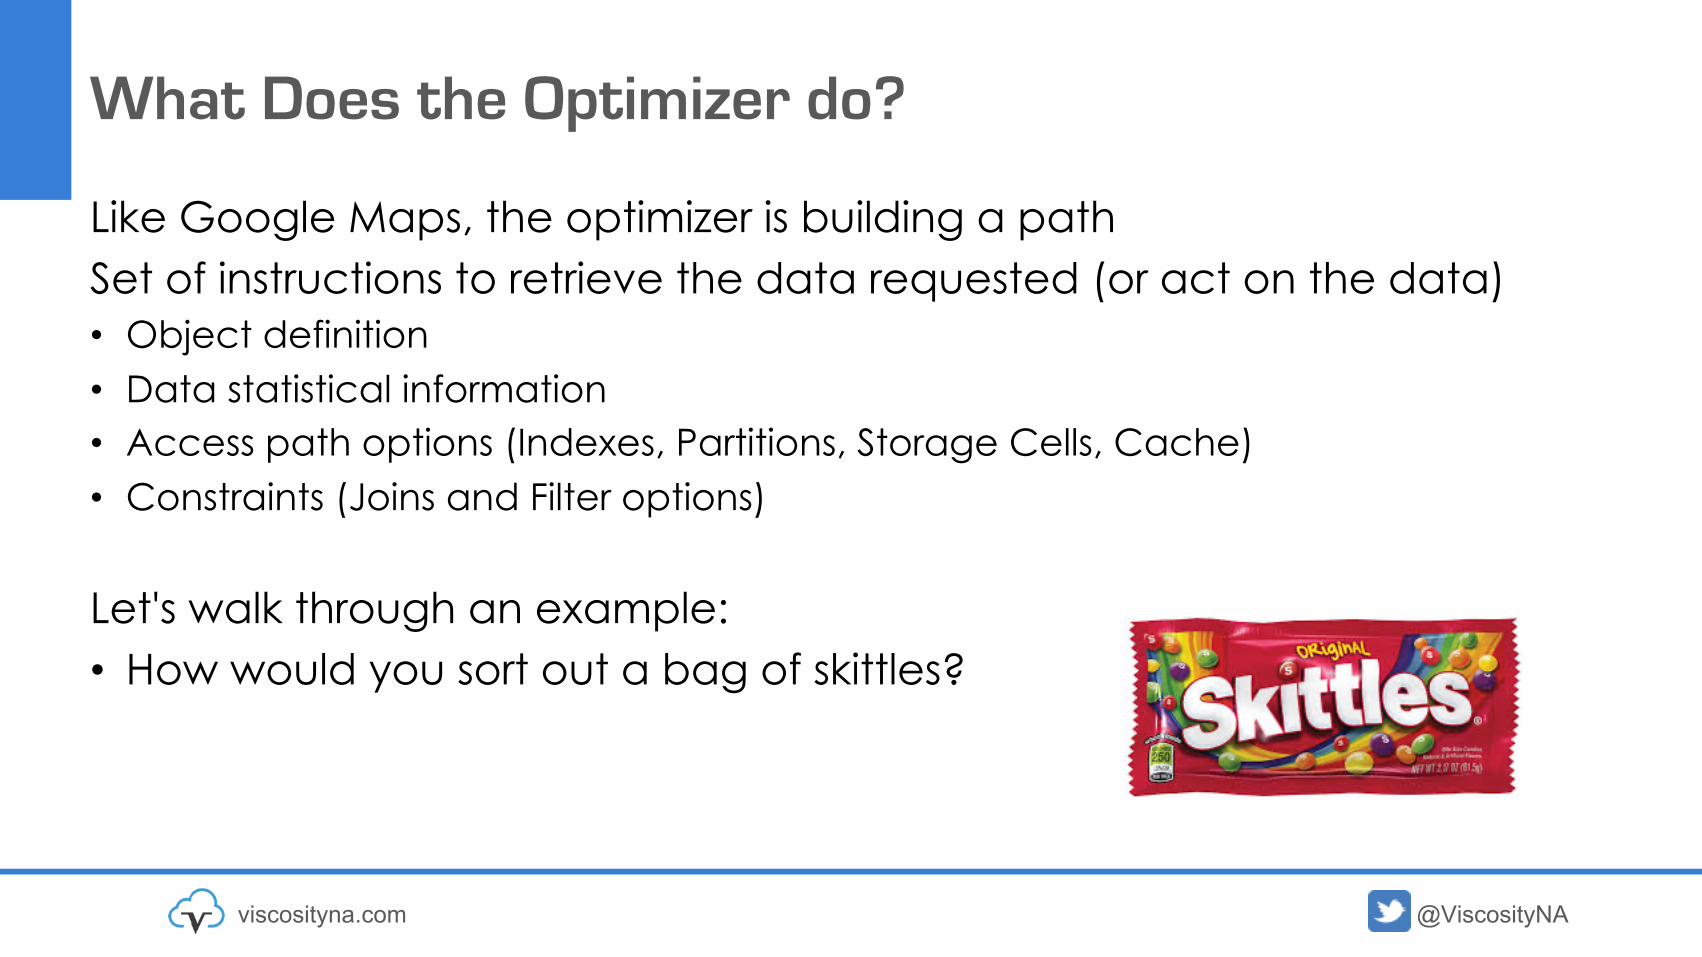
What Does the Optimizer do?
Like Google Maps, the optimizer is building a path Set of instructions to retrieve the data requested (or act on the data)• Object definition• Data statistical information• Access path options (Indexes, Partitions, Storage Cells, Cache)• Constraints (Joins and Filter options)
Let's walk through an example:• How would you sort out a bag of skittles?

@ViscosityNAviscosityna.com
How Would You?
How many candies of each color in a bag?How many candies of color blue in 5 bags?How many candies of color red in a large container?How many candies of color purple or yellow in 500 bags?
What if one person does this work?What if 10 people?Do you need one bowl?What if you have four bowls?
What would help you be more efficient?

@ViscosityNAviscosityna.com
What if You Had More Information
There are five colors (Yellow, Purple, Orange, Red, Green)Bag sizes:• Fun Size – 24 count• Original Size – 56 count• Party size – 50oz • Jar – 54ozWhat if you had five people to help?What if the colors were pre-sorted?

@ViscosityNAviscosityna.com
Normal distribution?
Normal distribution – five colors • Fun Size – 24 count = 24/5 = 4.8 of each color• Original Size – 2.17oz – 56 count = 11.2 of each color• Family size – 27.5oz = estimate 141.2 of each color• Jar – 54oz = estimate 278.7 of each color
Two original size bags – will you get 12 green each? Or 11? Or maybe 10?What if the distribution is not “normal”?
You need 24 green skittles

@ViscosityNAviscosityna.com
Some Terminology
• NDV - number of distinct values = unique possibilities– Age – 0 to probably 110?– Skittles colors – five (yellow, green, red, orange, purple)– U.S. Zip Codes – 41,688
• Cardinality – the percent of records that match a value or set of values– Estimate - ”normal distribution”– Actual – based on analysis of data
• #Rows – total number of rows in the table• AvgRowLen – number of bytes per row (inside a block)• Selectivity – how many rows will be retrieved (estimate)

@ViscosityNA
Example Tables
Tables t1 and t2Each has 500,000 rows of the same data
OWNER SEGMENT_NAME SEGMENT_TYPE TABLESPACE_NAME NO_EXTENTS SEG_SIZE-------- ------------- ------------ --------------- ---------- -----------PERFLAB T1 TABLE USERS 31 16,777,216
ROWNUM OWNER SEGMENT_NAME BYTES BLOCKS------ -------- ------------- ---------- ----------
1 PERFLAB T1 65536 816 PERFLAB T1 65536 817 PERFLAB T1 1048576 12831 PERFLAB T1 1048576 128
@ViscosityNA
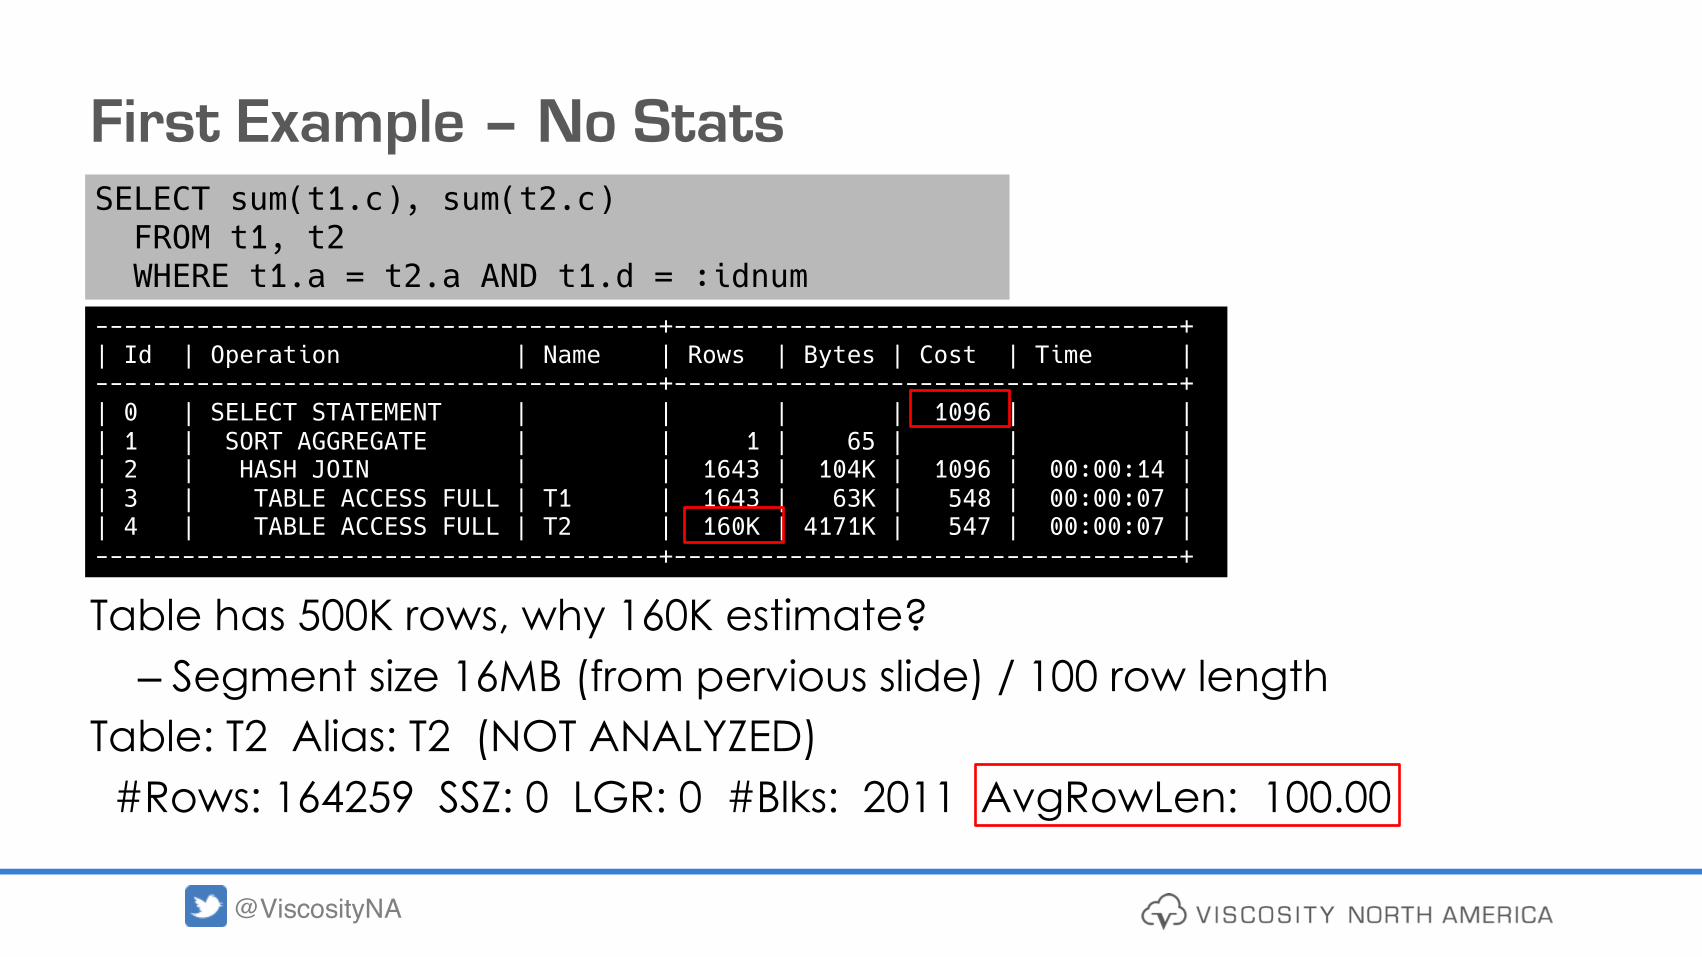
First Example – No Stats
Table has 500K rows, why 160K estimate?– Segment size 16MB (from pervious slide) / 100 row length
Table: T2 Alias: T2 (NOT ANALYZED)#Rows: 164259 SSZ: 0 LGR: 0 #Blks: 2011 AvgRowLen: 100.00
---------------------------------------+-----------------------------------+| Id | Operation | Name | Rows | Bytes | Cost | Time |---------------------------------------+-----------------------------------+| 0 | SELECT STATEMENT | | | | 1096 | || 1 | SORT AGGREGATE | | 1 | 65 | | || 2 | HASH JOIN | | 1643 | 104K | 1096 | 00:00:14 || 3 | TABLE ACCESS FULL | T1 | 1643 | 63K | 548 | 00:00:07 || 4 | TABLE ACCESS FULL | T2 | 160K | 4171K | 547 | 00:00:07 |---------------------------------------+-----------------------------------+
SELECT sum(t1.c), sum(t2.c) FROM t1, t2 WHERE t1.a = t2.a AND t1.d = :idnum
@ViscosityNA
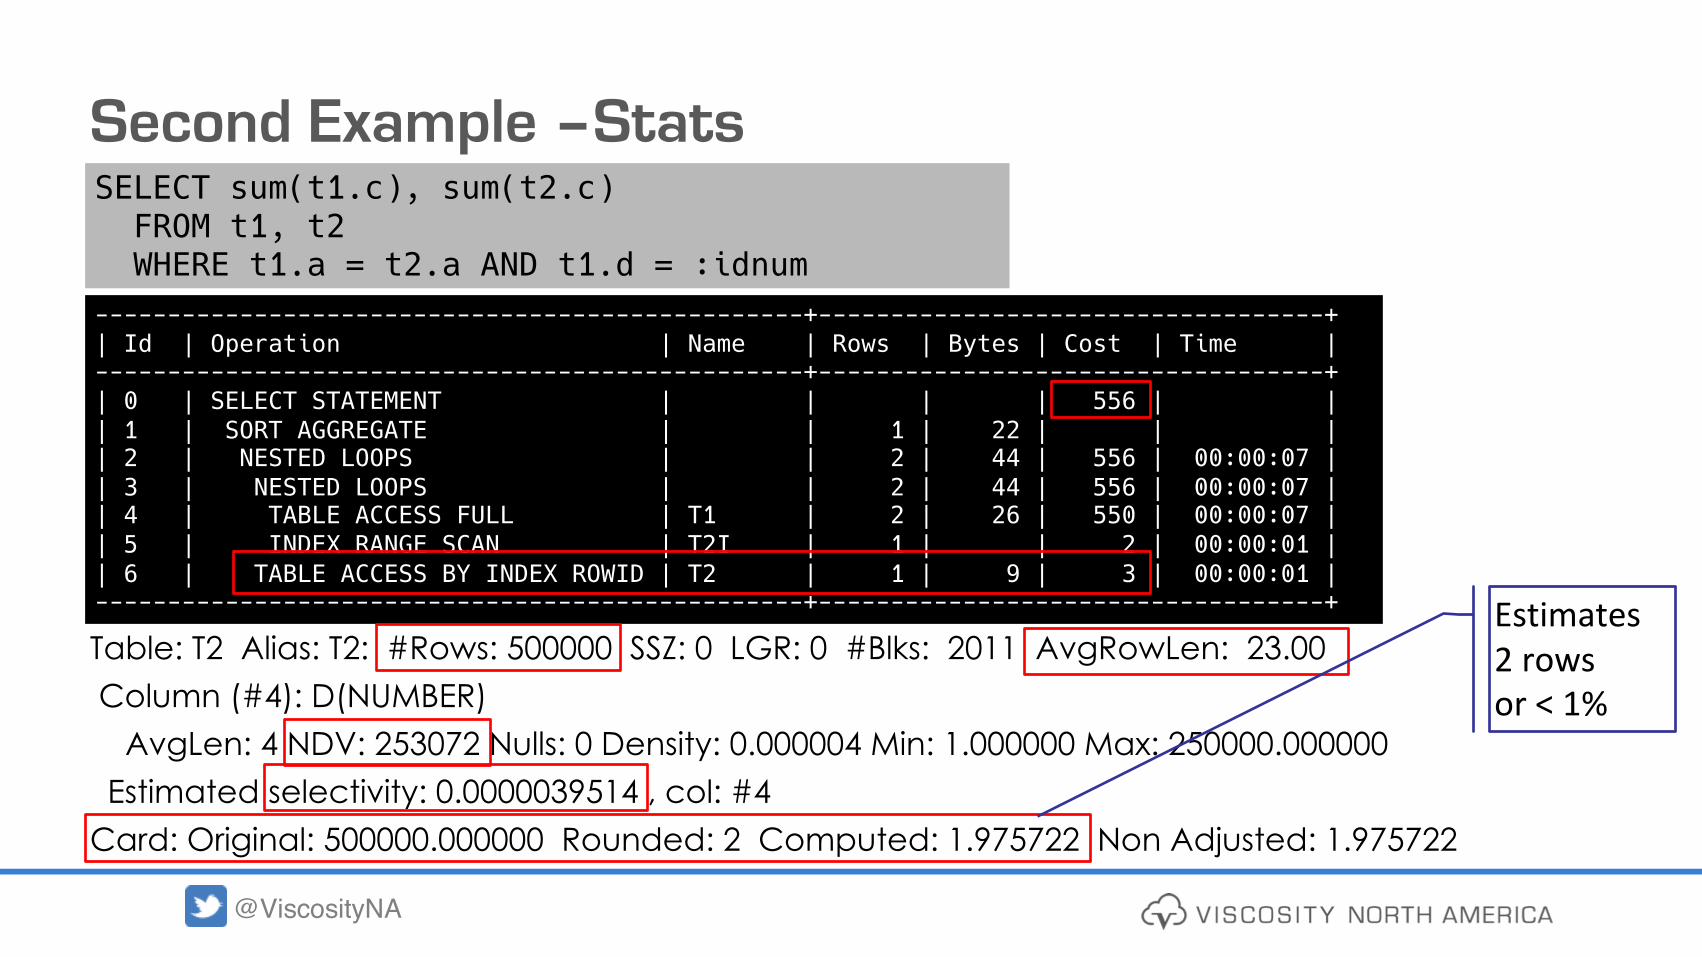
Second Example –Stats
Table: T2 Alias: T2: #Rows: 500000 SSZ: 0 LGR: 0 #Blks: 2011 AvgRowLen: 23.00 Column (#4): D(NUMBER)
AvgLen: 4 NDV: 253072 Nulls: 0 Density: 0.000004 Min: 1.000000 Max: 250000.000000Estimated selectivity: 0.0000039514 , col: #4
Card: Original: 500000.000000 Rounded: 2 Computed: 1.975722 Non Adjusted: 1.975722
-------------------------------------------------+-----------------------------------+| Id | Operation | Name | Rows | Bytes | Cost | Time |-------------------------------------------------+-----------------------------------+| 0 | SELECT STATEMENT | | | | 556 | || 1 | SORT AGGREGATE | | 1 | 22 | | || 2 | NESTED LOOPS | | 2 | 44 | 556 | 00:00:07 || 3 | NESTED LOOPS | | 2 | 44 | 556 | 00:00:07 || 4 | TABLE ACCESS FULL | T1 | 2 | 26 | 550 | 00:00:07 || 5 | INDEX RANGE SCAN | T2I | 1 | | 2 | 00:00:01 || 6 | TABLE ACCESS BY INDEX ROWID | T2 | 1 | 9 | 3 | 00:00:01 |-------------------------------------------------+-----------------------------------+
SELECT sum(t1.c), sum(t2.c) FROM t1, t2 WHERE t1.a = t2.a AND t1.d = :idnum
Estimates2 rowsor < 1%

@ViscosityNA
Second Example –Stats + Histograms
Column (#4): D(NUMBER)AvgLen: 4 NDV: 253072 Nulls: 0 Density: 0.000002 Min: 1.000000 Max: 250000.000000Histogram: Hybrid #Bkts: 254 UncompBkts: 5433 EndPtVals: 254 ActualVal: yes
Estimated selectivity: 0.493858 , endpoint value predicate, col: #4 Card: Original: 500000.000000 Computed: 246929.000000 Non Adjusted: 246929.000000
---------------------------------------+-----------------------------------+| Id | Operation | Name | Rows | Bytes | Cost | Time |---------------------------------------+-----------------------------------+| 0 | SELECT STATEMENT | | | | 1893 | || 1 | SORT AGGREGATE | | 1 | 22 | | || 2 | HASH JOIN | | 241K | 5305K | 1893 | 00:00:23 || 3 | TABLE ACCESS FULL | T1 | 241K | 3135K | 550 | 00:00:07 || 4 | TABLE ACCESS FULL | T2 | 488K | 4395K | 549 | 00:00:07 |---------------------------------------+-----------------------------------+
SELECT sum(t1.c), sum(t2.c) FROM t1, t2 WHERE t1.a = t2.a AND t1.d = :idnum
We went from:2 rows24,6929 rowsOr 49.3%

@ViscosityNA
What have I not been telling you?
Tables t1 and t2• Each has 50,000 rows• Column D – 250,001 rows value = 10– 249,999 rows “random” unique value
So, if I search for d=10–Oracle must find ½ the table
If I search for d=1000–Oracle must find 1 record
Joining 2 tables using “most” of the data – Hash Join
Joining 2 tables looking for just 1 record in each table –Nested Loops

@ViscosityNAviscosityna.com
Execution Plans Are Not Absolutes!
An execution plan can have different costsA SQL may run better with different execution plans at different timesPlan stability tools can help and can hurt performance– SQL Profiles are statistical information on generating plans– SQL Baselines allow for multiple plans– SQL Patches are the “hammer” of the toolset
Your system will change over time– Data growth / change– Hardware changes– Software changes
Your tuning methodology needs to adapt to change!
@ViscosityNAviscosityna.com
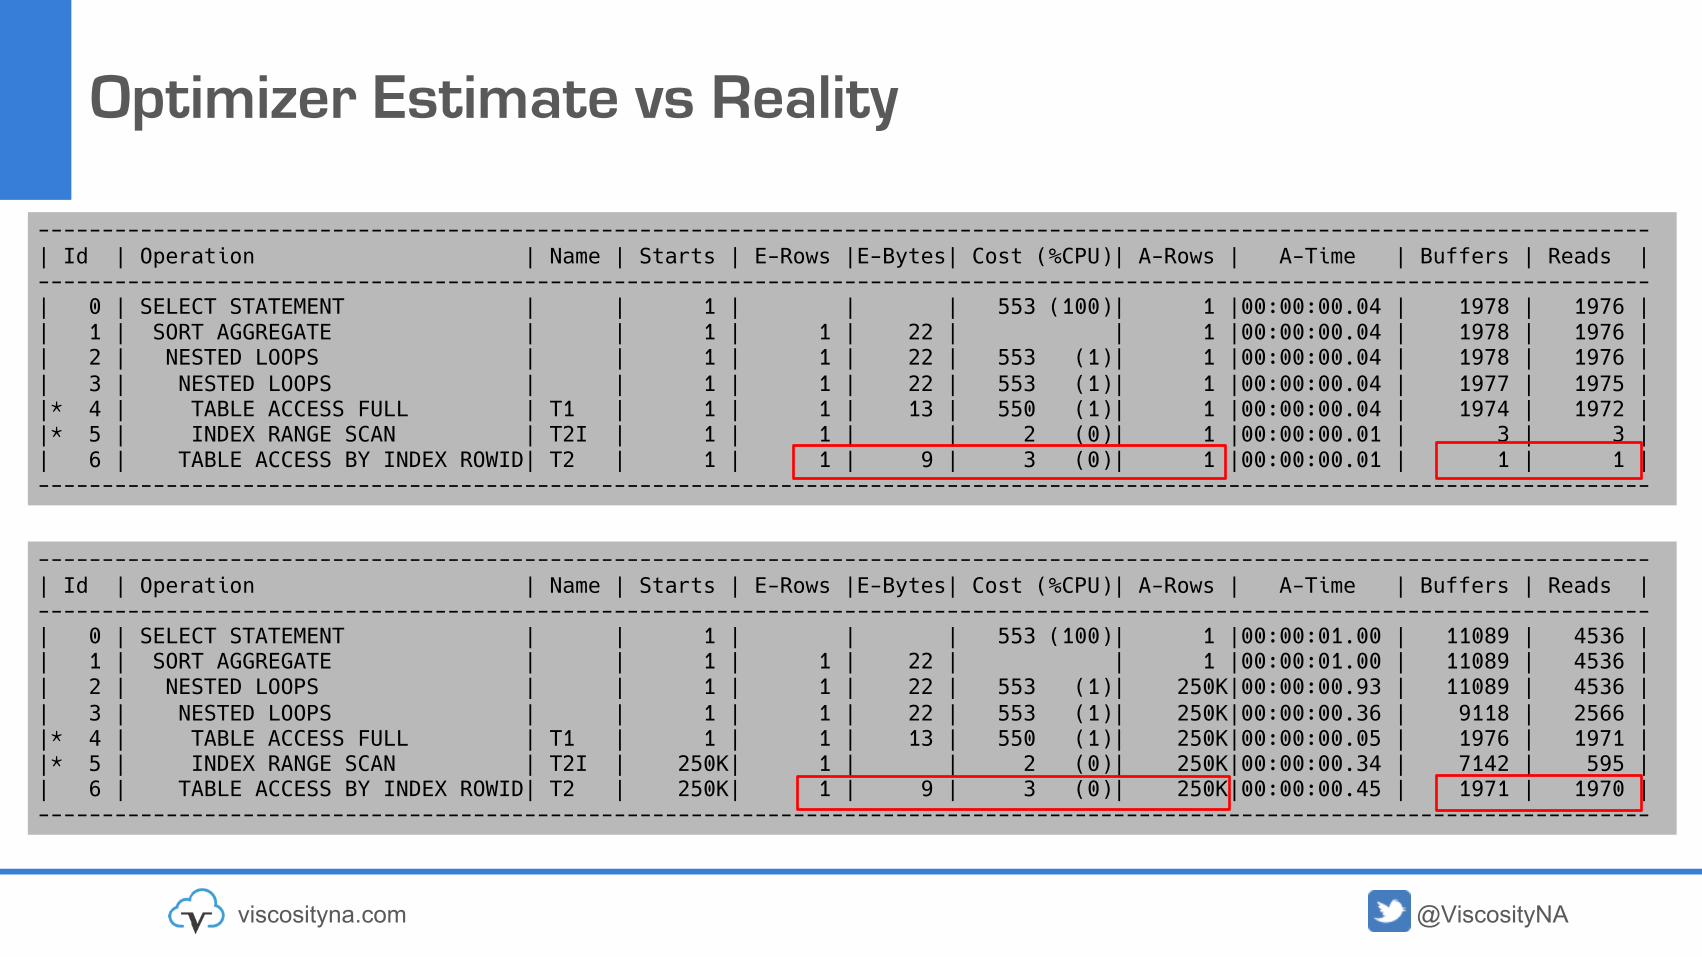
Optimizer Estimate vs Reality
------------------------------------------------------------------------------------------------------------------------------| Id | Operation | Name | Starts | E-Rows |E-Bytes| Cost (%CPU)| A-Rows | A-Time | Buffers | Reads |------------------------------------------------------------------------------------------------------------------------------| 0 | SELECT STATEMENT | | 1 | | | 553 (100)| 1 |00:00:00.04 | 1978 | 1976 || 1 | SORT AGGREGATE | | 1 | 1 | 22 | | 1 |00:00:00.04 | 1978 | 1976 || 2 | NESTED LOOPS | | 1 | 1 | 22 | 553 (1)| 1 |00:00:00.04 | 1978 | 1976 || 3 | NESTED LOOPS | | 1 | 1 | 22 | 553 (1)| 1 |00:00:00.04 | 1977 | 1975 ||* 4 | TABLE ACCESS FULL | T1 | 1 | 1 | 13 | 550 (1)| 1 |00:00:00.04 | 1974 | 1972 ||* 5 | INDEX RANGE SCAN | T2I | 1 | 1 | | 2 (0)| 1 |00:00:00.01 | 3 | 3 || 6 | TABLE ACCESS BY INDEX ROWID| T2 | 1 | 1 | 9 | 3 (0)| 1 |00:00:00.01 | 1 | 1 |------------------------------------------------------------------------------------------------------------------------------
------------------------------------------------------------------------------------------------------------------------------| Id | Operation | Name | Starts | E-Rows |E-Bytes| Cost (%CPU)| A-Rows | A-Time | Buffers | Reads |------------------------------------------------------------------------------------------------------------------------------| 0 | SELECT STATEMENT | | 1 | | | 553 (100)| 1 |00:00:01.00 | 11089 | 4536 || 1 | SORT AGGREGATE | | 1 | 1 | 22 | | 1 |00:00:01.00 | 11089 | 4536 || 2 | NESTED LOOPS | | 1 | 1 | 22 | 553 (1)| 250K|00:00:00.93 | 11089 | 4536 || 3 | NESTED LOOPS | | 1 | 1 | 22 | 553 (1)| 250K|00:00:00.36 | 9118 | 2566 ||* 4 | TABLE ACCESS FULL | T1 | 1 | 1 | 13 | 550 (1)| 250K|00:00:00.05 | 1976 | 1971 ||* 5 | INDEX RANGE SCAN | T2I | 250K| 1 | | 2 (0)| 250K|00:00:00.34 | 7142 | 595 || 6 | TABLE ACCESS BY INDEX ROWID| T2 | 250K| 1 | 9 | 3 (0)| 250K|00:00:00.45 | 1971 | 1970 |------------------------------------------------------------------------------------------------------------------------------

@ViscosityNA
Same Query – Two Different Plans
The Optimizer decides
Why one over the other?
@ViscosityNAviscosityna.com
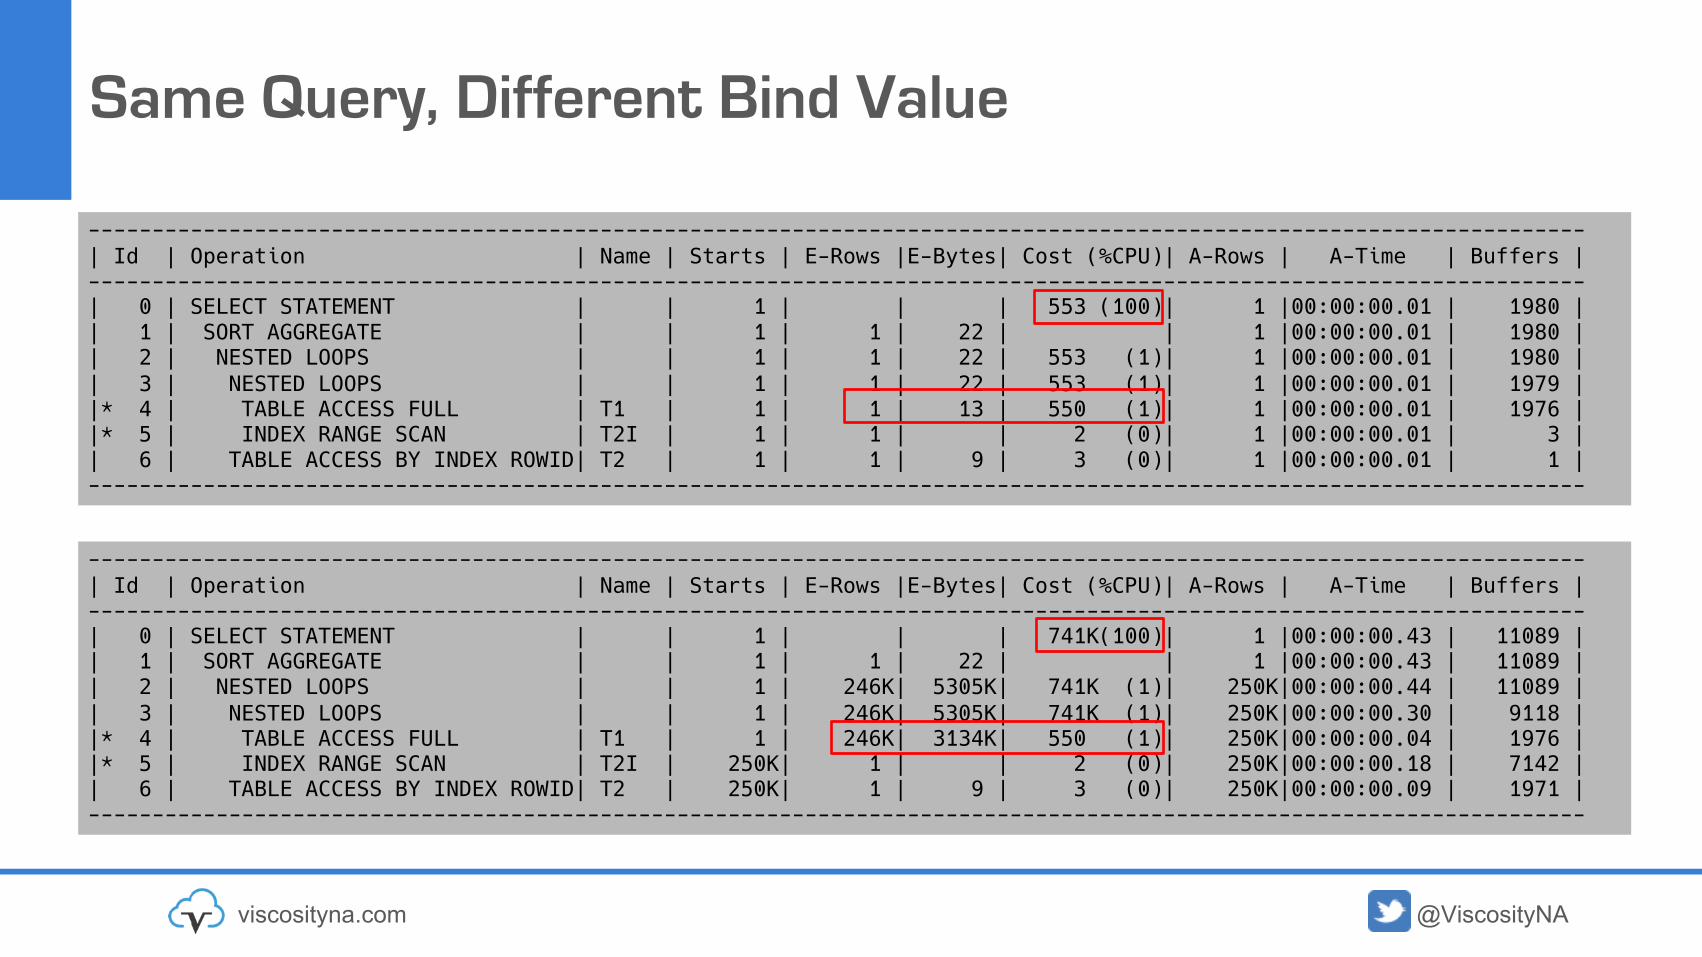
Same Query, Different Bind Value
---------------------------------------------------------------------------------------------------------------------| Id | Operation | Name | Starts | E-Rows |E-Bytes| Cost (%CPU)| A-Rows | A-Time | Buffers |---------------------------------------------------------------------------------------------------------------------| 0 | SELECT STATEMENT | | 1 | | | 553 (100)| 1 |00:00:00.01 | 1980 || 1 | SORT AGGREGATE | | 1 | 1 | 22 | | 1 |00:00:00.01 | 1980 || 2 | NESTED LOOPS | | 1 | 1 | 22 | 553 (1)| 1 |00:00:00.01 | 1980 || 3 | NESTED LOOPS | | 1 | 1 | 22 | 553 (1)| 1 |00:00:00.01 | 1979 ||* 4 | TABLE ACCESS FULL | T1 | 1 | 1 | 13 | 550 (1)| 1 |00:00:00.01 | 1976 ||* 5 | INDEX RANGE SCAN | T2I | 1 | 1 | | 2 (0)| 1 |00:00:00.01 | 3 || 6 | TABLE ACCESS BY INDEX ROWID| T2 | 1 | 1 | 9 | 3 (0)| 1 |00:00:00.01 | 1 |---------------------------------------------------------------------------------------------------------------------
---------------------------------------------------------------------------------------------------------------------| Id | Operation | Name | Starts | E-Rows |E-Bytes| Cost (%CPU)| A-Rows | A-Time | Buffers |---------------------------------------------------------------------------------------------------------------------| 0 | SELECT STATEMENT | | 1 | | | 741K(100)| 1 |00:00:00.43 | 11089 || 1 | SORT AGGREGATE | | 1 | 1 | 22 | | 1 |00:00:00.43 | 11089 || 2 | NESTED LOOPS | | 1 | 246K| 5305K| 741K (1)| 250K|00:00:00.44 | 11089 || 3 | NESTED LOOPS | | 1 | 246K| 5305K| 741K (1)| 250K|00:00:00.30 | 9118 ||* 4 | TABLE ACCESS FULL | T1 | 1 | 246K| 3134K| 550 (1)| 250K|00:00:00.04 | 1976 ||* 5 | INDEX RANGE SCAN | T2I | 250K| 1 | | 2 (0)| 250K|00:00:00.18 | 7142 || 6 | TABLE ACCESS BY INDEX ROWID| T2 | 250K| 1 | 9 | 3 (0)| 250K|00:00:00.09 | 1971 |---------------------------------------------------------------------------------------------------------------------
@ViscosityNAviscosityna.com
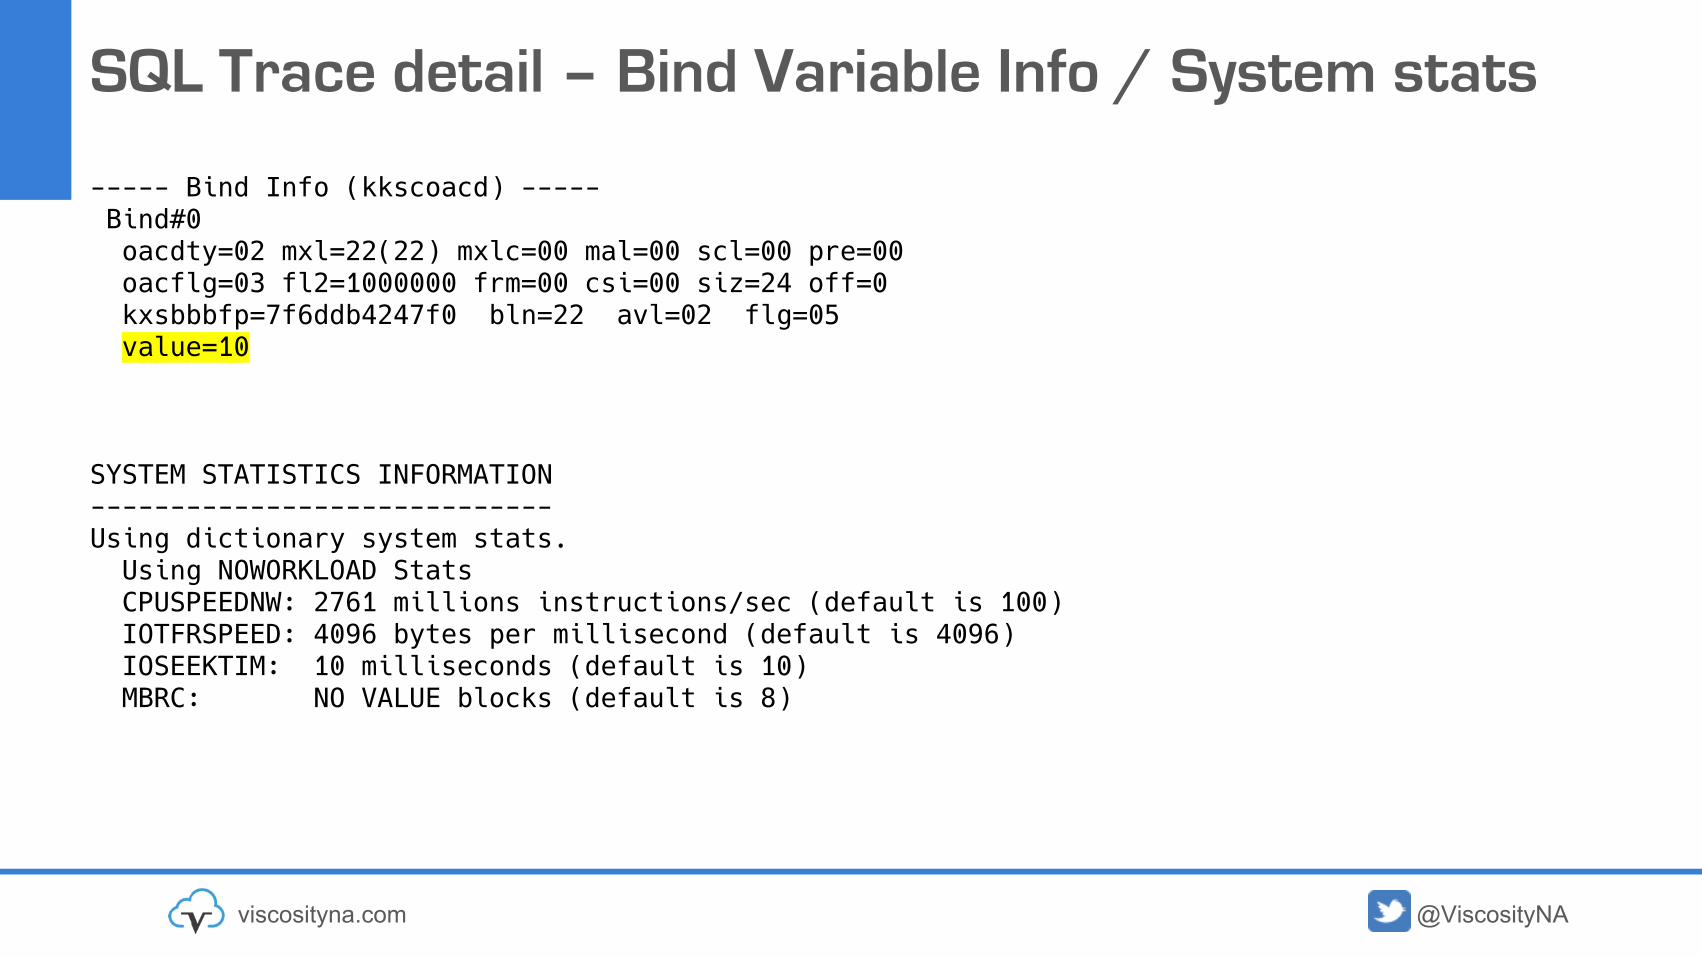
SQL Trace detail – Bind Variable Info / System stats
----- Bind Info (kkscoacd) -----Bind#0oacdty=02 mxl=22(22) mxlc=00 mal=00 scl=00 pre=00oacflg=03 fl2=1000000 frm=00 csi=00 siz=24 off=0kxsbbbfp=7f6ddb4247f0 bln=22 avl=02 flg=05value=10
SYSTEM STATISTICS INFORMATION-----------------------------Using dictionary system stats.Using NOWORKLOAD StatsCPUSPEEDNW: 2761 millions instructions/sec (default is 100)IOTFRSPEED: 4096 bytes per millisecond (default is 4096)IOSEEKTIM: 10 milliseconds (default is 10)MBRC: NO VALUE blocks (default is 8)

@ViscosityNA
System Statistics
Stored in sys.aux_stats$ table, if you collect No Workload system stats:• CPUSPEEDNW Represents no-workload, average number of CPU cycles (millions/sec)• IOSEEKTIM Represents the time it takes to position the disk head to read data (ms)• IOTFRSPEED single random IO read request (bytes/ms)
If you have collected Workload system stats:• SREADTIM Single-block read time is the average time to read a single block randomly (ms)• MREADTIM Multiblock read is the average time to read a multiblock sequentially (ms)• CPUSPEED Represents workload average number of CPU cycles (millions/sec)• MBRC Average sequential multiblock read count (blocks)• MAXTHR Maximum throughput that the I/O subsystem can deliver (bytes/sec).• SLAVETHR Average parallel execution server I/O throughput (bytes/sec)
@ViscosityNA
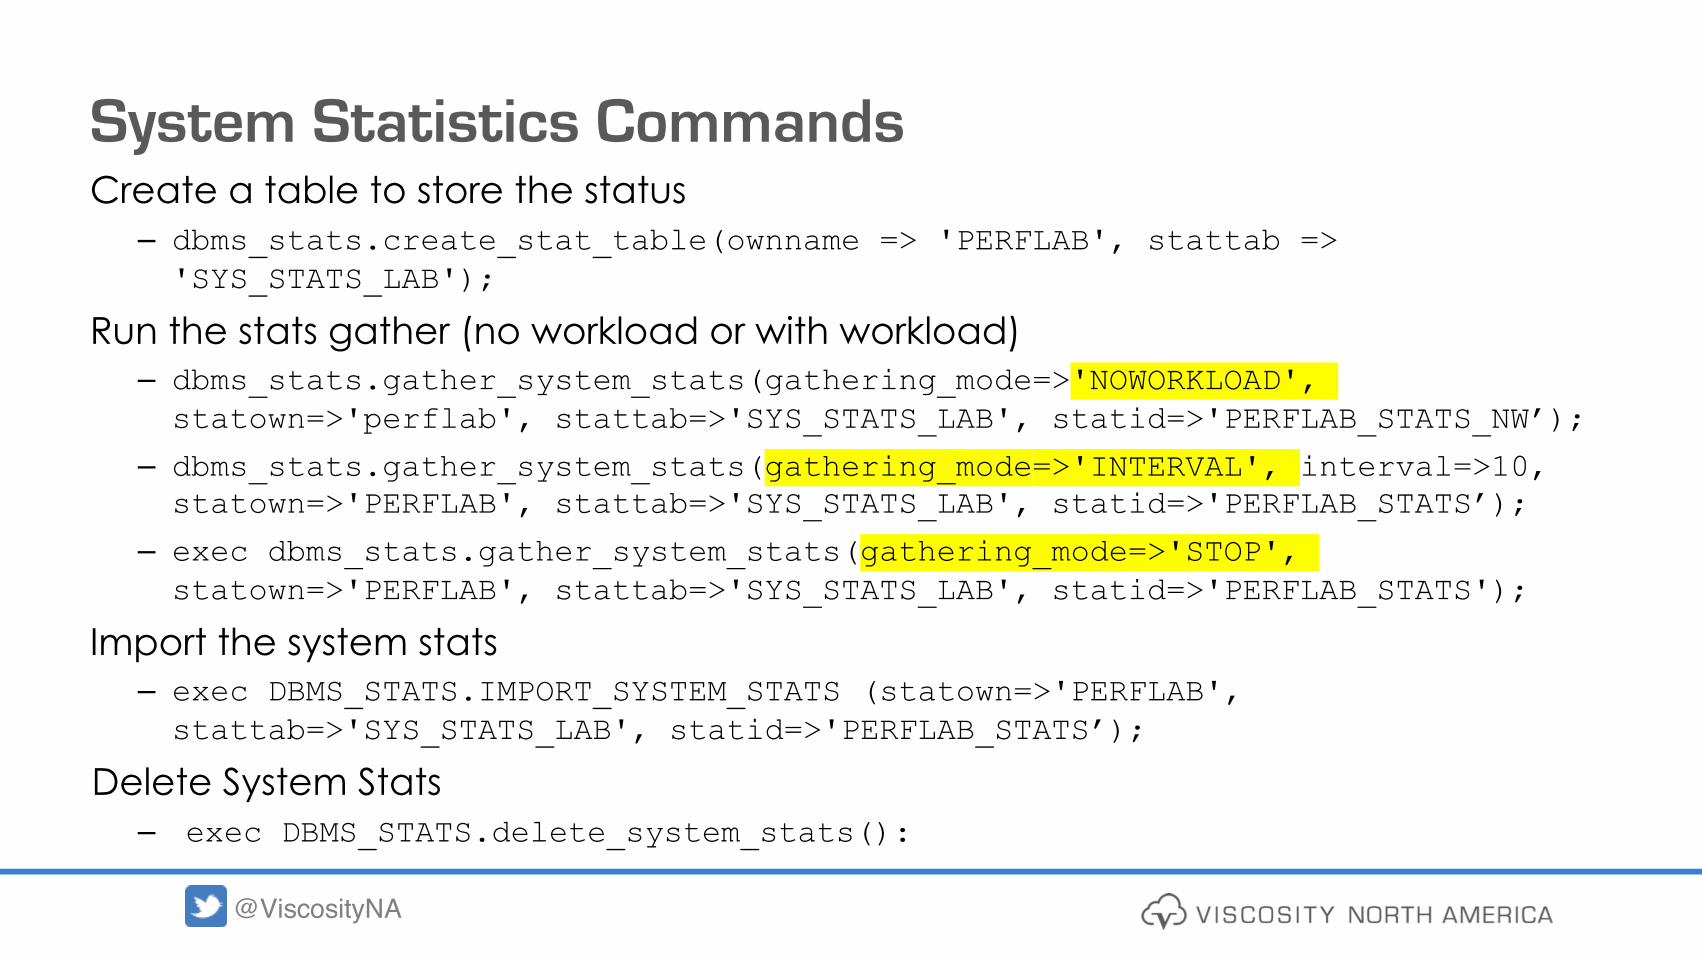
System Statistics CommandsCreate a table to store the status– dbms_stats.create_stat_table(ownname => 'PERFLAB', stattab => 'SYS_STATS_LAB');
Run the stats gather (no workload or with workload)– dbms_stats.gather_system_stats(gathering_mode=>'NOWORKLOAD', statown=>'perflab', stattab=>'SYS_STATS_LAB', statid=>'PERFLAB_STATS_NW’);
– dbms_stats.gather_system_stats(gathering_mode=>'INTERVAL', interval=>10, statown=>'PERFLAB', stattab=>'SYS_STATS_LAB', statid=>'PERFLAB_STATS’);
– exec dbms_stats.gather_system_stats(gathering_mode=>'STOP', statown=>'PERFLAB', stattab=>'SYS_STATS_LAB', statid=>'PERFLAB_STATS');
Import the system stats– exec DBMS_STATS.IMPORT_SYSTEM_STATS (statown=>'PERFLAB', stattab=>'SYS_STATS_LAB', statid=>'PERFLAB_STATS’);
Delete System Stats– exec DBMS_STATS.delete_system_stats():
@ViscosityNAviscosityna.com
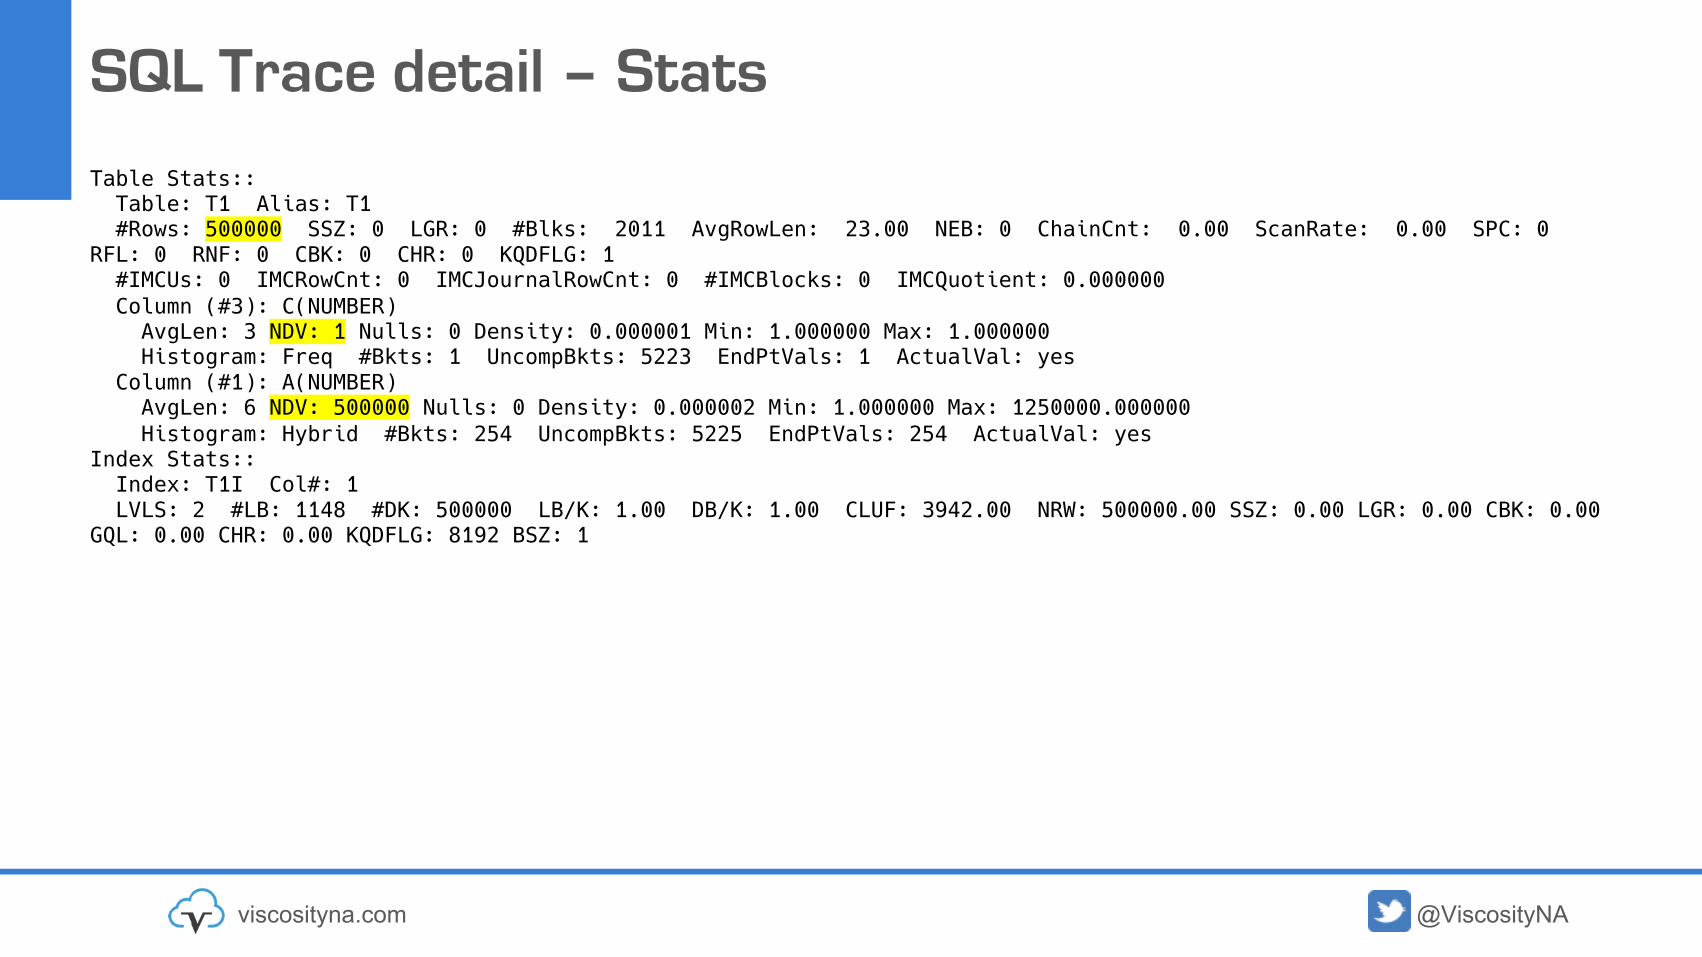
SQL Trace detail – Stats
Table Stats::Table: T1 Alias: T1#Rows: 500000 SSZ: 0 LGR: 0 #Blks: 2011 AvgRowLen: 23.00 NEB: 0 ChainCnt: 0.00 ScanRate: 0.00 SPC: 0
RFL: 0 RNF: 0 CBK: 0 CHR: 0 KQDFLG: 1#IMCUs: 0 IMCRowCnt: 0 IMCJournalRowCnt: 0 #IMCBlocks: 0 IMCQuotient: 0.000000Column (#3): C(NUMBER)AvgLen: 3 NDV: 1 Nulls: 0 Density: 0.000001 Min: 1.000000 Max: 1.000000Histogram: Freq #Bkts: 1 UncompBkts: 5223 EndPtVals: 1 ActualVal: yes
Column (#1): A(NUMBER)AvgLen: 6 NDV: 500000 Nulls: 0 Density: 0.000002 Min: 1.000000 Max: 1250000.000000Histogram: Hybrid #Bkts: 254 UncompBkts: 5225 EndPtVals: 254 ActualVal: yes
Index Stats::Index: T1I Col#: 1LVLS: 2 #LB: 1148 #DK: 500000 LB/K: 1.00 DB/K: 1.00 CLUF: 3942.00 NRW: 500000.00 SSZ: 0.00 LGR: 0.00 CBK: 0.00
GQL: 0.00 CHR: 0.00 KQDFLG: 8192 BSZ: 1

@ViscosityNAviscosityna.com
SQL Trace detail – Table Scan E.G. 1Access path analysis for EMPLOYEES***************************************SINGLE TABLE ACCESS PATH Single Table Cardinality Estimation for EMPLOYEES[E] SPD: Return code in qosdDSDirSetup: NOCTX, estType = TABLE
kkecdn: Single Table Predicate:"E"."STAFFNO"<=10Column (#5): STAFFNO(NUMBER)AvgLen: 4 NDV: 500 Nulls: 0 Density: 0.002000 Min: 1.000000 Max: 500.000000
Estimated selectivity: 0.020036 , col: #5Table: EMPLOYEES Alias: ECard: Original: 500.000000 Rounded: 10 Computed: 10.018036 Non Adjusted: 10.018036
Scan IO Cost (Disk) = 3.000000Scan CPU Cost (Disk) = 150607.200000Cost of predicates:io = NOCOST, cpu = 50.000000, sel = 0.020036 flag = 2048 ("E"."STAFFNO"<=10)
Total Scan IO Cost = 3.000000 (scan (Disk))+ 0.000000 (io filter eval) (= 0.000000 (per row) * 500.000000 (#rows))
= 3.000000Total Scan CPU Cost = 150607.200000 (scan (Disk))
+ 25000.000000 (cpu filter eval) (= 50.000000 (per row) * 500.000000 (#rows))= 175607.200000
Access Path: TableScanCost: 3.005902 Resp: 3.005902 Degree: 0Cost_io: 3.000000 Cost_cpu: 175607Resp_io: 3.000000 Resp_cpu: 175607
Best:: AccessPath: TableScanCost: 3.005902 Degree: 1 Resp: 3.005902 Card: 10.018036 Bytes: 0.000000

@ViscosityNAviscosityna.com
SQL Trace detail – Table Scan E.G. 2Access path analysis for T1***************************************SINGLE TABLE ACCESS PATH Single Table Cardinality Estimation for T1[T1] SPD: Return code in qosdDSDirSetup: NOCTX, estType = TABLEkkecdn: Single Table Predicate:"T1"."D"=:B1Column (#4): NewDensity:0.000002, OldDensity:0.000003 BktCnt:5225.000000, PopBktCnt:2633.000000, PopValCnt:1, NDV:253072
Column (#4): D(NUMBER)AvgLen: 4 NDV: 253072 Nulls: 0 Density: 0.000002 Min: 1.000000 Max: 250000.000000Histogram: Hybrid #Bkts: 254 UncompBkts: 5225 EndPtVals: 254 ActualVal: yes
Estimated selectivity: 0.493858 , endpoint value predicate, col: #4Table: T1 Alias: T1Card: Original: 500000.000000 Rounded: 246929 Computed: 246929.000000 Non Adjusted: 246929.000000
Scan IO Cost (Disk) = 546.000000Scan CPU Cost (Disk) = 119321215.840000Cost of predicates:io = NOCOST, cpu = 50.000000, sel = 0.493858 flag = 2048 ("T1"."D"=:B1)
Total Scan IO Cost = 546.000000 (scan (Disk))+ 0.000000 (io filter eval) (= 0.000000 (per row) * 500000.000000 (#rows))
= 546.000000Total Scan CPU Cost = 119321215.840000 (scan (Disk))
+ 25000000.000000 (cpu filter eval) (= 50.000000 (per row) * 500000.000000 (#rows))= 144321215.840000
Best:: AccessPath: TableScanCost: 550.355946 Degree: 1 Resp: 550.355946 Card: 246929.000000 Bytes: 0.000000

@ViscosityNAviscosityna.com
SQL Trace detail – Table JoinsJoin order[1]: T1[T1]#0 T2[T2]#1
Now joining: T2[T2]#1***************NL Join (NL - nested loops (join))Best NL cost: 741505.823354
resc: 741505.823354 resc_io: 741333.000000 resc_cpu: 5725983349 (Resc - resource cost)
Join Card: 246929.000000 = outer (246929.000000) * inner (500000.000000) * sel (2.0000e-06)Join Card - Rounded: 246929 Computed: 246929.000000
SM Join (SM - sort merge (join))SM cost: 4181.015172
resc: 4181.015172 resc_io: 4151.000000 resc_cpu: 994462669 (Resc - resource cost)SM Join (with index on outer)
HA Join (HA - hash (join))HA cost: 1893.061885
resc: 1893.061885 resc_io: 1881.000000 resc_cpu: 399634373 (Resc - resource cost)
Best:: JoinMethod: HashCost: 1893.061885 Degree: 1 Resp: 1893.061885 Card: 246929.000000 Bytes:
***********************Best so far: Table#: 0 cost: 550.355946 card: 246929.000000 bytes: 3210077.000000
Table#: 1 cost: 1893.061885 card: 246929.000000 bytes: 5432438.000000
*********************************Number of join permutations tried: 2

@ViscosityNAviscosityna.com
Playing With the Optimizer - 1
My SQL is not picking up an index.
1. Flush statement from cursor cache2. At session level set:
3. Run Explain Plan
Forcing indexes to be 99% less expensive than would normally be
ALTER SESSION SET optimizer_index_cost_adj = 1;

@ViscosityNAviscosityna.com
Playing With the Optimizer - 2
My SQL is not picking up an index.
1. Flush statement from cursor cache2. At session level set:
possible options are CHOOSE, CPU, IO3. Run Explain Plan
Forcing Optimizer to cost on a different resource
ALTER SESSION SET "_optimizer_cost_model"=IO;
@ViscosityNAviscosityna.com
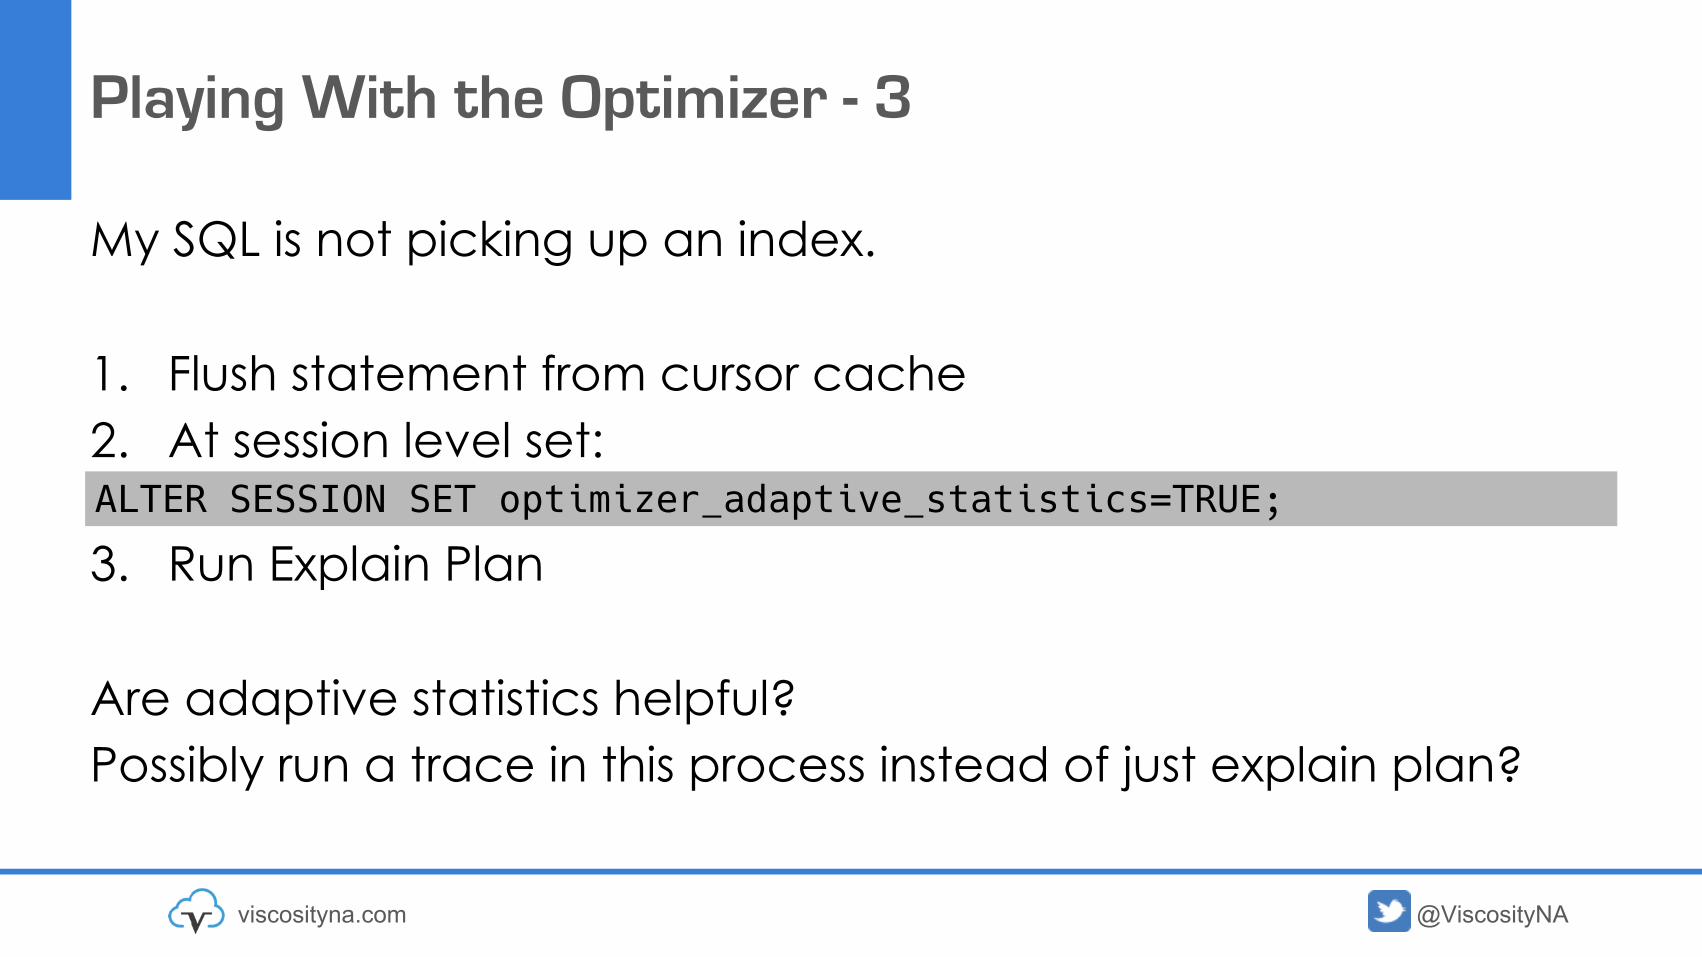
Playing With the Optimizer - 3
My SQL is not picking up an index.
1. Flush statement from cursor cache2. At session level set:
3. Run Explain Plan
Are adaptive statistics helpful?Possibly run a trace in this process instead of just explain plan?
ALTER SESSION SET optimizer_adaptive_statistics=TRUE;
@ViscosityNAviscosityna.com
Optimizer SQL Steps
SQL Syntax Check OptimizationSemantic
Check
Shared Pool
Check
ParsingRow Source Generation Execution
Plan1 --2 –-3 –-4 --
Plan1 --2 –-3 –-4 --
Plan1 --2 –-3 –-4 --
Plan1 --2 –-3 –-4 --
Plan1 --2 –-3 –-4 --
GenerateMultiple
Execution Plan Options Query Plan
(make Outline)
Shared Pool
Soft Parse
Hard Parse ->
Plan1 --2 –-3 –-4 --
Object
StatisticsSystem Statistics
SQL
Profile
Baseline/*+ --
–-–-
*/
Outline/*+ --
–-–-
*/
*Explain will show soft parse detail if available
Note: Soft Parsing is impacted by bind variable values
Explain Plan* / MonitorSQL Health Check
SQL Trace SQLTXplain
CBO Trace
@ViscosityNAviscosityna.com
Wrapping Up
Have these tools ready to use!Know when each tool might be usefulOracle will tune a lot of things for you, but sometimes it wont
Don’t trace everything! Be surgical or specific!
Practice in non-production!

@ViscosityNAviscosityna.com
References
• Diagnostics for Query Tuning Problems (Doc ID 68735.1)• SQL Tuning Health-Check Script (SQLHC) (Doc ID 1366133.1)• SQLT Usage Instructions (Doc ID 1614107.1)• How To Collect 10046 Trace (SQL_TRACE) Diagnostics for Performance Issues (Doc ID 376442.1)• EVENT: 10046 "enable SQL statement tracing (including binds/waits)" (Doc ID 21154.1)• Interpreting Raw SQL_TRACE output (Doc ID 39817.1)• How to Obtain Tracing of Optimizer Computations (EVENT 10053) (Doc ID 225598.1)

Contact Viscosity @ViscosityNAviscosityna.com
Facebook.com/ViscosityNA
Linkedin.com/company/Viscosity-North-America
@ViscosityNA
Viscosity North America
@Viscosity_NA
Follow Us Online!

@ViscosityNAwww.viscosityna.com