Deep Attention Model for the Hierarchical Diagnosis of...
9
Deep Attention Model for the Hierarchical Diagnosis of Skin Lesions Catarina Barata, Jorge S. Marques Institute for Systems and Robotics Lisbon, Portugal [email protected] M. Emre Celebi University of Central Arkansas Conway, AR, USA Abstract Deep learning has played a major role in the recent advances in the dermoscopy image analysis field. How- ever, such advances came at the cost of reducing the in- terpretability of the developed diagnostic systems, which do not comply with the requirements of the medical community nor with the most recent laws on machine learning explain- ability. Recent advances in the deep learning field, namely attention maps, improved the interpretability of these meth- ods. Incorporating medical knowledge in the systems has also proved useful to increase their performance. In this work we propose to combine these two approaches in a for- mulation that: i) makes use of the hierarchical organization of skin lesions, as identified by dermatologists, to develop a classification model; and ii) uses an attention module to identify relevant regions in the skin lesions and guide the classification decisions. We demonstrate the potential of the proposed approach in two state-of-the-art dermoscopy sets (ISIC 2017 and ISIC 2018). 1. Introduction The deep learning revolution has brought significant ad- vances in various fields, particularly in medical image anal- ysis [18]. In particular, the field of dermoscopy image anal- ysis has seen a boom in the past few years, with several works relying on deep convolution neural networks (CNNs) to achieve increasingly better results in lesion diagnosis, which have started to rival the performance of trained der- matologists [12]. On par with CNNs, the release of public image data sets such as the ISIC archive [8] or PH 2 [20], has also contributed to the growing interest on this topic. There has been an effort to provide more insights on the factors that influence the performance of CNNs on lesion diagnosis, namely: i) performing data augmentation, both on the training [30] and test sets [23]; ii) using different ar- chitectures [14], as well as combining them in ensembles; iii) studying the best strategies for transfer learning; and iv) assessing the importance of image dimensions and other re- lated properties [29]. Despite the aforementioned efforts, there are still as- pects of the learning procedure that are not fully under- stood, while the decision process is not self-explainable. This hampers the transition of deep learning methods to the clinical practice, especially if one takes into consideration the recent European Unions General Data Protection Reg- ulation, which mandates that any machine learning based method that is designed to interact with humans, such as a computer aided-diagnosis systems must be self-explainable. Therefore, it is important to design strategies that take ad- vantage of the representation and classification power of CNNs, and at the same time are transparent and understand- able [6]. Various strategies have been used to give interpretability to CNNs, such as: i) use of class activation (CAM) or at- tention maps that highlight the most relevant regions in the lesion for a decision and guide the network regarding the most discriminating feature maps [33, 25, 34]; ii) incorpo- ration of the detection of relevant dermoscopic criteria in the CNNs (high level features) [16, 13]; and iii) incorpo- ration of CNN features into a content-based image retrieval system (CBIR), which provides the user with examples sim- ilar to the one being diagnosed [9]. However, there are few evidences that these approaches lead to significantly better performance w.r.t to less transparent deep learning meth- ods. Notorious examples are methods based on CBIR that demonstrated: i) the ability to be extended to the diagnosis of unknown diseases [27]; and ii) the capability to improve the diagnostic confidence of dermatologists [24]. In this work we propose a different approach, which takes into account the hierarchical organization of skin le- sions (see Fig. 1). Lesions may be organized into hier- archical groups according to their origin (melanocytic or non-melanocytic), degree of malignancy (benign or malig- nant), and finally their diagnosis (e.g., melanoma, basal cell carcinoma, vascular lesion, or nevi) [2]. We explore this structure using as inspiration recent works on caption gen- eration and attention models that use deep neural networks [32]. The developed deep learning system is able to sequen- 1
Transcript of Deep Attention Model for the Hierarchical Diagnosis of...

Deep Attention Model for the Hierarchical Diagnosis of Skin Lesions
Catarina Barata, Jorge S. Marques
Institute for Systems and Robotics
Lisbon, Portugal
M. Emre Celebi
University of Central Arkansas
Conway, AR, USA
Abstract
Deep learning has played a major role in the recent
advances in the dermoscopy image analysis field. How-
ever, such advances came at the cost of reducing the in-
terpretability of the developed diagnostic systems, which do
not comply with the requirements of the medical community
nor with the most recent laws on machine learning explain-
ability. Recent advances in the deep learning field, namely
attention maps, improved the interpretability of these meth-
ods. Incorporating medical knowledge in the systems has
also proved useful to increase their performance. In this
work we propose to combine these two approaches in a for-
mulation that: i) makes use of the hierarchical organization
of skin lesions, as identified by dermatologists, to develop
a classification model; and ii) uses an attention module to
identify relevant regions in the skin lesions and guide the
classification decisions. We demonstrate the potential of the
proposed approach in two state-of-the-art dermoscopy sets
(ISIC 2017 and ISIC 2018).
1. Introduction
The deep learning revolution has brought significant ad-
vances in various fields, particularly in medical image anal-
ysis [18]. In particular, the field of dermoscopy image anal-
ysis has seen a boom in the past few years, with several
works relying on deep convolution neural networks (CNNs)
to achieve increasingly better results in lesion diagnosis,
which have started to rival the performance of trained der-
matologists [12]. On par with CNNs, the release of public
image data sets such as the ISIC archive [8] or PH2 [20],
has also contributed to the growing interest on this topic.
There has been an effort to provide more insights on the
factors that influence the performance of CNNs on lesion
diagnosis, namely: i) performing data augmentation, both
on the training [30] and test sets [23]; ii) using different ar-
chitectures [14], as well as combining them in ensembles;
iii) studying the best strategies for transfer learning; and iv)
assessing the importance of image dimensions and other re-
lated properties [29].
Despite the aforementioned efforts, there are still as-
pects of the learning procedure that are not fully under-
stood, while the decision process is not self-explainable.
This hampers the transition of deep learning methods to the
clinical practice, especially if one takes into consideration
the recent European Unions General Data Protection Reg-
ulation, which mandates that any machine learning based
method that is designed to interact with humans, such as a
computer aided-diagnosis systems must be self-explainable.
Therefore, it is important to design strategies that take ad-
vantage of the representation and classification power of
CNNs, and at the same time are transparent and understand-
able [6].
Various strategies have been used to give interpretability
to CNNs, such as: i) use of class activation (CAM) or at-
tention maps that highlight the most relevant regions in the
lesion for a decision and guide the network regarding the
most discriminating feature maps [33, 25, 34]; ii) incorpo-
ration of the detection of relevant dermoscopic criteria in
the CNNs (high level features) [16, 13]; and iii) incorpo-
ration of CNN features into a content-based image retrieval
system (CBIR), which provides the user with examples sim-
ilar to the one being diagnosed [9]. However, there are few
evidences that these approaches lead to significantly better
performance w.r.t to less transparent deep learning meth-
ods. Notorious examples are methods based on CBIR that
demonstrated: i) the ability to be extended to the diagnosis
of unknown diseases [27]; and ii) the capability to improve
the diagnostic confidence of dermatologists [24].
In this work we propose a different approach, which
takes into account the hierarchical organization of skin le-
sions (see Fig. 1). Lesions may be organized into hier-
archical groups according to their origin (melanocytic or
non-melanocytic), degree of malignancy (benign or malig-
nant), and finally their diagnosis (e.g., melanoma, basal cell
carcinoma, vascular lesion, or nevi) [2]. We explore this
structure using as inspiration recent works on caption gen-
eration and attention models that use deep neural networks
[32]. The developed deep learning system is able to sequen-
1
Skin Lesion
Melanocytic Non-melanocytic
Benign Malignant Benign Malignant - Congenital nevi
- Atypical nevi
- Spitz/Reed nevi
- ...
- Melanoma - Dermatofibroma
- Vascular
- Benign keratosis
- Basal cell carcinoma
- Malignant keratosis
Figure 1. Hierarchical organization of skin lesions. Dermoscopy images taken from [28].
tially classify the skin lesions into each of these groups, im-
proving the overall diagnosis performance. Additionally,
the model provides attention maps associated with each of
the hierarchical classes, introducing interpretability to the
system.
2. Related Work
Some works tried to introduce interpretability to CNNs
in dermoscopy image analysis. Yang et al. [33] relied on
the use of a multi-task CNN with CAMs, to simultaneously
diagnose and locate the skin lesions in dermoscopy images.
The obtained CAMs highlight the region of interest in the
image, which usually matches the whole lesion. Zhang et
al. [34] added attention modules to residual networks, to
obtain improved feature maps between consecutive layers.
These authors also resort to CAMs, and show that the pro-
posed network focuses on the skin lesion and disregards
most of the surrounding skin. Although some measure of
interpretability may be obtained from CAMs, these maps
usually highlight the entire lesion and are not able to specify
smaller regions of interest, which may be associated with
different dermoscopic structures. Van Simoens and Dhoedt
[25] inspected the learned filter maps for a small CNN, and
concluded that the model was able to learn filters that were
sensitive to: border, lesion and skin color, hair, and artifacts.
However, no diagnosis scores were provided.
Dıaz [13] and Kawahara et al. [16] both used CNNs
to detect relevant dermoscopic structures. The former
proposed a dermoscopic segmentation structure network,
whose output was a set of segmentation masks of differ-
ent dermoscopic structures. These masks were then com-
bined with the features maps obtained from a ResNet50
to guide the final diagnosis. The latter proposed a multi-
task CNN that simultaneously evaluated the seven criteria
of the 7-point checklist method [1] and provided a diagno-
sis. Both approaches showed promising results and allowed
the integration of medical knowledge into the deep learn-
ing models. Nonetheless, the classification performance of
such systems may be hampered by the incorrect identifica-
tion of the dermoscopic structures. Moreover, these sys-
tems did not cover dermoscopic structures usually associ-
ated with non-melanocytic lesions, such as milia-like cysts
[2].
Recently, Codella et al. [9] proposed a CBIR system to
diagnose skin lesions based on deep learning features. This
system was trained in a collaborative fashion, where human
feedback regarding the similarity of the lesions was used
as an input. Their results showed that the collaborative ap-
proach led to better results as well as the retrieval of lesions
similar to the one being diagnosed, both in terms of visual
properties and diagnosis.
None of the aforementioned works takes into considera-
tion the inherent structure of skin lesions, i.e., the fact that
they are organized into hierarchical groups. Usually, the di-
agnosis is treated as a one-vs-all problem, where the distinc-
tion between all the classes is performed in the same fully-
connected layer. However, dermatologists must be able to
distinguish between melanocytic and non-melanocytic le-
sions, prior to applying methods such as the ABCD rule or
the 7-point checklist [2], which have been designed to diag-
nose only melanocytic lesions. Thus, adding this structure
to the deep learning systems may lead to better results, as
was recently demonstrated in [4]. Unfortunately, these sys-
tems lack interpretability.
In this paper we propose a deep learning system that is
able to classify skin lesions in a hierarchical way and that at
the same time is able to provide the user with information
that may help interpret the classification results. The con-
cept of hierarchy has been adopted before [12]. However, to
the best of our knowledge, this is the first system that aims
use hierarchy to leverage its interpretability.
3. Proposed Model
This paper proposes a new system for the classifica-
tion of skin lesions, which is trained to mimic their se-
quential grouping from more general (melanocytic/non-
melanocytic) to more specific (diagnostic) classes, as shown
in Fig. 2.
We will treat the problem of sequential classification as
one of caption generation [31], where the goal is to find

DenseNet - 161
ResNet-Inception
Image
Encoder
Attention
Module
Image
Decoder
LSTM 𝑴𝒆𝒍𝒂𝒏𝒐𝒄𝒚𝒕𝒊𝒄 𝑴𝒆𝒍𝒂𝒏𝒐𝒎𝒂
Hierarchical
Diagnosis
Figure 2. Block diagram of the proposed system. The heat map (blue to red) highlights the attended (most relevant) regions of the image
for each label.
the correct sequence of words S = {S1, ..., ST } (T is the
length of the sequence) that better describes image I . In
terms of inference, caption generation methods aim to find
the sequence S that maximizes
log p(S|I) =T∑
t=0
log p(St|I, S1, ..., St−1). (1)
This formulation allows us to condition a word St on all or
a subset of previous words, up to t − 1. The probabilities
p(St|I, S1, ..., St−1) are commonly modeled with a recur-
rent neural network (RNN), where the hidden state ht is re-
sponsible for propagating the condition on previous words.
Interpretability may be incorporated into deep caption mod-
els, through the use of visual attention [32], making it possi-
ble to teach the network to focus on different salient regions
to generate each word, and at the same time show what the
model is “seeing”.
It is possible to establish a relation between caption mod-
els and the concept of hierarchical classification. In this
type of classification scheme, the classes are organized in
a tree structure, such that the ones at the lower levels are
conditioned on those at the upper levels. Thus, we can for-
mulate our classification problem as in (1): we want to find
the best sequence of classes S for an image I , imposing that
each of the generated classes St is conditioned on the pre-
vious ones {S1, ..., St−1}. We also incorporate an attention
module into our system to identify regions of interest in the
images (see Fig. 2). In Section 4, we detail the proposed
model.
4. Hierarchical Attention CNN-LSTM
The proposed model may be divided into three main
blocks, as shown in Fig. 2: i) the encoder that receives a
raw image and extracts features; ii) the decoder that sequen-
tially generates the classes of the lesion; and iii) the atten-
tion module, which is responsible for guiding the decoder to
attend at different locations and improve the transparency of
the network. In the following subsections, we explain each
of the blocks.
4.1. Image Encoder
The encoding block receives as input a 299 × 299 RGB
image I and uses a bank of CNNs to extract a set of fea-
ture maps. In our experiments, we vectorize and concate-
nate the feature maps from the lower convolutional layers of
two popular architectures: DenseNet161 [15] and ResNet-
Inception [26]. This produces a set of L vector descriptors
x = {x1, ..., xL}, xl ∈ RD, where
√D ×
√D is the shape
of each of the feature maps. It is possible to associate these
feature maps with portions of the image I , which will allow
us to identify regions of interest using the attention module,
as described in sub-section 4.3.
4.2. Decoder Hierarchical Diagnosis
The decoder sequentially diagnoses the dermoscopy im-
age, using a long short-term memory network (LSTM) of
dimensionality P , as proposed in recent works on image
captioning [31, 32]. This network sequentially produces
the hierarchical classes of a skin lesion, conditioned on a
context vector zt, the previous hidden state ht−1, and the
previously generated class St−1, according to the following
implementation
it = σ(WisESt−1 +Wihht−1 +Wizzt + bi),
ft = σ(WfsESt−1 +Wfhht−1 +Wfzzt + bf ),
ct = ftct−1 + ittanh(WcsESt−1 +Wchht−1+
+Wczzt + bc),
ot = σ(WosESt−1 +Wohht−1 +Wozzt + bo),
ht = ottanh(ct), (2)
where it, ft, ct, ot, and ht are the input, forget, memory,
output, and hidden state of the LSTM, respectively, at time-
step t. The weights W• and biases b• are learned during
the training phase, as well as the embedding matrix E ∈R
M×K , where M is the word-embedding dimension and
K is the number of words/classes. The context vector ztis computed using the attention module, as described in the
next section.
The memory state c0 and the hidden state h0 must be
initialized. We adopted the strategy proposed in [32], and
apply two separate perceptrons to predict the initial values
given the average of the feature maps: 1
L
∑L
l=1xl.
At each time step, we can predict the next class S∗
t as the
one that maximizes
p(St|x, St−1) = softmax(Wo(ESt−1+Wzzt+Whht)),(3)
where Wo ∈ RK×M , Wz ∈ R
M×D, and Wh ∈ RM×P ,
where P is the dimension of the hidden state, are trainable
weight matrices.
4.3. Attention Module
This module estimates the context vector zt, using
the feature maps x and a set of positive weights αt ={αt1, ..., αtL}. These weights are computed by an attention
model, which we define as a multi-layer perceptron (MLP)
αt = softmax(Wa(tanh(Waxx+Wahht−1)), . (4)
where Wa ∈ RL×M , Wax ∈ R
M×DL, and Wah ∈R
M×M are all trainable weight matrices. Since αt depends
on the hidden state ht−1 of the decoder, this allows us to
simultaneously enforce the network to attend different lo-
cations in the image at each time instant, and at the same
time condition it on the previously predicted classes.
Given the attention vector αt, it is possible to compute
the context vector zt. In this work we adopt the soft atten-
tion mechanism proposed by Chorowski et al. [7], which
assumes that the weights express the relative importance of
each feature map. Thus, the context vector may be defined
as
zt =
L∑
i=1
αtixi. (5)
5. Experimental Setup
5.1. Data sets and Experiments
The proposed model is evaluated on the publicly avail-
able ISIC 2017 data set [8]. This set contains 2,750 im-
ages each belonging to one of the following three classes:
melanoma and nevus, both melanocytic, and seborrheic
keratosis (non-melanocytic). All of the images were pre-
processed in order to normalize their colors using the
method proposed in [3].
The images are divided into three sets: training (2,000
images), validation (150 images), and test (600 images).The
first subset was used to train different models, while the
second subset was used to select the best combination of
parameters. No external data sets were used to complement
the training set.
Two main experiments were performed considering two
configurations of the dermoscopy images: with and without
cropping, where in the former case we use the segmenta-
tion masks of the lesions to compute a tight bounding box
around them.
We also carried out a preliminary experiment on the
ISIC 2018 [28] set, which comprises more than 12k im-
ages, divided into seven classes: melanoma and nevus
(melanocytic), and basal cell carcinoma (BCC), actinic ker-
atosis, benign keratosis, dermatofibroma, and vascular le-
sions, all of them non-melanocytic.. Out of these images, a
subset of 10,015 is available with the corresponding ground
truth diagnosis. The remaining images are available for on-
line scoring of developed methods. To train our model and
select the best configuration, we randomly split the avail-
able data into training (80%) and validation sets (20%).
Similarly to the previous experiments, we do not augment
the training set with external data. We also submitted the
model to the online platform, for scoring.
5.2. Model Training
A set of dermoscopy images I = {I1, ..., IN}, for which
we have the corresponding ground truth sequences of hier-
archical labels S = {S1, ..., SN}, is used to train the model
end-to-end to minimize the following loss
L(I, S) = −T∑
i=1
log p(St), (6)
where p(St) is given by (3) and T is the length of the se-
quence (in our case, T = 2). This loss is optimized using
the Adam variant of the stochastic gradient descent method
[17], with mini-batches of size 10 and an adaptive learn-
ing rate with an initial value of 10−6. Additionally, we set
the model hyperparameters to be the following: D = 81,
M = 50, and P tuned within {27, . . . , 29}. Each model
was trained for 500 epochs, with an early stopping criterion.
We adopted several strategies to improve generalization
and reduce overfitting. First, several of the model weights
W• were carefully initialized. In particular, we initial-
ized the weights of the image encoders (DenseNet-161 and
ResNet-Inception) from pre-trained versions on ImageNet.
Although other works have stated that they do not need to
retrain the encoders to obtain good captions [32], we found
it beneficial to fine-tune these weights. The word encoding
weights E were also initialized from GloVe [22] and fine-
tuned using Mittens [11].
Online data augmentation was also used to improve the
performance of the model. In particular, at each epoch the
training images were sequentially transformed using a ran-
dom crop, random flip, and random color transformation.
Finally, dropout with probability 50% was incorporated in
several layers. The model was implemented in Tensorflow
and executed on a NVIDIA Titan Xp1.
5.3. Model Evaluation
We evaluated the proposed model on a test set of der-
moscopy images and quantified its performance using var-
ious metrics derived from the confusion matrix C. In par-
ticular, we evaluate the models regarding the class-specific
sensitivity (SE) and specificity (SP ), and the overall bal-
anced accuracy (BACC). The area under the curve (AUC)
for each class was also computed.
1The source code to train and evaluate is available on https://
github.com/catarina-barata/skin-hierarchy/
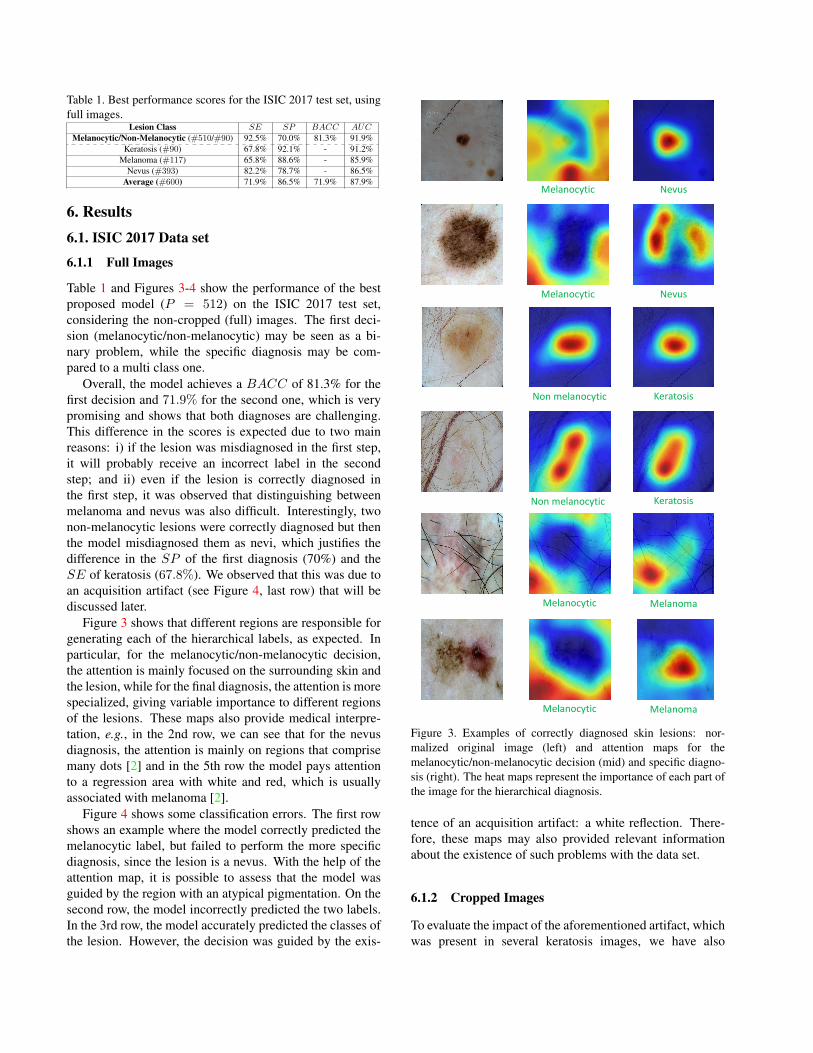
Table 1. Best performance scores for the ISIC 2017 test set, using
full images.Lesion Class SE SP BACC AUC
Melanocytic/Non-Melanocytic (#510/#90) 92.5% 70.0% 81.3% 91.9%
Keratosis (#90) 67.8% 92.1% - 91.2%
Melanoma (#117) 65.8% 88.6% - 85.9%
Nevus (#393) 82.2% 78.7% - 86.5%
Average (#600) 71.9% 86.5% 71.9% 87.9%
6. Results
6.1. ISIC 2017 Data set
6.1.1 Full Images
Table 1 and Figures 3-4 show the performance of the best
proposed model (P = 512) on the ISIC 2017 test set,
considering the non-cropped (full) images. The first deci-
sion (melanocytic/non-melanocytic) may be seen as a bi-
nary problem, while the specific diagnosis may be com-
pared to a multi class one.
Overall, the model achieves a BACC of 81.3% for the
first decision and 71.9% for the second one, which is very
promising and shows that both diagnoses are challenging.
This difference in the scores is expected due to two main
reasons: i) if the lesion was misdiagnosed in the first step,
it will probably receive an incorrect label in the second
step; and ii) even if the lesion is correctly diagnosed in
the first step, it was observed that distinguishing between
melanoma and nevus was also difficult. Interestingly, two
non-melanocytic lesions were correctly diagnosed but then
the model misdiagnosed them as nevi, which justifies the
difference in the SP of the first diagnosis (70%) and the
SE of keratosis (67.8%). We observed that this was due to
an acquisition artifact (see Figure 4, last row) that will be
discussed later.
Figure 3 shows that different regions are responsible for
generating each of the hierarchical labels, as expected. In
particular, for the melanocytic/non-melanocytic decision,
the attention is mainly focused on the surrounding skin and
the lesion, while for the final diagnosis, the attention is more
specialized, giving variable importance to different regions
of the lesions. These maps also provide medical interpre-
tation, e.g., in the 2nd row, we can see that for the nevus
diagnosis, the attention is mainly on regions that comprise
many dots [2] and in the 5th row the model pays attention
to a regression area with white and red, which is usually
associated with melanoma [2].
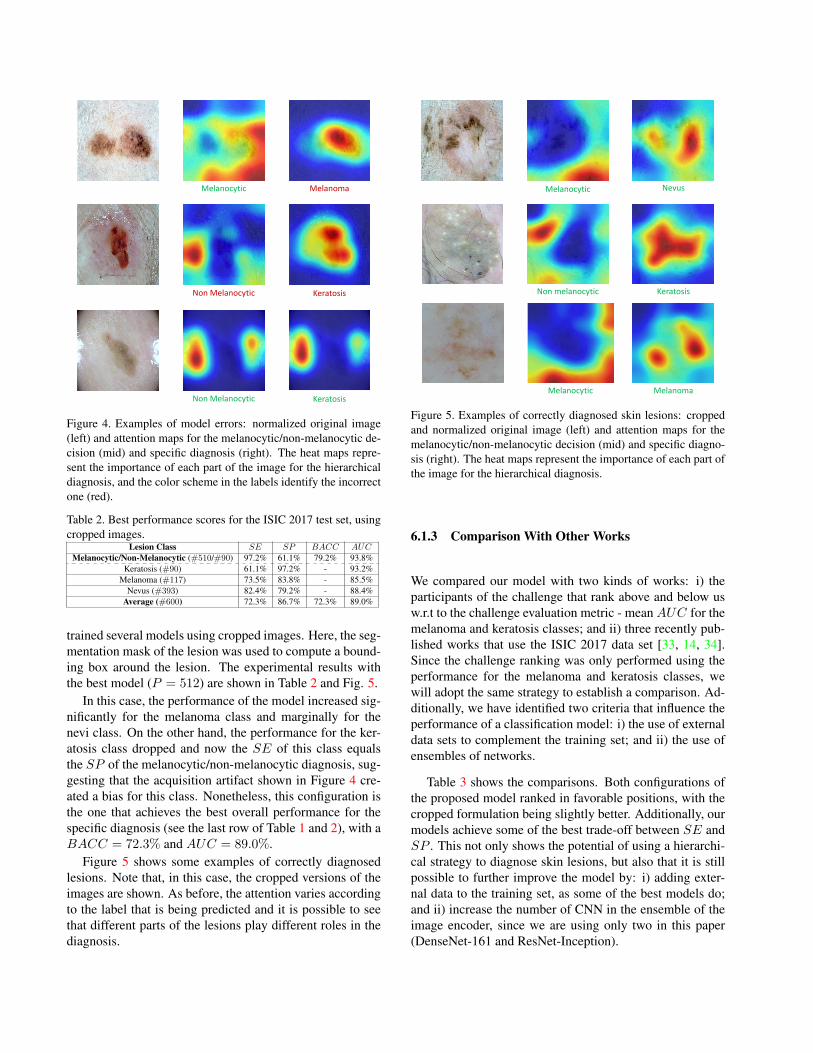
Figure 4 shows some classification errors. The first row
shows an example where the model correctly predicted the
melanocytic label, but failed to perform the more specific
diagnosis, since the lesion is a nevus. With the help of the
attention map, it is possible to assess that the model was
guided by the region with an atypical pigmentation. On the
second row, the model incorrectly predicted the two labels.
In the 3rd row, the model accurately predicted the classes of
the lesion. However, the decision was guided by the exis-
Melanocytic Nevus
Melanocytic Nevus
Non melanocytic Keratosis
Non melanocytic Keratosis
Melanocytic Melanoma
Melanocytic Melanoma
Figure 3. Examples of correctly diagnosed skin lesions: nor-
malized original image (left) and attention maps for the
melanocytic/non-melanocytic decision (mid) and specific diagno-
sis (right). The heat maps represent the importance of each part of
the image for the hierarchical diagnosis.
tence of an acquisition artifact: a white reflection. There-
fore, these maps may also provided relevant information
about the existence of such problems with the data set.
6.1.2 Cropped Images
To evaluate the impact of the aforementioned artifact, which
was present in several keratosis images, we have also
Melanocytic Melanoma
Non Melanocytic Keratosis
Non Melanocytic Keratosis
Figure 4. Examples of model errors: normalized original image
(left) and attention maps for the melanocytic/non-melanocytic de-
cision (mid) and specific diagnosis (right). The heat maps repre-
sent the importance of each part of the image for the hierarchical
diagnosis, and the color scheme in the labels identify the incorrect
one (red).
Table 2. Best performance scores for the ISIC 2017 test set, using
cropped images.Lesion Class SE SP BACC AUC
Melanocytic/Non-Melanocytic (#510/#90) 97.2% 61.1% 79.2% 93.8%
Keratosis (#90) 61.1% 97.2% - 93.2%
Melanoma (#117) 73.5% 83.8% - 85.5%
Nevus (#393) 82.4% 79.2% - 88.4%
Average (#600) 72.3% 86.7% 72.3% 89.0%
trained several models using cropped images. Here, the seg-
mentation mask of the lesion was used to compute a bound-
ing box around the lesion. The experimental results with
the best model (P = 512) are shown in Table 2 and Fig. 5.
In this case, the performance of the model increased sig-
nificantly for the melanoma class and marginally for the
nevi class. On the other hand, the performance for the ker-
atosis class dropped and now the SE of this class equals
the SP of the melanocytic/non-melanocytic diagnosis, sug-
gesting that the acquisition artifact shown in Figure 4 cre-
ated a bias for this class. Nonetheless, this configuration is
the one that achieves the best overall performance for the
specific diagnosis (see the last row of Table 1 and 2), with a
BACC = 72.3% and AUC = 89.0%.
Figure 5 shows some examples of correctly diagnosed
lesions. Note that, in this case, the cropped versions of the
images are shown. As before, the attention varies according
to the label that is being predicted and it is possible to see
that different parts of the lesions play different roles in the
diagnosis.
Melanocytic Nevus
Non melanocytic Keratosis
Melanocytic Melanoma
Figure 5. Examples of correctly diagnosed skin lesions: cropped
and normalized original image (left) and attention maps for the
melanocytic/non-melanocytic decision (mid) and specific diagno-
sis (right). The heat maps represent the importance of each part of
the image for the hierarchical diagnosis.
6.1.3 Comparison With Other Works
We compared our model with two kinds of works: i) the
participants of the challenge that rank above and below us
w.r.t to the challenge evaluation metric - mean AUC for the
melanoma and keratosis classes; and ii) three recently pub-
lished works that use the ISIC 2017 data set [33, 14, 34].
Since the challenge ranking was only performed using the
performance for the melanoma and keratosis classes, we
will adopt the same strategy to establish a comparison. Ad-
ditionally, we have identified two criteria that influence the
performance of a classification model: i) the use of external
data sets to complement the training set; and ii) the use of
ensembles of networks.
Table 3 shows the comparisons. Both configurations of
the proposed model ranked in favorable positions, with the
cropped formulation being slightly better. Additionally, our
models achieve some of the best trade-off between SE and
SP . This not only shows the potential of using a hierarchi-
cal strategy to diagnose skin lesions, but also that it is still
possible to further improve the model by: i) adding exter-
nal data to the training set, as some of the best models do;
and ii) increase the number of CNN in the ensemble of the
image encoder, since we are using only two in this paper
(DenseNet-161 and ResNet-Inception).

Table 3. Comparison with other works on the ISIC 2017 test set. ∗ means that some information is missing from the paper.
Melanoma Keratosis Average
Method Ensembles Ext. Data SE SP AUC SE SP AUC SE SP AUC
#1 [19] Y Y 73.5% 85.1% 86.8% 97.8% 77.3% 95.3% 85.7% 81.3% 91.1%
#2 [13] N Y 10.3% 99.8% 85.6% 17.8% 99.8% 96.5% 14.1% 99.8% 91.0%
#3 [21] Y Y 54.7% 95.0% 87.4% 35.6% 99.0% 94.3% 34.4% 97.4% 90.8%
#4 [5] Y Y 42.7% 96.3% 87.0% 58.9% 97.6% 92.1% 50.8% 97.0% 89.6%
Proposed Cropped Y N 73.5% 83.8% 85.5% 61.1% 97.2% 93.2% 67.3% 90.5% 89.4%
#5 [10] Y Y 35.0% 96.5% 83.6% 55.6% 97.6% 93.5% 45.3% 97.1% 88.6%
Proposed Full Y N 65.8% 88.6% 85.9% 67.8% 92.1% 91.2% 66.8% 90.3% 88.6%
[33] N N 60.7% 88.4% 84.2% ∗ ∗ ∗ ∗ ∗ ∗[14] Y N 40.2% 71.9% 85.1% 71.1% 85.1% 93.0% 55.6% 78.5% 89.1%
[34] N Y 65.8% 89.6% 87.5% 87.8% 86.7% 95.8% 76.8% 88.2% 91.7%
Table 4. Best performance scores for our validation set randomly
selected from ISIC 2018.Lesion Class SE SP BACC AUC
Melanocytic/Non-Melanocytic (#1564/#439) 93.7% 90.7% 92.2% 97.6%
Melanoma (#222) 75.7% 92.0% - 93.6%
Nevus (#1342) 87.4% 94.7% - 97.2%
Actinic (#65) 61.5% 99.4% - 80.4%
BCC (#102) 84.3% 98.9% - 82.0%
Keratosis (#220) 81.4% 94.9% - 83.7%
Dermatofibroma (#24) 66.7% 99.5% - 60.5%
Vascular (#28) 89.2% 99.6% - 64.4%
Average (#2003) 78.0% 97.0% 78.0% 80.2%
6.2. Preliminary Results on the ISIC 2018 Data set
This section reports preliminary results for the proposed
model on the ISIC 2018 data set. In this part, the hyper-
parameters of the model were not tuned and we selected
the best hyperparameter configuration obtained for the ISIC
2017 data set (M = 50, P = 512, and D = 81). Table 4
reports the performance scores on our validation set.
ISIC 2018 is a much more complex data set than ISIC
2017, mainly because it comprises four more classes.
Nonetheless, the proposed model is able to achieve a sig-
nificantly good performance on the distinction between
melanocytic and non-melanocytic lesions (BACC =92.2%). The second level of diagnosis is more challenging,
as expressed by the obtained scores. There is a significant
unbalance between the different classes. Nonetheless, the
model is still able to achieve SE above 60% for all of the
classes and a BACC = 78.0%.
Table 5 shows the performance on the test set. In this
case we do not have access to the ground truth diagno-
sis, thus it is not possible to evaluate the melanocytic/non-
melanocytic diagnosis. The obtained performances are
worse than those obtained on the validation set. This may be
due to : i) the selected validation set not being representa-
tive enough and created a bias; ii) the used hyperparameters
were not adequate and they require further tuning.
We believe that further experiments must be conducted
on this data set, which may lead to an improvement in the
scores. In particular, we plan to tune the model hyperpa-
rameters M and P and assess their influence in the perfor-
mance. Additionally, we believe that incorporating more
Table 5. Best performance scores on the test set of ISIC 2018.
Lesion Class SE SP BACC AUC
Melanoma 60.8% 90.9% - 88.1%
Nevus 84.6% 90.5% - 94.9%
Actinic 44.2% 99.0% - 94.4%
BCC 60.2% 98.4% - 96.6%
Keratosis 70.0% 91.7% - 91.0%
Dermatofibroma 65.9% 99.4% - 94.7%
Vascular 60.0% 99.5% - 97.3%
Average (#1512) 63.7% 95.6% 64.1% 93.9%
CNNs on the image encoding block may also improve the
results, as many authors in the field of dermoscopy im-
age analysis report the importance of using ensembles (e.g.,
[14]). Strategies to deal with the severe class imbalance,
, such as using weighted losses in the training, may also
prove fruitful. Finally, as this data set comprises more le-
sion classes than ISIC 2017, it may be interesting to add an
extra decision step, to distinguish between benign and ma-
lignant lesions, prior to the specific diagnosis (recall Figure
1), thus setting the number of the LSTM steps to T = 3.
7. Conclusions
This paper proposes a hierarchical classification model
for the diagnosis of skin lesions that is able to provide inter-
pretation through the use of attention maps. The proposed
approach is inspired by recent works on deep models for
caption generation, and combines CNNs with LSTM and
attention modules. We evaluated our method on the ISIC
2017 and 2018 data sets and show that the hierarchical clas-
sification strategy has potential and that it is able to achieve
competitive results with state-of-the-art methods, using a
small number of ensembles and no external data. Moreover,
the obtained attention maps show that the model is able to
identify clinically relevant regions in the lesions, as well as
to provide more insightful information on the importance of
the different image regions in the diagnosis.
Acknowledgments
This work was supported by the FCT project
and plurianual funding: [PTDC/EEIPRO/0426/2014],
[UID/EEA/50009/2019].
The Titan Xp used for this research was donated by theNVIDIA Corporation.
References
[1] G. Argenziano, G. Fabbrocini, P. Carli, V. De Giorgi, E. Sam-
marco, and E. Delfino. Epiluminescence microscopy for
the diagnosis of doubtful melanocytic skin lesions. compar-
ison of the ABCD rule of dermatoscopy and a new 7-point
checklist based on pattern analysis. Archives of Dermatol-
ogy, 134:1563–1570, 1998. 2
[2] G. Argenziano, H. P. Soyer, V. De Giorgi, D. Piccolo,
P. Carli, M. Delfino, A. Ferrari, V. Hofmann-Wellenhog,
D. Massi, G. Mazzocchetti, M. Scalvenzi, and I. H. Wolf.
Interactive Atlas of Dermoscopy. EDRA Medical Publish-
ing & New Media, 2000. 1, 2, 5
[3] C. Barata, M. E. Celebi, and J. S. Marques. Improving der-
moscopy image classification using color constancy. IEEE
Journal of Biomedical and Health Informatics, 19:1146–
1152, 2015. 4
[4] C. Barata and J. S. Marques. Deep learning for skin cancer
diagnosis with hiearchical architectures. In accepted in IEEE
International Symposium on Biomedical Imaging, 2019. 2
[5] L. Bi, J. Kim, E. Ahn, and D. Feng. Automatic skin le-
sion analysis using large-scale dermoscopy images and deep
residual networks. arXiv preprint arXiv:1703.04197, 2017.
7
[6] M. E. Celebi, N. Codella, and A. Halpern. Dermoscopy im-
age analysis: Overview and future directions. IEEE Journal
of Biomedical and Health Informatics, 23(2):474–478, 2019.
1
[7] J. K. Chorowski, D. Bahdanau, D. Serdyuk, K. Cho, and
Y. Bengio. Attention-based models for speech recognition.
In Advances in neural information processing systems, pages
577–585, 2015. 4
[8] N. C. F. Codella, D. Gutman, M. E. Celebi, B. Helba, M. A.
Marchetti, S. W. Dusza, A. Kalloo, K. Liopyris, N. Mishra,
H. Kittler, et al. Skin lesion analysis toward melanoma de-
tection: A challenge at the 2017 international symposium on
biomedical imaging (isbi), hosted by the international skin
imaging collaboration (isic). In 2018 IEEE 15th Interna-
tional Symposium on Biomedical Imaging (ISBI 2018), pages
168–172. IEEE, 2018. 1, 4
[9] N. C. F. Codella, C. C. Lin, A. Halpern, M. Hind, R. Feris,
and J. R. Smith. Collaborative human-ai (chai): Evidence-
based interpretable melanoma classification in dermoscopic
images. In Understanding and Interpreting Machine Learn-
ing in Medical Image Computing Applications, pages 97–
105. Springer, 2018. 1, 2
[10] T. DeVries and D. Ramachandram. Skin lesion classification
using deep multi-scale convolutional neural networks. arXiv
preprint arXiv:1703.01402, 2017. 7
[11] N. Dingwall and C. Potts. Mittens: an extension of glove
for learning domain-specialized representations. In Proceed-
ings of the 2018 Conference of the North American Chapter
of the Association for Computational Linguistics: Human
Language Technologies, Volume 2 (Short Papers), volume 2,
pages 212–217, 2018. 4
[12] A. Esteva, B. Kuprel, R. A. Novoa, J. Ko, S. M. Swetter,
H. M. Blau, and S. Thrun. Dermatologist-level classification
of skin cancer with deep neural networks. Nature, 542:115–
118, 2017. 1, 2
[13] I. Gonzalez-Dıaz. Dermaknet: Incorporating the knowledge
of dermatologists to convolutional neural networks for skin
lesion diagnosis. IEEE journal of biomedical and health in-
formatics, 23(2):547–559, 2019. 1, 2, 7
[14] B. Harangi. Skin lesion classification with ensembles of deep
convolutional neural networks. Journal of biomedical infor-
matics, 86:25–32, 2018. 1, 6, 7
[15] G. Huang, Z. Liu, L. Van Der Maaten, and K. Q. Weinberger.
Densely connected convolutional networks. In CVPR, vol-
ume 1, page 3, 2017. 3
[16] J. Kawahara, S. Daneshvar, G. Argenziano, and
G. Hamarneh. 7-point checklist and skin lesion classification
using multi-task multi-modal neural nets. IEEE journal of
biomedical and health informatics, 23(2):538–546, 2019. 1,
2
[17] D. P. Kingma and J. Ba. Adam: A method for stochastic
optimization. arXiv preprint arXiv:1412.6980, 2014. 4
[18] G. Litjens, T. Kooi, B. E. Bejnordi, A. A. A. Setio, F. Ciompi,
M. Ghafoorian, J. A. Van Der Laak, B. Van Ginneken, and
C. I. Sanchez. A survey on deep learning in medical image
analysis. Medical image analysis, 42:60–88, 2017. 1
[19] K. Matsunaga, A. Hamada, A. Minagawa, and H. Koga. Im-
age classification of melanoma, nevus and seborrheic ker-
atosis by deep neural network ensemble. arXiv preprint
arXiv:1703.03108, 2017. 7
[20] T. Mendonca, P. M. Ferreira, J. S. Marques, A. R. S. Marcal,
and J. Rozeira. Ph 2-a dermoscopic image database for re-
search and benchmarking. In 2013 35th annual international
conference of the IEEE engineering in medicine and biology
society (EMBC), pages 5437–5440. IEEE, 2013. 1
[21] A. Menegola, J. Tavares, M. Fornaciali, L. T. Li, S. Avila,
and E. Valle. RECOD titans at isic challenge 2017. arXiv
preprint arXiv:1703.04819, 2017. 7
[22] J. Pennington, R. Socher, and C. Manning. Glove: Global
vectors for word representation. In Proceedings of the 2014
conference on empirical methods in natural language pro-
cessing (EMNLP), pages 1532–1543, 2014. 4
[23] F. Perez, C. Vasconcelos, S. Avila, and E. Valle. Data aug-
mentation for skin lesion analysis. In OR 2.0 Context-Aware
Operating Theaters, Computer Assisted Robotic Endoscopy,
Clinical Image-Based Procedures, and Skin Image Analysis,
pages 303–311. Springer, 2018. 1
[24] M. Sadeghi, P. K. Chilana, and M. S. Atkins. How users per-
ceive content-based image retrieval for identifying skin im-
ages. In Understanding and Interpreting Machine Learning
in Medical Image Computing Applications, pages 141–148.
Springer, 2018. 1

[25] P. Simoens and B. Dhoedt. Visualizing convolutional neural
networks to improve decision support for skin lesion classi-
fication. In Understanding and Interpreting Machine Learn-
ing in Medical Image Computing Applications: First Inter-
national Workshops, MLCN 2018, DLF 2018, and iMIMIC
2018, Held in Conjunction with MICCAI 2018, Granada,
Spain, September 16-20, 2018, Proceedings, volume 11038,
page 115. Springer, 2018. 1, 2
[26] C. Szegedy, S. Ioffe, V. Vanhoucke, and A. A. Alemi.
Inception-v4, inception-resnet and the impact of residual
connections on learning. In Thirty-First AAAI Conference
on Artificial Intelligence, 2017. 3
[27] P. Tschandl, G. Argenziano, M. Razmara, and J. Yap. Di-
agnostic accuracy of content-based dermatoscopic image re-
trieval with deep classification features. British Journal of
Dermatology, 2018. 1
[28] P. Tschandl, C. Rosendahl, and H. Kittler. The ham10000
dataset, a large collection of multi-source dermatoscopic im-
ages of common pigmented skin lesions. Scientific data,
5:180161, 2018. 2, 4
[29] E. Valle, M. Fornaciali, A. Menegola, and et al. Data, depth,
and design: learning reliable models for melanoma screen-
ing. arXiv preprint arXiv:1711.00441, 2017. 1
[30] C. N. Vasconcelos and B. N. Vasconcelos. Experiments us-
ing deep learning for dermoscopy image analysis. Pattern
Recognition Letters, 2017. 1
[31] O. Vinyals, A. Toshev, S. Bengio, and D. Erhan. Show and
tell: A neural image caption generator. In Proceedings of
the IEEE conference on computer vision and pattern recog-
nition, pages 3156–3164, 2015. 2, 3
[32] K. Xu, J. Ba, R. Kiros, K. Cho, A. Courville, R. Salakhudi-
nov, R. Zemel, and Y. Bengio. Show, attend and tell: Neural
image caption generation with visual attention. In Interna-
tional conference on machine learning, pages 2048–2057,
2015. 1, 3, 4
[33] J. Yang, F. Xie, H. Fan, Z. Jiang, and J. Liu. Classification
for dermoscopy images using convolutional neural networks
based on region average pooling. IEEE Access, 6:65130–
65138, 2018. 1, 2, 6, 7
[34] J. Zhang, Y. Xie, Y. Xia, and C. Shen. Attention residual
learning for skin lesion classification. IEEE transactions on
medical imaging, 2019. 1, 2, 6, 7


![Hierarchical Self-Attention Network for Action ... · work combines the strength of self-attention [14,33] in learning temporal dependency with CNN-based object detectors to obtain](https://static.fdocuments.in/doc/165x107/606f532a05d29c1dc30fb7d0/hierarchical-self-attention-network-for-action-work-combines-the-strength-of.jpg)