Deeber 2011 236218 Justice Expenditures and Employment, FY
12
U.S. Department of Justice Office of Justice Programs Bureau of Justice Statistics Bureau of Justice Statistics · Statistical Tables BJS December 2011, NCJ 236218 I n 2007, federal, state, and local governments spent $228 billion and employed 2.5 million persons for police protection, corrections, and judicial and legal services (figures 1 and 2). Local police protection represented the largest share of both total justice expenditures (32%) and employment (36%), followed by state corrections (19% of expenditures and employment). e findings in this report are based on the Bureau of Justice Statistics’ (BJS) Justice Expenditure and Employment Extracts (JEE) series, based on data from the U.S. Census Bureau’s Government Finance Survey and Annual Survey of Public Employment. e data include yearly information on federal, state, and local government expenditures and employment for three justice functions: corrections, police protection, and judicial and legal services (for definition of terms, see page 9). Expenditure data are presented in real terms (see Methodology for more details). Extract tables from this series are accessible on the BJS website. is report presents trend data in 5-year increments from 1982 to 2007 on direct justice expenditures. Intergovernmental expenditures, the sum of payments made from one government entity to another, appear as direct expenditures when the receiving government purchases goods or services with the funds (see Methodology for further explanation). Justice Expenditures and Employment, FY 1982-2007 - Statistical Tables By Tracey Kyckelhahn, Ph.D., BJS Statistician Expenditures (in millions of dollars) 0 10,000 20,000 30,000 40,000 50,000 60,000 70,000 80,000 Local State Federal Local State Federal Local State Judicial and legal services Federal Corrections Police protection FIGURE 1 Justice expenditures, by function, FY 2007 Number 0 500,000 1,000,000 1,500,000 2,000,000 2,500,000 Corrections Police protection Judicial and legal Total employment 2007 2002 1997 1992 1987 1982 FIGURE 2 Justice employees, by function, FY 1982–2007 Source: U.S. Census Bureau, Government Finance Survey. Source: U.S. Census Bureau, Annual Survey of Public Employment.
Transcript of Deeber 2011 236218 Justice Expenditures and Employment, FY

U.S. Department of Justice Office of Justice Programs Bureau of Justice Statistics
Bureau of Justice Statistics · Statistical Tables
BJS
December 2011, NCJ 236218
In 2007, federal, state, and local governments spent $228 billion and employed 2.5 million persons for police protection, corrections, and judicial
and legal services (figures 1 and 2). Local police protection represented the largest share of both total justice expenditures (32%) and employment (36%), followed by state corrections (19% of expenditures and employment).
The findings in this report are based on the Bureau of Justice Statistics’ (BJS) Justice Expenditure and Employment Extracts (JEE) series, based on data from the U.S. Census Bureau’s Government Finance Survey and Annual Survey of Public Employment. The data include yearly information on federal, state, and local government expenditures
and employment for three justice functions: corrections, police protection, and judicial and legal services (for definition of terms, see page 9). Expenditure data are presented in real terms (see Methodology for more details). Extract tables from this series are accessible on the BJS website.
This report presents trend data in 5-year increments from 1982 to 2007 on direct justice expenditures. Intergovernmental expenditures, the sum of payments made from one government entity to another, appear as direct expenditures when the receiving government purchases goods or services with the funds (see Methodology for further explanation).
Justice Expenditures and Employment, FY 1982-2007 - Statistical Tables
By Tracey Kyckelhahn, Ph.D., BJS Statistician
Expenditures (in millions of dollars)0 10,000 20,000 30,000 40,000 50,000 60,000 70,000 80,000
LocalState
Federal
LocalState
Federal
LocalState
Judicial and legal servicesFederal
Corrections
Police protection
Figure 1Justice expenditures, by function, FY 2007
Number
0
500,000
1,000,000
1,500,000
2,000,000
2,500,000
Corrections
Police protection
Judicial and legal
Total employment
200720021997199219871982
Figure 2 Justice employees, by function, FY 1982–2007
Source: U.S. Census Bureau, Government Finance Survey. Source: U.S. Census Bureau, Annual Survey of Public Employment.

2 Justice expenditures and employment, 1982-2007 - Statistical Tables
Direct expenditures, by justice function and level of government�� During 2007, the cost of the nation’s police protection,
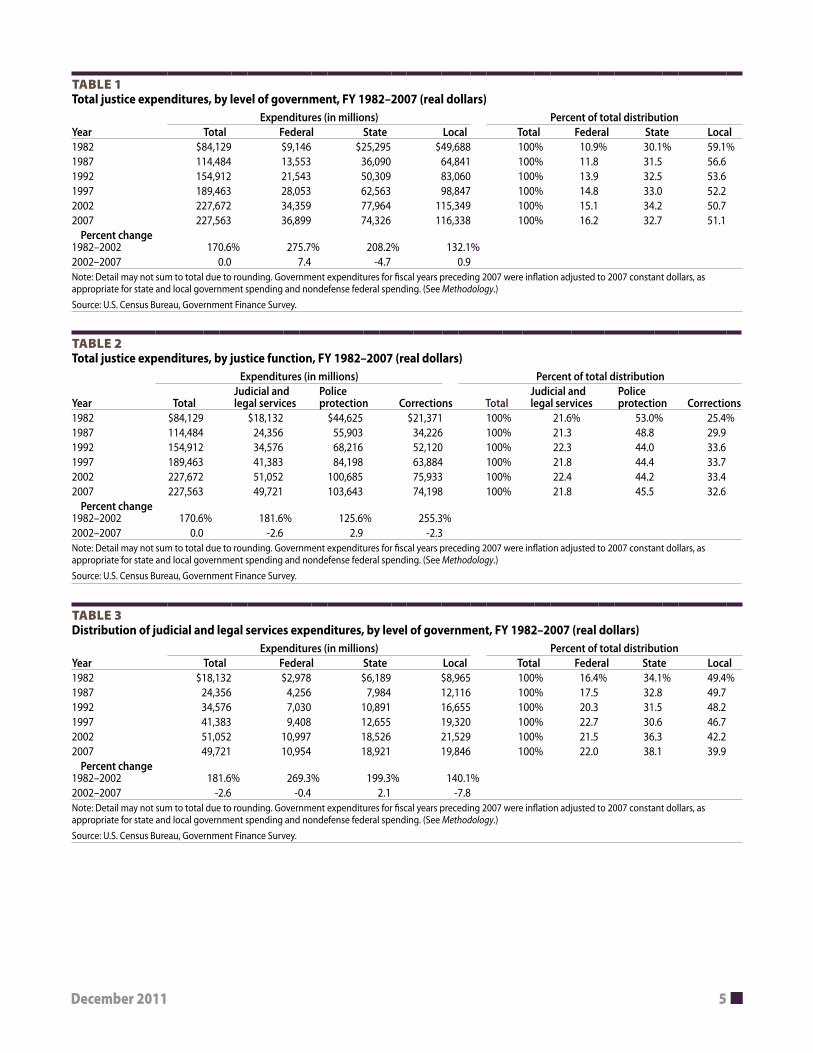
corrections, and judicial and legal services was $228 billion, an increase of 171% since 1982, after adjusting for inflation. Between 2002 and 2007, public expenditures for criminal and civil justice remained flat (table 1).
�� Between 1982 and 2002, federal expenditures increased 276%; state, 208%; and local, 132%, after adjusting for inflation. Between 2002 and 2007, federal expenditures increased 7% and local expenditures increased 1%, while state expenditures declined 5%.
�� Federal expenditures increased from 11% of total expenditures to 16% between 1982 and 2007, while state expenditures increased from 30% to 33%, and local expenditures declined from 59% to 51% of total expenditures during this same period.
�� Between 1982 and 2002, after adjusting for inflation, judicial and legal services expenditures increased 182%; police protection, 126%; and corrections, 255%. Between 2002 and 2007, judicial and legal services expenditures declined 3% and corrections declined 2%, while police protection expenditures increased 3% (table 2).
�� Judicial and legal services spending remained at 22% of total expenditures in 1982 and 2007, varying slightly over this time. During this same period, police protection declined from 53% to 46%, and corrections increased from 25% to 33%.
�� Across all levels of government and justice functions, local police protection and state corrections expenditures were
the largest components of justice spending between 1982 and 2007. Local police protection expenditures fell from 40% of total spending in 1982 to 32% in 2007, while state corrections increased from 16% in 1982 to 21% in 1997 and then decreased to 19% in 2007 (not shown in table).
�� In 1982, local governments supplied about half (49%) of total judicial and legal services funding; by 2007, local (40%) and state (38%) governments contributed about the same percentage of total judicial and legal services funding (table 3).
�� The federal government contributed about a fifth of total expenditures on judicial and legal services both in 2007 (22%) and 1982 (16%).
�� Most police protection expenditures were at the local level, 75% in 1982 and 70% in 2007, while federal government spending on police protection increased from 11% to 19% during this same period. State spending on police protection was stable from 1982 to 2007, comprising between 11% and 13% of total spending (table 4).
�� Corrections expenditures were concentrated primarily at the state level, varying slightly between 59% and 63% from 1982 to 2007 (table 5).
�� From 1982 to 2007, local corrections expenditures varied between 30% and 34% of total corrections spending while federal spending varied between 5% and 9% during this same period.
Per capita expenditures�� Per capita justice expenditures totaled $755 per U.S.
resident in 2007, a decline of 5% from the inflation adjusted 2002 peak of $791 per resident (table 6).
�� In 2007, per capita expenditures were highest for police protection ($344), followed by corrections ($246) and judicial and legal services ($165).
�� Between 2002 and 2007, per capita expenditures fell the most for judicial and legal services (-7%) and corrections (-7%), followed by police protection (-2%).

December 2011 3
employment, by justice function and level of government�� In 2007, a total of 2.5 million persons were employed in
the nation’s justice system, an increase of 93% from 1982, when 1.3 million persons were employed (table 7).
�� Between 1982 and 2002, federal justice system employment increased 115%; state, 118%; and local, 63%. Between 2002 and 2007, federal justice system employment increased 30%; state, 3%; and local, 5%.
�� Federal employment increased from 7% of total justice employment in 1982 to 11% in 2007, while state employment increased from 27% to 31%, and local employment declined from 66% to 58% during this same period.
�� Between 1982 and 2002, employment for judicial and legal services increased 97%; police protection, 47%; and corrections, 151%. Between 2002 and 2007, judicial and legal services employment increased 4%; police protection, 9%; and corrections, 4% (table 8).
�� As a percentage of total justice employment, judicial and legal services held steady, comprising 20% of total justice employment in 1982 and 21% in 2007. During this same period, police protection employment declined from 57% to 48% of total justice employment, and corrections employment increased from 24% to 32%.
�� Across all levels of government and justice functions, local police protection employment and state corrections employment had the greatest percentage of justice employees between 1982 and 2007. Local police protection employment fell from 47% of total justice employment in 1982 to 36% in 2007, while state corrections employment increased from 15% to 22% between 1982 and 1997, and declined to 19% in 2007 (not shown in table).
�� Between 1982 and 2007, over half (53% to 57%) of judicial and legal services employees worked at the local level, about a third (30% to 35%) worked at the state level, and 11% to 14% worked at the federal level (table 9).
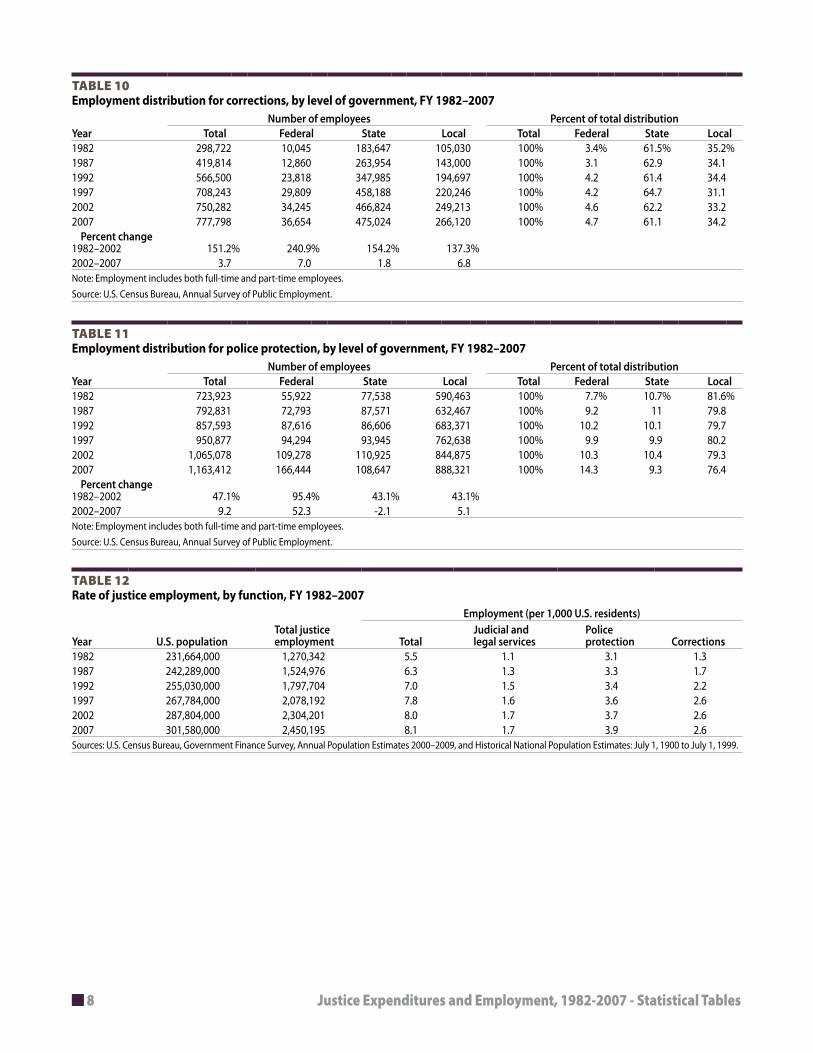
�� Between 1982 and 2007, about two-thirds (61% to 65%) of corrections employees worked at the state level, about a third (31% to 35%) worked at the local level, and 3% to 5% worked at the federal level (table 10).
�� Over three-quarters (76% to 82%) of police protection employees worked at the local level between 1982 and 2007. During this same period, 9% to 11% worked at the state level, and 8% to 14% worked at the federal level (table 11).
employment rate�� The justice employment rate increased from 5.5
employees per 1,000 U.S. residents in 1982 to 8.1 in 2001. This rate held steady between 2002 and 2007 (table 12).
�� Across justice functions in 2007, the employment rate for police protection was the highest (3.9 per 1,000 U.S. residents), followed by corrections (2.6 per 1,000) and judicial and legal services (1.7 per 1,000).

4 Justice expenditures and employment, 1982-2007 - Statistical Tables
List of TablesTabLe 1. Total justice expenditures, by level of government, FY 1982-2007 (real dollars)
TabLe 2. Total justice expenditures, by justice function, FY 1982-2007 (real dollars)
TabLe 3. Distribution of judicial and legal services expenditures, by level of government, FY 1982-2007 (real dollars)
TabLe 4. Distribution of police protection expenditures, by level of government, FY 1982-2007 (real dollars)
TabLe 5. Distribution of corrections expenditures, by level of government, FY 1982-2007 (real dollars)
TabLe 6. Per capita justice expenditures, by function, FY 1982-2007 (real dollars)
TabLe 7. Total justice employment, by level of government, FY 1982-2007
TabLe 8. Total justice employment, by justice function, FY 1982-2007
TabLe 9. Employment distribution for judicial and legal services, by level of government, FY 1982-2007
TabLe 10. Employment distribution for corrections, by level of government, FY 1982-2007
TabLe 11. Employment distribution for police protection, by level of government, FY 1982-2007
TabLe 12. Rate of justice employment, by function, FY 1982-2007
December 2011 5
TabLe 1Total justice expenditures, by level of government, FY 1982–2007 (real dollars)
Expenditures (in millions) Percent of total distributionYear Total Federal State Local Total Federal State Local1982 $84,129 $9,146 $25,295 $49,688 100% 10.9% 30.1% 59.1%1987 114,484 13,553 36,090 64,841 100% 11.8 31.5 56.61992 154,912 21,543 50,309 83,060 100% 13.9 32.5 53.61997 189,463 28,053 62,563 98,847 100% 14.8 33.0 52.22002 227,672 34,359 77,964 115,349 100% 15.1 34.2 50.72007 227,563 36,899 74,326 116,338 100% 16.2 32.7 51.1 Percent change 1982–2002 170.6% 275.7% 208.2% 132.1%2002–2007 0.0 7.4 -4.7 0.9Note: Detail may not sum to total due to rounding. Government expenditures for fiscal years preceding 2007 were inflation adjusted to 2007 constant dollars, as appropriate for state and local government spending and nondefense federal spending. (See Methodology.)Source: U.S. Census Bureau, Government Finance Survey.
TabLe 2Total justice expenditures, by justice function, FY 1982–2007 (real dollars)
Expenditures (in millions) Percent of total distribution
Year TotalJudicial and legal services
Police protection Corrections Total
Judicial and legal services
Policeprotection Corrections
1982 $84,129 $18,132 $44,625 $21,371 100% 21.6% 53.0% 25.4%1987 114,484 24,356 55,903 34,226 100% 21.3 48.8 29.91992 154,912 34,576 68,216 52,120 100% 22.3 44.0 33.61997 189,463 41,383 84,198 63,884 100% 21.8 44.4 33.72002 227,672 51,052 100,685 75,933 100% 22.4 44.2 33.42007 227,563 49,721 103,643 74,198 100% 21.8 45.5 32.6 Percent change 1982–2002 170.6% 181.6% 125.6% 255.3%2002–2007 0.0 -2.6 2.9 -2.3Note: Detail may not sum to total due to rounding. Government expenditures for fiscal years preceding 2007 were inflation adjusted to 2007 constant dollars, as appropriate for state and local government spending and nondefense federal spending. (See Methodology.)Source: U.S. Census Bureau, Government Finance Survey.
TabLe 3Distribution of judicial and legal services expenditures, by level of government, FY 1982–2007 (real dollars)
Expenditures (in millions) Percent of total distributionYear Total Federal State Local Total Federal State Local1982 $18,132 $2,978 $6,189 $8,965 100% 16.4% 34.1% 49.4%1987 24,356 4,256 7,984 12,116 100% 17.5 32.8 49.71992 34,576 7,030 10,891 16,655 100% 20.3 31.5 48.21997 41,383 9,408 12,655 19,320 100% 22.7 30.6 46.72002 51,052 10,997 18,526 21,529 100% 21.5 36.3 42.22007 49,721 10,954 18,921 19,846 100% 22.0 38.1 39.9 Percent change 1982–2002 181.6% 269.3% 199.3% 140.1%2002–2007 -2.6 -0.4 2.1 -7.8Note: Detail may not sum to total due to rounding. Government expenditures for fiscal years preceding 2007 were inflation adjusted to 2007 constant dollars, as appropriate for state and local government spending and nondefense federal spending. (See Methodology.)Source: U.S. Census Bureau, Government Finance Survey.

6 Justice expenditures and employment, 1982-2007 - Statistical Tables
TabLe 6Per capita justice expenditures, by function, FY 1982–2007 (real dollars)
Expenditures (per capita)Total expenditures (in millions) Total
Judicial andlegal services
Policeprotection CorrectionsYear U.S. population
1982 231,664,000 $84,129 $363 $78 $193 $92 1987 242,289,000 114,484 473 101 231 141 1992 255,030,000 154,912 607 136 267 204 1997 267,784,000 189,463 708 155 314 239 2002 287,804,000 227,672 791 177 350 264 2007 301,580,000 227,563 755 165 344 246 Note: Government expenditures for fiscal years preceding 2007 were inflation-adjusted to 2007 constant dollars, as appropriate for state and local government spending and nondefense federal spending. (See Methodology.)Sources: U.S. Census Bureau, Government Finance Survey, Annual Population Estimates 2000–2009, and Historical National Population Estimates: July 1, 1900 to July 1, 1999.
TabLe 4Distribution of police protection expenditures, by level of government, FY 1982–2007 (real dollars)
Expenditures (in millions) Percent of total distributionYear Total Federal State Local Total Federal State Local1982 $44,625 $5,069 $5,904 $33,652 100% 11.4% 13.2% 75.4%1987 55,903 7,564 7,128 41,211 100% 13.5 12.8 73.71992 68,216 10,674 8,255 49,287 100% 15.6 12.1 72.31997 84,198 13,819 9,853 60,526 100% 16.4 11.7 71.92002 100,685 17,648 12,533 70,504 100% 17.5 12.4 70.02007 103,643 19,617 11,383 72,643 100% 18.9 11.0 70.1 Percent change 1982–2002 125.6% 248.2% 112.3% 109.5%2002–2007 2.9 11.2 -9.2 3.0Note: Detail may not sum to total due to rounding. Government expenditures for fiscal years preceding 2007 were inflation adjusted to 2007 constant dollars, as appropriate for state and local government spending and nondefense federal spending. (See Methodology.)Source: U.S. Census Bureau, Government Finance Survey.
TabLe 5Distribution of corrections expenditures, by level of government, FY 1982–2007 (real dollars)
Expenditures (in millions) Percent of total distributionYear Total Federal State Local Total Federal State Local1982 $21,371 $1,099 $13,204 $7,068 100% 5.1% 61.8% 33.1%1987 34,226 1,732 20,978 11,516 100% 5.1 61.3 33.61992 52,120 3,839 31,163 17,118 100% 7.4 59.8 32.81997 63,884 4,826 40,057 19,001 100% 7.6 62.7 29.72002 75,933 5,715 46,904 23,314 100% 7.5 61.8 30.72007 74,198 6,328 44,021 23,849 100% 8.5 59.3 32.1 Percent change 1982–2002 255.3% 420.0% 255.2% 229.9%2002–2007 -2.3 10.7 -6.1 2.3Note: Detail may not sum to total due to rounding. Government expenditures for fiscal years preceding 2007 were inflation adjusted to 2007 constant dollars, as appropriate for state and local government spending and nondefense federal spending. (See Methodology.)Source: U.S. Census Bureau, Government Finance Survey.

December 2011 7
TabLe 7Total justice employment, by level of government, FY 1982–2007
Number of employees Percent of total distributionYear Total Federal State Local Total Federal State Local1982 1,270,342 94,555 341,010 834,777 100% 7.4% 26.8% 65.7%1987 1,524,976 121,321 451,633 952,022 100% 8.0 29.6 62.41992 1,797,704 162,202 548,139 1,087,363 100% 9.0 30.5 60.51997 2,078,192 176,739 690,807 1,210,646 100% 8.5 33.2 58.32002 2,304,201 203,099 742,373 1,358,729 100% 8.8 32.2 59.02007 2,450,195 263,840 761,201 1,425,154 100% 10.8 31.1 58.2 Percent change 1982–2002 81.4% 114.8% 117.7% 62.8%2002–2007 6.3 29.9 2.5 4.9Note: Employment includes both full-time and part-time employees.Source: U.S. Census Bureau, Annual Survey of Public Employment.
TabLe 8Total justice employment, by justice function, FY 1982–2007
Number of employees Percent of total distribution
Year TotalJudicial and legal services
Police protection Corrections Total
Judicial and legal services
Policeprotection Corrections
1982 1,270,342 247,697 723,923 298,722 100% 19.5% 57.0% 23.5%1987 1,524,976 312,331 792,831 419,814 100% 20.5 52.0 27.51992 1,797,704 373,611 857,593 566,500 100% 20.8 47.7 31.51997 2,078,192 419,072 950,877 708,243 100% 20.2 45.8 34.12002 2,304,201 488,841 1,065,078 750,282 100% 21.2 46.2 32.62007 2,450,195 508,985 1,163,412 777,798 100% 20.8 47.5 31.7 Percent change 1982–2002 81.4% 97.4% 47.1% 151.2%2002–2007 6.3 4.1 9.2 3.7Note: Employment includes both full-time and part-time employees.Source: U.S. Census Bureau, Annual Survey of Public Employment.
TabLe 9Employment distribution for judicial and legal services, by level of government, FY 1982–2007
Number of employees Percent of total distributionYear Total Federal State Local Total Federal State Local1982 247,697 28,588 79,825 139,284 100% 11.5% 32.2% 56.2%1987 312,331 35,668 100,108 176,555 100% 11.4 32.1 56.51992 373,611 50,768 113,548 209,295 100% 13.6 30.4 56.01997 419,072 52,636 138,674 227,762 100% 12.6 33.1 54.32002 488,841 59,576 164,624 264,641 100% 12.2 33.7 54.12007 508,985 60,742 177,530 270,713 100% 11.9 34.9 53.2 Percent change 1982–2002 97.4% 108.4% 106.2% 90.0%2002–2007 4.1 2.0 7.8 2.3Note: Employment includes both full-time and part-time employees.Source: U.S. Census Bureau, Annual Survey of Public Employment.
8 Justice expenditures and employment, 1982-2007 - Statistical Tables
TabLe 10Employment distribution for corrections, by level of government, FY 1982–2007
Number of employees Percent of total distributionYear Total Federal State Local Total Federal State Local1982 298,722 10,045 183,647 105,030 100% 3.4% 61.5% 35.2%1987 419,814 12,860 263,954 143,000 100% 3.1 62.9 34.11992 566,500 23,818 347,985 194,697 100% 4.2 61.4 34.41997 708,243 29,809 458,188 220,246 100% 4.2 64.7 31.12002 750,282 34,245 466,824 249,213 100% 4.6 62.2 33.22007 777,798 36,654 475,024 266,120 100% 4.7 61.1 34.2 Percent change 1982–2002 151.2% 240.9% 154.2% 137.3%2002–2007 3.7 7.0 1.8 6.8Note: Employment includes both full-time and part-time employees.Source: U.S. Census Bureau, Annual Survey of Public Employment.
TabLe 11Employment distribution for police protection, by level of government, FY 1982–2007
Number of employees Percent of total distributionYear Total Federal State Local Total Federal State Local1982 723,923 55,922 77,538 590,463 100% 7.7% 10.7% 81.6%1987 792,831 72,793 87,571 632,467 100% 9.2 11 79.81992 857,593 87,616 86,606 683,371 100% 10.2 10.1 79.71997 950,877 94,294 93,945 762,638 100% 9.9 9.9 80.22002 1,065,078 109,278 110,925 844,875 100% 10.3 10.4 79.32007 1,163,412 166,444 108,647 888,321 100% 14.3 9.3 76.4 Percent change 1982–2002 47.1% 95.4% 43.1% 43.1%2002–2007 9.2 52.3 -2.1 5.1Note: Employment includes both full-time and part-time employees.Source: U.S. Census Bureau, Annual Survey of Public Employment.
TabLe 12Rate of justice employment, by function, FY 1982–2007
Employment (per 1,000 U.S. residents)Total justice employment Total
Judicial andlegal services
Policeprotection CorrectionsYear U.S. population
1982 231,664,000 1,270,342 5.5 1.1 3.1 1.31987 242,289,000 1,524,976 6.3 1.3 3.3 1.71992 255,030,000 1,797,704 7.0 1.5 3.4 2.21997 267,784,000 2,078,192 7.8 1.6 3.6 2.62002 287,804,000 2,304,201 8.0 1.7 3.7 2.62007 301,580,000 2,450,195 8.1 1.7 3.9 2.6Sources: U.S. Census Bureau, Government Finance Survey, Annual Population Estimates 2000–2009, and Historical National Population Estimates: July 1, 1900 to July 1, 1999.

December 2011 9
Definition of TermsExpenditures include only external cash payments made from any source of funds, including any payments financed from borrowing, fund balances, intergovernmental revenue, and other current revenue. It excludes any intragovernmental transfers and noncash transactions, such as the provision of meals or housing of employees. It also excludes retirement of debt, investment in securities, extensions of loans, or agency transactions.
Direct expenditures are all expenditures except those classified as intergovernmental. It includes direct current expenditures (e.g., salaries, wages, fees, and commissions and purchases of supplies, materials, and contractual services) and capital outlays (e.g., construction and purchase of equipment, land, and existing structures). Note that capital outlays are included for the year in which the direct expenditure is made, regardless of how the funds are raised (e.g., bond issue) or when they are paid back.
Intergovernmental transfers are the sum of payments made from one government entity to another, including grants-in-aid, shared revenues, payments in lieu of taxes, and amounts for services performed by one government for another on a reimbursable or cost-sharing basis (e.g., payments by one government to another for boarding prisoners). It excludes amounts paid to other governments for purchase of commodities, property, or utility services.
Employees are all persons on government payrolls during the pay period including March 15, 2007. They include all paid officials and persons on paid leave, but exclude unpaid officials, persons on unpaid leave, pensioners, and contractors.
Police protection is the justice function of enforcing the law, preserving order, and apprehending those who violate the law, whether these activities are performed by a city police department, sheriffs’ office, state police, or federal law enforcement agency such as the Federal Bureau of Investigation (FBI) or the Drug Enforcement Administration (DEA). Private security police are outside the scope of the survey.
Judicial and legal services include all civil and criminal courts and activities associated with courts such as law libraries, grand juries, petit juries, court reporters, judicial councils, bailiffs, and probate functions. It also includes the civil and criminal justice activities of the attorneys general, district attorneys, state’s attorneys, and their variously named equivalents and corporate counsels, solicitors, and legal departments with various names. It excludes legal units of noncriminal justice agencies, whose functions may be performed by legal services departments in other jurisdictions (e.g., a county counsel).
Corrections involves the community supervision, confinement, and rehabilitation of adults and juveniles convicted of offenses and the confinement of persons awaiting trial or adjudication. It includes the costs of operation and employment for jails, prisons, probation and parole offices, pardon proceedings, and correctional administrations. Data for institutions with authority to hold prisoners beyond arraignment (usually 48 hours or more) are included in this definition.
MethodologyThe Justice Expenditure and Employment Extracts (JEE) series is an annual data collection published by the Bureau of Justice Statistics (BJS). Data presented are extracted from the U.S. Census Bureau’s Government Finance Survey and Annual Survey of Public Employment. This report includes federal, state, and local (e.g., city, county, municipal, and township) government direct expenditures and employment for three justice functions: police protection, corrections, and judicial and legal services.
Intergovernmental transfers are excluded to avoid the inflation of expenditures that would result from the adding of intergovernmental transfers plus the direct expenditure of the funds by the recipient government. In addition, intergovernmental transfers themselves may be duplicated. The federal government may transfer money to a state, which then divides that money among localities, causing duplication in the counting of intergovernmental transfers. This also makes it difficult to determine the original source of the intergovernmental transfer. Funds received through
intergovernmental transfers are ultimately captured in the receiving government’s direct expenditures.
Data collectionThis report includes data in 5-year increments from 1982 to 2007. Data were obtained for the federal government, every state government, and all local governments. Beginning in 1997, expenditure data for the federal government were obtained from the Budget of the United States Government using the definitions contained in the federal budget. Prior to 1997, the U.S. Census Bureau compiled expenditures from the federal budget according to Census definitions. Federal government employment data were obtained from the U.S. Office of Personnel Management records.
Expenditures for state as well as local large county and city governments were compiled by U.S. Census Bureau representatives from government audits, budgets, and other financial reports with the advice of state and local officers

10 Justice expenditures and employment, 1982-2007 - Statistical Tables
and employees. The information from these reports was then placed into expenditure categories using the U.S. Census Bureau’s classification system. The data were verified with government officials before being released. Data from other localities were collected from state central collections and through mail surveys to local governments. State and local employment data were collected through a mail survey of all state and local departments, agencies, and institutions. The Government Finance Survey is available on the U.S. Census Bureau’s website at http://www.census.gov/govs/.
Response rates, imputation, and standard errorsThe response rates for localities are presented in the methodology sections of each year’s collection, available on the BJS website. Prior to 1994, the U.S. Census Bureau imputed data of nonresponding jurisdictions from previous years’ data to estimate national, state, and local totals. From 1994 to 2007, the U.S. Census Bureau imputed data from similar nonresponding jurisdictions to estimate national, state, and local totals.
Other BJS employment and expenditure collectionsThe data here differ from other BJS series, which also collect agency-based employment and expenditure data, due to different units of analysis and data collection purposes. All other collections provide more detailed employment data with a more narrow scope than the JEE. Some other collections also include expenditure data with varying levels of detail. These include—
�� The Law Enforcement Management and Administrative Statistics (LEMAS), which collects operating expenditure data and the number of sworn and civilian personnel for law enforcement agencies. Unlike the JEE, LEMAS classifies expenditures and employment by type of agency as opposed to function. For example, transit police for a transportation agency are coded as transportation personnel in LEMAS but as police protection personnel in the JEE. Further discussion of LEMAS is accessible on the BJS website at http://bjs.ojp.usdoj.gov/index.cfm?ty=dcdetail&iid=248.
�� The National Census of State Court Prosecutors (NCSP), which collects employment and expenditure data on prosecutors’ offices in state court systems. It provides detail on the number and type of staff in prosecutors’ offices, including number and types of prosecutors and number of other staff such as investigators and victim advocates. It also includes data on the annual budget of the office and the annual salary of the chief prosecutor. The data it provides are a subset of the judicial and legal services function in the JEE collection. Further discussion of the NCSP is accessible on the BJS website at http://bjs.gov/index.cfm?ty=dcdetail&iid=265.
�� The Census of Jail Facilities (CJF), which provides the number of full- and part-time employees on the government payroll in responding jail jurisdictions. It includes the number and demographic characteristics of correctional officers and the number of other types of personnel such as administrators, professional and technical staff, clerical and maintenance staff, and educational staff. Operating costs collected by the CJF include total salaries, wages, benefits, and other operating expenditures. Capital expenditures for jail jurisdictions include construction costs; equipment, such as vehicles, furnishings, and computers; and other capital costs, such as the purchase of land. Further discussion of the CJF is accessible on the BJS website at http://bjs.gov/index.cfm?ty=dcdetail&iid=254.
�� The Census of State and Federal Adult Correctional Facilities, which contains the same detail on the number and types of personnel as the CJF but it lacks expenditure data. Further discussion is accessible on the BJS website at http://bjs.ojp.usdoj.gov/index.cfm?ty=dcdetail&iid=255.
Adjusting for InflationGovernment expenditures for fiscal years preceding 2007 were inflation adjusted to 2007 constant dollars, as appropriate for state and local government spending and nondefense federal spending. Annual chain-type price indices for gross domestic product were employed as divisors and unadjusted expenditures were employed as dividends to produce inflation adjusted expenditures in 2007 constant dollars.
The U.S. Department of Commerce, Bureau of Economic Analysis, developed the price indices used in all inflation adjustments, as published in the Economic Report of the President. For more information on price indices, see the Economic Report of the President (2009), Table B-7. Chain-type price indexes for gross domestic product, 1959-2008, U.S. Government Printing Office, retrieved from http://www.gpoaccess.gov/eop/tables09.html.
Below is a comparison of total justice expenditures in nominal dollars (before adjusting for inflation) and real dollars (after adjusting for inflation).
aPPeNDiX TabLe 1Total justice expenditures, by nominal and real dollars, FY 1982–2007
YearNominal dollars(in millions)
Real dollars(in millions)
1982 $35,842 $84,1291987 58,871 114,4841992 93,777 154,9121997 129,793 189,4632002 179,580 227,6722007 227,563 227,563


U.S. Department of Justice Office of Justice Programs Bureau of Justice Statistics Washington, DC 20531
Official Business Penalty for Private Use $300
PRESORTED STANDARDPOSTAGE & FEES PAID
DOJ/BJSPermit No. G-91
The Bureau of Justice Statistics is the statistical agency of the U.S. Department of Justice. James P. Lynch is director.
These Statistical Tables were prepared by Tracey Kyckelhahn and verified by Thomas Cohen.
Morgan Young edited the report, Barbara Quinn and Morgan Young produced the report, and Jayne Robinson prepared the report for final printing under the supervision of Doris J. James.
December 2011, NCJ 236218
The full text of each report is available in PDF and ASCII formats on the BJS website at www.bjs.gov. Tables are also available in PDF and CSV formats. Related datasets are made available on the National Archive of Criminal Justice Data website at http://www.icpsr.umich.edu/icpsrweb/NACJD/index.jsp.
Office of Justice Programs • Innovation • Partnerships • Safer Neighborhoods • www.ojp.gov
NCJ236218