Dedicated Channel Capacity of a WCDMA System with HSDPA · Dedicated Channel Capacity of a WCDMA...
58
Dedicated Channel Capacity of a WCDMA System with HSDPA SUJATA BHATTACHARYA Master’s Degree Project Stockholm, Sweden 2005
Transcript of Dedicated Channel Capacity of a WCDMA System with HSDPA · Dedicated Channel Capacity of a WCDMA...

Dedicated Channel Capacity of a
WCDMA System with HSDPA
SUJATA BHATTACHARYA
Master’s Degree ProjectStockholm, Sweden 2005


Dedicated Channel Capacity of a
WCDMA System with HSDPA
SUJATA BHATTACHARYA
Master’s Degree Project
May 2005
TRITA–S3–RST–0512ISSN 1400–9137
ISRN KTH/RST/R--05/12--SE
Radio Communication Systems LaboratoryDepartment of Signals, Sensors and Systems


Abstract
Keeping an eye on the future upcoming demands for mobile applications, 3GPPhas the target to enhance the downlink packet data rate in many folds. As aresult, WCDMA specifications have been evolved with the addition of a newfeature called HSDPA (High Speed Downlink Packet Access) in Release 5. Thegoal of HSDPA has been to increase the system capacity by increasing the datarate and reduce the round trip delay. The increase of system capacity has beenachieved by dynamic sharing of code resource and certain amount of power.
A number of research papers have shown that HSDPA will enhance WCDMAsystem with the fulfillment of the above objective. As per the business forcast,HSDPA will start getting deployed towards the end of this year (2005). How-ever, in a real deployment scenario, it may happen that some of the cells areimplemented with HSDPA and some are not yet; what will happen to the capac-ity of those cells without HSDPA? When HSDPA is implemented in a cell, thebase station uses more power, imparting more interference to the neighbouringcells, thus affecting their dedicated channel capacity. In addition to the higherpower, if the availability of data in the HSDPA channel varies, then the inter-ference to the neighbouring cell might be larger and fluctuating, in turn, thededicated channel capacity of the neighbouring cells might be affected.
This scenario has been studied in this master thesis. Mainly, it has beenstudied how is the dedicated channel capacity of a cell without HSDPA affectedby the introduction of an HSDPA channel in adjacent cell. Does this influencedepend on the data traffic on the HSDPA channel?
With the simple system model used, it has been observed that though there isa change in the capacity of the system after implementing HSDPA in adjacentcells, the variation is negligible. It has been found that the decrease in thededicated channel capacity is more if the HSDPA data traffic is larger. Thefluctuating data in HSDPA channel has not degraded the capacity further; itis only the higher power, which has affected the dedicated channel capacity.However, in all these cases, variation can be considered as negligible. So, ithas been concluded that there is no impact on the capacity of cells which arenot with HSDPA after implementing HSDPA in adjacent cells. Considering thelimitations in this study, it has been suggested to study this aspect further byusing a more complex system model to find out the reality.
iii


Acknowledgements
I would like to convey my deepest gratitude to my advisor, Bogdan Timus, whohas guided me in pursuing my thesis. I sincerely appreciate his effort to helpme in my work. I would like to convey my thanks to Prof.Dr. Jens Zander forhis kind consent of becoming my examiner for this master thesis.
In addition, I would like to express my indebtedness to Prof.Dr. MikaelSkoglund, Program Director, Master program in Wireless systems for giving methe opportunity to join the master program in which this thesis is a part of thecurriculum. I would like to thank Dr. Ben Slimane and Dr. Bo Karlson fortheir guidance and motivation to join the master program.
I am in deed thankful to Dr. Muhammad Kazmi from Ericsson for hiscomments to my thesis during the study period. Also I am thankful to all othercollegues in Radio Communication Systems department for their kind support.Lastly, I acknowledge the support and inspiration given by my family in pursuingand achieving this work.
v


Contents
1 Introduction 1
1.1 Background . . . . . . . . . . . . . . . . . . . . . . . . . . . . . . 1
1.2 Thesis Motivation . . . . . . . . . . . . . . . . . . . . . . . . . . 2
1.3 Problem Definition . . . . . . . . . . . . . . . . . . . . . . . . . . 2
1.4 Previous Work . . . . . . . . . . . . . . . . . . . . . . . . . . . . 5
1.5 Report Outline . . . . . . . . . . . . . . . . . . . . . . . . . . . . 6
2 HSDPA Overview 7
2.1 General . . . . . . . . . . . . . . . . . . . . . . . . . . . . . . . . 7
2.2 Channels in HSDPA . . . . . . . . . . . . . . . . . . . . . . . . . 7
2.2.1 HS-DSCH . . . . . . . . . . . . . . . . . . . . . . . . . . . 8
2.2.2 HS-SCCH . . . . . . . . . . . . . . . . . . . . . . . . . . . 8
2.2.3 HS-DPCCH . . . . . . . . . . . . . . . . . . . . . . . . . . 9
2.2.4 DPCH . . . . . . . . . . . . . . . . . . . . . . . . . . . . . 9
2.3 Fast Link Adaptation . . . . . . . . . . . . . . . . . . . . . . . . 9
2.4 Hybrid ARQ . . . . . . . . . . . . . . . . . . . . . . . . . . . . . 10
2.5 Fast Scheduling . . . . . . . . . . . . . . . . . . . . . . . . . . . . 10
2.6 Power Control . . . . . . . . . . . . . . . . . . . . . . . . . . . . . 10
3 System Model 13
3.1 Network Model . . . . . . . . . . . . . . . . . . . . . . . . . . . . 13
3.1.1 Cell Deployment Model . . . . . . . . . . . . . . . . . . . 13
3.1.2 Propagation Model . . . . . . . . . . . . . . . . . . . . . . 13
3.1.3 Handover . . . . . . . . . . . . . . . . . . . . . . . . . . . 15
3.1.4 HSDPA Model . . . . . . . . . . . . . . . . . . . . . . . . 15
3.1.5 Traffic Model . . . . . . . . . . . . . . . . . . . . . . . . . 15
3.1.6 Power Control Model . . . . . . . . . . . . . . . . . . . . 16
3.1.7 Interference Model . . . . . . . . . . . . . . . . . . . . . . 17
3.1.8 Receiver Model . . . . . . . . . . . . . . . . . . . . . . . . 18
3.2 System Quality Measure . . . . . . . . . . . . . . . . . . . . . . . 19
4 Results 21
4.1 Adjacent Cell Dissatisfaction . . . . . . . . . . . . . . . . . . . . 21
4.2 HSDPA Admission Threshold . . . . . . . . . . . . . . . . . . . . 24
4.3 Comparison of DCH Capacity . . . . . . . . . . . . . . . . . . . . 28
vii
viii Contents
5 Conclusion 31
5.1 Conclusion . . . . . . . . . . . . . . . . . . . . . . . . . . . . . . 315.2 Future Work . . . . . . . . . . . . . . . . . . . . . . . . . . . . . 31
References 33
A Receiver Model Details 35
B UTRAN Overview 39
B.1 General . . . . . . . . . . . . . . . . . . . . . . . . . . . . . . . . 39B.2 Power Control . . . . . . . . . . . . . . . . . . . . . . . . . . . . . 41
B.2.1 Inner loop Power control . . . . . . . . . . . . . . . . . . . 42B.2.2 Outer loop Power Control . . . . . . . . . . . . . . . . . . 42
List of Figures
1.1 System Example- Combination of cells-with/without HSDPA . . 31.2 Capacity variation after HSDPA implementation in adjacent cells 4
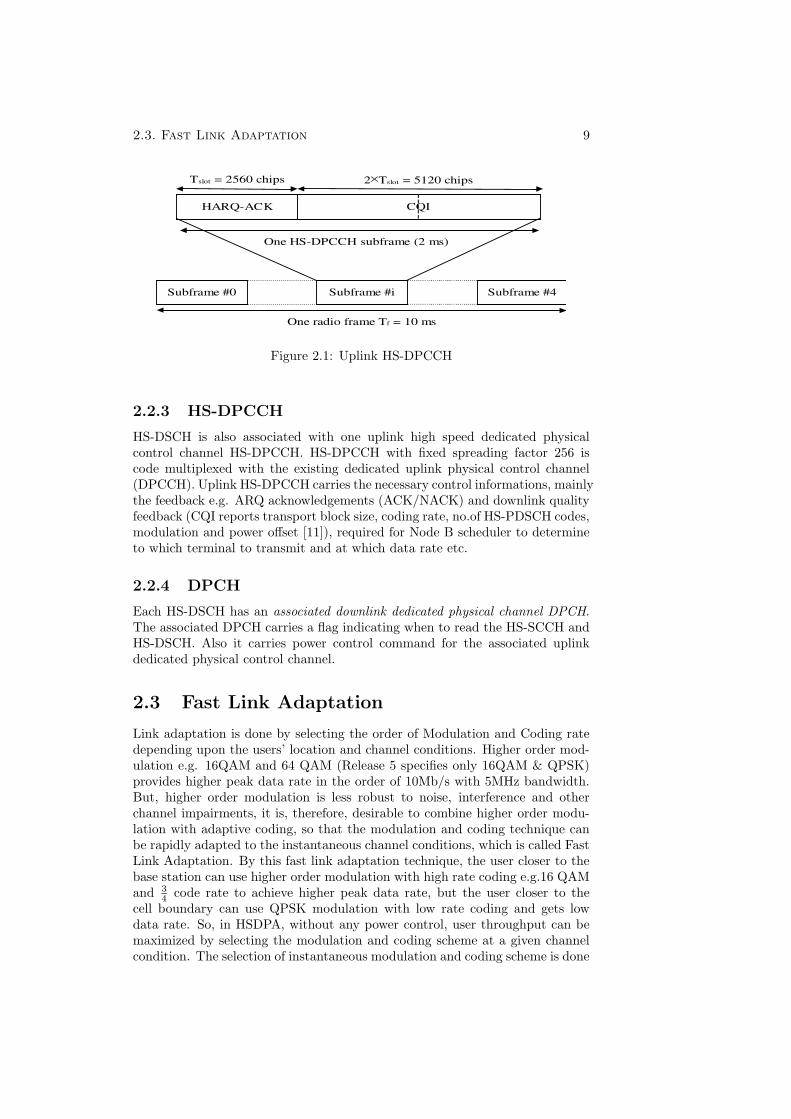
2.1 Uplink HS-DPCCH . . . . . . . . . . . . . . . . . . . . . . . . . . 9
3.1 Network Model . . . . . . . . . . . . . . . . . . . . . . . . . . . . 143.2 Single Stage Markov Chain . . . . . . . . . . . . . . . . . . . . . 16
4.1 Adjacent Cell Dissatisfaction (TPCdelay = 0) . . . . . . . . . . . 224.2 Adjacent Cell Dissatisfaction (TPCdelay = 2) . . . . . . . . . . . 234.3 BSPower Distribution for Reference System at different loads . . 254.4 System Dissatisfaction for different HSPWR threshold . . . . . . 264.5 Adjacent Cell Dissatisfaction for different HSPWR threshold . . 274.6 Comparison of DCH Capacity of adjacent cells without HSDPA . 29
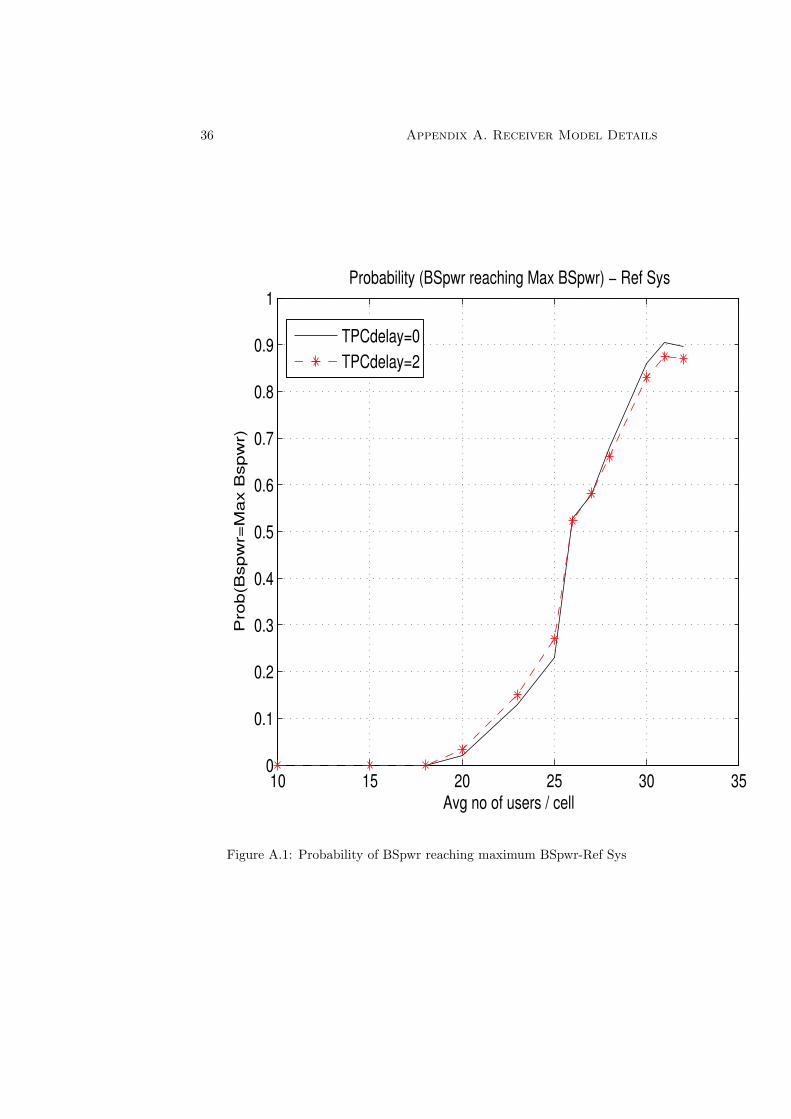
A.1 Probability of BSpwr reaching maximum BSpwr-Ref Sys . . . . 36A.2 Average Base Station Power-Ref Sys . . . . . . . . . . . . . . . . 37A.3 Determination of Reference SIR- Ref Sys . . . . . . . . . . . . . 38
B.1 UMTS architecture . . . . . . . . . . . . . . . . . . . . . . . . . . 40B.2 Radio frame for Uplink dedicated physical channel . . . . . . . . 40B.3 Radio frame for Downlink Dedicated Physical Channel . . . . . . 41
ix


List of Abbreviations
3GPP 3rd Generation Partnership ProjectBCCH Broadcast Control ChannelBCH Broadcast ChannelBER Bit Error RateBLER Block Error RateBS Base StationCCCH Common Control ChannelCPCH Common Packet ChannelCTCH Common Traffic ChannelDCH Dedicated ChannelDCCH Dedicated Control ChannelDSCH Downlink Shared ChannelDTCH Dedicated Traffic ChannelFACH Forwardlink Access ChannelHARQ Hybrid Automatic Repeat RequestHSDPA High Speed Downlink Packet AccessHS-DSCH High Speed Downlink Shared ChannelPCCH Paging Control ChannelPCH Paging ChannelQAM Quadrature Amplitude ModulationQPSK Quadrature Phase Shift KeyingRACH Random Access ChannelSHCCH Shared Control ChannelSIR Signal to Interference RatioTCP Transmission Control ProtocolTTI Transmission Time IntervalUE User EquipmentUMTS Universal Mobile Telecommunications SystemUTRAN UMTS Terrestrial Radio Access NetworkWCDMA Wideband Code Division Multiple Access
xi

Chapter 1
Introduction
1.1 Background
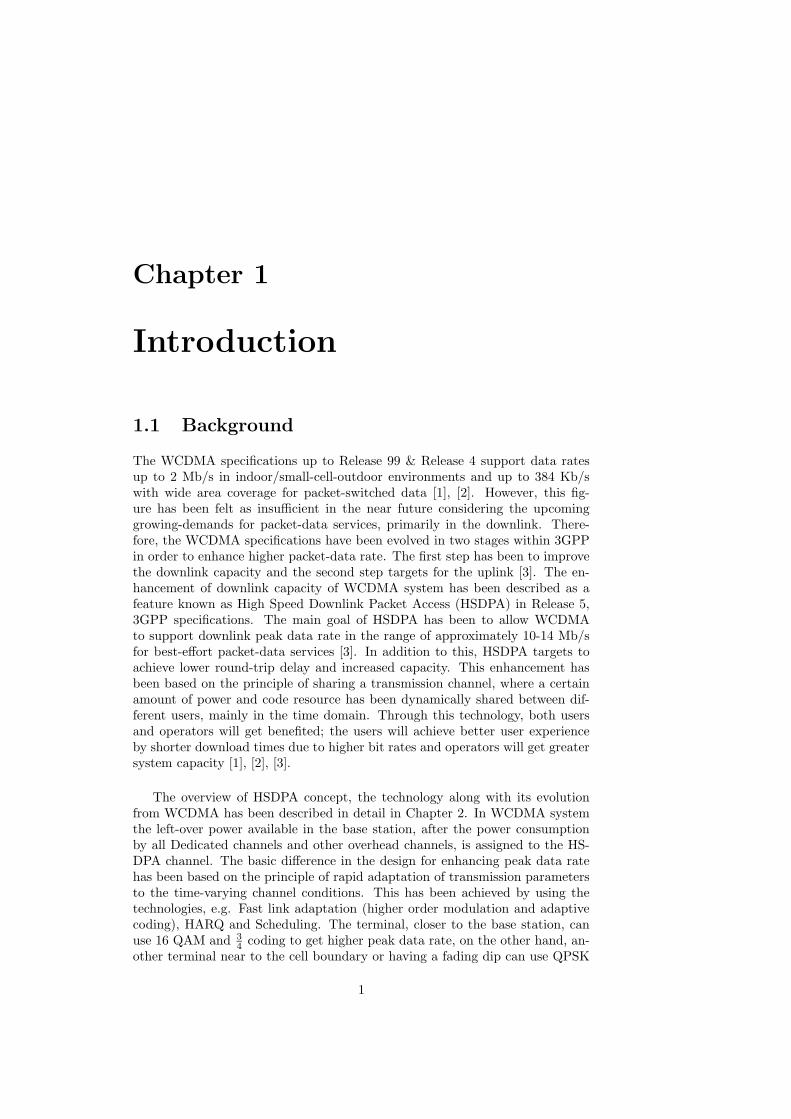
The WCDMA specifications up to Release 99 & Release 4 support data ratesup to 2 Mb/s in indoor/small-cell-outdoor environments and up to 384 Kb/swith wide area coverage for packet-switched data [1], [2]. However, this fig-ure has been felt as insufficient in the near future considering the upcominggrowing-demands for packet-data services, primarily in the downlink. There-fore, the WCDMA specifications have been evolved in two stages within 3GPPin order to enhance higher packet-data rate. The first step has been to improvethe downlink capacity and the second step targets for the uplink [3]. The en-hancement of downlink capacity of WCDMA system has been described as afeature known as High Speed Downlink Packet Access (HSDPA) in Release 5,3GPP specifications. The main goal of HSDPA has been to allow WCDMAto support downlink peak data rate in the range of approximately 10-14 Mb/sfor best-effort packet-data services [3]. In addition to this, HSDPA targets toachieve lower round-trip delay and increased capacity. This enhancement hasbeen based on the principle of sharing a transmission channel, where a certainamount of power and code resource has been dynamically shared between dif-ferent users, mainly in the time domain. Through this technology, both usersand operators will get benefited; the users will achieve better user experienceby shorter download times due to higher bit rates and operators will get greatersystem capacity [1], [2], [3].
The overview of HSDPA concept, the technology along with its evolutionfrom WCDMA has been described in detail in Chapter 2. In WCDMA systemthe left-over power available in the base station, after the power consumptionby all Dedicated channels and other overhead channels, is assigned to the HS-DPA channel. The basic difference in the design for enhancing peak data ratehas been based on the principle of rapid adaptation of transmission parametersto the time-varying channel conditions. This has been achieved by using thetechnologies, e.g. Fast link adaptation (higher order modulation and adaptivecoding), HARQ and Scheduling. The terminal, closer to the base station, canuse 16 QAM and 3
4coding to get higher peak data rate, on the other hand, an-
other terminal near to the cell boundary or having a fading dip can use QPSK
1

2 Chapter 1. Introduction
and low rate code to get lower data rate. Also Release 5 has introduced a newshared downlink channel for packet data, called HS-DSCH (High Speed Down-link Shared Channel). In order to reduce the round trip delay, the requiredHSDPA functionalities i.e. Fast link adaptation, HARQ & Scheduling havebeen implemented in Node B, closer to the air interface. In Node B, this newfunctionality has been implemented in a new entity, called MAC-hs [1], [2], [3],[4], [9], [10], [11], [12].
1.2 Thesis Motivation
After the standardization of Release 5 specifications in 3GPP, number of stud-ies have been conducted on the evaluation of the performance of HSDPA. Allthe previous studies have shown improved system performance due to HSDPAimplementation. The article [5] has shown the increased system capacity overdedicated channels. In this study, all cells have been implemented with HSDPA.However, in a real deployment scenario it may happen that all the cells do notimplement HSDPA in the initial stage. Different higher layer protocols havebeen designed in WCDMA systems in such a way, that the HSDPA function-ality should be able to operate in an environment where certain cells are notupdated with HSDPA functionality [4]. As HSDPA leads to higher power in thesystem, it may create more interference to the neighbouring cells, affecting thededicated channel capacity of those cells. None of the previous studies has con-sidered the impact of HSDPA implementation on the dedicated channel capacityin neighbouring cells when those cells do not have HSDPA. Therefore, in thisMaster thesis, the impact of HSDPA implementation on the dedicated channelcapacity in neighbouring cells, has been studied when those neighbouring cellsdo not have HSDPA.
1.3 Problem Definition
As per the market forecast [15], HSDPA will start getting deployed towards endof the year 2005. It will be deployed in phases. That means, it will happenthat there will be combination of cells in a network in the begining, where someof the cells will not have HSDPA; they will have only Dedicated channels andsome cells will have HSDPA, having both Dedicated and HS-DSCH channel.Figure 1.1 shows this scenario as an example; cell-2 has HSDPA, but cell-1 doesnot have; it has only Dedicated channels.
In WCDMA systems, due to the varying channel conditions, the power ina dedicated channel varies by the power control mechanism as described in theappendix -B.2. The power transmitted by the base station is large if the termi-nal is far away on the boundary of the cell, on the other hand, the base stationtransmit power is low if the terminal is closer to the base station. Anotherreason for the use of power control in dedicated channels is the variation ofinterference from neighbouring cells because of the changes in the transmissionpower in those cells.

1.3. Problem Definition 3
Figure 1.1: System Example- Combination of cells-with/without HSDPA

4 Chapter 1. Introduction
Figure 1.2: Capacity variation after HSDPA implementation in adjacent cells
The Base station in cell-2 in Figure 1.1 uses larger power due to HSDPAimplementation, which imparts larger interference to cell-1. As the dedicatedchannels in cell-1 is power controlled, the base station in cell-1 will increaseits power due to larger interference. As a result, the capacity of cell-1 will beaffected. Secondly, if the traffic variation in HSDPA is large, the base stationpower in cell-2 will be larger and fluctuating, which will impart larger and fluc-tuating interference to cell-1. Due to non ideal power control of Dedicated chan-nel, this larger and fluctuating interference may also affect the capacity of cell-1.
This phenomenon has been explained in detail in the Figure 1.2. Initiallyboth the cells do not have HSDPA; they have only Dedicated channels. At thisstage, it has been assumed that the capacity of the cell-1 is ’Cap-1’, which hasbeen achieved after the power control due to fluctuation in its own dedicatedchannel and due to interference from cell-2.
When HSDPA is implemented in cell-2 with 100% activity (100% activitymeans that there is constant supply of data for transmission), the base stationpower in cell-2 is larger, but constant. This larger & constant power will im-part larger and constant interference to cell-1, so the base station in cell-1 willincrease its power in order to achieve the target SIR level. As a result, capacityof cell-1 will be affected. The first problem is to find out how much is the vari-ation in the capacity of the cell-1 after HSDPA implementation in cell-2? Willit be larger or lower than the reference case? Because in the reference case, theinterference varies, but here the interference is constant.
In the second case, when activity factor is less than 100% i.e. there is notsufficient data available in the HSDPA channel for transmission; there is fluctu-
1.4. Previous Work 5
ation in the availability of HSDPA data in cell-2, then the base station powerin cell-2 will be larger and fluctuating, which imparts larger and fluctuatinginterference to cell-1. Under this scenario how much is the capacity variationin cell-1? Is this variation is larger than the case with 100% active HSDPA celldue to larger variance of interference and use of non-ideal power control?With the above understanding, the thesis answers the following questions:
• How is the Dedicated channel capacity in a cell without HSDPA affectedby the introduction of a fully loaded (100% activity) HSDPA channel ina neighbouring cell?
• Does the Dedicated channel capacity vary for different HSDPA activityfactors?
This problem can also be interpreted as:
• Is there any impact on the dedicated channel capacity of a cell due tolarger interference from its adjacent cell?
• Is there any impact on the dedicated channel capacity of a cell due tovariation of interference from its adjacent cell?
1.4 Previous Work
Following previous studies have been described to show that all these stud-ies have considered that all cells are implemented with HSDPA. The scenarioof initial deployment phase, where some cells might not have HSDPA imple-mentation, has not been considered. Following studies have shown improvedperformance due to the implementation of HSDPA functionalities like Fast linkadaptation, HARQ and Scheduling, but the effects of larger interference due toHSDPA introduction on adjecent cells, on those cells which do not have HSDPA,has not been studied.
In the study [2], the performance of HSDPA-evolved WCDMA system hasbeen evaluated by a system level simulation, taking web-browsing users intoaccount. All HSDPA techniques e.g. Link Adaptation, Hybrid ARQ, andScheduling have been simulated for the study to show how these techniqueshelp to increase the throughput, lower the delays and increase peak data ratesup to 10 Mbits/sec. The ratio of the correctly received user bits during theentire session and the session length, excluding the time during which there isno data for transmission, has been defined as the system throughput. The per-formance of the system has been measured in terms of the system throughputas a function of the offered load. With the above performance criteria and onesimplified system model, the simulation result has shown good throughput evenat high loads. But this study has evaluated the overall system performance withHSDPA implemented in all cells.
Another study [5] has indicated that the introduction of HS-DSCH has sig-nificantly improved the performance of TCP based applications and the systemcapacity. The study has used the end-user quality i.e. the TCP file transfer de-lay as the performance criteria as a function of the system load i.e. the number

6 Chapter 1. Introduction
of users. First, the performance has been measured in a system without HS-DPA. After implementing HSDPA, the performance has again been measured.Interestingly it has been shown that the TCP file transfer delay has been re-duced in the system with HSDPA. The simulation result has shown that boththe application performance and the system capacity have been increased overthe dedicated channels. It has also specified that the application performancehas been increased due to shorter TTI and HARQ being located in Node B,but the increase in the system throughput has been mainly due to higher datarate by adaptive modulation and coding and by efficient scheduling of users.This study has evaluated both the HS-DSCH channel and dedicated channel,but with the same scenario that all cells do have HSDPA.
Though this study is no way related to this master thesis, it is described hereto show that all HSDPA functionality may not be available in the beginning. Inpractical scenario, higher order modulation may not be available initially in allterminals. Therefore, another study has been done on HS-DSCH performanceto know up to what extent the enhancement due to HSDPA depends on higherorder modulation. This result has been published in the article [6]. In this pa-per, the impact of higher order modulation on HS-DSCH performance has beenstudied by comparing the HS-DSCH performance with 16 QAM with the HS-DSCH performance with QPSK. The performance has been measured in termsof packet bit rate versus system throughput. It has been found that withouthigher order modulation (16 QAM), performance improvement is substantialwith the introduction of HSDPA (with QPSK) because of the lower round triptimes obtained by shorter TTI (2 ms).
1.5 Report Outline
• Overview of HSDPA concept has been described in chapter 2.
• Chapter 3 has presented the system model used during the study.
• The result obtained from the simulation and its explanation have beendescribed in chapter 4.
• Chapter 5 concludes with discussions and suggestion for further work.
• Lastly, details of the used Receiver model & UTRAN overview have beenappened.

Chapter 2
HSDPA Overview
2.1 General
HSDPA, an evolution to WCDMA, aims at enhancing the packet peak data ratein the downlink direction up to the range of 14 Mb/s. It also aims to reducethe round trip delay and to achieve higher system capacity.
The technologies which are used to achieve the above requirements of HS-DPA, include Fast link adaptation (Adaptive Modulation and Coding), fasthybrid ARQ, fast scheduling, fast cell selection and multiple-input-multiple-output (MIMO) antenna solution. 3GPP Release 5 specifications have includedonly fast link adaptation, fast hybrid ARQ and fast scheduling techniques forimplementing HSDPA.
The basic technology used for HSDPA is based on the rapid adaptationof transmission parameters to the time-varying channel conditions in order toachieve higher peak data rate. Therefore, the corresponding functions suchas fast link adaptation and fast scheduling have been placed closer to the airinterface i.e. in the Node B (Base station), which is different in present WCDMAsystem where these functions are handled by RNC. Hence, for HSDPA, certainfunctionality has been shifted from RNC to Node B by the addition of a newentity in Node B, called MAC-hs. MAC-hs handles all HSDPA functionalitiese.g. HARQ (generating ACK/NACK), reordering and multiplexing [1], [2] &[4].
2.2 Channels in HSDPA
In order to implement the HSDPA functionalities, Release 5 has introduced anew downlink transport channel for best effort packet data, called HS-DSCH(High Speed Downlink Shared Channel) and related signaling channels apartfrom the existing channels as described in [12]. The details are given in thefollowing subsections.
7

8 Chapter 2. HSDPA Overview
2.2.1 HS-DSCH
HSDPA introduces a new down link transport channel, HS-DSCH (High SpeedDownlink Shared Channel), to be used for best effort packet-data, which is ter-minated in the Node B and is controlled by MAC-hs. HS-DSCH is shared byseveral UEs, transmitted over the entire cell or over only part of the cell usinge.g. beam-forming antennas.
HS-DSCH corresponds to a common channelization code resource, sharedamong several users mainly in the time domain. The code resource consists ofmultiple codes of fixed spreading factor 16 and up to 15 out of 16 orthogonalcodes can be allocated for HS-DSCH. Also a part of the code tree can be al-located to HS-DSCH and the remaining part can be used simultaneously forother channels e.g. dedicated channels used for speech services. All channeliza-tion codes in a single HS-DSCH frame are assigned the same scrambling codesequence.
HS-DSCH uses a shorter TTI (Transmission Time Interval) equal to 2ms(equivalent to one sub- frame of three slots i.e.7680 chips) compared to 10msdedicated channel TTI. Also, there is one transport block per HS-DSCH TTI.Shorter TTI helps in reducing the delay as it reduces the retransmission time.Also it helps in designing a finer scheduling process as it can track channelvariations in a better way. HS-DSCH is allocated to different users on the ba-sis of HS-DSCH TTI i.e. within one TTI, HS-DSCH code resource is usuallyallocated to a single user, however, two or more users can use the HS-DSCHchannel within one TTI by sharing the code resource i.e. by using distinct partof the code tree. In other words, multiplexing of multiple users for HS-DSCHtransmission is allowed in code-domain as well as in time-domain.
The corresponding physical channel is denoted by HS-PDSCH (High SpeedPhysical Downlink Shared Channel).
2.2.2 HS-SCCH
HS-DSCH is associated with one or several (up to max. 4) downlink HighSpeed Shared Control Channels (HS-SCCH). HS-SCCH, a physical channel,carries channelisation code set in order to indicate which UE has been sched-uled and necessary signalling information for the UE to decode the HS-DSCH.Node B transmits HS-SCCH two slots before the corresponding HS-DSCH TTIto inform the terminal. HS-SCCH channel carries informations in two parts.The first part contains channelisation code set and the modulation scheme forthe allocated HS-DSCH. The UE identifies the HS-SCCH carrying informationfor it by descrambling the first part by the UE identity. The second part con-tains transport block size and HARQ related information. If there is HS-DSCHtransmission to the same user in consecutive HS-DSCH TTIs, then the sameHS-SCCH is used for the corresponding associated downlink signalling.
2.3. Fast Link Adaptation 9
Subframe #0 Subframe # i Subframe #4
HARQ-ACK CQI
One radio frame T f = 10 ms
One HS-DPCCH subframe (2 ms)
2 × T slot = 5120 chips T slot = 2560 chips
Figure 2.1: Uplink HS-DPCCH
2.2.3 HS-DPCCH
HS-DSCH is also associated with one uplink high speed dedicated physicalcontrol channel HS-DPCCH. HS-DPCCH with fixed spreading factor 256 iscode multiplexed with the existing dedicated uplink physical control channel(DPCCH). Uplink HS-DPCCH carries the necessary control informations, mainlythe feedback e.g. ARQ acknowledgements (ACK/NACK) and downlink qualityfeedback (CQI reports transport block size, coding rate, no.of HS-PDSCH codes,modulation and power offset [11]), required for Node B scheduler to determineto which terminal to transmit and at which data rate etc.
2.2.4 DPCH
Each HS-DSCH has an associated downlink dedicated physical channel DPCH.The associated DPCH carries a flag indicating when to read the HS-SCCH andHS-DSCH. Also it carries power control command for the associated uplinkdedicated physical control channel.
2.3 Fast Link Adaptation
Link adaptation is done by selecting the order of Modulation and Coding ratedepending upon the users’ location and channel conditions. Higher order mod-ulation e.g. 16QAM and 64 QAM (Release 5 specifies only 16QAM & QPSK)provides higher peak data rate in the order of 10Mb/s with 5MHz bandwidth.But, higher order modulation is less robust to noise, interference and otherchannel impairments, it is, therefore, desirable to combine higher order modu-lation with adaptive coding, so that the modulation and coding technique canbe rapidly adapted to the instantaneous channel conditions, which is called FastLink Adaptation. By this fast link adaptation technique, the user closer to thebase station can use higher order modulation with high rate coding e.g.16 QAMand 3
4code rate to achieve higher peak data rate, but the user closer to the
cell boundary can use QPSK modulation with low rate coding and gets lowdata rate. So, in HSDPA, without any power control, user throughput can bemaximized by selecting the modulation and coding scheme at a given channelcondition. The selection of instantaneous modulation and coding scheme is done

10 Chapter 2. HSDPA Overview
by Node B, on the basis of downlink channel quality. MAC-hs located in NodeB, selects the transport format based on the channel quality feedback reportedby the UE or from the transmit power of an associated DPCH.
2.4 Hybrid ARQ
The receiver sends a negative acknowledgement to retransmit when detects anerror. Combining the soft information from both the transmissions (originaland retransmission) prior to decoding is known as Hybrid ARQ type-II. Thisimproves the performance. The fast hybrid ARQ together with fast link adap-tation is beneficial. The link adaptation selects a good initial estimate of theamount of required redundancy by selecting the coding scheme, so that therewill not be many retransmissions. The hybrid ARQ fine-tunes the effectivecode rate. Retransmission requests can be made per HS-DSCH TTI in HSDPA,contrary to earlier WCDMA releases, where retransmission requests are madeper transmit block. In HSDPA, the use of a single CRC (A CRC of size 24bits is calculated and added per HS-DSCH TTI) for all transport blocks in oneTTI reduces the overhead compared to using one CRC per transport block inRelease 99. There are two methods of combining original transmission and re-transmission i.e. Chase combining and Incremental Redundancy (IR). In Chasecombining, identical encoded data is transmitted in response to a retransmis-sion request, but in IR, only additional parity bits are transmitted against aretransmission request. These additional parity bits are used together with theoriginal parity bit, thereby, reducing the code rate.
2.5 Fast Scheduling
Fast scheduling is the mechanism to determine which user to transmit throughthe shared channel (HS-DSCH) during a time interval TTI. It is a key elementin the design as it determines the overall behaviour of the system. The mainobjective of the scheduler is to achieve maximum system throughput by assign-ing all the available radio resources to the user with the best radio conditions,at the same time, maintaining some degree of fairness between users.
2.6 Power Control
By power control mechanism, similar service quality is provided to all communi-cation links despite the variations in the channel conditions, that means largerproportion of the total available power is consumed for the bad channel condi-tions. It is obvious that radio resources can be efficiently used when allocated togood channel conditions. Therefore, it is understood that power control is notthe most efficient tool for allocating resources from the overall system through-put point of view. Therefore, while designing HSDPA, power control has beendeactivated for HSDPA channel. The necessary requirements are fulfilled bythe techniques e, g, Adaptive Modulation and Coding and Hybrid ARQ. Bythe absence of power control, power efficiency is gained due to the eliminationof power control overhead. Also, when 16 QAM is used, amplitude estimationand more accurate phase estimation are needed to separate the constellation

2.6. Power Control 11
points in the demodulation/detection process. To estimate the amplitude, ratioof the amplitude of the power level of HS-DSCH and pilot power level (fromCommon Pilot Channel - CPICH) is required, so if power control is applied, itwill deteriorate the performance. Hence, power control is not recommended if16 QAM is used [Ch.11, Pg.285, [9]].
• HS-PDSCH: The HS-PDSCH power control is under the control of Node B.When the HS-PDSCH is transmitted using 16QAM, the UE may assumethat the power is kept constant during the corresponding HS-DSCH subframe. In case of multiple HS-PDSCH transmission to one UE, all theHS-PDSCHs intended for that UE shall be transmitted with equal power.The sum of the powers used by all HS-PDSCHs and HS-SCCHs in a cellshall not exceed the value of ’HS-PDSCH and HS-SCCH Total Power’ ifsignaled by higher layers[4],[10].
• HS-SCCH: The HS-SCCH power control is under the control of the NodeB. It may follow the power control commands sent by the UE to the NodeB or any other power control procedure applied by the Node B.
• HS-DPCCH: The power control of uplink HS-DPCCH is done by the as-sociated downlink DPCH.


Chapter 3
System Model
3.1 Network Model
This thesis has been studied by a simple system level simulation in MATLAB/ RUNE environment. First, a WCDMA system without HSDPA (no cellshave HSDPA implementation) has been simulated, which has been used as a’Reference System’. Then, HSDPA has been implemented in some cells with100% activity for the study. Lastly, the HSDPA activity factor has been variedto study the influence on System capacity in comparison to the capacity of theReference System.
3.1.1 Cell Deployment Model
In this system model, the deployment site corresponds to an urban area. Itconsists of seven sites with 3-sector antenna, making a total of 21 uniformhexagonal cells Figure 3.1. The cell radius is 500 m [5]. The users are distributeduniformly throughout the cell and move randomly with a constant velocity of 3km/hr. The wrap-around technique has been used to prevent the border effects[6], [13].
3.1.2 Propagation Model
The Propagation model consist of three components:
• distance dependent component according to Okumura-Hata [14]
• a log-normal distributed component used to model shadow fading (thiscomponent has a spatial correlation with an exponential decrease so thatthe correlation is exp(-1) at 110 m).
• a fast fading component (rayleigh fading) with spatial correlation. Thefading rate is related to the spatial correlation.
13

14 Chapter 3. System Model
−2000 −1000 0 1000 2000
−2000
−1500
−1000
−500
0
500
1000
1500
2000
1
2
3
4
5 6
7
8
9
10
11
12 13
14
15
16
17
18
19 20
21
Network Model
HSDPA HSDPA
HSDPA
HSDPA
Figure 3.1: Network Model

3.1. Network Model 15
Propagation Specific Parameters
gain constant (gain at 1 meter distance) - 28noise floor (thermal noise floor) - 103 dBmalpha (distance attenuation coefficient) 3.5sigma (standard deviation for the log-normal fading) 8 dBraa ( lognormal correlation down link) 0.5corrdist (lognormal fading correlation distance) 110 m
Rayleigh Fading
Fading rate fd is given by [16]
fd =v
λ(3.1)
where
• v = the velocity of the mobile
• λ = the wavelength of the carrier
As the mobile velocity has been taken as 3 km/hr in this system model andthe wavelength of WCDMA carrier is 0.15m, the fading rate is very small.
3.1.3 Handover
An Ideal soft handover algorithm has been implemented, which is based on errorfree measurement without any delay. This means that a base station is added tothe active set as soon as the average pathgain to that base station (i.e. ignoringthe fast fading) is within 3dB from the average pathgain between the mobileand the best base station. In other words, the handover margin is 3 dB andthere is no limit for how many base stations can be added to the active set.
3.1.4 HSDPA Model
HSDPA has been implemented in 4 cells (cell no. 1, 3, 4 & 5), out of total 21cells with 100% and 50% HSDPA activity. Cells for HSDPA implementationhas been selected in such a way that almost all other cells in the network areadjacent to HSDPA enabled cells. As the study covers only the effects of inter-ference, on those cells which do not have HSDPA, caused by larger power dueto HSDPA implementation on neighbouring cells, all HSDPA functionalities likeAdaptive Modulation, HARQ and Scheduling have not been implemented. Theinterference effect has only been simulated by changing the power settings.
3.1.5 Traffic Model
DCH
The traffic over the dedicated channel has been considered as some continuouslytransmitted services which requires -18 dB as the SIR target required for powercontrol.
userbr (user bit rate) 12.200 kbpsofftraf (average number of offered load to a cell) 10:32 (20:26)

16 Chapter 3. System Model
ON OFF
0.5
0.5
HSDPA Activity – 50%
Figure 3.2: Single Stage Markov Chain
HSDPA
For HSDPA channel, it has been assumed for simplicity that there is only oneHSDPA user in one HSDPA cell. Two cases of HSDPA traffic activity have beenconsidered. one is 100% activity i.e. if the cell is HSDPA enabled, then there isalways HSDPA data for transmission. The second case assumes 50% activity,so there is fluctuation in the availability of the HSDPA data for transmission.50% activity of HSDPA channel has been implemented slot wise by a singlestage markov chain with transition probabilities equal to 0.5 as shown in theFigure 3.2.
3.1.6 Power Control Model
The downlink common control channels have been allocated 20% of the max-imum base station power, which has been denoted as Overhead power. Somesafety margin (10%) has been taken for the target base station power, whichlimits only the HSDPA power. The remaining part ( e.g.70%) has been allo-cated to Dedicated channels and HSDPA channels. In order to design a stablesystem, the maximum base station power and maximum DCH power have beenlimited.
poh (overhead power) 4 Wbspwrtarget (target base station power) 18 Wpbsmax ( maximum base station power) 21 Wpchmax (maximum channel power) 33 dBmsirtarget (C/I target level for inner loop power control) - 18 dB
Power Control is implemented in the base station. The type of power con-trol which has been assumed for HSDPA implies that the DCH channels havehigher priority than the HSDPA channels. This means that the base stationautomatically protects the DCH channels by preempting resources from theHSDPA channel whenever needed (i.e. giving the HSDPA channel the ”powerleft-overs”).
3.1. Network Model 17
DCH
Inner loop power control (+/- 1 dB per slot) has been modeled for dedicatedchannels in the following way: The received SIR on each user is measured andcompared with the target SIR (-18dB). If the received SIR is less than the tar-get SIR, then a command is sent to the base station to increase the transmittedpower by one dB, otherwise it is decreased by one dB.Two different models of the power control have been tested; one model has usedideal power control i.e. no delay (No delay means that the power is changed inthe next slot, i.e. the transmission power in slot n+1 is set according to the SIRmeasurement in slot n). The other model has used a delay of 2 slots i.e. if thesir measurement is done in slot ’n’ and it is required to increase transmit powerby 1 dB, then it is increased in the slot ’n+3’.
Outer loop power control has not been implemented in this study.
There is a mechanism for scaling down the DCH power whenever the requiredsum of powers exceeds the base station power limit. This affects the DCH powersetting but not the overhead power.
HSDPA
HSDPA power on every third slot (’n’) is set as per the following formula. TheHSDPA power in slots ’n+1’ & ’n+2’ is the same as that in the slot ’n’.
HSDPApwr = BStargetpwr −∑
DCHpwr − Poh (3.2)
BStargetpwr is a threshold given to the HSDPA power only. It has been se-lected 10% below the maximum base station power. The aim of this thresholdis to limit the interference caused by the HSDPA channel [7].
The scaling down of the base station power does not take into account theHSDPA power. This leads to the HSDPA channel being allocated no power,but the HSDPA power is controlled each third slot.
Since the total base station power is the sum of all DCH power, Overheadpower and HSDPA power; the HSDPA power is controlled at every third slot,there might be a case when the total base station power exceeds the predefinedlimit.
3.1.7 Interference Model
The SIR received on each user has been calculated by the following formula:
γij =pij · gij
N +∑
m6=j gim(∑
n pnm + POHm + PHSm) + reb · gij((∑
k 6=i pkj) + POHj + PHSj)
(3.3)where

18 Chapter 3. System Model
• γij = SIR received on user i from base station j
• pij = Transmitted power to user i from base station j
• gij = Path gain between user i and base station j
• gim = Path gain between user i and all other base stations except j
• pkj = Transmitted power to all other users except i from base station j
• pnm = Transmitted power to all users from all base stations except j
• reb = Rebate factor for interference in own base station(models the or-thogonality factor- value taken as 0.5)
• POHj = Overhead power of base station j
• PHSj = HSDPA power of base station j
• N = Additive White Gaussian Noise
3.1.8 Receiver Model
Only downlink case has been studied.
A detailed model of the receiver would be needed in order to get an accuratemapping between the link behavior at a micro-level (what happens at data bitand coding block level) and a system-level behavior (when only slot average SIRvalues are available). This kind of model has not been available for the study.Therefore, a heuristic approach has been taken for defining the model.
The SIR received on each user has been measured in each slot. In RUNE, amatrix (size equal to no. of users by no. of base stations) is available , whichshows the SIR received on each user from different base stations to which the useris connected. The matrix carries zeros in places where there is no connectivitybetween a particular user with a particular base station. As users can be undermore than one base station during soft handover, the SIR received on each userfrom all base stations (21 nos.) have been added together (Maximum ratiocombining). Then the average SIR on each user for a frame ( 1 frame = 15slots) has been calculated by taking linear averaging of SIRs received for 15slots.
SIRsloti=
21∑
j=1
SIRj (3.4)
SIRframek=
15∑
i=1
(SIRsloti)/15 (3.5)
where
• SIRsloti= SIR received on each user in slot i.

3.2. System Quality Measure 19
• SIRframek= Average SIR on each user over a frame k.
According to this receiver model, a frame is correctly received if the aver-age SIRframe is larger than a threshold. Otherwise the frame is erroneous.Therefore the frame error flag is modelled as:
Frame Error = SIRframek≤ −23.5 dB (3.6)
Details for how this model parameter has been selected and some charac-teristics of this model are given in appendix A.
3.2 System Quality Measure
For the purpose of characterising the system behaviour and characteristics,a number of quality measures are defined next.
– Dissatisfaction Rate has been chosen as the parameter to measurethe System performance.
– Dedicated Channel Capacity of a cell has been defined as the numberof users at which Dissatisfaction Rate exceeds 4%.
The process of defining Dissatisfaction Rate has been described below:
Frame Error has been obtained from the receiver model. Frame ErrorRate per session has been defined as the sum of all frame errors dividedby the number of frames under observation.
Frame Error RateSession =
∑Frame Error
No of frames under observation(3.7)
The service that has been assumed for the DCH channels is a typicalspeech (conversational) type of service. Therefore, if the number of lostframes is too large then the speech quality is degraded. Though there aresome models for assessing the instantaneous speech quality, but the issueof assessing the quality of an entire session is typically difficult. Thereforeit is assumed that the speech quality is severely affected if the averageframe error rate is lager than 3%.
Accordingly, User Dissatisfaction Flag has been set to 1, if the FrameError Rate per session is greater than 3%.
User Dissatisfaction Flag = Frame Error RateSession ≥ 0.03 (3.8)
System Dissatisfaction Rate has been defined as the percentage of UserDissatisfaction Flag with respect to number of users.
System Dissatisfaction Rate = 100 ∗
∑User Dissatisfaction Flag
No of users(3.9)

20 Chapter 3. System Model
In addition to the overall System Dissatisfaction Rate, cell-wise dissatis-faction rate has also been defined by the percentage of users with poorsession quality (User dissatisfaction flag set to 1) in each cell. In this case,Frame Error Rate per session has been determined in the same manner asabove and then which users are connected to which cell has been foundout. Out of those users connected in a cell, only those users with poorsession quality (i.e. in which case User Dissatisfaction Flag is set to 1)have been considered in order to calculate the cellwise dissatisfaction rate.Next, dissatisfaction rate of only those cells which have no HSDPA imple-mentation, but are adjacent to the cells with HSDPA implementation, hasbeen determined in all three system models i.e. Reference system, HSDPAsystem with 100% activity and HSDPA system with 50% activity.
User Dissatisfaction Flagcellj = Frame Error RateSessioncellj ≥ 0.03(3.10)
Cell Dissatisfaction Ratecellj = 100 ∗
∑User Dissatisfaction Flagcellj
No of users connected to cellj(3.11)
Adjacentcell Dissatisfaction Rate =21∑
j=8
Cell Dissatisfaction Ratecellj/14
(3.12)

Chapter 4
Results
With the system model described in previous chapter, System Dissatis-faction Rate for three types of systems i.e. Reference System, HSDPASystem with 100% activity and HSDPA System with 50% activity havebeen determined for comparison. All these results have been averagedover 10 independent realizations. 95% confidence interval of these resultshas been determined, which is around 2%.
In addition to the above result, the Dissatisfaction Rate in those cells (cells8 to 21, refer Figure 3.1), which are not implemented with HSDPA, butare adjacent to HSDPA enabled cells, has been determined for above threesystem types in order to find out the impact of HSDPA implementation inthe neighbouring cells which is the objective of this master thesis. The re-sult of the adjacent cell dissatisfaction rate has been shown in the followingsection.
4.1 Adjacent Cell Dissatisfaction
With -23.5 db as the reference SIR [Appendix A], dissatisfaction rate inadjacent cells has been determined by varying the average load/cell from20 to 26 for the above three different systems using ideal power controli.e. TPCdelay = 0 and plotted in Figure 4.1. Next the above procedurehas been repeated for delayed power control technique i.e. TPCdelay = 2and shown in Figure 4.2 to see the impact of power control on the result.
It has been observed that with delayed power control, dissatisfaction ratehas been increased compared to the system with ideal power control.
It is observed from both the figures that the adjacent cell dissatisfactionrate has been increased after the introduction of HSDPA, but the increaseis insignificant. This implies that HSDPA implementation in neighbouringcell has not created more interference to the adjacent cells which are not
21

22 Chapter 4. Results
20 21 22 23 24 25 262
3
4
5
6
7
8
9
10
11
Avg no of users / cell
Dis
sa
tisfa
ctio
n R
ate
Adjacent Cell Dissatisfaction Rate (TPC delay=0)
Ref SysHSDPA(50%)HSDPA(100%)
Figure 4.1: Adjacent Cell Dissatisfaction (TPCdelay = 0)

4.1. Adjacent Cell Dissatisfaction 23
20 21 22 23 24 25 262
3
4
5
6
7
8
9
10
11
Avg no of users / cell
Dis
sa
tisfa
ctio
n R
ate
Adjacent Cell Dissatisfaction Rate (TPC delay=2)
Ref SysHSDPA(50%)HSDPA(100%)
Figure 4.2: Adjacent Cell Dissatisfaction (TPCdelay = 2)

24 Chapter 4. Results
HSDPA enabled. It is also seen that with 100% HSDPA active cells, dis-satisfaction rate is larger than that in 50% HSDPA active cells. In termsof Dedicated channel capacity, the capacity has decreased insignificantlyafter HSDPA implementation. The decrease is more in 100% HSDPA ac-tive cells than that in 50% HSDPA active cell.
In order to verify the authenticity of the result, base station power dis-tribution for the reference system has been plotted for different loads (foraverage no of users / cell =20 and 26) in both the power control methodsi.e. with ideal power control and delayed power control and shown in Fig-ure 4.3.
It is observed that at load 26, 50% cases have reached maximum BS powerin Reference system, that means all available power has been consumedby the dedicated channels, so when HSDPA is implemented, there is nopower left for the HSDPA channels, as a result, HSDPA implementationhas insignificant impact on the Dedicated channel capacity of neighbour-ing cell. Secondly it is seen that the increase of average BS power dueto delayed power control is nominal, which might be another reason forinsignificant impact of HSDPA implementation. Due to non ideal powercontrol, the variance of the base station power distribution is expected tobe flatter compared to BS power distribution in ideal power control, butthe Figure 4.3 shows the minor difference between ideal power control anddelayed power control, which signify that delayed power control does nothave larger variance. This has been explained by the fact that as the uservelocity has been taken as 3km/hr, which is very slow, the fading effecthas not been observed, as a result, the base station power distributionunder ideal power control and under delayed power control has not showna significant difference.
4.2 HSDPA Admission Threshold
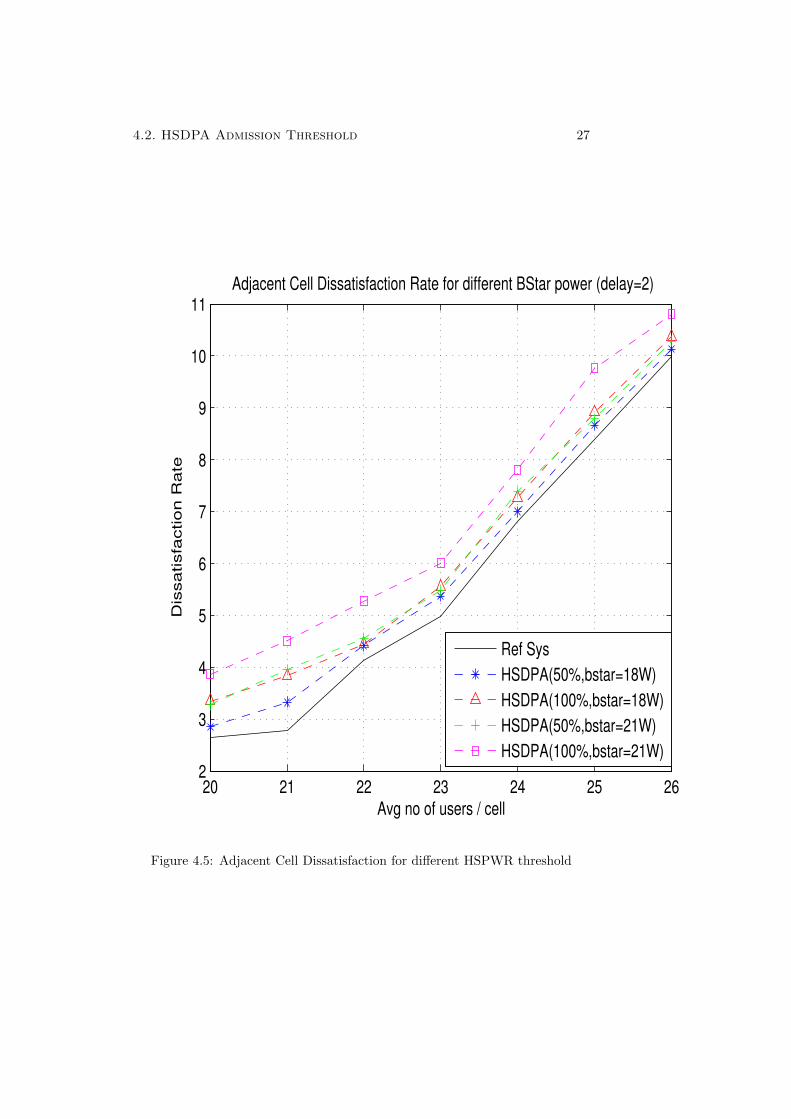
It has been observed that the interference effects due to HSDPA imple-mentation are not significant. This might be due to the fact that thethreshold for HSDPA is too low. Major part of the BS power is consumedby the Dedicated channel as it has more priority, HSDPA channels get lesspower to use. Again due to low threshold, HSDPA share of power becomeseven less. In order to investigate the result further, observations have beentaken for the effects on the dissatisfaction rate when BS target power hasbeen raised to maximum available BS power. System dissatisfaction aswell as average dissatisfaction in adjacent cells have been measured set-ting equal values (21W) to both maximum base station power and targetbase station power. Results in Figure 4.4 & Figure 4.5 are shown underdealyed power control with different values of BStarget power for compar-ison.
It is noted that the impact is more clear in this scenario. From Figure 4.5, it is seen that if 22 is the DCH capacity (as defined in chapter 3) of

4.2. HSDPA Admission Threshold 25
0 5 10 15 20 250
0.1
0.2
0.3
0.4
0.5
0.6
0.7
0.8
0.9
1
delay
=0
dela
y=2
delay=
0
delay
=2
load=20 →
load=26 →
BS Power Distribution for Reference System
Power (W)
Figure 4.3: BSPower Distribution for Reference System at different loads

26 Chapter 4. Results
20 21 22 23 24 25 262
3
4
5
6
7
8
9
10
11
Avg no of users / cell
Dis
satis
fact
ion
Ra
te
System Dissatisfaction Rate for different BStarget power(delay=2)
Ref SysHSDPA(50%, bstar=18W)HSDPA(100%,bstar=18W)HSDPA(50%,bstar=21W)HSDPA(100%,bstar=21W)
Figure 4.4: System Dissatisfaction for different HSPWR threshold
4.2. HSDPA Admission Threshold 27
20 21 22 23 24 25 262
3
4
5
6
7
8
9
10
11
Avg no of users / cell
Dis
sa
tisfa
ctio
n R
ate
Adjacent Cell Dissatisfaction Rate for different BStar power (delay=2)
Ref SysHSDPA(50%,bstar=18W)HSDPA(100%,bstar=18W)HSDPA(50%,bstar=21W)HSDPA(100%,bstar=21W)
Figure 4.5: Adjacent Cell Dissatisfaction for different HSPWR threshold
28 Chapter 4. Results
the adjacent cell without HSDPA in case of reference system, after imple-mentation of HSDPA (100%), this DCH capacity goes down to 20. Theimpact on the overall system dissatisfaction is not that evident even in thisscenario. This might be due to the fact that there are some cells whichare not adjacent to HSDPA enabled cell, so the impact on those cells arenegligible, which has been averaged over the entire system.
4.3 Comparison of DCH Capacity
With reference to the definition of DCH capacity ( Number of users percell at which dissatisfaction rate becomes larger than 4%) as defined inchapter 3, DCH capacity of the cell having no HSDPA, but adjacent toHSDPA enabled cell, has been determined in different system configura-tions as given in the following table:
System-1 Reference system with delay=0System-2 HSDPA system (50%) with delay=0System-3 HSDPA system (100%) with delay=0System-4 Reference system with delay=2System-5 HSDPA system (50%) with delay=2System-6 HSDPA system (100%) with delay=2System-7 HSDPA system (50%) with delay=2 & BStarpwr=21WSystem-8 HSDPA system (100%) with delay=2 & BStarpwr=21W
Then relative capacity of each system has been calculated by dividing theDCH capacity of each system by the DCH capacity of the Reference sys-tem with ideal power control. The relative capacities have been plotted inFigure 4.6 to give a clear picture of the impacts of HSDPA implementationon adjacent cells.
It is observed that the maximum decrease of DCH capacity is 14% as seenfrom the bar 8 in Figure 4.6. It has been noted that the impact due todelayed power control is not significant, but the impact of interference,due to larger HSDPA power when threshold has been increased, is visible.

4.3. Comparison of DCH Capacity 29
delay=0 delay=2 Bstarpwr=21W 0
0.1
0.2
0.3
0.4
0.5
0.6
0.7
0.8
0.9
1
Re
lative
Ca
pa
city
Comparison of DCH Capacity for different System Models
Figure 4.6: Comparison of DCH Capacity of adjacent cells without HSDPA


Chapter 5
Conclusion
5.1 Conclusion
– It is seen that after the introduction of HSDPA in some cells, thereis minor impact on the overall system performance. The dedicatedchannel capacity of the total system and of the adjacent cell has beenreduced, but the reduction is so insignificant that it can be neglectedfrom statistical point of view. Hence, this is a very encouraging resultfor the telecommunication industries.
– It has been observed that the impact is larger with 100% activity thanthat with 50% activity. That means the dedicated channel capacityof a 100% HSDPA active cell is lower than the dedicated channelcapacity of a 50% HSDPA active cell.
– From the above observation, it is concluded that the interferenceaffects the capacity, but variation of interference doesnt affect.
– In addition to the above, it is found that the impact is visible whenthere is larger threshold for HSDPA power.
5.2 Future Work
The receiver model used in this study is a heuristic model, which might nothave shown correct result. This has been felt so due to the uncorrelationobserved between Figure A.1 and Figure A.3. In Figure A.1, it is noticedthat when the load increases from 25 to 30, the probability of base sta-tion power reaching maximum value increases from 20% to 80%, but theDissatisfaction rate in Figure A.3 increases from 5% to 20%. Apart fromthis, outer loop power control has not been implemented, which can givemore accurate result as the SIR target is selected dynamically. Therefore,it is suggested to study this aspect further by taking care of the limita-tions of this study i.e. by using a receiver model, in which there is bettercorrelation between link level behaviour and system level result and also,by implementing outer loop power control.
31


References
[1] M.Frodigh, S.Parkvall, C.Roobol, P.Johansson and P.Larsson,Future-Generation Wireless Networks, IEEE Personal Communca-tions, Volume.8, Issue:5, Oct 2001.
[2] S.Parkvall, E.Dahlman, P.Frenger, P.Beming and M.Persson, Theevolution of WCDMA towards higher speed downlink packet data ac-cess, Vehicular Technology Conference, 2001. VTC 2001 Spring. IEEEVTS 53rd, Volume:3, 2001.
[3] The white paper, WCDMA Evolved, Thefirst step - HSDPA, May 2004, Ericsson,http://www.ericsson.com/products/white papers pdf/wcdma evolved.pdf
[4] 3GPP TS 25.308 V5.2.0, HSDPA, Overall description, (release 5).
[5] J.Peisa, E.Englund, TCP Performance over HS-DSCH, Proceedingsof the Vehicular Technology Conference 2002 Spring.
[6] E.Englund, K.W.Helmersson, Magnus Persson, M. Samuelsson, Ste-fan Parkval, Impacts of Higher Order Modulation on HS-DSCH Sys-tem Performance, Proceedings of the Vehicular Technology Confer-ence 2003.
[7] A.Furuskr, S.Parkvall, M.Persson and M.Samuelsson,Performance ofWCDMA High Speed Packet Data, Vehicular Technology Confer-ence, 2002. VTC Spring 2002. IEEE 55th,Volume:3, 6-9 May 2002,Pages:1116 - 1120, vol.3
[8] C.S.Chiu and C.C.Lin, Comparative Downlink Shared Channel Per-formance Evaluation of WCDMA Release 99 and HSDPA, Interna-tional Conference on Networking, Sensing & Control, IEEE Proceed-ings 2004.
[9] Harri Holma and Antti Toskala, WCDMA for UMTS, Radio Accessfor Third Generation Mobile Communications, Second Edition, JohnWiley and Sons.
[10] 3GPP TS 25.214 V6.2.0, Physical layer procedures (FDD), (Release6).
[11] 3GPP TR 25.858 V5.0.0,High Speed Downlink Packet Access: Physi-cal Layer Aspects(Release 5).
[12] 3GPP TS 25.211 V6.1.0,Physical Channels and mapping of transportchannels on to physical channels (FDD) (Release 6)
33

34 References
[13] Jens Zander and Seong-Lyun Kim, Radio Resource Management forWireless Networks, 2001 Artech House, Inc., Appendix B & C.
[14] Hata M., Empirical Formula for Propagation Loss in Land MobileRadio Services, IEEE Trans. Veh. Tech. Vol. VT-29, Aug. 1980.
[15] Ericsson reveals HSDPA market introduction, Ericsson PressReleases, Feb. 2005 http://www.ericsson.com/press/20050215-130150.html
[16] Lars Ahlin and Jens Zander Principles of Wireless Communications,Second Edition, section 5.1, pp-229.

Appendix A
Receiver Model Details
A detailed model of the receiver is needed in order to get an accurate map-ping between the link behavior at a micro-level (what happens at data bitand coding block level) and a system-level behavior (when only slot aver-age SIR values are available). This kind of model has not been availablefor the study. Therefore, a heuristic approach has been taken for definingthe model. The receiver model has been described in chapter 3. Thisappendix describes how the Reference SIR (which has been considered asa good SIR for correct reception of data) value has been selected.
First, in order to figure out a good range of the load for the required per-formance of the system, average BS power has been measured for averageusers per cell varying from 10 to 32 in the reference system. From theBS power distribution, probability of BS power reaching the maximumBS power has been calculated for different loads. From the values in Fig-ure A.1, it has been observed that the probability of BS power reachingmaximum level is around 10% at the loads between 20 to 25. At theseloads, the average base station power as shown in Figure A.2 varies from12W to 16W. So, this gives an idea about the required load of the systemfor measuring the system performance.
Next, system dissatisfaction rate has been determined for average usersper cell varying from 10 to 32 in the Reference system taking differentrequired SIR values from -20 db to -25 db and have been plotted to findout the Reference SIR required for the study.
From the plot showing the system dissatisfaction rate versus average users/cellfor different required SIR values Figure A.3, it is noticed that between theloads 20 & 25, if the accepted system dissatisfaction rate is taken as 4% (as4% has been defined as the accepted dissatisfaction rate while defining theDCH capacity in chapter 3), then -23.5 db can be taken as the good ref-erence SIR for the remaining part of the measurement.
35
36 Appendix A. Receiver Model Details
10 15 20 25 30 350
0.1
0.2
0.3
0.4
0.5
0.6
0.7
0.8
0.9
1
Avg no of users / cell
Pro
b(B
sp
wr=
Ma
x B
sp
wr)
Probability (BSpwr reaching Max BSpwr) − Ref Sys
TPCdelay=0TPCdelay=2
Figure A.1: Probability of BSpwr reaching maximum BSpwr-Ref Sys

37
10 15 20 25 30 356
8
10
12
14
16
18
20
22
Avg no of users / cell
Po
we
r in
W
Average Base station Power − Ref Sys
TPCdelay=0TPCdelay=2
Figure A.2: Average Base Station Power-Ref Sys

38 Appendix A. Receiver Model Details
10 15 20 25 30 3510−1
100
101
102
Avg no of users / cell
Syste
m D
issa
tisfa
ctio
n R
ate
(%)
Determination of Reference SIR − Ref Sys
−22 db−22.5 db−23 db−23.5 db−24 db−24.5 db−25 db
Figure A.3: Determination of Reference SIR- Ref Sys

Appendix B
UTRAN Overview
B.1 General
UTRAN (Universal Terrestrial Radio Access Network) is that part of theUMTS Figure B.1 which consists of RNCs and Node Bs between Iu andUu. A number of RNCs (Radio Network Controller) are connected tothe core network. Each RNC can handle several Node Bs (Base stations),which in turn get connected to UEs (User Equipment). RNC is the logicalnode responsible for total radio resource management, where as Node B isresponsible for radio transmission / reception in one or more cells to /fromUEs. RNCs are either CRNC (Controlling RNC) or SRNC (Serving RNC)as per the functions they perform. CRNC owns the radio resources of acell, but the SRNC handles the connection to one UE, and may borrowradio resources of a certain cell from the CRNC [2], [4].
Data transfer takes place through various channels [12] in the form oftransport blocks. Physical channels [12] are defined by a specific carrierfrequency, scrambling code, channelization code and a time duration mea-sured in number of chips.
Radio frame A radio frame is a processing duration which consists of15 slots. The length of a radio frame corresponds to 38400 chipsequivalent to 10 ms.
Slot A slot is a duration of 2560 chips which consists of fields containingbits. It corresponds to one power control period.
The transmission time interval set is (10/20/40/80 ms), which is one radioframe. The modulation used here is QPSK.
Transport channels are mapped to Physical Channels e.g Dedicated Chan-nel (DCH) is mapped to Dedicated Physical Data Channel (DPDCH) andDedicated Physical Control Channel (DPCCH)[12].
One carrier is distinguished from others by a combination of channeliza-tion code (which are taken from Orthogonal Variable Spreading Factor
39

40 Appendix B. UTRAN Overview
Figure B.1: UMTS architecture
Pilot N pilot bits
TPC N TPC bits
Data
Slot #0 Slot #1 Slot #i Slot #14
T slot = 2560 chips, 10 bits
1 radio frame: T f = 10 ms
DPDCH
DPCCH FBI
N FBI bits TFCI
N TFCI bits
T slot = 2560 chips,
Figure B.2: Radio frame for Uplink dedicated physical channel

B.2. Power Control 41
One radio frame, Tf = 10 ms
TPC NTPC bits
Slot #0 Slot #1 Slot #i Slot #14
Tslot = 2560 chips, 10*2k bits (k=0..7)
Data2Ndata2 bits
DPDCH
TFCI NTFCI bits
Pilot Npilot bits
Data1Ndata1 bits
DPDCH DPCCH DPCCH
Figure B.3: Radio frame for Downlink Dedicated Physical Channel
Code tree) and a scrambling code. The channelization code specifies auser and scrambling code specifies a cell. In WCDMA, power is used asa common source, which makes mixed services with variable data ratepossible. Different power is allocated to users by Radio Resource manage-ment, so that maximum interference level is not exceeded. One physicalresource carrying one channelization code and one scrambling code canprovide multiple services with variable bit rate by only varying power. Asthe demand for the data rate changes, the power allocated to this physicalresource is adjusted in such a way that quality of service is guaranteed atany instant of the connection.
B.2 Power Control
Power control mechanism is the heart of WCDMA system in order to solvenear-far problem. Without this control, WCDMA system will not functiondesirably as a single frequency (re-use factor 1) carrier is used throughoutthe cell, so a mobile near to the base station can overshout another mo-bile, which is far away from the base station i.e. nearby mobile can blocka large part of the cell leading to near-far problem. The objective of thepower control is to maximize the capacity by keeping the interference levelat minimum in the air interface and to provide required quality of service.Minimum interference is achieved by ensuring equal received power perbit of all mobile stations at all times.
Some transport channels support power control, some do not. In caseswhere there is no power control, the power settings are done by the up-per layers. Following Table lists which transport channels support powercontrol and which channels do not.

42 Appendix B. UTRAN Overview
Transport Channel Support Power ControlDedicated Channel YesBroadcast Channel NoForward Access Channel NoPaging Channel NoRandom Access Channel NoCommon Packet Channel YesDownlink Shared Channel Yes
B.2.1 Inner loop Power control
This is done in both the cases i.e. in the uplink as well as in the downlink.The inner loop power control function is located in Node B.In the uplink, base station frequently measures the received Signal to In-terference Ratio (SIR) on the dedicated channel and compares it with atarget SIR. If the received measured SIR is greater than the target SIR,the base station commands the mobile station per slot to lower the power;if received SIR is less than target SIR, then base station commands theMS to increase the power. This measure-command-react cycle is executedat a rate of 1500 times per second for each mobile station. The basic stepsize is 1 dB or 2 dB.
The downlink inner loop power control function controls the level of thedownlink-transmitted power depending on the location of the UE. If thebase station sends too less power, so that the SIR at the UE is less than thetarget value, then the UE sends power control commands in the uplinkcontrol channel to the Node B in order to increase transmission power.SRNC sends regularly the required power range to Node B on the basisof the measurement results from the UE.
B.2.2 Outer loop Power Control
Outer loop power control located in the SRNC, sets the SIR target requiredfor inner loop power control, so that the required quality can be provided,at the same time the air interface resources can be optimized. The targetSIR, in stead of being fixed, floats around the minimum value, that justfulfils the target quality and get adjusted in the base station dependingon the need of the individual link for a constant quality e.g. target BER(Bit Error Rate) or BLER (Block Error Rate).


![00-WCDMA HSDPA Principles[1]](https://static.fdocuments.in/doc/165x107/577d2da21a28ab4e1eadf7a8/00-wcdma-hsdpa-principles1.jpg)