Decomposition of Gender Income Gap in Rural Informal Micro- … · 2017-11-10 · Decomposition of...
32
Decomposition of Gender Income Gap in Rural Informal Micro- enterprises: An Unconditional Quantile Approach in the Handloom Industry Bhabesh Hazarika National Institute of Public Finance and Policy, New Delhi Paper prepared for the IARIW-ICIER Conference New Delhi, India, November 23-25, 2017 Session 2A: Inequality II Time: Thursday, November 23, 2017 [Afternoon]
Transcript of Decomposition of Gender Income Gap in Rural Informal Micro- … · 2017-11-10 · Decomposition of...
Decomposition of Gender Income Gap in Rural Informal Micro-
enterprises: An Unconditional Quantile Approach in the Handloom
Industry
Bhabesh Hazarika
National Institute of Public Finance and Policy, New Delhi
Paper prepared for the IARIW-ICIER Conference
New Delhi, India, November 23-25, 2017
Session 2A: Inequality II
Time: Thursday, November 23, 2017 [Afternoon]
IARIW-ICRIER Conference on “Experiences and Challenges in Measuring
Income, Inequality, and Poverty in South Asia,”
New Delhi, India, November 23-25, 2017
Decomposition of Gender Income Gap in Rural Informal Micro-enterprises: An Unconditional
Quantile Approach in the Handloom Industry
BHABESH HAZARIKA*
National Institute of Public Finance and Policy, New Delhi
Abstract
There exists a noteworthy gender income gap in the micro-entrepreneurial activities and typically the
females earn lower than the males. While such gender income gap in wage employment is well-
documented, well-documented, the aspect needs attention in the context of the micro-entrepreneurship,
particularly in the informal sector. It is important to analyze how differently the gender difference in
endowments affect the income of the male and the female micro-entrepreneurs. The present study, based
on primary data, analyses gender income gap and its compositions throughout the income distribution of
the handloom micro-entrepreneurs in Assam. On an average, the female micro-entrepreneurs earn 51
percent lesser than their male counterpart. The unconditional quantile decomposition reveals that the
gender income gap increases along the income distribution. The differences in the productive
characteristics (endowment effects) explain much of the income gap at the median level and beyond than
the heterogeneous returns to such characteristics (discriminatory effects). The endowment effects related
to education, financial literacy, risk attitude, SHGs membership, and technology adoption are found in
favor of the male micro-entrepreneurs. The results suggest that poor management of entrepreneurial
activities of the female results in wider gender gap throughout the income distribution. The study urges
for policy prescriptions towards dissemination of technological, financial, and managerial know-how to
make the females more organized towards addressing the gender income gap.
Keywords: micro-entrepreneurs; handloom; gender; income gap; unconditional quantile regression.
JEL Classification: L26 L67 D13 D33 D63
---------------------------
*Author’s affiliation: National Institute of Public Finance and Policy (NIPFP), New Delhi 110067. E-
1
Decomposition of Gender Income Gap in Rural Informal Micro-enterprises: An Unconditional
Quantile Approach in the Handloom Industry
I. Introduction
There is a growing concern on the issue of gender differentials in returns to micro-entrepreneurship in
recent years (Verrest, 2013). Literature suggests that the income of the female micro-entrepreneurs may
be comparable to their male counterpart controlling for nature and types of activities. However, there still
exists a noteworthy gender income gap, and typically the female micro-entrepreneurs earn lower than
their male counterpart (Hundley, 2001; Leung, 2006; Alvarez et al., 2009; Fairlie and Robb,
2009; Lechmann and Schnabel, 2012). While the gender wage gap in the labor market is well-
documented, little is known about the gender income gap in entrepreneurship and its compositions
especially in the context of informal micro-enterprises (Lechmann and Schnabel, 2012).
The micro, small, and medium enterprises (MSMEs) in the informal sector play a crucial role in the
Indian economy in reducing the regional disparities (MoMSME, 2017). The MSMEs tend to ensure more
equitable income distribution by generating employment and income opportunities for the people at the
lower end of income distribution. Similarly, efforts in terms of institutional training, technology
promotion, and credit access have been made to uplift the entrepreneurial involvement of the females and
their performances in the activities such as handloom, leathers, and food-processing. As a result, a sharp
increase in the female-owned micro-entrepreneurship has been witnessed from 0.9 million in 2000-01 to
1.8 million in 2006-07 in the informal sector. Among them, 70.8 percent were operated in the rural areas
with an employment size of 2.2 million in 2006-07 (MoMSMEs, 2017). Given the competitive market
environment, a particular point of interest in this context is to what extent the female micro-entrepreneurs
have performed as compared to their male counterpart. There is a need to analyze how differently the
constraints such as the size of operation, low technology access, informality, credit, etc., affect the
performance of the rural micro-entrepreneurs across gender.
The gender income gap and its policy related issues are often discussed in the context of wage
employment (Chzhen and Mumford, 2011; Ahmed et al., 2015; Becolod, 2016). The gender differences in
the productive characteristics (endowments) and market discrimination against the females are the two
reasons for such gender wage gap. In a transitional economy, while the returns to productive
characteristics tend to increase, there often remains a gender gap in the returns if the males and the
females differ with respect to such characteristics (Magnani and Zhu, 2012; Chi and Li, 2014). In wage
employment, the presence of employer discrimination also appears as another element of the gender wage
gap (Deshpande and Sharma, 2016). Even after correction of these differences, there may be a gender
income gap due to market discrimination against the females if employers have more autonomy in
2
payment decisions (Magnani and Zhu, 2012; Chi and Li, 2014). Therefore, if the employers’
discrimination is significant, then the micro-entrepreneurial/self-employment activities must be able to
reduce the gender gap. Contrary to this expectation, there is evidence for a larger gender income gap in
the micro-entrepreneurship/self-employment as compared to wage employment (Leung, 2006; Alvarez et
al., 2009; Lechmann and Schnabel, 2012). Such differential returns to micro-entrepreneurship become
more puzzling especially when the market discriminations against the females do not play a key role in
informal micro-entrepreneurship (Lechmann and Schnabel, 2012; Åstebro and Chen, 2014).
There exist a few studies which estimated and decomposed the gender income gap in the context of
micro-enterprises/self-employment (Hundley, 2001; Leung, 2006; Fairlie and Robb, 2009; Lechmann and
Schnabel, 2012). The differences in endowments such as human capital, industrial closure, and firm size
appears crucial in explaining the gender income gap in self-employment (Hundley, 2001; Lechmann and
Schnabel, 2012). Also, the different entrepreneurial motivations may also cause such gender income gap.
While the males are more motivated by monetary benefits, the females are more concerned about non-
monetary benefits (Koellinger et al., 2013; Åstebro and Chen, 2014; Hazarika & Goswami, 2016).
However, the non-monetary benefits such as work-flexibility and career aspirations have no proper
explanations towards the gender income gap in entrepreneurial activities (Lechmann and Schnabel, 2012).
Though females often face consumer and credit market imperfections, there are no conclusive evidences
on the effect of such market imperfections on the gender income gap particularly in the informal sector
(Orser et al., 2006). Thus, there is opaqueness in addressing what explains the lower income for females
and what remains unexplained even if the gender differences in productive characteristics are controlled
in the context of informal micro-enterprises. Understanding of gender income gap assumes added
importance as a higher income level of the females addresses not only greater gender inequality issue but
also makes significant contributions to the household welfare (Hazarika and Goswami, 2016).
While the gender income gap in wage employment in the Indian labor market has been well-
documented (Kijima, 2006; Azam and Sharif, 2011; Khanna, 2012), the literature on the issue in the
informal micro-entrepreneurship is infrequent. A few studies show concerns over gender gap in
entrepreneurship entry but not in income in the context of registered/formal sector and thus leaving the
informal micro-entrepreneurship to infringe (Jodhka, 2010; Iyer et al., 2013; Deshpande and Sharma,
2016). The recent works of Deshpande and Sharma (2016) analyzed the income gap issue across different
ethnic groups in India. In order to ensure the welfare effects of informal micro-entrepreneurship, it is
important to understand not only the causes of the gender income gap but also the pattern of the gap
across the entire income distribution (Matano and Naticchioni, 2016). Similarly, decomposition of the
3
income gap enables to understand the relative contributions of the characteristics in explaining why the
female micro-entrepreneurs earn lesser than their male counterpart.
Considering the above perspectives, the present study attempts to explore and decompose the gender
income gap in nonfarm informal micro-enterprises. For operational purposes, the study considers an
under-researched context of handloom micro-enterprises in Assam, a state that is geographically and
economically peripheral but strategically significant in North East India. Considering a single industry
and a single occupation, the study wipes out the effects of industrial and occupational segregation. The
industry is unorganized, informal, and rural-based (Bhagavatula et al., 2010; Bortamuly and Goswami,
2012; Bortamuly et al., 2014; Hazarika et al., 2016; Hazarika and Gowami, 2016). A substantial
proportion of the females is found to own handloom micro-enterprises (Bortamuly et al., 2013, 2014;
Hazarika and Goswami, 2014). Thus, it provides a suitable setting for analyzing the gender income gap
within a rural and informal sector.
The study emphasizes on analyzing the effect of gender difference in productive characteristics such
as human capital, social capital, and firm characteristics (endowments effects), and differential returns to
these characteristics (differential returns effects) on income throughout the distribution. The novelty of
the paper lies in (1) analysis of the gender income gap in informal micro-enterprises into endowment and
differential returns effects in an under-researched context of the handloom industry; (2) Analysis of
gender income gap throughout the income distribution; and (3) integration of the social capital aspects in
income gap analysis.
II. BACKGROUND OF THE HANDLOOM INDUSTRY IN ASSAM
India is the second largest textile producer in the world only after China. The share of the sector is about
10.0 percent of India’s industrial production and 13.0 percent of the country’s export earnings. The
handloom industry contributed 11.0 percent of the total textile with an annual growth rate of 5.0 percent
in 2015-16 (Ministry of Textile, 2017). However, the industry has experienced a significant fall in terms
of the employment as well as the number of looms over the years. The number of handloom weaver has
declined from 6.7 million in 1987-88 to 6.6 million in 1995-95, and further to 4.3 million in 2009-10
(NCAER, 2004, 2010). Such decline in the employment in the industry can be attributed to the market
risks accrued from the powerloom and mill sector. Despite such decline in the total employment, the
growth prospect of the industry is carried forward by the increase in the full-time workers during the last
few decades. The proportion of the full-time worker has increased from 25.2 percent in 1995-96 to 42.6
percent in 2009-10 (NCAER 2004, 2010). The scenario is more so in Assam. From a gender perspective,
while involvement of males on a full-time basis has declined, there is a drastic increase in employment
among females on full-time basis. The number of females on full-time has increased by nearly 20 times
4
(688,457) in 2009-10 compared to 1995-96 (NCAER, 2004, 2010). However, entrepreneurial orientation
in the handloom industry in the state is still unorganized, informal, and at an early stage. The Third
Handloom Census of India reveals that only 26.0 percent of the total handloom households in the state
have been involved in fully commercialized handloom activities against the national figure of 53.1
percent (NCAER, 2010). Though the females mostly engaged as the unskilled workers in the industry,
over the years, they are the stabilization forces in the hour of crises and problems in the industry
(Bortamuly et al., 2014). However, the female handloom workers do face some generic as well as gender-
specific obstacles towards achieving business success.
The industry provides a suitable setting to study the issues such as the existence of gender income gap
and the contributors towards such gap in the context of informal micro-entrepreneurship. Using female as
a dummy in the income function for the industry, Bortamuly and Goswami (2012) found that the males
earned more than their female counterpart. However, the study considered only the handloom workers.
Moreover, it neither estimated nor decomposed the gender income gap.
Given the intensified market competition, the micro-entrepreneurs initiate different measures to
produce competitive, cost-effective, and quality products. However, differences in the measures along
with existing firm endowments may result in differential returns. For example, the female micro-
entrepreneurs in the rural areas are more vulnerable due to limited access to credit, lack of financial
know-how, and lower extent of modern technology usage (Hazarika et al., 2016). In other words, lack of
organized work practices may leave the females with lower returns to the handloom activities. Apart from
these, several other issues such as market access and entrepreneurial orientation may affect males and
females differently resulting in different returns across gender. Thus, there is a need to study whether
there exists gender income gap in the handloom micro-enterprises, and if it exists, then what is the
pattern. It is also important to assess how the gender differences in different characteristics affect the
gender income gap among the micro-entrepreneurs throughout the income distribution towards for policy
prescriptions in addressing the existing income gap.
III. Methodology
A. Sampling strategy and the sample
The study is based on primary data collected from the handloom micro-entrepreneurs in six districts of
Assam namely Baksa, Dhemaji, Kamrup, Kokrajhar, Lakhimpur, and Udalguri during January 2013 to
June 2013. The study used a multi-stage sampling technique. Firstly, based on the proportion of the
commercial handloom households to the total handloom households, all the 27 districts in the state were
5
distributed into three strata1. The first stratum included the districts with a higher proportion than the
state’s figure of 10.5 percent. The districts with a proportion close to the state’s figure were included in
the second stratum, and the districts with a lower proportion than the state’s figure were included in the
last stratum. Secondly, two districts from each stratum, two blocks from each district, and a minimum of
two villages from each block were purposively selected based on the commercial concentration of
handloom activities. Lastly, a list of handloom micro-entrepreneurs was prepared for each selected village
before collection of the primary data and from the list so prepared, the respondents were randomly
selected.
In the present study, a handloom micro-entrepreneur was defined as an individual who owns a micro-
enterprise with a maximum of 10 wage employees or 10 operating looms in the survey year2. Those new
enterprises which were yet to complete one year of operation were not included in the sample. A
minimum of 10 percent of the total handloom micro-entrepreneurs in each village was selected resulting
in a sample of 328 respondents. The respondents were interviewed face-to-face through a semi-structured
interview schedule that lasted for half-an-hour. In the sample, the shares of the female and male were 68.6
percent and 31.4 percent respectively. The average age of the respondents was 34.6 years with an average
educational attainment of 7.3 years of schooling.
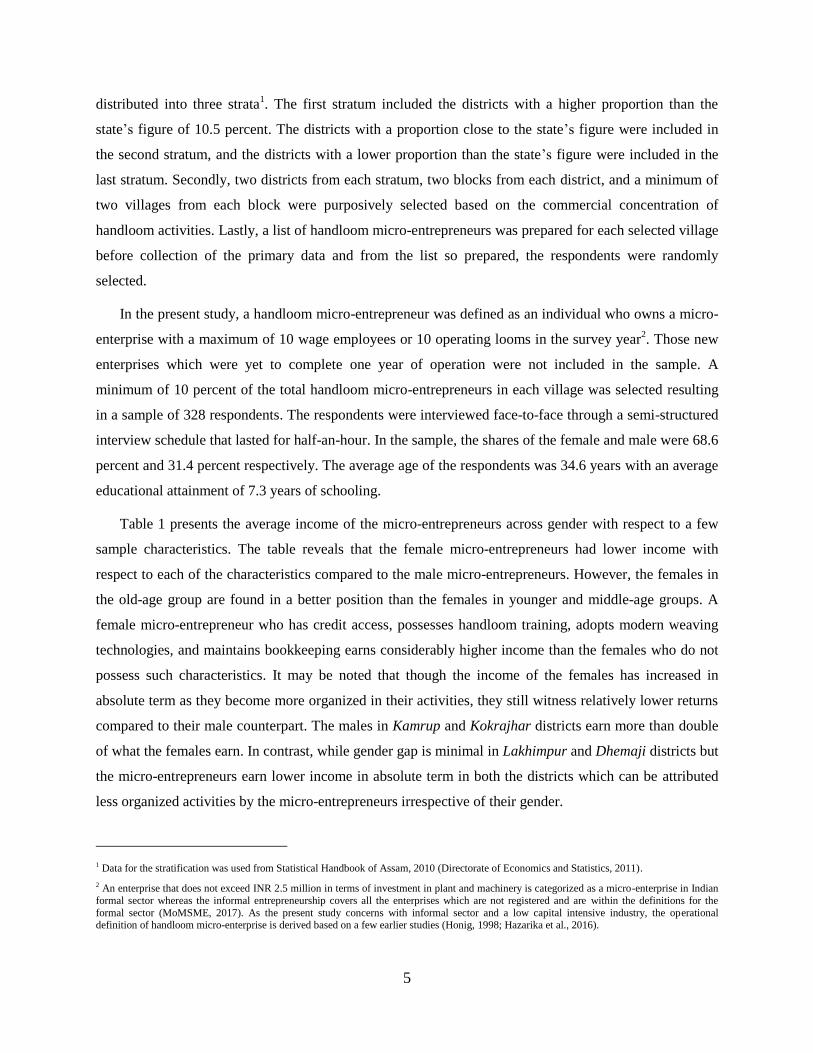
Table 1 presents the average income of the micro-entrepreneurs across gender with respect to a few
sample characteristics. The table reveals that the female micro-entrepreneurs had lower income with
respect to each of the characteristics compared to the male micro-entrepreneurs. However, the females in
the old-age group are found in a better position than the females in younger and middle-age groups. A
female micro-entrepreneur who has credit access, possesses handloom training, adopts modern weaving
technologies, and maintains bookkeeping earns considerably higher income than the females who do not
possess such characteristics. It may be noted that though the income of the females has increased in
absolute term as they become more organized in their activities, they still witness relatively lower returns
compared to their male counterpart. The males in Kamrup and Kokrajhar districts earn more than double
of what the females earn. In contrast, while gender gap is minimal in Lakhimpur and Dhemaji districts but
the micro-entrepreneurs earn lower income in absolute term in both the districts which can be attributed
less organized activities by the micro-entrepreneurs irrespective of their gender.
1 Data for the stratification was used from Statistical Handbook of Assam, 2010 (Directorate of Economics and Statistics, 2011).
2 An enterprise that does not exceed INR 2.5 million in terms of investment in plant and machinery is categorized as a micro-enterprise in Indian
formal sector whereas the informal entrepreneurship covers all the enterprises which are not registered and are within the definitions for the
formal sector (MoMSME, 2017). As the present study concerns with informal sector and a low capital intensive industry, the operational definition of handloom micro-enterprise is derived based on a few earlier studies (Honig, 1998; Hazarika et al., 2016).

6
7
Table 1. Gender income gap in handloom micro-entrepreneurship with respect to a few sample
characteristics
Characteristics Category Male (103) Female (225) F/M t-value p-value
Age Age < 30 years 72,897.22 35,023.89 48.05 5.56 0.001
Age 30-45 years 71,790.91 41,128.32 57.29 5.06 0.001
Age > 45 years 66,333.33 43,218.18 65.15 1.62 0.113
Education Illiterate 53,562.50 33,111.04 61.82 2.33 0.022
Primary 56,797.62 31,460.00 55.39 5.29 0.001
High school 61,313.73 36,051.48 58.80 4.59 0.001
Higher secondary 80,133.33 33,213.24 41.45 5.20 0.001
Availed training No 70,615.73 36,105.56 51.13 7.19 0.001
Yes 77,428.57 47,711.11 61.62 3.00 0.004
Bookkeeping
exercise
No 41,459.46 32,316.98 77.95 3.06 0.003
Yes 88,406.06 54,728.03 61.91 4.04 0.001
Weaving machines
adopted
No 51,071.70 33,595.40 65.78 4.11 0.001
Yes 93,240.00 52,812.90 56.64 4.88 0.001
Districts Kokrajhar 77,676.67 38,236.73 49.23 4.88 0.001
Udalguri 73,142.86 42,253.23 57.77 3.68 0.001
Kamrup 100,904.80 43,562.50 43.17 4.22 0.001
Baksa 89,500.00 56,075.00 62.65 2.03 0.051
Dhemaji 31,718.75 27,451.32 86.55 1.02 0.313
Lakhimpur 31,400.00 29,104.17 92.69 0.55 0.587
Notes: Figures in the parentheses represent sample size. F/M refers the ratio of females’ income to males’ income.
B. Analytical framework
Literature suggests that the derivation of the income variable is always a challenging task especially in the
informal sector (Carter, 2011; Verrest, 2013). There is every possibility of under-reporting or over-
reporting of the income by the informal micro-entrepreneurs. In order to overcome such problems, the
present study considers the net annual income of the handloom micro-entrepreneurs instead of self-
reported income. The net annual income for a micro-entrepreneur is derived by subtracting the production
cost from the gross annual income (quantity of output multiplied by the price per annum).
The present paper analyzes the gender income gap among the handloom micro-entrepreneurs in two
steps. Firstly, the income function for the micro-entrepreneurs is estimated at the mean and selected
quantiles of the income distribution. Secondly, the gender income gaps at selected quantiles are estimated
and decomposed into endowment effects (difference in the productive characteristics), and differential
returns effects (differences in returns to the productive characteristics) following unconditional quantile
decomposition method (Fipro et al., 2009).
8
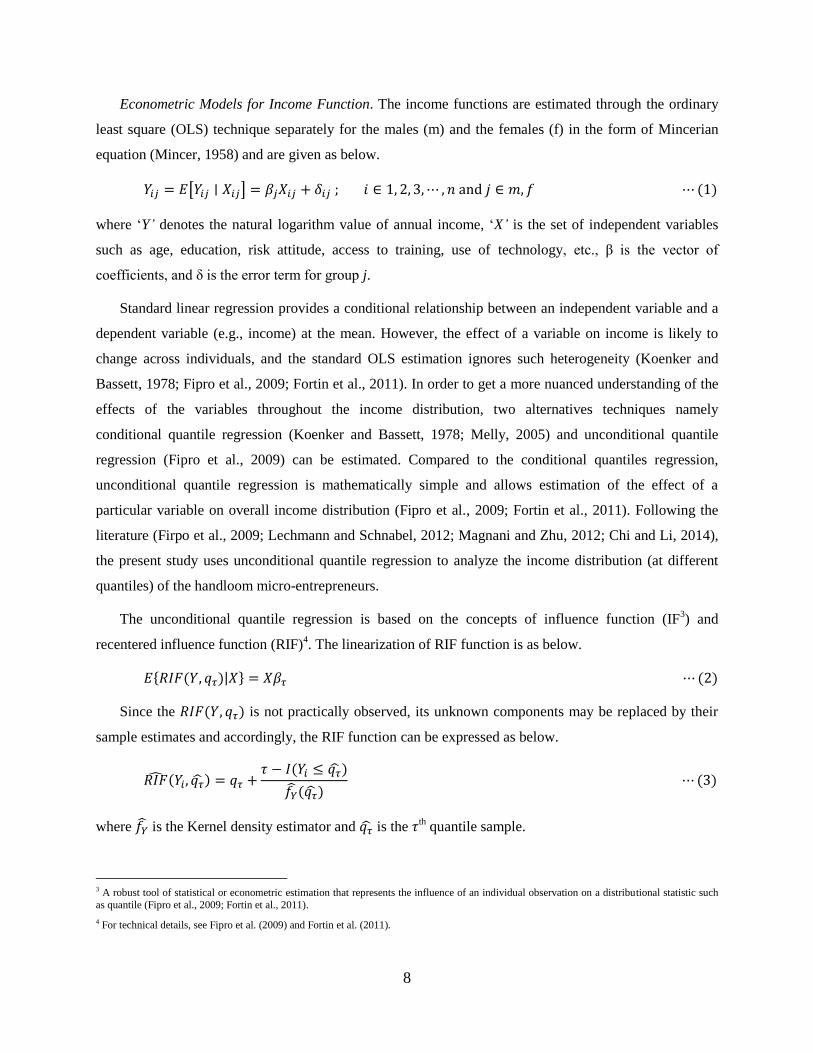
Econometric Models for Income Function. The income functions are estimated through the ordinary
least square (OLS) technique separately for the males (m) and the females (f) in the form of Mincerian
equation (Mincer, 1958) and are given as below.
where ‘Y’ denotes the natural logarithm value of annual income, ‘X’ is the set of independent variables
such as age, education, risk attitude, access to training, use of technology, etc., β is the vector of
coefficients, and δ is the error term for group j.
Standard linear regression provides a conditional relationship between an independent variable and a
dependent variable (e.g., income) at the mean. However, the effect of a variable on income is likely to
change across individuals, and the standard OLS estimation ignores such heterogeneity (Koenker and
Bassett, 1978; Fipro et al., 2009; Fortin et al., 2011). In order to get a more nuanced understanding of the
effects of the variables throughout the income distribution, two alternatives techniques namely
conditional quantile regression (Koenker and Bassett, 1978; Melly, 2005) and unconditional quantile
regression (Fipro et al., 2009) can be estimated. Compared to the conditional quantiles regression,
unconditional quantile regression is mathematically simple and allows estimation of the effect of a
particular variable on overall income distribution (Fipro et al., 2009; Fortin et al., 2011). Following the
literature (Firpo et al., 2009; Lechmann and Schnabel, 2012; Magnani and Zhu, 2012; Chi and Li, 2014),
the present study uses unconditional quantile regression to analyze the income distribution (at different
quantiles) of the handloom micro-entrepreneurs.
The unconditional quantile regression is based on the concepts of influence function (IF3) and
recentered influence function (RIF)4. The linearization of RIF function is as below.
Since the is not practically observed, its unknown components may be replaced by their
sample estimates and accordingly, the RIF function can be expressed as below.
where is the Kernel density estimator and is the th quantile sample.
3 A robust tool of statistical or econometric estimation that represents the influence of an individual observation on a distributional statistic such
as quantile (Fipro et al., 2009; Fortin et al., 2011).
4 For technical details, see Fipro et al. (2009) and Fortin et al. (2011).
9
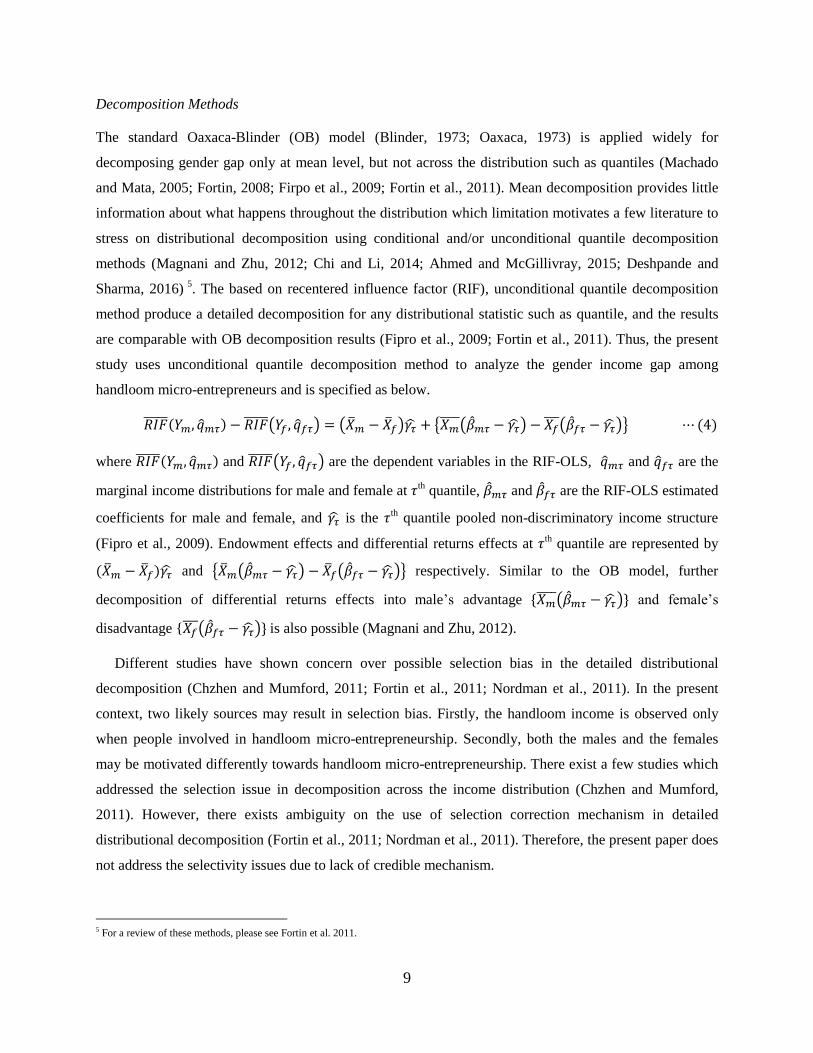
Decomposition Methods
The standard Oaxaca-Blinder (OB) model (Blinder, 1973; Oaxaca, 1973) is applied widely for
decomposing gender gap only at mean level, but not across the distribution such as quantiles (Machado
and Mata, 2005; Fortin, 2008; Firpo et al., 2009; Fortin et al., 2011). Mean decomposition provides little
information about what happens throughout the distribution which limitation motivates a few literature to
stress on distributional decomposition using conditional and/or unconditional quantile decomposition
methods (Magnani and Zhu, 2012; Chi and Li, 2014; Ahmed and McGillivray, 2015; Deshpande and
Sharma, 2016) 5
. The based on recentered influence factor (RIF), unconditional quantile decomposition
method produce a detailed decomposition for any distributional statistic such as quantile, and the results
are comparable with OB decomposition results (Fipro et al., 2009; Fortin et al., 2011). Thus, the present
study uses unconditional quantile decomposition method to analyze the gender income gap among
handloom micro-entrepreneurs and is specified as below.
where and are the dependent variables in the RIF-OLS, and are the
marginal income distributions for male and female at th quantile, and are the RIF-OLS estimated
coefficients for male and female, and is the th quantile pooled non-discriminatory income structure
(Fipro et al., 2009). Endowment effects and differential returns effects at th quantile are represented by
and respectively. Similar to the OB model, further
decomposition of differential returns effects into male’s advantage and female’s
disadvantage { is also possible (Magnani and Zhu, 2012).
Different studies have shown concern over possible selection bias in the detailed distributional
decomposition (Chzhen and Mumford, 2011; Fortin et al., 2011; Nordman et al., 2011). In the present
context, two likely sources may result in selection bias. Firstly, the handloom income is observed only
when people involved in handloom micro-entrepreneurship. Secondly, both the males and the females
may be motivated differently towards handloom micro-entrepreneurship. There exist a few studies which
addressed the selection issue in decomposition across the income distribution (Chzhen and Mumford,
2011). However, there exists ambiguity on the use of selection correction mechanism in detailed
distributional decomposition (Fortin et al., 2011; Nordman et al., 2011). Therefore, the present paper does
not address the selectivity issues due to lack of credible mechanism.
5 For a review of these methods, please see Fortin et al. 2011.
10
C. Choice of the Independent Variables
Based on literature, the present study considers a wide range of variables to analyze the gender income
gap in informal micro-enterprises (Hundley, 2001; Leung, 2006; Alvarez et al., 2009; Fairlie and Robb,
2009; Bortamuly and Goswami, 2012; Lechmann and Schnabel, 2012; Åstebro and Chen, 2014; Chi and
Li, 2014; Deshpande and Sharma, 2016). The variables considered cover three aspects namely human
capital, social capital, and firm-specific. Age, education, training, financial literacy, and risk attitude are
considered to capture the human capital aspects. Age of the respondents is taken as a proxy for handloom
experience as the industry largely depends on imitation, and knowledge and skills spill over the
generations (Bortamuly et al., 2013, 2014; Hazarika et al., 2016). Moreover, the squared term of age is
included in the model to examine the presence of a U-shaped relationship between experience and
income. Education is also specified in a similar way. Educational attainment and training are important
not only for skill development but also in increasing one’s ability to recognize the entrepreneurial
opportunities and thereby the business success (Fairlie and Robb, 2009; Bortamuly and Goswami, 2012;
Lechmann and Schnabel, 2012). Another aspect that reflects the financial practices and organized
workings of a micro-entrepreneur is the maintenance of the bookkeeping (Hazarika et al., 2016).
Bookkeeping helps the micro-entrepreneurs not only in estimating the cost structure and so thus the price
but also in the intertemporal assessment of one’s financial position. Thus, it can be used to judge how
organized and well-managed the workings of a handloom micro-entrepreneur.
The attitude towards risk is often conceptualized in the literature on entrepreneurial performance
(Cressy, 2006). It is often ar gued that the attitude towards risk has a positive effect on entrepreneurial
performance. However, the aspect of risk attitude is very subjective and literature uses different
dimensions towards defining and measuring the risk attitude at the individual level (Koellinger et al.,
2013). For measuring the risk attitude, the present study uses one item 5 point Likert scale through “Are
you generally a person who is fully prepared to take risks related to your enterprise?” The present
measure is effective in a sample with a low level of formal education as the respondents often find it
difficult to differentiate and understand the items in multi-item scales (Gardener et al., 1998).
11
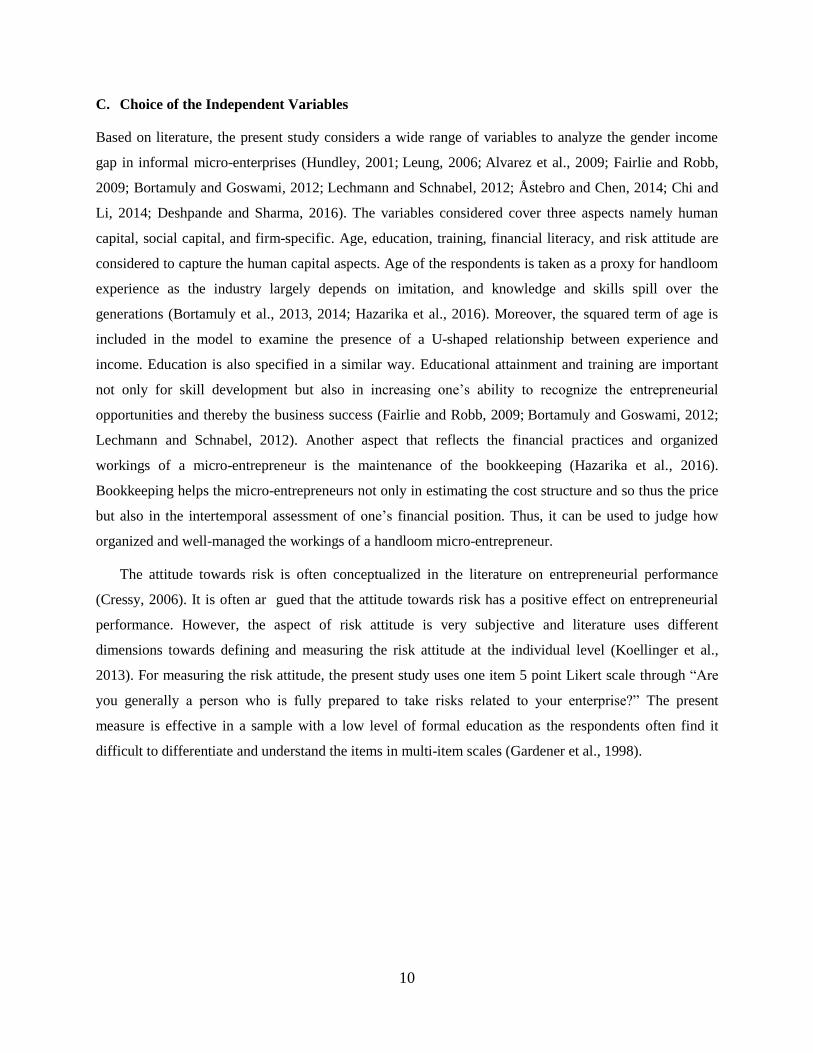
Table 2. Description and measurement of the independent variables
Variables Description Measurement units Expected
sign
ln(annual Income) Annual income of the micro-
entrepreneurs
Natural logarithm of annual income
Female Sex of the respondents Binary: 1 for female and 0 for male −
Age Age of the respondents In years +
Age2 Square term of age centered at
mean
In years −
Education Educational attainment of the
Respondents
In years +
Education2 Square term of education
centered at mean
In years −
Govt. training Availed government training Binary: 1 for availed and 0 for not +
Bookkeeping Maintain bookkeeping accounts Binary: 1 for yes and 0 for not +
Risk aversion Attitude towards risk 5 point Likert: 1 for highly risk
lovers to 5 for highly risk averse
−
Family labor Available family member on
part-time/full-time basis
In numbers +
Network size Size of social network of the
micro-entrepreneur
In numbers +
SGH membership Member of an active SHG Binary: 1 for yes and 0 for not +
Technology Installation of weaving
machinery
Binary: 1 for yes and 0 for not +
District District name of the micro-
entrepreneurs
Dummy: Baksa, Dhemaji, Kamrup,
Kokrajhar, Lakhimpur, and Udalguri
The present study also considers three social capital variables namely the availability of family
member, the social network size, and membership of self-help groups (SHGs). Besides providing the
emotional support, availability of family member as handloom workers not only reduces the labor cost but
also reduces the moral hazard problems associated with the hired labor. The importance of social network
is inevitable towards the business performance. Although a micro-enterprise is embedded to multiple
network structure, the present study focuses on the personal network which is critical towards enterprise
development and growth. The size of social capital, measured in terms of the number of people known to
a micro-entrepreneurs who are involved in the handloom business, leads to dissemination of knowledge
and information related to handloom business. Thus, it may importantly influence the performance of the
micro-enterprise. Apart from its role as social capital in enhancing trust and social bonding, SHGs
membership is critical for credit access especially in the rural areas where the formal credit facility is
12
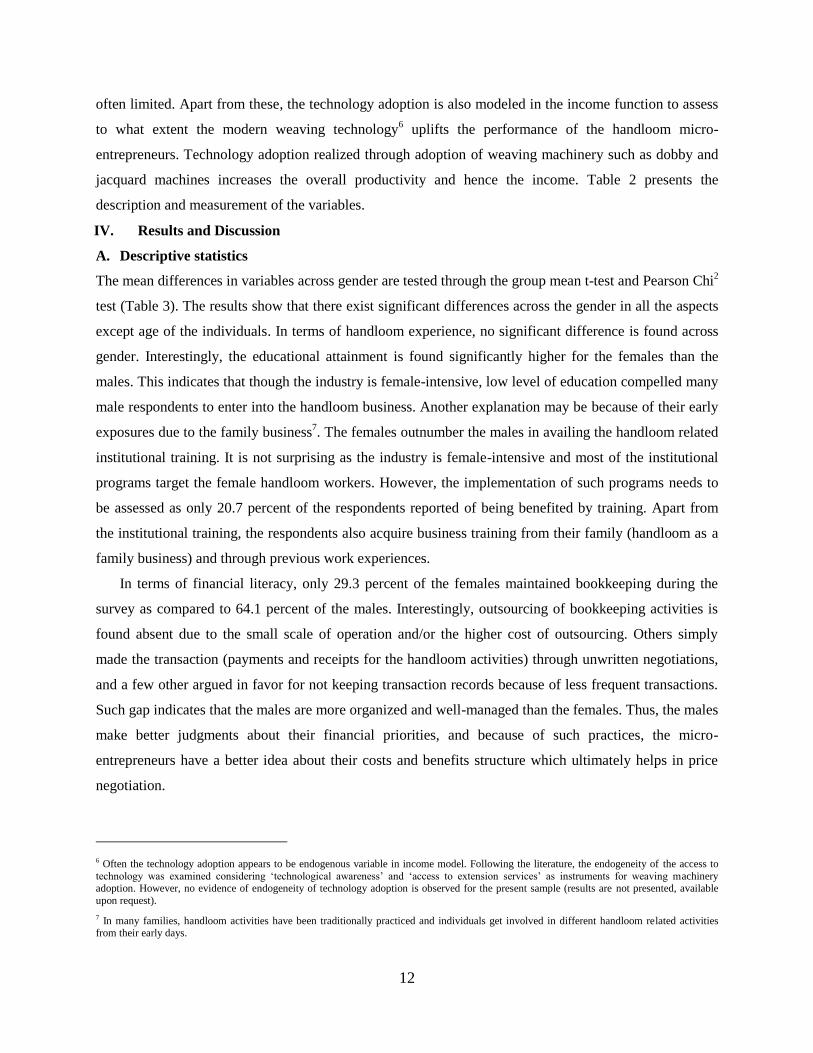
often limited. Apart from these, the technology adoption is also modeled in the income function to assess
to what extent the modern weaving technology6 uplifts the performance of the handloom micro-
entrepreneurs. Technology adoption realized through adoption of weaving machinery such as dobby and
jacquard machines increases the overall productivity and hence the income. Table 2 presents the
description and measurement of the variables.
IV. Results and Discussion
A. Descriptive statistics
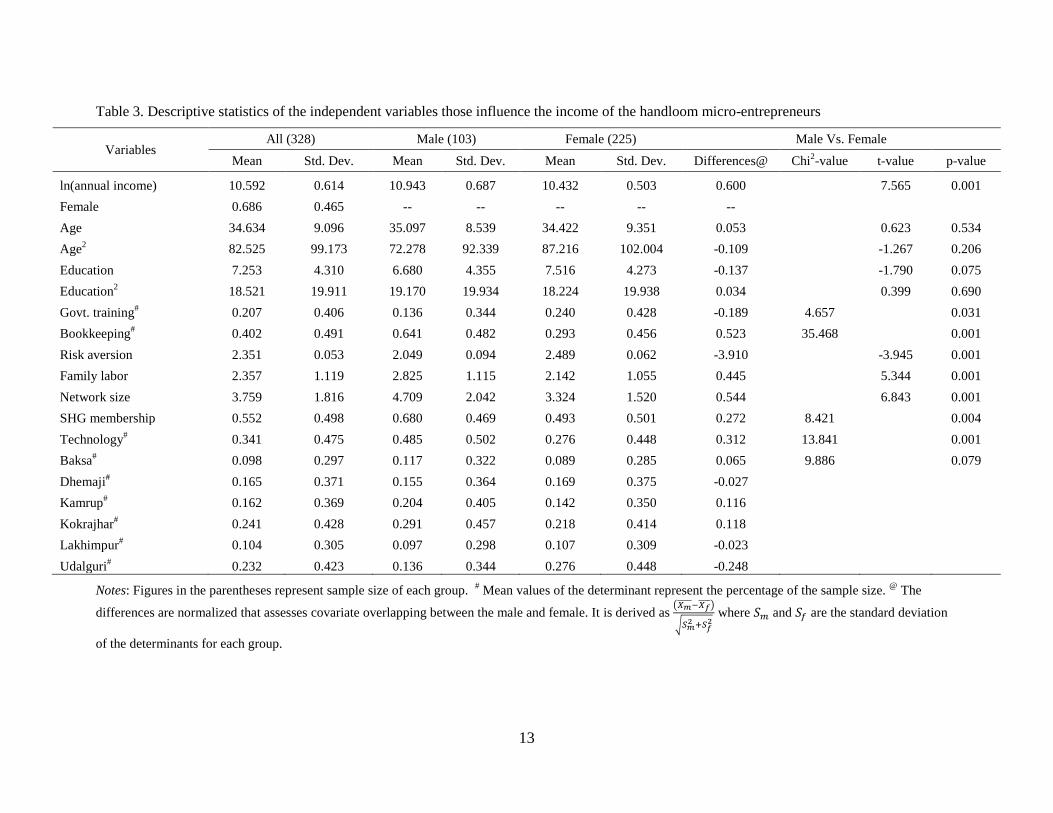
The mean differences in variables across gender are tested through the group mean t-test and Pearson Chi2
test (Table 3). The results show that there exist significant differences across the gender in all the aspects
except age of the individuals. In terms of handloom experience, no significant difference is found across
gender. Interestingly, the educational attainment is found significantly higher for the females than the
males. This indicates that though the industry is female-intensive, low level of education compelled many
male respondents to enter into the handloom business. Another explanation may be because of their early
exposures due to the family business7. The females outnumber the males in availing the handloom related
institutional training. It is not surprising as the industry is female-intensive and most of the institutional
programs target the female handloom workers. However, the implementation of such programs needs to
be assessed as only 20.7 percent of the respondents reported of being benefited by training. Apart from
the institutional training, the respondents also acquire business training from their family (handloom as a
family business) and through previous work experiences.
In terms of financial literacy, only 29.3 percent of the females maintained bookkeeping during the
survey as compared to 64.1 percent of the males. Interestingly, outsourcing of bookkeeping activities is
found absent due to the small scale of operation and/or the higher cost of outsourcing. Others simply
made the transaction (payments and receipts for the handloom activities) through unwritten negotiations,
and a few other argued in favor for not keeping transaction records because of less frequent transactions.
Such gap indicates that the males are more organized and well-managed than the females. Thus, the males
make better judgments about their financial priorities, and because of such practices, the micro-
entrepreneurs have a better idea about their costs and benefits structure which ultimately helps in price
negotiation.
6 Often the technology adoption appears to be endogenous variable in income model. Following the literature, the endogeneity of the access to
technology was examined considering ‘technological awareness’ and ‘access to extension services’ as instruments for weaving machinery adoption. However, no evidence of endogeneity of technology adoption is observed for the present sample (results are not presented, available
upon request).
7 In many families, handloom activities have been traditionally practiced and individuals get involved in different handloom related activities from their early days.
13
Table 3. Descriptive statistics of the independent variables those influence the income of the handloom micro-entrepreneurs
Variables All (328) Male (103) Female (225) Male Vs. Female
Mean Std. Dev. Mean Std. Dev. Mean Std. Dev. Differences@ Chi2-value t-value p-value
ln(annual income) 10.592 0.614 10.943 0.687 10.432 0.503 0.600
7.565 0.001
Female 0.686 0.465 -- -- -- -- --
Age 34.634 9.096 35.097 8.539 34.422 9.351 0.053
0.623 0.534
Age2 82.525 99.173 72.278 92.339 87.216 102.004 -0.109
-1.267 0.206
Education 7.253 4.310 6.680 4.355 7.516 4.273 -0.137
-1.790 0.075
Education2 18.521 19.911 19.170 19.934 18.224 19.938 0.034
0.399 0.690
Govt. training# 0.207 0.406 0.136 0.344 0.240 0.428 -0.189 4.657 0.031
Bookkeeping# 0.402 0.491 0.641 0.482 0.293 0.456 0.523 35.468 0.001
Risk aversion 2.351 0.053 2.049 0.094 2.489 0.062 -3.910
-3.945 0.001
Family labor 2.357 1.119 2.825 1.115 2.142 1.055 0.445
5.344 0.001
Network size 3.759 1.816 4.709 2.042 3.324 1.520 0.544
6.843 0.001
SHG membership 0.552 0.498 0.680 0.469 0.493 0.501 0.272 8.421 0.004
Technology# 0.341 0.475 0.485 0.502 0.276 0.448 0.312 13.841 0.001
Baksa# 0.098 0.297 0.117 0.322 0.089 0.285 0.065 9.886
0.079
Dhemaji# 0.165 0.371 0.155 0.364 0.169 0.375 -0.027
Kamrup# 0.162 0.369 0.204 0.405 0.142 0.350 0.116
Kokrajhar# 0.241 0.428 0.291 0.457 0.218 0.414 0.118
Lakhimpur# 0.104 0.305 0.097 0.298 0.107 0.309 -0.023
Udalguri# 0.232 0.423 0.136 0.344 0.276 0.448 -0.248
Notes: Figures in the parentheses represent sample size of each group.
# Mean values of the determinant represent the percentage of the sample size.
@ The
differences are normalized that assesses covariate overlapping between the male and female. It is derived as
where and are the standard deviation
of the determinants for each group.
14
Regarding the attitude towards risk, males were less risk-averse than the females. This is one of the
key issues which may explain why the females earn lesser than that of the males. Moreover, significant
differences are also found with respect to the use of modern weaving technologies in the workplace
between males (27.6%) and females (48.5%). It is also observed that the extent of deployment of such
machinery is greater in the male-owned micro-enterprises than the female-owned micro-enterprises.
In terms of social capital, the average network size for the males is found to be larger than that of the
females. The cultural norms of restricted outside-home mobility may explain such gender difference in
the network size in the rural areas. In terms of availability of family labor, the males are in an
advantageous position than the females. Against the general trend of promoting the SHGs for uplifting the
disadvantageous group of the females, the proportion of the males having a membership (68.0%) is
significantly higher than the females (49.3%). Such variation in SHGs membership may also contribute
towards the unequal income distribution across gender among the handloom micro-entrepreneurs.
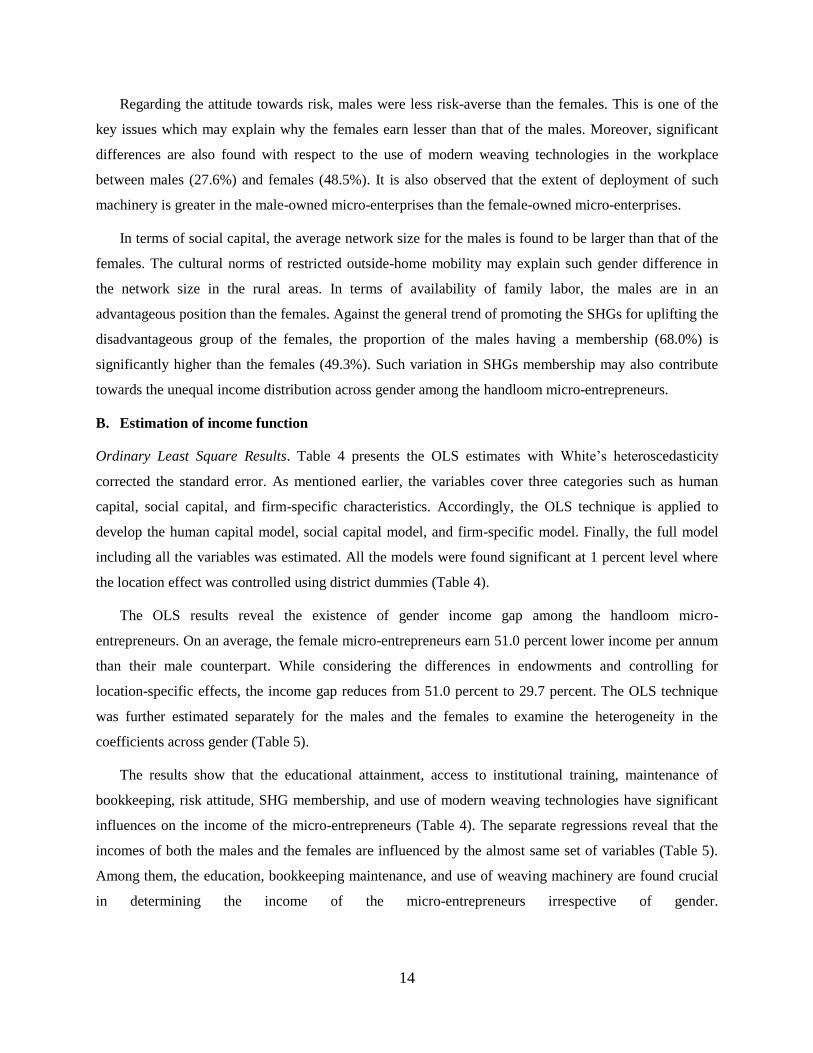
B. Estimation of income function
Ordinary Least Square Results. Table 4 presents the OLS estimates with White’s heteroscedasticity
corrected the standard error. As mentioned earlier, the variables cover three categories such as human
capital, social capital, and firm-specific characteristics. Accordingly, the OLS technique is applied to
develop the human capital model, social capital model, and firm-specific model. Finally, the full model
including all the variables was estimated. All the models were found significant at 1 percent level where
the location effect was controlled using district dummies (Table 4).
The OLS results reveal the existence of gender income gap among the handloom micro-
entrepreneurs. On an average, the female micro-entrepreneurs earn 51.0 percent lower income per annum
than their male counterpart. While considering the differences in endowments and controlling for
location-specific effects, the income gap reduces from 51.0 percent to 29.7 percent. The OLS technique
was further estimated separately for the males and the females to examine the heterogeneity in the
coefficients across gender (Table 5).
The results show that the educational attainment, access to institutional training, maintenance of
bookkeeping, risk attitude, SHG membership, and use of modern weaving technologies have significant
influences on the income of the micro-entrepreneurs (Table 4). The separate regressions reveal that the
incomes of both the males and the females are influenced by the almost same set of variables (Table 5).
Among them, the education, bookkeeping maintenance, and use of weaving machinery are found crucial
in determining the income of the micro-entrepreneurs irrespective of gender.
15
Table 4. Ordinary Least Squares estimates for handloom income for pooled sample
Variables Gender 1
# Gender 2
# Human capital Social capital
Firm
characteristics Full
Coef. RSE. Coef. RSE. Coef. RSE. Coef. RSE. Coef. RSE. Coef. RSE.
Constant 10.943*** 0.068 11.236*** 0.115 10.930*** 0.184 11.069*** 0.170 10.961*** 0.119 10.477*** 0.209
Female -0.510*** 0.075 -0.486*** 0.066 -0.328*** 0.064 -0.439*** 0.073 -0.400*** 0.065 -0.297*** 0.064
Age 0.003 0.003
0.004 0.003
Age2 0.001 0.001
0.000 0.000
Education 0.012* 0.007
0.036*** 0.008
Education2 0.001 0.001
0.002 0.002
Govt. training 0.127* 0.068
0.120* 0.064
Bookkeeping 0.371*** 0.069
0.296*** 0.066
Risk aversion -0.090*** 0.028
-0.084*** 0.027
Family labor 0.006 0.027
-0.004 0.023
Network size 0.001 0.020
0.003 0.016
SHG membership 0.215*** 0.056
0.157*** 0.051
Technology
0.371*** 0.067 0.234*** 0.064
District dummy No Yes Yes Yes Yes Yes
Sample 328 328 328 328
328
328
F-value 45.800 27.090 20.550 18.530
27.400
20.620
p-value 0.001 0.001 0.001 0.001
0.000
0.000
R2 0.149 0.314 0.440 0.314
0.376
0.529
Root MSE 0.567 0.513 0.469 0.516
0.490
0.433
Adjusted R
2 0.147 0.301 0.416 0.295
0.362
0.504
Notes: Gender 1 and Gender 2 refers regression model with female dummy and with and without district fixed effect. Significant levels * p < 0.10; ** p <
0.05; *** p< 0.01. RSE represents robust standard error.
16
Table 5. Ordinary Least Squares estimates for the income of the handloom micro-entrepreneurs across gender
Variables Human capital Social capital Firm characteristics Full
Male Female Male Female Male Female Male Female
Constant 10.639*** 10.501*** 11.222*** 10.103*** 10.964*** 10.232*** 9.911*** 9.942***
Age 0.003 0.004
0.005 0.004
Age2 0.001 0.001
0.000 0.000
Education 0.003 0.031**
0.089*** 0.022***
Education2 0.001 0.001
0.007** 0.002
Govt. training 0.174** -0.044
0.189* 0.120
Bookkeeping 0.292*** 0.555**
0.430*** 0.236***
Risk aversion -0.097*** -0.035
-0.031 -0.077**
Family labor 0.017 -0.007
-0.002 -0.007
Network size -0.028 0.018
-0.021 0.023
SHG membership 0.144 0.199***
0.101 0.151**
Technology
0.298** 0.354*** 0.239** 0.200**
District dummy Yes Yes Yes Yes Yes Yes Yes Yes
Sample 103 225 103 225 103 225 103 225
F-value 7.090 11.800 9.070 5.460 12.170 9.160 13.190 6.510
p-value 0.001 0.001 0.001 0.001 0.001 0.001 0.001 0.000
R2 0.273 0.547 0.403 0.167 0.419 0.208 0.690 0.351
Root MSE 0.441 0.492 0.553 0.468 0.540 0.454 0.417 0.421
Adjusted R2 0.232 0.487 0.352 0.136 0.382 0.186 0.632 0.301
Notes: Significant levels * p < 0.10; ** p < 0.05; *** p< 0.01. RSE represents robust standard error.
17
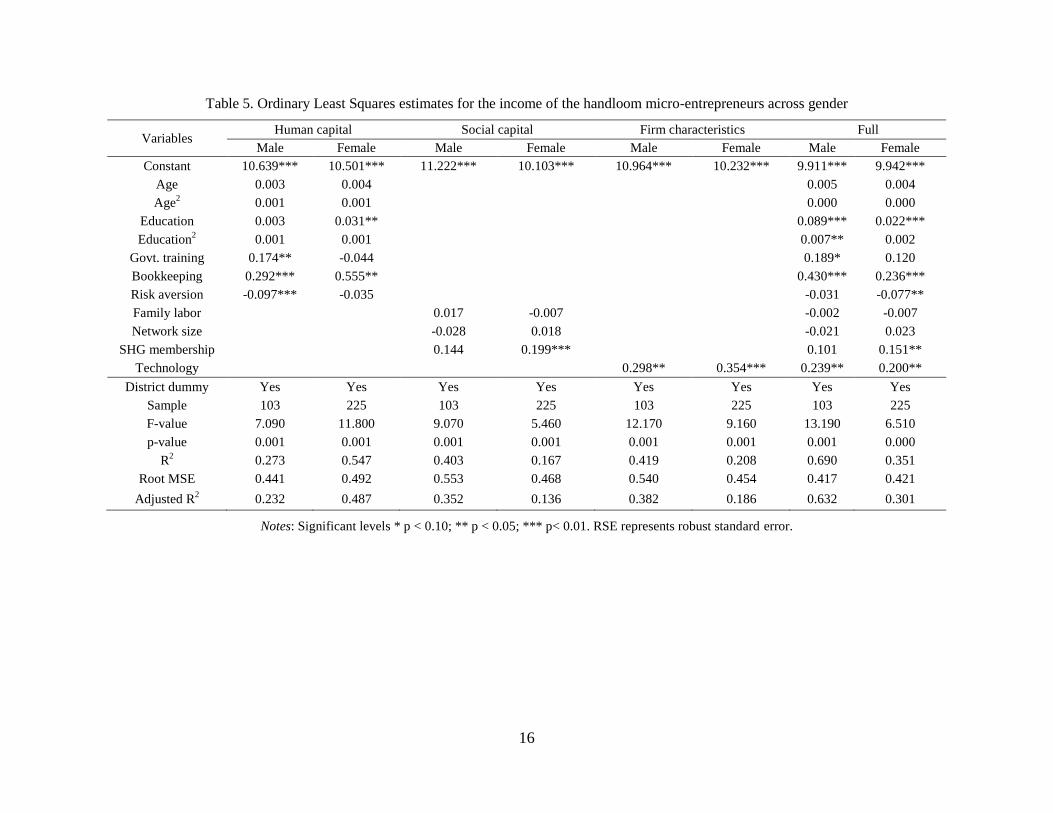
Contrary to the estimated literature, the relationship between the handloom experience and income of
the micro-entrepreneurs is found not significant in the present study. This might be because of the
collective effects of human capital, social capital, and economic aspects. Another explanation for such
result might be the similar age and experience profiles of the micro-entrepreneurs irrespective gender. As
expected, and in line with previous studies, the present study finds a positive and significant influence of
educational attainment on the income of the handloom micro-entrepreneurs. Ceteris paribus, one year
increase in schooling increases the income of the micro-entrepreneurs by 3.6 percent. Looking at the
gender issue, the returns to educational attainment is higher for the males (8.9%) than the females (2.2%).
Maintenance of bookkeeping has a favorable effect on income of the micro-entrepreneurs. Ceteris
paribus, micro-entrepreneurs who maintain bookkeeping earn 12.0 percent more than those who do not
keep such records. In particular, the effect of bookkeeping maintenance is more important for the females
as it enables one to review the firm activities and provides significant insights in making future
entrepreneurial decisions. Looking at the gender differentials, the return to maintenance of bookkeeping is
found to be higher for the males (43.0%) than the females (23.6%).
The influence of risk aversion attitude of the micro-entrepreneurs is found to be negative and
significant on their income level. As a micro-entrepreneur, one needs to take financial, production, and
marketing related decisions under uncertainty. The lower the risk-averse attitude, the greater will be the
entrepreneurial success and hence a higher level of income. This is more so for the female micro-
entrepreneurs as they are typically more risk-averse than their male counterpart that compels them to
concentrate on a small scale of production and lower extent of using of modern technology or rely on the
traditional techniques of production.
Among the social capital dimensions, the SHGs membership tends to increase the income of the
micro-entrepreneurs. Ceteris paribus, the income of the micro-entrepreneurs who are members of SHGs
earn 15.7 percent more than those who are not. Considering the gender aspects, while the influence of the
SHGs membership is found positive and significant for the females, it is found to be not significant for
the males. Apart from such relational embeddedness, SHGs also emerge as a source of credit in the
micro-enterprise development especially among the females and the poor for whom the access to formal
credit is limited. Thus, the SHGs membership provides the trust and confidence needed for accessing the
credit in an informal credit market. Such access to credit and relational embeddedness help the micro-
entrepreneurs towards investment in business expansion including technology adoption (Hazarika et al.,
2016).
18
The influence of technology adoption is found to be positive and significant on income, and its return
appears higher for the males than the females. Ceteris paribus, the use of weaving machines increases the
income of the males and the females by 23.9 percent and 20.0 percent respectively. It is often found that
most of the males produce high-valued silk products using dobby or jacquard machines.
The influence of handloom related institutional training is found to be positive and significant for the
overall sample and the male sub-sample. Unexpectedly, its influence is found not significant in elevating
the income of the female micro-entrepreneurs in the state. While most of the training programs target the
female handloom workers, such non-significant results reestablish the needs for thorough evaluation of
the implementation of such programs. Such programs should be made flexible to disseminate the benefits
to the targeted people. Lack of infrastructure and effective market linkages also hinder the benefits of
such programs. It is found that, even if the rural females are covered under such training programs, they
are unable to deliver the desired outcome due to limited infrastructure and market linkages. Therefore,
policies should be directed to ensure access to financial services and extension of the market linkage in
the rural areas. Findings related to bookkeeping maintenance and technology usage have important
implications in addressing the existing gender income gap. In most of these aspects, the males are found
in a favorable position and thus seek policy measures to encourage the females towards technology
adoption, financial literacy, and product diversification to minimize the income gap.
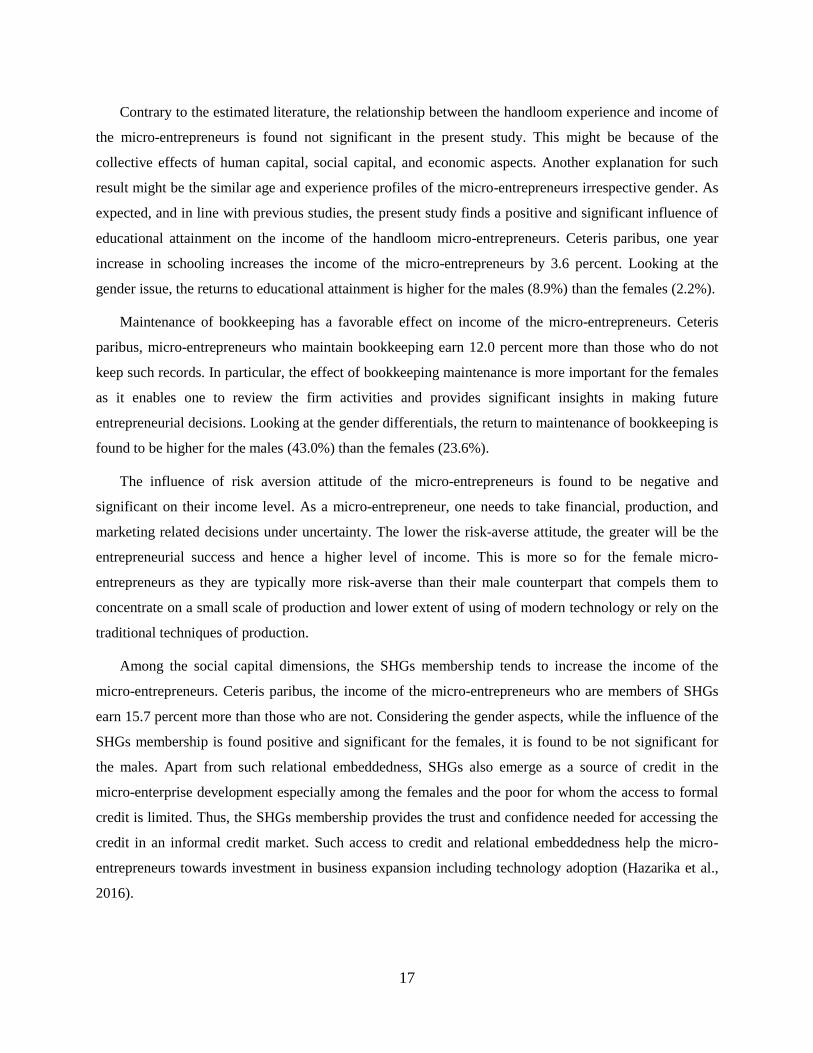
Distributional Regression Results
Table 6 presents the estimated unconditional marginal effects at selected quantiles (10th, 25
th, 50
th, 75
th,
and 90th). It also presents the conditional estimates to check the robustness of the unconditional estimates.
The results show similar patterns for both conditional and unconditional estimates indicating the
unconditional estimates to be robust. Educational attainment, attitude towards risk, bookkeeping
maintenance, SHGs membership, and use of weaving machinery appear important in determining the
income of the micro-entrepreneurs throughout the distribution. The return to education is found to be
similar throughout the distribution. While the influence of experience appears not significant in the
standard OLS model, it is significant at the higher quantiles. Similarly, the return to maintenance of
bookkeeping and use of weaving machinery tend to increase as one move to higher quantiles. Such
heterogeneity in returns is disguised in a standard OLS estimation. The assessment of such heterogeneity
across gender is imperative to get a clear picture on why the female micro-entrepreneurs earn lower than
their male counterpart.
20
Table 6. Quantile regression estimates of the income of the handloom micro-entrepreneurs
Variables
10th
Quantile 25th
Quantile 50th
Quantile 75th
Quantile 90th
Quantile
Condition
al
Uncondition
al
Condition
al
Uncondition
al
Condition
al
Uncondition
al
Condition
al
Uncondition
al
Condition
al
Uncondition
al
Constant 9.961*** 9.364*** 10.099*** 10.136*** 10.313*** 10.357*** 10.478*** 10.046*** 10.650*** 10.081***
Female -0.408*** 0.331*** -0.258*** 0.354*** -0.262*** -0.105 -0.276*** -0.080 -0.304*** -0.144
Age 0.005 0.003 0.004 -0.010* 0.004 0.005 0.001 0.013** 0.001 0.029***
Age2 -0.001 -0.001** 0.000 -0.001* 0.000 0.000 0.001** 0.000 0.001 0.001
Education 0.033*** 0.021* 0.028*** 0.013 0.026*** 0.021* 0.026*** 0.025* 0.053*** 0.078***
Education2 -0.001 0.003 0.000 -0.002 0.001 -0.001 0.002 0.000 0.006** 0.006
Govt.
training 0.175* 0.186* 0.128 0.104 0.129 0.025 0.064 0.162 0.152 0.492**
Bookkeepin
g 0.258*** -0.131 0.187** 0.230* 0.277*** 0.156* 0.352*** 0.346*** 0.415*** 0.770***
Risk
aversion -0.075* -0.061 -0.110*** -0.130** -0.093** -0.105** -0.095*** -0.152*** -0.077* -0.117
Family
labor -0.051 -0.033 -0.010 0.027 0.018 0.048 0.022 0.074* 0.014 0.050
Network
size -0.001 0.033 -0.025 0.036 -0.022 0.004 0.025 0.061** 0.011 -0.001
SHG
membership 0.094 0.173** 0.132* 0.169* 0.188*** 0.157** 0.156*** 0.149 0.096 0.343**
Technology 0.194** 0.087 0.306*** 0.415*** 0.212** 0.269*** 0.342*** 0.498*** 0.295*** 0.494**
Pseudo 0.254
0.252
0.297
0.403
0.447
R-squared 0.148
0.285
0.341
0.390
0.294
Notes: Significant levels * p < 0.10; ** p < 0.05; *** p< 0.01.
21
Table 7: Unconditional quintal regression estimates of the income of the micro-entrepreneurs across gender
Variables 10
th Quantile 25
th Quantile 50
th Quantile 75
th Quantile 90
th Quantile
Male Female Male Female Male Female Male Female Male Female
Constant 9.512*** 9.572*** 10.488*** 9.950*** 9.466*** 10.009*** 8.299*** 10.032*** 8.873*** 8.936***
Age -0.003 0.003 -0.012 -0.004 0.023** 0.000 0.011 0.009 0.020 0.031***
Age2 -0.001 -0.001* -0.003* 0.000 -0.001* 0.000 -0.001 0.000 0.001 0.001
Education 0.026 0.018 -0.028 0.008 0.080*** -0.002 0.108*** 0.002 0.155** 0.073***
Education2 -0.001 0.005* -0.010 0.000 0.001 0.000 0.009 -0.001 0.018* 0.003
Govt. training 0.409 0.160 0.440 0.159* 0.400 -0.026 0.266 0.259* -0.140 0.618*
Bookkeeping -0.244* -0.096 0.802*** 0.083 0.384* 0.127 0.614*** 0.215 0.374 0.866***
Risk aversion -0.198 -0.009 -0.246** -0.033 -0.139 -0.066 0.076 -0.277*** 0.035 -0.219*
Family labor -0.005 -0.058 -0.032 -0.003 0.083 0.000 0.142 0.076 0.094 0.085
network size 0.047* 0.020 0.032 0.025 -0.051 0.046 0.026 0.083** 0.058 -0.033
SHG
membership 0.090 0.226** 0.315 0.077 0.150 0.182** 0.113 0.114 0.429 0.252
Technology 0.358 0.027 0.986** 0.124 0.549** 0.153 0.616*** 0.424*** -0.006 0.556*
District dummy Yes Yes Yes Yes Yes Yes Yes Yes Yes Yes
Sample 103 225 103 225 103 225 103 225 103 225
F-value 0.340 1.410 11.260 2.570 31.210 5.820 10.550 9.930 0.960 3.120
p-value 0.991 0.142 0.000 0.001 0.000 0.000 0.000 0.000 0.502 0.000
R2 0.208 0.156 0.542 0.133 0.547 0.221 0.492 0.369 0.220 0.336
Root MSE 0.671 0.705 1.163 0.586 0.762 0.571 0.843 0.755 1.385 1.506
Notes: Significant levels * p < 0.10; ** p < 0.05; *** p< 0.01
22
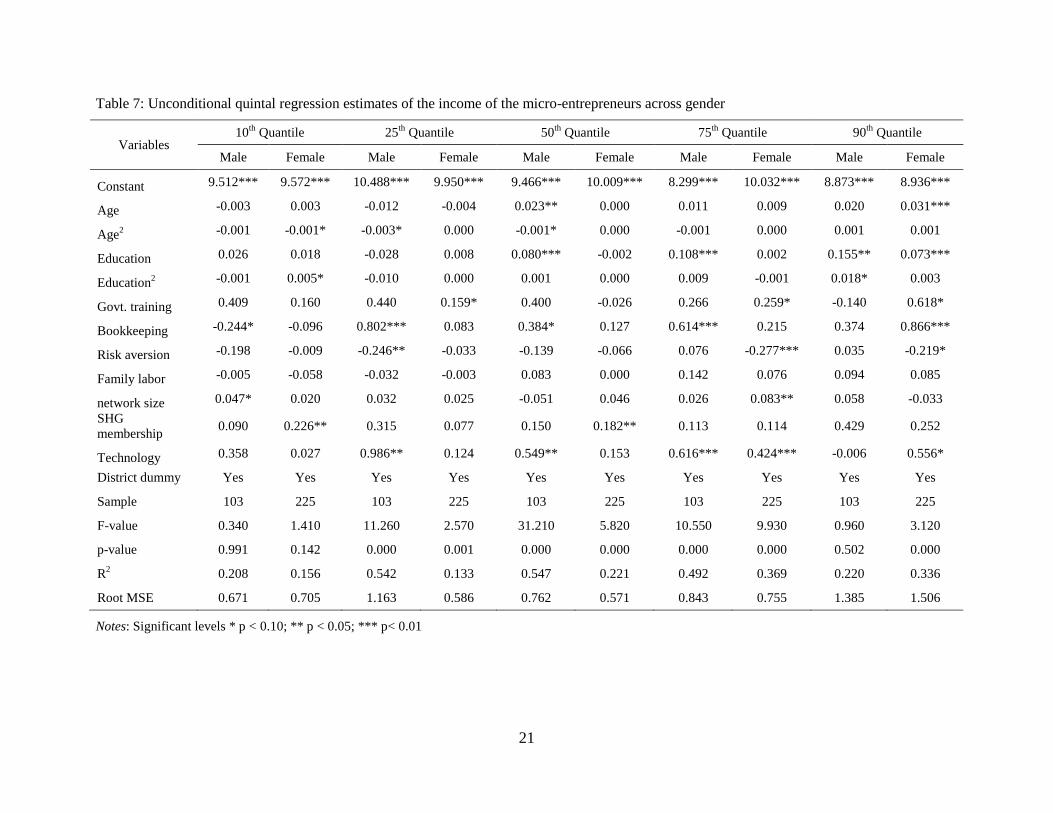
Table 7 presents the marginal effects across gender at different quantiles. While the return to
experience is found significant for the males at the median, it is significant for the females at the higher
quantiles (90th). The estimated return to maintenance of bookkeeping is found higher for the males at
lower quantile than their female counterpart. In contrast, the bookkeeping maintenance tends to reduce the
existing gender income gap at higher quantiles as indicated by the higher returns to the females at 90th
quantile. The SHGs membership is crucial for the females at the lower quantiles. More provisions for
credit and other financial services would reduce the existing gender income gap as indicated by the higher
returns for the female throughout the income distribution.
From the firm endowment perspective, the return to weaving machinery appears positive and
significant for the males, and it is a higher return at the lower quantiles than at the median. For the
females, the estimated OLS return to machinery was to be 23.4 percent which appears as 12.4 percent at
the 25th quantile, 42.4 percent at the 75
th quantile, and 55.6 percent at the 90
th quantile in unconditional
quantile estimation. Also, the returns at higher quantiles (75th and 90
th) are higher for the females than the
males. It implies that the income of the females rises more with the greater extent of machinery
deployment.
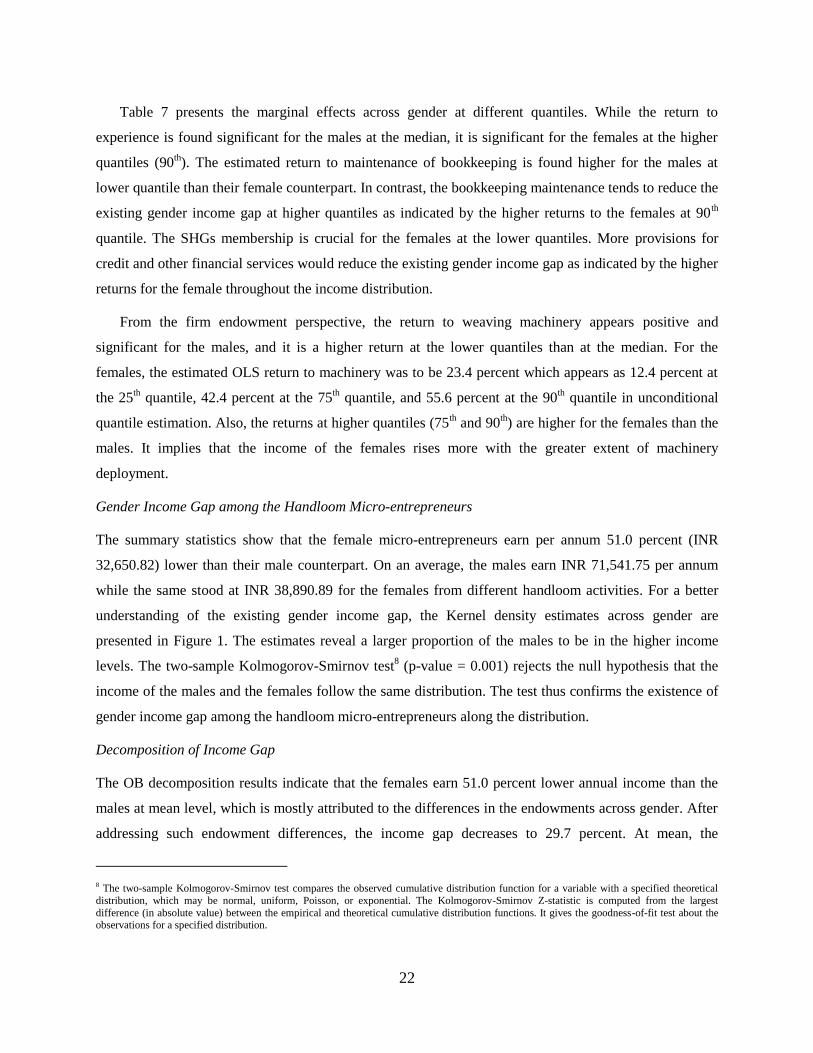
Gender Income Gap among the Handloom Micro-entrepreneurs
The summary statistics show that the female micro-entrepreneurs earn per annum 51.0 percent (INR
32,650.82) lower than their male counterpart. On an average, the males earn INR 71,541.75 per annum
while the same stood at INR 38,890.89 for the females from different handloom activities. For a better
understanding of the existing gender income gap, the Kernel density estimates across gender are
presented in Figure 1. The estimates reveal a larger proportion of the males to be in the higher income
levels. The two-sample Kolmogorov-Smirnov test8 (p-value = 0.001) rejects the null hypothesis that the
income of the males and the females follow the same distribution. The test thus confirms the existence of
gender income gap among the handloom micro-entrepreneurs along the distribution.
Decomposition of Income Gap
The OB decomposition results indicate that the females earn 51.0 percent lower annual income than the
males at mean level, which is mostly attributed to the differences in the endowments across gender. After
addressing such endowment differences, the income gap decreases to 29.7 percent. At mean, the
8 The two-sample Kolmogorov-Smirnov test compares the observed cumulative distribution function for a variable with a specified theoretical
distribution, which may be normal, uniform, Poisson, or exponential. The Kolmogorov-Smirnov Z-statistic is computed from the largest
difference (in absolute value) between the empirical and theoretical cumulative distribution functions. It gives the goodness-of-fit test about the observations for a specified distribution.
23
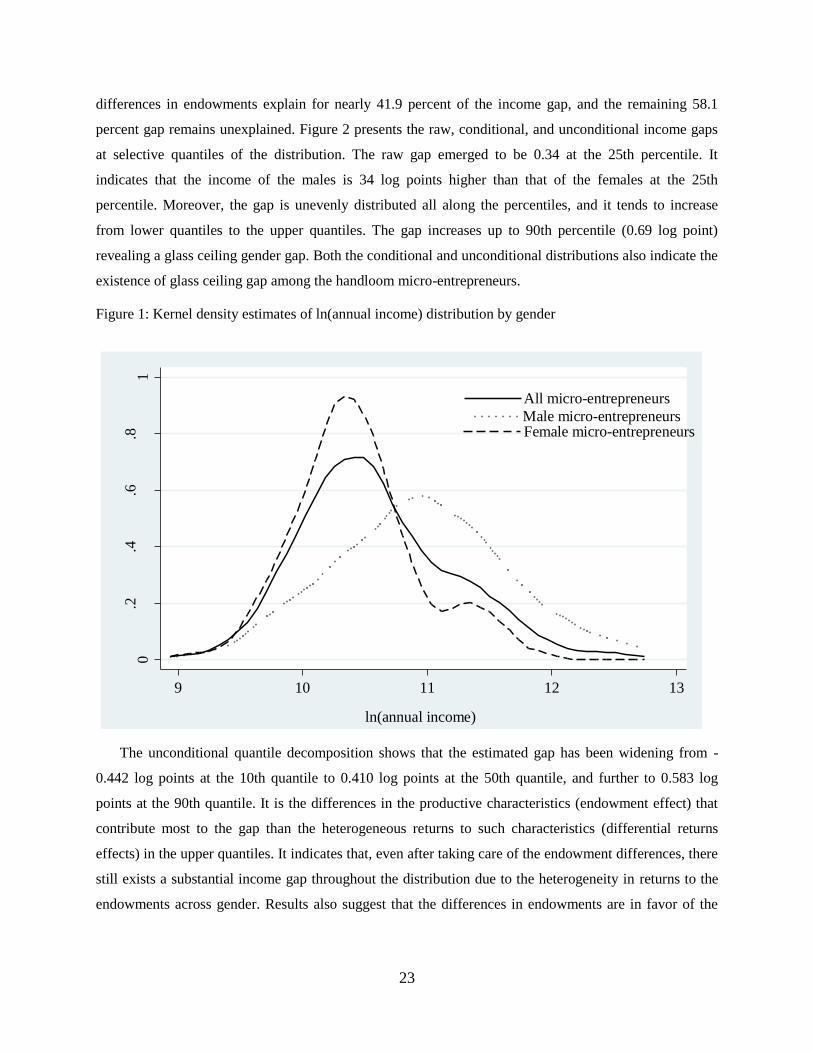
differences in endowments explain for nearly 41.9 percent of the income gap, and the remaining 58.1
percent gap remains unexplained. Figure 2 presents the raw, conditional, and unconditional income gaps
at selective quantiles of the distribution. The raw gap emerged to be 0.34 at the 25th percentile. It
indicates that the income of the males is 34 log points higher than that of the females at the 25th
percentile. Moreover, the gap is unevenly distributed all along the percentiles, and it tends to increase
from lower quantiles to the upper quantiles. The gap increases up to 90th percentile (0.69 log point)
revealing a glass ceiling gender gap. Both the conditional and unconditional distributions also indicate the
existence of glass ceiling gap among the handloom micro-entrepreneurs.
Figure 1: Kernel density estimates of ln(annual income) distribution by gender
The unconditional quantile decomposition shows that the estimated gap has been widening from -
0.442 log points at the 10th quantile to 0.410 log points at the 50th quantile, and further to 0.583 log
points at the 90th quantile. It is the differences in the productive characteristics (endowment effect) that
contribute most to the gap than the heterogeneous returns to such characteristics (differential returns
effects) in the upper quantiles. It indicates that, even after taking care of the endowment differences, there
still exists a substantial income gap throughout the distribution due to the heterogeneity in returns to the
endowments across gender. Results also suggest that the differences in endowments are in favor of the
0.2
.4.6
.81
Den
sity
9 10 11 12 13
ln(annual income)
All micro-entrepreneurs
Male micro-entrepreneursFemale micro-entrepreneurs
24
males. Conversely, differential returns effect becomes low for the females as they move towards higher
quantiles of the distribution.
Figure 2. Gender ln(annual income) gap among handloom micro-entrepreneurs
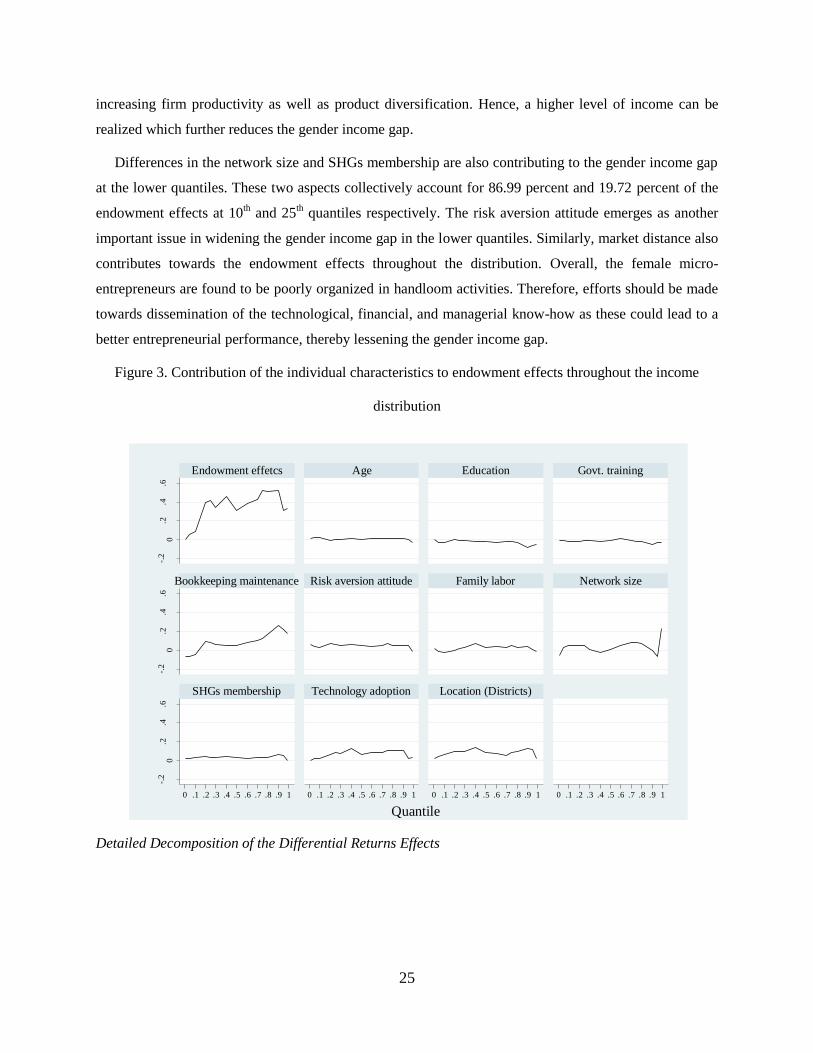
Detailed Decomposition of the Endowment Effects
The detailed decomposition of the endowment effects is presented in Figure 3. The coefficients refer to
the contribution of each characteristic to the endowment effect. The gender differences in bookkeeping
and use of weaving machine explain the major part of the endowment effects at the upper quantiles of the
distributions. These two variables collectively account for 37.23 percent, 44.14 percent, and 71.08 percent
of the endowment effects at 50th, 75
th, and 90
th quantiles respectively. It suggests that the differences in
the bookkeeping maintenance and technology adoption have widened the income gap at the upper end of
the distribution. In order to achieve a more equitable distribution across gender, it to enhancement the
financial literacy and technology adoption for the females is necessary for the rural informal sector.
Though bookkeeping maintenance uplifts the income of females, a significant proportion of them does
not maintain the same. Such low level of financial literacy of the females can be explained by their poor
formal education and lack of financial knowledge. They are also found to be reluctant to take higher risk,
reluctant to approach for external credit, and less competent in identifying handloom business
opportunities. Similarly, a greater investment in weaving machinery will enable females towards
-.5
-.3
-.1
.1.3
.5.7
.9
0 .1 .2 .3 .4 .5 .6 .7 .8 .9 1Quantile.
Raw gap
Conditional gap
Unconditional gap
ln(a
nn
ual
in
com
e) g
ap
25
increasing firm productivity as well as product diversification. Hence, a higher level of income can be
realized which further reduces the gender income gap.
Differences in the network size and SHGs membership are also contributing to the gender income gap
at the lower quantiles. These two aspects collectively account for 86.99 percent and 19.72 percent of the
endowment effects at 10th and 25
th quantiles respectively. The risk aversion attitude emerges as another
important issue in widening the gender income gap in the lower quantiles. Similarly, market distance also
contributes towards the endowment effects throughout the distribution. Overall, the female micro-
entrepreneurs are found to be poorly organized in handloom activities. Therefore, efforts should be made
towards dissemination of the technological, financial, and managerial know-how as these could lead to a
better entrepreneurial performance, thereby lessening the gender income gap.
Figure 3. Contribution of the individual characteristics to endowment effects throughout the income
distribution
Detailed Decomposition of the Differential Returns Effects
-.2
0.2
.4.6
-.2
0.2
.4.6
-.2
0.2
.4.6
0 .1 .2 .3 .4 .5 .6 .7 .8 .9 1 0 .1 .2 .3 .4 .5 .6 .7 .8 .9 1 0 .1 .2 .3 .4 .5 .6 .7 .8 .9 1 0 .1 .2 .3 .4 .5 .6 .7 .8 .9 1
Endowment effetcs Age Education Govt. training
Bookkeeping maintenance Risk aversion attitude Family labor Network size
SHGs membership Technology adoption Location (Districts)
Co
nti
bu
tio
n
QuantileGraphs by var
26
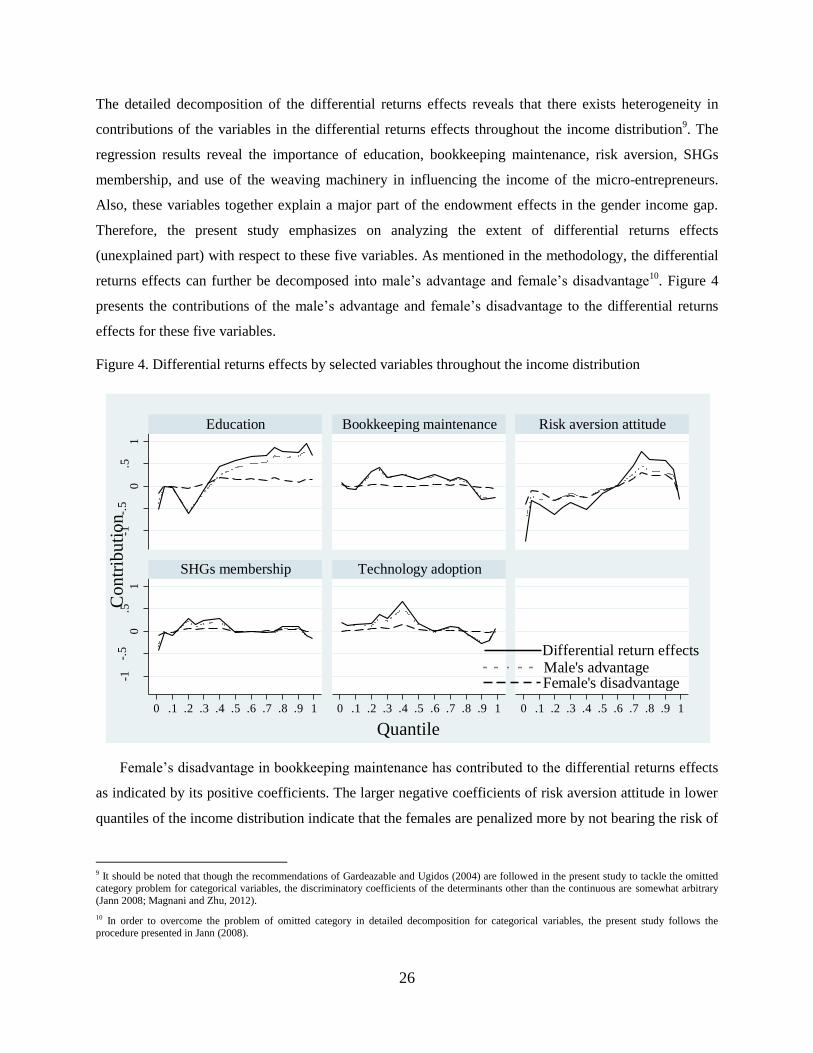
The detailed decomposition of the differential returns effects reveals that there exists heterogeneity in
contributions of the variables in the differential returns effects throughout the income distribution9. The
regression results reveal the importance of education, bookkeeping maintenance, risk aversion, SHGs
membership, and use of the weaving machinery in influencing the income of the micro-entrepreneurs.
Also, these variables together explain a major part of the endowment effects in the gender income gap.
Therefore, the present study emphasizes on analyzing the extent of differential returns effects
(unexplained part) with respect to these five variables. As mentioned in the methodology, the differential
returns effects can further be decomposed into male’s advantage and female’s disadvantage10
. Figure 4
presents the contributions of the male’s advantage and female’s disadvantage to the differential returns
effects for these five variables.
Figure 4. Differential returns effects by selected variables throughout the income distribution
Female’s disadvantage in bookkeeping maintenance has contributed to the differential returns effects
as indicated by its positive coefficients. The larger negative coefficients of risk aversion attitude in lower
quantiles of the income distribution indicate that the females are penalized more by not bearing the risk of
9 It should be noted that though the recommendations of Gardeazable and Ugidos (2004) are followed in the present study to tackle the omitted category problem for categorical variables, the discriminatory coefficients of the determinants other than the continuous are somewhat arbitrary
(Jann 2008; Magnani and Zhu, 2012).
10 In order to overcome the problem of omitted category in detailed decomposition for categorical variables, the present study follows the procedure presented in Jann (2008).
-1-.
50
.51
-1-.
50
.51
0 .1 .2 .3 .4 .5 .6 .7 .8 .9 1 0 .1 .2 .3 .4 .5 .6 .7 .8 .9 1 0 .1 .2 .3 .4 .5 .6 .7 .8 .9 1
Education Bookkeeping maintenance Risk aversion attitude
SHGs membership Technology adoption
Male's advantageFemale's disadvantage
Differential return effects
Quantile
Graphs by var
Co
ntr
ibu
tio
n
27
investment in technology, product diversification, etc. on the other hand, the difference in the returns to
education is found to be stable throughout the income distribution. Overall, the coefficients indicate that
the discrimination observed in the income distribution is due to the gender-based advantages of the male
micro-entrepreneurs.
28
V. CONCLUSIONS
The present study analyzes the gender income gap along with the income distribution among the
handloom micro-entrepreneurs in Assam. The RIF unconditional quantile regression shows evidence of a
substantial gender income gap throughout the distribution in the handloom industry. The study further
decomposes the estimated income gap into endowment effects and differential returns effects and also
attempts to understand the causes of endowment effects and differential returns effects of the existing
income gap.
The decomposition shows that the endowment effects contribute more to the gender income gap at the
upper quantiles of the income distribution indicating the existence of gender differences in the productive
characteristics. Gender differentials with respect to bookkeeping maintenance and use of weaving
machinery need to be addressed to reduce the gender income gap. In contrast, the differential returns
effects contribute more at the lower end of the income distribution indicating that even if the differences
in endowments are controlled, there still exists a substantial income gap at lower quantiles. However, as
females move towards the upper quantiles, the extent of differential returns effects tends to decline.
Overall, the differences in the endowments are in favor of the males. Use of weaving machinery and
practicing the bookkeeping maintenance by the male micro-entrepreneurs than their female counterpart
has led to the income gap throughout the income distribution. Thus, policy prescriptions should be
directed towards dissemination of the technological, financial, and managerial know-how to increase the
entrepreneurial skills of the females. They should be encouraged towards technology adoption and
product diversification so that they can reap the benefits of economies of scale and thereby reducing the
income gap.
The study has a few limitations. Instead of cross-sectional data, a set of panel data could have
delivered more nuanced understanding on the dynamics of gender income gap. Though handloom micro-
enterprises do exist in the urban areas, the issue of the rural-urban income gap is not addressed in the
present study. Nevertheless, the study contributes to the literature by providing insights on income gap in
informal micro-entrepreneurship with respect to the endowment and differential returns effects in an
under-researched context of the handloom industry. It also gives a more nuanced understanding of a
distributional gender gap considering a few less pronounced characteristics such as on maintenance of
bookkeeping and SHGs membership.
REFERENCES
Ahmed, Salma, and Mark McGillivray (2015), Human capital, discrimination, and the gender wage gap in
Bangladesh, World Development 67: 506–524.
29
Åstebro, Thomas, and Jing Chen (2014), The entrepreneurial earnings puzzle: Mismeasurement or
real? Journal Business Venturing 29: 88–105.
Becolod, Marigee (2016), Skills, the gender wage gap, and cities, Journal of Regional Science 57: 290–
318
Bhagavatula, Suresh, Tom Elfring, Aad Van Tilburg, and Gerhard G. Van De Bunt (2010), How social
and human capital influence opportunity recognition and resource mobilization in India's handloom
industry, Journal Business Venturing 25: 245–260.
Blinder, Alan S. (1973), Wage discrimination: Reduced form and structural estimates, Journal of Human
Resource 8: 436–455.
Bortamuly, Alin Borah, and Kishor Goswami (2012), Factors influencing wage structure of the handloom
workers in Assam: An assessment from gender perspective, Journal of Rural Development 31:
139–150
Bortamuly, Alin Borah, Kishor Goswami, and Bhabesh Hazarika (2013), Determinants of occupational
choice of workers in handloom industry in Assam, International Journal Social Economics 40:
1041–1057.
Bortamuly, Alin Borah, Kishor Goswami, Bhabesh Hazarika, and Kalpan Handique (2014), Do different
determinants affect differently across gender and location in handloom entrepreneurship
development? Journal of Small Business & Entrepreneurship 27: 427–449.
Carter, Sara (2011), The rewards of entrepreneurship: exploring the incomes, wealth, and economic
well‐being of entrepreneurial households, Entrepreneurship Theory and Practice 35: 39–55.
Chi, Wei, and Bo Li (2014), Trends in china’s gender employment and pay gap: Estimating gender pay
gaps with employment selection, Journal of Comparative Economics 42: 708–725.
Chzhen, Yekaterina, and Karen Mumford (2011), Gender gaps across the earnings distribution for full-
time employees in Britain: Allowing for sample selection, Labour Economics 18: 837–844.
Deshpande, Ashwini, and Smriti Sharma (2016), Disadvantage and discrimination in self-employment:
Caste gaps in earnings in Indian small businesses, Small Business Economics 46: 325–346.
DiNardo, John, Nicole M. Fortin, and Thomas Lemieux (1996), Labor market institution and the
distribution of wages, 1973–1992: A semiparametric approach, Econometrica 64: 1001–1044.
Directorate of Economics and Statistics (2011), Statistical Handbook of Assam 2010. Guwahati:
Government of Assam.
Fairlie, Robert W., and Alicia M. Robb (2009), Gender differences in business performance: Evidence
from the characteristics of Business Owners Survey, Small Business Economics 33: 375–395.
Firpo, Sergio, Nicole Fortin, and Thomas Lemieux (2009), Unconditional quantile regressions,
Econometrica 77: 953–973.
Fortin, Nicole, Thomas Lemieux, Sergio Firpo (2011), Decomposition methods in economics, in O.
Ashenfelter and D. Card (eds.), Handbook of Labor Economics (4A). Amsterdam: Elsevier, pp. 1–
102.
Fortin, Nicole (2008), The gender wage gap among young adults in the United States: The importance of
money versus people, Journal of Human Resources 43: 886–929.
Gardeazabal, Javier, and Arantza Ugidos (2004), More on identification in detailed wage decompositions,
Review of Economics and Statistics 86: 1034–1036.
Hazarika, Bhabesh, and Kishor Goswami (2014), Rural non-farm micro-entrepreneurship or not: Gender
issue in decision making, paper presented at the 6th Bolivian Conference on Development
Economics, Cochabamba.
30
Hazarika, Bhabesh, and Kishor Goswami (2016), Do home-based micro-entrepreneurial earnings
empower rural women? Evidence from the handloom sector in Assam,” Asian Journal of Women's
Studies 22: 289-317.
Hazarika, Bhabesh, Madhurjya Prashad Bezbaruah, and Kishor Goswami (2016), Adoption of modern
weaving technology in the handloom micro-enterprises in Assam: A double hurdle approach,
Technological Forecasting and Social Change 102: 344–356.
Honig, Benson (1998), What determines success? Examining the human, financial, and social capital of
Jamaican microentrepreneurs, Journal of Business Venturing 13: 371–394.
Hundley, Greg (2001), Why women earn less than men in self-employment, Journal of Labor Research
22: 817–829.
Iyer, Lakshmi, Tarun Khanna, and Ashutosh Varshney (2013), Caste and entrepreneurship in India,
Economic and Political Weekly 48: 52–60.
Jann, Benn (2008), A stata implementation of the Blinder-Oaxaca decomposition, Stata Journal 8: 453–
479.
Jodhka, Surinder S. (2010), Dalits in business: Self-employed scheduled castes in Northwest India,
Economic and Political Weekly 55: 41–48.
Khanna, Shantanu (2012), Gender wage discrimination in India: Glass ceiling or sticky floor?” Working
Paper No. 214. Centre for Development Economics, Delhi School of Economics, New Delhi.
Kijima, Yoko (2006), Why did wage inequality increase? Evidence from urban India 1983–99, Journal of
Development Economics 81: 97–117.
Koellinger, Philipp, Maria Minniti, and Christian Schade (2013), Gender differences in entrepreneurial
propensity, Oxford Bulletin of Economics and Statistics 75: 213–234.
Koenker, Roger, and Gilbert Bassett Jr. (1978), Regression quantiles, Econometrica, 46: 33–50.
Koenker, Roger, and Kevin Hallock (2001), Quantile regression: An introduction, Journal of Economic
Perspectives 15: 43–56.
Lechmann, Daniel SJ, and Claus Schnabel (2012), Why is there a gender earnings gap in self-
employment? A decomposition analysis with German data, IZA Journal of European Labor Studies
1: 1–25.
Lemieux, Thomas (2002), Decomposing changes in wage distributions: A unified approach, Canadian
Journal of Economics 35: 646–688.
Leung, Danny (2006), The male/female earnings gap and female self-employment, Journal of Socio
Economics 35: 759–779.
Machada, José AF, and José Mata (2005), Counterfactual decomposition of changes in wage distributions
using quantile regression, Journal of Applied Economics 20: 445–465.
Magnani, Elisabetta, and Rong Zhu (2012), Gender wage differentials among rural–urban migrants in
China, Regional Science and Urban Economics 42: 779–793.
Matano, Alessia, and Paolo Naticchioni (2016), What drives the urban wage premium? Evidence along
the wage distribution, Journal of Regional Science 56: 191–209.
Melly, Blaise (2005), Decomposition of differences in distribution using quantile regression, Labour
Economics 12: 577–590.
Mincer, Jacob (1958), Investment in human capital and personal income distribution, Journal of Political
Economy 66: 281–302.
Ministry of Textile (2016), Annual Report 2016–17. New Delhi: Ministry of Textile, Government of
India.
31
MoMSMEs (2017), Annual Report 2016–17. New Delhi: Ministry of Micro, Small and Medium
Enterprises, Government of India.
NCAER (2004), Joint Census of Handloom & Powerloom 1995-96: Handloom Sector. New Delhi:
National Council of Applied Economic Research.
NCAER (2010), Handloom Census 2009-10. New Delhi: Development Commissioner for Handlooms,
Government of India.
Nordman, Christophe J., Anne-Sophie Robilliard, and Francois Roubaud (2011), Gender and Ethnic
earnings gaps in seven West African cities, Labour Economics 18: S132–S145.
Oaxaca, Ronald (1973), Male–female wage differentials in urban labor markets, International Economic
Review 14: 693–709.
Orser, Barbara J., Allan L. Riding, and Kathryn Manley (2006), Women entrepreneurs and financial
capital, Entrepreneurship Theory and Practice 30: 643–665.
Shariff, Abusaleh, and Mehtabul Azam (2011), Income inequality in rural India: Decomposing the Gini
by income sources, Economics Bulletin 31: 739–748.
Verrest, Hebe (2013), Rethinking microentrepreneurship and business development programs:
Vulnerability and ambition in low-income urban Caribbean households, World Development 47:
58–70.


![NOETHER-LASKER DECOMPOSITION OF COHERENT ANALYTIC …€¦ · The Noether-Lasker decomposition of subsheaves is derived from the gap-sheaf theory of Thimm [4]. In part I of this paper](https://static.fdocuments.in/doc/165x107/6067aeb1ea161260153c32d4/noether-lasker-decomposition-of-coherent-analytic-the-noether-lasker-decomposition.jpg)