Decomposing the Growth of Portugal: A Case for Increasing Demand, not austerity, in a Small European...
34
Texto para Discussão 034 | 2016 Discussion Paper 034 | 2016 Decomposing the Growth of Portugal: A Case for Increasing Demand, not austerity, in a Small European Economy Carlos Pinkusfeld Bastos Professor: Institute of Economics, Rio de Janeiro Federal University (UFRJ) Gabriel Martins da Silva Porto Researcher: Political Economy Group – Institute of Economics, Rio de Janeiro Federal University (UFRJ) This paper can be downloaded without charge from http://www.ie.ufrj.br/index.php/index-publicacoes/textos-para-discussao
-
Upload
grupo-de-economia-politica-ie-ufrj -
Category
Economy & Finance
-
view
94 -
download
0
Transcript of Decomposing the Growth of Portugal: A Case for Increasing Demand, not austerity, in a Small European...

Texto para Discussão 034 | 2016
Discussion Paper 034 | 2016
Decomposing the Growth of Portugal: A Case for Increasing Demand, not austerity, in a Small European Economy
Carlos Pinkusfeld Bastos
Professor: Institute of Economics, Rio de Janeiro Federal University (UFRJ)
Gabriel Martins da Silva Porto Researcher: Political Economy Group – Institute of Economics, Rio de Janeiro Federal
University (UFRJ)
This paper can be downloaded without charge from
http://www.ie.ufrj.br/index.php/index-publicacoes/textos-para-discussao

IE-UFRJ DISCUSSION PAPER: BASTOS; PORTO, TD 034 - 2016. 2
Decomposing the Growth of Portugal: A Case for Increasing Demand, not austerity, in a Small European Economy
Novembro, 2016
Carlos Pinkusfeld Bastos
Professor: Institute of Economics, Rio de Janeiro Federal University (UFRJ)
Gabriel Martins da Silva Porto Researcher: Political Economy Group – Institute of Economics, Rio de Janeiro Federal
University (UFRJ)
Abstract
This paper presents an analysis of Portugal's economy from 1999 to 2015, providing an alternative to explanations that present the situation faced by Southern European countries after the Great Recession as a matter of excessive expenditure or loss in competitiveness. Based upon the Sraffian Supermultiplier model, we look at how demand components evolved along the analyzed period, in a growth accounting setting. This assessment evidences that insufficient effective (public) demand -- not balance-of-payments constraints nor an alleged excess of public expenditure -- is what explains Portugal's low-to-negative growth rates from 2001 forward. Given the limited productive structure, a labor market that is not strong enough to guarantee a solid internal credit expansion and the present institutional setting (which makes fiscal expenditure an also limited source of effective demand), we conclude that the only way for Portugal to abandon the low growth path would be a more cooperative fiscal stance from the European Union.
Keywords: Sraffian Supermultiplier, Growth Accounting, Euro Crisis, Portugal
JEL Classification: E42, E58, E62

IE-UFRJ DISCUSSION PAPER: BASTOS; PORTO, TD 034 - 2016. 3
1 Introduction
Eight years after the start of the 2008 crisis Portugal did not recover the level of GDP per
capita it had prior to this crisis. The labor market still shows a larger number of
unemployed workers, a higher rate of unemployment and lower wages compared to the
pre crisis period. One can hardly say that the austerity policies put in place by the
European Authorities succeeded in, almost a decade later, turning the page of a quite
dramatic slump suffered by this country after 2008. Even if we look in terms of some
fiscal indicators, like public debt, it is not easy to see any improvement or even relief
brought by the policies implemented since 2008.
It is not surprising that such state of affairs drew harsh criticism from unsuspected sources
like Lawrence Summers who wrote in 2015 that “Structural reform has been tried for
many years in Europe, which is now likely approaching its third recession. It is not even
clear that this reform works in the right direction. If supply increases without a
concomitant demand increase, deflationary pressure increases.”(p. 63)
However if a change of route is advisable, or necessary, it has to, besides abandoning the
austerity oriented policies, be based on a correct diagnosis of the Portuguese economic
situation. The task would be incomplete if one does not try to understand the specific
conditions of this country instead of trying to propose policy prescriptions that would fit
all European southern countries.
The aim of this paper is to show that the Portuguese experience has particularities that
make it not only an interesting case to study but also that would demand specific measures
from the European Union if it the expected result is a socially and politically stable
country.
To achieve this goal, the paper is structured as follows: the next section briefly presents
the established literature; the third section comprises a critical revision of the arguments
presented by this established literature (including a revision of the determinants of
Portugal's current account deficits); the fourth section contains an analysis of Portugal's
economic slowdown growth, utilizing a growth accounting method that is based on the
Sraffian Supermultiplier model; the concluding remarks are found at the fifth and final
section.

IE-UFRJ DISCUSSION PAPER: BASTOS; PORTO, TD 034 - 2016. 4
2 Revision of the established literature
The poor performance experienced by peripheral European economies through the late
2000s and 2010s has been analyzed from many perspectives. With empirical evidence
presenting a set of countries facing critical situations, combining elevated public debt,
recurring public deficits and large current account deficits, researchers began drawing
causalities to develop theoretical explanations. These problems were supposed to be
structural vulnerabilities of several European economies and were magnified by the
financial crisis initiated in the US in 2007 and that later spread to Europe.
In a broad sense, one could separate the most common theories in two different categories:
on one hand, there is a group that explains the situation as primarily derived from fiscal
matters (either through elevated public deficits or the worsening of the conditions for
public debt financing); while on the other hand, there is another group that presents this
situation as primarily derived from the worsening of current account balances. Of course
it is possible to put together these two interpretations both directly and indirectly. The
first case would be the twin deficits, or an excess of domestic demand over the potential
output and the second an impact of aggregate demand on the labor market, pushing up
labor costs up and compromising external competitiveness.
The first group of theories appeared to be the most favored by many policy makers after
2010. As Pisani-Ferry (2012) states, European policy makers generally considered the
Euro crisis to have fiscal origins, due to a lax enforcement of fiscal rules. The solution,
according to this understanding, was to enact policies that curb public expenditure in
order to reduce public deficits - and so they have tried, but so far without much success
(and least on the part that said that these adjustments would eventually lead to sustainable
growth).1
1 A different sort of argument related to the fiscal stance and public deficit financing is presented by
Papadimitriou and Wray (2012). To these authors, the fiscal problem of European economies is the fact
that, once they are hit by a deep recession, public balances would turn to deficits and "[...] markets would
raise risk premia on their debt, which would cause interest rates to explode in a manner that would further
increase deficits in a vicious cycle." (p. 2). And this is compounded by a second issue that lies in the fact
that these same countries are the main responsible for the safekeeping of their banking systems - as many
of them did after the global financial crisis erupted. Papadimitriou and Wray (idem) point out, that austerity
is almost self-defeating in these cases and it should be given to Europeans countries, by the European

IE-UFRJ DISCUSSION PAPER: BASTOS; PORTO, TD 034 - 2016. 5
Interpretations from the second group, the ones that considers current account imbalances
are the root of the Euro crisis, are also somewhat varied. Proponents of this thesis
generally consider that economies tend to full employment or full capacity levels. In this
setting, unwarranted increases in expenditures - be they public and/or private - in open
economies would result in external deficits. Higgins and Klitgaard (2010), for example,
argue that the decrease in interest rates faced by both the private and public sectors of
countries in the euro area periphery allowed them to engage in heavy borrowing from
private foreign investors, prompting a mismatch between full employment savings and
investment. Policy prescriptions in this case generally involve attempts to increase
domestic savings.
Among this same group, some authors also consider that increases the in domestic
absorption during the early Euro years have tightened the labor markets of the peripheral
European economies, prompting labor costs to rise above productivity gains, thus
hindering competitiveness in relation to central European economies (e.g. Germany). The
policy prescriptions that derive from such perception commonly involve fiscal
adjustments to reduce imports and promote a "competitive disinflation", which could
pave the way for structural adjustments.
According to Felipe and Kumar (2011), this understanding of the need for competitive
disinflation may be indifferent to the author's understanding to how the Euro crisis has
began. According to them:
"No matter how the crisis started, analysts have concluded that these countries
suffer from a competitiveness problem (i.e., workers are too expensive,
especially given their labor productivity). Given that devaluation is not
possible because they all use the euro, and that the monetary union has imposed
fiscal rigidity and removed monetary independence, it appears that adjustment
has to come through the labor market. [...] A number of economists have
concluded that to close the “competitiveness gap,” in particular with Germany,
requires downward adjustments in relative wages [...]" (Felipe and Kumar,
2011, p. 2).
Parliament, a larger room for further anti-cyclical policies and freedom to the European Central Bank (ECB)
to act as a buyer of last resort for sovereign bonds.

IE-UFRJ DISCUSSION PAPER: BASTOS; PORTO, TD 034 - 2016. 6
Such understanding is not exclusive to orthodox economists; unorthodox economists have
also registered similar arguments. According to Cesaratto (2012), the policies practiced
by the German government, similar to the "monetary mercantilism"2 of old, has motivated
the accumulation of significant trade surpluses against peripheral European economies.
To achieve this goal, the German government would promote the stagnation of domestic
demand via wage moderation and a restrictive fiscal policy. The peripheral economies,
conversely, obtained access to cheaper credit, with historically lower interest rates and
practiced less stringent wage policies during the first decade of the Euro. The resulting
increases in domestic demand and losses in competitiveness in the periphery led to the
accumulation of trade deficits against "core European economies". These imbalances, in
turn, were ultimately financed by banks from the same "core economies".
Blanchard (2007) was probably one of first authors to utilize arguments similar as that
advanced by Felipe and Kumar (op. cit.) for the specific case of Portugal. The author
arguments that the European integration process allowed Portugal's interest rates (both
nominal and real) to decrease. This, in turn, fueled an economic boom until the year 2000,
whose result was a tightening of the labor markets and, therefore, an overvaluation of
labor. This rise in the cost of labor, when coupled with very slow productivity growth,
made unit labor costs increase beyond what was observed for the rest of the Eurozone
(which accounts for a majority of Portugal's trade)3. Since the country could no more
devalue its currency, the adjustment, as prescribed by Blanchard (op. cit.), would be a
long period of competitive disinflation.
Baer et al. (2013) builds on similar assumptions, while also incorporating moral aspects
to the discussion. The text starts as follows:
"When peripheral countries join rich countries to form a customs union, which
also becomes a monetary union, they may be tempted to make use of perceived
opportunities. Using some of the latter might be called “responsible”, while
others might be called “irresponsible”. [...] The “irresponsible” use of
opportunities consisted of the government of the peripheral country to borrow
2 See also Cesaratto and Stiratti (2011). 3 It is fair to say, and we mentioned it below in section XX, that this, and other authors, also consider, when
discussing the competitiveness of Portugal´s exports, the structural trends set in motion in the 2000´s, i.e.,
the specialization in low tech exports and direct competition with China and other Asian economies.

IE-UFRJ DISCUSSION PAPER: BASTOS; PORTO, TD 034 - 2016. 7
from the rich country in order to finance a rapid rise in social benefits, which
were not related to productivity." (idem, p. 345)
For these authors, the responsible scenario, would be sustaining sufficient GDP growth
to service its increasing debt. The irresponsibility, on the other hand, lied in utilizing the
discounted credit rates (for the public and private sectors), due to joining the Euro, to
increase consumption and social transfers since the interest burden on public debt was
less biding, while not addressing the issues that impeded growth4.
For Baer et al. (op. cit) there were three main reasons why Portugal had a disappointing
economic performance during this period and, thus, failed to resume this "responsible"
growth. First, the authors cite lack of productivity growth. According to them,
productivity growth slowed down significantly after 2000, increasing the gap towards
OECD countries and, as such, a real adjustment would have to be made by cutting
nominal wages.
However, wages did increase during this period. Citing Blanchard (2007), Baer et al.
(2013) conclude that the economic boom of the late 1990s led to an overvaluation of labor
during the first years of the Euro. When this is coupled with slow growing productivity,
there results the loss of competitiveness - the second reason for Portugal's disappointing
performance.5
Departing from a less orthodox perspective, Garcimartín et al. (2011) develop upon the
concept that external relative prices were set wrong for Portugal during the first years of
the Euro (the real exchange rate was overvalued when the nominal exchange rate was
fixed in 1999). To validate this argument, the authors elaborate a stylized balance of
4 It is important to notice that Baer et al. (2013) consider that a moral hazard existed in both borrower and
lender sides for allowing "[...] a convergence with the richer economies of the EU in terms of benevolent
government" (idem, p. 350). 5 A third and final reason for the Portugal's disappointing performance was the existence of some structural
bottlenecks, very much in line with the neoclassical development literature. These authors consider that,
even though issues like cumbersome justice system, the under-par education and inefficient public
administration are commonly identified barriers to growth, these are especially significant in the case of
Portugal. To effectively promote sustainable growth, the authors conclude, these three barriers would have
to be addressed.

IE-UFRJ DISCUSSION PAPER: BASTOS; PORTO, TD 034 - 2016. 8
payments constrained model that incorporates temporary disequilibria and a role for
relative prices. This model is built on three premises: (i) income adjusts to external
disequilibria; (ii) capital flows may temporarily relax the BoP constraint (and the speed
in which exchange rates converge to their equilibrium values); and (iii) relative prices can
influence growth, at least in the short-run. Utilizing their stylized model, Garcimartín et
al. (2011) evaluate that:
"Portugal [...] has experienced a longer than usual stagnation because the return
to BoP equilibrium has taken a longer time than usual because no devaluation
- which could improve the BoP outcome - has occurred." (idem, p. 289)
In line with Blanchard (2007), these authors conclude that the return to equilibrium, for
Portugal and other European economies, will be a slow and difficult process of correcting
relative prices.
Leão & Palacio-Vera (2011), in their attempt to analyze why Portugal experienced a
steady divergence in terms of competitiveness, inflation and current account balances,
when compared to the central European economies, also take recourse to the setting or
relative prices. In these authors' perspective, Portugal's real effective exchange rate was
well above its equilibrium level, when nominal rates were fixed in 1999 - in line, for
example, with the assessment of Garcimarín et al. (op. cit.).
However it is important to notice that the argument advanced by Leão and Palacio-Vera
is very much in line with our structural thesis presented in section 3.b (further below).
According to Leão and Palacio-Vera (op.cit.), Portugal's current account deficits were
worsened by the following four trends: (i) a decline in the surplus of remittances; (ii) an
increase in the energy deficit; (iii) a growing external debt service and; (iv) fiercer direct
competition by both China and the EEC. On the other hand, the also authors point out
that these tendencies were a bit offset by: (i) a strong performance of service exports and
(ii) the stagnation of domestic demand (Leão and Palacio-Vera, op. cit, p. 14).
This concludes the presentation of the established literature for Portugal that shall be
utilized as a comparative benchmark. The following section provides a critical assessment
of the mentioned papers' arguments, in light of some stylized facts about Portugal's
economy.

IE-UFRJ DISCUSSION PAPER: BASTOS; PORTO, TD 034 - 2016. 9
3 Critical assessment of established theories
This section is dedicated to the appraisal of the theories presented on previous pages that
generally ascertained that Portugal's lackluster economic performance can be described
as derived from the excessive current account deficits possibly related to an excess in
government expenditure.
To this extent, it is imperative to first apprehend the extent in which the economic growth
in this country was truncated, and when. Thus, the following paragraphs attempt to
present a brief description Portugal`s growth trajectory, considering a longer timeframe
than just the Euro years, for comparison. The ensuing sub-sections analyze the evolution
of these current account deficits, their structural determinants and possible effects over a
small economy that belongs to a monetary union.
3.a Growth and unemployment
During the second half of XX century (and therefore, prior to joining the European
Monetary Union), Portugal displayed a long-lasting process of catching-up to central
European economies. As graph 1 (below) shows, Portugal's convergence trajectory begins
at the early 1960s and, in spite of some adverse shocks in 1975, 1984 and 1994, displays
an upward trend until 1999. This year marked a reversion of the convergence trajectory,
which, in turn, opened space for a divergence process. The first couple of decades from
the XXI century were marked by an increasing divergence between Portugal and the rest
of the Western European countries. The determinants of the slowdown in Portugal's
growth are the subjects under discussion.

IE-UFRJ DISCUSSION PAPER: BASTOS; PORTO, TD 034 - 2016. 10
Graph 1 - Portugal's per capita income as a percentage of Western Europe's and top 5 richest European countries6 averages, 1945-2010
Source: The Maddison Project7
When analyzing Portugal's GDP growth rate, as presented on graph 2 (below, left axis),
it is possible to notice that this country observed three distinct growth cycles from 1986
onwards (i.e. from joining the European Economic Community onwards), each one
milder than the previous. That is, while the first cycle, which ranges from 1986 to 1993,
was the most intense, the last one (from 2003 to 2007) was the mildest; whereas the in-
between cycle (from 1994 to 2002) was just milder than the first, yet more robust than
the last one. A period of successive recessions began after 2008 - but more recently, the
country appears to be initiating a new of cycle of very slow growth.
6 At the end of WWII, the richest European countries were: Denmark, Germany, Sweden, Switzerland and
the United Kingdom. The average of these five countries' per capita GDP was considered as the average of
Europe's top richest countries for the whole sample, for simplification. 7 http://www.ggdc.net/maddison/maddison-project/home.htm (2013 version, the latest as of September/16).
20%
30%
40%
50%
60%
70%
80%
1945
1948
1951
1954
1957
1960
1963
1966
1969
1972
1975
1978
1981
1984
1987
1990
1993
1996
1999
2002
2005
2008
Western Europe Average Top 5 Average
IE-UFRJ DISCUSSION PAPER: BASTOS; PORTO, TD 034 - 2016. 11
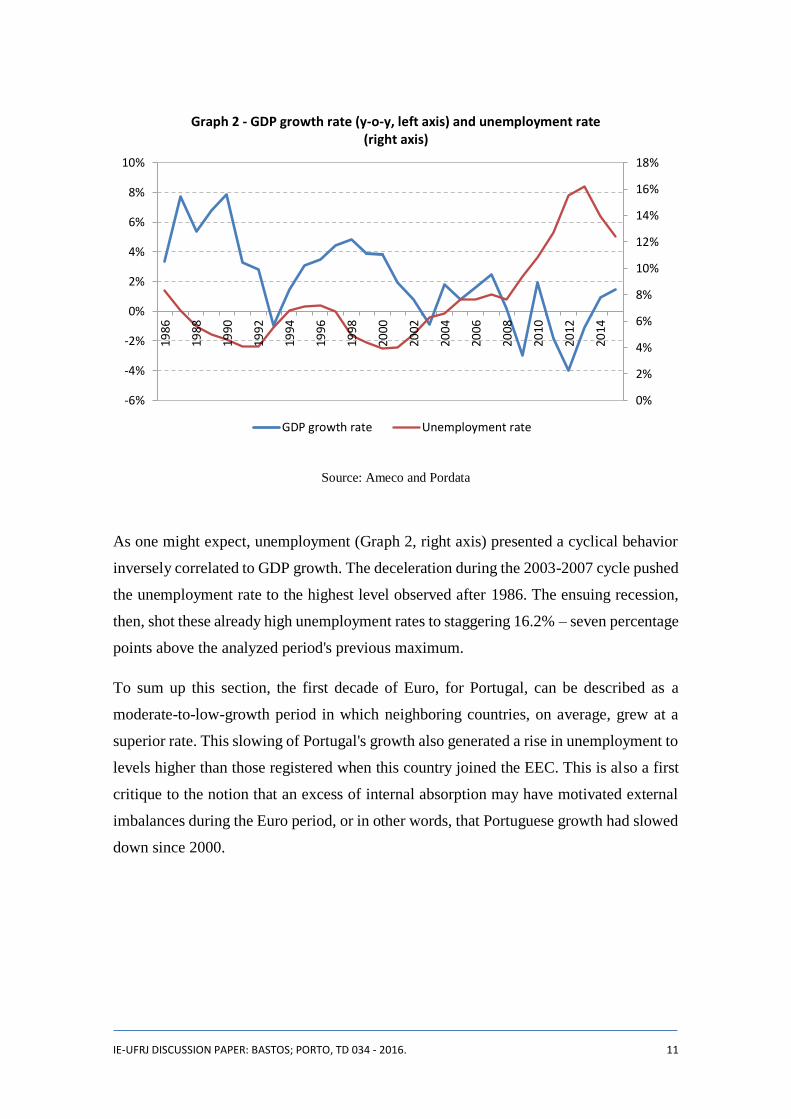
Graph 2 - GDP growth rate (y-o-y, left axis) and unemployment rate (right axis)
Source: Ameco and Pordata
As one might expect, unemployment (Graph 2, right axis) presented a cyclical behavior
inversely correlated to GDP growth. The deceleration during the 2003-2007 cycle pushed
the unemployment rate to the highest level observed after 1986. The ensuing recession,
then, shot these already high unemployment rates to staggering 16.2% – seven percentage
points above the analyzed period's previous maximum.
To sum up this section, the first decade of Euro, for Portugal, can be described as a
moderate-to-low-growth period in which neighboring countries, on average, grew at a
superior rate. This slowing of Portugal's growth also generated a rise in unemployment to
levels higher than those registered when this country joined the EEC. This is also a first
critique to the notion that an excess of internal absorption may have motivated external
imbalances during the Euro period, or in other words, that Portuguese growth had slowed
down since 2000.
0%
2%
4%
6%
8%
10%
12%
14%
16%
18%
-6%
-4%
-2%
0%
2%
4%
6%
8%
10%19
86
1988
1990
1992
1994
1996
1998
2000
2002
2004
2006
2008
2010
2012
2014
GDP growth rate Unemployment rate

IE-UFRJ DISCUSSION PAPER: BASTOS; PORTO, TD 034 - 2016. 12
3.b Current account deficits
To better analyze the performance of Portugal's current account deficits, we propose to
divide the analysis between two sets of periods, with the first one ranging from 1986 to
2010 and the second one, from 2011 forwards.
The first period is characterized by increasing current account deficits. As we attempt to
evidence on the next pages, on the run-up to the European Monetary Union, Portugal
went through a series of structural shocks that have, on aggregate, adversely impacted its
external deficits. These structural shocks shifted the level of current account deficits,
explaining the high values observed during the first decade of the Euro.
As graph 3, below, evidences, however, the post-2010 period was very successful in
reducing current account deficits, at the cost of a deep and lasting recession.
Graph 3 – Current account balances (left axis), GDP growth rate (y-o-y, left axis) and
export/import coefficients (% GDP, right axis), 1986-2015
Source: Ameco and Pordata
Historically, Portugal is a country that has had systematic trade and current account
deficits (Cabral, 2013, p. 28). These systemic trade deficits, in this sense, can be
15%
20%
25%
30%
35%
40%
45%
-15%
-10%
-5%
0%
5%
10%
1986
1988
1990
1992
1994
1996
1998
2000
2002
2004
2006
2008
2010
2012
2014
Critical Periods Current Account Balance
GDP real growth rate Import Coefficient
Export Coefficient

IE-UFRJ DISCUSSION PAPER: BASTOS; PORTO, TD 034 - 2016. 13
understood as the most relevant components of the recurring current account deficits.
Therefore, under normal circumstances, Portugal's current account deficit roughly
accompanied the trajectory of GDP, due to imports being an induced variable with a
relevant weight in external balances. This can be evidenced through graph 3 (above) if
one notices, for example, how current account deficits increased during the booms of
1986 and 1990 and how these deficits decreased during the 1993 and 2003 recessions.
Two critical periods, however, appear to have escaped this norm. From 1995 to 2000 and
2003 to 2008, Portugal registered a steady and significant increases in current account
deficits, even though: (i) the growth cycles that are contemporary to these deteriorations
in current balances are milder than the previous ones; and (ii) the contemporary growth
cycles begin to decelerate in some point, while current account deficits kept increasing.
As presented on graph 3 (dotted lines, right axis), Portugal registered significant increases
in its import coefficient after joining the EEC. This coefficient grew from less than 15%
of GDP, in 1986, to almost 40%, in 2010, with two of the most substantial increases
displayed in 95-00 and 03-08, that are mentioned above. After 2011, however, this
coefficient has mostly stabilized. The export coefficient, on the other hand, remained
practically flat for almost a decade, from 1995 to 2005 and only began to grow more
consistently from 2010 to 2013, also because the domestic GDP was decreasing while
some of Portugal's trade partners kept growing (even if at a slow pace). Fact is, however,
that Portugal has recently registered three years of trade surpluses (2013 to 2015)8, an
achievement that has previously occurred only during the World War II, when the exports
of weapons and ammunition to Germany, US and the UK also allowed for three years of
trade surpluses (1941 to 1943; cf. Cabral, 2013, p. 27).
This data for export and import coefficients provide for a first indication contrary to the
argument that a loss of competitiveness. After all, during this period, exports (as a
percentage of GDP) did not decrease (as would have been expected due to a loss of
competitiveness); if anything, the surge in current account deficits was motivated by an
increase in the import coefficient.
8 It appears so far that 2016 will also be year with trade surplus, making it four years in a row.

IE-UFRJ DISCUSSION PAPER: BASTOS; PORTO, TD 034 - 2016. 14
On the following paragraphs, we will take a deeper look of the determinants of these
increases in import coefficients. To critically assess the theories presented in section 2,
therefore, it is necessary to understand if the above detailed movements in exports and
imports (and, thus, in current account deficits) can be explained through a loss of
competitiveness (i.e. overvaluation of labor) or are, rather, consequences of adverse
shocks to an already limited productive structure.
3.c Structural shocks
If one refers once more to graph 3 (first grey box), it is possible to notice that, through
the 1995-2000 period, Portugal's current account deficits rose from 3.5 to approximately
10% of GDP. As already stated on previous paragraphs, this surge in current account
deficits occurred in a period in which GDP was growing slower to previous cycles and
extended beyond the peak of such cycle.
Most relevant, though, is that the deterioration of current account balances appears to
have exerted influence over following years. Excluding this transitional period out of the
sample and comparing the average current account deficit for pre-1995 and post-2000
years, the difference is very significant: 4.1% (current account balances passed from a
yearly average of -5.8% of GDP from 1986 to 1994 to a -9.9% average from 2001 to
2010).
In our understanding, this change can be better explained by two shocks that were
registered during this period, that have exerted larger influence Portugal's productive
structure (and, as such, its trade balance).
First, the increased trade openness of European markets towards Asian countries spurred
the downturn of Portugal's textile and clothing sectors. Although clothing accessories,
footwear and textile yearn were three of Portugal's most important industries and leading
exports for most part of the late XX century, these industries began facing decline after
1995, as a consequence of the Uruguay Round (1986-1994) of GATT9 negotiations, when
participant countries approved the Agreement on Textiles and Clothing that led to the
9 GATT (acronym for General Agreement on Tariffs and Trade) was renamed WTO (World Trade
Organization) after the referred event.

IE-UFRJ DISCUSSION PAPER: BASTOS; PORTO, TD 034 - 2016. 15
reduction of import barriers for textile and clothing products manufactured in
undeveloped countries.
It is important to notice that other authors, like Baer et al. (2013), also mention that, even
if Portugal had not observed any loss of competitiveness, the country could still be facing
economic difficulties due to the fact that it effectively competes internationally in low-
tech markets, with emerging economies - not central European economies. According to
Baer et al. (2013):
[...] the product mix (textiles, footwear, and furniture) of Portugal, to some
extent, is orthogonal to the product mix of the main European economies. This
is no longer true if we compare the (traditional) product mix of Portugal with
the product mix of some emerging economies where labor costs are just a
fraction of the labor costs in Portugal, and the productivity differences are not
sufficiently high to allow Portugal to continue being competitive in the usual
industries [...]" (p. 348).
The ratified measures were to be applied by EU countries from 1995 onwards, promoting
progressive cuts in trade tariffs. Southeast Asian countries (prominently China) could
then take over a larger portion of the European textile and clothing markets; while, on the
other hand, several Southern European countries that previously had large portions of this
market (most notably Portugal and Italy) were pushed out of it (Leão and Palacio-Vera,
2011), unable to compete with the low wages and overall competitiveness of the Asian
economies.
Hence, Portugal's textile and clothing manufactures, previous staples as relevant
Portuguese domestic product and exports, began to wane after 1995, with long lasting
consequences. As Cabral (2013, p. 27) states:
"[...] Portugal’s traditional goods export sector (e.g. textile and shoe industries)
experienced a cumulative nominal growth of -1.5% between 2000 and 2010.
This performance was likely the result of the EU-wide lowering of import
tariffs for sectors in which Portugal’s export sector was strongest [...] When
such traditional sectors are excluded from the analysis, goods exports grew, on
average, by 5.3% per year, which does not seem to support the hypothesis of a
large loss in competitiveness caused by the euro."

IE-UFRJ DISCUSSION PAPER: BASTOS; PORTO, TD 034 - 2016. 16
The second structural change was the expansion of Portugal's vehicle exports, which help
explain that increase in good exports (excl. textile and shoe industries) that were
mentioned by Cabral (op. cit., above). In 1995, the Auto Europa automobile factory began
its operations in Palmela (a small municipality near Lisbon), more than doubling
Portugal's automobile exports after its first year of operation.
Even though the automobile sector still amounted to a small portion of the whole
economy's added value (on average, the manufacture of motor vehicle amounted to
almost 1% of the total activity, from 1995 to 2013 10), road vehicles rapidly became
Portugal's most relevant and dynamic export after the opening of this factory. Thus,
growing vehicle exports were able to compensate for the receding textile and clothing
exports, maintaining Portugal's total exports relatively stable during the critical period.
On the import side, however, this generated a negative effect. Since the assembly line of
a vehicle is a long process, realized in several stages, the development of an intra-firm
trade to feed this industry is commonly observed. In a situation that resembles a Mexican
maquiladora, the Autoeuropa factory imported more than half of its utilized inputs11 for
almost a decade, exporting almost the entirety of produced units (which, by that time,
consisted only of three models that came from the same communal-design: Volkswagen
Sharan, SEAT Alhambra and Ford Galaxy).
Additionally, the import of proper automobiles rose considerably during this period (most
notably, the import of road vehicles destined to transport of goods and materials). Thus,
the sum of these two effects made the trade balance of the automobile sector to show a
net result that is far less encouraging than it could have been expected when the Auto
Europa project was designed. In fact, the construction of this factory had the negative
effect of raising the Portuguese import coefficient, once it generated the need to import
auto parts to conclude the cars’ assembly line.
Unfortunately, however, the loss of market share to China and the development of a
maquiladora automobile industry were not the only structural issues to impair Portugal's
situation in the long term. After the 1995-2000 "critical period", two additional structural
10 Source: OECD.stat. Data available at https://stats.oecd.org/Index.aspx?DataSetCode=SNA_TABLE6A. 11 This situation was progressively improved over the following years, however, to the extent that, in 2012,
62% of total inputs utilized by the Auto Europa factory were domestically produced.

IE-UFRJ DISCUSSION PAPER: BASTOS; PORTO, TD 034 - 2016. 17
shocks have also negatively affected Portugal's foreign accounts, after the Euro became
the national currency: on one side, the mounting international oil prices made energetic
inputs heavily costly imports, from 2002 forward; while on the other side, the larger
participation of Eastern European countries in continental European markets generated
harsh competition to Portugal's medium to high tech exports.
Since Portugal does not have the means to produce enough energetic inputs to sustain its
economy, once international oil prices began escalating after 2002, this country's
energetic trade deficit escalated at a similar pace, motivating the second "critical period"
(as displayed on graph 3). As a result, petroleum and its derived products became – by
far – Portugal's most cumbersome imports, sinking this country's balance of trades deeper
during this period.
After countries such as Poland, Czech Republic, Slovakia and Hungary joined the
European Union, Portugal's medium to high tech exports began facing fiercer competition
in the European market. The advantageous combination of lower wages, more skilled
labor force and of course the proximity with Germany, of these Eastern European
countries, not only pulled away some of Portugal's market share, but also drew most of
the high tech FDI that was previously destined to other peripheral European countries,
such as Portugal (Leão and Palacio-Vera, op. cit.). The combination of the
aforementioned China and Eastern Europe effects obligated Portuguese exporters to
search for markets away from North and Central European countries. Thus, non-European
countries turned more and more into a common destination for Portugal's exports, as
opposed to the reduced participation of exports to, say, Germany12.
While some of these events have also been mentioned, in a form or another, by many of
the papers that are presented in section 2 of this analysis, our main point of contention
lies in understanding that nominal or real wage cuts would have little to no effects in
addressing this country's structural current account deficits. Blanchard (2007), for
12 Nevertheless, Portugal was able to explore the proximity to its fast-growing neighbor, Spain, as a source
of external demand. During the first years of the Euro, Spain displayed an accelerated growth process
(somewhat similar to that displayed by Portugal earlier, from 1986 to 1992). The proximity to this country
allowed some of Portugal's industries – such as non-metallic minerals, fabricated metals and supply of
natural gas and petroleum products – to explore the Spanish excess of internal absorption to Lusitanian
favor. Needless to say, the aforementioned industries were some of those that most grew during the 1999-
2008 period.

IE-UFRJ DISCUSSION PAPER: BASTOS; PORTO, TD 034 - 2016. 18
example, cites that, due to "composition effects" in exports and a reduction in remittances,
the current account balances would still have deteriorated, independently of a boom-
induced overvaluation of wages (Blanchard, op. cit., p. 7). Werner et al. (op. cit., p. 348)
argue that large differences in unit labor costs with emerging markets would not allow
Portugal to continue being competitive in usual, low tech industries and, as such, Portugal
would still be facing financial and economic difficulties, even if the country had not lost
competitiveness towards other European economies. Leão and Palacio-Vera (op. cit.)
center their arguments on the effects of a series of structural shocks that were observed
on top of already adverse setting of relative prices13.
In effect, what these adverse structural shocks evidence is that Portugal was - and still is
- sandwiched in between Europe's more developed countries and the world's less
developed ones, when it comes to international trade. The latter have the expertise to be
more competitive in higher value added exports of goods and services, while, the former
have much lower wages that allow them to be more competitive in low-tech
manufactures. In this scenario, could internal devaluations achieve relevant results?
Felipe and Kumar (2011) provide an interesting reply:
"What would an across-the-board reduction in nominal wages of 20%–30%
achieve? The most obvious effect would be a very significant compression of
demand. But would this measure restore competitiveness? We argue that it
would not allow many firms to compete with German firms, which have a
different export basket, and in all likelihood it will not be enough to be able to
compete with China’s wages." (pp. 27-28)
Given the current productive structure, unless reductions in nominal wages are large
enough to make Portuguese worker earn as much as a their emerging markets competitors,
any period of prolonged, positive growth will still lead to increases in trade deficits.
Perhaps, one alternative to counter this situation, that does not involve a long-term
redefinition of Portugal's productive capabilities, would be to generate an increase in
13 Garcimartín et al. (2013) is, among the papers mentioned in Section 2 that directly approached the case
of Portugal, the only one that did not explicitly mention matters related to this country's productive
structure.

IE-UFRJ DISCUSSION PAPER: BASTOS; PORTO, TD 034 - 2016. 19
international transfer inflows14, to offset the impacts of trade account deficits over the
current account balance.
If increases in international transfer are not feasible and a redrawing of a nation's
productive capabilities may take a longer time span, is curbing national absorption in
order to restrain structural external balances a warranted policy? The next section aims to
answer this question, shedding light on the effects of current account deficits for a small
economy that belongs to a monetary union.
3.d Current account deficits in a monetary union
The infamous debate on the economics of Target 2 balances, deflagrated by the 2011
paper from Bindseil and König, shall provide more clarity on the effects of current
account deficits inside a monetary union. This debate, although originally ill conceived
to indicate that Germany was unwittingly financing the current account deficits of
peripheral European economies, prompted more attention to the currency settlement
system that is central to the establishment and well functioning of the EMU.
Without delving into the controversies involved in this debate, what is important to
observe is that T2 balances act as automatic stabilizers for the balance of payments of
Eurozone countries. In effect, T2 deficits are registered at the financial accounts of
member countries whenever a current account transaction with another member country
fails to meet a corresponding balance on the financial account. In normal circumstances,
these corresponding, financial account balances are obtained via interbank settlement
operations; when these interbank operations are, for any specific reason, not being
realized, T2 balances increase across the EMU.
Therefore, if this settlement system is working correctly (which it should be, since it is a
precondition to the proper functioning of a monetary union), no subset of Eurozone
countries may face an external crisis due to a shortage of liquidity to honor payments
14 One interesting solution was, interestingly enough, appointed by Blanchard (op. cit.). The French
economist proposed that Portugal followed the "Florida model", according to which the country could
become a coveted destination for retired Europeans. This could provide for increased in private transfer
inflows, effectively mitigating the impacts of the structural trade deficit over current account balances.

IE-UFRJ DISCUSSION PAPER: BASTOS; PORTO, TD 034 - 2016. 20
abroad. Liquidity is automatically provided for them if there is enough eligible collateral
available. According to Cechetti et al. (2012):
"In the case of the Eurosystem, TARGET2 does a job similar to creating
foreign exchange reserves for the country that is suffering the balance of
payments crisis. The only limit on capital outflows, and the only limit on the
liability that the country’s central bank can amass with respect to the remainder
of the Eurosystem, is the collateral that the country’s banks have available to
bring to the refinancing operation. But since the system operates automatically,
there is no natural break." (Cecchetti et al., op. cit., p. 5)
What this effectively means for Portugal and other peripheral European economies is that
external imbalances should not be considered for their (non-existent) impact in prompting
balance of payments crisis. The external sector, in this sense, can only impact growth by
acting as both a drain to effective demand (i.e. imports) or a driver to it (i.e. exports); it
cannot, however, provide for a barrier to growth when there is an insufficiency of foreign
currencies15.
This concludes our analysis of the critical arguments contrary to the theories presented in
section 2, by indicating the possible and limited extent to which the external sector might
act as a constraint to growth (i.e. only as a drain to effective demand). What the next
section achieves is to propose a more theory for the driver's of Portugal's growth (or lack
thereof) that more adequately relates to the arguments and data presented in this section.
15 To present a counterpoint: this role for the external sector, in both providing and requiring foreign
currencies, is especially relevant for emerging economies, since a healthy flow of foreign currencies is
necessary for these countries to finance growth (via imports of capital goods that are not produced
internally).

IE-UFRJ DISCUSSION PAPER: BASTOS; PORTO, TD 034 - 2016. 21
4 Growth accounting
In this fourth and final section (barring the concluding remarks), we attempt to present an
alternative narrative for the reasons to Portugal's low-to-negative growth during the Euro
years, with a special focus on the behavior of public expenditure using the Supermultiplier
approach (Serrano, 1996) to calculate the contributions to growth. The behavior of public
expenditure, related both to the trajectory of public finances and the contribution to the
growth of GDP, is a central element in this study since, as we tried to stress before, it is
presented as one of the main culprits for Portuguese economic problems.
The methodology utilized in the current analysis is based on Freitas and Dweck (2013),
which have developed a routine for disaggregating growth components in order to better
grasp the contributions of autonomous and induced expenditures in a manner that best
relates to the Supermultiplier theory. The original method was developed for analyzing
Brazil's economy; for the current analysis, we will transpose it to the case of Portugal.
According to this model, aggregate imports, private enterprise investment and household
consumption are considered induced expenditures, while the remaining components of
demand (households consumption of durable goods, government consumption,
residential investment, government investment and exports) are considered exogenous
expenditures (cf. Freitas and Dweck, op.cit, p. 165 et passim).
We also consider a general share of domestic content (𝜇), household propensity to
consume (c) and a private enterprise propensity to invest (h). It is important to notice that,
for the current model, ℎ is considered an endogenous variable, determined according to
the distance between normal and effective capacity utilization rates. It is paramount for
the sraffian supermultiplier model that the propensity to invest is endogenously
determined, according to the capacity utilization gap. This way, ℎ fluctuations guarantee
that the capacity utilization rates oscillate around their normal values.
According to these hypotheses, the supermultiplier formula is as follows (see Freitas &
Dweck, op.cit., for the derivation of this equation):
(1) 𝛼 = [𝜇
1 − 𝜇(𝑐 + ℎ)]

IE-UFRJ DISCUSSION PAPER: BASTOS; PORTO, TD 034 - 2016. 22
Considering that the GDP level can be determined as the product between the
supermultiplier and aggregate exogenous expenditures, Freitas & Dweck (2013) derive
that it is possible to decompose the growth rate the following way16:
(2) 𝑔 = 𝛼(𝑡) [𝐶𝐻𝑁𝐷(𝑡0)
𝑌(𝑡0)] 𝑔𝑐 + 𝛼(𝑡) [
𝐶𝐻𝐷(𝑡0)
𝑌(𝑡0)] 𝑔𝐶𝐻𝐷
+ 𝛼(𝑡) [𝐶𝐺(𝑡0)
𝑌(𝑡0)] 𝑔𝐶𝐺
+ 𝛼(𝑡) [𝐼𝑃𝐸(𝑡0)
𝑌(𝑡0)] 𝑔ℎ + 𝛼(𝑡) [
𝐼𝐻(𝑡0)
𝑌(𝑡0)] 𝑔𝐼𝐻
+ 𝛼(𝑡) [𝐼𝐺(𝑡0)
𝑌(𝑡0)] 𝑔𝐼𝐺
+ 𝛼(𝑡) [𝑋(𝑡0)
𝑌(𝑡0)] 𝑔𝑋 + 𝛼(𝑡) [
1
𝜇(𝑡)] 𝑔𝜇 + 𝛼(𝑡) [
𝐸(𝑡0)
𝑌(𝑡0)] 𝑔𝐸
Here, 𝑔 indicates the GDP growth rate, and 𝑔𝑖 , the growth rate of variable i; all growth
rates are measured between times 𝑡0 and 𝑡. 𝑌 is the gross domestic product and 𝑀, total
imports; 𝐶𝐻𝐷 indicates household consumption of durable goods and 𝐶𝐻𝑁𝐷, household
consumption of non-durable goods17; 𝐼𝐻 stands for total household investment18, 𝐼𝑃𝐸,
private enterprise investment and 𝐼𝐺, public investment; lastly, 𝑋 stands for aggregate
imports. Finally, 𝐸 stands for stock variations.
With these equations at hand, all that is left is to add the required data. For the current
analysis, all data utilized was obtained from the annual national accounts (ESA 2010
series) provided by INE ("Instituto Nacional de Estatística")19.
4.1. Determinants of growth - 1999-2015
Given the drastic differences in the behavior of Portugal's economy before and after the
eruption of the Global Financial Crisis, we opted to divide the analysis between two
periods: 1999-2007 and 2008-20015 (the latest observation available at the writing of this
16 For a complete presentation of how this equation is derived, see Freitas and Dweck, (op. cit., Appendix
A) 17 For the purposes of this paper, non-profit institutions serving households (NPISH) total consumption
were added to household consumption of durable goods. This comes from the hypothesis of this kind of
consumption being also a sort of autonomous expenditure. 18 Household investment also includes NPISH investment. 19 Available at https://www.ine.pt/xportal/xmain?xpid=INE&xpgid=ine_cnacionais.

IE-UFRJ DISCUSSION PAPER: BASTOS; PORTO, TD 034 - 2016. 23
paper20). The following table presents the average contributions from each selected
component, for the first period.
Table 1 – Average growth contributions of selected aggregate demand components, 1999-2007
Domestic Sector External Sector
Inventory Change
Total
Autonomous Expenditure
Super multiplier
Inventory Change Public Private
CG 0.96% 0.96%
IG -0.16% -0.16%
CHD 0.17% 0.17%
CHND 0.47% 0.47%
IPE -0.03% -0.03%
IH -0.19% -0.19%
μ -0.33% -0.33%
X 1.55% 1.55%
E -0.03% -0.03%
Total 0.81% 0.41% 1.23% -0.03% 2.41% 2.33% 0.11% -0.03%
Source: Authors' elaboration (INE database)
Regarding the left-hand side of table 1, it is interesting to notice that the domestic and
external sectors generated almost identical average contributions towards this period's
overall growth. If anything, this goes to show the frailty of domestic demand in Portugal
during the early Euro years, since it failed to surpass the contributions of the external
sector with regards to a country that, as we presented on section 3, has a very limited
productive structure and, on top of that, found itself competing for the European markets
with both emerging Eastern European economies.
Apart from exports, government consumption provided the most relevant contributions
to Portugal's growth between 1999-2007. Due to its relevance in the current debate,
government contributions are discussed with more detail in a dedicated section. However,
it is important to stress that public disinvestment provided for negative contributions
20 It is important to notice that data for 2014 and 2015 is still provisional, subject to scheduled reassessments
in upcoming occasions.

IE-UFRJ DISCUSSION PAPER: BASTOS; PORTO, TD 034 - 2016. 24
during this period. This process is observable throughout the analyzed sample, evidencing
the consequences of shortsighted attempts to promote fiscal consolidation.
Private sector consumption also provided for some positive contributions to growth,
although at a very slow pace. All other components, however, had negative contributions
(e.g. the -0.25% average contribution from household investment and the -0.03% average
contribution from private firms' fixed capital formation). This implies that investment (be
it autonomous or induced; originated from private enterprises, households or public
institutions) was in fact being reduced, even before the Global Financial Crisis adversely
hit the Portuguese markets.
In short, what table 1 tells us is that Portugal's growth during the 1999-2007 period was
mostly due to exports and government consumption. Now table 2, below, shows the same
information discussed before to the period after 2008.
Table 2 – Average growth contributions of selected aggregate demand components, 2008-2015
Domestic Sector External Sector
Inventory Change
Total
Autonomous Expenditure
Super multiplier
Inventory Change Public Private
CG -0.40% -0.40%
IG -0.20% -0.20%
CHD -0.33% -0.33%
CHND 0.46% 0.46%
IPE -0.68% -0.68%
IH -0.53% -0.53%
μ -0.07% -0.07%
X 1.44% 1.44%
E -0.08% -0.08%
Total -0.60% -1.07% 1.37% -0.08% -0.39% -0.02% -0.28% -0.08%
Source: Authors' elaboration (INE database)
The first striking aspect of this period is that overall growth was, on average, of -0.39%.
In effect, the level of Portugal's real GDP was lower in 2015 than it was in 2007 - even
though the economy began to recover in 2014.

IE-UFRJ DISCUSSION PAPER: BASTOS; PORTO, TD 034 - 2016. 25
This slump could have been even more acute if not for the steady behavior of this
country's exports. With a 1.44% average contribution to growth, exports once again figure
as the most relevant source of effective demand for Portugal. Apart from the expenditure
coming from the external sector, there are not many other components to Portugal's
economy. Household non-durable consumption produced a modest positive contribution
to contribution to growth, similar to what it did in the previous period - and that's it.
Private firms, governments and households accelerated the disinvestment process, while
the latter also cut down expenditure in durable goods. Most relevant, however, is that
government also realized very significant cuts in consumption (the most dramatic cuts
registered in 2012), so that the public sector as a whole accounted for a relevant role the
post-2008 economic slump.
This behavior is also reflected on the trend of the variable h, the propensity to invest of
private firms (see graph 4, below). This is on line with what the Supermultiplier theory
regarding induced investment would prescribe. When the rate of growth slows down, the
induced propensity to invest adjusts accordingly: this variable is reduced as well,
promoting the adjustment of the capacity utilization rate to the new levels of effective
demand. The opposite occurs when the rate of growth recovers.
Graph 4 - Private enterprises' propensity to invest (h), 1999-2015
Source: Author's elaboration (INE database)
0,08
0,09
0,10
0,11
0,12
0,13
0,14
0,15
1999
2000
2001
2002
2003
2004
2005
2006
2007
2008
2009
2010
2011
2012
2013
2014
2015

IE-UFRJ DISCUSSION PAPER: BASTOS; PORTO, TD 034 - 2016. 26
Summarizing what was presented so far, Portugal's growth was slowing down during the
1999-2007 timespan (especially when compared with the fast catching-up process
displayed by this country during the late 80s/early 90s). The growth accounting method
employed demonstrated that, among the exogenous demand components analyzed, public
consumption and exports were the main factors of this slow, yet positive growth.
However, a period of successive recessions followed after 2008, motivated largely by the
slowdown in public consumption. To further evidence the weight that this reduction in
government consumption had in turning a period of slow growth into successive
recessions, a comparison between the growth components for the two periods (1999-2007
x 2008-2015), as displayed in tables 1 and 2, is presented on the following graph.
Graph 5 - Comparison between average growth contributions from selected demand
components, 1999-2007 x 2008-2015
Source: Authors' elaboration (INE database)
What is important to notice once we compare the results of both tables 1 and 2, above, is
that average contributions from exports are almost unchanged from the first (1.55%) to
the second period (1.44%). This comparison highlights that Portugal´s economy is not
export-led - that is, the export drive is not able to pull the economy as a whole or,
alternatively, to affect the private sector and therefore lead to a higher rate of growth.
Once public expenditure fell, the economy moved in the same direction.
-1,0%
0,0%
1,0%
2,0%CG
IG
CHD
CHND
IPEIH
μ
X
E
1999-2007 2008-2015

IE-UFRJ DISCUSSION PAPER: BASTOS; PORTO, TD 034 - 2016. 27
Since the public sector expenditure is a crucial variable to understand the performance of
Portugal's economy during the analyzed period, we will take a closer look to its behavior
in the following paragraphs, bearing in mind that during the moment of moderate growth,
between 1999 and 2007, this expenditure component was one of the two main positive
contributors to economic growth and that the fiscal consolidation that was pursued after
2010 is at the root of the dismal performance of Portuguese economy (or, in other words,
domestic private sector expenditure never picked up the slack of the Portuguese
economy).
Graph 6, below, shows that from 1999-2007 there is a noticeable downward tendency of
the rate of growth of public expenditures. Therefore, policies to limit public expenditure
were already in previously to the fiscal consolidation realized under the auspices of the
“troika” (IMF, European Commission, and the European central Bank). In effect,
Portuguese public finances were getting "sounder" until 2007. As response for he 2008
crisis it is possible to identify a countercyclical fiscal policy, drastically reversed in 2011.
Graph 6 – General government's expenditure (y-o-y growth, left axis), net lending (% GDP) and public debt, 1999-2015
Source: AMECO
0%
20%
40%
60%
80%
100%
120%
140%
-20%
-15%
-10%
-5%
0%
5%
10%
1999
2000
2001
2002
2003
2004
2005
2006
2007
2008
2009
2010
2011
2012
2013
2014
2015
Public debt Expenditure (y-o-y growth)
Net lending Net lending (excl. interests)
IE-UFRJ DISCUSSION PAPER: BASTOS; PORTO, TD 034 - 2016. 28
The trend before 2008 is explained by the failed attempts to comply with Stability and
Growth Pact21. The combination of countercyclical measures and the fall of aggregate
product after 2008 explains that, in spite of the adjustment policies, both public deficit
and debt jumped to considerably higher levels. The more recent effort to reduce the
primary deficit did not have a substantial impact on the overall net lending necessities
due to the larger amount of interest services on (a large) public debt22. In 2015, for
example, these outlays responded to approximately 10% of total public expenditure.
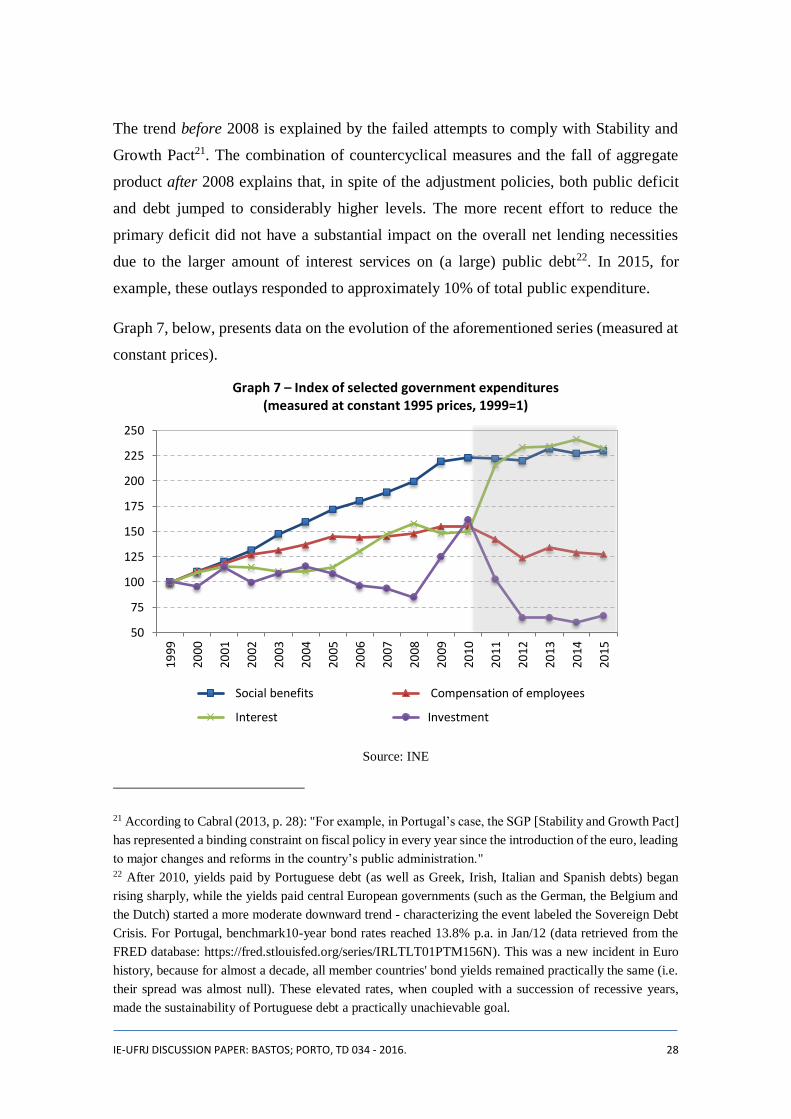
Graph 7, below, presents data on the evolution of the aforementioned series (measured at
constant prices).
Graph 7 – Index of selected government expenditures (measured at constant 1995 prices, 1999=1)
Source: INE
21 According to Cabral (2013, p. 28): "For example, in Portugal’s case, the SGP [Stability and Growth Pact]
has represented a binding constraint on fiscal policy in every year since the introduction of the euro, leading
to major changes and reforms in the country’s public administration." 22 After 2010, yields paid by Portuguese debt (as well as Greek, Irish, Italian and Spanish debts) began
rising sharply, while the yields paid central European governments (such as the German, the Belgium and
the Dutch) started a more moderate downward trend - characterizing the event labeled the Sovereign Debt
Crisis. For Portugal, benchmark10-year bond rates reached 13.8% p.a. in Jan/12 (data retrieved from the
FRED database: https://fred.stlouisfed.org/series/IRLTLT01PTM156N). This was a new incident in Euro
history, because for almost a decade, all member countries' bond yields remained practically the same (i.e.
their spread was almost null). These elevated rates, when coupled with a succession of recessive years,
made the sustainability of Portuguese debt a practically unachievable goal.
50
75
100
125
150
175
200
225
250
1999
2000
2001
2002
2003
2004
2005
2006
2007
2008
2009
2010
2011
2012
2013
2014
2015
Social benefits Compensation of employees
Interest Investment

IE-UFRJ DISCUSSION PAPER: BASTOS; PORTO, TD 034 - 2016. 29
It is important to notice, the jump of interest outlays is accompanied by a fall in public
investment, which, in terms of long run growth, has a strong negative impact. This
decrease in public investment directly curbed efforts to promote structural reforms, while
also indirectly reducing private induced expenditures (among which, private investment).
So, even though the negative short-term effects of the pre-crises austerity measures
promptly materialized (and, as such, are more easily noticeable), these long-term effects
are harder to measure - however important they may be.
Contrarily to public investment, the two main components of public expenditure (social
transfers and employees compensation), are more rigid. Attempts to overcome this will
face not only constitutional and legal barriers, but also social resistance, given the social
and distributive impacts of such measures.

IE-UFRJ DISCUSSION PAPER: BASTOS; PORTO, TD 034 - 2016. 30
5 Concluding remarks
This paper tried to show that the objective description of the origins and developments of
Portugal´s 2008 crisis does not fit within a model that is applied by some specific
interpreters for this country, and, in general, to describe the behavior of Southern
European countries as a whole.
It is not true that prior to the crisis Portugal could have been characterized as adopting a
profligate fiscal policy that was pushing the economy beyond its potential output and
causing serious problems. Such policy would have affected not only Portugal´s public
finances, but also its trade balance, both directly, through an increase in external savings
and, indirectly, by raising labor unit costs and reducing external competitiveness.
What we tried to show was that Portugal has a historical tendency to register trade balance
deficits, which reflect weaknesses in its productive structure. Unfortunately, these
limitations became even more pronounced as a consequence of important changes in the
external environment, like China’s rise as an exporter of low value manufactured goods
and the relevance of Eastern Europe as a source of cheaper skilled labor.
We also pointed out that these trade deficits could hardly result in a balance of payments
crisis for Portugal, even if the deficits are derived from structural limitations, and not
from a supposed temporary disequilibrium position caused by incorrect fiscal policies.
Within a monetary union the external deficit with European countries is automatically
financed and an eventual deficit with countries outside the monetary union can easily be
financed by European reserves.
Nonetheless, if it is true that Portugal's external deficit is not a problem in terms of the
ability to finance it, a lack of competitiveness could still be an issue in terms effective
demand. Assuming that the rate of growth in the long run is given by the trajectory of
autonomous expenditures, the lack of external competitiveness, reflecting a fragile
productive structure, compromises one important element of long run autonomous
expenditure: exports. Even if efforts at modernization took place in certain areas, such as
the auto industry, the lack of a solid industrial fabric would lead to strong leaks in terms
of imported components. Indeed, what our growth accounting exercise evidenced is that
Portugal's exports (chiefly among which, automobiles) provided some of the most
relevant growth contributions in both pre- and post-crisis periods, with very similar

IE-UFRJ DISCUSSION PAPER: BASTOS; PORTO, TD 034 - 2016. 31
average growth rates during each of these two moments, and yet ultimately failed to
contain the ensuing succession of recessive years.
This deficiency leaves Portugal with only two other options for generating economic
growth. The first would be credit expansion. Given general economic conditions after
2008, it is hard to imagine that, in an economy with a high rate of unemployment, a surge
in private credit for consumption could occur. If, for example, the private rate of interest
were very high with space for substantial decreases that could stimulate the private sector
to make loans, then this would be a short-term alternative, but it is not the case. The
second alternative would be an increase in public expenditure, but this demand
component is currently under the spell of the “Fiscal Consolidation” demanded by the so-
called “troika”.
Without any perspective of an increase in autonomous demand components, the prospects
for Portugal's economy are bleak. It is obvious too that the fiscal expenditure has a
hierarchical priority over the other components. The growth decomposition presented in
this paper showed clearly the importance of public expenditure to determine the trajectory
of the Portuguese economy. The decrease in government expenditure explains both the
deceleration after 2001 and the dismal performance after 2008. Private domestic
components never had the leading role in driving growth, and, particularly, the propensity
to invest decreased as expected by the fall in the rate of output growth. It would be almost
a matter of faith to believe that a “surge in confidence" would lead to an increase in private
investment without any real sign of future demand increases.
Therefore, a full economic recovery in Portugal, and the establishment of a higher growth
path, depends on the end of Fiscal Consolidation policies. We showed also that the latter,
given the public expenditure structure in Portugal, will hit social security recipients and
civil servants the hardest, with negative social impacts.
However, given the structural aspects described in this paper, the increase in public
expenditure necessary to put Portugal on a path of solid growth should emphasize
elements that could alter the productive fabric in a broad sense. Public investment has a
central role in this policy choice but different measures in terms of technological transfers
would be necessary to change the Portuguese economic structure, giving this country the
ability to compete in more dynamic export markets and allowing, at the same time, for

IE-UFRJ DISCUSSION PAPER: BASTOS; PORTO, TD 034 - 2016. 32
the creation of jobs in high productivity sectors. Of course this type of structural change
program is very different from the current policy of fiscal consolidation, but it is not
unusual as a regional policy within a given country: attempts to develop capacities in
poorer regions in order to achieve a more integrated and homogeneous national economy.
The present adjustment imposed on Portugal is a testimony to the distance between the
progressive ideals that gave rise to the European Union and the present regressive agenda.

IE-UFRJ DISCUSSION PAPER: BASTOS; PORTO, TD 034 - 2016. 33
7 References
Baer, W., Dias, D., Duarte, J. (2013). The economy of Portugal and the European Union:
From high growth prospects to the debt crisis. The Quarterly Review of Economics and
Finance, 53 (4): 345-352.
Bindseil, U., König, P. (2011). The economics of Target 2 balances. SFB 649 Discussion
Paper, 35: 1-28.
Blanchard, O. (2007). Adjustment within the euro: The difficult case of Portugal.
Portuguese Economic Journal, 6(1): 1–21.
Cabral, R. (2013). The Euro Crisis and Portugal’s Dilemma. Intereconomics, 48 (1): 27-
32.
Cecchetti, S., McCauley, R. & McGuire, P. (2012). Interpreting Target 2 balances. Bank
of International Settlements: Working Papers, 393: 1-16.
Cesaratto, S. (2011). The European Crisis: Political and institutional failures or method
in the madness? International Development Economics Associates, News Analysis.
Available at: http://www.networkideas.org/news/jan2011/news28_European_Crisis.htm
Cesaratto, S., Stirati A. (2011). Germany and the European and Global Crises. Quaderni
del Dipartimento di Economia Politica, 607: 1-34.
Felipe, J., Kumar, U. (2011). Unit Labor Costs in the Eurozone: The Competitiveness
Debate Again. Levy Institute of Economics: Working Paper No. 651.
Freitas, F., Dweck, E. (2013). The Pattern of Economic Growth of the Brazilian Economy
1970-2005. In Levrero, S., Palumbo, A. & Stirati, A. (eds.) Sraffa and the Reconstruction
of Economic Theory, volume II: aggregate demand, policy analysis and growth. London:
Palgrave Macmillan.

IE-UFRJ DISCUSSION PAPER: BASTOS; PORTO, TD 034 - 2016. 34
Garcimartín, C., Rivas, L. & García Martinez, P. (2011). On the role of relative prices
and capital flows in balance-of-payments constrained growth: the experiences of Portugal
and Spain in the euro area. JPKE, 33 (2): 281-305.
Higgins, M., Klitgaard, T. (2011). Saving Imbalances and the Euro Area Sovereign Debt
Crisis. NY FED: Current issues in economic and finance, 17 (5): 1-11.
Leão, P., Palacio-Vera, A. (2011). Can Portugal Escape Stagnation without Opting Out
from the Eurozone? Levy Institute of Economics: Working Paper, 664: 1-27.
Papadimitriou, D., Wray, R. (2012). Euroland's Original Sin. Levy Institute of Economics:
Policy Note, 2012/8: 1-5.
Pisany-Ferry, J. (2012). The Euro Crisis and New Impossible Trinity. Bruegel Policy
Contribution, 2012.1: 1-16.
Serrano, F. (1995). Long period effective demand and the sraffian supermultiplier.
Contributions to Political Economy, 14 (1).
________ . (1996). "The Sraffian Supermultiplier", unpublished dissertation, Cambridge
University, England.
Summers, L. (2015). Demand side secular stagnation. The American Economic Review,
105(5): 60-65.