Decomposing the Change in GDP per capita Using Rwanda as an Example Paul Cichello May 1, 2009 The...
13
Decomposing the Change in GDP per capita Using Rwanda as an Example Paul Cichello May 1, 2009 The Employment Lab: New Diagnostic Tools for Employment Focused Development
-
Upload
piers-nash -
Category
Documents
-
view
215 -
download
0
Transcript of Decomposing the Change in GDP per capita Using Rwanda as an Example Paul Cichello May 1, 2009 The...

Decomposing the Change in GDP per capita
Using Rwanda as an Example
Paul Cichello
May 1, 2009The Employment Lab:
New Diagnostic Tools for Employment Focused Development

Basic Trends, 2000-2006 Source: MINECOFIN (GDP), eicv1 & eicv2 (Employment and Population)
20002001 RWF
(US$)*
20062001 RWF
(US$)*
∆ % ∆ Annual Growth
Rate
GDP per capita
80,987($857)
97,847($1,036)
16,859($179)
20.8% 3.2%
Employment (1000s)
3,495 4,002 507 14.5% 2.3%
Poverty Headcount
.604 .569 -.035 -5.9% -1.0%
* 94 2001 RWF = $1 US (PPP)
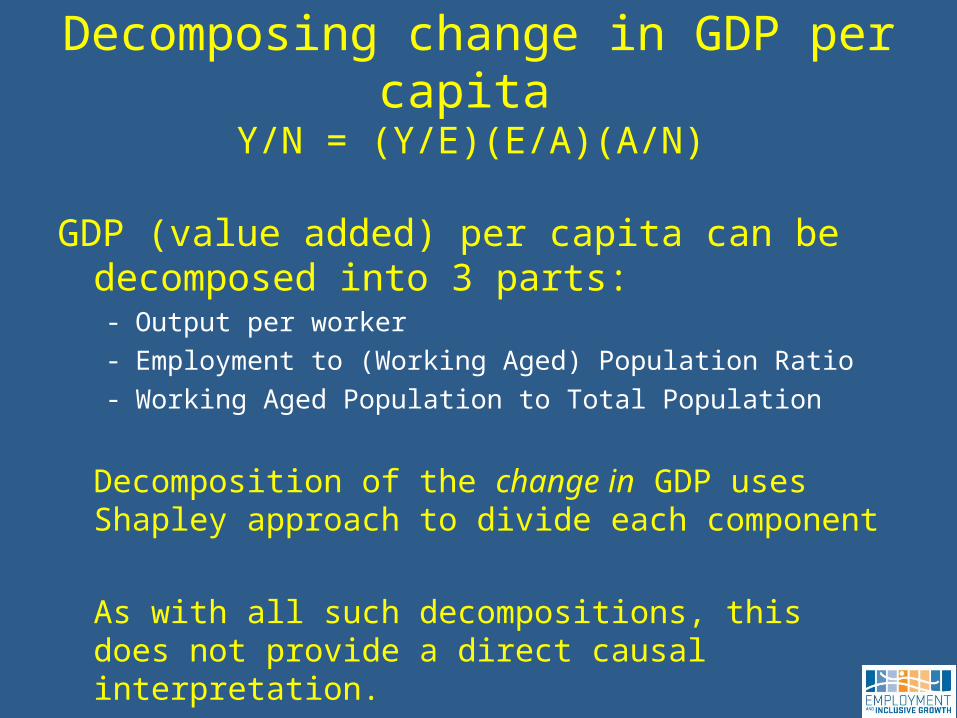
Y/N = (Y/E)(E/A)(A/N)
GDP (value added) per capita can be decomposed into 3 parts:- Output per worker- Employment to (Working Aged) Population Ratio - Working Aged Population to Total Population
Decomposition of the change in GDP uses Shapley approach to divide each component
As with all such decompositions, this does not provide a direct causal interpretation.
Decomposing change in GDP per capita
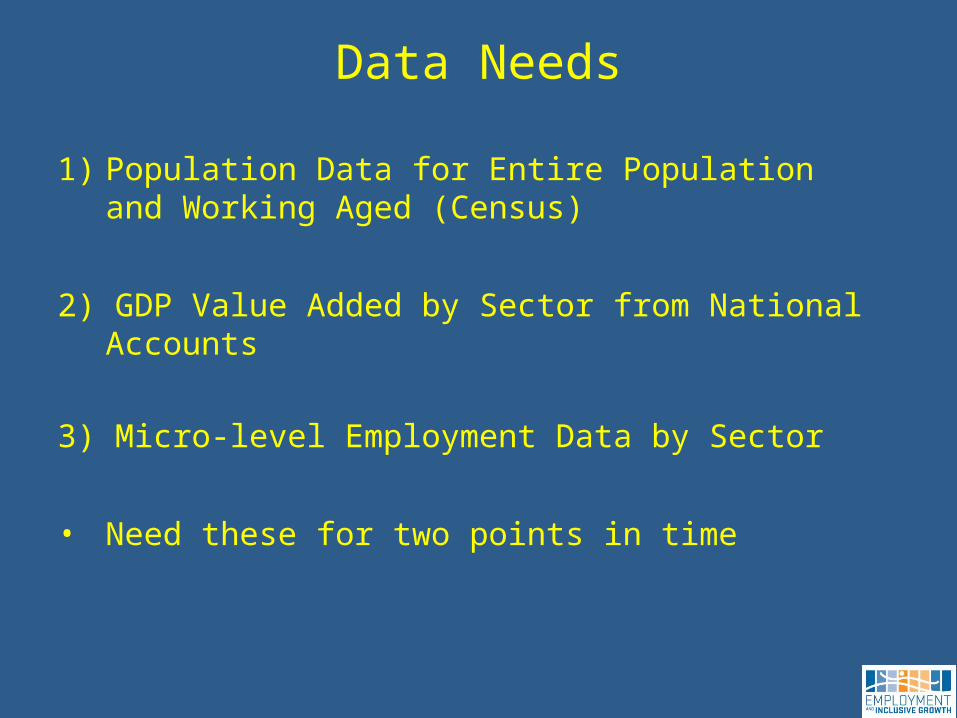
Data Needs
1) Population Data for Entire Population and Working Aged (Census)
2) GDP Value Added by Sector from National Accounts
3) Micro-level Employment Data by Sector
• Need these for two points in time

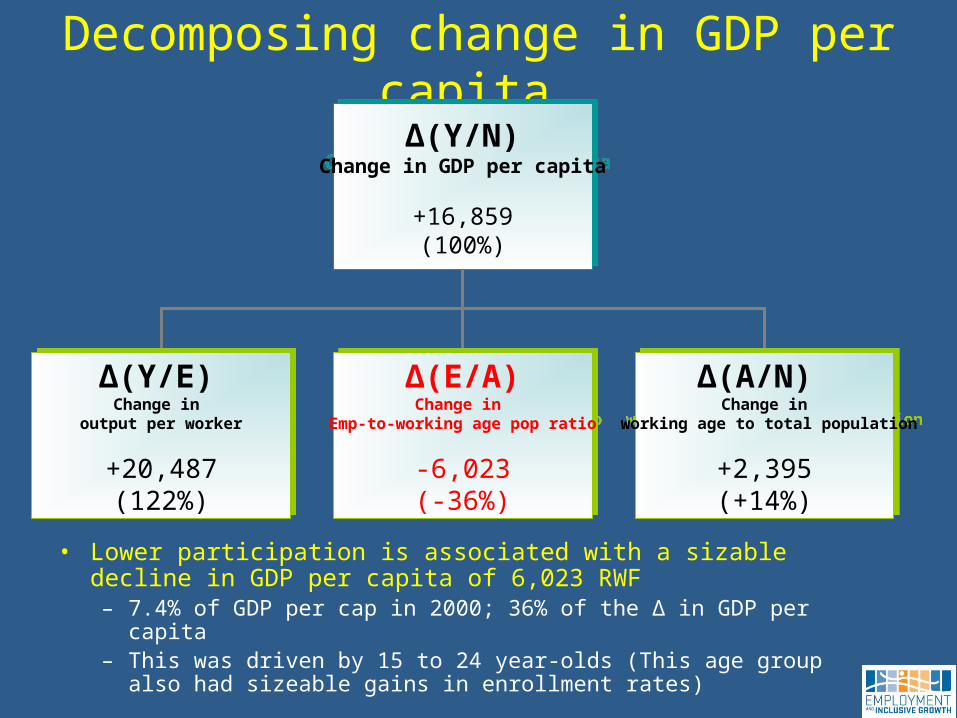
Decomposing change in GDP per capita Δ(Y/N)
Change in GDP per capita
+16,859(100%)
Δ(Y/N)Change in GDP per capita
+16,859(100%)
Δ(Y/E)
Change in output per worker
+20,487(122%)
Δ(Y/E)
Change in output per worker
+20,487(122%)
Δ(E/A)Change in
Emp-to-working age pop ratio
-6,023(-36%)
Δ(E/A)Change in
Emp-to-working age pop ratio
-6,023(-36%)
Δ(A/N) Change in
working age to total population
+2,395(+14%)
Δ(A/N) Change in
working age to total population
+2,395(+14%)
• Increased share of the population was working aged (15-64)
Decomposing change in GDP per capita Δ(Y/N)
Change in GDP per capita
+16,859(100%)
Δ(Y/N)Change in GDP per capita
+16,859(100%)
Δ(Y/E)
Change in output per worker
+20,487(122%)
Δ(Y/E)
Change in output per worker
+20,487(122%)
Δ(E/A)Change in
Emp-to-working age pop ratio
-6,023(-36%)
Δ(E/A)Change in
Emp-to-working age pop ratio
-6,023(-36%)
Δ(A/N) Change in
working age to total population
+2,395(+14%)
Δ(A/N) Change in
working age to total population
+2,395(+14%)
• Lower participation is associated with a sizable decline in GDP per capita of 6,023 RWF – 7.4% of GDP per cap in 2000; 36% of the ∆ in GDP per capita– This was driven by 15 to 24 year-olds (This age group also
had sizeable gains in enrollment rates)

Decomposing change in GDP per capita
due to employment changes
Δ(E/A)
-6,023(-36%)
Δ(E/A)
-6,023(-36%)
Primary
-15,693(-93%)
Primary
-15,693(-93%)
Secondary
+2,711(+16%)
Secondary
+2,711(+16%)
Tertiary
+6,959(+41%)
Tertiary
+6,959(+41%)
Note: Values represent the contribution to the change in GDP per capita
Percentage values are in percent of total change in GDP per capita

Decomposing change in GDP per capita
Δ(Y/N)Change in GDP per capita
+16,859(100%)
Δ(Y/N)Change in GDP per capita
+16,859(100%)
Δ(Y/E)
Change in output per worker
+20,487(122%)
Δ(Y/E)
Change in output per worker
+20,487(122%)
Δ(E/A)Change in
Emp-to-working age pop ratio
-6,023(-36%)
Δ(E/A)Change in
Emp-to-working age pop ratio
-6,023(-36%)
Δ(A/N) Change in
working age to total population
+2,395(+14%)
Δ(A/N) Change in
working age to total population
+2,395(+14%)
• Notice the increase in output per worker. This drives growth in GDP per capita.– 25% of GDP per cap in 2000; 122% of the ∆ in GDP per capita
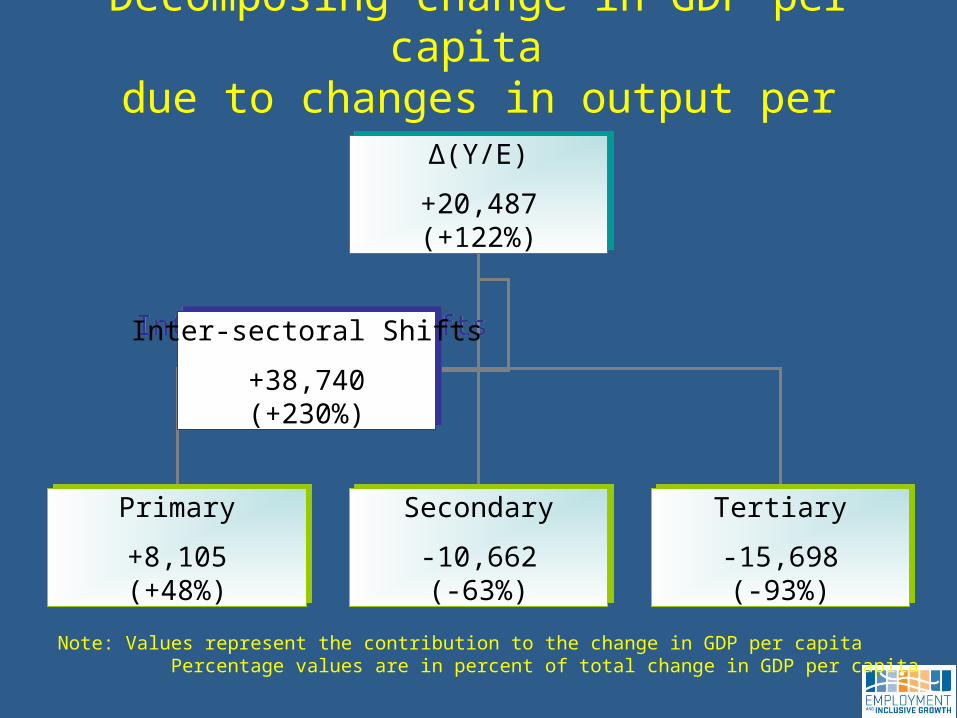
Decomposing change in GDP per capita due to changes in output per worker
Δ(Y/E)
+20,487(+122%)
Δ(Y/E)
+20,487(+122%)
Primary
+8,105(+48%)
Primary
+8,105(+48%)
Secondary
-10,662(-63%)
Secondary
-10,662(-63%)
Tertiary
-15,698(-93%)
Tertiary
-15,698(-93%)
Inter-sectoral Shifts
+38,740(+230%)
Inter-sectoral Shifts
+38,740(+230%)
Note: Values represent the contribution to the change in GDP per capita Percentage values are in percent of total change in GDP per capita
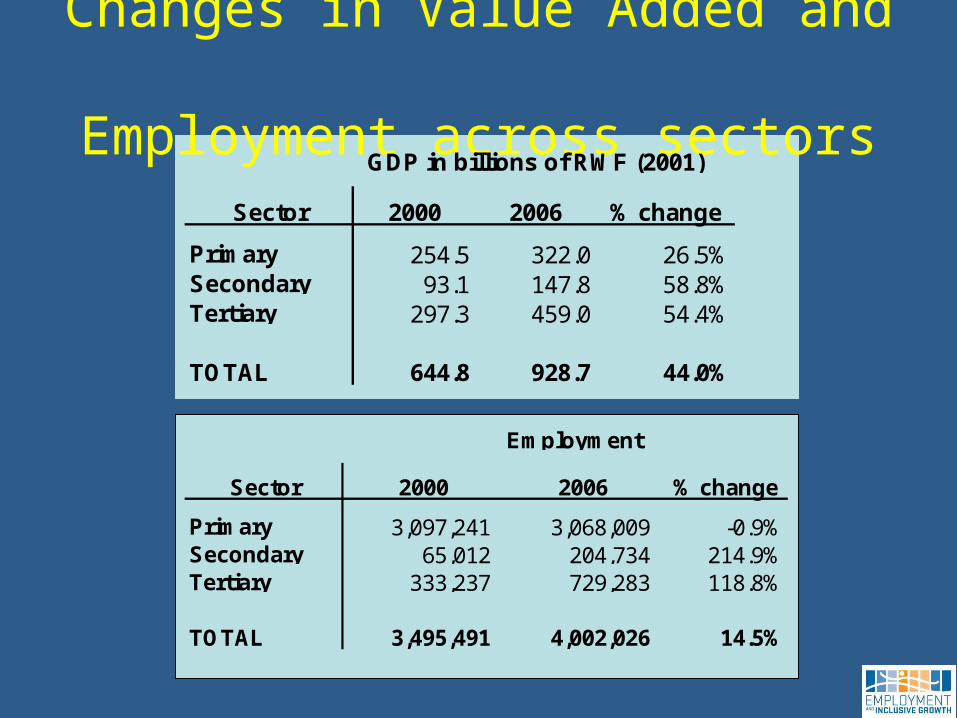
Changes in Value Added and Employment across sectors
GDP in billions of RWF (2001)
Sector 2000 2006 % change
Primary 254.5 322.0 26.5%Secondary 93.1 147.8 58.8%Tertiary 297.3 459.0 54.4%
TOTAL 644.8 928.7 44.0%
Employment
Sector 2000 2006 % change
Primary 3,097,241 3,068,009 -0.9%Secondary 65,012 204,734 214.9%Tertiary 333,237 729,283 118.8%
TOTAL 3,495,491 4,002,026 14.5%

Further analysis- details in guide
• Examine inter-sectoral changes accounted for by sector
• Decompose into changes in output per worker (within sectors) into TFP and capital-labor ratio components– Need information on:
• share of national income going towards capital
• Capital STOCK

Can it be done in practice???
This decomposition sounds complicated!
Will it be time-consuming to compute???
LET’S SEE

Will see today
• Demonstration (now)
• Output in exercises (next)– To see what we can learn from other
experiences– Does it tell us where to look?