Decommissioning Cost Analysis for the Oconee Nuclear Station
185
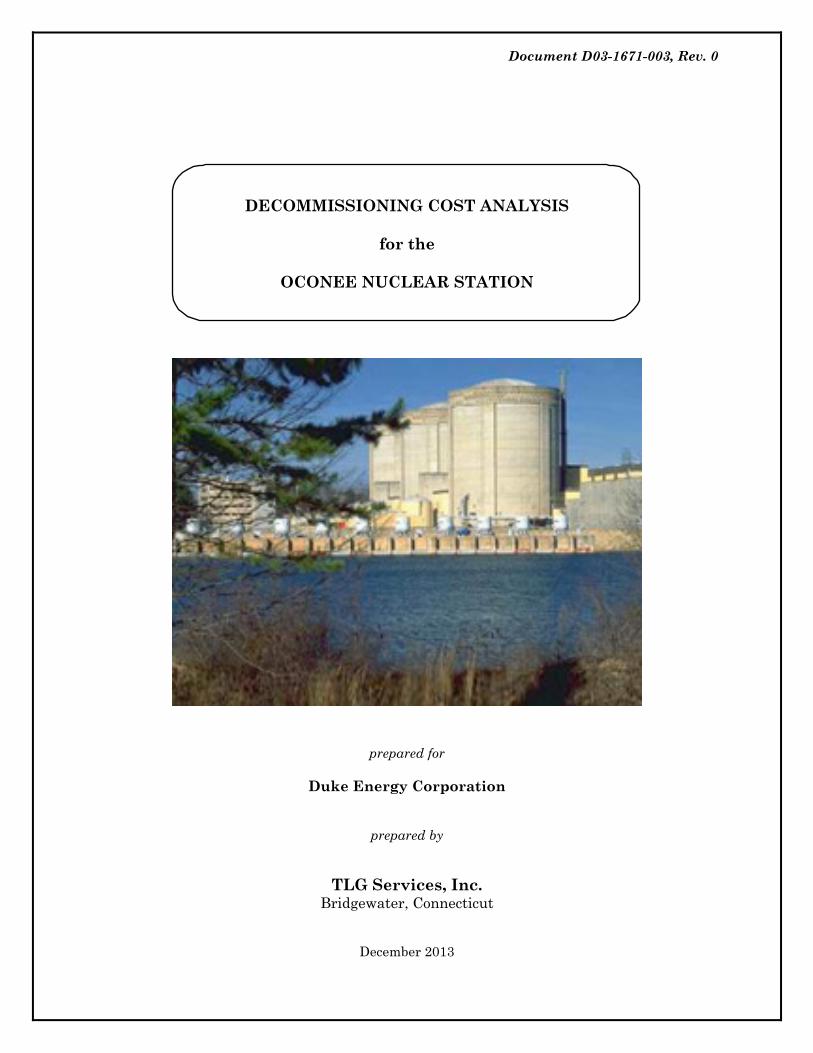
Document D03-1671-003, Rev. 0 DECOMMISSIONING COST ANALYSIS for the OCONEE NUCLEAR STATION prepared for Duke Energy Corporation prepared by TLG Services, Inc. Bridgewater, Connecticut December 2013 J , '~., ~i-Pi i i 1. ill
Transcript of Decommissioning Cost Analysis for the Oconee Nuclear Station
Document D03-1671-003, Rev. 0
DECOMMISSIONING COST ANALYSIS
for the
OCONEE NUCLEAR STATION
prepared for
Duke Energy Corporation
prepared by
TLG Services, Inc. Bridgewater, Connecticut
December 2013
J
, '~., ~i-Pi i i 1.
ill

Oconee Nuclear Station Document D03-1671-003, Rev. 0 Decommissioning Cost Analysis Page ii of xix
TLG Services, Inc.
APPROVALS Project Manager William A. Cloutier, Jr. Date Project Engineer Thomas J. Garrett Date Technical Manager Francis W. Seymore Date
Project ManagerDate
Project EngineerDate
Technical ManagerDate

Oconee Nuclear Station Document D03-1671-003, Rev. 0 Decommissioning Cost Analysis Page iii of xix
TLG Services, Inc.
TABLE OF CONTENTS
SECTION PAGE EXECUTIVE SUMMARY ................................................................................... vii-xix 1. INTRODUCTION ..................................................................................................... 1-1 1.1 Objectives of Study ........................................................................................... 1-1 1.2 Site Description ................................................................................................. 1-2 1.3 Regulatory Guidance ........................................................................................ 1-3 1.3.1 Nuclear Waste Policy Act ...................................................................... 1-5 1.3.2 Low-Level Radioactive Waste Acts ...................................................... 1-7 1.3.3 Radiological Criteria for License Termination .................................... 1-8 2. DECOMMISSIONING ALTERNATIVES .............................................................. 2-1 2.1 DECON .............................................................................................................. 2-2 2.1.1 Period 1 - Preparations ......................................................................... 2-2 2.1.2 Period 2 - Decommissioning Operations .............................................. 2-4 2.1.3 Period 3 - Site Restoration .................................................................... 2-7 2.1.4 ISFSI Operations and Decommissioning ............................................ 2-8 2.2 SAFSTOR .......................................................................................................... 2-9 2.2.1 Period 1 - Preparations ......................................................................... 2-9 2.2.2 Period 2 - Dormancy ............................................................................ 2-10 2.2.3 Periods 3 and 4 - Delayed Decommissioning ..................................... 2-11 2.2.4 Period 5 - Site Restoration .................................................................. 2-13 3. COST ESTIMATES ................................................................................................... 3-1 3.1 Basis of Estimates ............................................................................................ 3-1 3.2 Methodology ...................................................................................................... 3-1 3.3 Financial Components of the Cost Model ....................................................... 3-3 3.3.1 Contingency ........................................................................................... 3-3 3.3.2 Financial Risk ........................................................................................ 3-5 3.4 Site-Specific Considerations............................................................................. 3-6 3.4.1 Spent Fuel Management ....................................................................... 3-6 3.4.2 Reactor Vessel and Internal Components ........................................... 3-9 3.4.3 Primary System Components ............................................................. 3-10 3.4.4 Main Turbine and Condenser ............................................................. 3-11 3.4.5 Retired Components ............................................................................ 3-11 3.4.6 Transportation Methods ..................................................................... 3-11 3.4.7 Low-Level Radioactive Waste Disposal ............................................. 3-12 3.4.8 Site Conditions Following Decommissioning .................................... 3-13
Oconee Nuclear Station Document D03-1671-003, Rev. 0 Decommissioning Cost Analysis Page iv of xix
TLG Services, Inc.
TABLE OF CONTENTS (continued)
SECTION PAGE 3.5 Assumptions .................................................................................................... 3-15 3.5.1 Estimating Basis ................................................................................. 3-15
3.5.2 Labor Costs .......................................................................................... 3-15 3.5.3 Design Conditions................................................................................ 3-16
3.5.4 General ................................................................................................. 3-16 3.6 Cost Estimate Summary ............................................................................... 3-19 4. SCHEDULE ESTIMATE ........................................................................................ 4-1 4.1 Schedule Estimate Assumptions ..................................................................... 4-1 4.2 Project Schedule ................................................................................................ 4-2 5. RADIOACTIVE WASTES ........................................................................................ 5-1 6. RESULTS ................................................................................................................. 6-1 7. REFERENCES .......................................................................................................... 7-1
TABLES DECON Cost Summary, Decommissioning Cost Elements ......................... xviii SAFSTOR Cost Summary, Decommissioning Cost Elements ....................... xix 3.1 Spent Fuel Management Schedule ................................................................ 3-20 3.2 DECON Alternative, Unit 1, Total Annual Expenditures ........................... 3-22 3.2a DECON Alternative, Unit 1, License Termination Expenditures ............... 3-23 3.2b DECON Alternative, Unit 1, Spent Fuel Management Expenditures ........ 3-24 3.2c DECON Alternative, Unit 1, Site Restoration Expenditures ...................... 3-25 3.3 DECON Alternative, Unit 2, Total Annual Expenditures ........................... 3-26 3.3a DECON Alternative, Unit 2, License Termination Expenditures ............... 3-27 3.3b DECON Alternative, Unit 2, Spent Fuel Management Expenditures ........ 3-28 3.3c DECON Alternative, Unit 2, Site Restoration Expenditures ...................... 3-29 3.4 DECON Alternative, Unit 3, Total Annual Expenditures ........................... 3-30 3.4a DECON Alternative, Unit 3, License Termination Expenditures ............... 3-31 3.4b DECON Alternative, Unit 3, Spent Fuel Management Expenditures ........ 3-32 3.4c DECON Alternative, Unit 3, Site Restoration Expenditures ...................... 3-33

Oconee Nuclear Station Document D03-1671-003, Rev. 0 Decommissioning Cost Analysis Page v of xix
TLG Services, Inc.
TABLE OF CONTENTS (continued)
SECTION PAGE
TABLES (continued) 3.5 SAFSTOR Alternative, Unit 1, Total Annual Expenditures ........................ 3-34 3.5a SAFSTOR Alternative, Unit 1, License Termination Expenditures ........... 3-36 3.5b SAFSTOR Alternative, Unit 1, Spent Fuel Management Expenditures ..... 3-38 3.5c SAFSTOR Alternative, Unit 1, Site Restoration Expenditures ................... 3-39 3.6 SAFSTOR Alternative, Unit 2, Total Annual Expenditures ........................ 3-40 3.6a SAFSTOR Alternative, Unit 2, License Termination Expenditures ........... 3-42 3.6b SAFSTOR Alternative, Unit 2, Spent Fuel Management Expenditures ..... 3-44 3.6c SAFSTOR Alternative, Unit 2, Site Restoration Expenditures ................... 3-45 3.7 SAFSTOR Alternative, Unit 3, Total Annual Expenditures ........................ 3-46 3.7a SAFSTOR Alternative, Unit 3, License Termination Expenditures ........... 3-48 3.7b SAFSTOR Alternative, Unit 3, Spent Fuel Management Expenditures ..... 3-50 3.7c SAFSTOR Alternative, Unit 3, Site Restoration Expenditures ................... 3-51 5.1 DECON Alternative, Decommissioning Waste Summary ............................. 5-5 5.2 SAFSTOR Alternative, Decommissioning Waste Summary .......................... 5-6 6.1 DECON Alternative, Decommissioning Cost Elements ................................. 6-4 6.2 SAFSTOR Alternative, Decommissioning Cost Elements ............................. 6-5
FIGURES 4.1 Activity Schedule .............................................................................................. 4-3 4.2 Decommissioning Timeline, DECON .............................................................. 4-6 4.3 Decommissioning Timeline, SAFSTOR .......................................................... 4-7 5.1 Radioactive Waste Disposition ........................................................................ 5-3 5.2 Decommissioning Waste Destinations, Radiological ...................................... 5-4
APPENDICES A. Unit Cost Factor Development ............................................................................. A-1 B. Unit Cost Factor Listing ...................................................................................... B-1 C. Detailed Cost Analysis, DECON .......................................................................... C-1 D. Detailed Cost Analysis, SAFSTOR ...................................................................... D-1 E. ISFSI Decommissioning Cost Summary ............................................................. E-1
Oconee Nuclear Station Document D03-1671-003, Rev. 0 Decommissioning Cost Analysis Page vi of xix
TLG Services, Inc.
REVISION LOG
No. Date Item Revised Reason for Revision
0
12-09-2013
Original Issue
Oconee Nuclear Station Document D03-1671-003, Rev. 0 Decommissioning Cost Analysis Page vii of xix
TLG Services, Inc.
EXECUTIVE SUMMARY This report presents estimates of the cost to decommission the Oconee Nuclear Station (Oconee) for the selected decommissioning scenarios following the scheduled cessation of plant operations. The estimates are designed to provide Duke Energy Corporation (Duke Energy) with sufficient information to assess its financial obligations, as they pertain to the eventual decommissioning of the nuclear station. The analysis relies upon site-specific, technical information from an evaluation prepared in 2008,[1] updated to reflect current assumptions pertaining to the disposition of the nuclear plant and relevant industry experience in undertaking such projects. The costs are based on several key assumptions in areas of regulation, component characterization, high-level radioactive waste management, low-level radioactive waste disposal, performance uncertainties (contingency) and site restoration requirements. The analysis is not a detailed engineering evaluation, but estimates prepared in advance of the detailed engineering required to carry out the decommissioning of the nuclear station. It may also not reflect the actual plan to decommission Oconee; the plan may differ from the assumptions made in this analysis based on facts that exist at the time of decommissioning. The plant inventory, the basis for the decontamination and dismantling requirements and cost, and the decommissioning waste streams, was reviewed for this analysis. The plant confirmed that there were no substantive changes over the five year period to the configuration of the plant or site facilities (that would significantly impact decommissioning). However, some minor plant additions were identified and included in the current study. The costs to decommission Oconee for the scenarios evaluated are tabulated at the end of this section. Costs are reported in 2013 dollars and include monies anticipated to be spent for radiological remediation and operating license termination, spent fuel management, and site restoration activities. A complete discussion of the assumptions relied upon in this analysis is provided in Section 3, along with schedules of annual expenditures for each scenario. A sequence of significant project activities is provided in Section 4 with a timeline for each scenario. Detailed cost reports used to generate the summary tables contained within this document are provided in Appendices C and D.
1 “Decommissioning Cost Analysis for the Oconee Nuclear Station,” Document D03-1594-004, Rev. 0,
TLG Services, Inc., December 2008

Oconee Nuclear Station Document D03-1671-003, Rev. 0 Decommissioning Cost Analysis Page viii of xix
TLG Services, Inc.
Consistent with the 2008 analysis, the current cost estimates assume that the shutdown of the nuclear station is a scheduled and pre-planned event (e.g., there is no delay in transitioning the plant and workforce from operations or in obtaining regulatory relief from operating requirements, etc.). The estimates include the continued operation of the fuel handling buildings as interim wet fuel storage facilities for ten years after Unit 3 operations cease. During this time period, it is assumed that the spent fuel residing in the pools will be transferred to the Department of Energy (DOE). Once the pools are emptied, the spent fuel stored at the independent spent fuel storage installation (ISFSI) will be transferred to the DOE. The ISFSI, consisting of transportable storage canisters to house the spent fuel assemblies, and horizontal storage modules, will remain operational until the DOE is able to complete the transfer of the fuel to a federal facility (e.g., a monitored retrievable storage facility).[2] DOE officials have stated that DOE does not have an obligation to accept already-canistered fuel without an amendment to DOE’s contracts with plant licensees to remove the fuel (the “Standard Contract”), but DOE has not explained what any such amendment would involve. For purposes of this analysis, it is assumed that DOE will accept already-canistered fuel. Alternatives and Regulations The Nuclear Regulatory Commission (NRC) provided general decommissioning requirements in a rule adopted on June 27, 1988. [3] In this rule, the NRC set forth technical and financial criteria for decommissioning licensed nuclear facilities. The regulations addressed planning needs, timing, funding methods, and environmental review requirements for decommissioning. The rule also defined three decommissioning alternatives as being acceptable to the NRC: DECON, SAFSTOR, and ENTOMB.
DECON is defined as "the alternative in which the equipment, structures, and portions of a facility and site containing radioactive contaminants are removed or decontaminated to a level that permits the property to be released for unrestricted use shortly after cessation of operations."[4]
2 Projected expenditures for spent fuel management identified in the cost analyses do not consider
the outcome of the litigation with the DOE with regard to the delays incurred by the owner in the timely removal of spent fuel from the site.
3 U.S. Code of Federal Regulations, Title 10, Parts 30, 40, 50, 51, 70 and 72 "General Requirements for Decommissioning Nuclear Facilities," Nuclear Regulatory Commission, Federal Register Volume 53, Number 123 (p 24018 et seq.), June 27, 1988
4 Ibid. Page FR24022, Column 3
Oconee Nuclear Station Document D03-1671-003, Rev. 0 Decommissioning Cost Analysis Page ix of xix
TLG Services, Inc.
SAFSTOR is defined as "the alternative in which the nuclear facility is placed and maintained in a condition that allows the nuclear facility to be safely stored and subsequently decontaminated (deferred decontamination) to levels that permit release for unrestricted use."[5]
Decommissioning is required to be completed within 60 years, although longer time periods will be considered when necessary to protect public health and safety. ENTOMB is defined as "the alternative in which radioactive contaminants are encased in a structurally long-lived material, such as concrete; the entombed structure is appropriately maintained and continued surveillance is carried out until the radioactive material decays to a level permitting unrestricted release of the property."[6] As with the SAFSTOR alternative, decommissioning is currently required to be completed within 60 years, although longer time periods will also be considered when necessary to protect public health and safety.
The 60-year restriction has limited the practicality for the ENTOMB alternative at commercial reactors that generate significant amounts of long-lived radioactive material. In 1997, the Commission directed its staff to re-evaluate this alternative and identify the technical requirements and regulatory actions that would be necessary for entombment to become a viable option. The resulting evaluation provided several recommendations, however, rulemaking has been deferred pending the completion of additional research studies (e.g., on engineered barriers).
In 1996, the NRC published revisions to its general requirements for decommissioning nuclear power plants to clarify ambiguities and codify procedures and terminology as a means of enhancing efficiency and uniformity in the decommissioning process.[7] The amendments allow for greater public participation and better define the transition process from operations to decommissioning. Regulatory Guide 1.184, issued in July 2000, further described the methods and procedures that are acceptable to the NRC staff for implementing the requirements of the 1996 revised rule that relate to the initial activities and the major phases of the decommissioning process. The costs and schedules presented in this analysis follow the general guidance and sequence in
5 Ibid.
6 Ibid. Page FR24023, Column 2
7 U.S. Code of Federal Regulations, Title 10, Parts 2, 50, and 51, "Decommissioning of Nuclear Power Reactors," Nuclear Regulatory Commission, Federal Register Volume 61, (p 39278 et seq.), July 29, 1996
Oconee Nuclear Station Document D03-1671-003, Rev. 0 Decommissioning Cost Analysis Page x of xix
TLG Services, Inc.
the amended regulations. The format and content of the estimates is also consistent with the recommendations of Regulatory Guide 1.202, issued February 2005.[8]
Decommissioning Scenarios Two decommissioning scenarios were evaluated for Oconee. The scenarios selected are representative of alternatives available and are defined as follows: 1. The first scenario assumes that the station would be promptly decommissioned
(DECON alternative) upon the expiration of the current operating licenses, i.e., in 2033 and 2034. The spent fuel in the plant’s spent fuel storage pools is transferred to the DOE within ten years of Unit 3 ceasing operation. The equipment, structures, and portions of the plant containing radioactive contaminants are removed or decontaminated to a level that permits the facility to be released for unrestricted use. Site structures are then demolished. Spent fuel storage operations continue at the site until the transfer of the fuel to the DOE is complete, assumed to be in the year 2058.
2. In the second scenario, the nuclear station is placed into safe-storage (SAFSTOR
alternative) at the end of its current operating license. The spent fuel in the plant’s spent fuel storage pools is transferred to the DOE and the plant reconfigured for long-term storage. Spent fuel storage operations continue at the site until the transfer of the fuel to the DOE is complete, assumed to be in the year 2058. Decommissioning operations commence in 2085, with the decontamination and dismantling of Oconee completed in 2093, sixty years after the cessation of Unit 1 operations. Site structures are then demolished.
Methodology The methodology used to develop the estimates follows the basic approach originally presented in the cost estimating guidelines[9] developed by the Atomic Industrial Forum (now Nuclear Energy Institute). This reference describes a unit cost factor method for estimating decommissioning activity costs. The unit cost factors used in this analysis incorporate site-specific costs and the latest available information about worker productivity in decommissioning. An activity duration critical path is used to determine the total decommissioning program schedule. This is required for calculating the carrying costs, which include
8 “Standard Format and Content of Decommissioning Cost Estimates for Nuclear Power Reactors,”
Regulatory Guide 1.202, Nuclear Regulatory Commission, February 2005
9 T.S. LaGuardia et al., "Guidelines for Producing Commercial Nuclear Power Plant Decommissioning Cost Estimates," AIF/NESP-036, May 1986
Oconee Nuclear Station Document D03-1671-003, Rev. 0 Decommissioning Cost Analysis Page xi of xix
TLG Services, Inc.
program management, administration, field engineering, equipment rental, quality assurance, and security. This systematic approach for assembling decommissioning estimates ensures a high degree of confidence in the reliability of the resulting costs. The estimates also reflect lessons learned from previously completed decommissioning projects, including TLG’s involvement in the Shippingport Station decommissioning, completed in 1989, and the decommissioning of the Cintichem reactor, hot cells and associated facilities, completed in 1997. In addition, the planning and engineering for the Pathfinder, Shoreham, Rancho Seco, Trojan, Yankee Rowe, Big Rock Point, Maine Yankee, Humboldt Bay-3, Connecticut Yankee and San Onofre-1 nuclear units have provided additional insight into the process, the regulatory aspects, and technical challenges of decommissioning commercial nuclear units. Contingency Consistent with cost estimating practice, contingencies are applied to the decontamination and dismantling costs developed as "specific provision for unforeseeable elements of cost within the defined project scope, particularly important where previous experience relating estimates and actual costs has shown that unforeseeable events which will increase costs are likely to occur.”[10] The cost elements in the estimates are based on ideal conditions; therefore, the types of unforeseeable events that are almost certain to occur in decommissioning, based on industry experience, are addressed through a percentage contingency applied on a line-item basis. This contingency factor is a nearly universal element in all large-scale construction and demolition projects. It should be noted that contingency, as used in this analysis, does not account for price escalation and inflation in the cost of decommissioning over the remaining operating life of the station. Contingency funds are expected to be fully expended throughout the program. As such, inclusion of contingency is necessary to provide assurance that sufficient funding will be available to accomplish the intended tasks. Low-Level Radioactive Waste Disposal The contaminated and activated material generated in the decontamination and dismantling of a commercial nuclear reactor is generally classified as low-level radioactive waste, although not all of the material is suitable for shallow-land disposal. With the passage of the “Low-Level Radioactive Waste Disposal Act” in 1980 and its
10 Project and Cost Engineers’ Handbook, Second Edition, American Association of Cost Engineers,
Marcel Dekker, Inc., New York, New York, p. 239.

Oconee Nuclear Station Document D03-1671-003, Rev. 0 Decommissioning Cost Analysis Page xii of xix
TLG Services, Inc.
Amendments of 1985, [11] the states became ultimately responsible for the disposition of low-level radioactive waste generated within their own borders. South Carolina is a member of the three-state Atlantic Interstate Low-Level Radioactive Waste Management Compact, formed after South Carolina formally joined the Northeast Regional Compact. As such, the owners will continue to have access to the currently operating disposal facility in Barnwell, South Carolina. Disposition of the various waste streams produced by the decommissioning process considered all options and services currently available to Duke Energy. The majority of the low-level radioactive waste designated for direct disposal (Class A[12]) can be sent to EnergySolutions’ facility in Clive, Utah. The rate schedule for the Barnwell facility is used to generate disposal costs for the large components and the higher activity waste forms waste (Class B and C material[13]). It is also assumed that Duke Energy can access other disposal sites, should it prove cost-effective. Low activity waste forms (concrete debris, dry-active waste) and metallic waste suspected of being contaminated are routed to a Tennessee-based radioactive waste processor for decontamination, volume reduction and/or disposal. The dismantling of the components residing closest to the reactor core generates radioactive waste that may be considered unsuitable for shallow-land disposal (i.e., low-level radioactive waste with concentrations of radionuclides that exceed the limits established by the NRC for Class C radioactive waste (GTCC)). The Low-Level Radioactive Waste Policy Amendments Act of 1985 assigned the federal government the responsibility for the disposal of this material. The Act also stated that the beneficiaries of the activities resulting in the generation of such radioactive waste bear all reasonable costs of disposing of such waste. However, to date, the federal government has not identified a cost for disposing of GTCC or a schedule for acceptance. For purposes of this analysis, the GTCC radioactive waste is assumed to be packaged and disposed of in a similar manner as high-level waste and at a cost equivalent to that envisioned for the spent fuel. The GTCC is packaged in canisters compatible with the spent fuel dry storage system and either stored on site or shipped directly to a federal facility as it is generated (depending upon the timing of the decommissioning and whether the spent fuel has been removed from the site prior to the start of decommissioning). 11 “Low-Level Radioactive Waste Policy Amendments Act of 1985,” Public Law 99-240, January 15,
1986
12 Waste is classified in accordance with U.S. Code of Federal Regulations, Title 10, Part 61.55
13 U.S. Code of Federal Regulations, Title 10, Part 61, “Licensing Requirements for Land Disposal of Radioactive Waste”
Oconee Nuclear Station Document D03-1671-003, Rev. 0 Decommissioning Cost Analysis Page xiii of xix
TLG Services, Inc.
A significant portion of the waste material generated during decommissioning may only be potentially contaminated by radioactive materials. This waste can be analyzed on site or shipped off site to licensed facilities for further analysis, for processing and/or for conditioning/recovery. Reduction in the volume of low-level radioactive waste requiring disposal in a licensed low-level radioactive waste disposal facility can be accomplished through a variety of methods, including analyses and surveys or decontamination to eliminate the portion of waste that does not require disposal as radioactive waste, compaction, incineration or metal melt. The estimates reflect the savings from waste recovery/volume reduction. High-Level Radioactive Waste Management Congress passed the “Nuclear Waste Policy Act” (NWPA) in 1982, assigning the federal government’s long-standing responsibility for disposal of the spent nuclear fuel created by the commercial nuclear generating plants to the DOE. The DOE was to begin accepting spent fuel by January 31, 1998; however, to date no progress in the removal of spent fuel from commercial generating sites has been made. Today, the country is at an impasse on high-level waste disposal, even with the License Application for a geologic repository submitted by the DOE to the NRC in 2008. The current administration has cut the budget for the repository program while promising to “conduct a comprehensive review of policies for managing the back end of the nuclear fuel cycle … and make recommendations for a new plan.”[14] Towards this goal, the administration appointed a Blue Ribbon Commission on America’s Nuclear Future (Blue Ribbon Commission) to make recommendations for a new plan for nuclear waste disposal. The Blue Ribbon Commission’s charter includes a requirement that it consider “[o]ptions for safe storage of used nuclear fuel while final disposition pathways are selected and deployed.”[15] On January 26, 2012, the Blue Ribbon Commission issued its “Report to the Secretary of Energy” containing a number of recommendations on nuclear waste disposal. Two of the recommendations that may impact decommissioning planning are:
“[T]he United States [should] establish a program that leads to the timely development of one or more consolidated storage facilities”[16]
14 Blue Ribbon Commission on America’s Nuclear Future’s Charter,
http://cybercemetery.unt.edu/archive/brc/20120620215336/http://brc.gov/index.php?q=page/charter
15 Ibid.
16 “Blue Ribbon Commission on America’s Nuclear Future, Report to the Secretary of Energy,” http://www.brc.gov/sites/default/files/documents/brc_finalreport_jan2012.pdf, p. 32, January
2012
Oconee Nuclear Station Document D03-1671-003, Rev. 0 Decommissioning Cost Analysis Page xiv of xix
TLG Services, Inc.
“[T]he United States should undertake an integrated nuclear waste management program that leads to the timely development of one or more permanent deep geological facilities for the safe disposal of spent fuel and high-level nuclear waste.”[17]
In January 2013, the DOE issued the “Strategy for the Management and Disposal of Used Nuclear Fuel and High-Level Radioactive Waste,” in response to the recommendations made by the Blue Ribbon Commission and as “a framework for moving toward a sustainable program to deploy an integrated system capable of transporting, storing, and disposing of used nuclear fuel...”[18] “With the appropriate authorizations from Congress, the Administration currently plans to implement a program over the next 10 years that:
Sites, designs and licenses, constructs and begins operations of a pilot interim storage facility by 2021 with an initial focus on accepting used nuclear fuel from shut-down reactor sites;
Advances toward the siting and licensing of a larger interim storage facility to be available by 2025 that will have sufficient capacity to provide flexibility in the waste management system and allows for acceptance of enough used nuclear fuel to reduce expected government liabilities; and
Makes demonstrable progress on the siting and characterization of repository sites to facilitate the availability of a geologic repository by 2048.”[19]
Completion of the decommissioning process is dependent upon the DOE’s ability to remove spent fuel from the site in a timely manner. DOE’s repository program had assumed that spent fuel allocations would be accepted for disposal from the nation’s commercial nuclear plants, with limited exceptions, in the order (the “queue”) in which it was discharged from the reactor.[20] Duke Energy’s current spent fuel management plan for the Oconee spent fuel is based in general upon: 1) a 2025
17 Ibid., p.27
18 “Strategy for the Management and Disposal of Used Nuclear Fuel and High-Level Radioactive Waste,” U.S. DOE, January 11, 2013
19 Ibid., p.2
20 U.S. Code of Federal Regulations, Title 10, Part 961.11, Article IV – Responsibilities of the Parties, B. DOE Responsibilities, 5.(a) … DOE shall issue an annual acceptance priority ranking for receipt of SNF and/or HLW at the DOE repository. This priority ranking shall be based on the age of SNF and/or HLW as calculated from the date of discharge of such materials from the civilian nuclear power reactor. The oldest fuel or waste will have the highest priority for acceptance …”
Oconee Nuclear Station Document D03-1671-003, Rev. 0 Decommissioning Cost Analysis Page xv of xix
TLG Services, Inc.
start date for DOE initiating transfer of commercial spent fuel to a federal facility (based upon the proposed timeline for the availability of the larger interim storage facility), 2) expectations for spent fuel receipt by the DOE for the Oconee fuel, and 3) reassignment of allocations between the Oconee, McGuire and Catawba units in the Duke Energy fleet so as to minimize on-site storage costs. The DOE’s generator allocation/receipt schedules are based upon the oldest fuel receiving the highest priority. Assuming a maximum rate of transfer of 3,000 metric tons of uranium (MTU)/year, [21] and the aforementioned assumptions on spent fuel management, the spent fuel from Oconee is completely removed from the site by 2058 if the units cease operating in 2033/2034. The NRC requires that licensees establish a program to manage and provide funding for the caretaking of all irradiated fuel at the reactor site until title of the fuel is transferred to the DOE. [22] Interim storage of the fuel, until the DOE has completed the transfer, will be in the fuel handling buildings’ storage pool as well as at an on-site ISFSI. An ISFSI has been constructed to support continued plant operations. Spent fuel stored at the ISFSI will be transferred to the DOE once the spent fuel assemblies in the storage pools have been removed. Once the storage pools are emptied, the fuel handling buildings can be either decontaminated and dismantled or prepared for long-term storage. Duke Energy’s position is that the DOE has a contractual obligation to accept the spent fuel earlier than the projections set out above consistent with its contract commitments. No assumption made in this study should be interpreted to be inconsistent with this claim. Site Restoration The efficient removal of the contaminated materials at the site may result in damage to many of the site structures. Blasting, coring, drilling, and the other decontamination activities can substantially damage power block structures, potentially weakening the footings and structural supports. It is unreasonable to anticipate that these structures would be repaired and preserved after the radiological contamination is removed. The cost to dismantle site structures with a work force already mobilized is more efficient and less costly than if the process is deferred. 21 “Acceptance Priority Ranking & Annual Capacity Report,” DOE/RW-0567, July 2004
22 U.S. Code of Federal Regulations, Title 10, Part 50 – Domestic Licensing of Production and Utilization Facilities, Subpart 54 (bb), “Conditions of Licenses”

Oconee Nuclear Station Document D03-1671-003, Rev. 0 Decommissioning Cost Analysis Page xvi of xix
TLG Services, Inc.
Consequently, this study assumes that site structures addressed by this analysis are removed to a nominal depth of three feet below the local grade level wherever possible. The site is then graded and stabilized. The cost for the site restoration of decontaminated and/or non-contaminated structures has been calculated and is separately presented as "Site Restoration” expenditures in this report. Summary The estimates to decommission Oconee assume the removal of all contaminated and activated plant components and structural materials such that Duke Energy may then have unrestricted use of the site with no further requirements for an operating license. Low-level radioactive waste, other than GTCC waste, is sent to a commercial processor for treatment/conditioning or to a controlled disposal facility. Decommissioning is accomplished within the 60-year period required by current NRC regulations. In the interim, the spent fuel remains in storage at the site until such time that the transfer to a DOE facility is complete. Once emptied, the storage facility can also be decommissioned. The alternatives evaluated in this analysis are described in Section 2. The assumptions are presented in Section 3, along with schedules of annual expenditures. The major cost contributors are identified in Section 6, with detailed activity costs, waste volumes, and associated manpower requirements delineated in Appendices C and D. The major cost components are also identified in the cost summary provided at the end of this section. The cost elements in the estimates for the DECON and SAFSTOR alternatives are assigned to one of three subcategories: NRC License Termination (radiological remediation), Spent Fuel Management, and Site Restoration. The subcategory “NRC License Termination” is used to accumulate costs that are consistent with “decommissioning” as defined by the NRC in its financial assurance regulations (i.e., 10 CFR §50.75). The cost reported for this subcategory is generally sufficient to terminate the unit’s operating license, recognizing that there may be some additional cost impact from spent fuel management. The License Termination cost subcategory also includes costs to decommission the ISFSI (as required by 10 CFR §72.30). Section 3.4.1 provides the basis for the ISFSI decommissioning cost. The “Spent Fuel Management” subcategory contains costs associated with the containerization and transfer of spent fuel from the wet storage pools to the DOE, as well as the eventual transfer of the spent fuel in storage at the ISFSI to the DOE. Costs are included for the operation of the storage pools and the management of the ISFSI until such time that the transfer is complete. It does not include any
Oconee Nuclear Station Document D03-1671-003, Rev. 0 Decommissioning Cost Analysis Page xvii of xix
TLG Services, Inc.
spent fuel management expenses incurred prior to the cessation of plant operations, nor does it include any costs related to the final disposal of the spent fuel. “Site Restoration” is used to capture costs associated with the dismantling and demolition of buildings and facilities demonstrated to be free from contamination. This includes structures never exposed to radioactive materials, as well as those facilities that have been decontaminated to appropriate levels. Structures are removed to a depth of three feet and backfilled to conform to local grade. It should be noted that the costs assigned to these subcategories are allocations. Delegation of cost elements is for the purposes of comparison (e.g., with NRC financial guidelines) or to permit specific financial treatment (e.g., Asset Retirement Obligation determinations). In reality, there can be considerable interaction between the activities in the three subcategories. For example, an owner may decide to remove non-contaminated structures early in the project to improve access to highly contaminated facilities or plant components. In these instances, the non-contaminated removal costs could be reassigned from Site Restoration to an NRC License Termination support activity. However, in general, the allocations represent a reasonable accounting of those costs that can be expected to be incurred for the specific subcomponents of the total estimated program cost, if executed as described. As noted within this document, the estimates were developed and costs are presented in 2013 dollars. As such, the estimates do not reflect the escalation of costs (due to inflationary and market forces) over the remaining operating life of the plant or during the decommissioning period.
Oconee Nuclear Station Document D03-1671-003, Rev. 0 Decommissioning Cost Analysis Page xviii of xix
TLG Services, Inc.
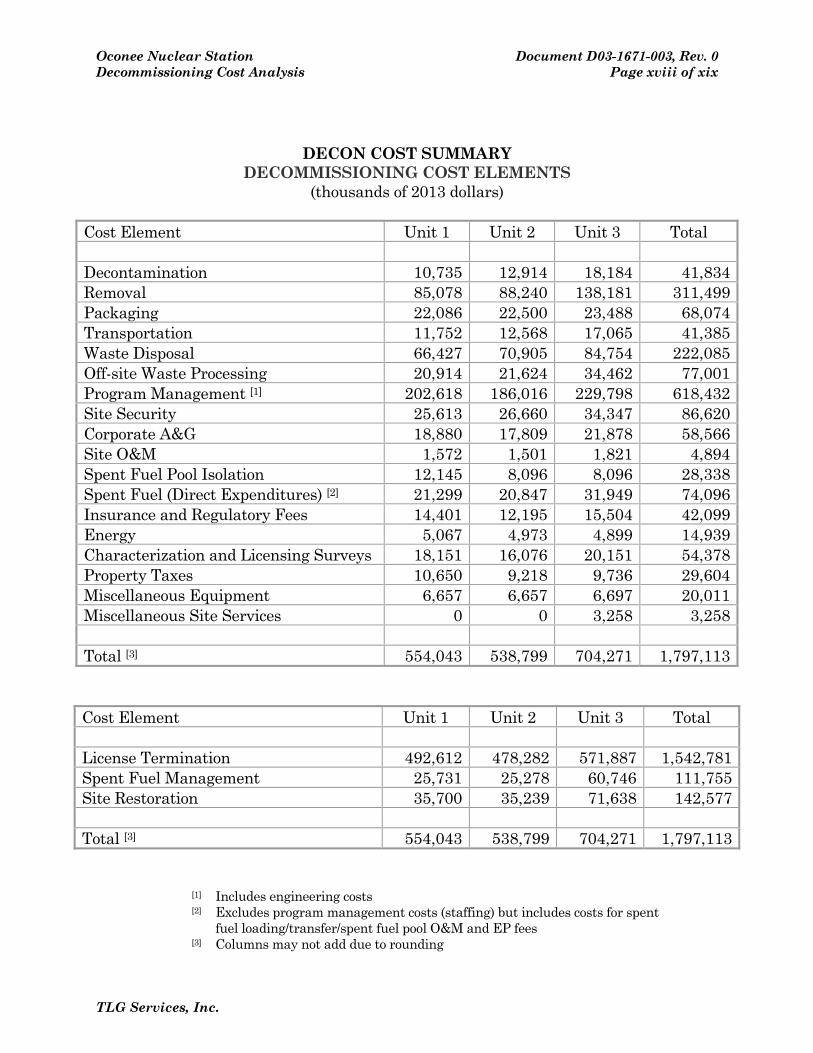
DECON COST SUMMARY DECOMMISSIONING COST ELEMENTS
(thousands of 2013 dollars)
Cost Element Unit 1 Unit 2 Unit 3 Total Decontamination 10,735 12,914 18,184 41,834 Removal 85,078 88,240 138,181 311,499 Packaging 22,086 22,500 23,488 68,074 Transportation 11,752 12,568 17,065 41,385 Waste Disposal 66,427 70,905 84,754 222,085 Off-site Waste Processing 20,914 21,624 34,462 77,001 Program Management [1] 202,618 186,016 229,798 618,432 Site Security 25,613 26,660 34,347 86,620 Corporate A&G 18,880 17,809 21,878 58,566 Site O&M 1,572 1,501 1,821 4,894 Spent Fuel Pool Isolation 12,145 8,096 8,096 28,338 Spent Fuel (Direct Expenditures) [2] 21,299 20,847 31,949 74,096 Insurance and Regulatory Fees 14,401 12,195 15,504 42,099 Energy 5,067 4,973 4,899 14,939 Characterization and Licensing Surveys 18,151 16,076 20,151 54,378 Property Taxes 10,650 9,218 9,736 29,604 Miscellaneous Equipment 6,657 6,657 6,697 20,011 Miscellaneous Site Services 0 0 3,258 3,258 Total [3] 554,043 538,799 704,271 1,797,113
Cost Element Unit 1 Unit 2 Unit 3 Total License Termination 492,612 478,282 571,887 1,542,781 Spent Fuel Management 25,731 25,278 60,746 111,755 Site Restoration 35,700 35,239 71,638 142,577 Total [3] 554,043 538,799 704,271 1,797,113
[1] Includes engineering costs
[2] Excludes program management costs (staffing) but includes costs for spent fuel loading/transfer/spent fuel pool O&M and EP fees
[3] Columns may not add due to rounding

Oconee Nuclear Station Document D03-1671-003, Rev. 0 Decommissioning Cost Analysis Page xix of xix
TLG Services, Inc.
SAFSTOR COST SUMMARY DECOMMISSIONING COST ELEMENTS
(thousands of 2013 dollars)
Cost Element Unit 1 Unit 2 Unit 3 Total Decontamination 9,886 9,823 12,820 32,528 Removal 82,829 85,276 133,456 301,562 Packaging 16,255 16,506 17,220 49,981 Transportation 8,327 8,578 11,861 28,766 Waste Disposal 51,762 54,763 65,385 171,910 Off-site Waste Processing 23,656 24,715 38,265 86,637 Program Management [1] 276,445 199,158 209,190 684,793 Site Security 48,399 50,002 49,458 147,858 Corporate A&G 26,116 19,438 20,336 65,891 Site O&M 2,508 1,788 1,877 6,173 Spent Fuel Pool Isolation 12,145 8,096 8,096 28,338 Spent Fuel (Direct Expenditures) [2] 21,298 20,845 27,091 69,233 Insurance and Regulatory Fees 43,598 41,509 40,938 126,045 Energy 8,726 8,545 8,372 25,643 Characterization and Licensing Surveys 17,215 11,150 10,193 38,558 Property Taxes 10,958 9,538 9,975 30,471 Miscellaneous Equipment 17,840 17,836 21,027 56,703 Miscellaneous Site Services 0 3,810 3,258 7,068 Total [3] 677,963 591,377 688,819 1,958,159
Cost Element Unit 1 Unit 2 Unit 3 Total License Termination 523,998 478,238 536,114 1,538,350 Spent Fuel Management 117,249 76,965 80,584 274,797 Site Restoration 36,717 36,174 72,120 145,011 Total [3] 677,963 591,377 688,819 1,958,159
[1] Includes engineering costs
[2] Excludes program management costs (staffing) but includes costs for spent fuel loading/transfer/spent fuel pool O&M and EP fees
[3] Columns may not add due to rounding

Oconee Nuclear Station Document D03-1671-003, Rev. 0 Decommissioning Cost Analysis Section 1, Page 1 of 9
TLG Services, Inc.
1. INTRODUCTION This report presents estimates of the cost to decommission the Oconee Nuclear Station (Oconee) for the selected decommissioning scenarios following the scheduled cessation of plant operations. The estimates are designed to provide Duke Energy Corporation (Duke Energy) with sufficient information to assess its financial obligations, as they pertain to the eventual decommissioning of the nuclear station. The analysis relies upon site-specific, technical information from an earlier evaluation prepared in 2008,[1]* updated to reflect current assumptions pertaining to the disposition of the nuclear plant and relevant industry experience in undertaking such projects. The costs are based on several key assumptions in areas of regulation, component characterization, high-level radioactive waste management, low-level radioactive waste disposal, performance uncertainties (contingency) and site restoration requirements. The analysis is not a detailed engineering evaluation, but rather estimates prepared in advance of the detailed engineering required to carry out the decommissioning of the nuclear station. It may also not reflect the actual plan to decommission Oconee; the plan may differ from the assumptions made in this analysis based on facts that exist at the time of decommissioning. The plant inventory, the basis for the decontamination and dismantling requirements and cost, and the decommissioning waste streams, were reviewed for this analysis. The plant confirmed that there were no substantive changes over the five-year period to the configuration of the plant or site facilities (that would significantly impact decommissioning). However, some minor plant additions were identified and included in the current study. 1.1 OBJECTIVES OF STUDY
The objectives of this study are to prepare comprehensive estimates of the costs to decommission Oconee, to provide a sequence or schedule for the associated activities, and to develop waste stream projections from the decontamination and dismantling activities. For the purposes of this study, the shutdown dates for the station are assumed to be February 6, 2033, October 6, 2033 and July 19, 2034 for Units 1, 2 and 3, respectively, based upon the current operating licenses and the approved extended periods of operation, i.e., license renewal.
* References provided in Section 7 of the document

Oconee Nuclear Station Document D03-1671-003, Rev. 0 Decommissioning Cost Analysis Section 1, Page 2 of 9
TLG Services, Inc.
1.2 SITE DESCRIPTION Oconee is located in Oconee County, approximately 35 miles west of Greenville, South Carolina on the shore of Lake Keowee. The station is comprised of three nuclear units and an independent spent fuel storage installation (ISFSI). All three units are essentially identical except for certain auxiliary systems. In particular, one spent fuel pool is shared between Oconee 1 and 2, and a separate spent fuel pool is provided for Oconee 3. Lake Keowee, created with the construction of the Keowee and Little River Dams, provides both the power source for the Keowee Hydroelectric Station, as well as the heat sink for the nuclear units. Both facilities were planned and constructed concurrently, to the extent that the Oconee intake dike structure forms part of the Keowee lake boundary. The turbine building houses turbine-generator sets for all three units. The pedestal structure for each is independent; only the steel superstructure is common to all three units. The nuclear steam supply system (NSSS) for each unit consists of a pressurized water reactor and a two-loop reactor coolant system. The systems were supplied by the Babcock & Wilcox Company and have a referenced core design of 2568 MWt (thermal) with the reactor at rated power and a net dependable capability rating of 860 MWe (electric). The reactor coolant system is comprised of the reactor vessel, two vertical once-through steam generators, four shaft-sealed reactor coolant pumps, an electrically heated pressurizer and interconnected piping. The system is housed within the reactor or “containment” building, a conventionally reinforced, post-tensioned structure. The building consists of a right circular cylinder and dome, connected to and supported by a massive reinforced concrete foundation slab. The entire interior surface is lined with a ¼ inch thick welded steel plate to assure a high degree of leak tightness. Heat produced in the reactor is converted to electrical energy by the steam and power conversion system. A turbine-generator converts the thermal energy of steam produced in the steam generators into mechanical shaft power and then into electrical energy. Each unit's turbine generator consists of a tandem (single shaft) arrangement of double-flow high-pressure turbine and three identical double-flow low pressure turbines driving a direct coupled generator at 1800 rpm. The turbines are operated in a closed feedwater cycle, which condenses the steam. The heated feedwater is returned to the steam generators.
Oconee Nuclear Station Document D03-1671-003, Rev. 0 Decommissioning Cost Analysis Section 1, Page 3 of 9
TLG Services, Inc.
The condenser circulating water system removes heat rejected in the main condensers and is the ultimate heat sink for the station. The Little River arm of Lake Keowee is the source of water for the system. Each unit has four condenser circulating water pumps supplying water into a common condenser intake header under the turbine building floor. The condenser discharge is returned to the Keowee River arm of Lake Keowee.
1.3 REGULATORY GUIDANCE The Nuclear Regulatory Commission (NRC or Commission) provided initial decommissioning requirements in its rule "General Requirements for Decommissioning Nuclear Facilities," issued in June 1988.[2] This rule set forth financial criteria for decommissioning licensed nuclear power facilities. The regulation addressed decommissioning planning needs, timing, funding methods, and environmental review requirements. The intent of the rule was to ensure that decommissioning would be accomplished in a safe and timely manner and that adequate funds would be available for this purpose. Subsequent to the rule, the NRC issued Regulatory Guide 1.159, “Assuring the Availability of Funds for Decommissioning Nuclear Reactors,”[3] which provided additional guidance to the licensees of nuclear facilities on the financial methods acceptable to the NRC staff for complying with the requirements of the rule. The regulatory guide addressed the funding requirements and provided guidance on the content and form of the financial assurance mechanisms indicated in the rule. The rule defined three decommissioning alternatives as being acceptable to the NRC: DECON, SAFSTOR, and ENTOMB. The DECON alternative assumes that any contaminated or activated portion of the plant’s systems, structures and facilities are removed or decontaminated to levels that permit the site to be released for unrestricted use shortly after the cessation of plant operations, while the SAFSTOR and ENTOMB alternatives defer the process. The rule also placed limits on the time allowed to complete the decommissioning process. For all alternatives, the process is restricted in overall duration to 60 years, unless it can be shown that a longer duration is necessary to protect public health and safety. At the conclusion of a 60-year dormancy period (or longer if the NRC approves such a case), the site would still require significant remediation to meet the unrestricted release limits for license termination. The ENTOMB alternative has not been viewed as a viable option for power reactors due to the significant time required to isolate the long-lived radionuclides for decay to permissible levels. However, with rulemaking
Oconee Nuclear Station Document D03-1671-003, Rev. 0 Decommissioning Cost Analysis Section 1, Page 4 of 9
TLG Services, Inc.
permitting the controlled release of a site,[4] the NRC did re-evaluate the alternative. The resulting feasibility study, based upon an assessment by Pacific Northwest National Laboratory, concluded that the method did have conditional merit for some, if not most reactors. The staff also found that additional rulemaking would be needed before this option could be treated as a generic alternative. The NRC had considered rulemaking to alter the 60-year time for completing decommissioning and to clarify the use of engineered barriers for reactor entombments.[5] However, the NRC’s staff has subsequently recommended that rulemaking be deferred, based upon several factors (e.g., no licensee has committed to pursuing the entombment option, the unresolved issues associated with the disposition of greater-than-Class C material (GTCC), and the NRC’s current priorities), at least until after the additional research studies are complete. The Commission concurred with the staff’s recommendation. In 1996, the NRC published revisions to the general requirements for decommissioning nuclear power plants.[6] When the decommissioning regulations were adopted in 1988, it was assumed that the majority of licensees would decommission at the end of the facility’s operating licensed life. Since that time, several licensees permanently and prematurely ceased operations. Exemptions from certain operating requirements were required once the reactor was defueled to facilitate the decommissioning. Each case was handled individually, without clearly defined generic requirements. The NRC amended the decommissioning regulations in 1996 to clarify ambiguities and codify procedures and terminology as a means of enhancing efficiency and uniformity in the decommissioning process. The amendments allow for greater public participation and better define the transition process from operations to decommissioning. Under the revised regulations, licensees will submit written certification to the NRC within 30 days after the decision to cease operations. Certification will also be required once the fuel is permanently removed from the reactor vessel. Submittal of these notices, along with related changes to Technical Specifications, entitle the licensee to a fee reduction and eliminate the obligation to follow certain requirements needed only during operation of the reactor. Within two years of submitting notice of permanent cessation of operations, the licensee is required to submit a Post-Shutdown Decommissioning Activities Report (PSDAR) to the NRC. The PSDAR describes the planned decommissioning activities, the associated sequence and schedule, and an estimate of expected costs. Prior to completing
Oconee Nuclear Station Document D03-1671-003, Rev. 0 Decommissioning Cost Analysis Section 1, Page 5 of 9
TLG Services, Inc.
decommissioning, the licensee is required to submit an application to the NRC to terminate the license, which includes a license termination plan (LTP). 1.3.1 Nuclear Waste Policy Act
Congress passed the “Nuclear Waste Policy Act” (NWPA) in 1982,[7] assigning the federal government’s long-standing responsibility for disposal of the spent nuclear fuel created by the commercial nuclear generating plants to the DOE. The NWPA Amendments Act of 1987[8] designated Yucca Mountain as the sole site to be considered for a permanent geologic repository. The DOE was to begin accepting spent fuel by January 31, 1998; however, to date no progress in the removal of spent fuel from commercial generating sites has been made. Today, the country is at an impasse on high-level waste disposal, even with the License Application for a geologic repository submitted by the DOE to the NRC in 2008. The current administration has cut the budget for the repository program while promising to “conduct a comprehensive review of policies for managing the back end of the nuclear fuel cycle … and make recommendations for a new plan.” Towards this goal, the administration appointed a Blue Ribbon Commission on America’s Nuclear Future (Blue Ribbon Commission) to make recommendations for a new plan for nuclear waste disposal. On January 26, 2012, the Blue Ribbon Commission issued its “Report to the Secretary of Energy”[9] containing a number of recommendations on nuclear waste disposal. Two of the recommendations that may impact decommissioning planning are: “[T]he United States [should] establish a program that leads to
the timely development of one or more consolidated storage facilities”
“[T]he United States should undertake an integrated nuclear waste management program that leads to the timely development of one or more permanent deep geological facilities for the safe disposal of spent fuel and high-level nuclear waste.”
In January 2013, the DOE issued the “Strategy for the Management and Disposal of Used Nuclear Fuel and High-Level Radioactive Waste,” in response to the recommendations made by the Blue Ribbon Commission and as “a framework for moving toward a sustainable program to deploy an integrated system capable of transporting, storing, and disposing of used nuclear fuel...”[10]
Oconee Nuclear Station Document D03-1671-003, Rev. 0 Decommissioning Cost Analysis Section 1, Page 6 of 9
TLG Services, Inc.
“With the appropriate authorizations from Congress, the Administration currently plans to implement a program over the next 10 years that: Sites, designs and licenses, constructs and begins operations of a
pilot interim storage facility by 2021 with an initial focus on accepting used nuclear fuel from shut-down reactor sites;
Advances toward the siting and licensing of a larger interim storage facility to be available by 2025 that will have sufficient capacity to provide flexibility in the waste management system and allows for acceptance of enough used nuclear fuel to reduce expected government liabilities; and
Makes demonstrable progress on the siting and characterization of repository sites to facilitate the availability of a geologic repository by 2048.”
Completion of the decommissioning process is dependent upon the DOE’s ability to remove spent fuel from the site in a timely manner. DOE’s repository program had assumed that spent fuel allocations would be accepted for disposal from the nation’s commercial nuclear plants, with limited exceptions, in the order (the “queue”) in which it was discharged from the reactor.[11] Duke Energy’s current spent fuel management plan for the Oconee spent fuel is based in general upon: 1) a 2025 start date for DOE initiating transfer of commercial spent fuel to a federal facility (based upon the proposed timeline for the availability of the larger interim storage facility), 2) expectations for spent fuel receipt by the DOE for the Oconee fuel, and 3) reassignment of allocations between the Oconee, McGuire and Catawba units in the Duke Energy fleet so as to minimize on-site storage costs. The DOE’s generator allocation/receipt schedules are based upon the oldest fuel receiving the highest priority. Assuming a maximum rate of transfer of 3,000 metric tons of uranium (MTU)/year,[12] and the aforementioned assumptions on spent fuel management, the spent fuel from Oconee is completely removed from the site by 2058 if the units cease operating in 2033/2034. The NRC requires that licensees establish a program to manage and provide funding for the caretaking of all irradiated fuel at the reactor site until title of the fuel is transferred to the DOE.[13] Interim storage of the fuel, until the DOE has completed the transfer, will be in the fuel handling buildings’ storage pool as well as at an on-site ISFSI.
Oconee Nuclear Station Document D03-1671-003, Rev. 0 Decommissioning Cost Analysis Section 1, Page 7 of 9
TLG Services, Inc.
An ISFSI has been constructed to support continued plant operations. Spent fuel stored at the ISFSI will be transferred to the DOE once the spent fuel assemblies in the storage pools have been removed. Once the storage pools are emptied, the fuel handling buildings can be either decontaminated and dismantled or prepared for long-term storage. Duke Energy’s position is that the DOE has a contractual obligation to accept the spent fuel earlier than the projections set out above consistent with its contract commitments. No assumption made in this study should be interpreted to be inconsistent with this claim.
1.3.2 Low-Level Radioactive Waste Acts The contaminated and activated material generated in the decontamination and dismantling of a commercial nuclear reactor is classified as low-level (radioactive) waste, although not all of the material is suitable for “shallow-land” disposal. With the passage of the “Low-Level Radioactive Waste Policy Act” in 1980,[14] and its Amendments of 1985,[15] the states became ultimately responsible for the disposition of low-level radioactive waste generated within their own borders. South Carolina is a member of the three-state Atlantic Interstate Low-Level Radioactive Waste Management Compact, formed after South Carolina formally joined the Northeast Regional Compact. As such, the owners will continue to have access to the currently operating disposal facility in Barnwell, South Carolina. Disposition of the various waste streams produced by the decommissioning process considered all options and services currently available to Duke Energy. The majority of the low-level radioactive waste designated for direct disposal (Class A[16]) can be sent to EnergySolutions’ facility in Clive, Utah. The rate schedule for the Barnwell facility is used to generate disposal costs for the large components and the higher activity waste forms waste (Class B and C material). It is also assumed that Duke Energy can access other disposal sites, should it prove cost-effective. Low activity waste forms (concrete debris, dry-active waste) and metallic waste suspected of being contaminated are routed to a Tennessee-based radioactive waste processor for decontamination, volume reduction and/or disposal. The dismantling of the components residing closest to the reactor core generates radioactive waste that may be considered unsuitable for
Oconee Nuclear Station Document D03-1671-003, Rev. 0 Decommissioning Cost Analysis Section 1, Page 8 of 9
TLG Services, Inc.
shallow-land disposal (i.e., low-level radioactive waste with concentrations of radionuclides that exceed the limits established by the NRC for Class C radioactive waste (GTCC)). The Low-Level Radioactive Waste Policy Amendments Act of 1985 assigned the federal government the responsibility for the disposal of this material. The Act also stated that the beneficiaries of the activities resulting in the generation of such radioactive waste bear all reasonable costs of disposing of such waste. However, to date, the federal government has not identified a cost for disposing of GTCC or a schedule for acceptance. For purposes of this analysis, the GTCC radioactive waste is assumed to be packaged and disposed of in a similar manner as high-level waste and at a cost equivalent to that envisioned for the spent fuel. The GTCC is packaged in canisters compatible with the spent fuel dry storage system and either stored on site or shipped directly to a federal facility as it is generated (depending upon the timing of the decommissioning and whether the spent fuel has been removed from the site prior to the start of decommissioning). A significant portion of the waste material generated during decommissioning may only be potentially contaminated by radioactive materials. This waste can be analyzed on site or shipped off site to licensed facilities for further analysis, for processing and/or for conditioning/recovery. Reduction in the volume of low-level radioactive waste requiring disposal in a licensed low-level radioactive waste disposal facility can be accomplished through a variety of methods, including analyses and surveys or decontamination to eliminate the portion of waste that does not require disposal as radioactive waste, compaction, incineration or metal melt. The estimates reflect the savings from waste recovery/volume reduction.
1.3.3 Radiological Criteria for License Termination
In 1997, the NRC published Subpart E, “Radiological Criteria for License Termination,”[17] amending 10 CFR Part 20. This subpart provides radiological criteria for releasing a facility for unrestricted use. The regulation states that the site can be released for unrestricted use if radioactivity levels are such that the average member of a critical group would not receive a Total Effective Dose Equivalent (TEDE) in excess of 25 millirem per year, and provided that residual radioactivity has been reduced to levels that are As Low As Reasonably Achievable (ALARA). The decommissioning estimates assume that the Oconee site will be remediated to a residual level consistent with the NRC-prescribed level.
Oconee Nuclear Station Document D03-1671-003, Rev. 0 Decommissioning Cost Analysis Section 1, Page 9 of 9
TLG Services, Inc.
It should be noted that the NRC and the Environmental Protection Agency (EPA) differ on the amount of residual radioactivity considered acceptable in site remediation. The EPA has two limits that apply to radioactive materials. An EPA limit of 15 millirem per year is derived from criteria established by the Comprehensive Environmental Response, Compensation, and Liability Act (CERCLA or Superfund).[18] An additional and separate limit of 4 millirem per year, as defined in 40 CFR §141.16, is applied to drinking water.[19]
On October 9, 2002, the NRC signed an agreement with the EPA on the radiological decommissioning and decontamination of NRC-licensed sites. The Memorandum of Understanding (MOU)[20] provides that EPA will defer exercise of authority under CERCLA for the majority of facilities decommissioned under NRC authority. The MOU also includes provisions for NRC and EPA consultation for certain sites when, at the time of license termination, (1) groundwater contamination exceeds EPA-permitted levels; (2) NRC contemplates restricted release of the site; and/or (3) residual radioactive soil concentrations exceed levels defined in the MOU. The MOU does not impose any new requirements on NRC licensees and should reduce the involvement of the EPA with NRC licensees who are decommissioning. Most sites are expected to meet the NRC criteria for unrestricted use, and the NRC believes that only a few sites will have groundwater or soil contamination in excess of the levels specified in the MOU that trigger consultation with the EPA. However, if there are other hazardous materials on the site, the EPA may be involved in the cleanup. As such, the possibility of dual regulation remains for certain licensees. The present study does not include any costs for this occurrence.
Oconee Nuclear Station Document D03-1671-003, Rev. 0 Decommissioning Cost Analysis Section 2, Page 1 of 13
TLG Services, Inc.
2. DECOMMISSIONING ALTERNATIVES Detailed cost estimates were developed to decommission Oconee based upon the NRC-approved decommissioning alternatives DECON and SAFSTOR. Although the alternatives differ with respect to technique, process, cost, and schedule, they attain the same result: the ultimate release of the site for unrestricted use. Two decommissioning scenarios were evaluated for the Oconee Nuclear Station. The scenarios selected are representative of alternatives available and are defined as follows: 1. The first scenario assumes that the station would be promptly decommissioned
(DECON alternative) upon the expiration of the current operating licenses, i.e., in 2033 and 2034. The spent fuel in the plant’s spent fuel storage pools is transferred to the DOE within ten years of Unit 3 ceasing operation. The equipment, structures, and portions of the plant containing radioactive contaminants are removed or decontaminated to a level that permits the facility to be released for unrestricted use. Site structures are then demolished. Spent fuel storage operations continue at the site until the transfer of the fuel to the DOE is complete, assumed to be in the year 2058.
2. In the second scenario, the nuclear station is placed into safe-storage (SAFSTOR
alternative) at the end of its current operating license. The spent fuel in the plant’s spent fuel storage pools is transferred to the DOE and the plant reconfigured for long-term storage. Spent fuel storage operations continue at the site until the transfer of the fuel to the DOE is complete, assumed to be in the year 2058. Decommissioning operations commence in 2085, with the decontamination and dismantling of Oconee completed in 2093, sixty years after the cessation of Unit 1 operations. Site structures are then demolished.
The following sections describe the basic activities associated with each alternative. Although detailed procedures for each activity identified are not provided, and the actual sequence of work may vary, the activity descriptions provide a basis not only for estimating but also for the expected scope of work, i.e., engineering and planning at the time of decommissioning. The conceptual approach that the NRC has described in its regulations divides decommissioning into three phases. The initial phase commences with the effective date of permanent cessation of operations and involves the transition of both plant and licensee from reactor operations (i.e., power production) to facility de-activation and closure. During the first phase, notification is to be provided to the NRC
Oconee Nuclear Station Document D03-1671-003, Rev. 0 Decommissioning Cost Analysis Section 2, Page 2 of 13
TLG Services, Inc.
certifying the permanent cessation of operations and the removal of fuel from the reactor vessel. The licensee is then prohibited from reactor operation. The second phase encompasses activities during the storage period or during major decommissioning activities, or a combination of the two. The third phase pertains to the activities involved in license termination. The decommissioning estimates developed for Oconee are also divided into phases or periods; however, demarcation of the phases is based upon major milestones within the project or significant changes in the projected expenditures. 2.1 DECON
The DECON alternative, as defined by the NRC, is "the alternative in which the equipment, structures, and portions of a facility and site containing radioactive contaminants are removed or decontaminated to a level that permits the property to be released for unrestricted use shortly after cessation of operations." This study does not address the cost to dispose of the spent fuel residing at the site; such costs are funded through a surcharge on electrical generation. However, the study does estimate the costs incurred with the interim on-site storage of the fuel pending shipment by the DOE to an off-site disposal facility. 2.1.1 Period 1 - Preparations
In anticipation of the cessation of plant operations, detailed preparations are undertaken to provide a smooth transition from plant operations to site decommissioning. Through implementation of a staffing transition plan, the organization required to manage the intended decommissioning activities is assembled from available plant staff and outside resources. Preparations include the planning for permanent defueling of the reactor, revision of technical specifications applicable to the operating conditions and requirements, a characterization of the facility and major components, and the development of the PSDAR. Engineering and Planning The PSDAR, required prior to or within two years of permanent cessation of operations, provides a description of the licensee’s planned decommissioning activities, a timetable, and the associated financial requirements of the intended decommissioning program. Upon receipt of the PSDAR, the NRC will make the document available to the public for comment in a local hearing to be held in the vicinity of the reactor site.

Oconee Nuclear Station Document D03-1671-003, Rev. 0 Decommissioning Cost Analysis Section 2, Page 3 of 13
TLG Services, Inc.
Ninety days following submittal and NRC receipt of the PSDAR, the licensee may begin to perform major decommissioning activities under a modified 10 CFR §50.59 procedure, i.e., without specific NRC approval. Major activities are defined as any activity that results in permanent removal of major radioactive components, permanently modifies the structure of the containment, or results in dismantling components (for shipment) containing GTCC, as defined by 10 CFR §61. Major components are further defined as comprising the reactor vessel and internals, large bore reactor coolant system piping, and other large components that are radioactive. The NRC includes the following additional criteria for use of the §50.59 process in decommissioning. The proposed activity must not: foreclose release of the site for possible unrestricted use,
significantly increase decommissioning costs,
cause any significant environmental impact, or
violate the terms of the licensee’s existing license Existing operational technical specifications are reviewed and modified to reflect plant conditions and the safety concerns associated with permanent cessation of operations. The environmental impact associated with the planned decommissioning activities is also considered. Typically, a licensee will not be allowed to proceed if the consequences of a particular decommissioning activity are greater than that bounded by previously evaluated environmental assessments or impact statements. In this instance, the licensee would have to submit a license amendment for the specific activity and update the environmental report. The decommissioning program outlined in the PSDAR will be designed to accomplish the required tasks within the ALARA guidelines (as defined in 10 CFR §20) for protection of personnel from exposure to radiation hazards. It will also address the continued protection of the health and safety of the public and the environment during the dismantling activity. Consequently, with the development of the PSDAR, activity specifications, cost-benefit and safety analyses, work packages, and procedures, would be assembled to support the proposed decontamination and dismantling activities. Site Preparations Following final plant shutdown, and in preparation for actual decommissioning activities, the following activities are initiated:
Oconee Nuclear Station Document D03-1671-003, Rev. 0 Decommissioning Cost Analysis Section 2, Page 4 of 13
TLG Services, Inc.
Characterization of the site and surrounding environs. This includes radiation surveys of work areas, major components (including the reactor vessel and its internals), internal piping, and biologic shield cores.
Isolation of the spent fuel storage pools and fuel handling systems, such that decommissioning operations can commence on the balance of the plant. The pools will remain operational for ten years following the cessation of Unit 3 operations before the inventory resident at shutdown can be transferred to the DOE.
Specification of transport and disposal requirements for activated materials and/or hazardous materials, including shielding and waste stabilization.
Development of procedures for occupational exposure control, control and release of liquid and gaseous effluent, processing of radwaste (including dry-active waste, resins, filter media, metallic and non-metallic components generated in decommissioning), site security and emergency programs, and industrial safety.
2.1.2 Period 2 - Decommissioning Operations
This period includes the physical decommissioning activities associated with the removal and disposal of contaminated and activated components and structures, including the successful release of the site from the 10 CFR §50 operating license, exclusive of the ISFSI. Significant decommissioning activities in this phase include: Construction of temporary facilities and/or modification of existing
facilities to support dismantling activities. For example, this will include a centralized processing area to facilitate equipment removal and component preparations for off-site disposal.
Reconfiguration and modification of site structures and facilities as needed to support decommissioning operations. This will include the upgrading of roads (on- and off-site) to facilitate hauling and transport. Modifications will be required to the containment structure to facilitate access of large/heavy equipment. Modifications will also be required to the refueling area of the Reactor Building to support the segmentation of the reactor vessel internals and component extraction.
Transfer of the spent fuel from the storage pools to the DOE.
Oconee Nuclear Station Document D03-1671-003, Rev. 0 Decommissioning Cost Analysis Section 2, Page 5 of 13
TLG Services, Inc.
Design and fabrication of temporary and permanent shielding to support removal and transportation activities, construction of contamination control envelopes, and the procurement of specialty tooling.
Procurement (lease or purchase) of shipping casks, cask liners, and industrial packages.
Decontamination of components and piping systems as required to control (minimize) worker exposure.
Removal of piping and components no longer essential to support decommissioning operations.
Removal of control rod drive housings and the head service structure from reactor vessel head. Segmentation of the vessel closure head.
Removal and segmentation of the upper internals assemblies. Segmentation will maximize the loading of the shielded transport casks, i.e., by weight and activity. The operations are conducted under water using remotely operated tooling and contamination controls.
Disassembly and segmentation of the remaining reactor internals, including the core former and lower core support assembly. Some material is expected to exceed Class C disposal requirements. As such, the segments will be packaged in modified fuel storage canisters for geologic disposal.
Segmentation of the reactor vessel. A shielded platform is installed for segmentation as cutting operations are performed in-air using remotely operated equipment within a contamination control envelope. The water level is maintained just below the cut to minimize the working area dose rates. Segments are transferred in-air to containers that are stored under water, for example, in an isolated area of the refueling canal.
Removal of the activated portions of the concrete biological shield and accessible contaminated concrete surfaces. If dictated by the steam generator and pressurizer removal scenarios, those portions of the associated cubicles necessary for access and component extraction are removed.
Removal of the steam generators and pressurizer for material recovery and controlled disposal. These components can serve as their own burial containers provided that all penetrations are properly sealed and the internal contaminants are stabilized, e.g., with grout. Steel shielding will be added, as necessary, to those
Oconee Nuclear Station Document D03-1671-003, Rev. 0 Decommissioning Cost Analysis Section 2, Page 6 of 13
TLG Services, Inc.
external areas of the package to meet transportation limits and regulations.
At least two years prior to the anticipated date of license termination, an LTP is required. Submitted as a supplement to the Final Safety Analysis Report (FSAR) or its equivalent, the plan must include: a site characterization, description of the remaining dismantling activities, plans for site remediation, procedures for the final radiation survey, designation of the end use of the site, an updated cost estimate to complete the decommissioning, and any associated environmental concerns. The NRC will notice the receipt of the plan, make the plan available for public comment, and schedule a local hearing. LTP approval will be subject to any conditions and limitations as deemed appropriate by the Commission. The licensee may then commence with the final remediation of site facilities and services, including:
Removal of remaining plant systems and associated components as
they become nonessential to the decommissioning program or worker health and safety (e.g., waste collection and treatment systems, electrical power and ventilation systems).
Removal of the steel liners from refueling canal, disposing of the activated and contaminated sections as radioactive waste. Removal of any activated/ contaminated concrete.
Surveys of the decontaminated areas of the containment structure.
Remediation and removal of the contaminated equipment and material from the auxiliary and fuel buildings and any other contaminated facility. Radiation and contamination controls will be utilized until residual levels indicate that the structures and equipment can be released for unrestricted access and conventional demolition. This activity may necessitate the dismantling and disposition of most of the systems and components (both clean and contaminated) located within these buildings. This activity facilitates surface decontamination and subsequent verification surveys required prior to obtaining release for demolition.
Routing of material removed in the decontamination and dismantling to a central processing area. Material certified to be free of contamination is released for unrestricted disposition, e.g., as scrap, recycle, or general disposal. Contaminated material is characterized and segregated for additional off-site processing (disassembly, chemical cleaning, volume reduction, and waste treatment), and/or

Oconee Nuclear Station Document D03-1671-003, Rev. 0 Decommissioning Cost Analysis Section 2, Page 7 of 13
TLG Services, Inc.
packaged for controlled disposal at a low-level radioactive waste disposal facility.
Incorporated into the LTP is the Final Survey Plan. This plan identifies the radiological surveys to be performed once the decontamination activities are completed and is developed using the guidance provided in the “Multi-Agency Radiation Survey and Site Investigation Manual (MARSSIM).”[21] This document incorporates the statistical approaches to survey design and data interpretation used by the EPA. It also identifies commercially available instrumentation and procedures for conducting radiological surveys. Use of this guidance ensures that the surveys are conducted in a manner that provides a high degree of confidence that applicable NRC criteria are satisfied. Once the survey is complete, the results are provided to the NRC in a format that can be verified. The NRC then reviews and evaluates the information, performs an independent confirmation of radiological site conditions, and makes a determination on the requested change to the operating license (that would release the property, exclusive of the ISFSI, for unrestricted use). The NRC will amend the operating license if it determines that site remediation has been performed in accordance with the LTP, and that the terminal radiation survey and associated documentation demonstrate that the property (exclusive of the ISFSI) is suitable for release.
2.1.3 Period 3 - Site Restoration Following completion of decommissioning operations, site restoration activities can begin. Efficient removal of the contaminated materials and verification that residual radionuclide concentrations are below the NRC limits will result in substantial damage to many of the structures. Although performed in a controlled, safe manner, blasting, coring, drilling, scarification (surface removal), and the other decontamination activities will substantially degrade power block structures including the reactor, fuel handling, radioactive waste, solidification facility and condensate polishing buildings. Under certain circumstances, verifying that subsurface radionuclide concentrations meet NRC site release requirements will require removal of grade slabs and lower floors, potentially weakening footings and structural supports. This removal activity will be necessary for those facilities and plant areas where historical records, when available, indicate the potential for radionuclides having been present in the soil, where system failures
Oconee Nuclear Station Document D03-1671-003, Rev. 0 Decommissioning Cost Analysis Section 2, Page 8 of 13
TLG Services, Inc.
have been recorded, or where it is required to confirm that subsurface process and drain lines were not breached over the operating life of the station. It is not currently anticipated that these structures would be repaired and preserved after the radiological contamination is removed. The cost to dismantle site structures with a work force already mobilized on site is more efficient than if the process is deferred. This cost study presumes that site structures and other facilities are dismantled as a continuation of the decommissioning activity. Foundations and exterior walls are removed to a nominal depth of three feet below grade. The three-foot depth allows for the placement of gravel for drainage, as well as topsoil, so that vegetation can be established for erosion control. Site areas affected by the dismantling activities are restored and the plant area graded as required to prevent ponding and inhibit the refloating of subsurface materials. Non-contaminated concrete rubble produced by demolition activities is processed to remove reinforcing steel and miscellaneous embedments. The processed material is then used on site to backfill foundation voids. Excess non-contaminated materials are trucked to an off-site area for disposal as construction debris.
2.1.4 ISFSI Operations and Decommissioning Transfer of spent fuel to a DOE repository or interim facility is assumed to be exclusively from the ISFSI once the fuel pools have been emptied and the fuel handling buildings released for decommissioning. The ISFSI will continue to operate as an independent facility following the amendment of the operating license to release the adjacent (power block) property. Assuming the DOE starts accepting fuel from Oconee in 2031, transfer of spent fuel from the ISFSI is anticipated to continue through the year 2058. At the conclusion of the spent fuel transfer process, the ISFSI will be decommissioned. The Commission will terminate the license(s) if it determines that the remediation of the ISFSI has been performed in accordance with an ISFSI license termination plan and that the final radiation survey and associated documentation demonstrate that the
Oconee Nuclear Station Document D03-1671-003, Rev. 0 Decommissioning Cost Analysis Section 2, Page 9 of 13
TLG Services, Inc.
facility is suitable for release. Once the requirements are satisfied, the NRC can terminate the license(s) for the ISFSI. The ISFSI is comprised of a series of horizontal storage modules and dry storage canisters located on pre-cast concrete storage pads. For purposes of this cost analysis, it is assumed that once the inner canisters containing the spent fuel assemblies have been removed, any required decontamination performed, and the license(s) for the facility terminated, the modules can be dismantled using conventional techniques for the demolition of reinforced concrete. The concrete storage pads will then be removed, and the area graded and landscaped to conform to the surrounding environment.
2.2 SAFSTOR
The NRC defines SAFSTOR as "the alternative in which the nuclear facility is placed and maintained in a condition that allows the nuclear facility to be safely stored and subsequently decontaminated (deferred decontamination) to levels that permit release for unrestricted use." The facility is left intact (during the dormancy period), with structures maintained in a sound condition. Systems that are not required to support the spent fuel pools or site surveillance and security are drained, de-energized, and secured. Minimal cleaning/removal of loose contamination and/or fixation and sealing of remaining contamination are performed. Access to contaminated areas is secured to provide controlled access for inspection and maintenance. The engineering and planning requirements are similar to those for the DECON alternative, although a shorter time period is expected for these activities due to the more limited work scope. Site preparations are also similar to those for the DECON alternative. However, with the exception of the required radiation surveys and site characterizations, the mobilization and preparation of site facilities is less extensive. 2.2.1 Period 1 - Preparations
Preparations for long-term storage include the planning for permanent defueling of the reactor, revision of technical specifications appropriate to the operating conditions and requirements, a characterization of the facility and major components, and the development of the PSDAR. The process of placing the plant in safe-storage includes, but is not limited to, the following activities:
Oconee Nuclear Station Document D03-1671-003, Rev. 0 Decommissioning Cost Analysis Section 2, Page 10 of 13
TLG Services, Inc.
Isolation of the spent fuel storage services and fuel handling systems so that safe-storage operations may commence on the balance of the plant. This activity may be carried out by plant personnel in accordance with existing operating technical specifications. Activities are scheduled around the fuel handling systems to the greatest extent possible.
Transferring the spent fuel from the storage pools to the DOE, following the minimum required cooling period in the spent fuel pools.
Draining and de-energizing of the non-contaminated systems not required to support continued site operations or maintenance.
Disposing of contaminated filter elements and resin beds not required for processing wastes from layup activities for future operations.
Draining of the reactor vessel, with the internals left in place and the vessel head secured.
Draining and de-energizing non-essential, contaminated systems including decontamination as required for future maintenance and inspection.
Preparing lighting and alarm systems whose continued use is required; de-energizing portions of fire protection, electric power, and HVAC systems whose continued use is not required.
Cleaning of the loose surface contamination from building access pathways.
Performing an interim radiation survey of plant, posting warning signs where appropriate.
Erecting physical barriers and/or securing all access to radioactive or contaminated areas, except as required for inspection and maintenance.
Installing security and surveillance monitoring equipment and relocating security fence around secured structures, as required.
2.2.2 Period 2 - Dormancy
The second phase identified by the NRC in its rule addresses licensed activities during a storage period and is applicable to the dormancy phases of the deferred decommissioning alternatives. Dormancy activities include a 24-hour security force, preventive and corrective maintenance on security systems, area lighting, general building
Oconee Nuclear Station Document D03-1671-003, Rev. 0 Decommissioning Cost Analysis Section 2, Page 11 of 13
TLG Services, Inc.
maintenance, heating and ventilation of buildings, routine radiological inspections of contaminated structures, maintenance of structural integrity, and a site environmental and radiation monitoring program. Resident maintenance personnel perform equipment maintenance, inspection activities, routine services to maintain safe conditions, adequate lighting, heating, and ventilation, and periodic preventive maintenance on essential site services. An environmental surveillance program is carried out during the dormancy period to ensure that releases of radioactive material to the environment are prevented or detected and controlled. Appropriate emergency procedures are established and initiated for potential releases that exceed prescribed limits. The environmental surveillance program constitutes an abbreviated version of the program in effect during normal plant operations. Security during the dormancy period is conducted primarily to prevent unauthorized entry and to protect the public from the consequences of its own actions. The security fence, sensors, alarms, and other surveillance equipment are maintained throughout the dormancy period. Fire and radiation alarms are also functional. Consistent with the DECON scenario, the spent fuel storage pools are emptied within ten years of the cessation of Unit 3 operations. The transfer of the spent fuel from the ISFSI to a DOE facility begins in 2031 and continues throughout the dormancy period until completed in 2058. Once emptied, the ISFSI is decommissioned along with the power block structures in Period 4. After a period of storage (such that license termination is accomplished within 60 years of final shutdown), it is required that the licensee submit an application to terminate the license, along with a LTP (described in Section 2.1.2), thereby initiating the third phase.
2.2.3 Periods 3 and 4 - Delayed Decommissioning
Prior to the commencement of decommissioning operations, preparations are undertaken to reactivate site services and prepare for decommissioning. Preparations include engineering and planning, a detailed site characterization, and the assembly of a decommissioning management organization. Final planning and the assembly of activity specifications and detailed work procedures are also initiated at this time.
Oconee Nuclear Station Document D03-1671-003, Rev. 0 Decommissioning Cost Analysis Section 2, Page 12 of 13
TLG Services, Inc.
Much of the work in developing a termination plan is relevant to the development of the detailed engineering plans and procedures. The activities associated with this phase and the follow-on decontamination and dismantling processes are detailed in Sections 2.1.1 and 2.1.2. The primary difference between the sequences anticipated for the DECON and this deferred scenario is the absence, in the latter, of any constraint on the dismantling process due to the operation of the spent fuel pools in the DECON option. Radioactive decay over the length of the dormancy period will have some effect upon the quantities of radioactive wastes generated from system and structure removal operations. However, given the levels of radioactivity and spectrum of radionuclides expected from sixty years of plant operation, no plant process system identified as being contaminated upon final shutdown will become releasable due to the decay period alone. However, due to the lower activity levels, a greater percentage of the waste volume can be designated for off-site processing and recovery. The delay in decommissioning also yields lower working area radiation levels. As such, the estimate for this delayed scenario incorporates reduced ALARA controls for the SAFSTOR's lower occupational exposure potential. Although the initial radiation levels due to 60Co will substantially decrease during the dormancy period, the internal components of the reactor vessel will still exhibit sufficiently high radiation dose rates to require remote sectioning under water due to the presence of long-lived radionuclides such as 94Nb, 59Ni, and 63Ni. Therefore, the dismantling procedures described for the DECON alternative would still be employed during this scenario. Portions of the biological shield will still be radioactive due to the presence of activated trace elements with long half-lives (152Eu and 154Eu). Decontamination will require controlled removal and disposal. It is assumed that radioactive corrosion products on inner surfaces of piping and components will not have decayed to levels that will permit unrestricted use or allow conventional removal. These systems and components will be surveyed as they are removed and disposed of in accordance with the existing radioactive release criteria.
Oconee Nuclear Station Document D03-1671-003, Rev. 0 Decommissioning Cost Analysis Section 2, Page 13 of 13
TLG Services, Inc.
2.2.4 Period 5 - Site Restoration Following completion of decommissioning operations, site-restoration activities begin. Dismantling, as a continuation of the decommissioning process is a cost-effective option, as described in Section 2.1.3. The basis for the dismantling cost is consistent with that described for DECON, presuming the removal of structures and site facilities to a nominal depth of three feet below grade and the limited restoration of the site.
Oconee Nuclear Station Document D03-1671-003, Rev. 0 Decommissioning Cost Analysis Section 3, Page 1 of 52
TLG Services, Inc.
3. COST ESTIMATES The cost estimates prepared for decommissioning Oconee consider the unique features of the site, including the nuclear steam supply system, electric power generating systems, structures, and supporting facilities. The basis of the estimates, including the sources of information relied upon, the estimating methodology employed, site-specific considerations, and other pertinent assumptions, is described in this section. 3.1 BASIS OF ESTIMATES
The current estimates were developed using the site-specific, technical information relied upon in the decommissioning analysis prepared in 2008. This information was reviewed for the current analysis and updated as deemed appropriate. The site-specific considerations and assumptions used in the previous evaluation were also revisited. Modifications were incorporated where new information was available or experience from ongoing decommissioning programs provided viable alternatives or improved processes.
3.2 METHODOLOGY The methodology used to develop the estimates follows the basic approach originally presented in the AIF/NESP-036 study report, "Guidelines for Producing Commercial Nuclear Power Plant Decommissioning Cost Estimates,"[22] and the DOE "Decommissioning Handbook."[23] These documents present a unit factor method for estimating decommissioning activity costs, which simplifies the estimating calculations. Unit factors for concrete removal ($/cubic yard), steel removal ($/ton), and cutting costs ($/inch) are developed using local labor rates. The activity-dependent costs are estimated with the item quantities (cubic yards and tons), developed from plant drawings and inventory documents. Removal rates and material costs for the conventional disposition of components and structures rely upon information available in the industry publication, "Building Construction Cost Data," published by R.S. Means.[24] The unit factor method provides a demonstrable basis for establishing reliable cost estimates. The detail provided in the unit factors, including activity duration, labor costs (by craft), and equipment and consumable costs, ensures that essential elements have not been omitted. Appendix A presents the detailed development of a typical unit factor. Appendix B provides the values contained within one set of factors developed for this analysis.
Oconee Nuclear Station Document D03-1671-003, Rev. 0 Decommissioning Cost Analysis Section 3, Page 2 of 52
TLG Services, Inc.
This analysis reflects lessons learned from TLG’s involvement in the Shippingport Station Decommissioning Project, completed in 1989, as well as the decommissioning of the Cintichem reactor, hot cells, and associated facilities, completed in 1997. In addition, the planning and engineering for the Pathfinder, Shoreham, Rancho Seco, Trojan, Yankee Rowe, Big Rock Point, Maine Yankee, Humboldt Bay-3, Oyster Creek, Connecticut Yankee, and San Onofre-1 nuclear units have provided additional insight into the process, the regulatory aspects, and the technical challenges of decommissioning commercial nuclear units. Work Difficulty Factors TLG has historically applied work difficulty adjustment factors (WDFs) to account for the inefficiencies in working in a power plant environment. WDFs are assigned to each unique set of unit factors, commensurate with the inefficiencies associated with working in confined, hazardous environments. The ranges used for the WDFs are as follows:
Access Factor 10% to 20%
Respiratory Protection Factor 10% to 50%
Radiation/ALARA Factor 10% to 37%
Protective Clothing Factor 10% to 30%
Work Break Factor 8.33% The factors and their associated range of values were developed in conjunction with the AIF/NESP-036 study. The application of the factors is discussed in more detail in that publication. Scheduling Program Durations The unit factors, adjusted by the WDFs as described above, are applied against the inventory of materials to be removed in the radiological controlled areas. The resulting labor-hours, or crew-hours, are used in the development of the decommissioning program schedule, using resource loading and event sequencing considerations. The scheduling of conventional removal and dismantling activities is based upon productivity information available from the "Building Construction Cost Data" publication. In the DECON alternative, dismantling of the fuel handing building systems and decontamination of the spent fuel pools is also dependent upon the timetable for the transfer of the spent fuel assemblies from the pool to the DOE.

Oconee Nuclear Station Document D03-1671-003, Rev. 0 Decommissioning Cost Analysis Section 3, Page 3 of 52
TLG Services, Inc.
An activity duration critical path is used to determine the total decommissioning program schedule. The schedule is relied upon in calculating the carrying costs, which include program management, administration, field engineering, equipment rental, and support services such as quality control and security. This systematic approach for assembling decommissioning estimates ensures a high degree of confidence in the reliability of the resulting costs.
3.3 FINANCIAL COMPONENTS OF THE COST MODEL
TLG’s proprietary decommissioning cost model, DECCER, produces a number of distinct cost elements. These direct expenditures, however, do not comprise the total cost to accomplish the project goal, i.e., license termination, spent fuel management and site restoration. 3.3.1 Contingency
Inherent in any cost estimate that does not rely on historical data is the inability to specify the precise source of costs imposed by factors such as tool breakage, accidents, illnesses, weather delays, and labor stoppages. In the DECCER cost model, contingency fulfills this role. Contingency is added to each line item to account for costs that are difficult or impossible to develop analytically. Such costs are historically inevitable over the duration of a job of this magnitude; therefore, this cost analysis includes funds to cover these types of expenses. The activity- and period-dependent costs are combined to develop the total decommissioning cost. A contingency is then applied on a line-item basis, using one or more of the contingency types listed in the AIF/NESP-036 study. "Contingencies" are defined in the American Association of Cost Engineers “Project and Cost Engineers' Handbook”[25] as "specific provision for unforeseeable elements of cost within the defined project scope; particularly important where previous experience relating estimates and actual costs has shown that unforeseeable events which will increase costs are likely to occur." The cost elements in this analysis are based upon ideal conditions and maximum efficiency; therefore, consistent with industry practice, contingency is included. In the AIF/NESP-036 study, the types of unforeseeable events that are likely to occur in decommissioning are discussed and guidelines are provided for a contingency percentage in each category. It should be noted that contingency, as used in this analysis, does not account for price escalation and inflation in the cost of decommissioning over the remaining operating life of the station.

Oconee Nuclear Station Document D03-1671-003, Rev. 0 Decommissioning Cost Analysis Section 3, Page 4 of 52
TLG Services, Inc.
Contingency funds are an integral part of the total cost to complete the decommissioning process. Exclusion of this component puts at risk a successful completion of the intended tasks and, potentially, subsequent related activities. For this study, TLG examined the major activity-related problems (decontamination, segmentation, equipment handling, packaging, transport, and waste disposal) that necessitate a contingency. Individual activity contingencies ranged from 10% to 75%, depending on the degree of difficulty judged to be appropriate from TLG’s actual decommissioning experience. The contingency values used in this study are as follows: Decontamination 50% Contaminated Component Removal 25% Contaminated Component Packaging 10% Contaminated Component Transport 15% Low-Level Radioactive Waste Disposal 25% Low-Level Radioactive Waste Processing 15%
Reactor Segmentation 75% NSSS Component Removal 25% Reactor Waste Packaging 25% Reactor Waste Transport 25% Reactor Vessel Component Disposal 50% GTCC Disposal 15%
Non-Radioactive Component Removal 15% Heavy Equipment and Tooling 15% Construction 15% Supplies 25% Engineering 15% Energy 15%
Characterization and Termination Surveys 30% Spent Fuel Transfer 15% Operations and Maintenance 15% Taxes and Fees 10% Insurance 10% Staffing (plant, contractor and security) 15%
The contingency values are applied to the appropriate components of the estimates on a line item basis. A composite value is then reported at the end of each detailed estimate (as provided in Appendices C and D). For example, the composite contingency value reported for the DECON
Oconee Nuclear Station Document D03-1671-003, Rev. 0 Decommissioning Cost Analysis Section 3, Page 5 of 52
TLG Services, Inc.
alternative in Appendix C is approximately 19.0%; the corresponding SAFSTOR alternative in Appendix D is approximately 17.8%.
3.3.2 Financial Risk
In addition to the routine uncertainties addressed by contingency, another cost element that is sometimes necessary to consider when bounding decommissioning costs relates to uncertainty, or risk. Examples can include changes in work scope, pricing, job performance, and other variations that could conceivably, but not necessarily, occur. Consideration is sometimes necessary to generate a level of confidence in the estimate, within a range of probabilities. TLG considers these types of costs under the broad term “financial risk.” Included within the category of financial risk are: Transition activities and costs: ancillary expenses associated with
eliminating 50% to 80% of the site labor force shortly after the cessation of plant operations, added cost for worker separation packages throughout the decommissioning program, national or company-mandated retraining, and retention incentives for key personnel.
Delays in approval of the decommissioning plan due to intervention, public participation in local community meetings, legal challenges, and national and local hearings.
Changes in the project work scope from the baseline estimate, involving the discovery of unexpected levels of contaminants, contamination in places not previously expected, contaminated soil previously undiscovered (either radioactive or hazardous material contamination), variations in plant inventory or configuration not indicated by the as-built drawings.
Regulatory changes, for example, affecting worker health and safety, site release criteria, waste transportation, and disposal.
Policy decisions altering national commitments (e.g., in the ability to accommodate certain waste forms for disposition, or in the timetable for such, or the start and rate of acceptance of spent fuel by the DOE.
Pricing changes for basic inputs such as labor, energy, materials, and waste disposal.
This cost study does not add any additional costs to the estimate for financial risk, since there is insufficient historical data from which to project future liabilities. Consequently, the areas of uncertainty or risk
Oconee Nuclear Station Document D03-1671-003, Rev. 0 Decommissioning Cost Analysis Section 3, Page 6 of 52
TLG Services, Inc.
are revisited periodically and addressed through repeated revisions or updates of the base estimates.
3.4 SITE-SPECIFIC CONSIDERATIONS There are a number of site-specific considerations that affect the method for dismantling and removal of equipment from the site and the degree of restoration required. The cost impact of the considerations identified below is included in this cost study. 3.4.1 Spent Fuel Management
The cost to dispose the spent fuel generated from plant operations is not reflected within the estimates to decommission Oconee. Ultimate disposition of the spent fuel is within the province of the DOE’s Waste Management System, as defined by the Nuclear Waste Policy Act. As such, the disposal cost is financed by a 1 mill/kWhr surcharge paid into the DOE’s waste fund during operations. However, the NRC requires licensees to establish a program to manage and provide funding for the management of all irradiated fuel at the reactor site until title of the fuel is transferred to the Secretary of Energy. This requirement is prepared for through inclusion of certain high-level waste cost elements within the estimates, as described below. Completion of the decommissioning process is highly dependent upon the DOE’s ability to remove spent fuel from the site. The timing for removal of spent fuel from the site is based upon the DOE’s most recently published annual acceptance rates of 400 MTU/year for year 1, 3,800 MTU total for years 2 through 4 and 3,000 MTU/year for year 5 and beyond.[26] The DOE contracts provide mechanisms for altering the oldest fuel first allocation scheme, including emergency deliveries, exchanges of allocations amongst utilities and the option of providing priority acceptance from permanently shut down nuclear reactors. Because it is unclear how these mechanisms may operate once DOE begins accepting spent fuel from commercial reactors, this study assumes that DOE will accept spent fuel in an oldest fuel first order. ISFSI An ISFSI has been constructed within the protected area to support continued plant operations. The ISFSI will be expected to operate throughout decommissioning, and beyond the conclusion of the remediation phase in the DECON decommissioning scenario, until such
Oconee Nuclear Station Document D03-1671-003, Rev. 0 Decommissioning Cost Analysis Section 3, Page 7 of 52
TLG Services, Inc.
time that the transfer of spent fuel to the DOE can be completed. The scenario is similar for the SAFSTOR alternative; however, based upon the expected completion date for fuel transfer, the ISFSI will be emptied prior to the commencement of decommissioning operations. Operation and maintenance costs for the spent fuel pools and the ISFSI are included within the estimates and address the cost for staffing the facility, as well as other costs (e.g., security, insurance, and licensing fees). The estimates also include the costs to transfer the transportable storage canisters to the DOE. Costs are also provided for the final disposition of the facilities once the transfer is complete. Storage Canister Design The design and capacity of the ISFSI is based upon the NUHOMS® dry cask storage system. The system consists of a transportable storage canister with a nominal capacity of 24 fuel assemblies and a horizontal concrete storage module. For fuel transferred directly from the pools to the DOE, the DOE was assumed to provide Transport, Aging and Disposal (TAD) canisters with a 21 assembly capacity at no additional cost to the owner. Canister Loading and Transfer The estimates include the cost for the materials and labor equipment to seal and load each spent fuel canister (TAD) into the DOE transport cask from the wet storage pools and an allowance to transfer each spent fuel canister from the ISFSI to the DOE. Operations and Maintenance The estimates also include the cost of operating and maintaining the spent fuel pools and the ISFSI, respectively. Pool operations are expected to continue approximately ten years after the cessation of Unit 3 operations. ISFSI operating costs are based upon the previously stated assumptions on fuel transfer expectations. ISFSI Decommissioning In accordance with 10 CFR §72.30, licensees must have a proposed decommissioning plan for the ISFSI site and facilities that includes a cost estimate to implement. The plan should contain sufficient
Oconee Nuclear Station Document D03-1671-003, Rev. 0 Decommissioning Cost Analysis Section 3, Page 8 of 52
TLG Services, Inc.
information on the proposed practices and procedures for the decontamination of the ISFSI and for the disposal of residual radioactive materials after all spent fuel, high-level radioactive waste, and reactor-related GTCC waste have been removed.
A multi-purpose (storage and transport) dry shielded storage canister with a horizontal, reinforced concrete storage module is used as a basis for the cost analysis. As an allowance for module remediation, 24 modules are assumed to have some level of neutron-induced activation (i.e., to levels exceeding free-release limits), equivalent to the number of modules required to accommodate the final core off load. The steel support structure is assumed to be removed from these modules and sent, along with the concrete, for controlled disposal. The cost of the disposition of this material, as well as the demolition of the ISFSI facility, is included in the estimate. The cost estimate for decommissioning the ISFSI reflects: 1) the cost of an independent contractor performing the decommissioning activities; 2) an adequate contingency factor; and 3) the cost of meeting the criteria for unrestricted use. The cost summary for decommissioning the ISFSI is presented in Appendix E.
GTCC The dismantling of the reactor internals is expected to generate radioactive waste considered unsuitable for shallow land disposal (i.e., low-level radioactive waste with concentrations of radionuclides that exceed the limits established by the NRC for Class C radioactive waste (GTCC)). The Low-Level Radioactive Waste Policy Amendments Act of 1985 assigned the federal government the responsibility for the disposal of this material. The Act also stated that the beneficiaries of the activities resulting in the generation of such radioactive waste bear all reasonable costs of disposing of such waste. Although the DOE is responsible for disposing of GTCC waste, any costs for that service have not been determined. For purposes of this estimate, the GTCC is packaged in canisters compatible with the spent fuel dry storage system and disposed of at a cost equivalent to that envisioned for the spent fuel. It is assumed that the DOE would not accept this waste prior to completing the transfer of spent fuel. Therefore, until such time the DOE is ready to accept GTCC waste, it is reasonable to assume that this material would remain in storage at the Oconee site (for the DECON alternative). In the SAFSTOR scenario, the GTCC material is shipped
Oconee Nuclear Station Document D03-1671-003, Rev. 0 Decommissioning Cost Analysis Section 3, Page 9 of 52
TLG Services, Inc.
directly to a DOE facility as it is generated since the fuel has been removed from the site prior to the start of delayed dismantling.
3.4.2 Reactor Vessel and Internal Components
The reactor pressure vessel and internal components are segmented for disposal in shielded, reusable transportation casks. Segmentation is performed in the refueling canal, where a turntable and remote cutter are installed. The vessel is segmented in place, using a mast-mounted cutter supported off the lower head and directed from a shielded work platform installed overhead in the reactor cavity. Transportation cask specifications and transportation regulations dictate the segmentation and packaging methodology. Intact disposal of reactor vessel shells has been successfully demonstrated at several of the sites that have been decommissioned. Access to navigable waterways has allowed these large packages to be transported to the disposal sites with minimal overland travel. Intact disposal of the reactor vessel and internal components can provide savings in cost and worker exposure by eliminating the complex segmentation requirements, isolation of the GTCC material, and transport/storage of the resulting waste packages. Portland General Electric (PGE) was able to dispose of the Trojan reactor as an intact package (including the internals). However, its location on the Columbia River simplified the transportation analysis since:
the reactor package could be secured to the transport vehicle for the entire journey, i.e., the package was not lifted during transport,
there were no man-made or natural terrain features between the plant site and the disposal location that could produce a large drop, and
transport speeds were very low, limited by the overland transport vehicle and the river barge.
As a member of the Northwest Compact, PGE had a site available for disposal of the package - the US Ecology facility in Washington State. The characteristics of this arid site proved favorable in demonstrating compliance with land disposal regulations.
It is not known whether this option will be available when the Oconee plant ceases operation. Future viability of this option will depend upon

Oconee Nuclear Station Document D03-1671-003, Rev. 0 Decommissioning Cost Analysis Section 3, Page 10 of 52
TLG Services, Inc.
the ultimate location of the disposal site, as well as the disposal site licensee’s ability to accept highly radioactive packages and effectively isolate them from the environment. Consequently, the study assumes that the reactor vessel will require segmentation, as a bounding condition.
3.4.3 Primary System Components
In the DECON scenario, the reactor coolant system components are assumed to be decontaminated using chemical agents prior to the start of dismantling operations. This type of decontamination can be expected to have a significant ALARA impact, since in this scenario the removal work is done within the first few years of shutdown. A decontamination factor (average reduction) of 10 is assumed for the process. Disposal of the decontamination solution effluent is included within the estimate as a "process liquid waste" charge. In the SAFSTOR scenario, radionuclide decay is expected to provide the same benefit and, therefore, a chemical decontamination is not included. The following discussion deals with the removal and disposition of the steam generators, but the techniques involved are also applicable to other large components, such as heat exchangers, component coolers, and the pressurizer. The steam generators’ size and weight, as well as their location within the reactor building, will ultimately determine the removal strategy. A trolley crane is set up for the removal of the generators. It can also be used to move portions of the steam generator cubicle walls and floor slabs from the reactor building to a location where they can be decontaminated and transported to the material handling area. Interferences within the work area, such as grating, piping, and other components are removed to create sufficient laydown space for processing these large components. The generators are rigged for removal, disconnected from the surrounding piping and supports, and maneuvered into the open area where they are lowered onto a dolly. Each generator is rotated into the horizontal position for extraction from the containment and placed onto a multi-wheeled vehicle for transport to an on-site processing and storage area.
Oconee Nuclear Station Document D03-1671-003, Rev. 0 Decommissioning Cost Analysis Section 3, Page 11 of 52
TLG Services, Inc.
Disposal costs are based upon the displaced volume and weight of the units. Each component is then loaded onto a rail car for transport to the disposal facility. Reactor coolant piping is cut from the reactor vessel once the water level in the vessel (used for personnel shielding during dismantling and cutting operations in and around the vessel) is dropped below the nozzle zone. The piping is boxed and transported by shielded van. The reactor coolant pumps and motors are lifted out intact, packaged, and transported for processing and/or disposal.
3.4.4 Main Turbine and Condenser
The main turbine is dismantled using conventional maintenance procedures. The turbine rotors and shafts are removed to a laydown area. The lower turbine casings are removed from their anchors by controlled demolition. The main condensers are also disassembled and moved to a laydown area. Material is then prepared for transportation to an off-site recycling facility where it is surveyed and designated for either decontamination or volume reduction, conventional disposal, or controlled disposal. Components are packaged and readied for transport in accordance with the intended disposition.
3.4.5 Retired Components
The estimate includes the cost to dispose of six retired steam generators expected to be in storage at the site upon the cessation of plant operations. The components are processed for disposal in the same manner as described for the installed units. Three reactor closure heads with service structures are included with additional materials as stored in the retired steam generator storage facility.
3.4.6 Transportation Methods
Contaminated piping, components, and structural material other than the highly activated reactor vessel and internal components will qualify as LSA-I, II or III or Surface Contaminated Object, SCO-I or II, as described in Title 49.[27] The contaminated material will be packaged in Industrial Packages (IP-1, IP-2, or IP-3, as defined in subpart 173.411) for transport unless demonstrated to qualify as their own shipping containers. The reactor vessel and internal components are expected to be transported in accordance with 10 CFR Part 71, in Type B containers. It is conceivable that the reactor, due to its limited specific activity,
Oconee Nuclear Station Document D03-1671-003, Rev. 0 Decommissioning Cost Analysis Section 3, Page 12 of 52
TLG Services, Inc.
could qualify as LSA II or III. However, the high radiation levels on the outer surface would require that additional shielding be incorporated within the packaging so as to attenuate the dose to levels acceptable for transport. Any fuel cladding failure that occurred during the lifetime of the plant is assumed to have released fission products at sufficiently low levels that the buildup of quantities of long-lived isotopes (e.g., 137Cs, 90Sr, or transuranics) has been prevented from reaching levels exceeding those that permit the major reactor components to be shipped under current transportation regulations and disposal requirements. Transport of the highly activated metal, produced in the segmentation of the reactor vessel and internal components, will be by shielded truck cask. Cask shipments may exceed 95,000 pounds, including vessel segment(s), supplementary shielding, cask tie-downs, and tractor-trailer. The maximum level of activity per shipment assumed permissible was based upon the license limits of the available shielded transport casks. The segmentation scheme for the vessel and internal segments is designed to meet these limits. The transport of large intact components (e.g., large heat exchangers and other oversized components) will be by a combination of truck, rail, and/or multi-wheeled transporter to the disposal facilities. Transportation costs for material requiring controlled disposal are based upon the mileage to the EnergySolutions facility in Clive, Utah and the Waste Control Specialist facility in Andrews County, Texas. Transportation costs for off-site waste processing are based upon the mileage to Memphis, Tennessee. Truck transport costs are estimated using published tariffs from Tri-State Motor Transit.[28] The transportation cost for the GTCC material is assumed to be inclusive of the disposal cost.
3.4.7 Low-Level Radioactive Waste Disposal
To the greatest extent practical, metallic material generated in the decontamination and dismantling processes is processed to reduce the total cost of controlled disposal. Material meeting the regulatory and/or site release criterion, is released as scrap, requiring no further cost consideration. Conditioning (preparing the material to meet the waste acceptance criteria of the disposal site) and recovery of the waste stream

Oconee Nuclear Station Document D03-1671-003, Rev. 0 Decommissioning Cost Analysis Section 3, Page 13 of 52
TLG Services, Inc.
is performed off site at a licensed processing center. Any material leaving the site is subject to a survey and release charge, at a minimum. The mass of radioactive waste generated during the various decommissioning activities at the site is shown on a line-item basis in the detailed Appendices C and D, and summarized in Section 5. The quantified waste summaries shown in these tables are consistent with 10 CFR Part 61 classifications. Commercially available steel containers are presumed to be used for the disposal of piping, small components, and concrete. Larger components can serve as their own containers, with proper closure of all openings, access ways, and penetrations. The volumes are calculated based on the exterior package dimensions for containerized material or a specific calculation for components serving as their own waste containers. The more highly activated reactor components will be shipped in reusable, shielded truck casks with disposable liners. In calculating disposal costs, the burial fees are applied against the liner volume, as well as the special handling requirements of the payload. Disposal fees are based upon estimated charges, with surcharges added for the highly activated components, for example, generated in the segmentation of the reactor vessel. The cost to dispose of the lowest level and majority of the material generated from the decontamination and dismantling activities is based upon the current cost for disposal at EnergySolutions facility in Clive, Utah. Disposal costs for the higher activity waste (Class B and C) are based upon the rate schedule for the Barnwell facility. Material exceeding Class C limits (limited to material closest to the reactor core and comprising less than 1% of the total waste volume) is generally not suitable for shallow-land disposal. This material is packaged in the same multi-purpose canisters used for spent fuel storage/transport.
3.4.8 Site Conditions Following Decommissioning
The NRC will amend or terminate the site license if it determines that site remediation has been performed in accordance with the license termination plan, and that the terminal radiation survey and associated documentation demonstrate that the facility is suitable for release. The NRC’s involvement in the decommissioning process will end at this point. Building codes and environmental regulations will dictate the
Oconee Nuclear Station Document D03-1671-003, Rev. 0 Decommissioning Cost Analysis Section 3, Page 14 of 52
TLG Services, Inc.
next step in the decommissioning process, as well as Duke Energy’s own future plans for the site. All structures will be removed except for the switchyard. The switchyard is required for grid operations. Structures to be removed include, but are not limited to, the reactor buildings, auxiliary buildings, fuel buildings, service building, turbine buildings, intake and condenser discharge structures. The landfill and firing range will be remediated and closed. The structures that may require decontamination or radiological remediation are the reactor buildings, auxiliary buildings, hot machine shops, interim radwaste building, radwaste facility, fuel building and the retired steam generator storage facility and the ground floor of the turbine building. The estimates presented herein include the dismantling of the major structures to a nominal depth of three feet below grade, backfilling and the collapsing of below grade voids, and general terra-forming such that the site upon which the power block and supplemental structures are located is transformed into a “grassy plain.” The estimates do not assume the remediation of any significant volume of contaminated soil. This assumption may be affected by continued plant operations and/or future regulatory actions, such as the development of site-specific release criteria. Costs are included for the remediation and post-closure care and maintenance of the landfill and shooting range at the site. Since the care and maintenance of the landfill will extend beyond the active decommissioning period in the DECON scenario, a lump-sum perpetuity payment is included in the final year of decommissioning for the remaining duration. Environmental Remediation Oconee has a cement lined lagoon and three chemical treatment ponds, samples will be taken of the settled material as part of closure requirements; to date sediment has met release criteria. All ponds will be backfilled to grade level.

Oconee Nuclear Station Document D03-1671-003, Rev. 0 Decommissioning Cost Analysis Section 3, Page 15 of 52
TLG Services, Inc.
3.5 ASSUMPTIONS The following are the major assumptions made in the development of the estimates for decommissioning the site. 3.5.1 Estimating Basis
Decommissioning costs are reported in the year of projected expenditure; however, the values are provided in 2013 dollars. Costs are not inflated, escalated, or discounted over the periods of performance. The estimates rely upon the physical plant inventory that was the basis for the 2008 analysis (updated to reflect any significant changes to the plant over the past five years). The study follows the principles of ALARA through the use of work duration adjustment factors. These factors address the impact of activities such as radiological protection instruction, mock-up training, and the use of respiratory protection and protective clothing. The factors lengthen a task's duration, increasing costs and lengthening the overall schedule. ALARA planning is considered in the costs for engineering and planning, and in the development of activity specifications and detailed procedures. Changes to worker exposure limits may impact the decommissioning cost and project schedule.
3.5.2 Labor Costs
For purposes of this analysis, Duke Energy will continue to provide site operations support, including decommissioning program management, licensing, radiological protection, and site security. Duke Energy will serve as the Decommissioning Operations Contractor, providing the supervisory staff needed to oversee the labor subcontractors, consultants, and specialty contractors needed to perform the work envisioned in the decontamination and dismantling effort. Duke Energy will also provide the engineering services needed to develop activity specifications, detailed procedures, detailed activation analyses, and support field activities such as structural modifications. Severance and retention costs are not included in the estimate. Reduction in staff levels will be handled through normal staffing processes. Personnel costs are based upon average salary information provided by Duke Energy. Overhead costs are included for site and corporate support, reduced commensurate with the staffing of the project.

Oconee Nuclear Station Document D03-1671-003, Rev. 0 Decommissioning Cost Analysis Section 3, Page 16 of 52
TLG Services, Inc.
The craft labor required to decontaminate and dismantle the nuclear plant is acquired through standard site contracting practices. The current cost of labor at the site is used as an estimating basis. Security, while reduced from operating levels, is maintained throughout the decommissioning for access control, material control, and to safeguard the spent fuel.
3.5.3 Design Conditions
Any fuel cladding failure that occurred during the lifetime of the plant is assumed to have released fission products at sufficiently low levels that the buildup of quantities of long-lived isotopes (e.g., 137Cs, 90Sr, or transuranics) has been prevented from reaching levels exceeding those that permit the major NSSS components to be shipped under current transportation regulations and disposal requirements. The curie contents of the vessel and internals at final shutdown are derived from those listed in NUREG/CR-3474.[29] Actual estimates are derived from the curie/gram values contained therein and adjusted for the different mass of the Oconee components, projected operating life, and different periods of decay. Additional short-lived isotopes were derived from NUREG/CR-0130[30] and NUREG/CR-0672,[31] and benchmarked to the long-lived values from NUREG/CR-3474. Neutron activation of the containment building structure is assumed to be confined to the biological shield.
3.5.4 General
Transition Activities Existing warehouses are cleared of non-essential material and remain for use by Duke Energy and its subcontractors. The plant’s operating staff performs the following activities at no additional cost or credit to the project during the transition period: Drain and collect fuel oils, lubricating oils, and transformer oils
for recycle and/or sale.
Drain and collect acids, caustics, and other chemical stores for recycle and/or sale.
Oconee Nuclear Station Document D03-1671-003, Rev. 0 Decommissioning Cost Analysis Section 3, Page 17 of 52
TLG Services, Inc.
Process operating waste inventories. Disposal of operating wastes (e.g., filtration media, resins) during this initial period is not considered a decommissioning expense.
Scrap and Salvage
The existing plant equipment is considered obsolete and suitable for scrap as deadweight quantities only. Duke Energy will make economically reasonable efforts to salvage equipment following final plant shutdown. However, dismantling techniques assumed by TLG for equipment in this analysis are not consistent with removal techniques required for salvage (resale) of equipment. Experience has indicated that some buyers wanted equipment stripped down to very specific requirements before they would consider purchase. This required expensive rework after the equipment had been removed from its installed location. Since placing a salvage value on this machinery and equipment would be speculative, and the value would be small in comparison to the overall decommissioning expenses, this analysis does not attempt to quantify the value that an owner may realize based upon those efforts. It is assumed, for purposes of this analysis, that any value received from the sale of scrap generated in the dismantling process would be more than offset by the on-site processing costs. The dismantling techniques assumed in the decommissioning estimates do not include the additional cost for size reduction and preparation to meet “furnace ready” conditions. For example, the recovery of copper from electrical cabling may require the removal and disposition of any contaminated insulation, an added expense. With a volatile market, the potential profit margin in scrap recovery is highly speculative, regardless of the ability to free release this material. This assumption is an implicit recognition of scrap value in the disposal of clean metallic waste at no additional cost to the project. Furniture, tools, mobile equipment such as forklifts, trucks, bulldozers, and other property is removed at no cost or credit to the decommissioning project. Disposition may include relocation to other facilities. Spare parts are also made available for alternative use. Energy
For estimating purposes, the plant is assumed to be de-energized, with the exception of those facilities associated with spent fuel storage.
Oconee Nuclear Station Document D03-1671-003, Rev. 0 Decommissioning Cost Analysis Section 3, Page 18 of 52
TLG Services, Inc.
Replacement power costs are used to calculate the cost of energy consumed during decommissioning for tooling, lighting, ventilation, and essential services.
Insurance
Costs for continuing coverage (nuclear liability and property insurance) following cessation of plant operations and during decommissioning are included and based upon current operating premiums. Reductions in premiums, throughout the decommissioning process, are based upon the guidance and the limits for coverage defined in the NRC’s proposed rulemaking “Financial Protection Requirements for Permanently Shutdown Nuclear Power Reactors.”[32] The NRC’s financial protection requirements are based on various reactor (and spent fuel) configurations. Taxes Property tax payments continue throughout the decommissioning process, although at a substantially reduced level. The rate of decrease in disbursements is consistent over the same time interval for both the DECON and SAFSTOR alternatives. The value of plant structures and equipment decreases from 100% to 0% over an eight-year period. The property taxes are determined based on a 100% value of the plant structures and equipment for the first two years, 66.7% of the value for the next three years, 33.3% of the value for the next three years, and 0% for the remainder of the decommissioning period.
Site Modifications
The perimeter fence and in-plant security barriers will be moved, as appropriate, to conform to the Site Security Plan in force during the various stages of the project.
Integrated earthworks created during the initial formation of the Lake Keowee area and integral with it will be left intact and maintained in accordance with the current dam maintenance and inspection program. The on-site dike and earthwork network forming water retention ponds and lagoons will be disabled to relieve ongoing inspection requirements.

Oconee Nuclear Station Document D03-1671-003, Rev. 0 Decommissioning Cost Analysis Section 3, Page 19 of 52
TLG Services, Inc.
3.6 COST ESTIMATE SUMMARY
Schedules of expenditures are provided in Tables 3.2 through 3.7. The tables delineate the cost contributors by year of expenditures as well as cost contributor (e.g., labor, materials, and waste disposal). The tables in Appendices C and D provide additional detail. The cost elements in these tables are assigned to one of three subcategories: “License Termination,” “Spent Fuel Management,” and “Site Restoration.” The subcategory “License Termination” is used to accumulate costs that are consistent with “decommissioning” as defined by the NRC in its financial assurance regulations (i.e., 10 CFR §50.75). The cost reported for this subcategory is generally sufficient to terminate the plant’s operating license, recognizing that there may be some additional cost impact from spent fuel management. The “Spent Fuel Management” subcategory contains costs associated with the containerization and transfer of spent fuel from the wet storage pools to the DOE, as well as the eventual transfer of the spent fuel in storage at the ISFSI to the DOE. Costs are also included for the operations of the pools and management of the ISFSI until such time that the transfer of all fuel from this facility to an off-site location (e.g., interim storage facility) is complete. “Site Restoration” is used to capture costs associated with the dismantling and demolition of buildings and facilities demonstrated to be free from contamination. This includes structures never exposed to radioactive materials, as well as those facilities that have been decontaminated to appropriate levels. Structures are removed to a depth of three feet and backfilled to conform to local grade. As discussed in Section 3.4.1, it is assumed that the DOE will not accept the GTCC waste prior to completing the transfer of spent fuel. Therefore, the cost of GTCC disposal is shown in the final year of ISFSI operation (for the DECON alternative). While designated for disposal at a federal facility along with the spent fuel, GTCC waste is still classified as low-level radioactive waste and, as such, included as a “License Termination” expense. Decommissioning costs are reported in 2013 dollars. Costs are not inflated, escalated, or discounted over the period of expenditure (or projected lifetime of the plant). The schedules are based upon the detailed activity costs reported in Appendices C and D, along with the timelines presented in Section 4.

Oconee Nuclear Station Document D03-1671-003, Rev. 0 Decommissioning Cost Analysis Section 3, Page 20 of 52
TLG Services, Inc.
TABLE 3.1 SPENT FUEL MANAGEMENT SCHEDULE
(Fuel Assembly Totals by Location) DOE Year Pools ISFSI Acceptance
2025 1399 4392 0 2026 1394 4488 0 2027 1363 4488 0 2028 1271 4488 0 2029 1222 4488 0 2030 1263 4488 0 2031 1080 4423 65 2032 1080 4141 282 2033 1362 3895 246 2034 1395 3622 273 2035 1323 3424 198 2036 1179 3297 127 2037 1107 3030 267 2038 963 2969 61 2039 891 2865 104 2040 747 2577 288 2041 675 2486 91 2042 531 2330 156 2043 177 2330 0 2044 0 2330 0 2045 2330 0 2046 2330 0 2047 2330 0 2048 2330 0 2049 2330 0 2050 2330 0 2051 2330 0 2052 2330 0 2053 2330 0 2054 1876 454 2055 1360 516 2056 844 516
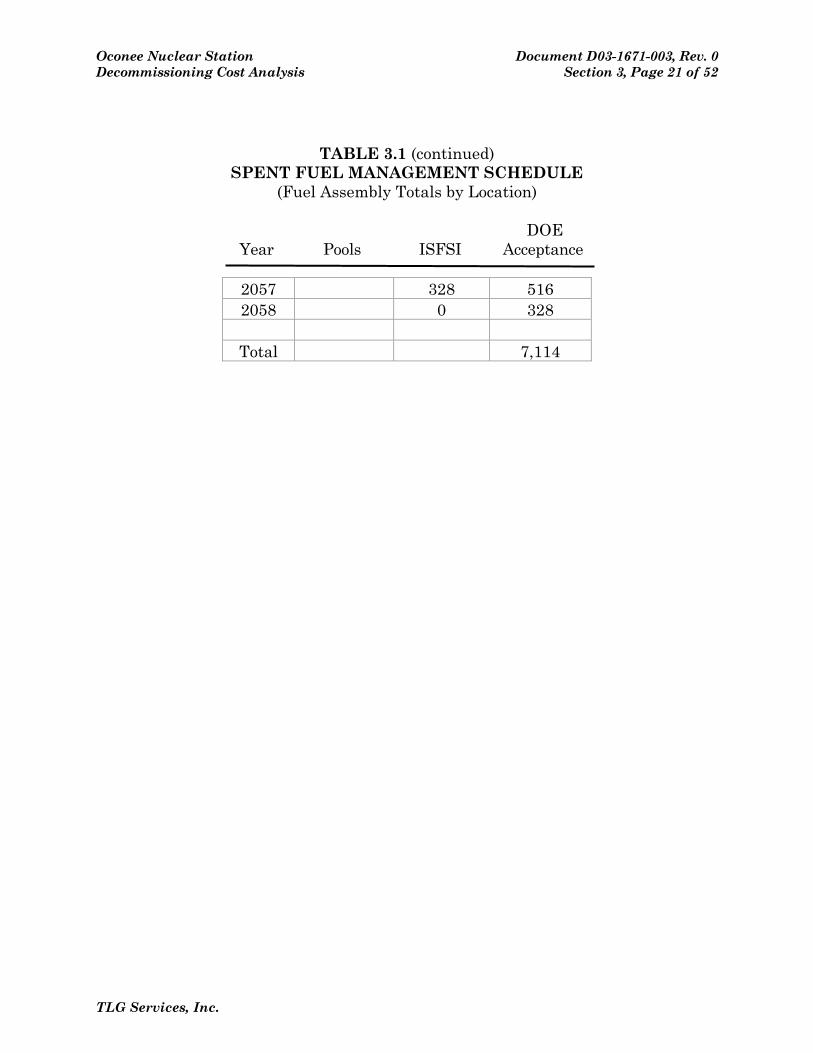
Oconee Nuclear Station Document D03-1671-003, Rev. 0 Decommissioning Cost Analysis Section 3, Page 21 of 52
TLG Services, Inc.
TABLE 3.1 (continued) SPENT FUEL MANAGEMENT SCHEDULE
(Fuel Assembly Totals by Location) DOE Year Pools ISFSI Acceptance
2057 328 516 2058 0 328
Total 7,114

Oconee Nuclear Station Document D03-1671-003, Rev. 0 Decommissioning Cost Analysis Section 3, Page 22 of 52
TLG Services, Inc.
TABLE 3.2 DECON ALTERNATIVE, UNIT 1
TOTAL ANNUAL EXPENDITURES (thousands, 2013 dollars)
Equipment & Year Labor Materials Energy Burial Other Total
2033 41,273 2,977 639 3,330 7,949 56,167 2034 48,703 16,218 1,048 13,092 22,998 102,058 2035 46,685 20,085 674 29,512 12,787 109,743 2036 32,113 9,032 562 12,860 8,992 63,558 2037 28,372 6,247 532 8,667 8,015 51,834 2038 18,843 4,185 376 5,210 5,614 34,228 2039 4,551 1,092 142 24 2,012 7,820 2040 4,563 1,095 142 24 2,018 7,842 2041 4,551 1,092 142 24 2,012 7,820 2042 4,551 1,092 142 24 2,012 7,820 2043 4,551 1,092 142 24 2,012 7,820 2044 8,756 2,301 178 1,630 2,933 15,798 2045 21,401 2,597 181 1,753 3,051 28,983 2046 8,909 5,615 73 1 1,096 15,693 2047 8,552 5,735 71 0 1,068 15,426 2048 3,023 2,136 25 0 465 5,649 2049 72 215 0 0 142 429 2050 72 215 0 0 142 429 2051 72 215 0 0 142 429 2052 72 216 0 0 143 431 2053 72 215 0 0 142 429 2054 72 215 0 0 142 429 2055 72 215 0 0 142 429 2056 72 216 0 0 143 431 2057 72 215 0 0 142 429 2058 51 592 0 0 11,273 11,916
Total 290,091 85,122 5,067 76,174 97,589 554,043
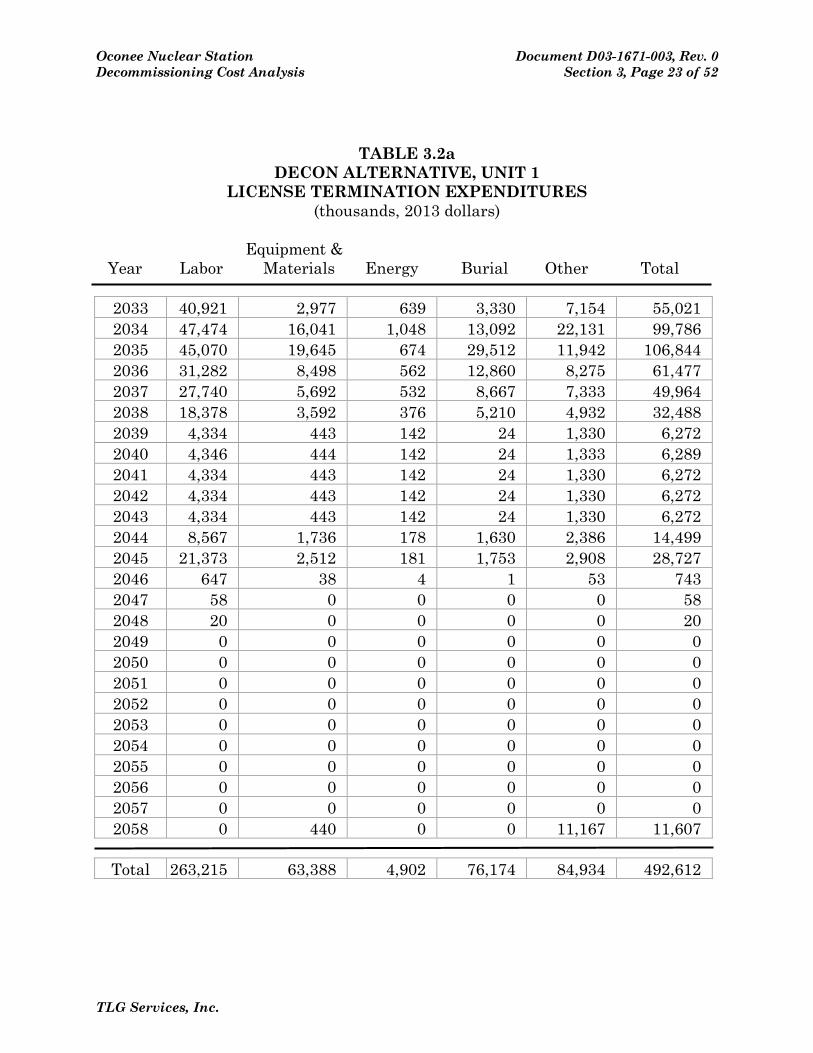
Oconee Nuclear Station Document D03-1671-003, Rev. 0 Decommissioning Cost Analysis Section 3, Page 23 of 52
TLG Services, Inc.
TABLE 3.2a DECON ALTERNATIVE, UNIT 1
LICENSE TERMINATION EXPENDITURES (thousands, 2013 dollars)
Equipment & Year Labor Materials Energy Burial Other Total
2033 40,921 2,977 639 3,330 7,154 55,021 2034 47,474 16,041 1,048 13,092 22,131 99,786 2035 45,070 19,645 674 29,512 11,942 106,844 2036 31,282 8,498 562 12,860 8,275 61,477 2037 27,740 5,692 532 8,667 7,333 49,964 2038 18,378 3,592 376 5,210 4,932 32,488 2039 4,334 443 142 24 1,330 6,272 2040 4,346 444 142 24 1,333 6,289 2041 4,334 443 142 24 1,330 6,272 2042 4,334 443 142 24 1,330 6,272 2043 4,334 443 142 24 1,330 6,272 2044 8,567 1,736 178 1,630 2,386 14,499 2045 21,373 2,512 181 1,753 2,908 28,727 2046 647 38 4 1 53 743 2047 58 0 0 0 0 58 2048 20 0 0 0 0 20 2049 0 0 0 0 0 0 2050 0 0 0 0 0 0 2051 0 0 0 0 0 0 2052 0 0 0 0 0 0 2053 0 0 0 0 0 0 2054 0 0 0 0 0 0 2055 0 0 0 0 0 0 2056 0 0 0 0 0 0 2057 0 0 0 0 0 0 2058 0 440 0 0 11,167 11,607
Total 263,215 63,388 4,902 76,174 84,934 492,612
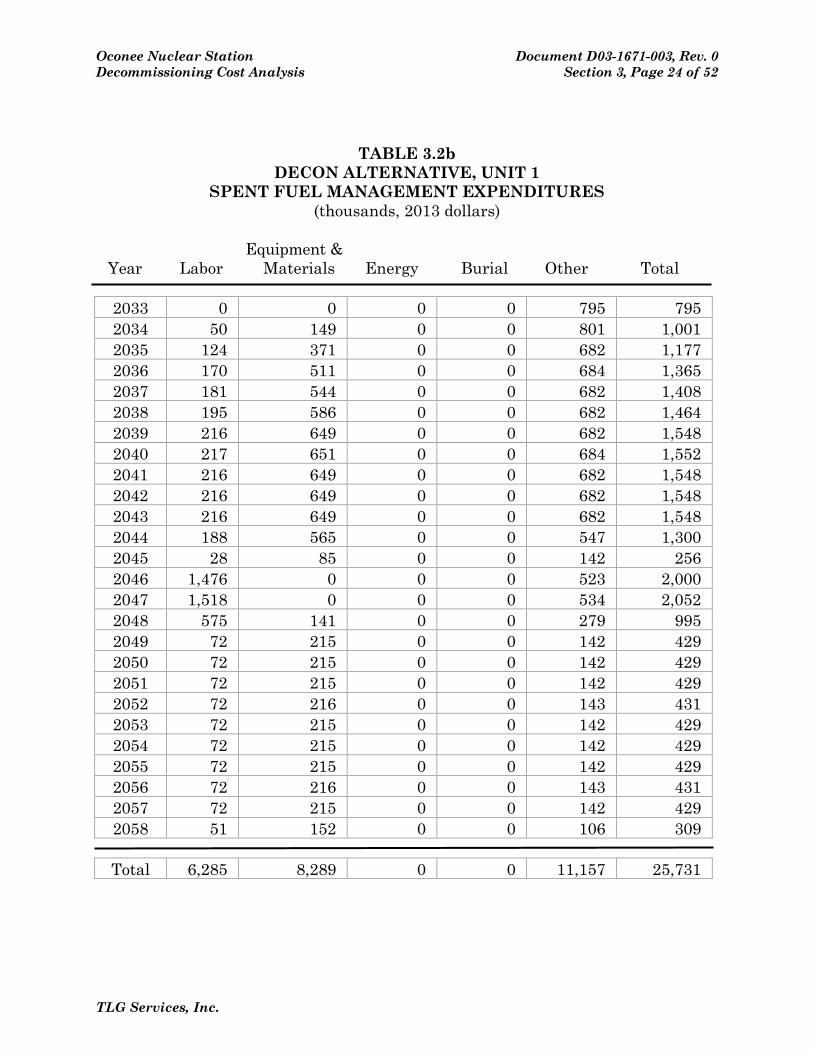
Oconee Nuclear Station Document D03-1671-003, Rev. 0 Decommissioning Cost Analysis Section 3, Page 24 of 52
TLG Services, Inc.
TABLE 3.2b DECON ALTERNATIVE, UNIT 1
SPENT FUEL MANAGEMENT EXPENDITURES (thousands, 2013 dollars)
Equipment & Year Labor Materials Energy Burial Other Total
2033 0 0 0 0 795 795 2034 50 149 0 0 801 1,001 2035 124 371 0 0 682 1,177 2036 170 511 0 0 684 1,365 2037 181 544 0 0 682 1,408 2038 195 586 0 0 682 1,464 2039 216 649 0 0 682 1,548 2040 217 651 0 0 684 1,552 2041 216 649 0 0 682 1,548 2042 216 649 0 0 682 1,548 2043 216 649 0 0 682 1,548 2044 188 565 0 0 547 1,300 2045 28 85 0 0 142 256 2046 1,476 0 0 0 523 2,000 2047 1,518 0 0 0 534 2,052 2048 575 141 0 0 279 995 2049 72 215 0 0 142 429 2050 72 215 0 0 142 429 2051 72 215 0 0 142 429 2052 72 216 0 0 143 431 2053 72 215 0 0 142 429 2054 72 215 0 0 142 429 2055 72 215 0 0 142 429 2056 72 216 0 0 143 431 2057 72 215 0 0 142 429 2058 51 152 0 0 106 309
Total 6,285 8,289 0 0 11,157 25,731
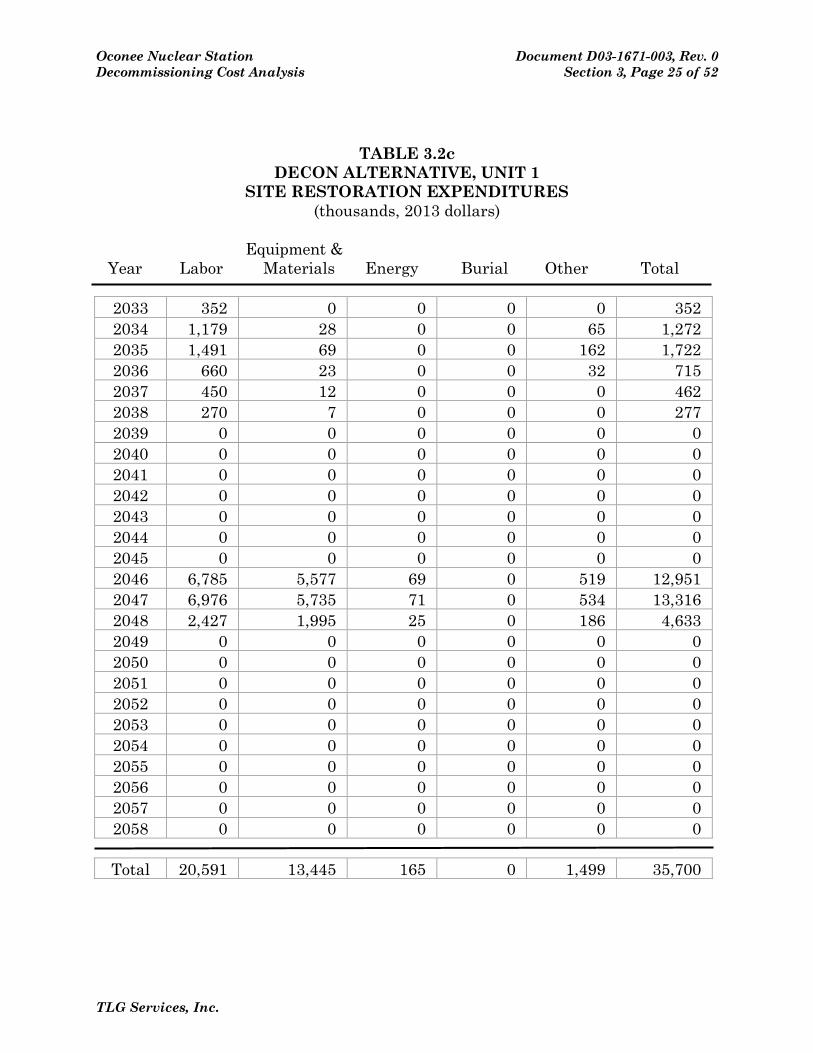
Oconee Nuclear Station Document D03-1671-003, Rev. 0 Decommissioning Cost Analysis Section 3, Page 25 of 52
TLG Services, Inc.
TABLE 3.2c DECON ALTERNATIVE, UNIT 1
SITE RESTORATION EXPENDITURES (thousands, 2013 dollars)
Equipment & Year Labor Materials Energy Burial Other Total
2033 352 0 0 0 0 352 2034 1,179 28 0 0 65 1,272 2035 1,491 69 0 0 162 1,722 2036 660 23 0 0 32 715 2037 450 12 0 0 0 462 2038 270 7 0 0 0 277 2039 0 0 0 0 0 0 2040 0 0 0 0 0 0 2041 0 0 0 0 0 0 2042 0 0 0 0 0 0 2043 0 0 0 0 0 0 2044 0 0 0 0 0 0 2045 0 0 0 0 0 0 2046 6,785 5,577 69 0 519 12,951 2047 6,976 5,735 71 0 534 13,316 2048 2,427 1,995 25 0 186 4,633 2049 0 0 0 0 0 0 2050 0 0 0 0 0 0 2051 0 0 0 0 0 0 2052 0 0 0 0 0 0 2053 0 0 0 0 0 0 2054 0 0 0 0 0 0 2055 0 0 0 0 0 0 2056 0 0 0 0 0 0 2057 0 0 0 0 0 0 2058 0 0 0 0 0 0
Total 20,591 13,445 165 0 1,499 35,700
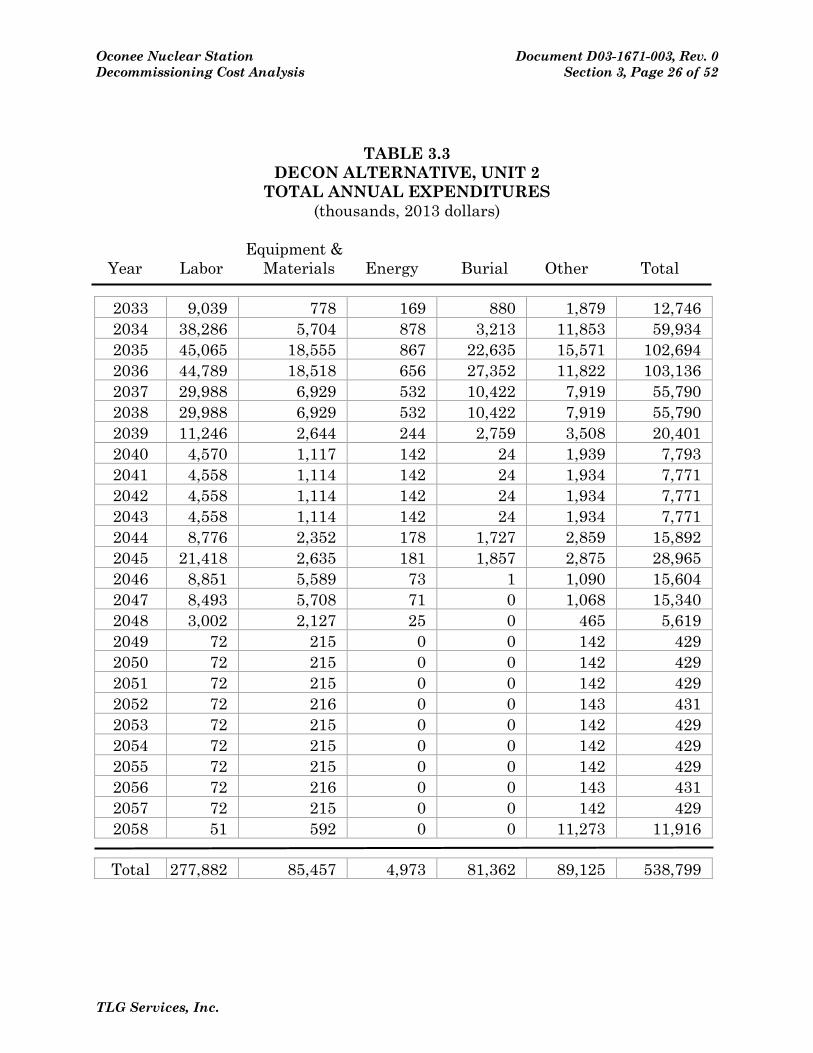
Oconee Nuclear Station Document D03-1671-003, Rev. 0 Decommissioning Cost Analysis Section 3, Page 26 of 52
TLG Services, Inc.
TABLE 3.3 DECON ALTERNATIVE, UNIT 2
TOTAL ANNUAL EXPENDITURES (thousands, 2013 dollars)
Equipment & Year Labor Materials Energy Burial Other Total
2033 9,039 778 169 880 1,879 12,746 2034 38,286 5,704 878 3,213 11,853 59,934 2035 45,065 18,555 867 22,635 15,571 102,694 2036 44,789 18,518 656 27,352 11,822 103,136 2037 29,988 6,929 532 10,422 7,919 55,790 2038 29,988 6,929 532 10,422 7,919 55,790 2039 11,246 2,644 244 2,759 3,508 20,401 2040 4,570 1,117 142 24 1,939 7,793 2041 4,558 1,114 142 24 1,934 7,771 2042 4,558 1,114 142 24 1,934 7,771 2043 4,558 1,114 142 24 1,934 7,771 2044 8,776 2,352 178 1,727 2,859 15,892 2045 21,418 2,635 181 1,857 2,875 28,965 2046 8,851 5,589 73 1 1,090 15,604 2047 8,493 5,708 71 0 1,068 15,340 2048 3,002 2,127 25 0 465 5,619 2049 72 215 0 0 142 429 2050 72 215 0 0 142 429 2051 72 215 0 0 142 429 2052 72 216 0 0 143 431 2053 72 215 0 0 142 429 2054 72 215 0 0 142 429 2055 72 215 0 0 142 429 2056 72 216 0 0 143 431 2057 72 215 0 0 142 429 2058 51 592 0 0 11,273 11,916
Total 277,882 85,457 4,973 81,362 89,125 538,799

Oconee Nuclear Station Document D03-1671-003, Rev. 0 Decommissioning Cost Analysis Section 3, Page 27 of 52
TLG Services, Inc.
TABLE 3.3a DECON ALTERNATIVE, UNIT 2
LICENSE TERMINATION EXPENDITURES (thousands, 2013 dollars)
Equipment & Year Labor Materials Energy Burial Other Total
2033 9,000 778 169 880 1,669 12,496 2034 38,029 5,645 878 3,213 10,971 58,737 2035 43,587 18,029 867 22,635 14,730 99,848 2036 43,143 17,907 656 27,352 11,013 100,071 2037 29,370 6,415 532 10,422 7,237 53,975 2038 29,370 6,415 532 10,422 7,237 53,975 2039 10,919 2,014 244 2,759 2,826 18,761 2040 4,346 444 142 24 1,255 6,211 2041 4,334 443 142 24 1,252 6,194 2042 4,334 443 142 24 1,252 6,194 2043 4,334 443 142 24 1,252 6,194 2044 8,583 1,771 178 1,727 2,312 14,570 2045 21,389 2,549 181 1,857 2,733 28,709 2046 615 38 4 1 47 704 2047 25 0 0 0 0 25 2048 9 0 0 0 0 9 2049 0 0 0 0 0 0 2050 0 0 0 0 0 0 2051 0 0 0 0 0 0 2052 0 0 0 0 0 0 2053 0 0 0 0 0 0 2054 0 0 0 0 0 0
2055 0 0 0 0 0 0 2056 0 0 0 0 0 0 2057 0 0 0 0 0 0 2058 0 440 0 0 11,167 11,607
Total 251,385 63,776 4,808 81,362 76,951 478,282

Oconee Nuclear Station Document D03-1671-003, Rev. 0 Decommissioning Cost Analysis Section 3, Page 28 of 52
TLG Services, Inc.
TABLE 3.3b DECON ALTERNATIVE, UNIT 2
SPENT FUEL MANAGEMENT EXPENDITURES (thousands, 2013 dollars)
Equipment & Year Labor Materials Energy Burial Other Total
2033 0 0 0 0 210 210 2034 20 59 0 0 882 960 2035 157 471 0 0 734 1,362 2036 181 544 0 0 684 1,410 2037 168 503 0 0 682 1,353 2038 168 503 0 0 682 1,353 2039 209 627 0 0 682 1,518 2040 224 673 0 0 684 1,581 2041 224 671 0 0 682 1,577 2042 224 671 0 0 682 1,577 2043 224 671 0 0 682 1,577 2044 194 581 0 0 547 1,321 2045 28 85 0 0 142 256 2046 1,476 0 0 0 523 2,000 2047 1,518 0 0 0 534 2,052 2048 575 141 0 0 279 995 2049 72 215 0 0 142 429 2050 72 215 0 0 142 429 2051 72 215 0 0 142 429 2052 72 216 0 0 143 431 2053 72 215 0 0 142 429 2054 72 215 0 0 142 429 2055 72 215 0 0 142 429 2056 72 216 0 0 143 431 2057 72 215 0 0 142 429 2058 51 152 0 0 106 309
Total 6,285 8,289 0 0 10,704 25,278
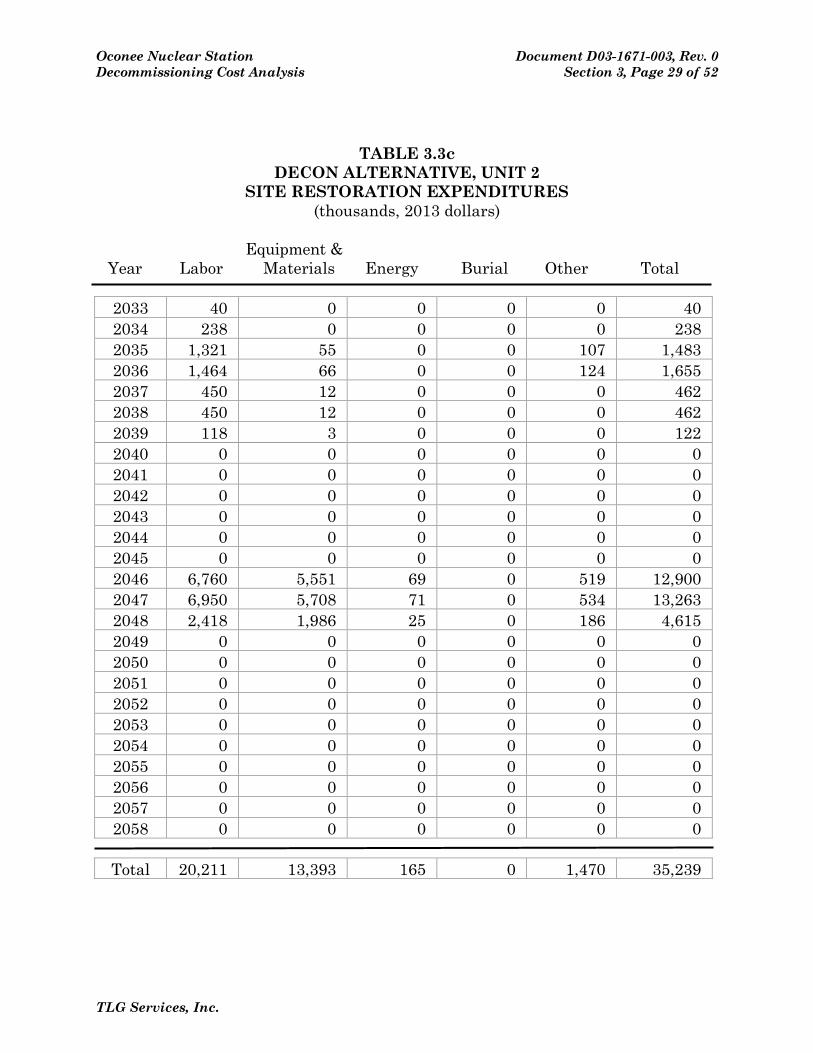
Oconee Nuclear Station Document D03-1671-003, Rev. 0 Decommissioning Cost Analysis Section 3, Page 29 of 52
TLG Services, Inc.
TABLE 3.3c DECON ALTERNATIVE, UNIT 2
SITE RESTORATION EXPENDITURES (thousands, 2013 dollars)
Equipment & Year Labor Materials Energy Burial Other Total
2033 40 0 0 0 0 40 2034 238 0 0 0 0 238 2035 1,321 55 0 0 107 1,483 2036 1,464 66 0 0 124 1,655 2037 450 12 0 0 0 462 2038 450 12 0 0 0 462 2039 118 3 0 0 0 122 2040 0 0 0 0 0 0 2041 0 0 0 0 0 0 2042 0 0 0 0 0 0 2043 0 0 0 0 0 0 2044 0 0 0 0 0 0 2045 0 0 0 0 0 0 2046 6,760 5,551 69 0 519 12,900 2047 6,950 5,708 71 0 534 13,263 2048 2,418 1,986 25 0 186 4,615 2049 0 0 0 0 0 0 2050 0 0 0 0 0 0 2051 0 0 0 0 0 0 2052 0 0 0 0 0 0 2053 0 0 0 0 0 0 2054 0 0 0 0 0 0 2055 0 0 0 0 0 0 2056 0 0 0 0 0 0 2057 0 0 0 0 0 0 2058 0 0 0 0 0 0
Total 20,211 13,393 165 0 1,470 35,239
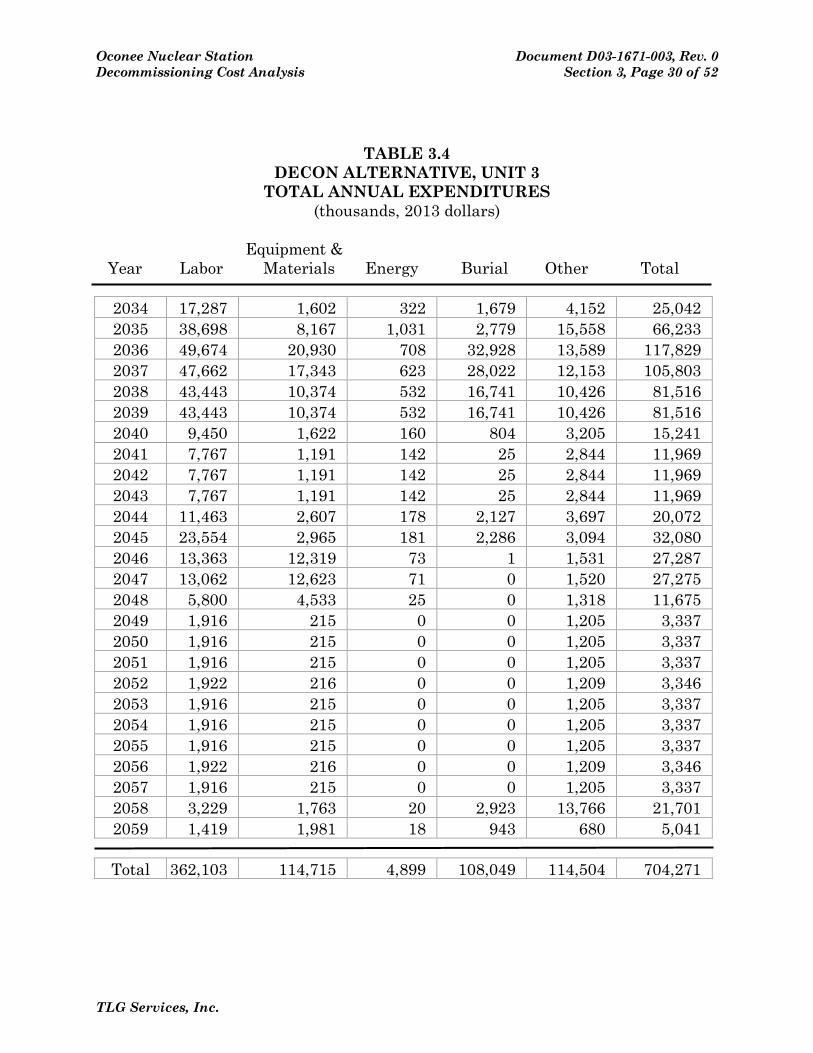
Oconee Nuclear Station Document D03-1671-003, Rev. 0 Decommissioning Cost Analysis Section 3, Page 30 of 52
TLG Services, Inc.
TABLE 3.4 DECON ALTERNATIVE, UNIT 3
TOTAL ANNUAL EXPENDITURES (thousands, 2013 dollars)
Equipment & Year Labor Materials Energy Burial Other Total
2034 17,287 1,602 322 1,679 4,152 25,042 2035 38,698 8,167 1,031 2,779 15,558 66,233 2036 49,674 20,930 708 32,928 13,589 117,829 2037 47,662 17,343 623 28,022 12,153 105,803 2038 43,443 10,374 532 16,741 10,426 81,516 2039 43,443 10,374 532 16,741 10,426 81,516 2040 9,450 1,622 160 804 3,205 15,241 2041 7,767 1,191 142 25 2,844 11,969 2042 7,767 1,191 142 25 2,844 11,969 2043 7,767 1,191 142 25 2,844 11,969 2044 11,463 2,607 178 2,127 3,697 20,072 2045 23,554 2,965 181 2,286 3,094 32,080 2046 13,363 12,319 73 1 1,531 27,287 2047 13,062 12,623 71 0 1,520 27,275 2048 5,800 4,533 25 0 1,318 11,675 2049 1,916 215 0 0 1,205 3,337 2050 1,916 215 0 0 1,205 3,337 2051 1,916 215 0 0 1,205 3,337 2052 1,922 216 0 0 1,209 3,346 2053 1,916 215 0 0 1,205 3,337 2054 1,916 215 0 0 1,205 3,337 2055 1,916 215 0 0 1,205 3,337 2056 1,922 216 0 0 1,209 3,346 2057 1,916 215 0 0 1,205 3,337 2058 3,229 1,763 20 2,923 13,766 21,701 2059 1,419 1,981 18 943 680 5,041
Total 362,103 114,715 4,899 108,049 114,504 704,271

Oconee Nuclear Station Document D03-1671-003, Rev. 0 Decommissioning Cost Analysis Section 3, Page 31 of 52
TLG Services, Inc.
TABLE 3.4a DECON ALTERNATIVE, UNIT 3
LICENSE TERMINATION EXPENDITURES (thousands, 2013 dollars)
Equipment & Year Labor Materials Energy Burial Other Total
2034 17,172 1,485 322 1,679 3,529 24,187 2035 38,276 7,807 1,031 2,779 14,188 64,081 2036 46,929 20,247 708 32,928 12,269 113,081 2037 45,403 16,451 623 28,022 10,698 101,197 2038 42,224 9,116 532 16,741 8,717 77,330 2039 42,224 9,116 532 16,741 8,717 77,330 2040 9,161 868 160 804 1,972 12,966 2041 7,524 464 142 25 1,638 9,793 2042 7,524 464 142 25 1,638 9,793 2043 7,524 464 142 25 1,638 9,793 2044 11,255 1,984 178 2,127 2,716 18,261 2045 23,526 2,880 181 2,286 2,787 31,660 2046 684 42 4 1 45 775 2047 25 0 0 0 0 25 2048 9 0 0 0 0 9 2049 0 0 0 0 0 0 2050 0 0 0 0 0 0 2051 0 0 0 0 0 0 2052 0 0 0 0 0 0 2053 0 0 0 0 0 0 2054 0 0 0 0 0 0 2055 0 0 0 0 0 0
2056 0 0 0 0 0 0 2057 0 0 0 0 0 0 2058 1,740 1,611 20 2,923 12,874 19,168 2059 561 378 6 943 551 2,439
Total 301,760 73,379 4,723 108,049 83,976 571,887
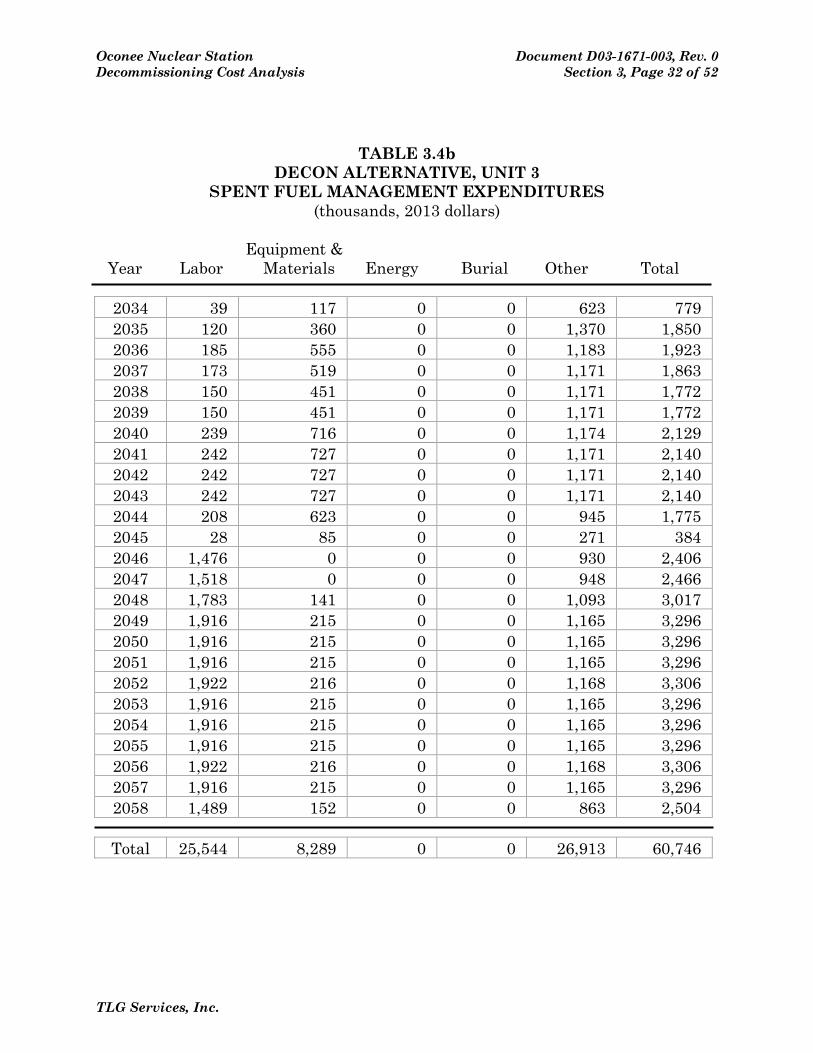
Oconee Nuclear Station Document D03-1671-003, Rev. 0 Decommissioning Cost Analysis Section 3, Page 32 of 52
TLG Services, Inc.
TABLE 3.4b DECON ALTERNATIVE, UNIT 3
SPENT FUEL MANAGEMENT EXPENDITURES (thousands, 2013 dollars)
Equipment & Year Labor Materials Energy Burial Other Total
2034 39 117 0 0 623 779 2035 120 360 0 0 1,370 1,850 2036 185 555 0 0 1,183 1,923 2037 173 519 0 0 1,171 1,863 2038 150 451 0 0 1,171 1,772 2039 150 451 0 0 1,171 1,772 2040 239 716 0 0 1,174 2,129 2041 242 727 0 0 1,171 2,140 2042 242 727 0 0 1,171 2,140 2043 242 727 0 0 1,171 2,140 2044 208 623 0 0 945 1,775 2045 28 85 0 0 271 384 2046 1,476 0 0 0 930 2,406 2047 1,518 0 0 0 948 2,466 2048 1,783 141 0 0 1,093 3,017 2049 1,916 215 0 0 1,165 3,296 2050 1,916 215 0 0 1,165 3,296 2051 1,916 215 0 0 1,165 3,296 2052 1,922 216 0 0 1,168 3,306 2053 1,916 215 0 0 1,165 3,296 2054 1,916 215 0 0 1,165 3,296 2055 1,916 215 0 0 1,165 3,296 2056 1,922 216 0 0 1,168 3,306 2057 1,916 215 0 0 1,165 3,296 2058 1,489 152 0 0 863 2,504
Total 25,544 8,289 0 0 26,913 60,746
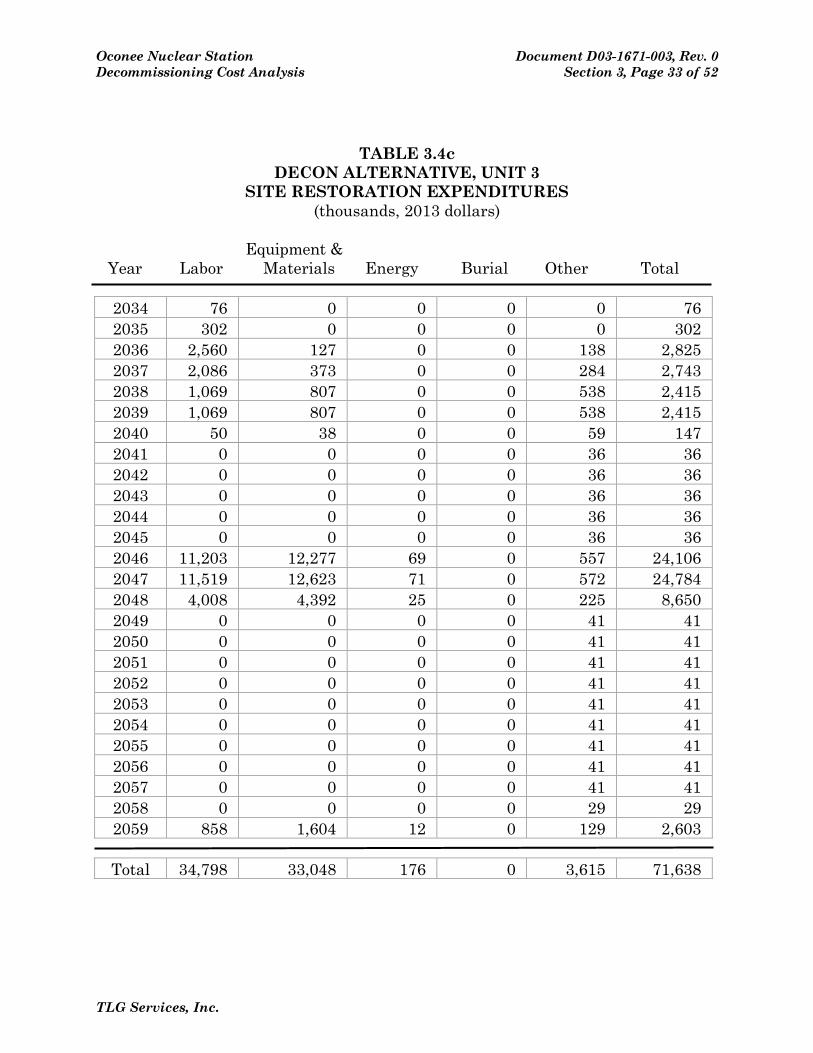
Oconee Nuclear Station Document D03-1671-003, Rev. 0 Decommissioning Cost Analysis Section 3, Page 33 of 52
TLG Services, Inc.
TABLE 3.4c DECON ALTERNATIVE, UNIT 3
SITE RESTORATION EXPENDITURES (thousands, 2013 dollars)
Equipment & Year Labor Materials Energy Burial Other Total
2034 76 0 0 0 0 76 2035 302 0 0 0 0 302 2036 2,560 127 0 0 138 2,825 2037 2,086 373 0 0 284 2,743 2038 1,069 807 0 0 538 2,415 2039 1,069 807 0 0 538 2,415 2040 50 38 0 0 59 147 2041 0 0 0 0 36 36 2042 0 0 0 0 36 36 2043 0 0 0 0 36 36 2044 0 0 0 0 36 36 2045 0 0 0 0 36 36 2046 11,203 12,277 69 0 557 24,106 2047 11,519 12,623 71 0 572 24,784 2048 4,008 4,392 25 0 225 8,650 2049 0 0 0 0 41 41 2050 0 0 0 0 41 41 2051 0 0 0 0 41 41 2052 0 0 0 0 41 41 2053 0 0 0 0 41 41 2054 0 0 0 0 41 41 2055 0 0 0 0 41 41 2056 0 0 0 0 41 41 2057 0 0 0 0 41 41 2058 0 0 0 0 29 29 2059 858 1,604 12 0 129 2,603
Total 34,798 33,048 176 0 3,615 71,638

Oconee Nuclear Station Document D03-1671-003, Rev. 0 Decommissioning Cost Analysis Section 3, Page 34 of 52
TLG Services, Inc.
TABLE 3.5 SAFSTOR ALTERNATIVE, UNIT 1 TOTAL ANNUAL EXPENDITURES
(thousands, 2013 dollars) Equipment & Year Labor Materials Energy Burial Other Total
2033 33,925 2,537 639 3,330 7,959 48,390 2034 25,670 4,745 484 1,084 18,662 50,645 2035 7,742 1,013 142 14 2,801 11,712 2036 7,763 1,016 142 14 2,808 11,744 2037 7,742 1,013 142 14 2,801 11,712 2038 7,742 1,013 142 14 2,801 11,712 2039 7,742 1,013 142 14 2,801 11,712 2040 7,763 1,016 142 14 2,808 11,744 2041 7,742 1,013 142 14 2,801 11,712 2042 7,742 1,013 142 14 2,801 11,712 2043 7,742 1,013 142 14 2,801 11,712 2044 6,301 876 124 12 2,344 9,657 2045 2,002 466 71 6 978 3,522 2046 2,002 466 71 6 978 3,522 2047 2,002 466 71 6 978 3,522 2048 2,007 467 71 6 980 3,532 2049 2,002 466 71 6 978 3,522 2050 2,002 466 71 6 978 3,522 2051 2,002 466 71 6 978 3,522 2052 2,007 467 71 6 980 3,532 2053 2,002 466 71 6 978 3,522 2054 2,002 466 71 6 978 3,522 2055 2,002 466 71 6 978 3,522 2056 2,007 467 71 6 980 3,532 2057 2,002 466 71 6 978 3,522 2058 1,914 422 71 6 935 3,349 2059 1,659 295 71 6 811 2,843 2060 1,664 296 71 6 813 2,851 2061 1,659 295 71 6 811 2,843 2062 1,659 295 71 6 811 2,843 2063 1,659 295 71 6 811 2,843 2064 1,664 296 71 6 813 2,851
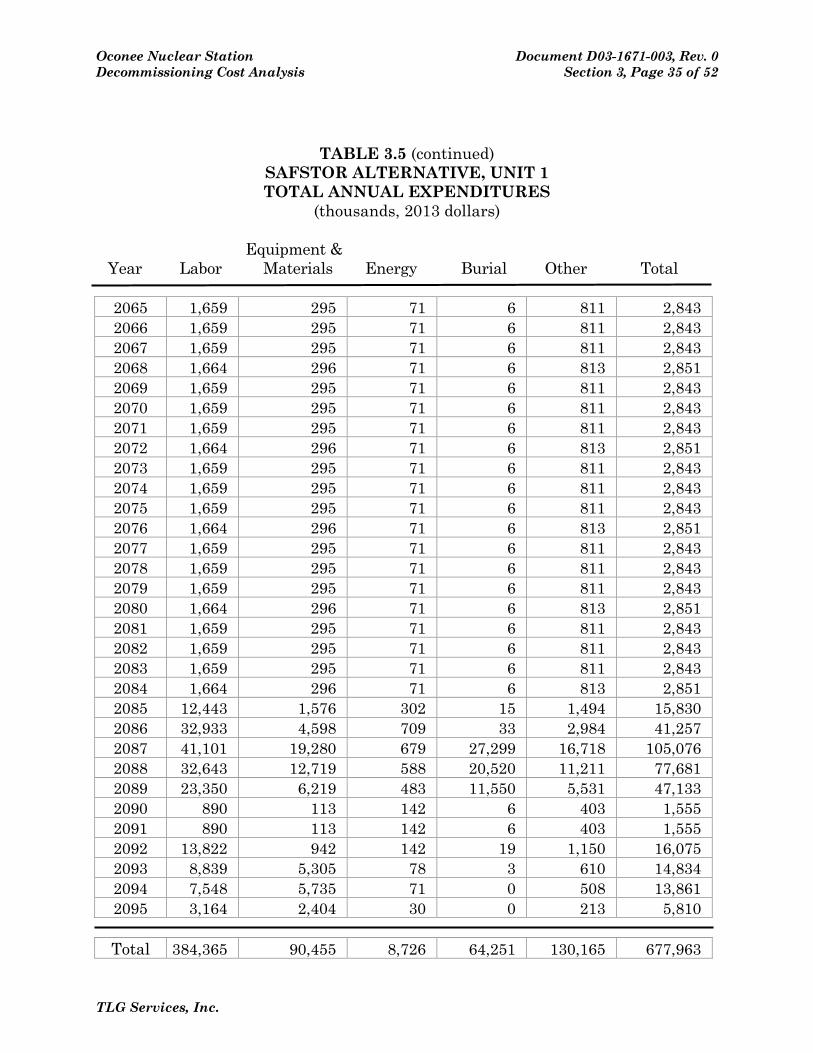
Oconee Nuclear Station Document D03-1671-003, Rev. 0 Decommissioning Cost Analysis Section 3, Page 35 of 52
TLG Services, Inc.
TABLE 3.5 (continued) SAFSTOR ALTERNATIVE, UNIT 1 TOTAL ANNUAL EXPENDITURES
(thousands, 2013 dollars) Equipment & Year Labor Materials Energy Burial Other Total
2065 1,659 295 71 6 811 2,843 2066 1,659 295 71 6 811 2,843 2067 1,659 295 71 6 811 2,843 2068 1,664 296 71 6 813 2,851 2069 1,659 295 71 6 811 2,843 2070 1,659 295 71 6 811 2,843 2071 1,659 295 71 6 811 2,843 2072 1,664 296 71 6 813 2,851 2073 1,659 295 71 6 811 2,843 2074 1,659 295 71 6 811 2,843 2075 1,659 295 71 6 811 2,843 2076 1,664 296 71 6 813 2,851 2077 1,659 295 71 6 811 2,843 2078 1,659 295 71 6 811 2,843 2079 1,659 295 71 6 811 2,843 2080 1,664 296 71 6 813 2,851 2081 1,659 295 71 6 811 2,843 2082 1,659 295 71 6 811 2,843 2083 1,659 295 71 6 811 2,843 2084 1,664 296 71 6 813 2,851 2085 12,443 1,576 302 15 1,494 15,830 2086 32,933 4,598 709 33 2,984 41,257 2087 41,101 19,280 679 27,299 16,718 105,076 2088 32,643 12,719 588 20,520 11,211 77,681 2089 23,350 6,219 483 11,550 5,531 47,133 2090 890 113 142 6 403 1,555 2091 890 113 142 6 403 1,555 2092 13,822 942 142 19 1,150 16,075 2093 8,839 5,305 78 3 610 14,834 2094 7,548 5,735 71 0 508 13,861 2095 3,164 2,404 30 0 213 5,810
Total 384,365 90,455 8,726 64,251 130,165 677,963
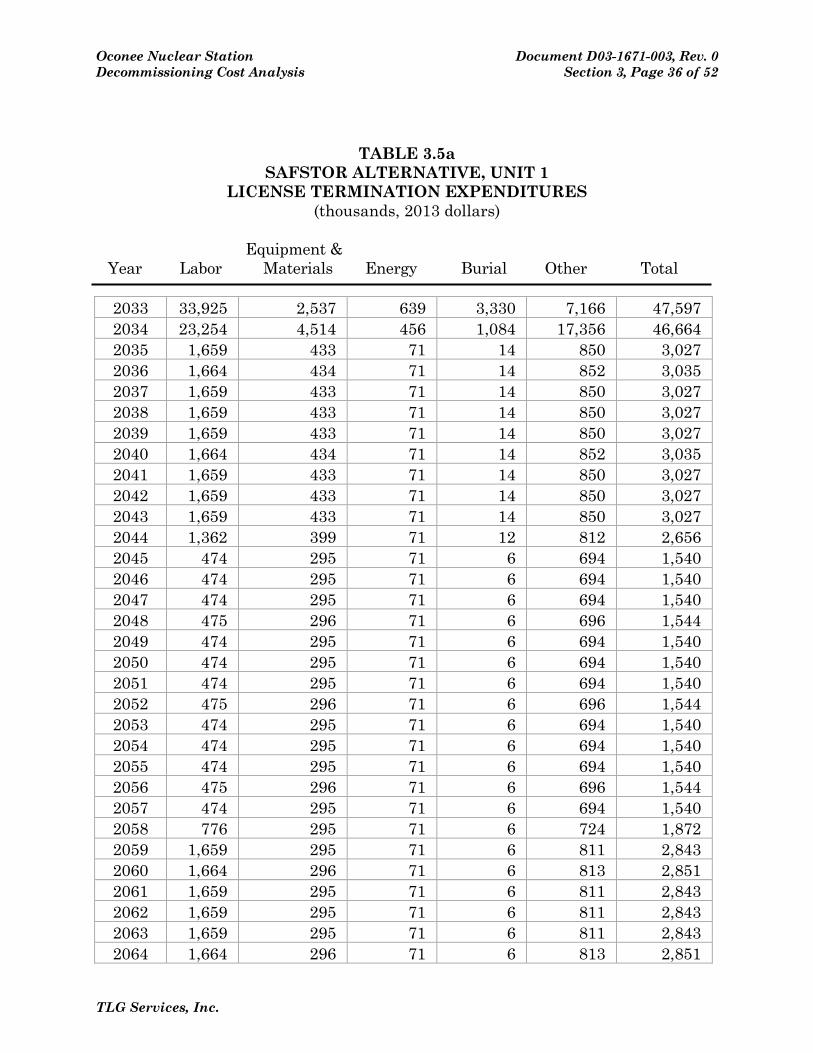
Oconee Nuclear Station Document D03-1671-003, Rev. 0 Decommissioning Cost Analysis Section 3, Page 36 of 52
TLG Services, Inc.
TABLE 3.5a SAFSTOR ALTERNATIVE, UNIT 1
LICENSE TERMINATION EXPENDITURES (thousands, 2013 dollars)
Equipment & Year Labor Materials Energy Burial Other Total
2033 33,925 2,537 639 3,330 7,166 47,597 2034 23,254 4,514 456 1,084 17,356 46,664 2035 1,659 433 71 14 850 3,027 2036 1,664 434 71 14 852 3,035 2037 1,659 433 71 14 850 3,027 2038 1,659 433 71 14 850 3,027 2039 1,659 433 71 14 850 3,027 2040 1,664 434 71 14 852 3,035 2041 1,659 433 71 14 850 3,027 2042 1,659 433 71 14 850 3,027 2043 1,659 433 71 14 850 3,027 2044 1,362 399 71 12 812 2,656 2045 474 295 71 6 694 1,540 2046 474 295 71 6 694 1,540 2047 474 295 71 6 694 1,540 2048 475 296 71 6 696 1,544 2049 474 295 71 6 694 1,540 2050 474 295 71 6 694 1,540 2051 474 295 71 6 694 1,540 2052 475 296 71 6 696 1,544 2053 474 295 71 6 694 1,540 2054 474 295 71 6 694 1,540 2055 474 295 71 6 694 1,540 2056 475 296 71 6 696 1,544 2057 474 295 71 6 694 1,540 2058 776 295 71 6 724 1,872 2059 1,659 295 71 6 811 2,843 2060 1,664 296 71 6 813 2,851 2061 1,659 295 71 6 811 2,843 2062 1,659 295 71 6 811 2,843 2063 1,659 295 71 6 811 2,843 2064 1,664 296 71 6 813 2,851
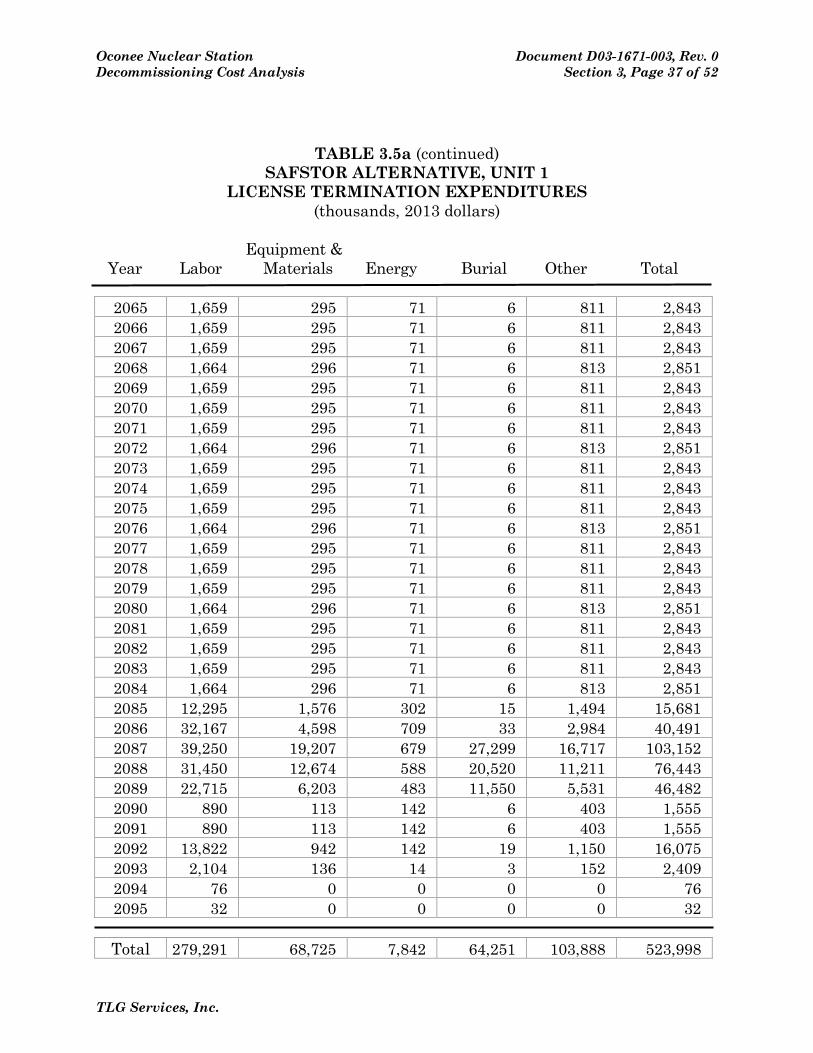
Oconee Nuclear Station Document D03-1671-003, Rev. 0 Decommissioning Cost Analysis Section 3, Page 37 of 52
TLG Services, Inc.
TABLE 3.5a (continued) SAFSTOR ALTERNATIVE, UNIT 1
LICENSE TERMINATION EXPENDITURES (thousands, 2013 dollars)
Equipment & Year Labor Materials Energy Burial Other Total
2065 1,659 295 71 6 811 2,843 2066 1,659 295 71 6 811 2,843 2067 1,659 295 71 6 811 2,843 2068 1,664 296 71 6 813 2,851 2069 1,659 295 71 6 811 2,843 2070 1,659 295 71 6 811 2,843 2071 1,659 295 71 6 811 2,843 2072 1,664 296 71 6 813 2,851 2073 1,659 295 71 6 811 2,843 2074 1,659 295 71 6 811 2,843 2075 1,659 295 71 6 811 2,843 2076 1,664 296 71 6 813 2,851 2077 1,659 295 71 6 811 2,843 2078 1,659 295 71 6 811 2,843 2079 1,659 295 71 6 811 2,843 2080 1,664 296 71 6 813 2,851 2081 1,659 295 71 6 811 2,843 2082 1,659 295 71 6 811 2,843 2083 1,659 295 71 6 811 2,843 2084 1,664 296 71 6 813 2,851 2085 12,295 1,576 302 15 1,494 15,681 2086 32,167 4,598 709 33 2,984 40,491 2087 39,250 19,207 679 27,299 16,717 103,152 2088 31,450 12,674 588 20,520 11,211 76,443 2089 22,715 6,203 483 11,550 5,531 46,482 2090 890 113 142 6 403 1,555 2091 890 113 142 6 403 1,555 2092 13,822 942 142 19 1,150 16,075 2093 2,104 136 14 3 152 2,409 2094 76 0 0 0 0 76 2095 32 0 0 0 0 32
Total 279,291 68,725 7,842 64,251 103,888 523,998

Oconee Nuclear Station Document D03-1671-003, Rev. 0 Decommissioning Cost Analysis Section 3, Page 38 of 52
TLG Services, Inc.
TABLE 3.5b SAFSTOR ALTERNATIVE, UNIT 1
SPENT FUEL MANAGEMENT EXPENDITURES (thousands, 2013 dollars)
Equipment & Year Labor Materials Energy Burial Other Total
2033 0 0 0 0 793 793 2034 2,416 231 28 0 1,305 3,981 2035 6,083 581 71 0 1,951 8,685 2036 6,099 582 71 0 1,956 8,709 2037 6,083 581 71 0 1,951 8,685 2038 6,083 581 71 0 1,951 8,685 2039 6,083 581 71 0 1,951 8,685 2040 6,099 582 71 0 1,956 8,709 2041 6,083 581 71 0 1,951 8,685 2042 6,083 581 71 0 1,951 8,685 2043 6,083 581 71 0 1,951 8,685 2044 4,939 478 53 0 1,531 7,001 2045 1,528 171 0 0 283 1,982 2046 1,528 171 0 0 283 1,982 2047 1,528 171 0 0 283 1,982 2048 1,532 171 0 0 284 1,987 2049 1,528 171 0 0 283 1,982 2050 1,528 171 0 0 283 1,982 2051 1,528 171 0 0 283 1,982 2052 1,532 171 0 0 284 1,987 2053 1,528 171 0 0 283 1,982 2054 1,528 171 0 0 283 1,982 2055 1,528 171 0 0 283 1,982 2056 1,532 171 0 0 284 1,987 2057 1,528 171 0 0 283 1,982 2058 1,138 127 0 0 211 1,477
Total 83,143 8,289 720 0 25,097 117,249
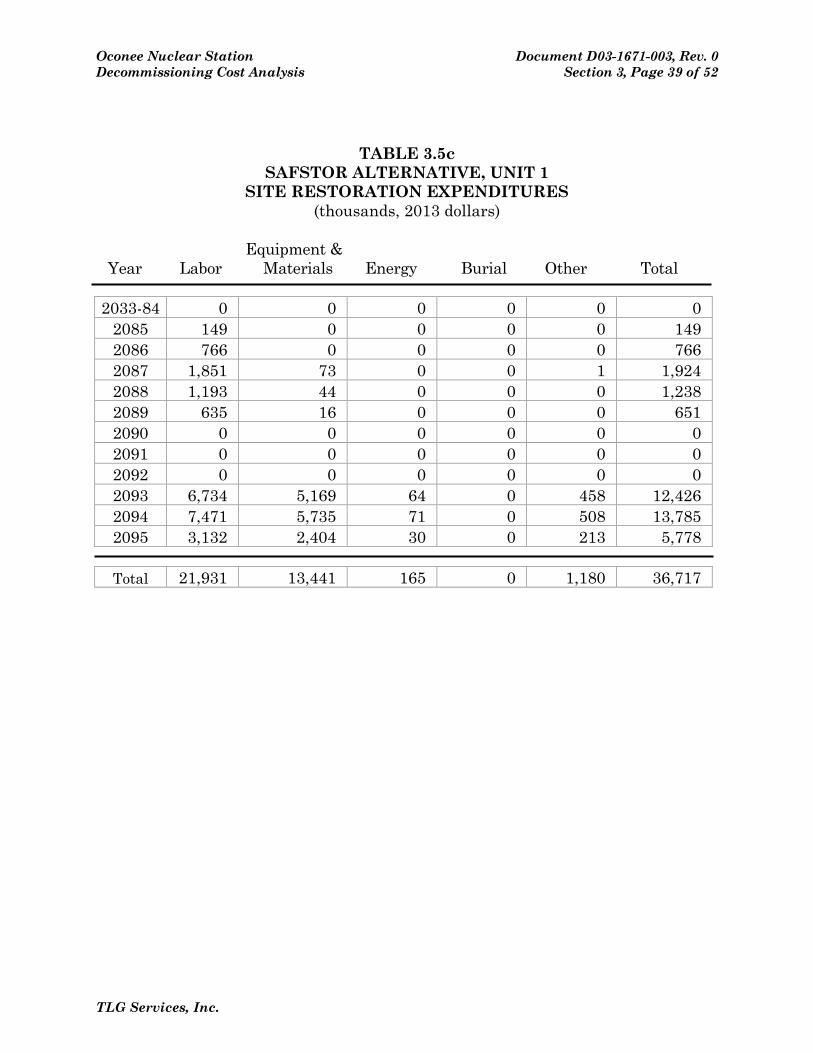
Oconee Nuclear Station Document D03-1671-003, Rev. 0 Decommissioning Cost Analysis Section 3, Page 39 of 52
TLG Services, Inc.
TABLE 3.5c SAFSTOR ALTERNATIVE, UNIT 1
SITE RESTORATION EXPENDITURES (thousands, 2013 dollars)
Equipment & Year Labor Materials Energy Burial Other Total 2033-84 0 0 0 0 0 0
2085 149 0 0 0 0 149 2086 766 0 0 0 0 766 2087 1,851 73 0 0 1 1,924 2088 1,193 44 0 0 0 1,238 2089 635 16 0 0 0 651 2090 0 0 0 0 0 0 2091 0 0 0 0 0 0 2092 0 0 0 0 0 0 2093 6,734 5,169 64 0 458 12,426 2094 7,471 5,735 71 0 508 13,785 2095 3,132 2,404 30 0 213 5,778
Total 21,931 13,441 165 0 1,180 36,717

Oconee Nuclear Station Document D03-1671-003, Rev. 0 Decommissioning Cost Analysis Section 3, Page 40 of 52
TLG Services, Inc.
TABLE 3.6 SAFSTOR ALTERNATIVE, UNIT 2 TOTAL ANNUAL EXPENDITURES
(thousands, 2013 dollars) Equipment & Year Labor Materials Energy Burial Other Total
2033 7,542 662 169 880 1,881 11,134 2034 32,470 4,942 709 3,134 15,600 56,855 2035 11,719 2,079 293 398 4,185 18,673 2036 4,572 1,022 142 13 2,364 8,113 2037 4,560 1,019 142 12 2,358 8,091 2038 4,560 1,019 142 12 2,358 8,091 2039 4,560 1,019 142 12 2,358 8,091 2040 4,572 1,022 142 13 2,364 8,113 2041 4,560 1,019 142 12 2,358 8,091 2042 4,560 1,019 142 12 2,358 8,091 2043 4,560 1,019 142 12 2,358 8,091 2044 3,920 881 124 11 2,007 6,943 2045 2,000 465 71 6 956 3,498 2046 2,000 465 71 6 956 3,498 2047 2,000 465 71 6 956 3,498 2048 2,005 466 71 6 958 3,507 2049 2,000 465 71 6 956 3,498 2050 2,000 465 71 6 956 3,498 2051 2,000 465 71 6 956 3,498 2052 2,005 466 71 6 958 3,507 2053 2,000 465 71 6 956 3,498 2054 2,000 465 71 6 956 3,498 2055 2,000 465 71 6 956 3,498 2056 2,005 466 71 6 958 3,507 2057 2,000 465 71 6 956 3,498 2058 1,740 421 71 6 897 3,134 2059 978 290 71 6 726 2,071 2060 981 291 71 6 728 2,077 2061 978 290 71 6 726 2,071 2062 978 290 71 6 726 2,071 2063 978 290 71 6 726 2,071 2064 981 291 71 6 728 2,077

Oconee Nuclear Station Document D03-1671-003, Rev. 0 Decommissioning Cost Analysis Section 3, Page 41 of 52
TLG Services, Inc.
TABLE 3.6 (continued) SAFSTOR ALTERNATIVE, UNIT 2 TOTAL ANNUAL EXPENDITURES
(thousands, 2013 dollars) Equipment & Year Labor Materials Energy Burial Other Total
2065 978 290 71 6 726 2,071 2066 978 290 71 6 726 2,071 2067 978 290 71 6 726 2,071 2068 981 291 71 6 728 2,077 2069 978 290 71 6 726 2,071 2070 978 290 71 6 726 2,071 2071 978 290 71 6 726 2,071 2072 981 291 71 6 728 2,077 2073 978 290 71 6 726 2,071 2074 978 290 71 6 726 2,071 2075 978 290 71 6 726 2,071 2076 981 291 71 6 728 2,077 2077 978 290 71 6 726 2,071 2078 978 290 71 6 726 2,071 2079 978 290 71 6 726 2,071 2080 981 291 71 6 728 2,077 2081 978 290 71 6 726 2,071 2082 978 290 71 6 726 2,071 2083 978 290 71 6 726 2,071 2084 981 291 71 6 728 2,077 2085 978 290 71 6 726 2,071 2086 3,697 586 151 9 915 5,358 2087 22,849 3,050 709 30 2,296 28,933 2088 35,780 15,681 689 20,250 12,736 85,136 2089 36,856 16,377 620 26,112 14,032 93,996 2090 27,916 7,771 532 15,425 6,235 57,879 2091 3,458 949 185 1,696 986 7,273 2092 13,512 930 142 19 985 15,589 2093 8,752 5,279 78 3 589 14,701 2094 7,478 5,708 71 0 508 13,765 2095 3,135 2,393 30 0 213 5,770
Total 309,770 89,756 8,545 68,311 114,996 591,377
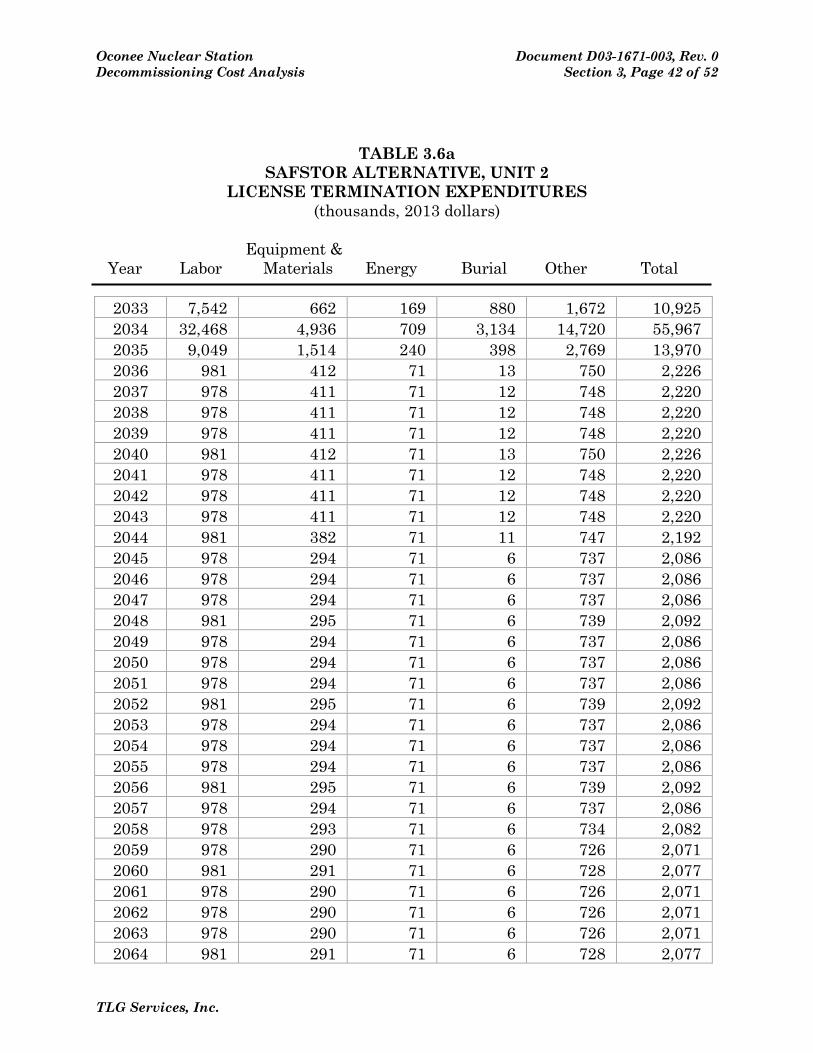
Oconee Nuclear Station Document D03-1671-003, Rev. 0 Decommissioning Cost Analysis Section 3, Page 42 of 52
TLG Services, Inc.
TABLE 3.6a SAFSTOR ALTERNATIVE, UNIT 2
LICENSE TERMINATION EXPENDITURES (thousands, 2013 dollars)
Equipment & Year Labor Materials Energy Burial Other Total
2033 7,542 662 169 880 1,672 10,925 2034 32,468 4,936 709 3,134 14,720 55,967 2035 9,049 1,514 240 398 2,769 13,970 2036 981 412 71 13 750 2,226 2037 978 411 71 12 748 2,220 2038 978 411 71 12 748 2,220 2039 978 411 71 12 748 2,220 2040 981 412 71 13 750 2,226 2041 978 411 71 12 748 2,220 2042 978 411 71 12 748 2,220 2043 978 411 71 12 748 2,220 2044 981 382 71 11 747 2,192 2045 978 294 71 6 737 2,086 2046 978 294 71 6 737 2,086 2047 978 294 71 6 737 2,086 2048 981 295 71 6 739 2,092 2049 978 294 71 6 737 2,086 2050 978 294 71 6 737 2,086 2051 978 294 71 6 737 2,086 2052 981 295 71 6 739 2,092 2053 978 294 71 6 737 2,086 2054 978 294 71 6 737 2,086 2055 978 294 71 6 737 2,086 2056 981 295 71 6 739 2,092 2057 978 294 71 6 737 2,086 2058 978 293 71 6 734 2,082 2059 978 290 71 6 726 2,071 2060 981 291 71 6 728 2,077 2061 978 290 71 6 726 2,071 2062 978 290 71 6 726 2,071 2063 978 290 71 6 726 2,071 2064 981 291 71 6 728 2,077
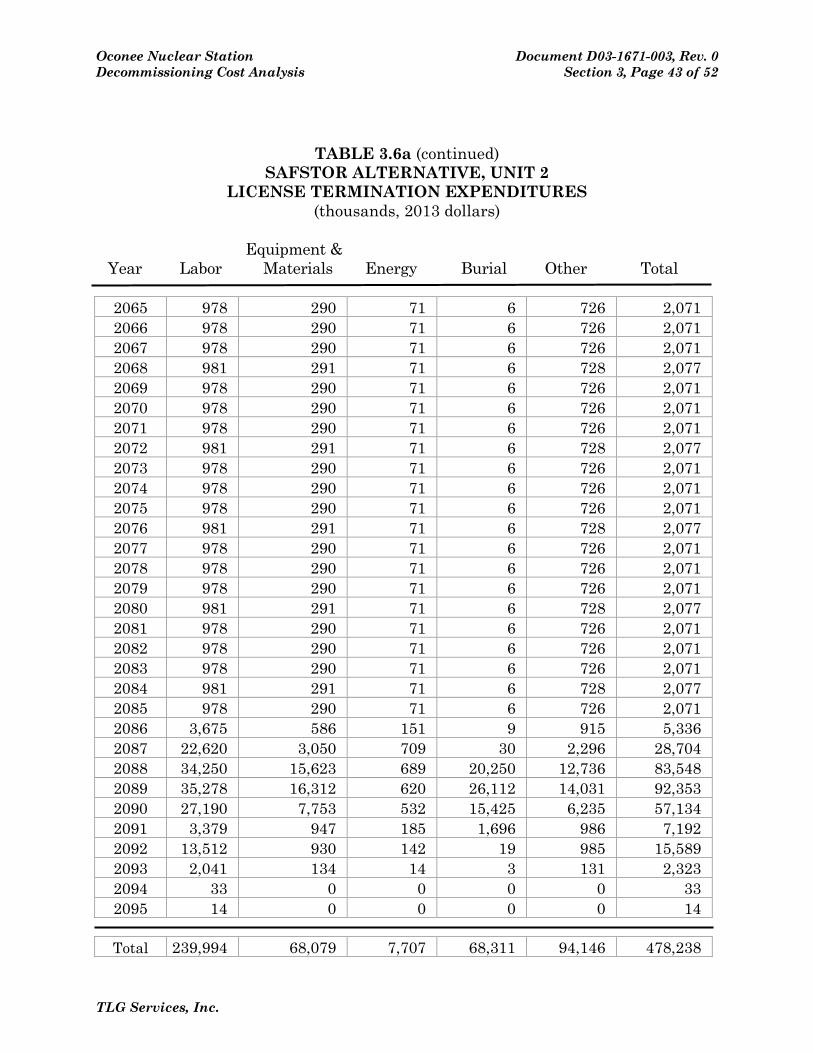
Oconee Nuclear Station Document D03-1671-003, Rev. 0 Decommissioning Cost Analysis Section 3, Page 43 of 52
TLG Services, Inc.
TABLE 3.6a (continued) SAFSTOR ALTERNATIVE, UNIT 2
LICENSE TERMINATION EXPENDITURES (thousands, 2013 dollars)
Equipment & Year Labor Materials Energy Burial Other Total
2065 978 290 71 6 726 2,071 2066 978 290 71 6 726 2,071 2067 978 290 71 6 726 2,071 2068 981 291 71 6 728 2,077 2069 978 290 71 6 726 2,071 2070 978 290 71 6 726 2,071 2071 978 290 71 6 726 2,071 2072 981 291 71 6 728 2,077 2073 978 290 71 6 726 2,071 2074 978 290 71 6 726 2,071 2075 978 290 71 6 726 2,071 2076 981 291 71 6 728 2,077 2077 978 290 71 6 726 2,071 2078 978 290 71 6 726 2,071 2079 978 290 71 6 726 2,071 2080 981 291 71 6 728 2,077 2081 978 290 71 6 726 2,071 2082 978 290 71 6 726 2,071 2083 978 290 71 6 726 2,071 2084 981 291 71 6 728 2,077 2085 978 290 71 6 726 2,071 2086 3,675 586 151 9 915 5,336 2087 22,620 3,050 709 30 2,296 28,704 2088 34,250 15,623 689 20,250 12,736 83,548 2089 35,278 16,312 620 26,112 14,031 92,353 2090 27,190 7,753 532 15,425 6,235 57,134 2091 3,379 947 185 1,696 986 7,192 2092 13,512 930 142 19 985 15,589 2093 2,041 134 14 3 131 2,323 2094 33 0 0 0 0 33 2095 14 0 0 0 0 14
Total 239,994 68,079 7,707 68,311 94,146 478,238
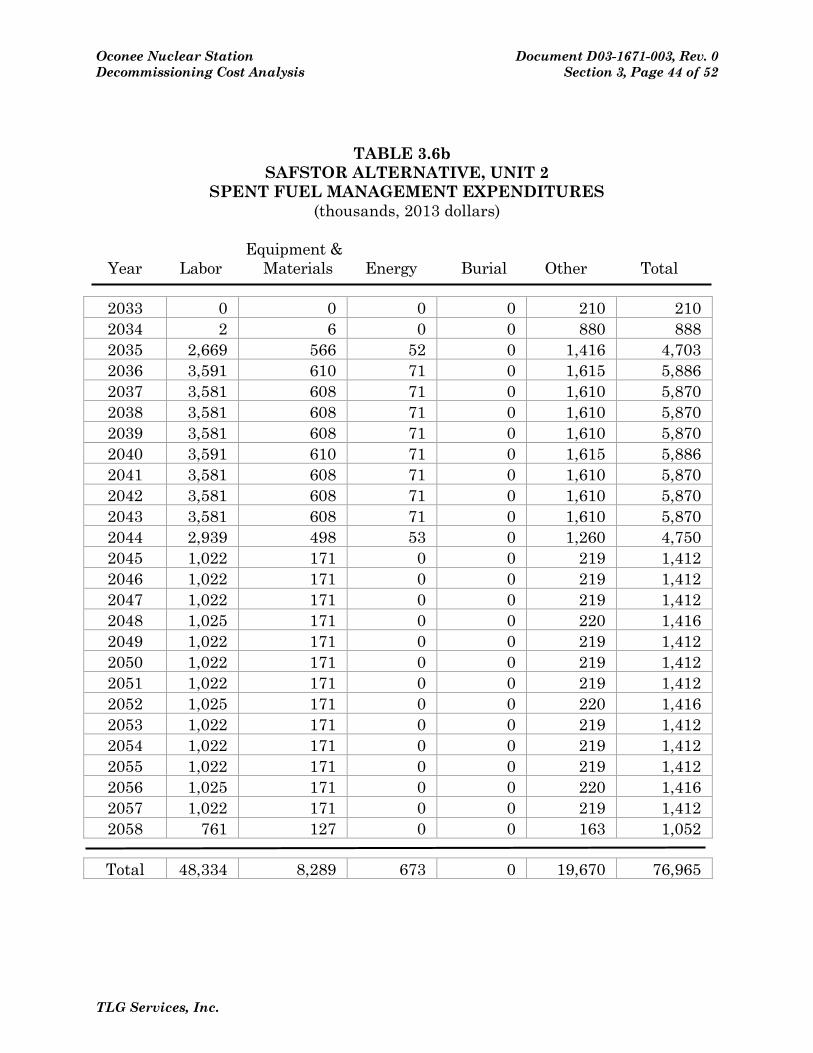
Oconee Nuclear Station Document D03-1671-003, Rev. 0 Decommissioning Cost Analysis Section 3, Page 44 of 52
TLG Services, Inc.
TABLE 3.6b SAFSTOR ALTERNATIVE, UNIT 2
SPENT FUEL MANAGEMENT EXPENDITURES (thousands, 2013 dollars)
Equipment & Year Labor Materials Energy Burial Other Total
2033 0 0 0 0 210 210 2034 2 6 0 0 880 888 2035 2,669 566 52 0 1,416 4,703 2036 3,591 610 71 0 1,615 5,886 2037 3,581 608 71 0 1,610 5,870 2038 3,581 608 71 0 1,610 5,870 2039 3,581 608 71 0 1,610 5,870 2040 3,591 610 71 0 1,615 5,886 2041 3,581 608 71 0 1,610 5,870 2042 3,581 608 71 0 1,610 5,870 2043 3,581 608 71 0 1,610 5,870 2044 2,939 498 53 0 1,260 4,750 2045 1,022 171 0 0 219 1,412 2046 1,022 171 0 0 219 1,412 2047 1,022 171 0 0 219 1,412 2048 1,025 171 0 0 220 1,416 2049 1,022 171 0 0 219 1,412 2050 1,022 171 0 0 219 1,412 2051 1,022 171 0 0 219 1,412 2052 1,025 171 0 0 220 1,416 2053 1,022 171 0 0 219 1,412 2054 1,022 171 0 0 219 1,412 2055 1,022 171 0 0 219 1,412 2056 1,025 171 0 0 220 1,416 2057 1,022 171 0 0 219 1,412 2058 761 127 0 0 163 1,052
Total 48,334 8,289 673 0 19,670 76,965
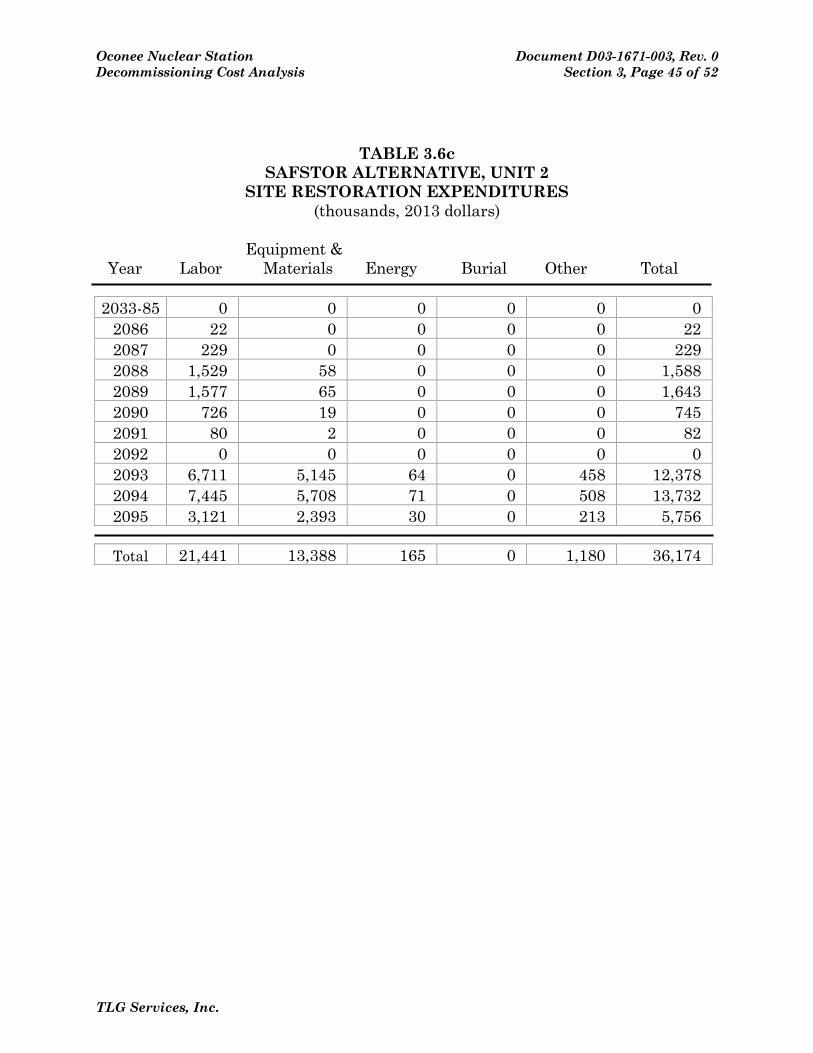
Oconee Nuclear Station Document D03-1671-003, Rev. 0 Decommissioning Cost Analysis Section 3, Page 45 of 52
TLG Services, Inc.
TABLE 3.6c SAFSTOR ALTERNATIVE, UNIT 2
SITE RESTORATION EXPENDITURES (thousands, 2013 dollars)
Equipment & Year Labor Materials Energy Burial Other Total 2033-85 0 0 0 0 0 0
2086 22 0 0 0 0 22 2087 229 0 0 0 0 229 2088 1,529 58 0 0 0 1,588 2089 1,577 65 0 0 0 1,643 2090 726 19 0 0 0 745 2091 80 2 0 0 0 82 2092 0 0 0 0 0 0 2093 6,711 5,145 64 0 458 12,378 2094 7,445 5,708 71 0 508 13,732 2095 3,121 2,393 30 0 213 5,756
Total 21,441 13,388 165 0 1,180 36,174

Oconee Nuclear Station Document D03-1671-003, Rev. 0 Decommissioning Cost Analysis Section 3, Page 46 of 52
TLG Services, Inc.
TABLE 3.7 SAFSTOR ALTERNATIVE, UNIT 3 TOTAL ANNUAL EXPENDITURES
(thousands, 2013 dollars) Equipment & Year Labor Materials Energy Burial Other Total
2034 14,430 1,380 322 1,679 4,036 21,847 2035 33,496 6,510 709 4,894 17,150 62,759 2036 5,932 1,231 170 95 3,258 10,685 2037 4,602 1,043 142 12 2,967 8,766 2038 4,602 1,043 142 12 2,967 8,766 2039 4,602 1,043 142 12 2,967 8,766 2040 4,614 1,046 142 13 2,975 8,790 2041 4,602 1,043 142 12 2,967 8,766 2042 4,602 1,043 142 12 2,967 8,766 2043 4,602 1,043 142 12 2,967 8,766 2044 3,961 902 124 11 2,502 7,500 2045 2,038 478 71 6 1,107 3,701 2046 2,038 478 71 6 1,107 3,701 2047 2,038 478 71 6 1,107 3,701 2048 2,044 479 71 6 1,110 3,711 2049 2,038 478 71 6 1,107 3,701 2050 2,038 478 71 6 1,107 3,701 2051 2,038 478 71 6 1,107 3,701 2052 2,044 479 71 6 1,110 3,711 2053 2,038 478 71 6 1,107 3,701 2054 2,038 478 71 6 1,107 3,701 2055 2,038 478 71 6 1,107 3,701 2056 2,044 479 71 6 1,110 3,711 2057 2,038 478 71 6 1,107 3,701 2058 1,778 433 71 6 1,011 3,299 2059 1,016 303 71 6 728 2,124 2060 1,019 304 71 6 730 2,130 2061 1,016 303 71 6 728 2,124 2062 1,016 303 71 6 728 2,124 2063 1,016 303 71 6 728 2,124 2064 1,019 304 71 6 730 2,130 2065 1,016 303 71 6 728 2,124
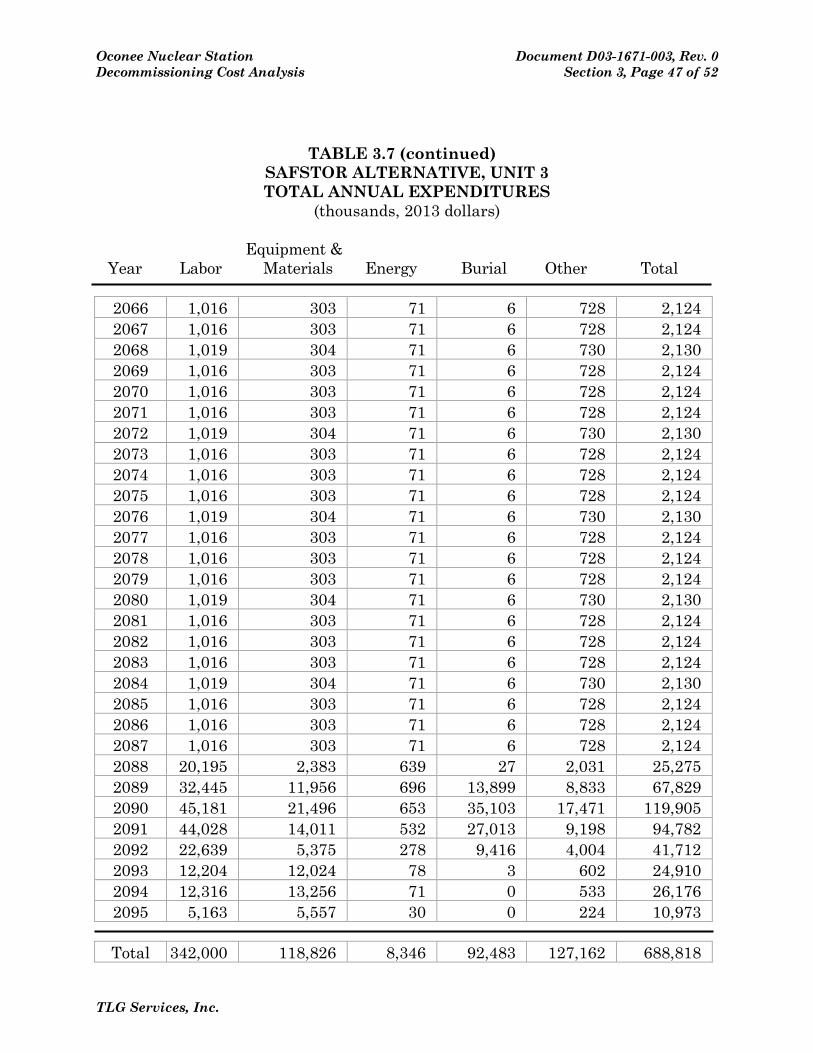
Oconee Nuclear Station Document D03-1671-003, Rev. 0 Decommissioning Cost Analysis Section 3, Page 47 of 52
TLG Services, Inc.
TABLE 3.7 (continued) SAFSTOR ALTERNATIVE, UNIT 3 TOTAL ANNUAL EXPENDITURES
(thousands, 2013 dollars) Equipment & Year Labor Materials Energy Burial Other Total
2066 1,016 303 71 6 728 2,124 2067 1,016 303 71 6 728 2,124 2068 1,019 304 71 6 730 2,130 2069 1,016 303 71 6 728 2,124 2070 1,016 303 71 6 728 2,124 2071 1,016 303 71 6 728 2,124 2072 1,019 304 71 6 730 2,130 2073 1,016 303 71 6 728 2,124 2074 1,016 303 71 6 728 2,124 2075 1,016 303 71 6 728 2,124 2076 1,019 304 71 6 730 2,130 2077 1,016 303 71 6 728 2,124 2078 1,016 303 71 6 728 2,124 2079 1,016 303 71 6 728 2,124 2080 1,019 304 71 6 730 2,130 2081 1,016 303 71 6 728 2,124 2082 1,016 303 71 6 728 2,124 2083 1,016 303 71 6 728 2,124 2084 1,019 304 71 6 730 2,130 2085 1,016 303 71 6 728 2,124 2086 1,016 303 71 6 728 2,124 2087 1,016 303 71 6 728 2,124 2088 20,195 2,383 639 27 2,031 25,275 2089 32,445 11,956 696 13,899 8,833 67,829 2090 45,181 21,496 653 35,103 17,471 119,905 2091 44,028 14,011 532 27,013 9,198 94,782 2092 22,639 5,375 278 9,416 4,004 41,712 2093 12,204 12,024 78 3 602 24,910 2094 12,316 13,256 71 0 533 26,176 2095 5,163 5,557 30 0 224 10,973
Total 342,000 118,826 8,346 92,483 127,162 688,818
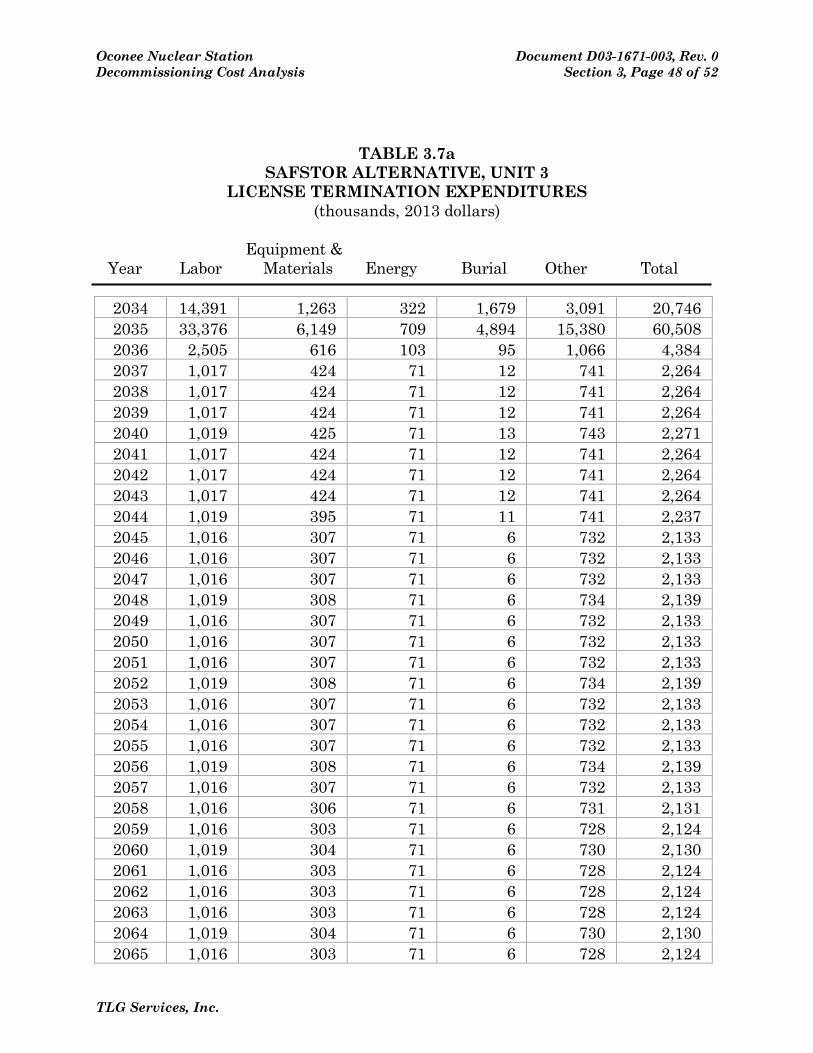
Oconee Nuclear Station Document D03-1671-003, Rev. 0 Decommissioning Cost Analysis Section 3, Page 48 of 52
TLG Services, Inc.
TABLE 3.7a SAFSTOR ALTERNATIVE, UNIT 3
LICENSE TERMINATION EXPENDITURES (thousands, 2013 dollars)
Equipment & Year Labor Materials Energy Burial Other Total
2034 14,391 1,263 322 1,679 3,091 20,746 2035 33,376 6,149 709 4,894 15,380 60,508 2036 2,505 616 103 95 1,066 4,384 2037 1,017 424 71 12 741 2,264 2038 1,017 424 71 12 741 2,264 2039 1,017 424 71 12 741 2,264 2040 1,019 425 71 13 743 2,271 2041 1,017 424 71 12 741 2,264 2042 1,017 424 71 12 741 2,264 2043 1,017 424 71 12 741 2,264 2044 1,019 395 71 11 741 2,237 2045 1,016 307 71 6 732 2,133 2046 1,016 307 71 6 732 2,133 2047 1,016 307 71 6 732 2,133 2048 1,019 308 71 6 734 2,139 2049 1,016 307 71 6 732 2,133 2050 1,016 307 71 6 732 2,133 2051 1,016 307 71 6 732 2,133 2052 1,019 308 71 6 734 2,139 2053 1,016 307 71 6 732 2,133 2054 1,016 307 71 6 732 2,133 2055 1,016 307 71 6 732 2,133 2056 1,019 308 71 6 734 2,139 2057 1,016 307 71 6 732 2,133 2058 1,016 306 71 6 731 2,131 2059 1,016 303 71 6 728 2,124 2060 1,019 304 71 6 730 2,130 2061 1,016 303 71 6 728 2,124 2062 1,016 303 71 6 728 2,124 2063 1,016 303 71 6 728 2,124 2064 1,019 304 71 6 730 2,130 2065 1,016 303 71 6 728 2,124
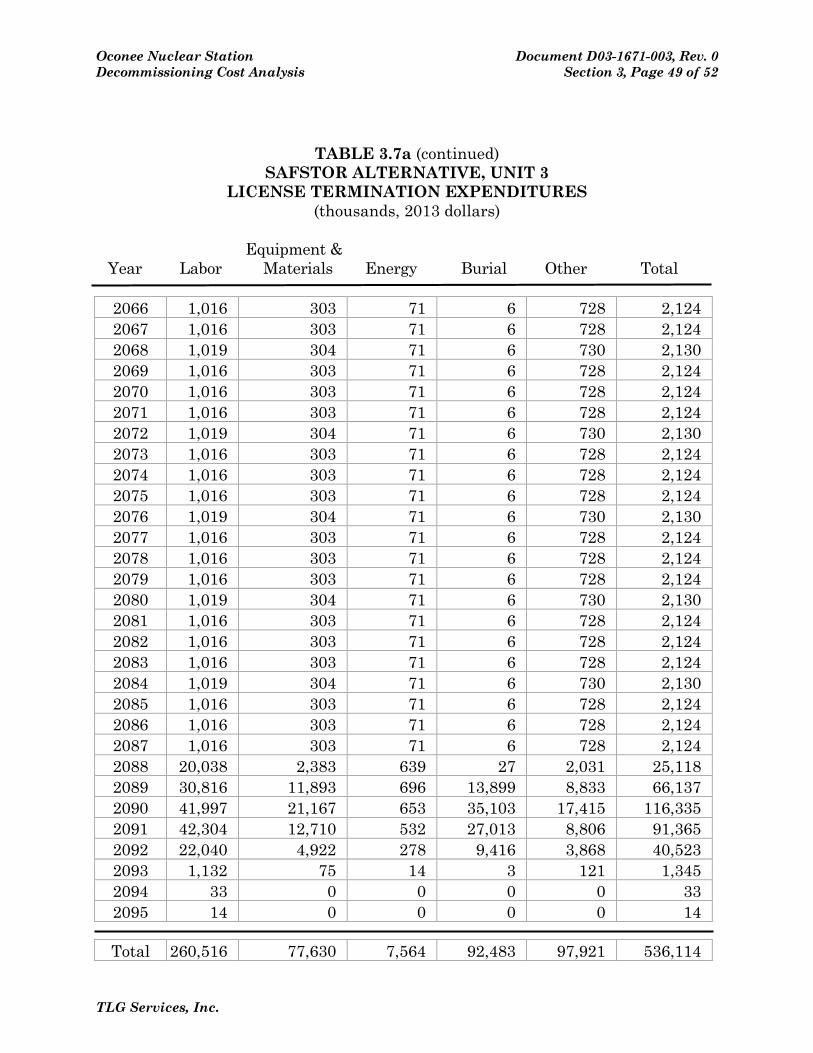
Oconee Nuclear Station Document D03-1671-003, Rev. 0 Decommissioning Cost Analysis Section 3, Page 49 of 52
TLG Services, Inc.
TABLE 3.7a (continued) SAFSTOR ALTERNATIVE, UNIT 3
LICENSE TERMINATION EXPENDITURES (thousands, 2013 dollars)
Equipment & Year Labor Materials Energy Burial Other Total
2066 1,016 303 71 6 728 2,124 2067 1,016 303 71 6 728 2,124 2068 1,019 304 71 6 730 2,130 2069 1,016 303 71 6 728 2,124 2070 1,016 303 71 6 728 2,124 2071 1,016 303 71 6 728 2,124 2072 1,019 304 71 6 730 2,130 2073 1,016 303 71 6 728 2,124 2074 1,016 303 71 6 728 2,124 2075 1,016 303 71 6 728 2,124 2076 1,019 304 71 6 730 2,130 2077 1,016 303 71 6 728 2,124 2078 1,016 303 71 6 728 2,124 2079 1,016 303 71 6 728 2,124 2080 1,019 304 71 6 730 2,130 2081 1,016 303 71 6 728 2,124 2082 1,016 303 71 6 728 2,124 2083 1,016 303 71 6 728 2,124 2084 1,019 304 71 6 730 2,130 2085 1,016 303 71 6 728 2,124 2086 1,016 303 71 6 728 2,124 2087 1,016 303 71 6 728 2,124 2088 20,038 2,383 639 27 2,031 25,118 2089 30,816 11,893 696 13,899 8,833 66,137 2090 41,997 21,167 653 35,103 17,415 116,335 2091 42,304 12,710 532 27,013 8,806 91,365 2092 22,040 4,922 278 9,416 3,868 40,523 2093 1,132 75 14 3 121 1,345 2094 33 0 0 0 0 33 2095 14 0 0 0 0 14
Total 260,516 77,630 7,564 92,483 97,921 536,114

Oconee Nuclear Station Document D03-1671-003, Rev. 0 Decommissioning Cost Analysis Section 3, Page 50 of 52
TLG Services, Inc.
TABLE 3.7b SAFSTOR ALTERNATIVE, UNIT 3
SPENT FUEL MANAGEMENT EXPENDITURES (thousands, 2013 dollars)
Equipment & Year Labor Materials Energy Burial Other Total
2034 39 117 0 0 622 778 2035 120 360 0 0 1,368 1,848 2036 3,426 615 68 0 2,156 6,265 2037 3,585 619 71 0 2,191 6,466 2038 3,585 619 71 0 2,191 6,466 2039 3,585 619 71 0 2,191 6,466 2040 3,595 621 71 0 2,197 6,484 2041 3,585 619 71 0 2,191 6,466 2042 3,585 619 71 0 2,191 6,466 2043 3,585 619 71 0 2,191 6,466 2044 2,942 507 53 0 1,727 5,229 2045 1,022 171 0 0 347 1,540 2046 1,022 171 0 0 347 1,540 2047 1,022 171 0 0 347 1,540 2048 1,025 171 0 0 348 1,544 2049 1,022 171 0 0 347 1,540 2050 1,022 171 0 0 347 1,540 2051 1,022 171 0 0 347 1,540 2052 1,025 171 0 0 348 1,544 2053 1,022 171 0 0 347 1,540 2054 1,022 171 0 0 347 1,540 2055 1,022 171 0 0 347 1,540 2056 1,025 171 0 0 348 1,544 2057 1,022 171 0 0 347 1,540 2058 761 127 0 0 259 1,148
Total 45,687 8,289 617 0 25,991 80,584
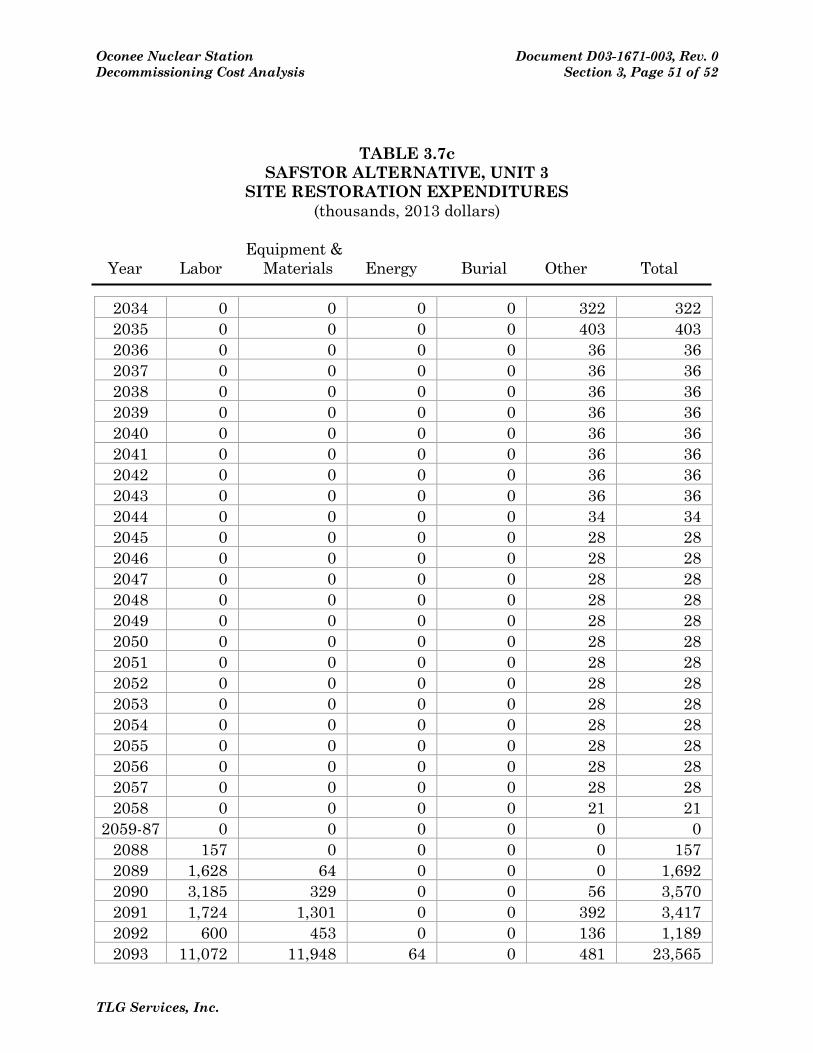
Oconee Nuclear Station Document D03-1671-003, Rev. 0 Decommissioning Cost Analysis Section 3, Page 51 of 52
TLG Services, Inc.
TABLE 3.7c SAFSTOR ALTERNATIVE, UNIT 3
SITE RESTORATION EXPENDITURES (thousands, 2013 dollars)
Equipment & Year Labor Materials Energy Burial Other Total
2034 0 0 0 0 322 322 2035 0 0 0 0 403 403 2036 0 0 0 0 36 36 2037 0 0 0 0 36 36 2038 0 0 0 0 36 36 2039 0 0 0 0 36 36 2040 0 0 0 0 36 36 2041 0 0 0 0 36 36 2042 0 0 0 0 36 36 2043 0 0 0 0 36 36 2044 0 0 0 0 34 34 2045 0 0 0 0 28 28 2046 0 0 0 0 28 28 2047 0 0 0 0 28 28 2048 0 0 0 0 28 28 2049 0 0 0 0 28 28 2050 0 0 0 0 28 28 2051 0 0 0 0 28 28 2052 0 0 0 0 28 28 2053 0 0 0 0 28 28 2054 0 0 0 0 28 28 2055 0 0 0 0 28 28 2056 0 0 0 0 28 28 2057 0 0 0 0 28 28 2058 0 0 0 0 21 21
2059-87 0 0 0 0 0 0 2088 157 0 0 0 0 157 2089 1,628 64 0 0 0 1,692 2090 3,185 329 0 0 56 3,570 2091 1,724 1,301 0 0 392 3,417 2092 600 453 0 0 136 1,189 2093 11,072 11,948 64 0 481 23,565
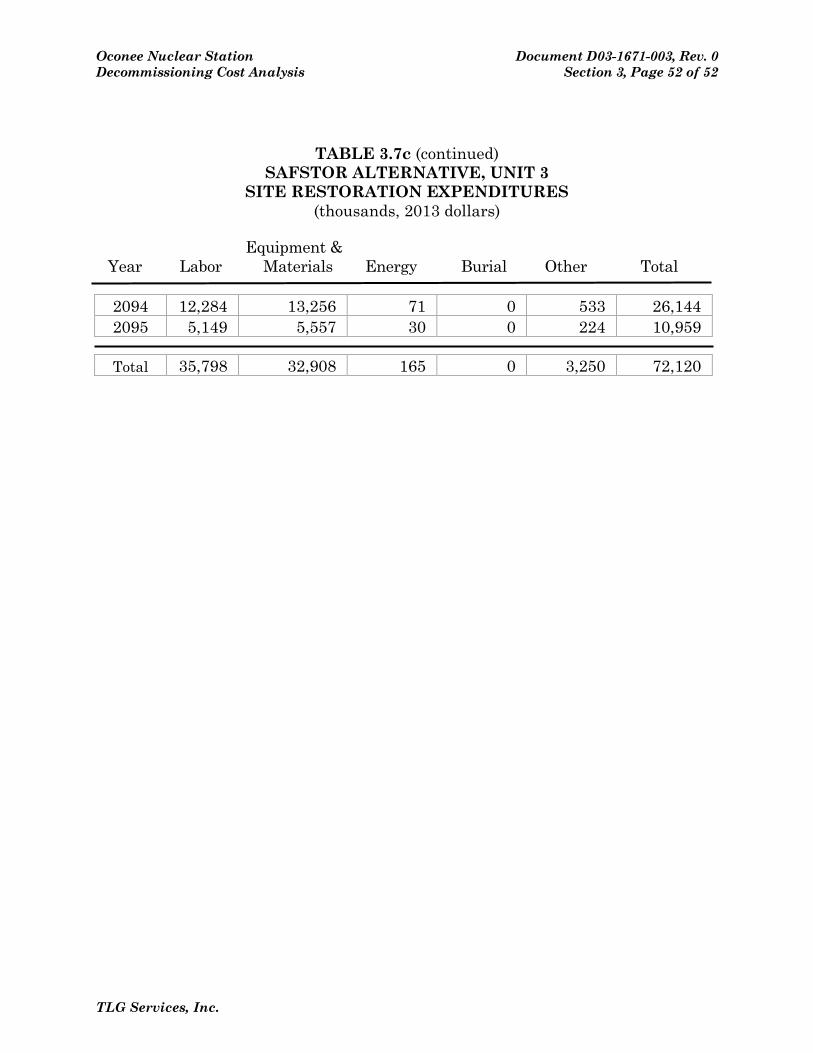
Oconee Nuclear Station Document D03-1671-003, Rev. 0 Decommissioning Cost Analysis Section 3, Page 52 of 52
TLG Services, Inc.
TABLE 3.7c (continued) SAFSTOR ALTERNATIVE, UNIT 3
SITE RESTORATION EXPENDITURES (thousands, 2013 dollars)
Equipment & Year Labor Materials Energy Burial Other Total
2094 12,284 13,256 71 0 533 26,144 2095 5,149 5,557 30 0 224 10,959
Total 35,798 32,908 165 0 3,250 72,120
Oconee Nuclear Station Document D03-1671-003, Rev. 0 Decommissioning Cost Analysis Section 4, Page 1 of 7
TLG Services, Inc.
4. SCHEDULE ESTIMATE The schedules for the decommissioning scenarios considered in this analysis follow the sequences presented in the AIF/NESP-036 study, with minor changes to reflect recent experience and site-specific constraints. In addition, the scheduling has been revised to reflect the spent fuel management described in Section 3.4.1. A schedule or sequence of activities for the DECON alternative is presented in Figure 4.1. The scheduling sequence is based on the fuel being removed from the spent fuel pools within ten years of the cessation of Unit 3 operations. The key activities listed in the schedule do not reflect a one-to-one correspondence with those activities in the cost tables, but reflect dividing some activities for clarity and combining others for convenience. The schedule was prepared using the "Microsoft Project Professional 2010" computer software.[33] 4.1 SCHEDULE ESTIMATE ASSUMPTIONS The schedule reflects the results of a precedence network developed for the site
decommissioning activities, i.e., a PERT (Program Evaluation and Review Technique) Software Package. The work activity durations used in the precedence network reflect the actual man-hour estimates from the cost table, adjusted by stretching certain activities over their slack range and shifting the start and end dates of others. The following assumptions were made in the development of the decommissioning schedule:
The fuel handling buildings are isolated until such time that all spent fuel
has been discharged from the spent fuel pools to the ISFSI. Decontamination and dismantling of the storage pools is initiated once the transfer of spent fuel is complete (DECON option).
All work (except vessel and internals removal) is performed during an 8-hour workday, 5 days per week, with no overtime.
Reactor and internals removal activities are performed by using separate crews for different activities working on different shifts, with a corresponding backshift charge for the second shift.
Multiple crews work parallel activities to the maximum extent possible, consistent with optimum efficiency, adequate access for cutting, removal and laydown space, and with the stringent safety measures necessary during demolition of heavy components and structures.
Oconee Nuclear Station Document D03-1671-003, Rev. 0 Decommissioning Cost Analysis Section 4, Page 2 of 7
TLG Services, Inc.
For plant systems removal, the systems with the longest removal durations in areas on the critical path are considered to determine the duration of the activity.
4.2 PROJECT SCHEDULE
The period-dependent costs presented in the detailed cost tables are based upon the durations developed in the schedules for decommissioning. Durations are established between several milestones in each project period; these durations are used to establish a critical path for the entire project. In turn, the critical path duration for each period is used as the basis for determining the period-dependent costs. A second critical path is shown for the spent fuel storage period, which determines the release of the fuel handling buildings for final decontamination. Project timelines are provided in Figures 4.2 and 4.3, with milestone dates based on the 2033 and 2034 shutdown dates. The fuel pools are emptied within ten years of the cessation of Unit 3 operations, while ISFSI operations continue until the DOE can complete the transfer of assemblies. Deferred decommissioning in the SAFSTOR scenario is assumed to commence so that the operating licenses are terminated within a 60-year period from the cessation of plant operations.

Oconee Nuclear Station Document D03-1671-003, Rev. 0 Decommissioning Cost Analysis Section 4, Page 3 of 7
TLG Services, Inc.
FIGURE 4.1 ACTIVITY SCHEDULE
ask NameUo N I Stt' P jmShdl
Sh td* pl tU it 1-2/6/2033Shutdo n plant Unit 2 - 10/0/2033Sh tdo pl tU it3-7/19/201MP indi U itlSh tdo th o ght itin
Cemtdcate of permanent cessatmn of operations submitted
Y-I Yl Y2 Y7 Yg Yp Y10 Y1 1 Y12 Yl3 Yla Yl5 Yl0
Recondgure plant
PSDAR submittedW'tt RM t fp t muff I b 'ttd
Stte spscthc decommtssmrung cost estimate submtttedP %4 I U R R Sh tdo th o 01 t
P I to mp~ p tRecordlgure plant
C* thi teofp * tees tionofop*r ti* s b itted
PSDAR b 'tt dWritten cerndcate of permanent remo al of fuel submitted
4
Period lb - Unit I Decommissioning preparationsF lt gp lp tmR * fg pl t( t dlPrepare detailed work proceduresD NSSSI ht p tf lp I
P* iodl -U it3Sh tdo th o ght iti*n
R Mm pl t
Perform etta charactenratmn
GDPJB
CDCD
PSDAR b tt dW 'tt md" t fp t muff I b tt d
P iud lb-U it2D o 'gp 9 to
F I t*rag pool 9 t e
R Mum pl t ( t dlP p dmdd kr dD * NSSSIsolate spent fuel pool
P%d2 U itlL g o po t o I
Preparatton for reactor easel remo alR t I& t~R ~hag NSSS p t d' itNotseseentbd systemsM t b /g tM dI '
1 ti* pl b itt*d

Oconee Nuclear Station Document D03-1671-003, Rev. 0 Decommissioning Cost Analysis Section 4, Page 4 of 7
TLG Services, Inc.
FIGURE 4.1 (continued) ACTIVITY SCHEDULE
T I NP lod2 -U lt2L g po t
F I to g p lop ti
Reactor vessel 3 internalsRemaining large NSSS components dispositionNon-essential systemsMain turbine/generatorMain condenserLicense termination pl n submitted
P lod2b-U itlD o t 'io ( tf DF lt gp lp tR yt t ppm~ tf I t gD bund' ot ppm~ tf I t gL t '
pl pp dP iud 2 -U it ID lay b fo F IPoo&D t 'io
Yl Y2 Y3 Y4 Y Yg Yl Yg Yg Y10 Yl1 Y12 Y13 Y14 Yla Ylg
F I tomg p lop tiP iodlb-U it3D o '
O'P P toFuel storage pool operauonsReconfigure plant (continued&
Prepare detailed work proceduresDecon NSSSIsolate spent fuel pool
P lod2 -U it3L g o po t o I
F lt gp lp t
R to I&'t mK gl g Nnnb p t 4 po tN t&ytM 1 b /3Main condenserLicense termination plan submitted
Period 2b - Unit 2 Decontamination ( et fuel&
Fuel storage pool operationsR yt t ppm~ tf I t gD bund g t ppi ~3 tf I t gL t '
pl pp dP lod2 -U 112 D Iayb lc F lpoo&D
F el to mpoolop atro sPeriod 2b - Unit 3 Decontaminatio (wet fuel&
Fuel storage pool operationsRemo e systems not supportbtg wet fuel storageDecon buildings not supportmg et fuel torageL t '
pl pp dP iod2 -U K.SD I b lc F Ipoo&D
F I to g p lop t'iodgd-U it1,2 dgD follo ' tf I to g
Remove remaining systemsDecon wet fuel storage area
Period 2e - St tion license termi tionF mgt*S yNRC & ppPrt Ok t td
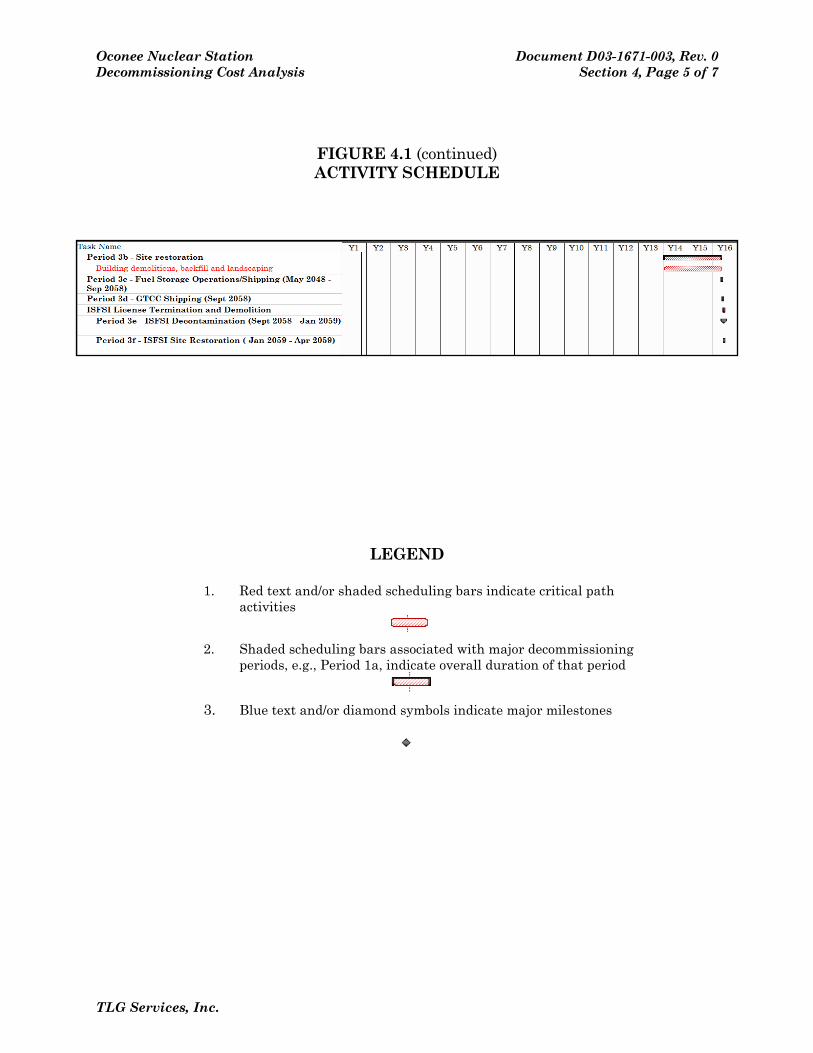
Oconee Nuclear Station Document D03-1671-003, Rev. 0 Decommissioning Cost Analysis Section 4, Page 5 of 7
TLG Services, Inc.
FIGURE 4.1 (continued) ACTIVITY SCHEDULE
LEGEND
1. Red text and/or shaded scheduling bars indicate critical path activities
2. Shaded scheduling bars associated with major decommissioning periods, e.g., Period 1a, indicate overall duration of that period
3. Blue text and/or diamond symbols indicate major milestones
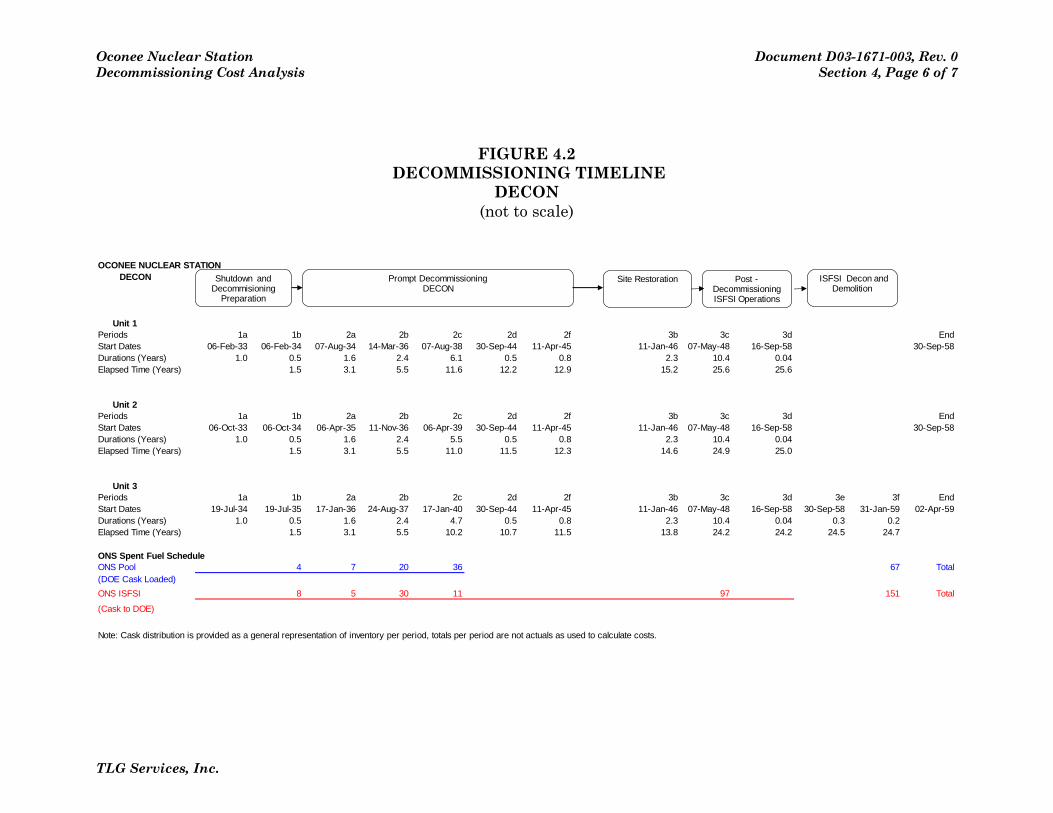
Oconee Nuclear Station Document D03-1671-003, Rev. 0 Decommissioning Cost Analysis Section 4, Page 6 of 7
TLG Services, Inc.
FIGURE 4.2 DECOMMISSIONING TIMELINE
DECON (not to scale)
OCONEE NUCLEAR STATION
DECON
Unit 1Periods 1a 1b 2a 2b 2c 2d 2f 3b 3c 3d EndStart Dates 06-Feb-33 06-Feb-34 07-Aug-34 14-Mar-36 07-Aug-38 30-Sep-44 11-Apr-45 11-Jan-46 07-May-48 16-Sep-58 30-Sep-58Durations (Years) 1.0 0.5 1.6 2.4 6.1 0.5 0.8 2.3 10.4 0.04Elapsed Time (Years) 1.5 3.1 5.5 11.6 12.2 12.9 15.2 25.6 25.6
Unit 2Periods 1a 1b 2a 2b 2c 2d 2f 3b 3c 3d EndStart Dates 06-Oct-33 06-Oct-34 06-Apr-35 11-Nov-36 06-Apr-39 30-Sep-44 11-Apr-45 11-Jan-46 07-May-48 16-Sep-58 30-Sep-58Durations (Years) 1.0 0.5 1.6 2.4 5.5 0.5 0.8 2.3 10.4 0.04Elapsed Time (Years) 1.5 3.1 5.5 11.0 11.5 12.3 14.6 24.9 25.0
Unit 3Periods 1a 1b 2a 2b 2c 2d 2f 3b 3c 3d 3e 3f EndStart Dates 19-Jul-34 19-Jul-35 17-Jan-36 24-Aug-37 17-Jan-40 30-Sep-44 11-Apr-45 11-Jan-46 07-May-48 16-Sep-58 30-Sep-58 31-Jan-59 02-Apr-59Durations (Years) 1.0 0.5 1.6 2.4 4.7 0.5 0.8 2.3 10.4 0.04 0.3 0.2Elapsed Time (Years) 1.5 3.1 5.5 10.2 10.7 11.5 13.8 24.2 24.2 24.5 24.7
ONS Spent Fuel ScheduleONS Pool 4 7 20 36 67 Total(DOE Cask Loaded)
ONS ISFSI 8 5 30 11 97 151 Total
(Cask to DOE)
Note: Cask distribution is provided as a general representation of inventory per period, totals per period are not actuals as used to calculate costs.
Shutdown and Decommisioning
Preparation
Prompt DecommissioningDECON
Post -Decommissioning ISFSI Operations
Site Restoration ISFSI Decon and Demolition
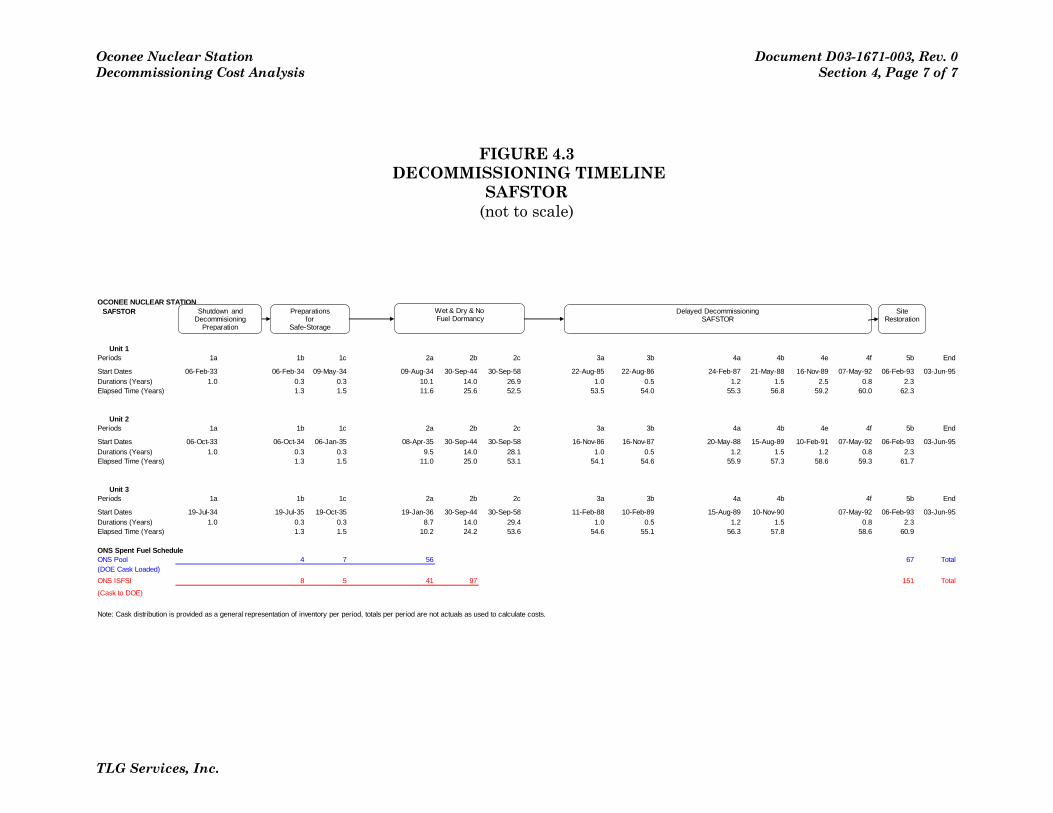
Oconee Nuclear Station Document D03-1671-003, Rev. 0 Decommissioning Cost Analysis Section 4, Page 7 of 7
TLG Services, Inc.
FIGURE 4.3 DECOMMISSIONING TIMELINE
SAFSTOR (not to scale)
OCONEE NUCLEAR STATIONSAFSTOR
Unit 1Periods 1a 1b 1c 2a 2b 2c 3a 3b 4a 4b 4e 4f 5b End
Start Dates 06-Feb-33 06-Feb-34 09-May-34 09-Aug-34 30-Sep-44 30-Sep-58 22-Aug-85 22-Aug-86 24-Feb-87 21-May-88 16-Nov-89 07-May-92 06-Feb-93 03-Jun-95
Durations (Years) 1.0 0.3 0.3 10.1 14.0 26.9 1.0 0.5 1.2 1.5 2.5 0.8 2.3Elapsed Time (Years) 1.3 1.5 11.6 25.6 52.5 53.5 54.0 55.3 56.8 59.2 60.0 62.3
Unit 2Periods 1a 1b 1c 2a 2b 2c 3a 3b 4a 4b 4e 4f 5b End
Start Dates 06-Oct-33 06-Oct-34 06-Jan-35 08-Apr-35 30-Sep-44 30-Sep-58 16-Nov-86 16-Nov-87 20-May-88 15-Aug-89 10-Feb-91 07-May-92 06-Feb-93 03-Jun-95
Durations (Years) 1.0 0.3 0.3 9.5 14.0 28.1 1.0 0.5 1.2 1.5 1.2 0.8 2.3Elapsed Time (Years) 1.3 1.5 11.0 25.0 53.1 54.1 54.6 55.9 57.3 58.6 59.3 61.7
Unit 3Periods 1a 1b 1c 2a 2b 2c 3a 3b 4a 4b 4f 5b End
Start Dates 19-Jul-34 19-Jul-35 19-Oct-35 19-Jan-36 30-Sep-44 30-Sep-58 11-Feb-88 10-Feb-89 15-Aug-89 10-Nov-90 07-May-92 06-Feb-93 03-Jun-95
Durations (Years) 1.0 0.3 0.3 8.7 14.0 29.4 1.0 0.5 1.2 1.5 0.8 2.3Elapsed Time (Years) 1.3 1.5 10.2 24.2 53.6 54.6 55.1 56.3 57.8 58.6 60.9
ONS Spent Fuel ScheduleONS Pool 4 7 56 67 Total(DOE Cask Loaded)
ONS ISFSI 8 5 41 97 151 Total
(Cask to DOE)
Note: Cask distribution is provided as a general representation of inventory per period, totals per period are not actuals as used to calculate costs.
Shutdown and Decommisioning
Preparation
Preparationsfor
Safe-Storage
Wet & Dry & No Fuel Dormancy
Delayed Decommissioning SAFSTOR
Site Restoration
Oconee Nuclear Station Document D03-1671-003, Rev. 0 Decommissioning Cost Analysis Section 5, Page 1 of 6
TLG Services, Inc.
5. RADIOACTIVE WASTES The objectives of the decommissioning process are the removal of all radioactive material from the site that would restrict its future use and the termination of the NRC license. This currently requires the remediation of all radioactive material at the site in excess of applicable legal limits. Under the Atomic Energy Act,[34] the NRC is responsible for protecting the public from sources of ionizing radiation. Title 10 of the Code of Federal Regulations delineates the production, utilization, and disposal of radioactive materials and processes. In particular, Part 71 defines radioactive material as it pertains to transportation and Part 61 specifies its disposition. Most of the materials being transported for controlled burial are categorized as Low Specific Activity (LSA) or Surface Contaminated Object (SCO) materials containing Type A quantities, as defined in 49 CFR Parts 173-178. Shipping containers are required to be Industrial Packages (IP-1, IP-2 or IP-3, as defined in 10 CFR §173.411). For this study, commercially available steel containers are presumed to be used for the disposal of piping, small components, and concrete. Larger components can serve as their own containers, with proper closure of all openings, access ways, and penetrations. The destinations for the various waste streams from decommissioning are identified in Figures 5.1 and 5.2. The volumes are shown on a line-item basis in Appendices C and D and summarized in Tables 5.1 and 5.2. The volumes are calculated based on the exterior dimensions for containerized material and on the displaced volume of components serving as their own waste containers. The reactor vessel and internals are categorized as large quantity shipments and, accordingly, will be shipped in reusable, shielded truck casks with disposable liners. In calculating disposal costs, the burial fees are applied against the liner volume, as well as the special handling requirements of the payload. Packaging efficiencies are lower for the highly activated materials (greater than Type A quantity waste), where high concentrations of gamma-emitting radionuclides limit the capacity of the shipping casks. No process system containing/handling radioactive substances at shutdown is presumed to meet material release criteria by decay alone (i.e., systems radioactive at shutdown will still be radioactive over the time period during which the decommissioning is accomplished, due to the presence of long-lived radionuclides). While the dose rates decrease with time, radionuclides such as 137Cs will still control the disposition requirements.
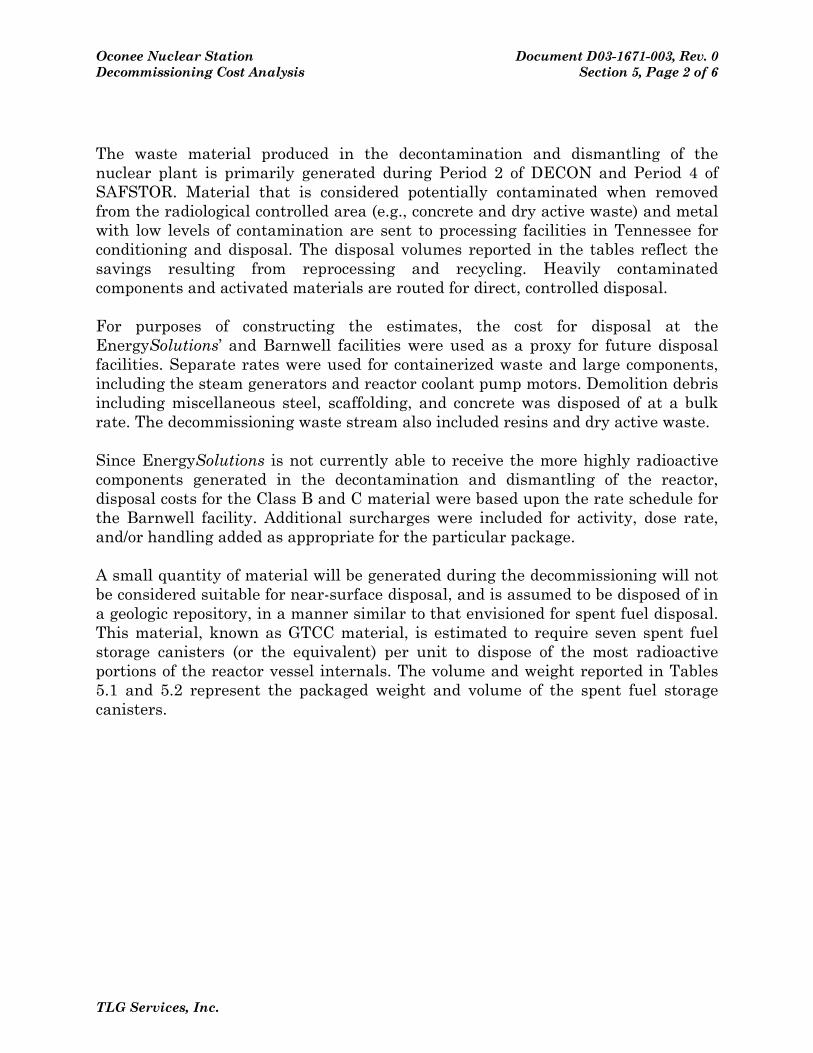
Oconee Nuclear Station Document D03-1671-003, Rev. 0 Decommissioning Cost Analysis Section 5, Page 2 of 6
TLG Services, Inc.
The waste material produced in the decontamination and dismantling of the nuclear plant is primarily generated during Period 2 of DECON and Period 4 of SAFSTOR. Material that is considered potentially contaminated when removed from the radiological controlled area (e.g., concrete and dry active waste) and metal with low levels of contamination are sent to processing facilities in Tennessee for conditioning and disposal. The disposal volumes reported in the tables reflect the savings resulting from reprocessing and recycling. Heavily contaminated components and activated materials are routed for direct, controlled disposal. For purposes of constructing the estimates, the cost for disposal at the EnergySolutions’ and Barnwell facilities were used as a proxy for future disposal facilities. Separate rates were used for containerized waste and large components, including the steam generators and reactor coolant pump motors. Demolition debris including miscellaneous steel, scaffolding, and concrete was disposed of at a bulk rate. The decommissioning waste stream also included resins and dry active waste. Since EnergySolutions is not currently able to receive the more highly radioactive components generated in the decontamination and dismantling of the reactor, disposal costs for the Class B and C material were based upon the rate schedule for the Barnwell facility. Additional surcharges were included for activity, dose rate, and/or handling added as appropriate for the particular package. A small quantity of material will be generated during the decommissioning will not be considered suitable for near-surface disposal, and is assumed to be disposed of in a geologic repository, in a manner similar to that envisioned for spent fuel disposal. This material, known as GTCC material, is estimated to require seven spent fuel storage canisters (or the equivalent) per unit to dispose of the most radioactive portions of the reactor vessel internals. The volume and weight reported in Tables 5.1 and 5.2 represent the packaged weight and volume of the spent fuel storage canisters.
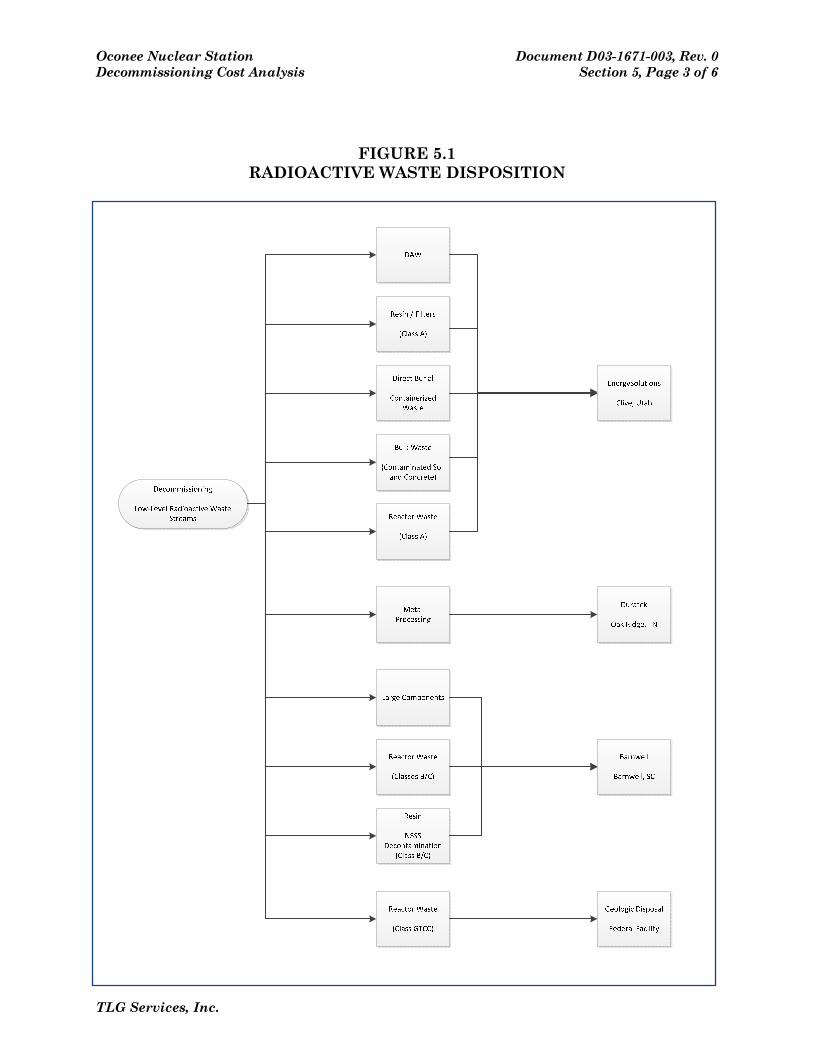
Oconee Nuclear Station Document D03-1671-003, Rev. 0 Decommissioning Cost Analysis Section 5, Page 3 of 6
TLG Services, Inc.
FIGURE 5.1 RADIOACTIVE WASTE DISPOSITION
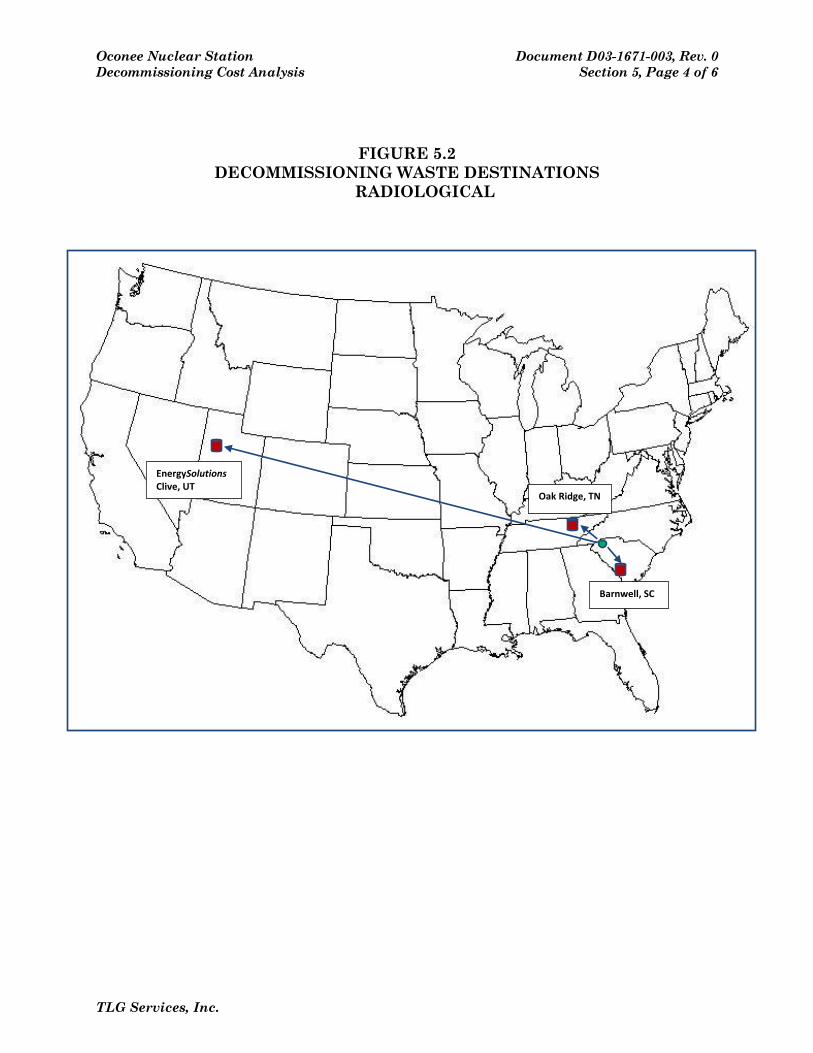
Oconee Nuclear Station Document D03-1671-003, Rev. 0 Decommissioning Cost Analysis Section 5, Page 4 of 6
TLG Services, Inc.
Barnwell, SC
Oak Ridge, TN
EnergySolutions Clive, UT
FIGURE 5.2 DECOMMISSIONING WASTE DESTINATIONS
RADIOLOGICAL
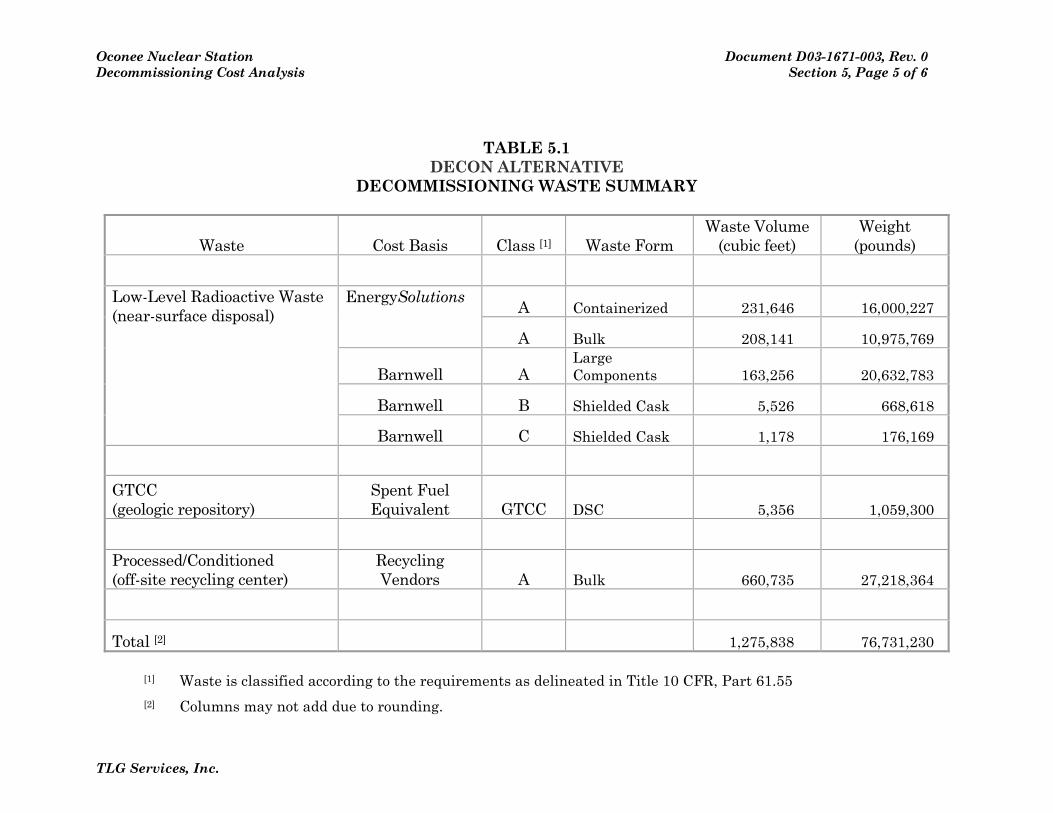
Oconee Nuclear Station Document D03-1671-003, Rev. 0 Decommissioning Cost Analysis Section 5, Page 5 of 6
TLG Services, Inc.
TABLE 5.1 DECON ALTERNATIVE
DECOMMISSIONING WASTE SUMMARY
Waste Cost Basis Class [1] Waste Form Waste Volume
(cubic feet) Weight
(pounds)
Low-Level Radioactive Waste (near-surface disposal)
EnergySolutions A Containerized 231,646 16,000,227
A Bulk 208,141 10,975,769
Barnwell A Large Components 163,256 20,632,783
Barnwell B Shielded Cask 5,526 668,618
Barnwell C Shielded Cask 1,178 176,169
GTCC (geologic repository)
Spent Fuel Equivalent GTCC DSC 5,356 1,059,300
Processed/Conditioned (off-site recycling center)
Recycling Vendors A Bulk 660,735 27,218,364
Total [2]
1,275,838 76,731,230
[1] Waste is classified according to the requirements as delineated in Title 10 CFR, Part 61.55 [2] Columns may not add due to rounding.
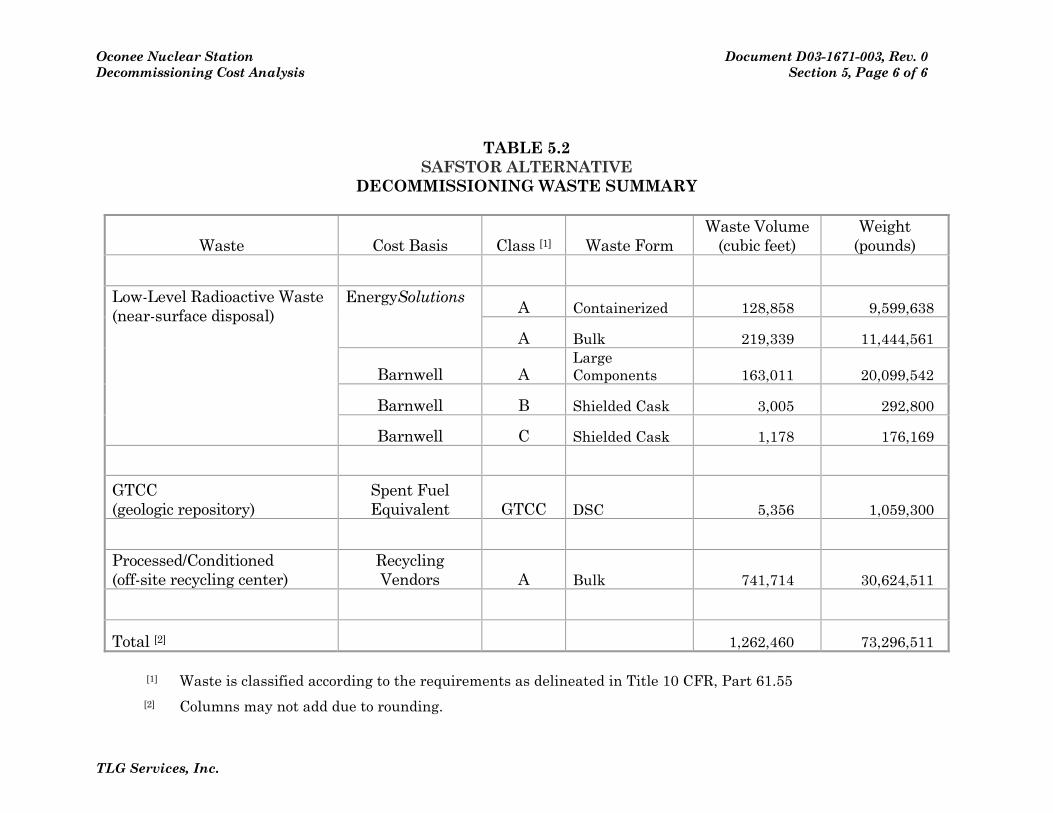
Oconee Nuclear Station Document D03-1671-003, Rev. 0 Decommissioning Cost Analysis Section 5, Page 6 of 6
TLG Services, Inc.
TABLE 5.2 SAFSTOR ALTERNATIVE
DECOMMISSIONING WASTE SUMMARY
Waste Cost Basis Class [1] Waste Form Waste Volume
(cubic feet) Weight
(pounds)
Low-Level Radioactive Waste (near-surface disposal)
EnergySolutions A Containerized 128,858 9,599,638
A Bulk 219,339 11,444,561
Barnwell A Large Components 163,011 20,099,542
Barnwell B Shielded Cask 3,005 292,800
Barnwell C Shielded Cask 1,178 176,169
GTCC (geologic repository)
Spent Fuel Equivalent GTCC DSC 5,356 1,059,300
Processed/Conditioned (off-site recycling center)
Recycling Vendors A Bulk 741,714 30,624,511
Total [2]
1,262,460 73,296,511
[1] Waste is classified according to the requirements as delineated in Title 10 CFR, Part 61.55 [2] Columns may not add due to rounding.
Oconee Nuclear Station Document D03-1671-003, Rev. 0 Decommissioning Cost Analysis Section 6, Page 1 of 5
TLG Services, Inc.
6. RESULTS The analysis to estimate the costs to decommission Oconee relied upon the site-specific, technical information developed for a previous analysis prepared in 2008. While not an engineering study, the estimates provide the Duke Energy with sufficient information to assess its financial obligations, as they pertain to the eventual decommissioning of the nuclear station. The estimates described in this report are based on numerous fundamental assumptions, including regulatory requirements, project contingencies, low-level radioactive waste disposal practices, high-level radioactive waste management options, and site restoration requirements. The decommissioning scenarios assume continued operation of the station’s spent fuel pools for a minimum of ten years following the cessation of Unit 3 operations for continued cooling of the assemblies. The cost projected to promptly decommission (DECON) Oconee is estimated to be $1,797.1 million. The majority of this cost (approximately 85.8%) is associated with the physical decontamination and dismantling of the nuclear plant so that the operating license can be terminated. Another 6.2% is associated with the management, interim storage, and eventual transfer of the spent fuel. The remaining 8.0% is for the demolition of the designated structures and limited restoration of the site. The cost projected for deferred decommissioning (SAFSTOR) is estimated to be $1,958.2 million. The majority of this cost (approximately 78.6%) is associated with placing the plant in storage, ongoing caretaking of the plant during dormancy, and the eventual physical decontamination and dismantling of the nuclear plant so that the operating license can be terminated. Another 14.0% is associated with the management, interim storage, and eventual transfer of the spent fuel. The remaining 7.4% is for the demolition of the designated structures and limited restoration of the site. The primary cost contributors, identified in Tables 6.1 and 6.2, are either labor-related or associated with the management and disposition of the radioactive waste. Program management is the largest single contributor to the overall cost. The magnitude of the expense is a function of both the size of the organization required to manage the decommissioning, as well as the duration of the program. It is assumed, for purposes of this analysis, that Duke Energy will oversee the decommissioning program, acting as the DOC to manage the decommissioning labor force and the associated subcontractors. The size and composition of the management organization varies with the decommissioning phase and associated site activities. However, once the operating license is terminated, the staff is

Oconee Nuclear Station Document D03-1671-003, Rev. 0 Decommissioning Cost Analysis Section 6, Page 2 of 5
TLG Services, Inc.
substantially reduced for the conventional demolition and restoration of the site, and the long-term care of the spent fuel (for the DECON alternative). As described in this report, the spent fuel pools will remain operational for a minimum of ten years following the cessation of Unit 3 operations. The pools will be isolated and an independent spent fuel island created. This will allow decommissioning operations to proceed in and around the pool areas. Over the ten-year period, the spent fuel will be packaged into transportable canisters for loading into a DOE-provided transport cask. Spent fuel will also be in storage at the ISFSI (from operations). This inventory will be transferred to the DOE after the pools are emptied. The cost for waste disposal includes only those costs associated with the controlled disposition of the low-level radioactive waste generated from decontamination and dismantling activities, including plant equipment and components, structural material, filters, resins and dry-active waste. As described in Section 5, disposition of the low-level radioactive material requiring controlled disposal is at the EnergySolutions’ and Barnwell facilities. Highly activated components, requiring additional isolation from the environment (GTCC), are packaged for geologic disposal. The cost of geologic disposal is based upon a cost equivalent for spent fuel. A significant portion of the metallic waste is designated for additional processing and treatment at an off-site facility. Processing reduces the volume of material requiring controlled disposal through such techniques and processes as survey and sorting, decontamination, and volume reduction. The material that cannot be unconditionally released is packaged for controlled disposal at one of the currently operating facilities. The cost identified in the summary tables for processing is all-inclusive, incorporating the ultimate disposition of the material. Removal costs reflect the labor-intensive nature of the decommissioning process, as well as the management controls required to ensure a safe and successful program. Decontamination and packaging costs also have a large labor component that is based upon prevailing union wages. Non-radiological demolition is a natural extension of the decommissioning process. The methods employed in decontamination and dismantling are generally destructive and indiscriminate in inflicting collateral damage. With a work force mobilized to support decommissioning operations, non-radiological demolition can be an integrated activity and a logical expansion of the work being performed in the process of terminating the operating license. Prompt demolition reduces future liabilities and can be more cost effective than deferral, due to the deterioration of the facilities (and therefore the working conditions) with time.
Oconee Nuclear Station Document D03-1671-003, Rev. 0 Decommissioning Cost Analysis Section 6, Page 3 of 5
TLG Services, Inc.
The reported cost for transport includes the tariffs and surcharges associated with moving large components and/or overweight shielded casks overland, as well as the general expense, e.g., labor and fuel, of transporting material to the destinations identified in this report. For purposes of this analysis, material is primarily moved overland by truck. Decontamination is used to reduce the plant’s radiation fields and minimize worker exposure. Slightly contaminated material or material located within a contaminated area is sent to an off-site processing center, i.e., this analysis does not assume that contaminated plant components and equipment can be decontaminated for uncontrolled release in-situ. Centralized processing centers have proven to be a more economical means of handling the large volumes of material produced in the dismantling of a nuclear plant. License termination survey costs are associated with the labor intensive and complex activity of verifying that contamination has been removed from the site to the levels specified by the regulating agency. This process involves a systematic survey of all remaining plant surface areas and surrounding environs, sampling, isotopic analysis, and documentation of the findings. The status of any plant components and materials not removed in the decommissioning process will also require confirmation and will add to the expense of surveying the facilities alone. The remaining costs include allocations for heavy equipment and temporary services, as well as for other expenses such as regulatory fees and the premiums for nuclear insurance. While site operating costs are greatly reduced following the final cessation of plant operations, certain administrative functions do need to be maintained either at a basic functional or regulatory level.
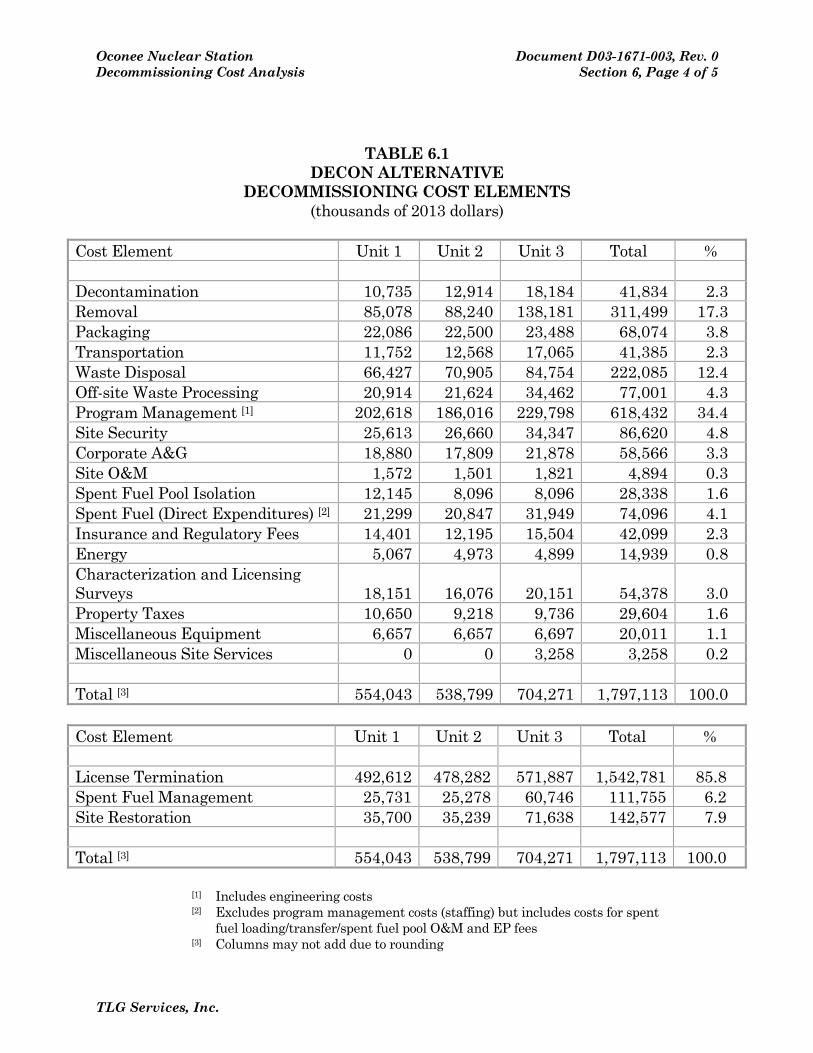
Oconee Nuclear Station Document D03-1671-003, Rev. 0 Decommissioning Cost Analysis Section 6, Page 4 of 5
TLG Services, Inc.
TABLE 6.1 DECON ALTERNATIVE
DECOMMISSIONING COST ELEMENTS (thousands of 2013 dollars)
Cost Element Unit 1 Unit 2 Unit 3 Total % Decontamination 10,735 12,914 18,184 41,834 2.3 Removal 85,078 88,240 138,181 311,499 17.3 Packaging 22,086 22,500 23,488 68,074 3.8 Transportation 11,752 12,568 17,065 41,385 2.3 Waste Disposal 66,427 70,905 84,754 222,085 12.4 Off-site Waste Processing 20,914 21,624 34,462 77,001 4.3 Program Management [1] 202,618 186,016 229,798 618,432 34.4 Site Security 25,613 26,660 34,347 86,620 4.8 Corporate A&G 18,880 17,809 21,878 58,566 3.3 Site O&M 1,572 1,501 1,821 4,894 0.3 Spent Fuel Pool Isolation 12,145 8,096 8,096 28,338 1.6 Spent Fuel (Direct Expenditures) [2] 21,299 20,847 31,949 74,096 4.1 Insurance and Regulatory Fees 14,401 12,195 15,504 42,099 2.3 Energy 5,067 4,973 4,899 14,939 0.8 Characterization and Licensing Surveys 18,151 16,076 20,151 54,378 3.0 Property Taxes 10,650 9,218 9,736 29,604 1.6 Miscellaneous Equipment 6,657 6,657 6,697 20,011 1.1 Miscellaneous Site Services 0 0 3,258 3,258 0.2 Total [3] 554,043 538,799 704,271 1,797,113 100.0
Cost Element Unit 1 Unit 2 Unit 3 Total % License Termination 492,612 478,282 571,887 1,542,781 85.8 Spent Fuel Management 25,731 25,278 60,746 111,755 6.2 Site Restoration 35,700 35,239 71,638 142,577 7.9 Total [3] 554,043 538,799 704,271 1,797,113 100.0
[1] Includes engineering costs
[2] Excludes program management costs (staffing) but includes costs for spent fuel loading/transfer/spent fuel pool O&M and EP fees
[3] Columns may not add due to rounding
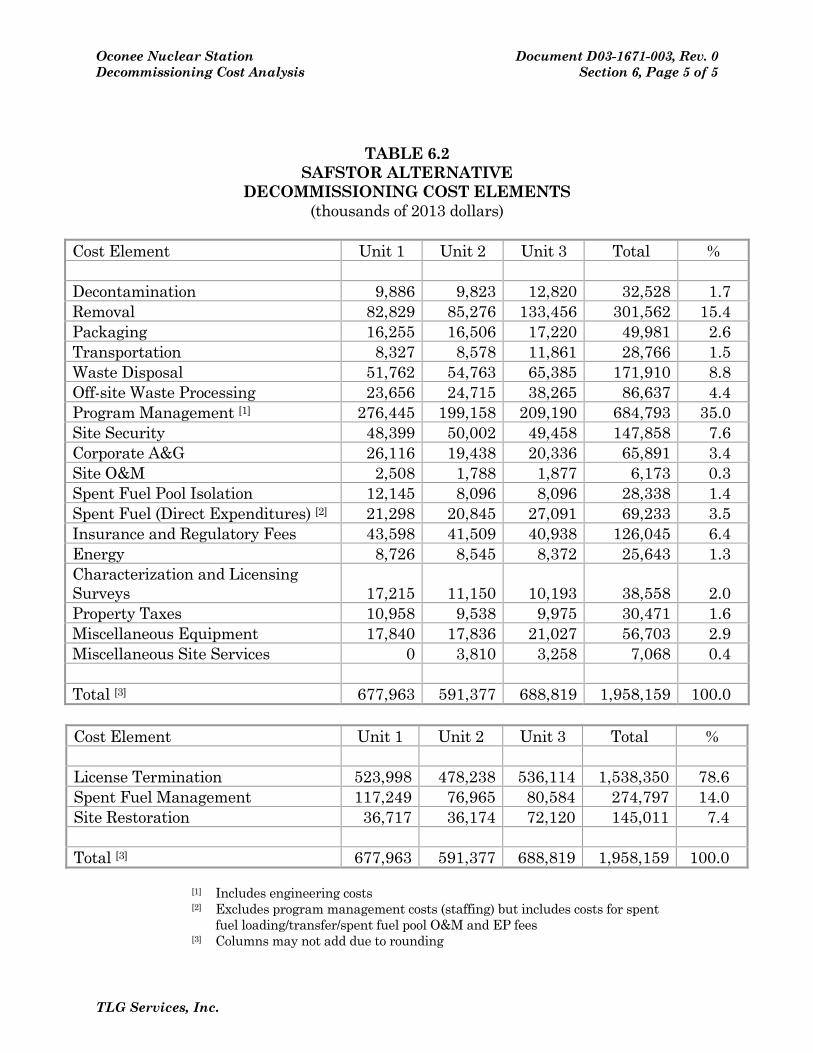
Oconee Nuclear Station Document D03-1671-003, Rev. 0 Decommissioning Cost Analysis Section 6, Page 5 of 5
TLG Services, Inc.
TABLE 6.2 SAFSTOR ALTERNATIVE
DECOMMISSIONING COST ELEMENTS (thousands of 2013 dollars)
Cost Element Unit 1 Unit 2 Unit 3 Total % Decontamination 9,886 9,823 12,820 32,528 1.7 Removal 82,829 85,276 133,456 301,562 15.4 Packaging 16,255 16,506 17,220 49,981 2.6 Transportation 8,327 8,578 11,861 28,766 1.5 Waste Disposal 51,762 54,763 65,385 171,910 8.8 Off-site Waste Processing 23,656 24,715 38,265 86,637 4.4 Program Management [1] 276,445 199,158 209,190 684,793 35.0 Site Security 48,399 50,002 49,458 147,858 7.6 Corporate A&G 26,116 19,438 20,336 65,891 3.4 Site O&M 2,508 1,788 1,877 6,173 0.3 Spent Fuel Pool Isolation 12,145 8,096 8,096 28,338 1.4 Spent Fuel (Direct Expenditures) [2] 21,298 20,845 27,091 69,233 3.5 Insurance and Regulatory Fees 43,598 41,509 40,938 126,045 6.4 Energy 8,726 8,545 8,372 25,643 1.3 Characterization and Licensing Surveys 17,215 11,150 10,193 38,558 2.0 Property Taxes 10,958 9,538 9,975 30,471 1.6 Miscellaneous Equipment 17,840 17,836 21,027 56,703 2.9 Miscellaneous Site Services 0 3,810 3,258 7,068 0.4 Total [3] 677,963 591,377 688,819 1,958,159 100.0
Cost Element Unit 1 Unit 2 Unit 3 Total % License Termination 523,998 478,238 536,114 1,538,350 78.6 Spent Fuel Management 117,249 76,965 80,584 274,797 14.0 Site Restoration 36,717 36,174 72,120 145,011 7.4 Total [3] 677,963 591,377 688,819 1,958,159 100.0
[1] Includes engineering costs
[2] Excludes program management costs (staffing) but includes costs for spent fuel loading/transfer/spent fuel pool O&M and EP fees
[3] Columns may not add due to rounding
Oconee Nuclear Station Document D03-1671-003, Rev. 0 Decommissioning Cost Analysis Section 7, Page 1 of 3
TLG Services, Inc.
7. REFERENCES 1. “Decommissioning Cost Analysis for the Oconee Nuclear Station,” Document
D03-1594-004, Rev. 0, TLG Services, Inc., December 2008. 2. U.S. Code of Federal Regulations, Title 10, Parts 30, 40, 50, 51, 70 and 72,
"General Requirements for Decommissioning Nuclear Facilities," Nuclear Regulatory Commission, 53 Fed. Reg. 24018, June 27, 1988.
3. U.S. Nuclear Regulatory Commission, Regulatory Guide 1.159, "Assuring the
Availability of Funds for Decommissioning Nuclear Reactors," Rev. 2, October 2011.
4. U.S. Code of Federal Regulations, Title 10, Part 20, Subpart E, “Radiological
Criteria for License Termination.” 5. U.S. Code of Federal Regulations, Title 10, Parts 20 and 50, “Entombment
Options for Power Reactors,” Advanced Notice of Proposed Rulemaking, 66 Fed. Reg. 52551, October 16, 2001.
6. U.S. Code of Federal Regulations, Title 10, Parts 2, 50 and 51,
"Decommissioning of Nuclear Power Reactors," Nuclear Regulatory Commission, 61 Fed. Reg. 39278, July 29, 1996.
7. “Nuclear Waste Policy Act of 1982,” 42 U.S. Code 10101, et seq. 8. “Nuclear Waste Policy Amendments of 1987,” 42 U.S. Code 10172 9. “Blue Ribbon Commission on America’s Nuclear Future, Report to the
Secretary of Energy,” http://www.brc.gov/, January 2012 10. “Strategy for the Management and Disposal of Used Nuclear Fuel and High-
Level Radioactive Waste,” U.S. DOE, January 11, 2013 11. U.S. Code of Federal Regulations, Title 10, Part 961.11, Article IV –
Responsibilities of the Parties, B. DOE Responsibilities, 5.(a) “… DOE shall issue an annual acceptance priority ranking for receipt of SNF and/or HLW at the DOE repository. This priority ranking shall be based on the age of SNF and/or HLW as calculated from the date of discharge of such materials from the civilian nuclear power reactor. The oldest fuel or waste will have the highest priority for acceptance …”
Oconee Nuclear Station Document D03-1671-003, Rev. 0 Decommissioning Cost Analysis Section 7, Page 2 of 3
TLG Services, Inc.
7. REFERENCES (continued)
12. “Acceptance Priority Ranking & Annual Capacity Report,” DOE/RW-0567, July
2004 13. U.S. Code of Federal Regulations, Title 10, Part 50, “Domestic Licensing of
Production and Utilization Facilities,” Subpart 54 (bb), “Conditions of Licenses.” 14. “Low Level Radioactive Waste Policy Act,” Public Law 96-573, 1980. 15. “Low-Level Radioactive Waste Policy Amendments Act of 1985,” Public Law 99-
240, 1986. 16. U.S. Code of Federal Regulations, Title 10, Part 61.55 “Waste Classification.” 17. U.S. Code of Federal Regulations, Title 10, Part 20, Subpart E, “Final Rule,
Radiological Criteria for License Termination,” 62 Fed. Reg. 39058, July 21, 1997.
18. “Establishment of Cleanup Levels for CERCLA Sites with Radioactive
Contamination,” EPA Memorandum OSWER No. 9200.4-18, August 22, 1997. 19. U.S. Code of Federal Regulations, Title 40, Part 141.16, “Maximum
contaminant levels for beta particle and photon radioactivity from man-made radionuclides in community water systems.”
20. “Memorandum of Understanding Between the Environmental Protection
Agency and the Nuclear Regulatory Commission: Consultation and Finality on Decommissioning and Decontamination of Contaminated Sites,” OSWER 9295.8-06a, October 9, 2002.
21. “Multi-Agency Radiation Survey and Site Investigation Manual (MARSSIM),”
NUREG/CR-1575, Rev. 1, EPA 402-R-97-016, Rev. 1, August 2000 22. T.S. LaGuardia et al., "Guidelines for Producing Commercial Nuclear Power
Plant Decommissioning Cost Estimates," AIF/NESP-036, May 1986. 23. W.J. Manion and T.S. LaGuardia, "Decommissioning Handbook," U.S.
Department of Energy, DOE/EV/10128-1, November 1980.
Oconee Nuclear Station Document D03-1671-003, Rev. 0 Decommissioning Cost Analysis Section 7, Page 3 of 3
TLG Services, Inc.
7. REFERENCES (continued)
24. "Building Construction Cost Data 2013," Robert Snow Means Company, Inc.,
Kingston, Massachusetts. 25. Project and Cost Engineers’ Handbook, Second Edition, p. 239, American
Association of Cost Engineers, Marcel Dekker, Inc., New York, New York, 1984. 26. Civilian Radioactive Waste Management System Waste Acceptance System
Requirements Document, Revision 5” (DOE/RW-0351) issued May 31, 2007. 27. U.S. Department of Transportation, Title 49 of the Code of Federal Regulations,
"Transportation," Parts 173 through 178. 28. Tri-State Motor Transit Company, published tariffs, Interstate Commerce
Commission (ICC), Docket No. MC-427719 Rules Tariff, March 2004, Radioactive Materials Tariff, August 2011.
29. J.C. Evans et al., "Long-Lived Activation Products in Reactor Materials"
NUREG/CR-3474, Pacific Northwest Laboratory for the Nuclear Regulatory Commission, August 1984.
30. R.I. Smith, G.J. Konzek, W.E. Kennedy, Jr., "Technology, Safety and Costs of
Decommissioning a Reference Pressurized Water Reactor Power Station," NUREG/CR-0130 and addenda, Pacific Northwest Laboratory for the Nuclear Regulatory Commission, June 1978.
31. H.D. Oak, et al., "Technology, Safety and Costs of Decommissioning a Reference
Boiling Water Reactor Power Station," NUREG/CR-0672 and addenda, Pacific Northwest Laboratory for the Nuclear Regulatory Commission, June 1980.
32. “Financial Protection Requirements for Permanently Shutdown Nuclear Power
Reactors,” 10 CFR Parts 50 and 140, Proposed Rule, 62 Fed. Reg. 58690, October 30, 1997.
33. "Microsoft Project Professional 2010," Microsoft Corporation, Redmond, WA. 34. “Atomic Energy Act of 1954,” (68 Stat. 919).
Oconee Nuclear Station Document D03-1671-003, Rev. 0 Decommissioning Cost Analysis Appendix A, Page 1 of 4
TLG Services, Inc.
APPENDIX A
UNIT COST FACTOR DEVELOPMENT
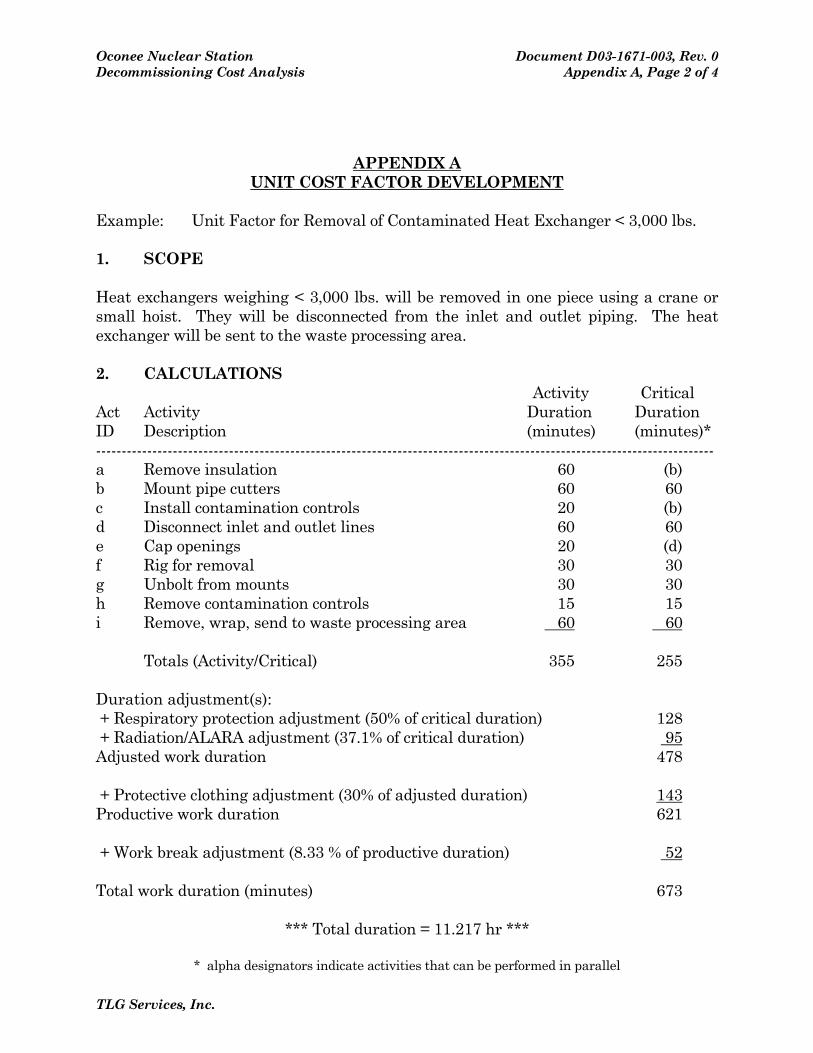
Oconee Nuclear Station Document D03-1671-003, Rev. 0 Decommissioning Cost Analysis Appendix A, Page 2 of 4
TLG Services, Inc.
APPENDIX A UNIT COST FACTOR DEVELOPMENT
Example: Unit Factor for Removal of Contaminated Heat Exchanger < 3,000 lbs. 1. SCOPE Heat exchangers weighing < 3,000 lbs. will be removed in one piece using a crane or small hoist. They will be disconnected from the inlet and outlet piping. The heat exchanger will be sent to the waste processing area. 2. CALCULATIONS Activity Critical Act Activity Duration Duration ID Description (minutes) (minutes)* ------------------------------------------------------------------------------------------------------------------------- a Remove insulation 60 (b) b Mount pipe cutters 60 60 c Install contamination controls 20 (b) d Disconnect inlet and outlet lines 60 60 e Cap openings 20 (d) f Rig for removal 30 30 g Unbolt from mounts 30 30 h Remove contamination controls 15 15 i Remove, wrap, send to waste processing area 60 60 Totals (Activity/Critical) 355 255 Duration adjustment(s): + Respiratory protection adjustment (50% of critical duration) 128 + Radiation/ALARA adjustment (37.1% of critical duration) 95 Adjusted work duration 478 + Protective clothing adjustment (30% of adjusted duration) 143 Productive work duration 621 + Work break adjustment (8.33 % of productive duration) 52 Total work duration (minutes) 673 *** Total duration = 11.217 hr ***
* alpha designators indicate activities that can be performed in parallel

Oconee Nuclear Station Document D03-1671-003, Rev. 0 Decommissioning Cost Analysis Appendix A, Page 3 of 4
TLG Services, Inc.
APPENDIX A (continued)
3. LABOR REQUIRED Duration Rate Crew Number (hours) ($/hr) Cost --------------------------------------------------------------------------------------------------------------------- Laborers 3.00 11.217 $**.** $***.** Craftsmen 2.00 11.217 $**.** $***.** Foreman 1.00 11.217 $**.** $***.** General Foreman 0.25 11.217 $**.** $**.** Fire Watch 0.05 11.217 $**.** $**.** Health Physics Technician 1.00 11.217 $**.** $***.** Total Labor Cost $3,194.92 4. EQUIPMENT & CONSUMABLES COSTS Equipment Costs none Consumables/Materials Costs -Universal Sorbent 50 @ $0.65 sq. ft. {1} $32.50 -Tarpaulins (oil resistant/fire retardant) 50 @ $0.29/sq. ft. {2} $14.50 -Gas torch consumables 1 @ $17.92/hr. x 1 hr. {3} $17.92 Subtotal cost of equipment and materials $64.92 Overhead & profit on equipment and materials @ 16.00 % $10.39 Total costs, equipment & material $75.31 TOTAL COST: Removal of contaminated heat exchanger <3000 pounds: $3,270.23 Total labor cost: $3,194.92 Total equipment/material costs: $75.31 Total craft labor man-hours required per unit: 81.88
** denotes business sensitive information
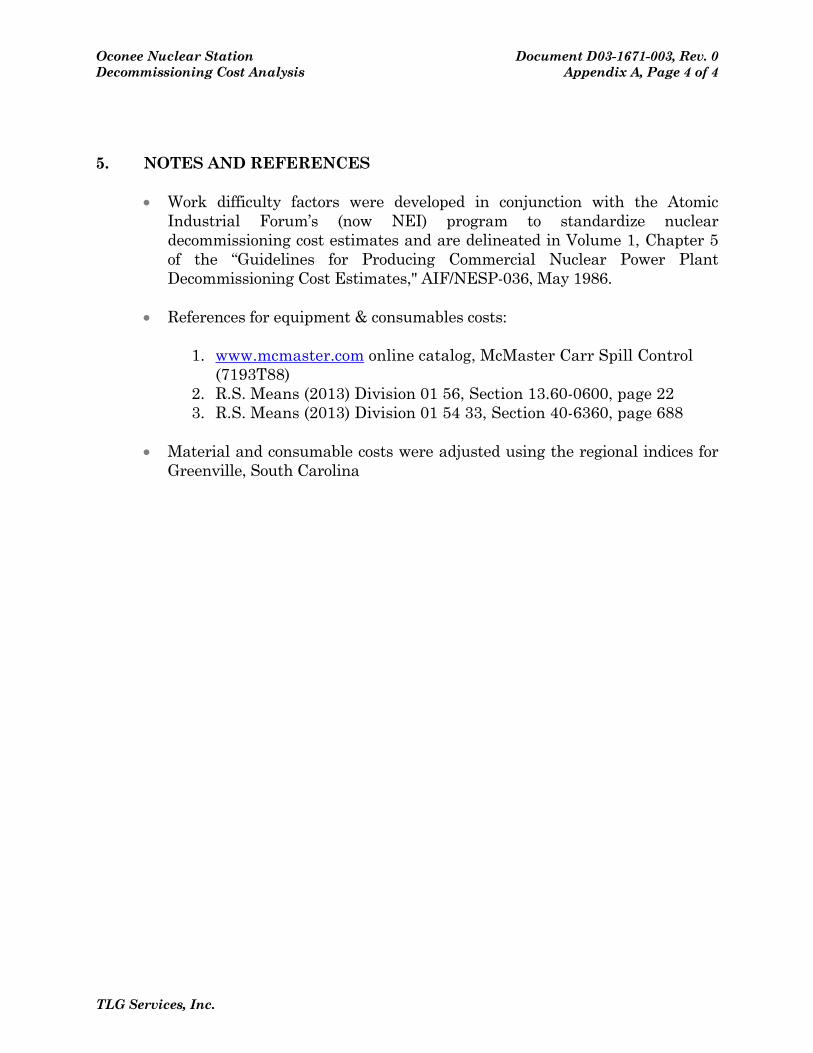
Oconee Nuclear Station Document D03-1671-003, Rev. 0 Decommissioning Cost Analysis Appendix A, Page 4 of 4
TLG Services, Inc.
5. NOTES AND REFERENCES
Work difficulty factors were developed in conjunction with the Atomic Industrial Forum’s (now NEI) program to standardize nuclear decommissioning cost estimates and are delineated in Volume 1, Chapter 5 of the “Guidelines for Producing Commercial Nuclear Power Plant Decommissioning Cost Estimates," AIF/NESP-036, May 1986.
References for equipment & consumables costs:
1. www.mcmaster.com online catalog, McMaster Carr Spill Control
(7193T88) 2. R.S. Means (2013) Division 01 56, Section 13.60-0600, page 22 3. R.S. Means (2013) Division 01 54 33, Section 40-6360, page 688
Material and consumable costs were adjusted using the regional indices for
Greenville, South Carolina
Oconee Nuclear Station Document D03-1671-003, Rev. 0 Decommissioning Cost Analysis Appendix B, Page 1 of 7
TLG Services, Inc.
APPENDIX B
UNIT COST FACTOR LISTING (DECON: Power Block Structures Only)
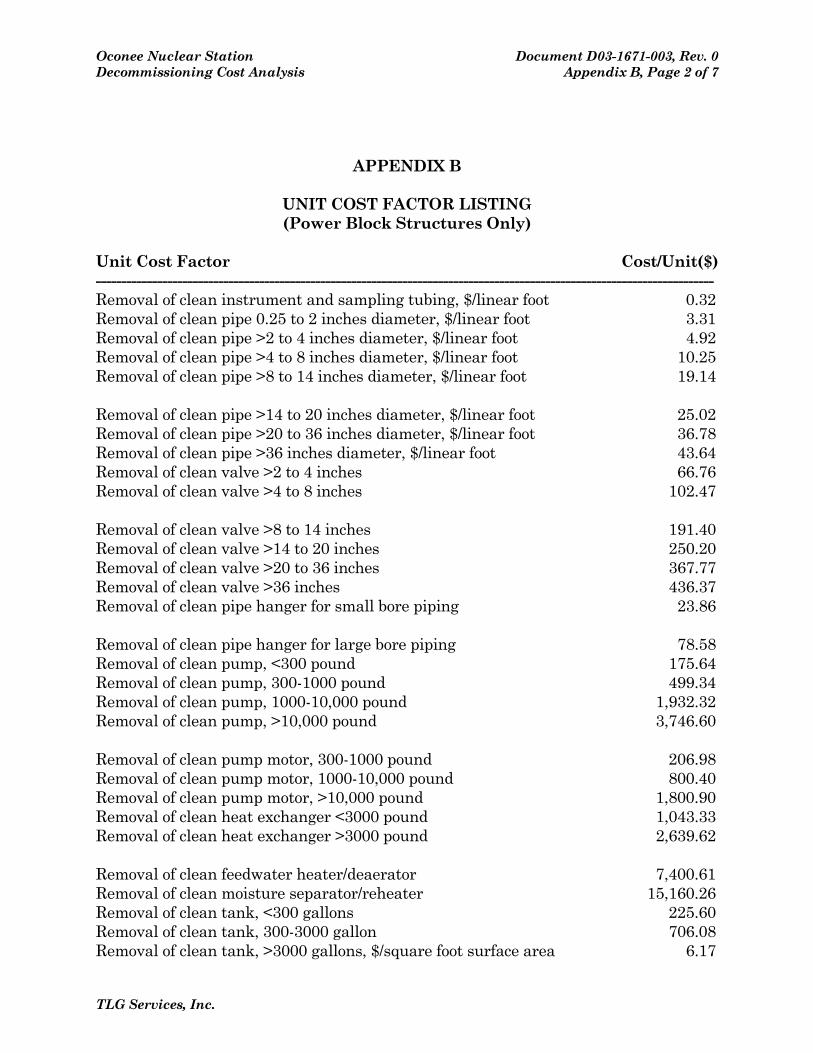
Oconee Nuclear Station Document D03-1671-003, Rev. 0 Decommissioning Cost Analysis Appendix B, Page 2 of 7
APPENDIX B
UNIT COST FACTOR LISTING (Power Block Structures Only)
Unit Cost Factor Cost/Unit($) -------------------------------------------------------------------------------------------------------------------------
TLG Services, Inc.
Removal of clean instrument and sampling tubing, $/linear foot 0.32 Removal of clean pipe 0.25 to 2 inches diameter, $/linear foot 3.31 Removal of clean pipe >2 to 4 inches diameter, $/linear foot 4.92 Removal of clean pipe >4 to 8 inches diameter, $/linear foot 10.25 Removal of clean pipe >8 to 14 inches diameter, $/linear foot 19.14 Removal of clean pipe >14 to 20 inches diameter, $/linear foot 25.02 Removal of clean pipe >20 to 36 inches diameter, $/linear foot 36.78 Removal of clean pipe >36 inches diameter, $/linear foot 43.64 Removal of clean valve >2 to 4 inches 66.76 Removal of clean valve >4 to 8 inches 102.47 Removal of clean valve >8 to 14 inches 191.40 Removal of clean valve >14 to 20 inches 250.20 Removal of clean valve >20 to 36 inches 367.77 Removal of clean valve >36 inches 436.37 Removal of clean pipe hanger for small bore piping 23.86 Removal of clean pipe hanger for large bore piping 78.58 Removal of clean pump, <300 pound 175.64 Removal of clean pump, 300-1000 pound 499.34 Removal of clean pump, 1000-10,000 pound 1,932.32 Removal of clean pump, >10,000 pound 3,746.60 Removal of clean pump motor, 300-1000 pound 206.98 Removal of clean pump motor, 1000-10,000 pound 800.40 Removal of clean pump motor, >10,000 pound 1,800.90 Removal of clean heat exchanger <3000 pound 1,043.33 Removal of clean heat exchanger >3000 pound 2,639.62 Removal of clean feedwater heater/deaerator 7,400.61 Removal of clean moisture separator/reheater 15,160.26 Removal of clean tank, <300 gallons 225.60 Removal of clean tank, 300-3000 gallon 706.08 Removal of clean tank, >3000 gallons, $/square foot surface area 6.17
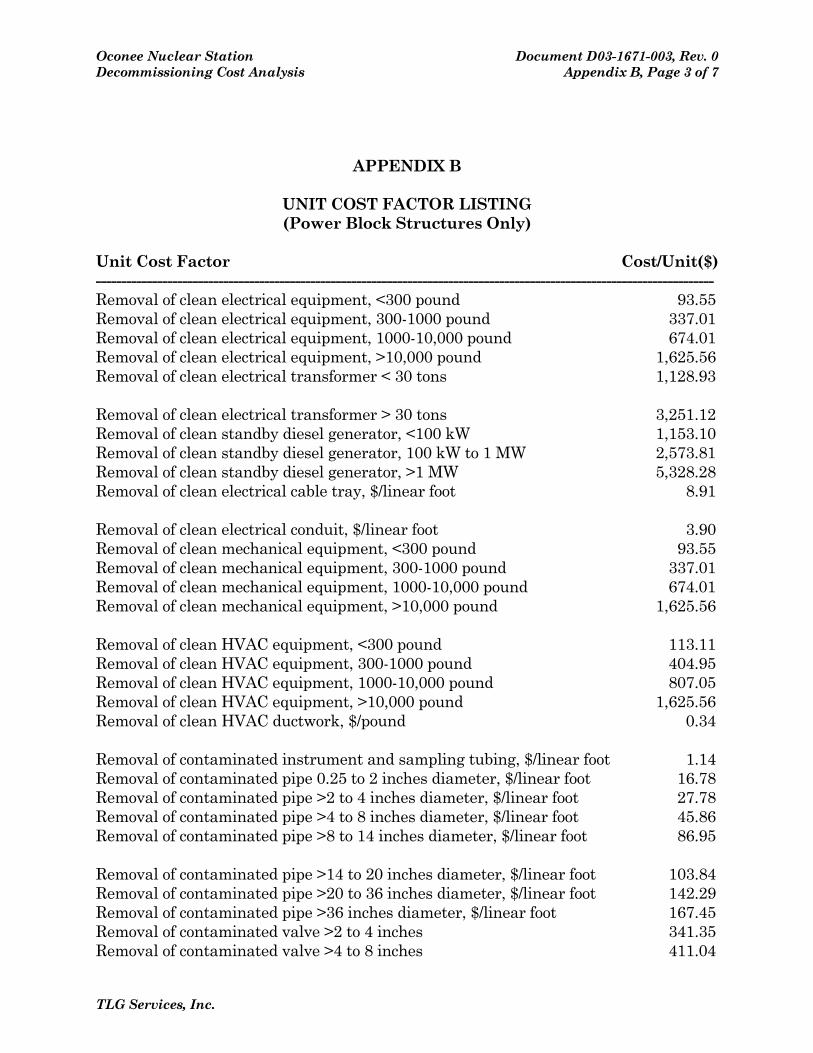
Oconee Nuclear Station Document D03-1671-003, Rev. 0 Decommissioning Cost Analysis Appendix B, Page 3 of 7
APPENDIX B
UNIT COST FACTOR LISTING (Power Block Structures Only)
Unit Cost Factor Cost/Unit($) -------------------------------------------------------------------------------------------------------------------------
TLG Services, Inc.
Removal of clean electrical equipment, <300 pound 93.55 Removal of clean electrical equipment, 300-1000 pound 337.01 Removal of clean electrical equipment, 1000-10,000 pound 674.01 Removal of clean electrical equipment, >10,000 pound 1,625.56 Removal of clean electrical transformer < 30 tons 1,128.93 Removal of clean electrical transformer > 30 tons 3,251.12 Removal of clean standby diesel generator, <100 kW 1,153.10 Removal of clean standby diesel generator, 100 kW to 1 MW 2,573.81 Removal of clean standby diesel generator, >1 MW 5,328.28 Removal of clean electrical cable tray, $/linear foot 8.91 Removal of clean electrical conduit, $/linear foot 3.90 Removal of clean mechanical equipment, <300 pound 93.55 Removal of clean mechanical equipment, 300-1000 pound 337.01 Removal of clean mechanical equipment, 1000-10,000 pound 674.01 Removal of clean mechanical equipment, >10,000 pound 1,625.56 Removal of clean HVAC equipment, <300 pound 113.11 Removal of clean HVAC equipment, 300-1000 pound 404.95 Removal of clean HVAC equipment, 1000-10,000 pound 807.05 Removal of clean HVAC equipment, >10,000 pound 1,625.56 Removal of clean HVAC ductwork, $/pound 0.34 Removal of contaminated instrument and sampling tubing, $/linear foot 1.14 Removal of contaminated pipe 0.25 to 2 inches diameter, $/linear foot 16.78 Removal of contaminated pipe >2 to 4 inches diameter, $/linear foot 27.78 Removal of contaminated pipe >4 to 8 inches diameter, $/linear foot 45.86 Removal of contaminated pipe >8 to 14 inches diameter, $/linear foot 86.95 Removal of contaminated pipe >14 to 20 inches diameter, $/linear foot 103.84 Removal of contaminated pipe >20 to 36 inches diameter, $/linear foot 142.29 Removal of contaminated pipe >36 inches diameter, $/linear foot 167.45 Removal of contaminated valve >2 to 4 inches 341.35 Removal of contaminated valve >4 to 8 inches 411.04
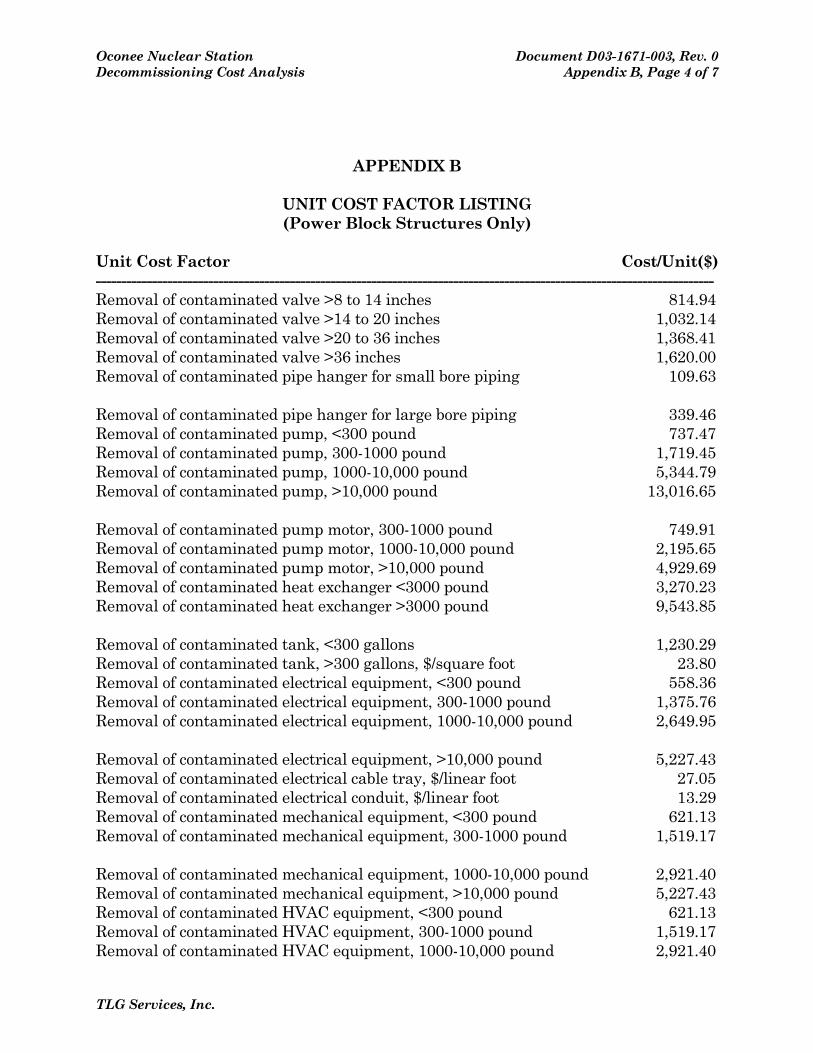
Oconee Nuclear Station Document D03-1671-003, Rev. 0 Decommissioning Cost Analysis Appendix B, Page 4 of 7
APPENDIX B
UNIT COST FACTOR LISTING (Power Block Structures Only)
Unit Cost Factor Cost/Unit($) -------------------------------------------------------------------------------------------------------------------------
TLG Services, Inc.
Removal of contaminated valve >8 to 14 inches 814.94 Removal of contaminated valve >14 to 20 inches 1,032.14 Removal of contaminated valve >20 to 36 inches 1,368.41 Removal of contaminated valve >36 inches 1,620.00 Removal of contaminated pipe hanger for small bore piping 109.63 Removal of contaminated pipe hanger for large bore piping 339.46 Removal of contaminated pump, <300 pound 737.47 Removal of contaminated pump, 300-1000 pound 1,719.45 Removal of contaminated pump, 1000-10,000 pound 5,344.79 Removal of contaminated pump, >10,000 pound 13,016.65 Removal of contaminated pump motor, 300-1000 pound 749.91 Removal of contaminated pump motor, 1000-10,000 pound 2,195.65 Removal of contaminated pump motor, >10,000 pound 4,929.69 Removal of contaminated heat exchanger <3000 pound 3,270.23 Removal of contaminated heat exchanger >3000 pound 9,543.85 Removal of contaminated tank, <300 gallons 1,230.29 Removal of contaminated tank, >300 gallons, $/square foot 23.80 Removal of contaminated electrical equipment, <300 pound 558.36 Removal of contaminated electrical equipment, 300-1000 pound 1,375.76 Removal of contaminated electrical equipment, 1000-10,000 pound 2,649.95 Removal of contaminated electrical equipment, >10,000 pound 5,227.43 Removal of contaminated electrical cable tray, $/linear foot 27.05 Removal of contaminated electrical conduit, $/linear foot 13.29 Removal of contaminated mechanical equipment, <300 pound 621.13 Removal of contaminated mechanical equipment, 300-1000 pound 1,519.17 Removal of contaminated mechanical equipment, 1000-10,000 pound 2,921.40 Removal of contaminated mechanical equipment, >10,000 pound 5,227.43 Removal of contaminated HVAC equipment, <300 pound 621.13 Removal of contaminated HVAC equipment, 300-1000 pound 1,519.17 Removal of contaminated HVAC equipment, 1000-10,000 pound 2,921.40
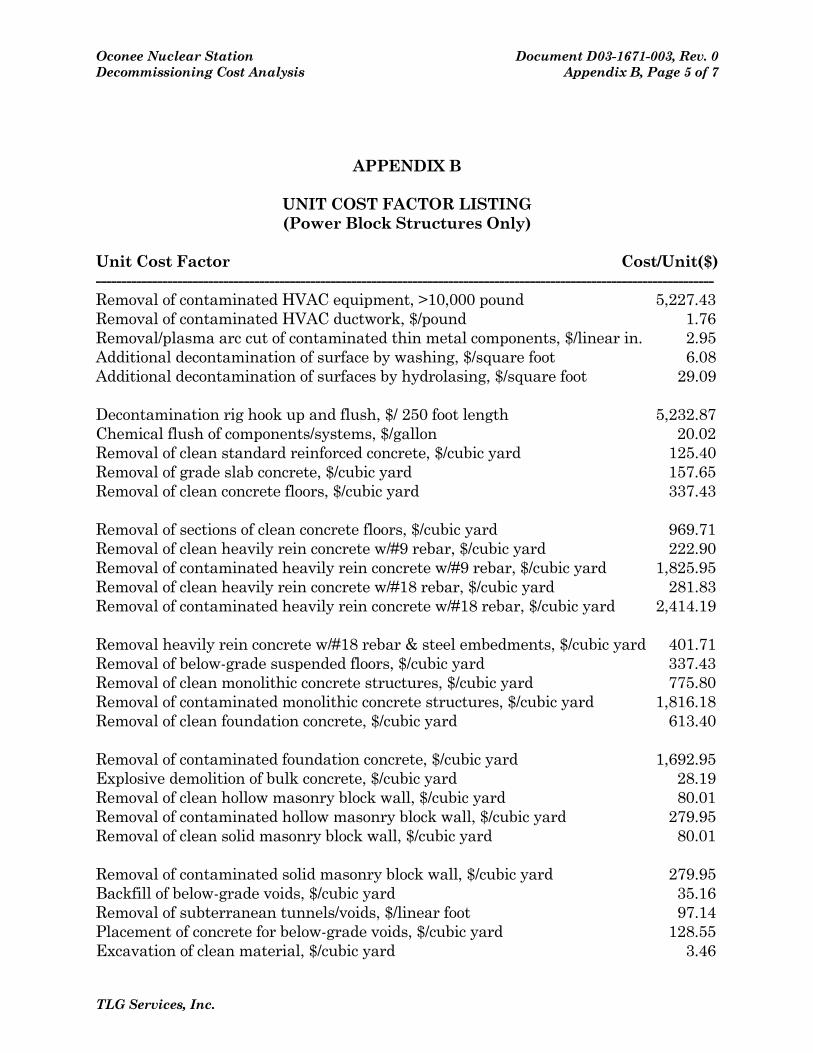
Oconee Nuclear Station Document D03-1671-003, Rev. 0 Decommissioning Cost Analysis Appendix B, Page 5 of 7
APPENDIX B
UNIT COST FACTOR LISTING (Power Block Structures Only)
Unit Cost Factor Cost/Unit($) -------------------------------------------------------------------------------------------------------------------------
TLG Services, Inc.
Removal of contaminated HVAC equipment, >10,000 pound 5,227.43 Removal of contaminated HVAC ductwork, $/pound 1.76 Removal/plasma arc cut of contaminated thin metal components, $/linear in. 2.95 Additional decontamination of surface by washing, $/square foot 6.08 Additional decontamination of surfaces by hydrolasing, $/square foot 29.09 Decontamination rig hook up and flush, $/ 250 foot length 5,232.87 Chemical flush of components/systems, $/gallon 20.02 Removal of clean standard reinforced concrete, $/cubic yard 125.40 Removal of grade slab concrete, $/cubic yard 157.65 Removal of clean concrete floors, $/cubic yard 337.43 Removal of sections of clean concrete floors, $/cubic yard 969.71 Removal of clean heavily rein concrete w/#9 rebar, $/cubic yard 222.90 Removal of contaminated heavily rein concrete w/#9 rebar, $/cubic yard 1,825.95 Removal of clean heavily rein concrete w/#18 rebar, $/cubic yard 281.83 Removal of contaminated heavily rein concrete w/#18 rebar, $/cubic yard 2,414.19 Removal heavily rein concrete w/#18 rebar & steel embedments, $/cubic yard 401.71 Removal of below-grade suspended floors, $/cubic yard 337.43 Removal of clean monolithic concrete structures, $/cubic yard 775.80 Removal of contaminated monolithic concrete structures, $/cubic yard 1,816.18 Removal of clean foundation concrete, $/cubic yard 613.40 Removal of contaminated foundation concrete, $/cubic yard 1,692.95 Explosive demolition of bulk concrete, $/cubic yard 28.19 Removal of clean hollow masonry block wall, $/cubic yard 80.01 Removal of contaminated hollow masonry block wall, $/cubic yard 279.95 Removal of clean solid masonry block wall, $/cubic yard 80.01 Removal of contaminated solid masonry block wall, $/cubic yard 279.95 Backfill of below-grade voids, $/cubic yard 35.16 Removal of subterranean tunnels/voids, $/linear foot 97.14 Placement of concrete for below-grade voids, $/cubic yard 128.55 Excavation of clean material, $/cubic yard 3.46

Oconee Nuclear Station Document D03-1671-003, Rev. 0 Decommissioning Cost Analysis Appendix B, Page 6 of 7
APPENDIX B
UNIT COST FACTOR LISTING (Power Block Structures Only)
Unit Cost Factor Cost/Unit($) -------------------------------------------------------------------------------------------------------------------------
TLG Services, Inc.
Excavation of contaminated material, $/cubic yard 40.57 Removal of clean concrete rubble (tipping fee included), $/cubic yard 24.87 Removal of contaminated concrete rubble, $/cubic yard 25.57 Removal of building by volume, $/cubic foot 0.30 Removal of clean building metal siding, $/square foot 0.97 Removal of contaminated building metal siding, $/square foot 3.54 Removal of standard asphalt roofing, $/square foot 1.50 Removal of transite panels, $/square foot 1.75 Scarifying contaminated concrete surfaces (drill & spall), $/square foot 11.28 Scabbling contaminated concrete floors, $/square foot 6.39 Scabbling contaminated concrete walls, $/square foot 16.45 Scabbling contaminated ceilings, $/square foot 56.05 Scabbling structural steel, $/square foot 5.26 Removal of clean overhead crane/monorail < 10 ton capacity 491.08 Removal of contaminated overhead crane/monorail < 10 ton capacity 1,459.57 Removal of clean overhead crane/monorail >10-50 ton capacity 1,178.60 Removal of contaminated overhead crane/monorail >10-50 ton capacity 3,502.39 Removal of polar crane > 50 ton capacity 4,972.29 Removal of gantry crane > 50 ton capacity 20,319.49 Removal of structural steel, $/pound 0.17 Removal of clean steel floor grating, $/square foot 3.89 Removal of contaminated steel floor grating, $/square foot 11.52 Removal of clean free standing steel liner, $/square foot 9.24 Removal of contaminated free standing steel liner, $/square foot 27.70 Removal of clean concrete-anchored steel liner, $/square foot 4.62 Removal of contaminated concrete-anchored steel liner, $/square foot 32.31 Placement of scaffolding in clean areas, $/square foot 13.40 Placement of scaffolding in contaminated areas, $/square foot 21.04 Landscaping with topsoil, $/acre 25,695.32 Cost of CPC B-88 LSA box & preparation for use 2,153.99

Oconee Nuclear Station Document D03-1671-003, Rev. 0 Decommissioning Cost Analysis Appendix B, Page 7 of 7
APPENDIX B
UNIT COST FACTOR LISTING (Power Block Structures Only)
Unit Cost Factor Cost/Unit($) -------------------------------------------------------------------------------------------------------------------------
TLG Services, Inc.
Cost of CPC B-25 LSA box & preparation for use 1,964.28 Cost of CPC B-12V 12 gauge LSA box & preparation for use 1,587.98 Cost of CPC B-144 LSA box & preparation for use 11,276.67 Cost of LSA drum & preparation for use 189.65 Cost of cask liner for CNSI 8 120A cask (resins) 8,483.14 Cost of cask liner for CNSI 8 120A cask (filters) 8,326.74 Decontamination of surfaces with vacuuming, $/square foot 0.67
Oconee Nuclear Station Document D03-1671-003, Rev. 0 Decommissioning Cost Analysis Appendix C, Page 1 of 27
TLG Services, Inc.
APPENDIX C
DETAILED COST ANALYSIS
DECON
Table Page
C-1 Unit 1, DECON Decommissioning Cost Estimate ............................................. 2 C-2 Unit 2, DECON Decommissioning Cost Estimate ........................................... 10 C-3 Unit 3, DECON Decommissioning Cost Estimate ........................................... 18

Oconee Nuclear StationDecommissioning Cost Analysis
Document D03-1671-003, Rev. 0Appendix C, Page 2 of 27
Table C-1 Oconee Nuclear Station, Unit 1
DECON Decommissioning Cost Estimate(thousands of 2013 dollars)
Costs run: Wed, Oct 23, 2013 at 10:16:58 Off-Site LLRW NRC Spent Fuel Site Processed Burial Volumes Burial / Utility andActivity DECCER Version 2010.09.09i Decon Removal Packaging Transport Processing Disposal Other Total Total Lic. Term. Management Restoration Volume Class A Class B Class C GTCC Processed Craft ContractorIndex Activity Description Cost Cost Costs Costs Costs Costs Costs Contingency Costs Costs Costs Costs Cu. Feet Cu. Feet Cu. Feet Cu. Feet Cu. Feet Wt., Lbs. Manhours Manhours
PERIOD 1a - Shutdown through Transition
Period 1a Direct Decommissioning Activities1a.1.1 Prepare preliminary decommissioning cost - - - - - - 98 15 112 112 - - - - - - - - - 1,300 1a.1.2 Notification of Cessation of Operations a 1a.1.3 Remove fuel & source material n/a1a.1.4 Notification of Permanent Defueling a 1a.1.5 Deactivate plant systems & process waste a 1a.1.6 Prepare and submit PSDAR - - - - - - 150 23 173 173 - - - - - - - - - 2,000 1a.1.7 Review plant dwgs & specs. - - - - - - 345 52 397 397 - - - - - - - - - 4,600 1a.1.8 Perform detailed rad survey a 1a.1.9 Estimate by-product inventory - - - - - - 75 11 86 86 - - - - - - - - - 1,000 1a.1.10 End product description - - - - - - 75 11 86 86 - - - - - - - - - 1,000 1a.1.11 Detailed by-product inventory - - - - - - 98 15 112 112 - - - - - - - - - 1,300 1a.1.12 Define major work sequence - - - - - - 563 84 647 647 - - - - - - - - - 7,500 1a.1.13 Perform SER and EA - - - - - - 233 35 268 268 - - - - - - - - - 3,100 1a.1.14 Perform Site-Specific Cost Study - - - - - - 375 56 432 432 - - - - - - - - - 5,000 1a.1.15 Prepare/submit License Termination Plan - - - - - - 307 46 354 354 - - - - - - - - - 4,096 1a.1.16 Receive NRC approval of termination plan a
Activity Specifications
1a.1.17.1 Plant & temporary facilities - - - - - - 369 55 425 382 - 42 - - - - - - - 4,920 1a.1.17.2 Plant systems - - - - - - 313 47 360 324 - 36 - - - - - - - 4,167 1a.1.17.3 NSSS Decontamination Flush - - - - - - 38 6 43 43 - - - - - - - - - 500 1a.1.17.4 Reactor internals - - - - - - 533 80 613 613 - - - - - - - - - 7,100 1a.1.17.5 Reactor vessel - - - - - - 488 73 561 561 - - - - - - - - - 6,500 1a.1.17.6 Biological shield - - - - - - 38 6 43 43 - - - - - - - - - 500 1a.1.17.7 Steam generators - - - - - - 234 35 269 269 - - - - - - - - - 3,120 1a.1.17.8 Reinforced concrete - - - - - - 120 18 138 69 - 69 - - - - - - - 1,600 1a.1.17.9 Main Turbine - - - - - - 30 5 35 - - 35 - - - - - - - 400 1a.1.17.10 Main Condensers - - - - - - 30 5 35 - - 35 - - - - - - - 400 1a.1.17.11 Plant structures & buildings - - - - - - 234 35 269 135 - 135 - - - - - - - 3,120 1a.1.17.12 Waste management - - - - - - 345 52 397 397 - - - - - - - - - 4,600 1a.1.17.13 Facility & site closeout - - - - - - 68 10 78 39 - 39 - - - - - - - 900 1a.1.17 Total - - - - - - 2,839 426 3,265 2,875 - 390 - - - - - - - 37,827
Planning & Site Preparations1a.1.18 Prepare dismantling sequence - - - - - - 180 27 207 207 - - - - - - - - - 2,400 1a.1.19 Plant prep. & temp. svces - - - - - - 2,900 435 3,335 3,335 - - - - - - - - - - 1a.1.20 Design water clean-up system - - - - - - 105 16 121 121 - - - - - - - - - 1,400 1a.1.21 Rigging/Cont. Cntrl Envlps/tooling/etc. - - - - - - 2,200 330 2,530 2,530 - - - - - - - - - - 1a.1.22 Procure casks/liners & containers - - - - - - 92 14 106 106 - - - - - - - - - 1,230 1a.1 Subtotal Period 1a Activity Costs - - - - - - 10,636 1,595 12,231 11,841 - 390 - - - - - - - 73,753
Period 1a Additional Costs1a.2.1 Asbestos Abatement - 3,376 4 319 - 2,925 - 1,624 8,249 8,249 - - - 25,455 - - - 330,915 38,621 - 1a.2 Subtotal Period 1a Additional Costs - 3,376 4 319 - 2,925 - 1,624 8,249 8,249 - - - 25,455 - - - 330,915 38,621 -
Period 1a Collateral Costs1a.3.1 Small tool allowance - 46 - - - - - 7 53 53 - - - - - - - - - - 1a.3 Subtotal Period 1a Collateral Costs - 46 - - - - - 7 53 53 - - - - - - - - - -
Period 1a Period-Dependent Costs1a.4.1 Insurance - - - - - - 881 88 969 969 - - - - - - - - - - 1a.4.2 Property taxes - - - - - - 1,963 196 2,159 2,159 - - - - - - - - - - 1a.4.3 Health physics supplies - 672 - - - - - 168 840 840 - - - - - - - - - - 1a.4.4 Heavy equipment rental - 571 - - - - - 86 657 657 - - - - - - - - - - 1a.4.5 Disposal of DAW generated - - 13 2 - 30 - 9 55 55 - - - 616 - - - 12,311 20 - 1a.4.6 Plant energy budget - - - - - - 617 92 709 709 - - - - - - - - - - 1a.4.7 NRC Fees - - - - - - 1,164 116 1,280 1,280 - - - - - - - - - - 1a.4.8 Emergency Planning Fees - - - - - - 129 13 142 - 142 - - - - - - - - - 1a.4.9 FEMA Fees - - - - - - 173 26 199 - 199 - - - - - - - - - 1a.4.10 Spent Fuel Pool O&M - - - - - - 470 70 540 - 540 - - - - - - - - - 1a.4.11 Corporate A&G - - - - - - 2,593 389 2,982 2,982 - - - - - - - - - - 1a.4.12 Site O&M - - - - - - 154 23 177 177 - - - - - - - - - -
TLG Services, Inc.
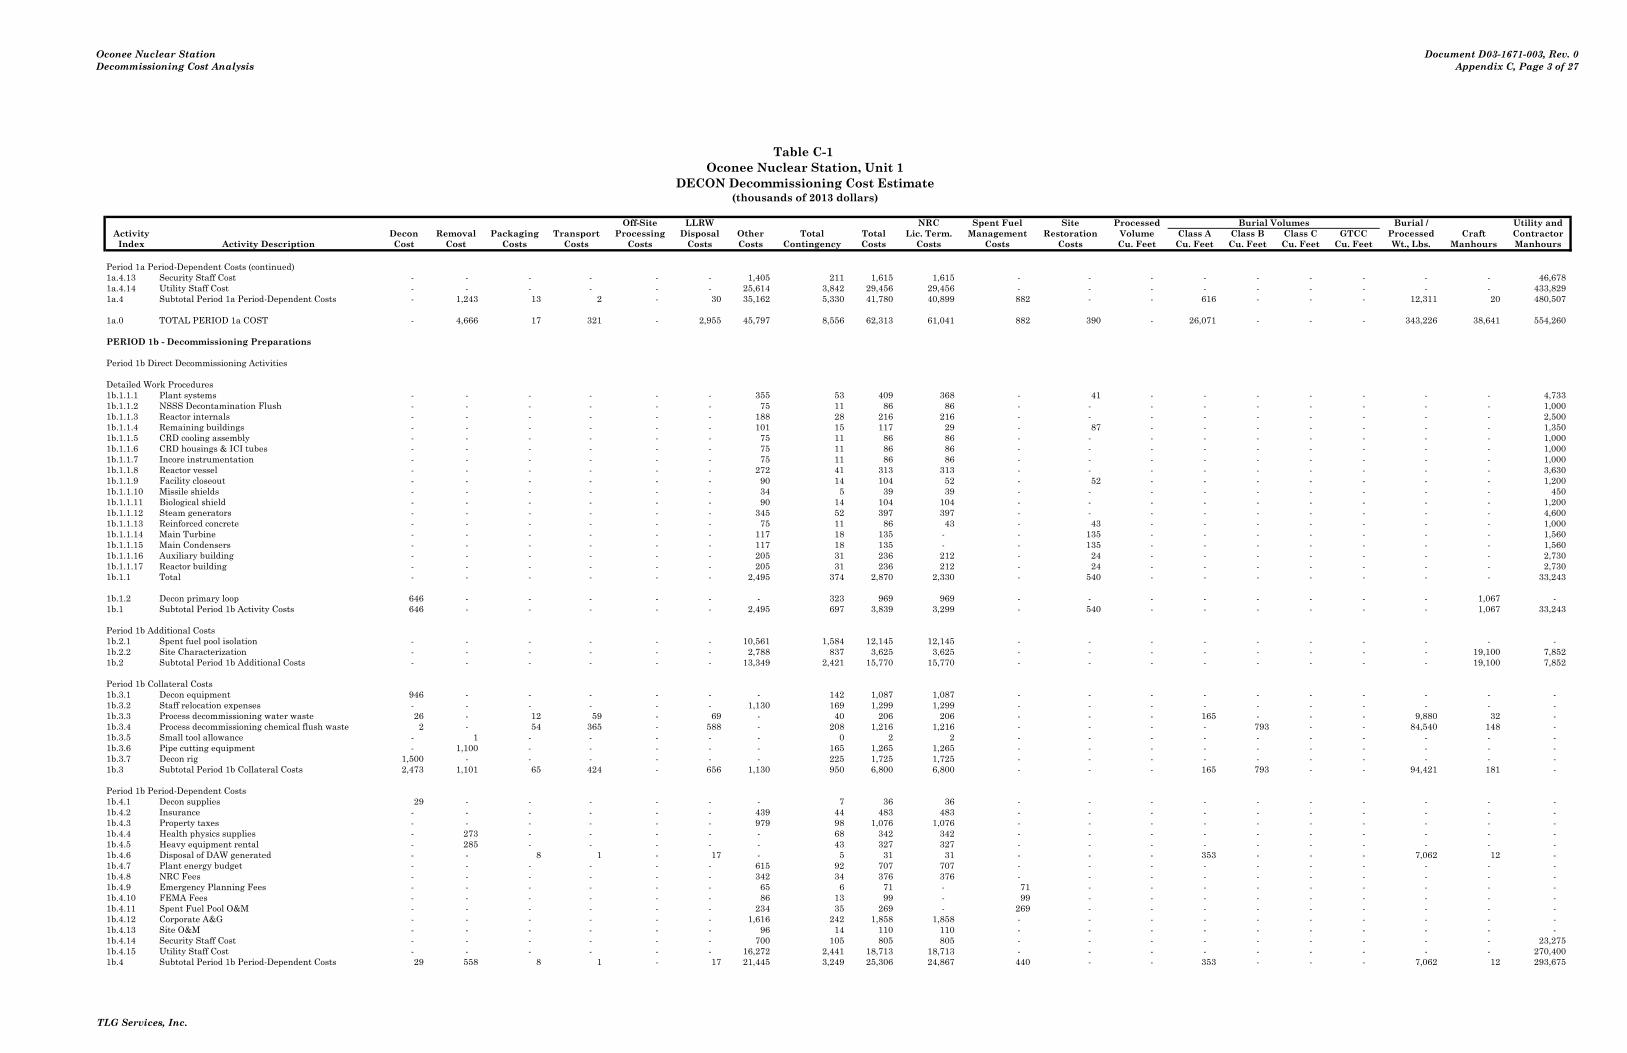
Oconee Nuclear StationDecommissioning Cost Analysis
Document D03-1671-003, Rev. 0Appendix C, Page 3 of 27
Table C-1 Oconee Nuclear Station, Unit 1
DECON Decommissioning Cost Estimate(thousands of 2013 dollars)
Costs run: Wed, Oct 23, 2013 at 10:16:58 Off-Site LLRW NRC Spent Fuel Site Processed Burial Volumes Burial / Utility andActivity DECCER Version 2010.09.09i Decon Removal Packaging Transport Processing Disposal Other Total Total Lic. Term. Management Restoration Volume Class A Class B Class C GTCC Processed Craft ContractorIndex Activity Description Cost Cost Costs Costs Costs Costs Costs Contingency Costs Costs Costs Costs Cu. Feet Cu. Feet Cu. Feet Cu. Feet Cu. Feet Wt., Lbs. Manhours Manhours
Period 1a Period-Dependent Costs (continued)1a.4.13 Security Staff Cost - - - - - - 1,405 211 1,615 1,615 - - - - - - - - - 46,678 1a.4.14 Utility Staff Cost - - - - - - 25,614 3,842 29,456 29,456 - - - - - - - - - 433,829 1a.4 Subtotal Period 1a Period-Dependent Costs - 1,243 13 2 - 30 35,162 5,330 41,780 40,899 882 - - 616 - - - 12,311 20 480,507
1a.0 TOTAL PERIOD 1a COST - 4,666 17 321 - 2,955 45,797 8,556 62,313 61,041 882 390 - 26,071 - - - 343,226 38,641 554,260
PERIOD 1b - Decommissioning Preparations
Period 1b Direct Decommissioning Activities
Detailed Work Procedures1b.1.1.1 Plant systems - - - - - - 355 53 409 368 - 41 - - - - - - - 4,733 1b.1.1.2 NSSS Decontamination Flush - - - - - - 75 11 86 86 - - - - - - - - - 1,000 1b.1.1.3 Reactor internals - - - - - - 188 28 216 216 - - - - - - - - - 2,500 1b.1.1.4 Remaining buildings - - - - - - 101 15 117 29 - 87 - - - - - - - 1,350 1b.1.1.5 CRD cooling assembly - - - - - - 75 11 86 86 - - - - - - - - - 1,000 1b.1.1.6 CRD housings & ICI tubes - - - - - - 75 11 86 86 - - - - - - - - - 1,000 1b.1.1.7 Incore instrumentation - - - - - - 75 11 86 86 - - - - - - - - - 1,000 1b.1.1.8 Reactor vessel - - - - - - 272 41 313 313 - - - - - - - - - 3,630 1b.1.1.9 Facility closeout - - - - - - 90 14 104 52 - 52 - - - - - - - 1,200 1b.1.1.10 Missile shields - - - - - - 34 5 39 39 - - - - - - - - - 450 1b.1.1.11 Biological shield - - - - - - 90 14 104 104 - - - - - - - - - 1,200 1b.1.1.12 Steam generators - - - - - - 345 52 397 397 - - - - - - - - - 4,600 1b.1.1.13 Reinforced concrete - - - - - - 75 11 86 43 - 43 - - - - - - - 1,000 1b.1.1.14 Main Turbine - - - - - - 117 18 135 - - 135 - - - - - - - 1,560 1b.1.1.15 Main Condensers - - - - - - 117 18 135 - - 135 - - - - - - - 1,560 1b.1.1.16 Auxiliary building - - - - - - 205 31 236 212 - 24 - - - - - - - 2,730 1b.1.1.17 Reactor building - - - - - - 205 31 236 212 - 24 - - - - - - - 2,730 1b.1.1 Total - - - - - - 2,495 374 2,870 2,330 - 540 - - - - - - - 33,243
1b.1.2 Decon primary loop 646 - - - - - - 323 969 969 - - - - - - - - 1,067 - 1b.1 Subtotal Period 1b Activity Costs 646 - - - - - 2,495 697 3,839 3,299 - 540 - - - - - - 1,067 33,243
Period 1b Additional Costs1b.2.1 Spent fuel pool isolation - - - - - - 10,561 1,584 12,145 12,145 - - - - - - - - - - 1b.2.2 Site Characterization - - - - - - 2,788 837 3,625 3,625 - - - - - - - - 19,100 7,852 1b.2 Subtotal Period 1b Additional Costs - - - - - - 13,349 2,421 15,770 15,770 - - - - - - - - 19,100 7,852
Period 1b Collateral Costs1b.3.1 Decon equipment 946 - - - - - - 142 1,087 1,087 - - - - - - - - - - 1b.3.2 Staff relocation expenses - - - - - - 1,130 169 1,299 1,299 - - - - - - - - - - 1b.3.3 Process decommissioning water waste 26 - 12 59 - 69 - 40 206 206 - - - 165 - - - 9,880 32 - 1b.3.4 Process decommissioning chemical flush waste 2 - 54 365 - 588 - 208 1,216 1,216 - - - - 793 - - 84,540 148 - 1b.3.5 Small tool allowance - 1 - - - - - 0 2 2 - - - - - - - - - - 1b.3.6 Pipe cutting equipment - 1,100 - - - - - 165 1,265 1,265 - - - - - - - - - - 1b.3.7 Decon rig 1,500 - - - - - - 225 1,725 1,725 - - - - - - - - - - 1b.3 Subtotal Period 1b Collateral Costs 2,473 1,101 65 424 - 656 1,130 950 6,800 6,800 - - - 165 793 - - 94,421 181 -
Period 1b Period-Dependent Costs1b.4.1 Decon supplies 29 - - - - - - 7 36 36 - - - - - - - - - - 1b.4.2 Insurance - - - - - - 439 44 483 483 - - - - - - - - - - 1b.4.3 Property taxes - - - - - - 979 98 1,076 1,076 - - - - - - - - - - 1b.4.4 Health physics supplies - 273 - - - - - 68 342 342 - - - - - - - - - - 1b.4.5 Heavy equipment rental - 285 - - - - - 43 327 327 - - - - - - - - - - 1b.4.6 Disposal of DAW generated - - 8 1 - 17 - 5 31 31 - - - 353 - - - 7,062 12 - 1b.4.7 Plant energy budget - - - - - - 615 92 707 707 - - - - - - - - - - 1b.4.8 NRC Fees - - - - - - 342 34 376 376 - - - - - - - - - - 1b.4.9 Emergency Planning Fees - - - - - - 65 6 71 - 71 - - - - - - - - - 1b.4.10 FEMA Fees - - - - - - 86 13 99 - 99 - - - - - - - - - 1b.4.11 Spent Fuel Pool O&M - - - - - - 234 35 269 - 269 - - - - - - - - - 1b.4.12 Corporate A&G - - - - - - 1,616 242 1,858 1,858 - - - - - - - - - - 1b.4.13 Site O&M - - - - - - 96 14 110 110 - - - - - - - - - - 1b.4.14 Security Staff Cost - - - - - - 700 105 805 805 - - - - - - - - - 23,275 1b.4.15 Utility Staff Cost - - - - - - 16,272 2,441 18,713 18,713 - - - - - - - - - 270,400 1b.4 Subtotal Period 1b Period-Dependent Costs 29 558 8 1 - 17 21,445 3,249 25,306 24,867 440 - - 353 - - - 7,062 12 293,675
TLG Services, Inc.
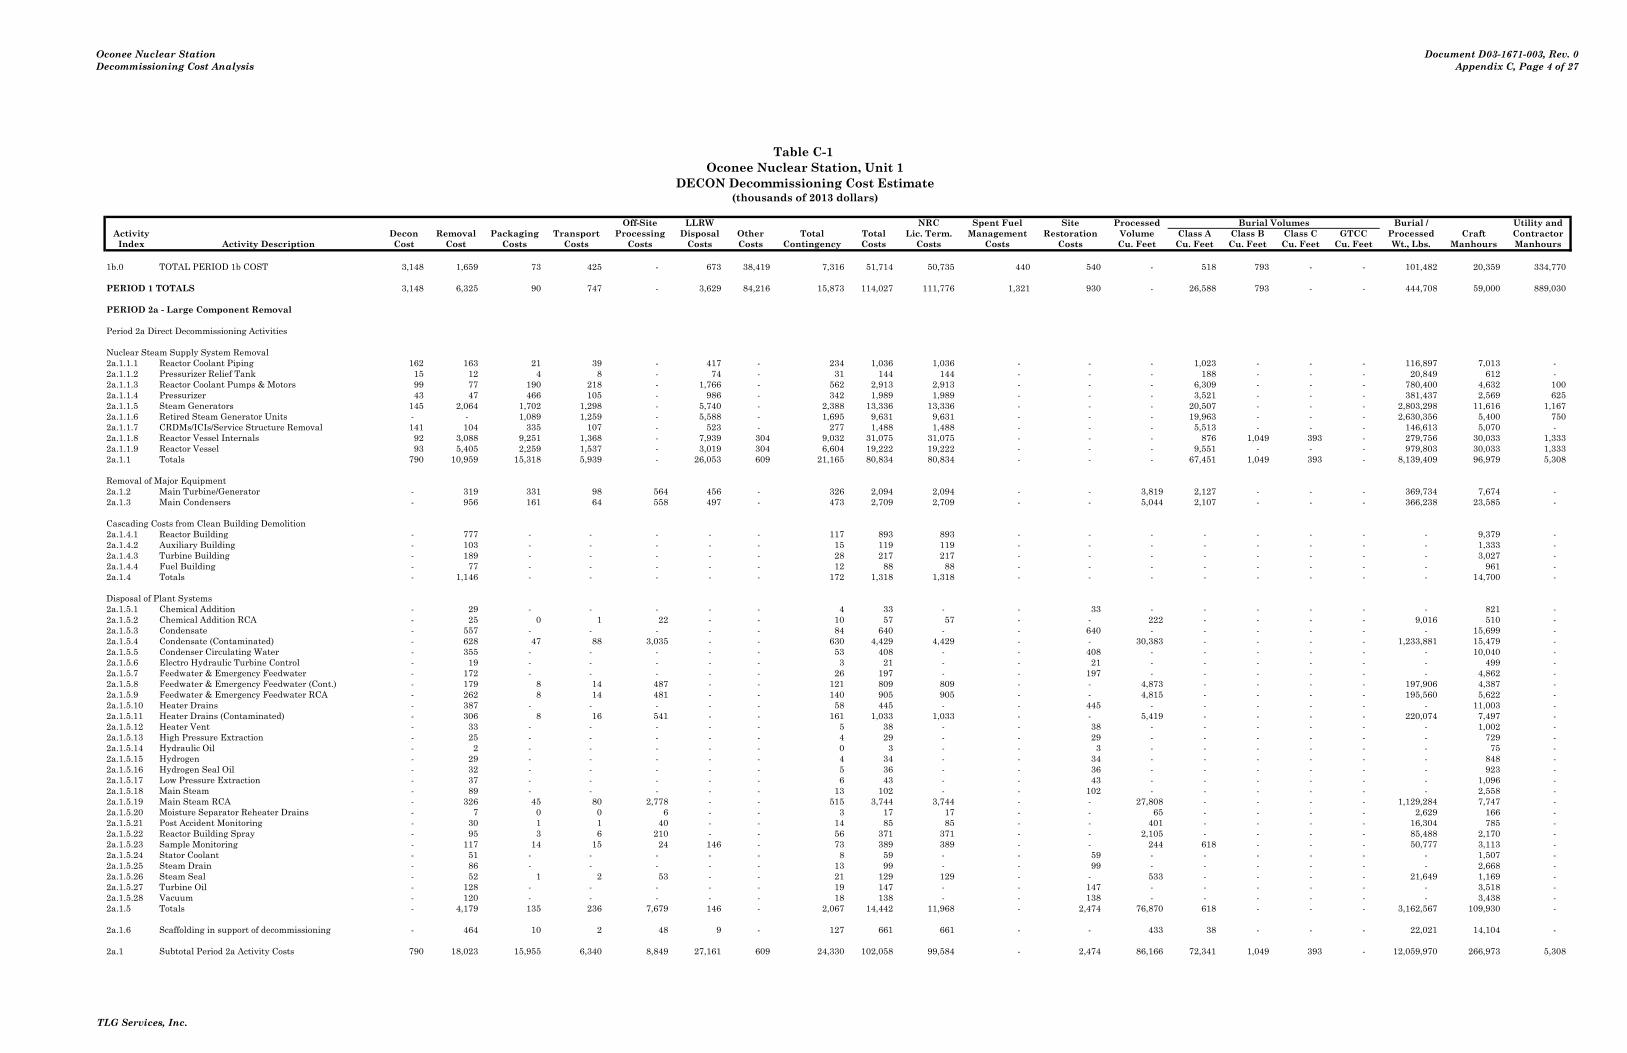
Oconee Nuclear StationDecommissioning Cost Analysis
Document D03-1671-003, Rev. 0Appendix C, Page 4 of 27
Table C-1 Oconee Nuclear Station, Unit 1
DECON Decommissioning Cost Estimate(thousands of 2013 dollars)
Costs run: Wed, Oct 23, 2013 at 10:16:58 Off-Site LLRW NRC Spent Fuel Site Processed Burial Volumes Burial / Utility andActivity DECCER Version 2010.09.09i Decon Removal Packaging Transport Processing Disposal Other Total Total Lic. Term. Management Restoration Volume Class A Class B Class C GTCC Processed Craft ContractorIndex Activity Description Cost Cost Costs Costs Costs Costs Costs Contingency Costs Costs Costs Costs Cu. Feet Cu. Feet Cu. Feet Cu. Feet Cu. Feet Wt., Lbs. Manhours Manhours
1b.0 TOTAL PERIOD 1b COST 3,148 1,659 73 425 - 673 38,419 7,316 51,714 50,735 440 540 - 518 793 - - 101,482 20,359 334,770
PERIOD 1 TOTALS 3,148 6,325 90 747 - 3,629 84,216 15,873 114,027 111,776 1,321 930 - 26,588 793 - - 444,708 59,000 889,030
PERIOD 2a - Large Component Removal
Period 2a Direct Decommissioning Activities
Nuclear Steam Supply System Removal2a.1.1.1 Reactor Coolant Piping 162 163 21 39 - 417 - 234 1,036 1,036 - - - 1,023 - - - 116,897 7,013 - 2a.1.1.2 Pressurizer Relief Tank 15 12 4 8 - 74 - 31 144 144 - - - 188 - - - 20,849 612 - 2a.1.1.3 Reactor Coolant Pumps & Motors 99 77 190 218 - 1,766 - 562 2,913 2,913 - - - 6,309 - - - 780,400 4,632 100 2a.1.1.4 Pressurizer 43 47 466 105 - 986 - 342 1,989 1,989 - - - 3,521 - - - 381,437 2,569 625 2a.1.1.5 Steam Generators 145 2,064 1,702 1,298 - 5,740 - 2,388 13,336 13,336 - - - 20,507 - - - 2,803,298 11,616 1,167 2a.1.1.6 Retired Steam Generator Units - - 1,089 1,259 - 5,588 - 1,695 9,631 9,631 - - - 19,963 - - - 2,630,356 5,400 750 2a.1.1.7 CRDMs/ICIs/Service Structure Removal 141 104 335 107 - 523 - 277 1,488 1,488 - - - 5,513 - - - 146,613 5,070 - 2a.1.1.8 Reactor Vessel Internals 92 3,088 9,251 1,368 - 7,939 304 9,032 31,075 31,075 - - - 876 1,049 393 - 279,756 30,033 1,333 2a.1.1.9 Reactor Vessel 93 5,405 2,259 1,537 - 3,019 304 6,604 19,222 19,222 - - - 9,551 - - - 979,803 30,033 1,333 2a.1.1 Totals 790 10,959 15,318 5,939 - 26,053 609 21,165 80,834 80,834 - - - 67,451 1,049 393 - 8,139,409 96,979 5,308
Removal of Major Equipment2a.1.2 Main Turbine/Generator - 319 331 98 564 456 - 326 2,094 2,094 - - 3,819 2,127 - - - 369,734 7,674 - 2a.1.3 Main Condensers - 956 161 64 558 497 - 473 2,709 2,709 - - 5,044 2,107 - - - 366,238 23,585 -
Cascading Costs from Clean Building Demolition2a.1.4.1 Reactor Building - 777 - - - - - 117 893 893 - - - - - - - - 9,379 - 2a.1.4.2 Auxiliary Building - 103 - - - - - 15 119 119 - - - - - - - - 1,333 - 2a.1.4.3 Turbine Building - 189 - - - - - 28 217 217 - - - - - - - - 3,027 - 2a.1.4.4 Fuel Building - 77 - - - - - 12 88 88 - - - - - - - - 961 - 2a.1.4 Totals - 1,146 - - - - - 172 1,318 1,318 - - - - - - - - 14,700 -
Disposal of Plant Systems2a.1.5.1 Chemical Addition - 29 - - - - - 4 33 - - 33 - - - - - - 821 - 2a.1.5.2 Chemical Addition RCA - 25 0 1 22 - - 10 57 57 - - 222 - - - - 9,016 510 - 2a.1.5.3 Condensate - 557 - - - - - 84 640 - - 640 - - - - - - 15,699 - 2a.1.5.4 Condensate (Contaminated) - 628 47 88 3,035 - - 630 4,429 4,429 - - 30,383 - - - - 1,233,881 15,479 - 2a.1.5.5 Condenser Circulating Water - 355 - - - - - 53 408 - - 408 - - - - - - 10,040 - 2a.1.5.6 Electro Hydraulic Turbine Control - 19 - - - - - 3 21 - - 21 - - - - - - 499 - 2a.1.5.7 Feedwater & Emergency Feedwater - 172 - - - - - 26 197 - - 197 - - - - - - 4,862 - 2a.1.5.8 Feedwater & Emergency Feedwater (Cont.) - 179 8 14 487 - - 121 809 809 - - 4,873 - - - - 197,906 4,387 - 2a.1.5.9 Feedwater & Emergency Feedwater RCA - 262 8 14 481 - - 140 905 905 - - 4,815 - - - - 195,560 5,622 - 2a.1.5.10 Heater Drains - 387 - - - - - 58 445 - - 445 - - - - - - 11,003 - 2a.1.5.11 Heater Drains (Contaminated) - 306 8 16 541 - - 161 1,033 1,033 - - 5,419 - - - - 220,074 7,497 - 2a.1.5.12 Heater Vent - 33 - - - - - 5 38 - - 38 - - - - - - 1,002 - 2a.1.5.13 High Pressure Extraction - 25 - - - - - 4 29 - - 29 - - - - - - 729 - 2a.1.5.14 Hydraulic Oil - 2 - - - - - 0 3 - - 3 - - - - - - 75 - 2a.1.5.15 Hydrogen - 29 - - - - - 4 34 - - 34 - - - - - - 848 - 2a.1.5.16 Hydrogen Seal Oil - 32 - - - - - 5 36 - - 36 - - - - - - 923 - 2a.1.5.17 Low Pressure Extraction - 37 - - - - - 6 43 - - 43 - - - - - - 1,096 - 2a.1.5.18 Main Steam - 89 - - - - - 13 102 - - 102 - - - - - - 2,558 - 2a.1.5.19 Main Steam RCA - 326 45 80 2,778 - - 515 3,744 3,744 - - 27,808 - - - - 1,129,284 7,747 - 2a.1.5.20 Moisture Separator Reheater Drains - 7 0 0 6 - - 3 17 17 - - 65 - - - - 2,629 166 - 2a.1.5.21 Post Accident Monitoring - 30 1 1 40 - - 14 85 85 - - 401 - - - - 16,304 785 - 2a.1.5.22 Reactor Building Spray - 95 3 6 210 - - 56 371 371 - - 2,105 - - - - 85,488 2,170 - 2a.1.5.23 Sample Monitoring - 117 14 15 24 146 - 73 389 389 - - 244 618 - - - 50,777 3,113 - 2a.1.5.24 Stator Coolant - 51 - - - - - 8 59 - - 59 - - - - - - 1,507 - 2a.1.5.25 Steam Drain - 86 - - - - - 13 99 - - 99 - - - - - - 2,668 - 2a.1.5.26 Steam Seal - 52 1 2 53 - - 21 129 129 - - 533 - - - - 21,649 1,169 - 2a.1.5.27 Turbine Oil - 128 - - - - - 19 147 - - 147 - - - - - - 3,518 - 2a.1.5.28 Vacuum - 120 - - - - - 18 138 - - 138 - - - - - - 3,438 - 2a.1.5 Totals - 4,179 135 236 7,679 146 - 2,067 14,442 11,968 - 2,474 76,870 618 - - - 3,162,567 109,930 -
2a.1.6 Scaffolding in support of decommissioning - 464 10 2 48 9 - 127 661 661 - - 433 38 - - - 22,021 14,104 -
2a.1 Subtotal Period 2a Activity Costs 790 18,023 15,955 6,340 8,849 27,161 609 24,330 102,058 99,584 - 2,474 86,166 72,341 1,049 393 - 12,059,970 266,973 5,308
TLG Services, Inc.

Oconee Nuclear StationDecommissioning Cost Analysis
Document D03-1671-003, Rev. 0Appendix C, Page 5 of 27
Table C-1 Oconee Nuclear Station, Unit 1
DECON Decommissioning Cost Estimate(thousands of 2013 dollars)
Costs run: Wed, Oct 23, 2013 at 10:16:58 Off-Site LLRW NRC Spent Fuel Site Processed Burial Volumes Burial / Utility andActivity DECCER Version 2010.09.09i Decon Removal Packaging Transport Processing Disposal Other Total Total Lic. Term. Management Restoration Volume Class A Class B Class C GTCC Processed Craft ContractorIndex Activity Description Cost Cost Costs Costs Costs Costs Costs Contingency Costs Costs Costs Costs Cu. Feet Cu. Feet Cu. Feet Cu. Feet Cu. Feet Wt., Lbs. Manhours Manhours
Period 2a Additional Costs2a.2.1 Remedial Action Surveys - - - - - - 1,627 488 2,115 2,115 - - - - - - - - 33,315 - 2a.2 Subtotal Period 2a Additional Costs - - - - - - 1,627 488 2,115 2,115 - - - - - - - - 33,315 -
Period 2a Collateral Costs2a.3.1 Process decommissioning water waste 53 - 24 121 - 141 - 82 421 421 - - - 338 - - - 20,272 66 - 2a.3.3 Small tool allowance - 225 - - - - - 34 259 233 - 26 - - - - - - - - 2a.3.4 Spent Fuel Capital and Transfer - - - - - - 690 103 793 - 793 - - - - - - - - - 2a.3 Subtotal Period 2a Collateral Costs 53 225 24 121 - 141 690 219 1,472 653 793 26 - 338 - - - 20,272 66 -
Period 2a Period-Dependent Costs2a.4.1 Decon supplies 93 - - - - - - 23 116 116 - - - - - - - - - - 2a.4.2 Insurance - - - - - - 622 62 684 684 - - - - - - - - - - 2a.4.3 Property taxes - - - - - - 2,362 236 2,598 2,338 - 260 - - - - - - - - 2a.4.4 Health physics supplies - 2,161 - - - - - 540 2,701 2,701 - - - - - - - - - - 2a.4.5 Heavy equipment rental - 3,506 - - - - - 526 4,032 4,032 - - - - - - - - - - 2a.4.6 Disposal of DAW generated - - 92 13 - 206 - 63 373 373 - - - 4,214 - - - 84,287 137 - 2a.4.7 Plant energy budget - - - - - - 939 141 1,080 1,080 - - - - - - - - - - 2a.4.8 NRC Fees - - - - - - 999 100 1,098 1,098 - - - - - - - - - - 2a.4.9 Emergency Planning Fees - - - - - - 208 21 228 - 228 - - - - - - - - - 2a.4.10 Spent Fuel Pool O&M - - - - - - 753 113 866 - 866 - - - - - - - - - 2a.4.11 Corporate A&G - - - - - - 4,096 614 4,710 4,710 - - - - - - - - - - 2a.4.12 Site O&M - - - - - - 398 60 458 458 - - - - - - - - - - 2a.4.13 Security Staff Cost - - - - - - 3,089 463 3,552 3,552 - - - - - - - - - 94,436 2a.4.14 Utility Staff Cost - - - - - - 41,520 6,228 47,748 47,748 - - - - - - - - - 685,286 2a.4 Subtotal Period 2a Period-Dependent Costs 93 5,667 92 13 - 206 54,984 9,190 70,244 68,891 1,094 260 - 4,214 - - - 84,287 137 779,721
2a.0 TOTAL PERIOD 2a COST 935 23,916 16,071 6,475 8,849 27,507 57,909 34,227 175,890 171,243 1,887 2,760 86,166 76,893 1,049 393 - 12,164,530 300,491 785,030
PERIOD 2b - Site Decontamination
Period 2b Direct Decommissioning Activities
Disposal of Plant Systems2b.1.1.1 Component Cooling - 50 - - - - - 7 57 - - 57 - - - - - - 1,374 - 2b.1.1.2 Component Cooling RCA - 129 2 4 143 - - 54 333 333 - - 1,430 - - - - 58,079 2,726 - 2b.1.1.3 Core Flood - 120 12 13 161 85 - 79 470 470 - - 1,611 360 - - - 89,255 2,799 - 2b.1.1.4 Electrical (Clean) - 614 - - - - - 92 706 - - 706 - - - - - - 16,347 - 2b.1.1.5 Electrical (Contaminated) - 207 12 15 91 126 - 100 552 552 - - 910 533 - - - 72,183 4,756 - 2b.1.1.6 Electrical (Contaminated) RCA - 1,313 24 44 1,516 - - 565 3,463 3,463 - - 15,179 - - - - 616,410 28,392 - 2b.1.1.7 High Pressure Injection - 985 386 372 1,270 3,447 - 1,393 7,853 7,853 - - 12,713 14,584 - - - 1,481,804 23,951 - 2b.1.1.8 Incore Instrumentation - 17 1 0 - 4 - 5 28 28 - - - 18 - - - 1,228 466 - 2b.1.1.9 Low Pressure Injection - 553 91 100 569 858 - 462 2,634 2,634 - - 5,697 3,663 - - - 471,820 13,495 - 2b.1.1.10 On-Site/Off-Site Power - 98 - - - - - 15 112 - - 112 - - - - - - 2,517 - 2b.1.1.11 Purge - 162 8 14 484 - - 116 783 783 - - 4,842 - - - - 196,641 3,632 - 2b.1.1.12 RFS Refueling Water - 51 6 5 31 43 - 29 165 165 - - 314 180 - - - 24,695 1,140 - 2b.1.1.13 Radiation Instrument Alarm - 12 - - - - - 2 13 - - 13 - - - - - - 323 - 2b.1.1.14 Radiation Instrument Alarm RCA - 29 0 0 6 - - 8 44 44 - - 63 - - - - 2,565 788 - 2b.1.1.15 Reactor Building Cooling - 362 30 54 1,873 - - 383 2,701 2,701 - - 18,745 - - - - 761,247 8,761 - 2b.1.1.16 Reactor Coolant - 260 32 23 51 223 - 135 723 723 - - 510 939 - - - 83,034 6,528 - 2b.1.1.17 Reactor Coolant Storage 460 543 80 82 243 773 - 616 2,797 2,797 - - 2,430 3,326 - - - 315,292 22,260 - 2b.1.1.18 Ventilation (Clean) - 192 - - - - - 29 221 - - 221 - - - - - - 5,666 - 2b.1.1.19 Ventilation (Contaminated) - 614 22 34 887 85 - 315 1,957 1,957 - - 8,878 361 - - - 384,448 13,306 - 2b.1.1.20 Ventilation (clean) RCA - 258 8 14 492 - - 141 913 913 - - 4,925 - - - - 200,000 4,619 - 2b.1.1 Totals 460 6,568 714 775 7,817 5,644 - 4,547 26,525 25,415 - 1,110 78,247 23,965 - - - 4,758,701 163,845 -
2b.1.2 Scaffolding in support of decommissioning - 580 13 3 60 11 - 159 826 826 - - 542 48 - - - 27,527 17,631 -
Decontamination of Site Buildings2b.1.3.1 Reactor Building 815 904 37 308 465 1,657 - 1,167 5,354 5,354 - - 4,658 12,908 - - - 990,468 37,633 - 2b.1.3.2 Auxiliary Building 337 179 8 81 63 141 - 271 1,078 1,078 - - 629 2,359 - - - 228,875 11,559 - 2b.1.3.3 Turbine Building 243 24 1 9 - 15 - 133 424 424 - - - 260 - - - 22,500 6,486 - 2b.1.3 Totals 1,395 1,107 45 397 528 1,812 - 1,571 6,856 6,856 - - 5,286 15,526 - - - 1,241,843 55,678 -
2b.1 Subtotal Period 2b Activity Costs 1,854 8,256 773 1,175 8,405 7,468 - 6,276 34,207 33,097 - 1,110 84,075 39,539 - - - 6,028,071 237,153 -
TLG Services, Inc.
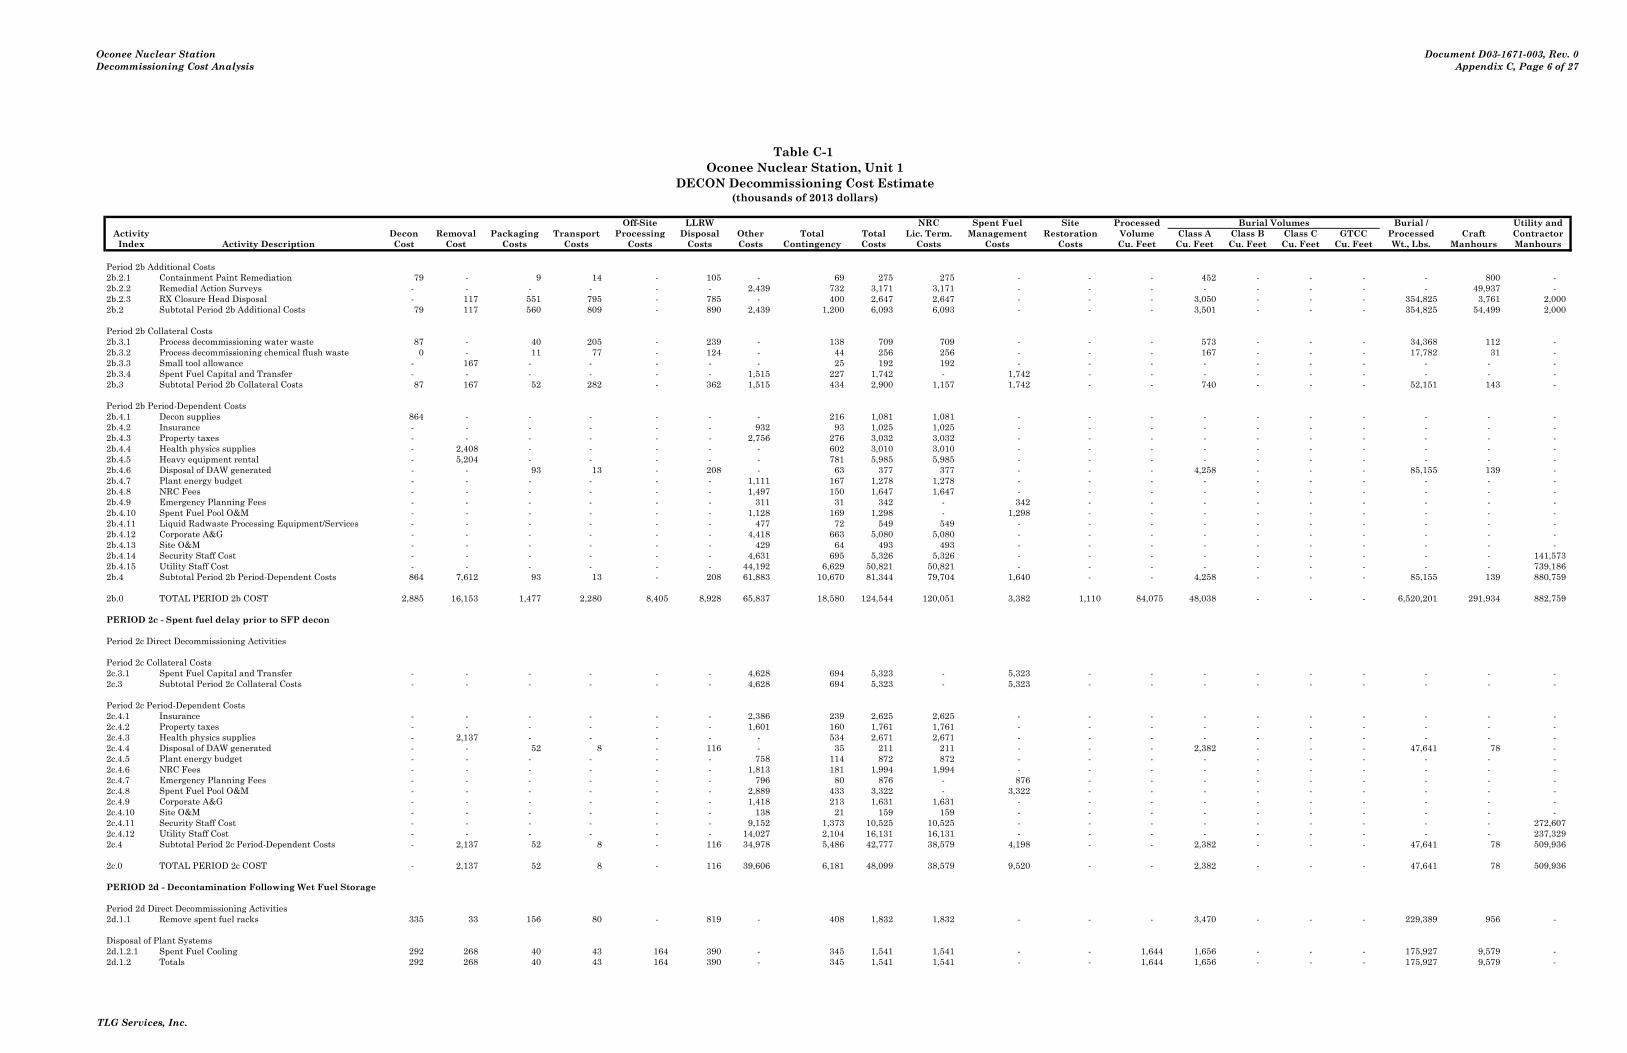
Oconee Nuclear StationDecommissioning Cost Analysis
Document D03-1671-003, Rev. 0Appendix C, Page 6 of 27
Table C-1 Oconee Nuclear Station, Unit 1
DECON Decommissioning Cost Estimate(thousands of 2013 dollars)
Costs run: Wed, Oct 23, 2013 at 10:16:58 Off-Site LLRW NRC Spent Fuel Site Processed Burial Volumes Burial / Utility andActivity DECCER Version 2010.09.09i Decon Removal Packaging Transport Processing Disposal Other Total Total Lic. Term. Management Restoration Volume Class A Class B Class C GTCC Processed Craft ContractorIndex Activity Description Cost Cost Costs Costs Costs Costs Costs Contingency Costs Costs Costs Costs Cu. Feet Cu. Feet Cu. Feet Cu. Feet Cu. Feet Wt., Lbs. Manhours Manhours
Period 2b Additional Costs2b.2.1 Containment Paint Remediation 79 - 9 14 - 105 - 69 275 275 - - - 452 - - - - 800 - 2b.2.2 Remedial Action Surveys - - - - - - 2,439 732 3,171 3,171 - - - - - - - - 49,937 - 2b.2.3 RX Closure Head Disposal - 117 551 795 - 785 - 400 2,647 2,647 - - - 3,050 - - - 354,825 3,761 2,000 2b.2 Subtotal Period 2b Additional Costs 79 117 560 809 - 890 2,439 1,200 6,093 6,093 - - - 3,501 - - - 354,825 54,499 2,000
Period 2b Collateral Costs2b.3.1 Process decommissioning water waste 87 - 40 205 - 239 - 138 709 709 - - - 573 - - - 34,368 112 - 2b.3.2 Process decommissioning chemical flush waste 0 - 11 77 - 124 - 44 256 256 - - - 167 - - - 17,782 31 - 2b.3.3 Small tool allowance - 167 - - - - - 25 192 192 - - - - - - - - - - 2b.3.4 Spent Fuel Capital and Transfer - - - - - - 1,515 227 1,742 - 1,742 - - - - - - - - - 2b.3 Subtotal Period 2b Collateral Costs 87 167 52 282 - 362 1,515 434 2,900 1,157 1,742 - - 740 - - - 52,151 143 -
Period 2b Period-Dependent Costs2b.4.1 Decon supplies 864 - - - - - - 216 1,081 1,081 - - - - - - - - - - 2b.4.2 Insurance - - - - - - 932 93 1,025 1,025 - - - - - - - - - - 2b.4.3 Property taxes - - - - - - 2,756 276 3,032 3,032 - - - - - - - - - - 2b.4.4 Health physics supplies - 2,408 - - - - - 602 3,010 3,010 - - - - - - - - - - 2b.4.5 Heavy equipment rental - 5,204 - - - - - 781 5,985 5,985 - - - - - - - - - - 2b.4.6 Disposal of DAW generated - - 93 13 - 208 - 63 377 377 - - - 4,258 - - - 85,155 139 - 2b.4.7 Plant energy budget - - - - - - 1,111 167 1,278 1,278 - - - - - - - - - - 2b.4.8 NRC Fees - - - - - - 1,497 150 1,647 1,647 - - - - - - - - - - 2b.4.9 Emergency Planning Fees - - - - - - 311 31 342 - 342 - - - - - - - - - 2b.4.10 Spent Fuel Pool O&M - - - - - - 1,128 169 1,298 - 1,298 - - - - - - - - - 2b.4.11 Liquid Radwaste Processing Equipment/Services - - - - - - 477 72 549 549 - - - - - - - - - - 2b.4.12 Corporate A&G - - - - - - 4,418 663 5,080 5,080 - - - - - - - - - - 2b.4.13 Site O&M - - - - - - 429 64 493 493 - - - - - - - - - - 2b.4.14 Security Staff Cost - - - - - - 4,631 695 5,326 5,326 - - - - - - - - - 141,573 2b.4.15 Utility Staff Cost - - - - - - 44,192 6,629 50,821 50,821 - - - - - - - - - 739,186 2b.4 Subtotal Period 2b Period-Dependent Costs 864 7,612 93 13 - 208 61,883 10,670 81,344 79,704 1,640 - - 4,258 - - - 85,155 139 880,759
2b.0 TOTAL PERIOD 2b COST 2,885 16,153 1,477 2,280 8,405 8,928 65,837 18,580 124,544 120,051 3,382 1,110 84,075 48,038 - - - 6,520,201 291,934 882,759
PERIOD 2c - Spent fuel delay prior to SFP decon
Period 2c Direct Decommissioning Activities
Period 2c Collateral Costs2c.3.1 Spent Fuel Capital and Transfer - - - - - - 4,628 694 5,323 - 5,323 - - - - - - - - - 2c.3 Subtotal Period 2c Collateral Costs - - - - - - 4,628 694 5,323 - 5,323 - - - - - - - - -
Period 2c Period-Dependent Costs2c.4.1 Insurance - - - - - - 2,386 239 2,625 2,625 - - - - - - - - - - 2c.4.2 Property taxes - - - - - - 1,601 160 1,761 1,761 - - - - - - - - - - 2c.4.3 Health physics supplies - 2,137 - - - - - 534 2,671 2,671 - - - - - - - - - - 2c.4.4 Disposal of DAW generated - - 52 8 - 116 - 35 211 211 - - - 2,382 - - - 47,641 78 - 2c.4.5 Plant energy budget - - - - - - 758 114 872 872 - - - - - - - - - - 2c.4.6 NRC Fees - - - - - - 1,813 181 1,994 1,994 - - - - - - - - - - 2c.4.7 Emergency Planning Fees - - - - - - 796 80 876 - 876 - - - - - - - - - 2c.4.8 Spent Fuel Pool O&M - - - - - - 2,889 433 3,322 - 3,322 - - - - - - - - - 2c.4.9 Corporate A&G - - - - - - 1,418 213 1,631 1,631 - - - - - - - - - - 2c.4.10 Site O&M - - - - - - 138 21 159 159 - - - - - - - - - - 2c.4.11 Security Staff Cost - - - - - - 9,152 1,373 10,525 10,525 - - - - - - - - - 272,607 2c.4.12 Utility Staff Cost - - - - - - 14,027 2,104 16,131 16,131 - - - - - - - - - 237,329 2c.4 Subtotal Period 2c Period-Dependent Costs - 2,137 52 8 - 116 34,978 5,486 42,777 38,579 4,198 - - 2,382 - - - 47,641 78 509,936
2c.0 TOTAL PERIOD 2c COST - 2,137 52 8 - 116 39,606 6,181 48,099 38,579 9,520 - - 2,382 - - - 47,641 78 509,936
PERIOD 2d - Decontamination Following Wet Fuel Storage
Period 2d Direct Decommissioning Activities2d.1.1 Remove spent fuel racks 335 33 156 80 - 819 - 408 1,832 1,832 - - - 3,470 - - - 229,389 956 -
Disposal of Plant Systems2d.1.2.1 Spent Fuel Cooling 292 268 40 43 164 390 - 345 1,541 1,541 - - 1,644 1,656 - - - 175,927 9,579 - 2d.1.2 Totals 292 268 40 43 164 390 - 345 1,541 1,541 - - 1,644 1,656 - - - 175,927 9,579 -
TLG Services, Inc.
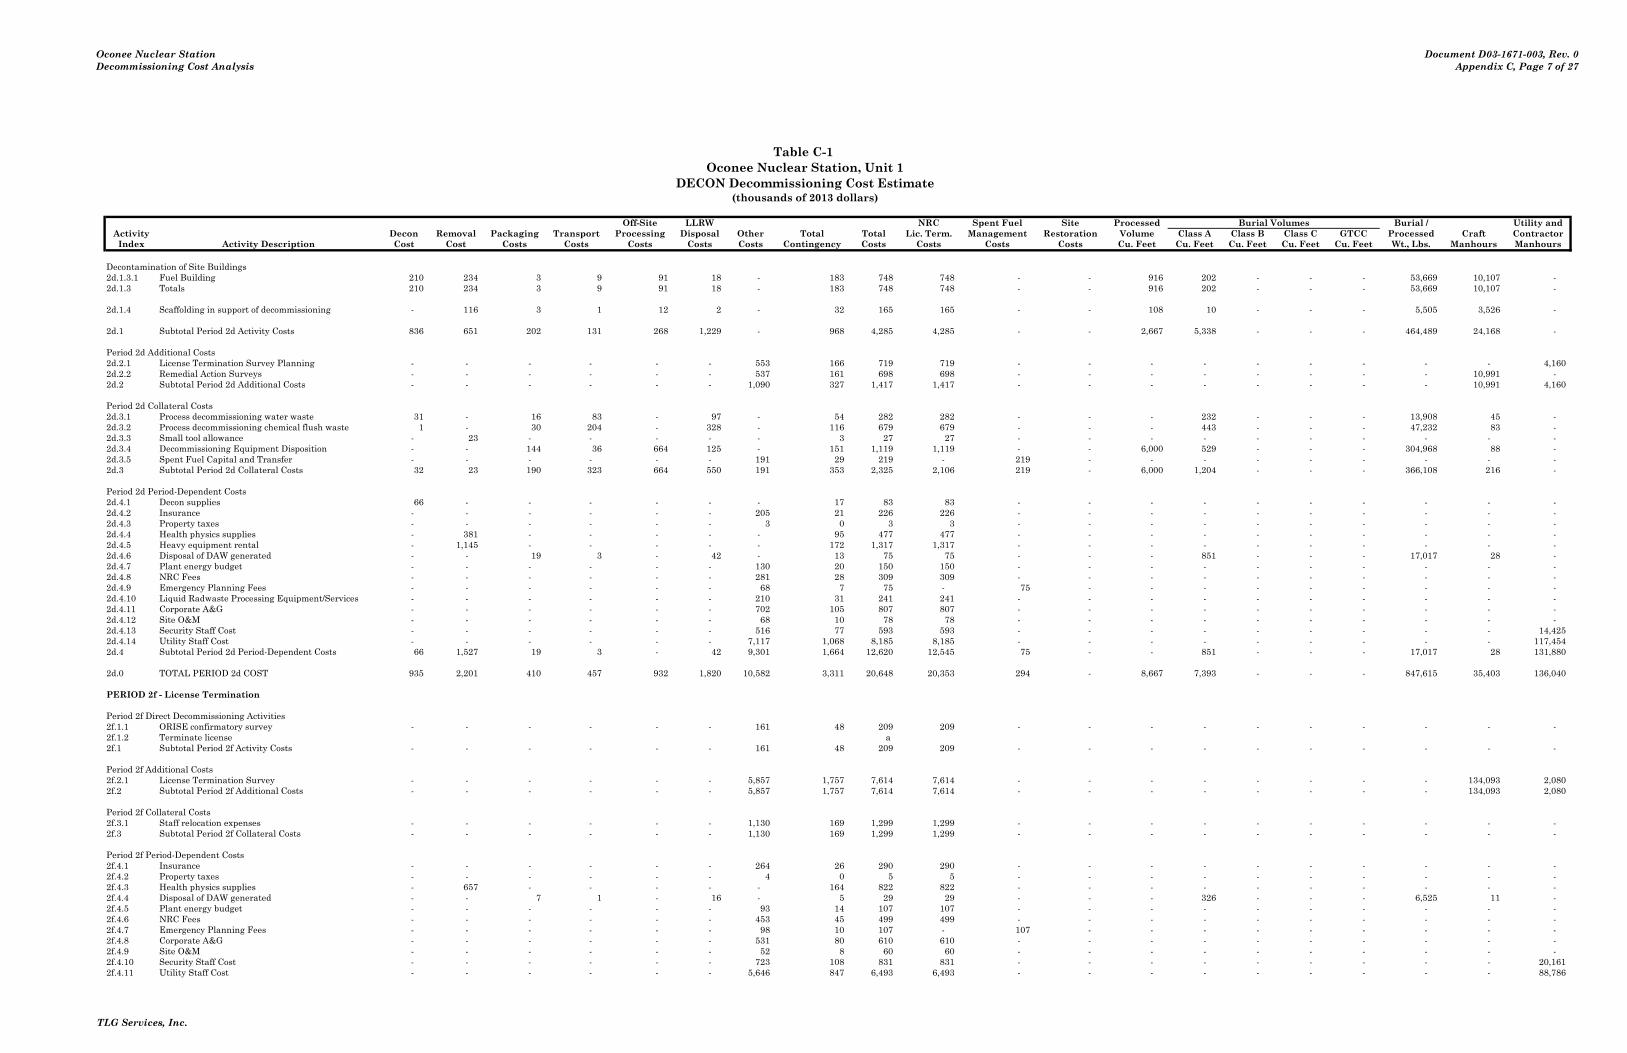
Oconee Nuclear StationDecommissioning Cost Analysis
Document D03-1671-003, Rev. 0Appendix C, Page 7 of 27
Table C-1 Oconee Nuclear Station, Unit 1
DECON Decommissioning Cost Estimate(thousands of 2013 dollars)
Costs run: Wed, Oct 23, 2013 at 10:16:58 Off-Site LLRW NRC Spent Fuel Site Processed Burial Volumes Burial / Utility andActivity DECCER Version 2010.09.09i Decon Removal Packaging Transport Processing Disposal Other Total Total Lic. Term. Management Restoration Volume Class A Class B Class C GTCC Processed Craft ContractorIndex Activity Description Cost Cost Costs Costs Costs Costs Costs Contingency Costs Costs Costs Costs Cu. Feet Cu. Feet Cu. Feet Cu. Feet Cu. Feet Wt., Lbs. Manhours Manhours
Decontamination of Site Buildings2d.1.3.1 Fuel Building 210 234 3 9 91 18 - 183 748 748 - - 916 202 - - - 53,669 10,107 - 2d.1.3 Totals 210 234 3 9 91 18 - 183 748 748 - - 916 202 - - - 53,669 10,107 -
2d.1.4 Scaffolding in support of decommissioning - 116 3 1 12 2 - 32 165 165 - - 108 10 - - - 5,505 3,526 -
2d.1 Subtotal Period 2d Activity Costs 836 651 202 131 268 1,229 - 968 4,285 4,285 - - 2,667 5,338 - - - 464,489 24,168 -
Period 2d Additional Costs2d.2.1 License Termination Survey Planning - - - - - - 553 166 719 719 - - - - - - - - - 4,160 2d.2.2 Remedial Action Surveys - - - - - - 537 161 698 698 - - - - - - - - 10,991 - 2d.2 Subtotal Period 2d Additional Costs - - - - - - 1,090 327 1,417 1,417 - - - - - - - - 10,991 4,160
Period 2d Collateral Costs2d.3.1 Process decommissioning water waste 31 - 16 83 - 97 - 54 282 282 - - - 232 - - - 13,908 45 - 2d.3.2 Process decommissioning chemical flush waste 1 - 30 204 - 328 - 116 679 679 - - - 443 - - - 47,232 83 - 2d.3.3 Small tool allowance - 23 - - - - - 3 27 27 - - - - - - - - - - 2d.3.4 Decommissioning Equipment Disposition - - 144 36 664 125 - 151 1,119 1,119 - - 6,000 529 - - - 304,968 88 - 2d.3.5 Spent Fuel Capital and Transfer - - - - - - 191 29 219 - 219 - - - - - - - - - 2d.3 Subtotal Period 2d Collateral Costs 32 23 190 323 664 550 191 353 2,325 2,106 219 - 6,000 1,204 - - - 366,108 216 -
Period 2d Period-Dependent Costs2d.4.1 Decon supplies 66 - - - - - - 17 83 83 - - - - - - - - - - 2d.4.2 Insurance - - - - - - 205 21 226 226 - - - - - - - - - - 2d.4.3 Property taxes - - - - - - 3 0 3 3 - - - - - - - - - - 2d.4.4 Health physics supplies - 381 - - - - - 95 477 477 - - - - - - - - - - 2d.4.5 Heavy equipment rental - 1,145 - - - - - 172 1,317 1,317 - - - - - - - - - - 2d.4.6 Disposal of DAW generated - - 19 3 - 42 - 13 75 75 - - - 851 - - - 17,017 28 - 2d.4.7 Plant energy budget - - - - - - 130 20 150 150 - - - - - - - - - - 2d.4.8 NRC Fees - - - - - - 281 28 309 309 - - - - - - - - - - 2d.4.9 Emergency Planning Fees - - - - - - 68 7 75 - 75 - - - - - - - - - 2d.4.10 Liquid Radwaste Processing Equipment/Services - - - - - - 210 31 241 241 - - - - - - - - - - 2d.4.11 Corporate A&G - - - - - - 702 105 807 807 - - - - - - - - - - 2d.4.12 Site O&M - - - - - - 68 10 78 78 - - - - - - - - - - 2d.4.13 Security Staff Cost - - - - - - 516 77 593 593 - - - - - - - - - 14,425 2d.4.14 Utility Staff Cost - - - - - - 7,117 1,068 8,185 8,185 - - - - - - - - - 117,454 2d.4 Subtotal Period 2d Period-Dependent Costs 66 1,527 19 3 - 42 9,301 1,664 12,620 12,545 75 - - 851 - - - 17,017 28 131,880
2d.0 TOTAL PERIOD 2d COST 935 2,201 410 457 932 1,820 10,582 3,311 20,648 20,353 294 - 8,667 7,393 - - - 847,615 35,403 136,040
PERIOD 2f - License Termination
Period 2f Direct Decommissioning Activities2f.1.1 ORISE confirmatory survey - - - - - - 161 48 209 209 - - - - - - - - - - 2f.1.2 Terminate license a 2f.1 Subtotal Period 2f Activity Costs - - - - - - 161 48 209 209 - - - - - - - - - -
Period 2f Additional Costs2f.2.1 License Termination Survey - - - - - - 5,857 1,757 7,614 7,614 - - - - - - - - 134,093 2,080 2f.2 Subtotal Period 2f Additional Costs - - - - - - 5,857 1,757 7,614 7,614 - - - - - - - - 134,093 2,080
Period 2f Collateral Costs2f.3.1 Staff relocation expenses - - - - - - 1,130 169 1,299 1,299 - - - - - - - - - - 2f.3 Subtotal Period 2f Collateral Costs - - - - - - 1,130 169 1,299 1,299 - - - - - - - - - -
Period 2f Period-Dependent Costs2f.4.1 Insurance - - - - - - 264 26 290 290 - - - - - - - - - - 2f.4.2 Property taxes - - - - - - 4 0 5 5 - - - - - - - - - - 2f.4.3 Health physics supplies - 657 - - - - - 164 822 822 - - - - - - - - - - 2f.4.4 Disposal of DAW generated - - 7 1 - 16 - 5 29 29 - - - 326 - - - 6,525 11 - 2f.4.5 Plant energy budget - - - - - - 93 14 107 107 - - - - - - - - - - 2f.4.6 NRC Fees - - - - - - 453 45 499 499 - - - - - - - - - - 2f.4.7 Emergency Planning Fees - - - - - - 98 10 107 - 107 - - - - - - - - - 2f.4.8 Corporate A&G - - - - - - 531 80 610 610 - - - - - - - - - - 2f.4.9 Site O&M - - - - - - 52 8 60 60 - - - - - - - - - - 2f.4.10 Security Staff Cost - - - - - - 723 108 831 831 - - - - - - - - - 20,161 2f.4.11 Utility Staff Cost - - - - - - 5,646 847 6,493 6,493 - - - - - - - - - 88,786
TLG Services, Inc.

Oconee Nuclear StationDecommissioning Cost Analysis
Document D03-1671-003, Rev. 0Appendix C, Page 8 of 27
Table C-1 Oconee Nuclear Station, Unit 1
DECON Decommissioning Cost Estimate(thousands of 2013 dollars)
Costs run: Wed, Oct 23, 2013 at 10:16:58 Off-Site LLRW NRC Spent Fuel Site Processed Burial Volumes Burial / Utility andActivity DECCER Version 2010.09.09i Decon Removal Packaging Transport Processing Disposal Other Total Total Lic. Term. Management Restoration Volume Class A Class B Class C GTCC Processed Craft ContractorIndex Activity Description Cost Cost Costs Costs Costs Costs Costs Contingency Costs Costs Costs Costs Cu. Feet Cu. Feet Cu. Feet Cu. Feet Cu. Feet Wt., Lbs. Manhours Manhours
2f.4 Subtotal Period 2f Period-Dependent Costs - 657 7 1 - 16 7,864 1,308 9,853 9,746 107 - - 326 - - - 6,525 11 108,947
2f.0 TOTAL PERIOD 2f COST - 657 7 1 - 16 15,011 3,282 18,975 18,868 107 - - 326 - - - 6,525 134,103 111,027
PERIOD 2 TOTALS 4,755 45,063 18,018 9,220 18,186 38,387 188,946 65,581 388,155 369,094 15,191 3,870 178,909 135,032 1,049 393 - 19,586,510 762,009 2,424,791
PERIOD 3b - Site Restoration
Period 3b Direct Decommissioning Activities
Demolition of Remaining Site Buildings3b.1.1.1 Reactor Building - 4,488 - - - - - 673 5,162 - - 5,162 - - - - - - 53,465 - 3b.1.1.2 Auxiliary Building - 930 - - - - - 140 1,070 - - 1,070 - - - - - - 12,013 - 3b.1.1.3 Turbine Building - 1,831 - - - - - 275 2,105 - - 2,105 - - - - - - 31,130 - 3b.1.1.4 Turbine Pedestal - 291 - - - - - 44 335 - - 335 - - - - - - 3,192 - 3b.1.1.5 Fuel Building - 712 - - - - - 107 819 - - 819 - - - - - - 9,163 - 3b.1.1 Totals - 8,252 - - - - - 1,238 9,490 - - 9,490 - - - - - - 108,963 -
Site Closeout Activities3b.1.2 Grade & landscape site - 73 - - - - - 11 84 - - 84 - - - - - - 150 - 3b.1.3 Final report to NRC - - - - - - 117 18 135 135 - - - - - - - - - 1,560 3b.1 Subtotal Period 3b Activity Costs - 8,326 - - - - 117 1,266 9,709 135 - 9,574 - - - - - - 109,113 1,560
Period 3b Additional Costs3b.2.1 Concrete Crushing - 285 - - - - 2 43 329 - - 329 - - - - - - 1,357 - 3b.2 Subtotal Period 3b Additional Costs - 285 - - - - 2 43 329 - - 329 - - - - - - 1,357 -
Period 3b Collateral Costs3b.3.1 Small tool allowance - 80 - - - - - 12 93 - - 93 - - - - - - - - 3b.3.2 Corporate A&G - - - - - - 1,044 157 1,200 - - 1,200 - - - - - - - - 3b.3.3 Site O&M - - - - - - 32 5 37 - - 37 - - - - - - - - 3b.3 Subtotal Period 3b Collateral Costs - 80 - - - - 1,076 173 1,330 - - 1,330 - - - - - - - -
Period 3b Period-Dependent Costs3b.4.1 Insurance - - - - - - 812 81 894 - 894 - - - - - - - - - 3b.4.2 Property taxes - - - - - - 14 1 15 - 15 - - - - - - - - - 3b.4.3 Heavy equipment rental - 7,180 - - - - - 1,077 8,257 - - 8,257 - - - - - - - - 3b.4.4 Plant energy budget - - - - - - 143 21 165 - - 165 - - - - - - - - 3b.4.5 Emergency Planning Fees - - - - - - 300 30 330 - 330 - - - - - - - - - 3b.4.6 Security Staff Cost - - - - - - 2,057 309 2,365 (0) 2,034 331 - - - - - - - 56,483 3b.4.7 Utility Staff Cost - - - - - - 10,785 1,618 12,403 0 1,488 10,914 - - - - - - - 174,627 3b.4 Subtotal Period 3b Period-Dependent Costs - 7,180 - - - - 14,112 3,137 24,429 0 4,762 19,667 - - - - - - - 231,110
3b.0 TOTAL PERIOD 3b COST - 15,870 - - - - 15,306 4,620 35,797 135 4,762 30,900 - - - - - - 110,470 232,670
PERIOD 3c - Fuel Storage Operations/Shipping
Period 3c Direct Decommissioning Activities
Period 3c Collateral Costs3c.3.1 Spent Fuel Capital and Transfer - - - - - - 2,587 388 2,975 - 2,975 - - - - - - - - - 3c.3 Subtotal Period 3c Collateral Costs - - - - - - 2,587 388 2,975 - 2,975 - - - - - - - - -
Period 3c Period-Dependent Costs3c.4.4 Emergency Planning Fees - - - - - - 1,342 134 1,476 - 1,476 - - - - - - - - - 3c.4 Subtotal Period 3c Period-Dependent Costs - - - - - - 1,342 134 1,476 - 1,476 - - - - - - - - -
3c.0 TOTAL PERIOD 3c COST - - - - - - 3,929 522 4,451 - 4,451 - - - - - - - - -
PERIOD 3d - GTCC shipping
Period 3d Direct Decommissioning Activities
Nuclear Steam Supply System Removal3d.1.1.1 Vessel & Internals GTCC Disposal - - 400 - - 9,711 - 1,497 11,607 11,607 - - - - - - 1,785 353,100 - - 3d.1.1 Totals - - 400 - - 9,711 - 1,497 11,607 11,607 - - - - - - 1,785 353,100 - - 3d.1 Subtotal Period 3d Activity Costs - - 400 - - 9,711 - 1,497 11,607 11,607 - - - - - - 1,785 353,100 - -
TLG Services, Inc.

Oconee Nuclear StationDecommissioning Cost Analysis
Document D03-1671-003, Rev. 0Appendix C, Page 9 of 27
Table C-1 Oconee Nuclear Station, Unit 1
DECON Decommissioning Cost Estimate(thousands of 2013 dollars)
Costs run: Wed, Oct 23, 2013 at 10:16:58 Off-Site LLRW NRC Spent Fuel Site Processed Burial Volumes Burial / Utility andActivity DECCER Version 2010.09.09i Decon Removal Packaging Transport Processing Disposal Other Total Total Lic. Term. Management Restoration Volume Class A Class B Class C GTCC Processed Craft ContractorIndex Activity Description Cost Cost Costs Costs Costs Costs Costs Contingency Costs Costs Costs Costs Cu. Feet Cu. Feet Cu. Feet Cu. Feet Cu. Feet Wt., Lbs. Manhours Manhours
Period 3d Period-Dependent Costs3d.4.4 Emergency Planning Fees - - - - - - 5 0 5 - 5 - - - - - - - - - 3d.4 Subtotal Period 3d Period-Dependent Costs - - - - - - 5 0 5 - 5 - - - - - - - - -
3d.0 TOTAL PERIOD 3d COST - - 400 - - 9,711 5 1,497 11,613 11,607 5 - - - - - 1,785 353,100 - -
PERIOD 3 TOTALS - 15,870 400 - - 9,711 19,240 6,639 51,860 11,742 9,219 30,900 - - - - 1,785 353,100 110,470 232,670
TOTAL COST TO DECOMMISSION 7,903 67,258 18,508 9,966 18,186 51,727 292,402 88,093 554,043 492,612 25,731 35,700 178,909 161,621 1,842 393 1,785 20,384,320 931,478 3,546,491
TOTAL COST TO DECOMMISSION WITH 18.91% CONTINGENCY: $554,043 thousands of 2013 dollars
TOTAL NRC LICENSE TERMINATION COST IS 88.91% OR: $492,612 thousands of 2013 dollars
SPENT FUEL MANAGEMENT COST IS 4.64% OR: $25,731 thousands of 2013 dollars
NON-NUCLEAR DEMOLITION COST IS 6.44% OR: $35,700 thousands of 2013 dollars
TOTAL LOW-LEVEL RADIOACTIVE WASTE VOLUME BURIED (EXCLUDING GTCC): 163,855 cubic feet
TOTAL GREATER THAN CLASS C RADWASTE VOLUME GENERATED: 1,785 cubic feet
TOTAL SCRAP METAL REMOVED: 43,692 tons
TOTAL CRAFT LABOR REQUIREMENTS: 931,478 man-hours
End Notes:n/a - indicates that this activity not charged as decommissioning expense.a - indicates that this activity performed by decommissioning staff.0 - indicates that this value is less than 0.5 but is non-zero.a cell containing " - " indicates a zero value
TLG Services, Inc.
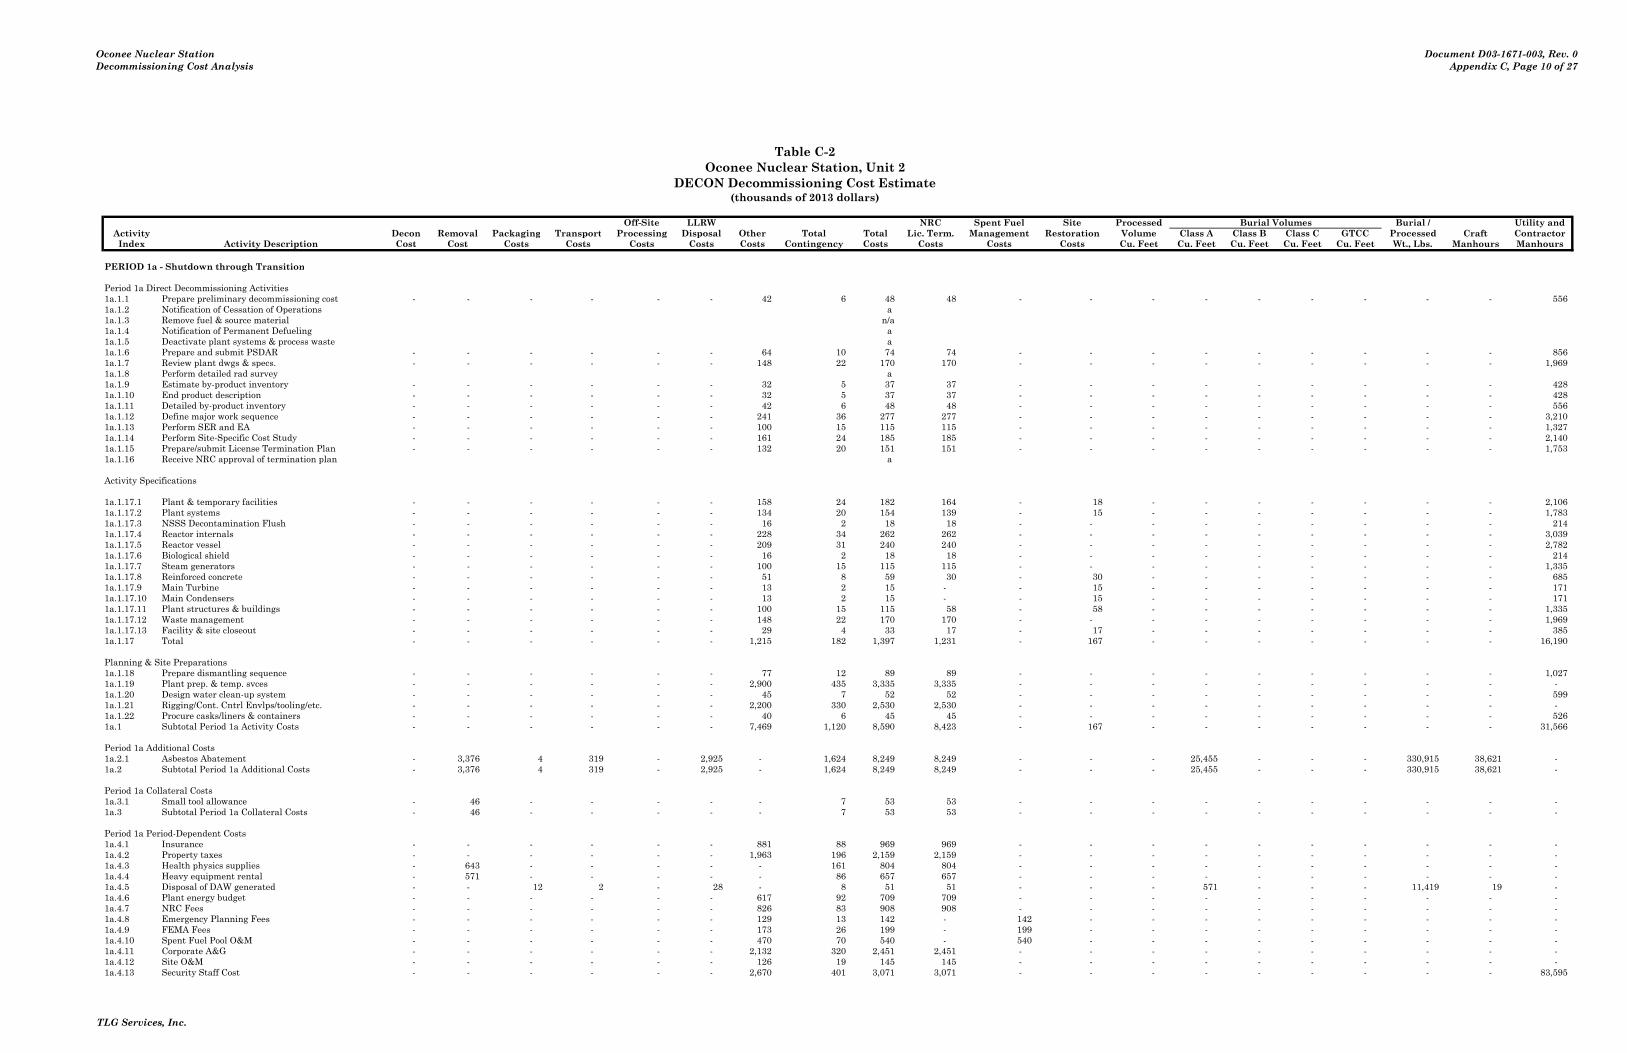
Oconee Nuclear StationDecommissioning Cost Analysis
Document D03-1671-003, Rev. 0Appendix C, Page 10 of 27
Table C-2Oconee Nuclear Station, Unit 2
DECON Decommissioning Cost Estimate(thousands of 2013 dollars)
Costs run: Wed, Oct 23, 2013 at 10:17:21 Off-Site LLRW NRC Spent Fuel Site Processed Burial Volumes Burial / Utility andActivity DECCER Version 2010.09.09i Decon Removal Packaging Transport Processing Disposal Other Total Total Lic. Term. Management Restoration Volume Class A Class B Class C GTCC Processed Craft ContractorIndex Activity Description Cost Cost Costs Costs Costs Costs Costs Contingency Costs Costs Costs Costs Cu. Feet Cu. Feet Cu. Feet Cu. Feet Cu. Feet Wt., Lbs. Manhours Manhours
PERIOD 1a - Shutdown through Transition
Period 1a Direct Decommissioning Activities1a.1.1 Prepare preliminary decommissioning cost - - - - - - 42 6 48 48 - - - - - - - - - 556 1a.1.2 Notification of Cessation of Operations a 1a.1.3 Remove fuel & source material n/a1a.1.4 Notification of Permanent Defueling a 1a.1.5 Deactivate plant systems & process waste a 1a.1.6 Prepare and submit PSDAR - - - - - - 64 10 74 74 - - - - - - - - - 856 1a.1.7 Review plant dwgs & specs. - - - - - - 148 22 170 170 - - - - - - - - - 1,969 1a.1.8 Perform detailed rad survey a 1a.1.9 Estimate by-product inventory - - - - - - 32 5 37 37 - - - - - - - - - 428 1a.1.10 End product description - - - - - - 32 5 37 37 - - - - - - - - - 428 1a.1.11 Detailed by-product inventory - - - - - - 42 6 48 48 - - - - - - - - - 556 1a.1.12 Define major work sequence - - - - - - 241 36 277 277 - - - - - - - - - 3,210 1a.1.13 Perform SER and EA - - - - - - 100 15 115 115 - - - - - - - - - 1,327 1a.1.14 Perform Site-Specific Cost Study - - - - - - 161 24 185 185 - - - - - - - - - 2,140 1a.1.15 Prepare/submit License Termination Plan - - - - - - 132 20 151 151 - - - - - - - - - 1,753 1a.1.16 Receive NRC approval of termination plan a
Activity Specifications
1a.1.17.1 Plant & temporary facilities - - - - - - 158 24 182 164 - 18 - - - - - - - 2,106 1a.1.17.2 Plant systems - - - - - - 134 20 154 139 - 15 - - - - - - - 1,783 1a.1.17.3 NSSS Decontamination Flush - - - - - - 16 2 18 18 - - - - - - - - - 214 1a.1.17.4 Reactor internals - - - - - - 228 34 262 262 - - - - - - - - - 3,039 1a.1.17.5 Reactor vessel - - - - - - 209 31 240 240 - - - - - - - - - 2,782 1a.1.17.6 Biological shield - - - - - - 16 2 18 18 - - - - - - - - - 214 1a.1.17.7 Steam generators - - - - - - 100 15 115 115 - - - - - - - - - 1,335 1a.1.17.8 Reinforced concrete - - - - - - 51 8 59 30 - 30 - - - - - - - 685 1a.1.17.9 Main Turbine - - - - - - 13 2 15 - - 15 - - - - - - - 171 1a.1.17.10 Main Condensers - - - - - - 13 2 15 - - 15 - - - - - - - 171 1a.1.17.11 Plant structures & buildings - - - - - - 100 15 115 58 - 58 - - - - - - - 1,335 1a.1.17.12 Waste management - - - - - - 148 22 170 170 - - - - - - - - - 1,969 1a.1.17.13 Facility & site closeout - - - - - - 29 4 33 17 - 17 - - - - - - - 385 1a.1.17 Total - - - - - - 1,215 182 1,397 1,231 - 167 - - - - - - - 16,190
Planning & Site Preparations1a.1.18 Prepare dismantling sequence - - - - - - 77 12 89 89 - - - - - - - - - 1,027 1a.1.19 Plant prep. & temp. svces - - - - - - 2,900 435 3,335 3,335 - - - - - - - - - - 1a.1.20 Design water clean-up system - - - - - - 45 7 52 52 - - - - - - - - - 599 1a.1.21 Rigging/Cont. Cntrl Envlps/tooling/etc. - - - - - - 2,200 330 2,530 2,530 - - - - - - - - - - 1a.1.22 Procure casks/liners & containers - - - - - - 40 6 45 45 - - - - - - - - - 526 1a.1 Subtotal Period 1a Activity Costs - - - - - - 7,469 1,120 8,590 8,423 - 167 - - - - - - - 31,566
Period 1a Additional Costs1a.2.1 Asbestos Abatement - 3,376 4 319 - 2,925 - 1,624 8,249 8,249 - - - 25,455 - - - 330,915 38,621 - 1a.2 Subtotal Period 1a Additional Costs - 3,376 4 319 - 2,925 - 1,624 8,249 8,249 - - - 25,455 - - - 330,915 38,621 -
Period 1a Collateral Costs1a.3.1 Small tool allowance - 46 - - - - - 7 53 53 - - - - - - - - - - 1a.3 Subtotal Period 1a Collateral Costs - 46 - - - - - 7 53 53 - - - - - - - - - -
Period 1a Period-Dependent Costs1a.4.1 Insurance - - - - - - 881 88 969 969 - - - - - - - - - - 1a.4.2 Property taxes - - - - - - 1,963 196 2,159 2,159 - - - - - - - - - - 1a.4.3 Health physics supplies - 643 - - - - - 161 804 804 - - - - - - - - - - 1a.4.4 Heavy equipment rental - 571 - - - - - 86 657 657 - - - - - - - - - - 1a.4.5 Disposal of DAW generated - - 12 2 - 28 - 8 51 51 - - - 571 - - - 11,419 19 - 1a.4.6 Plant energy budget - - - - - - 617 92 709 709 - - - - - - - - - - 1a.4.7 NRC Fees - - - - - - 826 83 908 908 - - - - - - - - - - 1a.4.8 Emergency Planning Fees - - - - - - 129 13 142 - 142 - - - - - - - - - 1a.4.9 FEMA Fees - - - - - - 173 26 199 - 199 - - - - - - - - - 1a.4.10 Spent Fuel Pool O&M - - - - - - 470 70 540 - 540 - - - - - - - - - 1a.4.11 Corporate A&G - - - - - - 2,132 320 2,451 2,451 - - - - - - - - - - 1a.4.12 Site O&M - - - - - - 126 19 145 145 - - - - - - - - - - 1a.4.13 Security Staff Cost - - - - - - 2,670 401 3,071 3,071 - - - - - - - - - 83,595
TLG Services, Inc.

Oconee Nuclear StationDecommissioning Cost Analysis
Document D03-1671-003, Rev. 0Appendix C, Page 11 of 27
Table C-2Oconee Nuclear Station, Unit 2
DECON Decommissioning Cost Estimate(thousands of 2013 dollars)
Costs run: Wed, Oct 23, 2013 at 10:17:21 Off-Site LLRW NRC Spent Fuel Site Processed Burial Volumes Burial / Utility andActivity DECCER Version 2010.09.09i Decon Removal Packaging Transport Processing Disposal Other Total Total Lic. Term. Management Restoration Volume Class A Class B Class C GTCC Processed Craft ContractorIndex Activity Description Cost Cost Costs Costs Costs Costs Costs Contingency Costs Costs Costs Costs Cu. Feet Cu. Feet Cu. Feet Cu. Feet Cu. Feet Wt., Lbs. Manhours Manhours
Period 1a Period-Dependent Costs (continued)1a.4.14 Utility Staff Cost - - - - - - 20,675 3,101 23,777 23,777 - - - - - - - - - 356,657 1a.4 Subtotal Period 1a Period-Dependent Costs - 1,214 12 2 - 28 30,661 4,664 36,582 35,700 882 - - 571 - - - 11,419 19 440,253
1a.0 TOTAL PERIOD 1a COST - 4,637 16 321 - 2,953 38,131 7,415 53,473 52,425 882 167 - 26,026 - - - 342,334 38,639 471,819
PERIOD 1b - Decommissioning Preparations
Period 1b Direct Decommissioning Activities
Detailed Work Procedures1b.1.1.1 Plant systems - - - - - - 152 23 175 157 - 17 - - - - - - - 2,026 1b.1.1.2 NSSS Decontamination Flush - - - - - - 32 5 37 37 - - - - - - - - - 428 1b.1.1.3 Reactor internals - - - - - - 80 12 92 92 - - - - - - - - - 1,070 1b.1.1.4 Remaining buildings - - - - - - 43 7 50 12 - 37 - - - - - - - 578 1b.1.1.5 CRD cooling assembly - - - - - - 32 5 37 37 - - - - - - - - - 428 1b.1.1.6 CRD housings & ICI tubes - - - - - - 32 5 37 37 - - - - - - - - - 428 1b.1.1.7 Incore instrumentation - - - - - - 32 5 37 37 - - - - - - - - - 428 1b.1.1.8 Reactor vessel - - - - - - 117 17 134 134 - - - - - - - - - 1,554 1b.1.1.9 Facility closeout - - - - - - 39 6 44 22 - 22 - - - - - - - 514 1b.1.1.10 Missile shields - - - - - - 14 2 17 17 - - - - - - - - - 193 1b.1.1.11 Biological shield - - - - - - 39 6 44 44 - - - - - - - - - 514 1b.1.1.12 Steam generators - - - - - - 148 22 170 170 - - - - - - - - - 1,969 1b.1.1.13 Reinforced concrete - - - - - - 32 5 37 18 - 18 - - - - - - - 428 1b.1.1.14 Main Turbine - - - - - - 50 8 58 - - 58 - - - - - - - 668 1b.1.1.15 Main Condensers - - - - - - 50 8 58 - - 58 - - - - - - - 668 1b.1.1.16 Auxiliary building - - - - - - 88 13 101 91 - 10 - - - - - - - 1,168 1b.1.1.17 Reactor building - - - - - - 88 13 101 91 - 10 - - - - - - - 1,168 1b.1.1 Total - - - - - - 1,068 160 1,228 997 - 231 - - - - - - - 14,228
1b.1.2 Decon primary loop 646 - - - - - - 323 969 969 - - - - - - - - 1,067 - 1b.1 Subtotal Period 1b Activity Costs 646 - - - - - 1,068 483 2,197 1,966 - 231 - - - - - - 1,067 14,228
Period 1b Additional Costs1b.2.1 Spent fuel pool isolation - - - - - - 7,040 1,056 8,096 8,096 - - - - - - - - - - 1b.2.2 Site Characterization - - - - - - 1,192 358 1,550 1,550 - - - - - - - - 8,167 3,357 1b.2 Subtotal Period 1b Additional Costs - - - - - - 8,233 1,414 9,646 9,646 - - - - - - - - 8,167 3,357
Period 1b Collateral Costs1b.3.1 Decon equipment 946 - - - - - - 142 1,087 1,087 - - - - - - - - - - 1b.3.2 Staff relocation expenses - - - - - - 1,130 169 1,299 1,299 - - - - - - - - - - 1b.3.3 Process decommissioning water waste 26 - 12 59 - 69 - 40 206 206 - - - 165 - - - 9,880 32 - 1b.3.4 Process decommissioning chemical flush waste 2 - 54 365 - 588 - 208 1,216 1,216 - - - - 793 - - 84,540 148 - 1b.3.5 Small tool allowance - 1 - - - - - 0 2 2 - - - - - - - - - - 1b.3.6 Pipe cutting equipment - 1,100 - - - - - 165 1,265 1,265 - - - - - - - - - - 1b.3.7 Decon rig 1,500 - - - - - - 225 1,725 1,725 - - - - - - - - - - 1b.3.8 Spent Fuel Capital and Transfer - - - - - - 142 21 164 - 164 - - - - - - - - - 1b.3 Subtotal Period 1b Collateral Costs 2,473 1,101 65 424 - 656 1,272 971 6,963 6,800 164 - - 165 793 - - 94,421 181 -
Period 1b Period-Dependent Costs1b.4.1 Decon supplies 29 - - - - - - 7 36 36 - - - - - - - - - - 1b.4.2 Insurance - - - - - - 439 44 483 483 - - - - - - - - - - 1b.4.3 Property taxes - - - - - - 807 81 888 888 - - - - - - - - - - 1b.4.4 Health physics supplies - 253 - - - - - 63 317 317 - - - - - - - - - - 1b.4.5 Heavy equipment rental - 285 - - - - - 43 327 327 - - - - - - - - - - 1b.4.6 Disposal of DAW generated - - 7 1 - 16 - 5 29 29 - - - 322 - - - 6,449 11 - 1b.4.7 Plant energy budget - - - - - - 615 92 707 707 - - - - - - - - - - 1b.4.8 NRC Fees - - - - - - 233 23 256 256 - - - - - - - - - - 1b.4.9 Emergency Planning Fees - - - - - - 65 6 71 - 71 - - - - - - - - - 1b.4.10 FEMA Fees - - - - - - 86 13 99 - 99 - - - - - - - - - 1b.4.11 Spent Fuel Pool O&M - - - - - - 234 35 269 - 269 - - - - - - - - - 1b.4.12 Corporate A&G - - - - - - 1,299 195 1,494 1,494 - - - - - - - - - - 1b.4.13 Site O&M - - - - - - 77 12 89 89 - - - - - - - - - - 1b.4.14 Security Staff Cost - - - - - - 1,331 200 1,531 1,531 - - - - - - - - - 41,683 1b.4.15 Utility Staff Cost - - - - - - 12,848 1,927 14,776 14,776 - - - - - - - - - 217,360 1b.4 Subtotal Period 1b Period-Dependent Costs 29 538 7 1 - 16 18,035 2,746 21,372 20,933 440 - - 322 - - - 6,449 11 259,043
TLG Services, Inc.
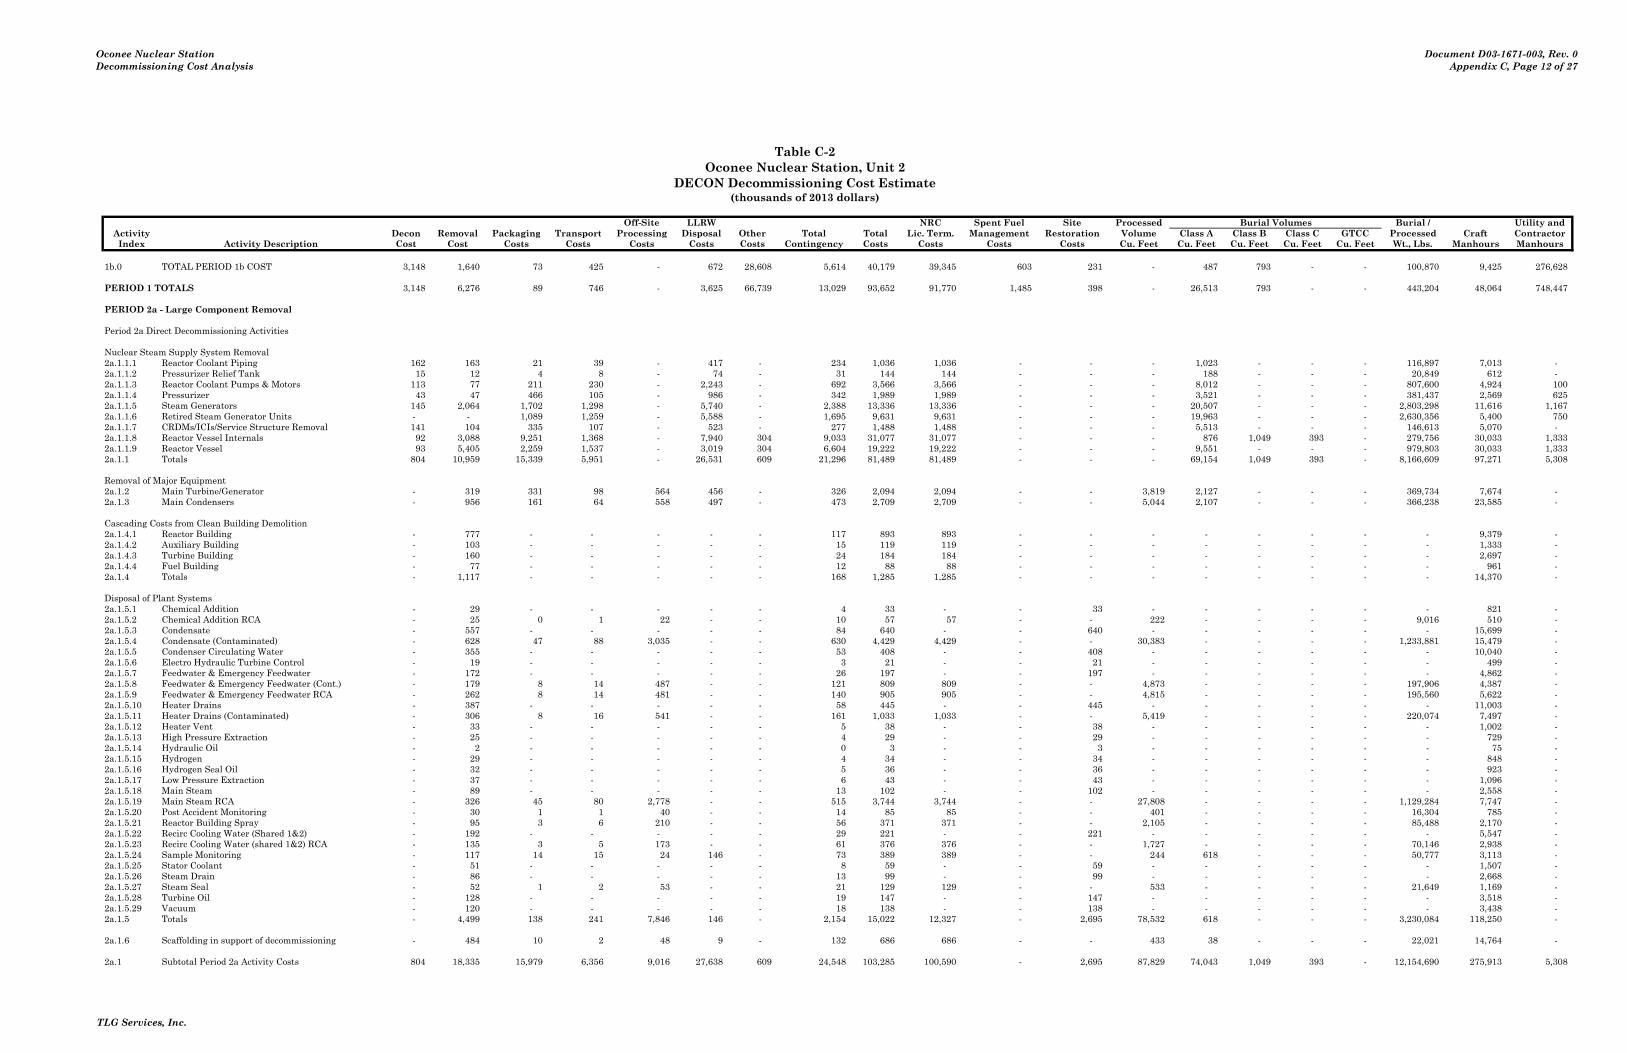
Oconee Nuclear StationDecommissioning Cost Analysis
Document D03-1671-003, Rev. 0Appendix C, Page 12 of 27
Table C-2Oconee Nuclear Station, Unit 2
DECON Decommissioning Cost Estimate(thousands of 2013 dollars)
Costs run: Wed, Oct 23, 2013 at 10:17:21 Off-Site LLRW NRC Spent Fuel Site Processed Burial Volumes Burial / Utility andActivity DECCER Version 2010.09.09i Decon Removal Packaging Transport Processing Disposal Other Total Total Lic. Term. Management Restoration Volume Class A Class B Class C GTCC Processed Craft ContractorIndex Activity Description Cost Cost Costs Costs Costs Costs Costs Contingency Costs Costs Costs Costs Cu. Feet Cu. Feet Cu. Feet Cu. Feet Cu. Feet Wt., Lbs. Manhours Manhours
1b.0 TOTAL PERIOD 1b COST 3,148 1,640 73 425 - 672 28,608 5,614 40,179 39,345 603 231 - 487 793 - - 100,870 9,425 276,628
PERIOD 1 TOTALS 3,148 6,276 89 746 - 3,625 66,739 13,029 93,652 91,770 1,485 398 - 26,513 793 - - 443,204 48,064 748,447
PERIOD 2a - Large Component Removal
Period 2a Direct Decommissioning Activities
Nuclear Steam Supply System Removal2a.1.1.1 Reactor Coolant Piping 162 163 21 39 - 417 - 234 1,036 1,036 - - - 1,023 - - - 116,897 7,013 - 2a.1.1.2 Pressurizer Relief Tank 15 12 4 8 - 74 - 31 144 144 - - - 188 - - - 20,849 612 - 2a.1.1.3 Reactor Coolant Pumps & Motors 113 77 211 230 - 2,243 - 692 3,566 3,566 - - - 8,012 - - - 807,600 4,924 100 2a.1.1.4 Pressurizer 43 47 466 105 - 986 - 342 1,989 1,989 - - - 3,521 - - - 381,437 2,569 625 2a.1.1.5 Steam Generators 145 2,064 1,702 1,298 - 5,740 - 2,388 13,336 13,336 - - - 20,507 - - - 2,803,298 11,616 1,167 2a.1.1.6 Retired Steam Generator Units - - 1,089 1,259 - 5,588 - 1,695 9,631 9,631 - - - 19,963 - - - 2,630,356 5,400 750 2a.1.1.7 CRDMs/ICIs/Service Structure Removal 141 104 335 107 - 523 - 277 1,488 1,488 - - - 5,513 - - - 146,613 5,070 - 2a.1.1.8 Reactor Vessel Internals 92 3,088 9,251 1,368 - 7,940 304 9,033 31,077 31,077 - - - 876 1,049 393 - 279,756 30,033 1,333 2a.1.1.9 Reactor Vessel 93 5,405 2,259 1,537 - 3,019 304 6,604 19,222 19,222 - - - 9,551 - - - 979,803 30,033 1,333 2a.1.1 Totals 804 10,959 15,339 5,951 - 26,531 609 21,296 81,489 81,489 - - - 69,154 1,049 393 - 8,166,609 97,271 5,308
Removal of Major Equipment2a.1.2 Main Turbine/Generator - 319 331 98 564 456 - 326 2,094 2,094 - - 3,819 2,127 - - - 369,734 7,674 - 2a.1.3 Main Condensers - 956 161 64 558 497 - 473 2,709 2,709 - - 5,044 2,107 - - - 366,238 23,585 -
Cascading Costs from Clean Building Demolition2a.1.4.1 Reactor Building - 777 - - - - - 117 893 893 - - - - - - - - 9,379 - 2a.1.4.2 Auxiliary Building - 103 - - - - - 15 119 119 - - - - - - - - 1,333 - 2a.1.4.3 Turbine Building - 160 - - - - - 24 184 184 - - - - - - - - 2,697 - 2a.1.4.4 Fuel Building - 77 - - - - - 12 88 88 - - - - - - - - 961 - 2a.1.4 Totals - 1,117 - - - - - 168 1,285 1,285 - - - - - - - - 14,370 -
Disposal of Plant Systems2a.1.5.1 Chemical Addition - 29 - - - - - 4 33 - - 33 - - - - - - 821 - 2a.1.5.2 Chemical Addition RCA - 25 0 1 22 - - 10 57 57 - - 222 - - - - 9,016 510 - 2a.1.5.3 Condensate - 557 - - - - - 84 640 - - 640 - - - - - - 15,699 - 2a.1.5.4 Condensate (Contaminated) - 628 47 88 3,035 - - 630 4,429 4,429 - - 30,383 - - - - 1,233,881 15,479 - 2a.1.5.5 Condenser Circulating Water - 355 - - - - - 53 408 - - 408 - - - - - - 10,040 - 2a.1.5.6 Electro Hydraulic Turbine Control - 19 - - - - - 3 21 - - 21 - - - - - - 499 - 2a.1.5.7 Feedwater & Emergency Feedwater - 172 - - - - - 26 197 - - 197 - - - - - - 4,862 - 2a.1.5.8 Feedwater & Emergency Feedwater (Cont.) - 179 8 14 487 - - 121 809 809 - - 4,873 - - - - 197,906 4,387 - 2a.1.5.9 Feedwater & Emergency Feedwater RCA - 262 8 14 481 - - 140 905 905 - - 4,815 - - - - 195,560 5,622 - 2a.1.5.10 Heater Drains - 387 - - - - - 58 445 - - 445 - - - - - - 11,003 - 2a.1.5.11 Heater Drains (Contaminated) - 306 8 16 541 - - 161 1,033 1,033 - - 5,419 - - - - 220,074 7,497 - 2a.1.5.12 Heater Vent - 33 - - - - - 5 38 - - 38 - - - - - - 1,002 - 2a.1.5.13 High Pressure Extraction - 25 - - - - - 4 29 - - 29 - - - - - - 729 - 2a.1.5.14 Hydraulic Oil - 2 - - - - - 0 3 - - 3 - - - - - - 75 - 2a.1.5.15 Hydrogen - 29 - - - - - 4 34 - - 34 - - - - - - 848 - 2a.1.5.16 Hydrogen Seal Oil - 32 - - - - - 5 36 - - 36 - - - - - - 923 - 2a.1.5.17 Low Pressure Extraction - 37 - - - - - 6 43 - - 43 - - - - - - 1,096 - 2a.1.5.18 Main Steam - 89 - - - - - 13 102 - - 102 - - - - - - 2,558 - 2a.1.5.19 Main Steam RCA - 326 45 80 2,778 - - 515 3,744 3,744 - - 27,808 - - - - 1,129,284 7,747 - 2a.1.5.20 Post Accident Monitoring - 30 1 1 40 - - 14 85 85 - - 401 - - - - 16,304 785 - 2a.1.5.21 Reactor Building Spray - 95 3 6 210 - - 56 371 371 - - 2,105 - - - - 85,488 2,170 - 2a.1.5.22 Recirc Cooling Water (Shared 1&2) - 192 - - - - - 29 221 - - 221 - - - - - - 5,547 - 2a.1.5.23 Recirc Cooling Water (shared 1&2) RCA - 135 3 5 173 - - 61 376 376 - - 1,727 - - - - 70,146 2,938 - 2a.1.5.24 Sample Monitoring - 117 14 15 24 146 - 73 389 389 - - 244 618 - - - 50,777 3,113 - 2a.1.5.25 Stator Coolant - 51 - - - - - 8 59 - - 59 - - - - - - 1,507 - 2a.1.5.26 Steam Drain - 86 - - - - - 13 99 - - 99 - - - - - - 2,668 - 2a.1.5.27 Steam Seal - 52 1 2 53 - - 21 129 129 - - 533 - - - - 21,649 1,169 - 2a.1.5.28 Turbine Oil - 128 - - - - - 19 147 - - 147 - - - - - - 3,518 - 2a.1.5.29 Vacuum - 120 - - - - - 18 138 - - 138 - - - - - - 3,438 - 2a.1.5 Totals - 4,499 138 241 7,846 146 - 2,154 15,022 12,327 - 2,695 78,532 618 - - - 3,230,084 118,250 -
2a.1.6 Scaffolding in support of decommissioning - 484 10 2 48 9 - 132 686 686 - - 433 38 - - - 22,021 14,764 -
2a.1 Subtotal Period 2a Activity Costs 804 18,335 15,979 6,356 9,016 27,638 609 24,548 103,285 100,590 - 2,695 87,829 74,043 1,049 393 - 12,154,690 275,913 5,308
TLG Services, Inc.
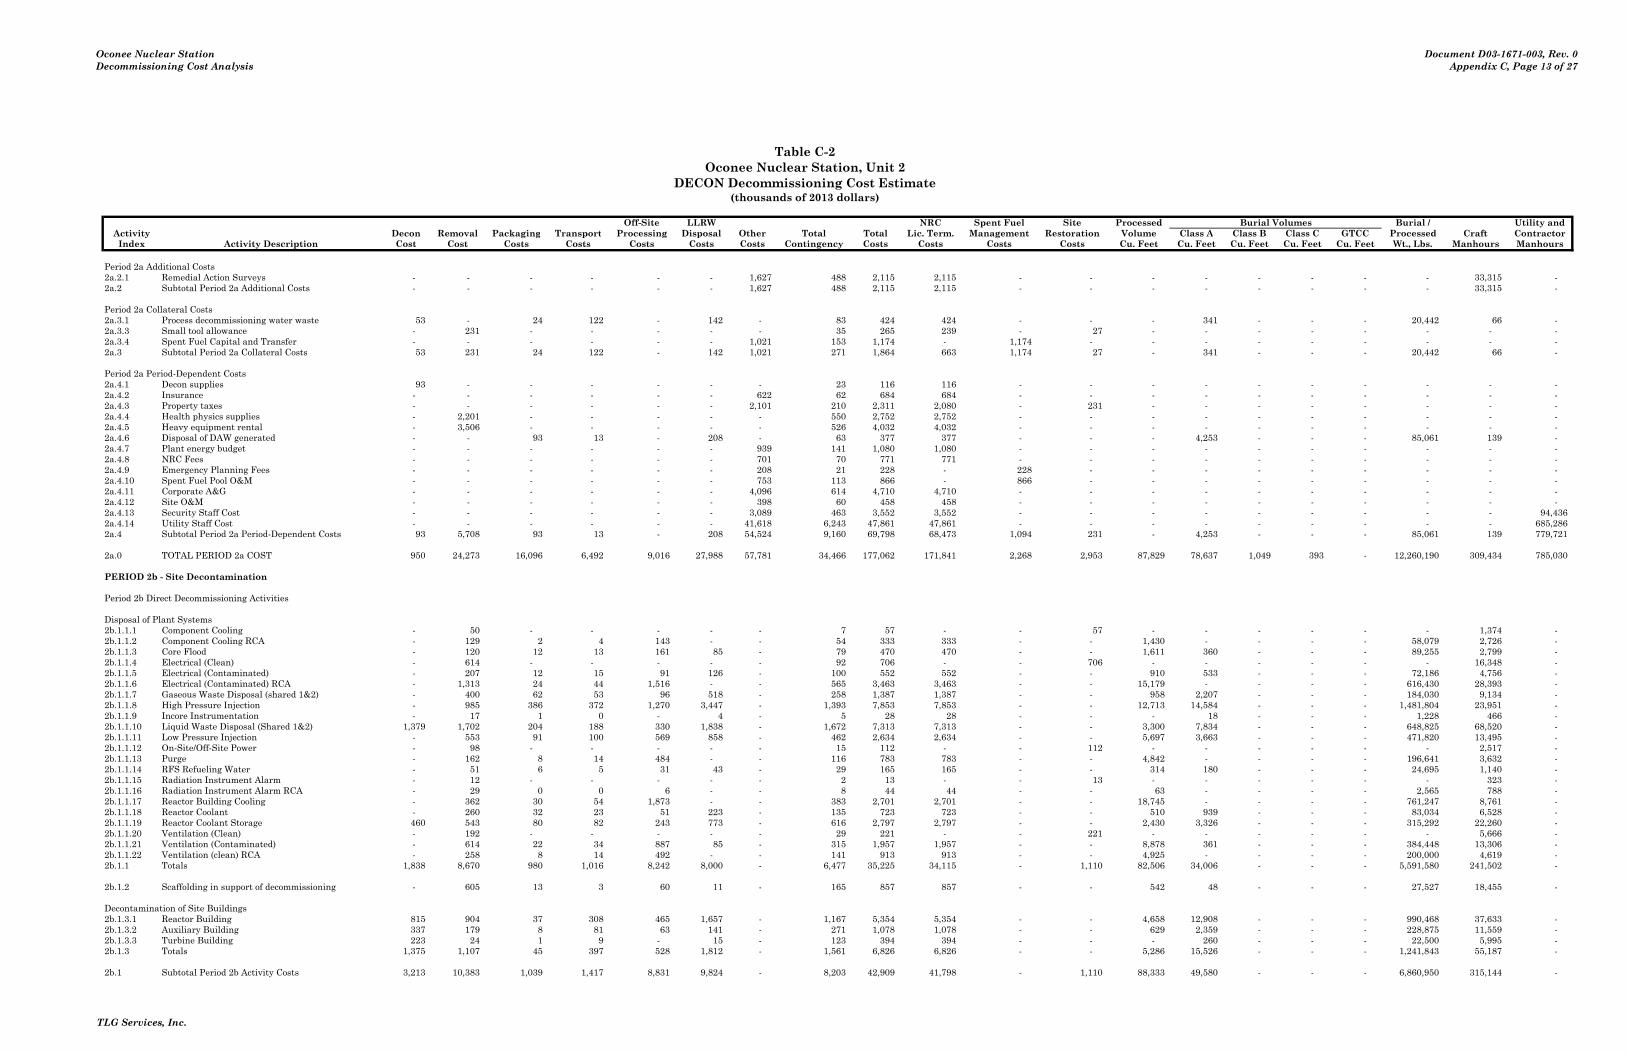
Oconee Nuclear StationDecommissioning Cost Analysis
Document D03-1671-003, Rev. 0Appendix C, Page 13 of 27
Table C-2Oconee Nuclear Station, Unit 2
DECON Decommissioning Cost Estimate(thousands of 2013 dollars)
Costs run: Wed, Oct 23, 2013 at 10:17:21 Off-Site LLRW NRC Spent Fuel Site Processed Burial Volumes Burial / Utility andActivity DECCER Version 2010.09.09i Decon Removal Packaging Transport Processing Disposal Other Total Total Lic. Term. Management Restoration Volume Class A Class B Class C GTCC Processed Craft ContractorIndex Activity Description Cost Cost Costs Costs Costs Costs Costs Contingency Costs Costs Costs Costs Cu. Feet Cu. Feet Cu. Feet Cu. Feet Cu. Feet Wt., Lbs. Manhours Manhours
Period 2a Additional Costs2a.2.1 Remedial Action Surveys - - - - - - 1,627 488 2,115 2,115 - - - - - - - - 33,315 - 2a.2 Subtotal Period 2a Additional Costs - - - - - - 1,627 488 2,115 2,115 - - - - - - - - 33,315 -
Period 2a Collateral Costs2a.3.1 Process decommissioning water waste 53 - 24 122 - 142 - 83 424 424 - - - 341 - - - 20,442 66 - 2a.3.3 Small tool allowance - 231 - - - - - 35 265 239 - 27 - - - - - - - - 2a.3.4 Spent Fuel Capital and Transfer - - - - - - 1,021 153 1,174 - 1,174 - - - - - - - - - 2a.3 Subtotal Period 2a Collateral Costs 53 231 24 122 - 142 1,021 271 1,864 663 1,174 27 - 341 - - - 20,442 66 -
Period 2a Period-Dependent Costs2a.4.1 Decon supplies 93 - - - - - - 23 116 116 - - - - - - - - - - 2a.4.2 Insurance - - - - - - 622 62 684 684 - - - - - - - - - - 2a.4.3 Property taxes - - - - - - 2,101 210 2,311 2,080 - 231 - - - - - - - - 2a.4.4 Health physics supplies - 2,201 - - - - - 550 2,752 2,752 - - - - - - - - - - 2a.4.5 Heavy equipment rental - 3,506 - - - - - 526 4,032 4,032 - - - - - - - - - - 2a.4.6 Disposal of DAW generated - - 93 13 - 208 - 63 377 377 - - - 4,253 - - - 85,061 139 - 2a.4.7 Plant energy budget - - - - - - 939 141 1,080 1,080 - - - - - - - - - - 2a.4.8 NRC Fees - - - - - - 701 70 771 771 - - - - - - - - - - 2a.4.9 Emergency Planning Fees - - - - - - 208 21 228 - 228 - - - - - - - - - 2a.4.10 Spent Fuel Pool O&M - - - - - - 753 113 866 - 866 - - - - - - - - - 2a.4.11 Corporate A&G - - - - - - 4,096 614 4,710 4,710 - - - - - - - - - - 2a.4.12 Site O&M - - - - - - 398 60 458 458 - - - - - - - - - - 2a.4.13 Security Staff Cost - - - - - - 3,089 463 3,552 3,552 - - - - - - - - - 94,436 2a.4.14 Utility Staff Cost - - - - - - 41,618 6,243 47,861 47,861 - - - - - - - - - 685,286 2a.4 Subtotal Period 2a Period-Dependent Costs 93 5,708 93 13 - 208 54,524 9,160 69,798 68,473 1,094 231 - 4,253 - - - 85,061 139 779,721
2a.0 TOTAL PERIOD 2a COST 950 24,273 16,096 6,492 9,016 27,988 57,781 34,466 177,062 171,841 2,268 2,953 87,829 78,637 1,049 393 - 12,260,190 309,434 785,030
PERIOD 2b - Site Decontamination
Period 2b Direct Decommissioning Activities
Disposal of Plant Systems2b.1.1.1 Component Cooling - 50 - - - - - 7 57 - - 57 - - - - - - 1,374 - 2b.1.1.2 Component Cooling RCA - 129 2 4 143 - - 54 333 333 - - 1,430 - - - - 58,079 2,726 - 2b.1.1.3 Core Flood - 120 12 13 161 85 - 79 470 470 - - 1,611 360 - - - 89,255 2,799 - 2b.1.1.4 Electrical (Clean) - 614 - - - - - 92 706 - - 706 - - - - - - 16,348 - 2b.1.1.5 Electrical (Contaminated) - 207 12 15 91 126 - 100 552 552 - - 910 533 - - - 72,186 4,756 - 2b.1.1.6 Electrical (Contaminated) RCA - 1,313 24 44 1,516 - - 565 3,463 3,463 - - 15,179 - - - - 616,430 28,393 - 2b.1.1.7 Gaseous Waste Disposal (shared 1&2) - 400 62 53 96 518 - 258 1,387 1,387 - - 958 2,207 - - - 184,030 9,134 - 2b.1.1.8 High Pressure Injection - 985 386 372 1,270 3,447 - 1,393 7,853 7,853 - - 12,713 14,584 - - - 1,481,804 23,951 - 2b.1.1.9 Incore Instrumentation - 17 1 0 - 4 - 5 28 28 - - - 18 - - - 1,228 466 - 2b.1.1.10 Liquid Waste Disposal (Shared 1&2) 1,379 1,702 204 188 330 1,838 - 1,672 7,313 7,313 - - 3,300 7,834 - - - 648,825 68,520 - 2b.1.1.11 Low Pressure Injection - 553 91 100 569 858 - 462 2,634 2,634 - - 5,697 3,663 - - - 471,820 13,495 - 2b.1.1.12 On-Site/Off-Site Power - 98 - - - - - 15 112 - - 112 - - - - - - 2,517 - 2b.1.1.13 Purge - 162 8 14 484 - - 116 783 783 - - 4,842 - - - - 196,641 3,632 - 2b.1.1.14 RFS Refueling Water - 51 6 5 31 43 - 29 165 165 - - 314 180 - - - 24,695 1,140 - 2b.1.1.15 Radiation Instrument Alarm - 12 - - - - - 2 13 - - 13 - - - - - - 323 - 2b.1.1.16 Radiation Instrument Alarm RCA - 29 0 0 6 - - 8 44 44 - - 63 - - - - 2,565 788 - 2b.1.1.17 Reactor Building Cooling - 362 30 54 1,873 - - 383 2,701 2,701 - - 18,745 - - - - 761,247 8,761 - 2b.1.1.18 Reactor Coolant - 260 32 23 51 223 - 135 723 723 - - 510 939 - - - 83,034 6,528 - 2b.1.1.19 Reactor Coolant Storage 460 543 80 82 243 773 - 616 2,797 2,797 - - 2,430 3,326 - - - 315,292 22,260 - 2b.1.1.20 Ventilation (Clean) - 192 - - - - - 29 221 - - 221 - - - - - - 5,666 - 2b.1.1.21 Ventilation (Contaminated) - 614 22 34 887 85 - 315 1,957 1,957 - - 8,878 361 - - - 384,448 13,306 - 2b.1.1.22 Ventilation (clean) RCA - 258 8 14 492 - - 141 913 913 - - 4,925 - - - - 200,000 4,619 - 2b.1.1 Totals 1,838 8,670 980 1,016 8,242 8,000 - 6,477 35,225 34,115 - 1,110 82,506 34,006 - - - 5,591,580 241,502 -
2b.1.2 Scaffolding in support of decommissioning - 605 13 3 60 11 - 165 857 857 - - 542 48 - - - 27,527 18,455 -
Decontamination of Site Buildings2b.1.3.1 Reactor Building 815 904 37 308 465 1,657 - 1,167 5,354 5,354 - - 4,658 12,908 - - - 990,468 37,633 - 2b.1.3.2 Auxiliary Building 337 179 8 81 63 141 - 271 1,078 1,078 - - 629 2,359 - - - 228,875 11,559 - 2b.1.3.3 Turbine Building 223 24 1 9 - 15 - 123 394 394 - - - 260 - - - 22,500 5,995 - 2b.1.3 Totals 1,375 1,107 45 397 528 1,812 - 1,561 6,826 6,826 - - 5,286 15,526 - - - 1,241,843 55,187 -
2b.1 Subtotal Period 2b Activity Costs 3,213 10,383 1,039 1,417 8,831 9,824 - 8,203 42,909 41,798 - 1,110 88,333 49,580 - - - 6,860,950 315,144 -
TLG Services, Inc.

Oconee Nuclear StationDecommissioning Cost Analysis
Document D03-1671-003, Rev. 0Appendix C, Page 14 of 27
Table C-2Oconee Nuclear Station, Unit 2
DECON Decommissioning Cost Estimate(thousands of 2013 dollars)
Costs run: Wed, Oct 23, 2013 at 10:17:21 Off-Site LLRW NRC Spent Fuel Site Processed Burial Volumes Burial / Utility andActivity DECCER Version 2010.09.09i Decon Removal Packaging Transport Processing Disposal Other Total Total Lic. Term. Management Restoration Volume Class A Class B Class C GTCC Processed Craft ContractorIndex Activity Description Cost Cost Costs Costs Costs Costs Costs Contingency Costs Costs Costs Costs Cu. Feet Cu. Feet Cu. Feet Cu. Feet Cu. Feet Wt., Lbs. Manhours Manhours
Period 2b Additional Costs2b.2.1 Containment Paint Remediation 79 - 9 14 - 105 - 69 275 275 - - - 452 - - - - 800 - 2b.2.2 Remedial Action Surveys - - - - - - 2,439 732 3,171 3,171 - - - - - - - - 49,937 - 2b.2.3 RX Closure Head Disposal - 117 551 795 - 785 - 400 2,647 2,647 - - - 3,050 - - - 354,825 3,761 2,000 2b.2 Subtotal Period 2b Additional Costs 79 117 560 809 - 890 2,439 1,200 6,093 6,093 - - - 3,501 - - - 354,825 54,499 2,000
Period 2b Collateral Costs2b.3.1 Process decommissioning water waste 133 - 62 316 - 367 - 212 1,090 1,090 - - - 881 - - - 52,833 172 - 2b.3.2 Process decommissioning chemical flush waste 2 - 54 363 - 584 - 207 1,209 1,209 - - - 789 - - - 84,082 148 - 2b.3.3 Small tool allowance - 221 - - - - - 33 255 255 - - - - - - - - - - 2b.3.4 Spent Fuel Capital and Transfer - - - - - - 1,400 210 1,610 - 1,610 - - - - - - - - - 2b.3 Subtotal Period 2b Collateral Costs 135 221 116 679 - 952 1,400 662 4,164 2,554 1,610 - - 1,670 - - - 136,916 319 -
Period 2b Period-Dependent Costs2b.4.1 Decon supplies 860 - - - - - - 215 1,075 1,075 - - - - - - - - - - 2b.4.2 Insurance - - - - - - 932 93 1,025 1,025 - - - - - - - - - - 2b.4.3 Property taxes - - - - - - 2,323 232 2,555 2,555 - - - - - - - - - - 2b.4.4 Health physics supplies - 2,765 - - - - - 691 3,456 3,456 - - - - - - - - - - 2b.4.5 Heavy equipment rental - 5,204 - - - - - 781 5,985 5,985 - - - - - - - - - - 2b.4.6 Disposal of DAW generated - - 109 16 - 244 - 74 444 444 - - - 5,005 - - - 100,099 163 - 2b.4.7 Plant energy budget - - - - - - 1,111 167 1,278 1,278 - - - - - - - - - - 2b.4.8 NRC Fees - - - - - - 1,051 105 1,156 1,156 - - - - - - - - - - 2b.4.9 Emergency Planning Fees - - - - - - 311 31 342 - 342 - - - - - - - - - 2b.4.10 Spent Fuel Pool O&M - - - - - - 1,128 169 1,298 - 1,298 - - - - - - - - - 2b.4.11 Liquid Radwaste Processing Equipment/Services - - - - - - 477 72 549 549 - - - - - - - - - - 2b.4.12 Corporate A&G - - - - - - 4,418 663 5,080 5,080 - - - - - - - - - - 2b.4.13 Site O&M - - - - - - 429 64 493 493 - - - - - - - - - - 2b.4.14 Security Staff Cost - - - - - - 4,631 695 5,326 5,326 - - - - - - - - - 141,573 2b.4.15 Utility Staff Cost - - - - - - 44,192 6,629 50,821 50,821 - - - - - - - - - 739,186 2b.4 Subtotal Period 2b Period-Dependent Costs 860 7,969 109 16 - 244 61,004 10,681 80,883 79,243 1,640 - - 5,005 - - - 100,099 163 880,759
2b.0 TOTAL PERIOD 2b COST 4,287 18,690 1,824 2,920 8,831 11,909 64,843 20,746 134,049 129,689 3,250 1,110 88,333 59,756 - - - 7,452,790 370,126 882,759
PERIOD 2c - Spent fuel delay prior to SFP decon
Period 2c Direct Decommissioning Activities
Period 2c Collateral Costs2c.3.1 Spent Fuel Capital and Transfer - - - - - - 4,269 640 4,909 - 4,909 - - - - - - - - - 2c.3 Subtotal Period 2c Collateral Costs - - - - - - 4,269 640 4,909 - 4,909 - - - - - - - - -
Period 2c Period-Dependent Costs2c.4.1 Insurance - - - - - - 2,129 213 2,342 2,342 - - - - - - - - - - 2c.4.2 Property taxes - - - - - - 1,165 116 1,281 1,281 - - - - - - - - - - 2c.4.3 Health physics supplies - 1,906 - - - - - 477 2,383 2,383 - - - - - - - - - - 2c.4.4 Disposal of DAW generated - - 46 7 - 104 - 32 188 188 - - - 2,125 - - - 42,506 69 - 2c.4.5 Plant energy budget - - - - - - 677 101 778 778 - - - - - - - - - - 2c.4.6 NRC Fees - - - - - - 1,491 149 1,640 1,640 - - - - - - - - - - 2c.4.7 Emergency Planning Fees - - - - - - 711 71 782 - 782 - - - - - - - - - 2c.4.8 Spent Fuel Pool O&M - - - - - - 2,577 387 2,964 - 2,964 - - - - - - - - - 2c.4.9 Corporate A&G - - - - - - 1,266 190 1,455 1,455 - - - - - - - - - - 2c.4.10 Site O&M - - - - - - 123 18 141 141 - - - - - - - - - - 2c.4.11 Security Staff Cost - - - - - - 8,165 1,225 9,390 9,390 - - - - - - - - - 243,221 2c.4.12 Utility Staff Cost - - - - - - 12,515 1,877 14,392 14,392 - - - - - - - - - 211,746 2c.4 Subtotal Period 2c Period-Dependent Costs - 1,906 46 7 - 104 30,818 4,856 37,737 33,992 3,745 - - 2,125 - - - 42,506 69 454,967
2c.0 TOTAL PERIOD 2c COST - 1,906 46 7 - 104 35,087 5,496 42,646 33,992 8,655 - - 2,125 - - - 42,506 69 454,967
PERIOD 2d - Decontamination Following Wet Fuel Storage
Period 2d Direct Decommissioning Activities2d.1.1 Remove spent fuel racks 335 33 156 80 - 819 - 408 1,832 1,832 - - - 3,470 - - - 229,389 956 -
Disposal of Plant Systems2d.1.2.1 Spent Fuel Cooling 324 288 46 50 190 453 - 388 1,739 1,739 - - 1,899 1,926 - - - 204,141 10,101 - 2d.1.2 Totals 324 288 46 50 190 453 - 388 1,739 1,739 - - 1,899 1,926 - - - 204,141 10,101 -
TLG Services, Inc.

Oconee Nuclear StationDecommissioning Cost Analysis
Document D03-1671-003, Rev. 0Appendix C, Page 15 of 27
Table C-2Oconee Nuclear Station, Unit 2
DECON Decommissioning Cost Estimate(thousands of 2013 dollars)
Costs run: Wed, Oct 23, 2013 at 10:17:21 Off-Site LLRW NRC Spent Fuel Site Processed Burial Volumes Burial / Utility andActivity DECCER Version 2010.09.09i Decon Removal Packaging Transport Processing Disposal Other Total Total Lic. Term. Management Restoration Volume Class A Class B Class C GTCC Processed Craft ContractorIndex Activity Description Cost Cost Costs Costs Costs Costs Costs Contingency Costs Costs Costs Costs Cu. Feet Cu. Feet Cu. Feet Cu. Feet Cu. Feet Wt., Lbs. Manhours Manhours
Decontamination of Site Buildings2d.1.3.1 Fuel Building 210 234 3 9 91 18 - 183 748 748 - - 916 202 - - - 53,669 10,107 - 2d.1.3 Totals 210 234 3 9 91 18 - 183 748 748 - - 916 202 - - - 53,669 10,107 -
2d.1.4 Scaffolding in support of decommissioning - 121 3 1 12 2 - 33 171 171 - - 108 10 - - - 5,505 3,691 -
2d.1 Subtotal Period 2d Activity Costs 869 677 208 138 293 1,292 - 1,012 4,490 4,490 - - 2,923 5,608 - - - 492,704 24,855 -
Period 2d Additional Costs2d.2.1 License Termination Survey Planning - - - - - - 553 166 719 719 - - - - - - - - - 4,160 2d.2.2 Remedial Action Surveys - - - - - - 537 161 698 698 - - - - - - - - 10,991 - 2d.2 Subtotal Period 2d Additional Costs - - - - - - 1,090 327 1,417 1,417 - - - - - - - - 10,991 4,160
Period 2d Collateral Costs2d.3.1 Process decommissioning water waste 34 - 17 88 - 102 - 57 298 298 - - - 245 - - - 14,682 48 - 2d.3.2 Process decommissioning chemical flush waste 1 - 36 246 - 395 - 140 818 818 - - - 534 - - - 56,876 100 - 2d.3.3 Small tool allowance - 24 - - - - - 4 27 27 - - - - - - - - - - 2d.3.4 Decommissioning Equipment Disposition - - 144 36 664 125 - 151 1,119 1,119 - - 6,000 529 - - - 304,968 88 - 2d.3.5 Spent Fuel Capital and Transfer - - - - - - 191 29 219 - 219 - - - - - - - - - 2d.3 Subtotal Period 2d Collateral Costs 35 24 197 369 664 622 191 380 2,481 2,262 219 - 6,000 1,307 - - - 376,526 236 -
Period 2d Period-Dependent Costs2d.4.1 Decon supplies 66 - - - - - - 17 83 83 - - - - - - - - - - 2d.4.2 Insurance - - - - - - 205 21 226 226 - - - - - - - - - - 2d.4.3 Property taxes - - - - - - 3 0 3 3 - - - - - - - - - - 2d.4.4 Health physics supplies - 385 - - - - - 96 481 481 - - - - - - - - - - 2d.4.5 Heavy equipment rental - 1,145 - - - - - 172 1,317 1,317 - - - - - - - - - - 2d.4.6 Disposal of DAW generated - - 19 3 - 42 - 13 76 76 - - - 858 - - - 17,161 28 - 2d.4.7 Plant energy budget - - - - - - 130 20 150 150 - - - - - - - - - - 2d.4.8 NRC Fees - - - - - - 195 20 215 215 - - - - - - - - - - 2d.4.9 Emergency Planning Fees - - - - - - 68 7 75 - 75 - - - - - - - - - 2d.4.10 Liquid Radwaste Processing Equipment/Services - - - - - - 210 31 241 241 - - - - - - - - - - 2d.4.11 Corporate A&G - - - - - - 702 105 807 807 - - - - - - - - - - 2d.4.12 Site O&M - - - - - - 68 10 78 78 - - - - - - - - - - 2d.4.13 Security Staff Cost - - - - - - 516 77 593 593 - - - - - - - - - 14,425 2d.4.14 Utility Staff Cost - - - - - - 7,117 1,068 8,185 8,185 - - - - - - - - - 117,454 2d.4 Subtotal Period 2d Period-Dependent Costs 66 1,530 19 3 - 42 9,215 1,656 12,530 12,455 75 - - 858 - - - 17,161 28 131,880
2d.0 TOTAL PERIOD 2d COST 970 2,230 424 510 957 1,956 10,495 3,375 20,918 20,623 294 - 8,923 7,773 - - - 886,390 36,110 136,040
PERIOD 2f - License Termination
Period 2f Direct Decommissioning Activities2f.1.1 ORISE confirmatory survey - - - - - - 161 48 209 209 - - - - - - - - - - 2f.1.2 Terminate license a 2f.1 Subtotal Period 2f Activity Costs - - - - - - 161 48 209 209 - - - - - - - - - -
Period 2f Additional Costs2f.2.1 License Termination Survey - - - - - - 5,857 1,757 7,614 7,614 - - - - - - - - 134,093 2,080 2f.2 Subtotal Period 2f Additional Costs - - - - - - 5,857 1,757 7,614 7,614 - - - - - - - - 134,093 2,080
Period 2f Collateral Costs2f.3.1 Staff relocation expenses - - - - - - 1,130 169 1,299 1,299 - - - - - - - - - - 2f.3 Subtotal Period 2f Collateral Costs - - - - - - 1,130 169 1,299 1,299 - - - - - - - - - -
Period 2f Period-Dependent Costs2f.4.1 Insurance - - - - - - 264 26 290 290 - - - - - - - - - - 2f.4.2 Property taxes - - - - - - 4 0 5 5 - - - - - - - - - - 2f.4.3 Health physics supplies - 657 - - - - - 164 822 822 - - - - - - - - - - 2f.4.4 Disposal of DAW generated - - 7 1 - 16 - 5 29 29 - - - 326 - - - 6,525 11 - 2f.4.5 Plant energy budget - - - - - - 93 14 107 107 - - - - - - - - - - 2f.4.6 NRC Fees - - - - - - 304 30 335 335 - - - - - - - - - - 2f.4.7 Emergency Planning Fees - - - - - - 98 10 107 - 107 - - - - - - - - - 2f.4.8 Corporate A&G - - - - - - 531 80 610 610 - - - - - - - - - - 2f.4.9 Site O&M - - - - - - 52 8 60 60 - - - - - - - - - - 2f.4.10 Security Staff Cost - - - - - - 723 108 831 831 - - - - - - - - - 20,161 2f.4.11 Utility Staff Cost - - - - - - 5,646 847 6,493 6,493 - - - - - - - - - 88,786
TLG Services, Inc.
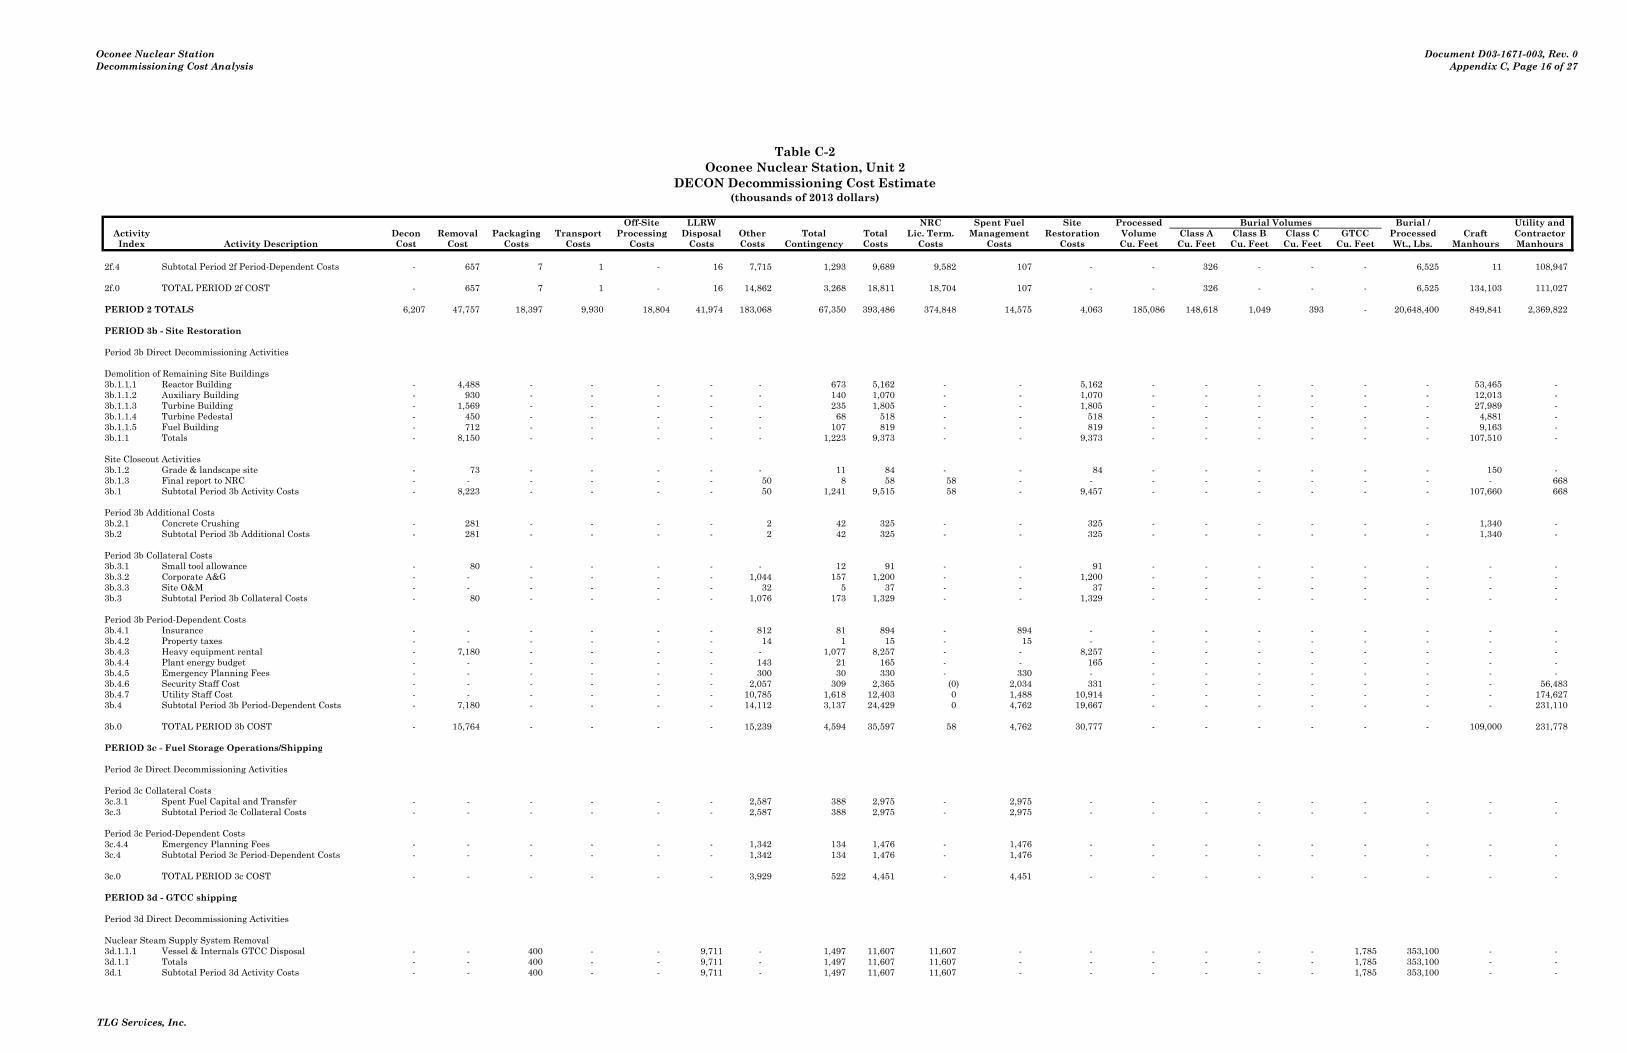
Oconee Nuclear StationDecommissioning Cost Analysis
Document D03-1671-003, Rev. 0Appendix C, Page 16 of 27
Table C-2Oconee Nuclear Station, Unit 2
DECON Decommissioning Cost Estimate(thousands of 2013 dollars)
Costs run: Wed, Oct 23, 2013 at 10:17:21 Off-Site LLRW NRC Spent Fuel Site Processed Burial Volumes Burial / Utility andActivity DECCER Version 2010.09.09i Decon Removal Packaging Transport Processing Disposal Other Total Total Lic. Term. Management Restoration Volume Class A Class B Class C GTCC Processed Craft ContractorIndex Activity Description Cost Cost Costs Costs Costs Costs Costs Contingency Costs Costs Costs Costs Cu. Feet Cu. Feet Cu. Feet Cu. Feet Cu. Feet Wt., Lbs. Manhours Manhours
2f.4 Subtotal Period 2f Period-Dependent Costs - 657 7 1 - 16 7,715 1,293 9,689 9,582 107 - - 326 - - - 6,525 11 108,947
2f.0 TOTAL PERIOD 2f COST - 657 7 1 - 16 14,862 3,268 18,811 18,704 107 - - 326 - - - 6,525 134,103 111,027
PERIOD 2 TOTALS 6,207 47,757 18,397 9,930 18,804 41,974 183,068 67,350 393,486 374,848 14,575 4,063 185,086 148,618 1,049 393 - 20,648,400 849,841 2,369,822
PERIOD 3b - Site Restoration
Period 3b Direct Decommissioning Activities
Demolition of Remaining Site Buildings3b.1.1.1 Reactor Building - 4,488 - - - - - 673 5,162 - - 5,162 - - - - - - 53,465 - 3b.1.1.2 Auxiliary Building - 930 - - - - - 140 1,070 - - 1,070 - - - - - - 12,013 - 3b.1.1.3 Turbine Building - 1,569 - - - - - 235 1,805 - - 1,805 - - - - - - 27,989 - 3b.1.1.4 Turbine Pedestal - 450 - - - - - 68 518 - - 518 - - - - - - 4,881 - 3b.1.1.5 Fuel Building - 712 - - - - - 107 819 - - 819 - - - - - - 9,163 - 3b.1.1 Totals - 8,150 - - - - - 1,223 9,373 - - 9,373 - - - - - - 107,510 -
Site Closeout Activities3b.1.2 Grade & landscape site - 73 - - - - - 11 84 - - 84 - - - - - - 150 - 3b.1.3 Final report to NRC - - - - - - 50 8 58 58 - - - - - - - - - 668 3b.1 Subtotal Period 3b Activity Costs - 8,223 - - - - 50 1,241 9,515 58 - 9,457 - - - - - - 107,660 668
Period 3b Additional Costs3b.2.1 Concrete Crushing - 281 - - - - 2 42 325 - - 325 - - - - - - 1,340 - 3b.2 Subtotal Period 3b Additional Costs - 281 - - - - 2 42 325 - - 325 - - - - - - 1,340 -
Period 3b Collateral Costs3b.3.1 Small tool allowance - 80 - - - - - 12 91 - - 91 - - - - - - - - 3b.3.2 Corporate A&G - - - - - - 1,044 157 1,200 - - 1,200 - - - - - - - - 3b.3.3 Site O&M - - - - - - 32 5 37 - - 37 - - - - - - - - 3b.3 Subtotal Period 3b Collateral Costs - 80 - - - - 1,076 173 1,329 - - 1,329 - - - - - - - -
Period 3b Period-Dependent Costs3b.4.1 Insurance - - - - - - 812 81 894 - 894 - - - - - - - - - 3b.4.2 Property taxes - - - - - - 14 1 15 - 15 - - - - - - - - - 3b.4.3 Heavy equipment rental - 7,180 - - - - - 1,077 8,257 - - 8,257 - - - - - - - - 3b.4.4 Plant energy budget - - - - - - 143 21 165 - - 165 - - - - - - - - 3b.4.5 Emergency Planning Fees - - - - - - 300 30 330 - 330 - - - - - - - - - 3b.4.6 Security Staff Cost - - - - - - 2,057 309 2,365 (0) 2,034 331 - - - - - - - 56,483 3b.4.7 Utility Staff Cost - - - - - - 10,785 1,618 12,403 0 1,488 10,914 - - - - - - - 174,627 3b.4 Subtotal Period 3b Period-Dependent Costs - 7,180 - - - - 14,112 3,137 24,429 0 4,762 19,667 - - - - - - - 231,110
3b.0 TOTAL PERIOD 3b COST - 15,764 - - - - 15,239 4,594 35,597 58 4,762 30,777 - - - - - - 109,000 231,778
PERIOD 3c - Fuel Storage Operations/Shipping
Period 3c Direct Decommissioning Activities
Period 3c Collateral Costs3c.3.1 Spent Fuel Capital and Transfer - - - - - - 2,587 388 2,975 - 2,975 - - - - - - - - - 3c.3 Subtotal Period 3c Collateral Costs - - - - - - 2,587 388 2,975 - 2,975 - - - - - - - - -
Period 3c Period-Dependent Costs3c.4.4 Emergency Planning Fees - - - - - - 1,342 134 1,476 - 1,476 - - - - - - - - - 3c.4 Subtotal Period 3c Period-Dependent Costs - - - - - - 1,342 134 1,476 - 1,476 - - - - - - - - -
3c.0 TOTAL PERIOD 3c COST - - - - - - 3,929 522 4,451 - 4,451 - - - - - - - - -
PERIOD 3d - GTCC shipping
Period 3d Direct Decommissioning Activities
Nuclear Steam Supply System Removal3d.1.1.1 Vessel & Internals GTCC Disposal - - 400 - - 9,711 - 1,497 11,607 11,607 - - - - - - 1,785 353,100 - - 3d.1.1 Totals - - 400 - - 9,711 - 1,497 11,607 11,607 - - - - - - 1,785 353,100 - - 3d.1 Subtotal Period 3d Activity Costs - - 400 - - 9,711 - 1,497 11,607 11,607 - - - - - - 1,785 353,100 - -
TLG Services, Inc.
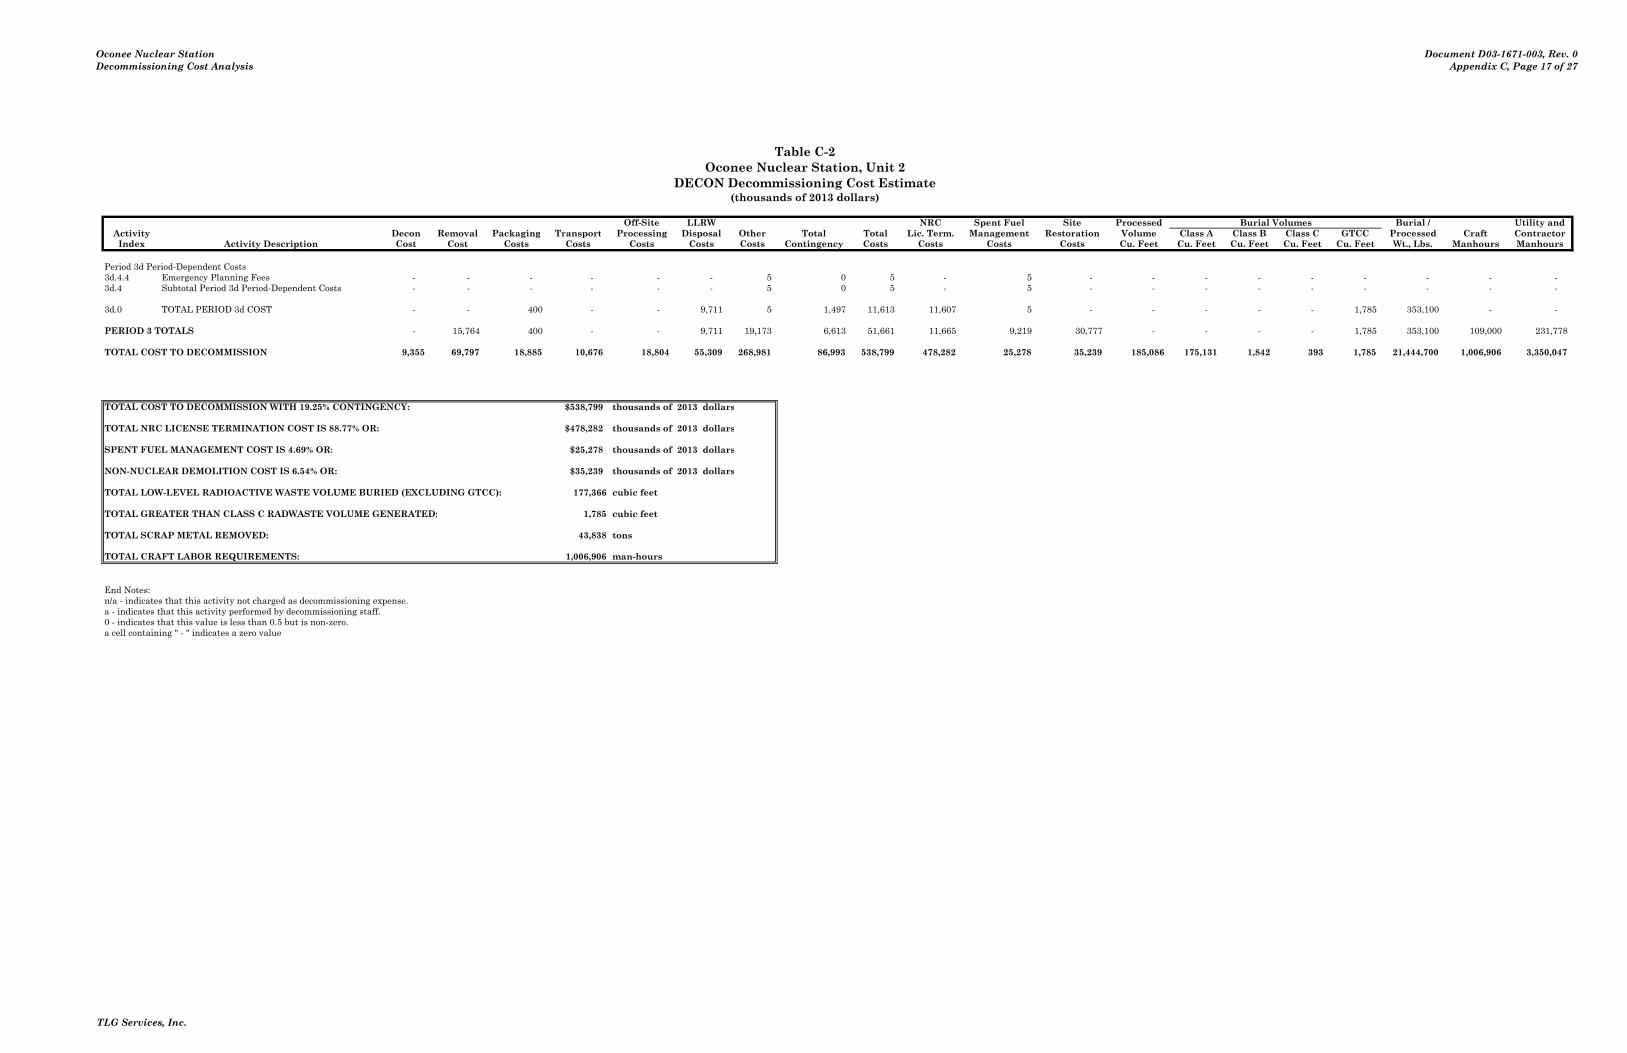
Oconee Nuclear StationDecommissioning Cost Analysis
Document D03-1671-003, Rev. 0Appendix C, Page 17 of 27
Table C-2Oconee Nuclear Station, Unit 2
DECON Decommissioning Cost Estimate(thousands of 2013 dollars)
Costs run: Wed, Oct 23, 2013 at 10:17:21 Off-Site LLRW NRC Spent Fuel Site Processed Burial Volumes Burial / Utility andActivity DECCER Version 2010.09.09i Decon Removal Packaging Transport Processing Disposal Other Total Total Lic. Term. Management Restoration Volume Class A Class B Class C GTCC Processed Craft ContractorIndex Activity Description Cost Cost Costs Costs Costs Costs Costs Contingency Costs Costs Costs Costs Cu. Feet Cu. Feet Cu. Feet Cu. Feet Cu. Feet Wt., Lbs. Manhours Manhours
Period 3d Period-Dependent Costs3d.4.4 Emergency Planning Fees - - - - - - 5 0 5 - 5 - - - - - - - - - 3d.4 Subtotal Period 3d Period-Dependent Costs - - - - - - 5 0 5 - 5 - - - - - - - - -
3d.0 TOTAL PERIOD 3d COST - - 400 - - 9,711 5 1,497 11,613 11,607 5 - - - - - 1,785 353,100 - -
PERIOD 3 TOTALS - 15,764 400 - - 9,711 19,173 6,613 51,661 11,665 9,219 30,777 - - - - 1,785 353,100 109,000 231,778
TOTAL COST TO DECOMMISSION 9,355 69,797 18,885 10,676 18,804 55,309 268,981 86,993 538,799 478,282 25,278 35,239 185,086 175,131 1,842 393 1,785 21,444,700 1,006,906 3,350,047
TOTAL COST TO DECOMMISSION WITH 19.25% CONTINGENCY: $538,799 thousands of 2013 dollars
TOTAL NRC LICENSE TERMINATION COST IS 88.77% OR: $478,282 thousands of 2013 dollars
SPENT FUEL MANAGEMENT COST IS 4.69% OR: $25,278 thousands of 2013 dollars
NON-NUCLEAR DEMOLITION COST IS 6.54% OR: $35,239 thousands of 2013 dollars
TOTAL LOW-LEVEL RADIOACTIVE WASTE VOLUME BURIED (EXCLUDING GTCC): 177,366 cubic feet
TOTAL GREATER THAN CLASS C RADWASTE VOLUME GENERATED: 1,785 cubic feet
TOTAL SCRAP METAL REMOVED: 43,838 tons
TOTAL CRAFT LABOR REQUIREMENTS: 1,006,906 man-hours
End Notes:n/a - indicates that this activity not charged as decommissioning expense.a - indicates that this activity performed by decommissioning staff.0 - indicates that this value is less than 0.5 but is non-zero.a cell containing " - " indicates a zero value
TLG Services, Inc.
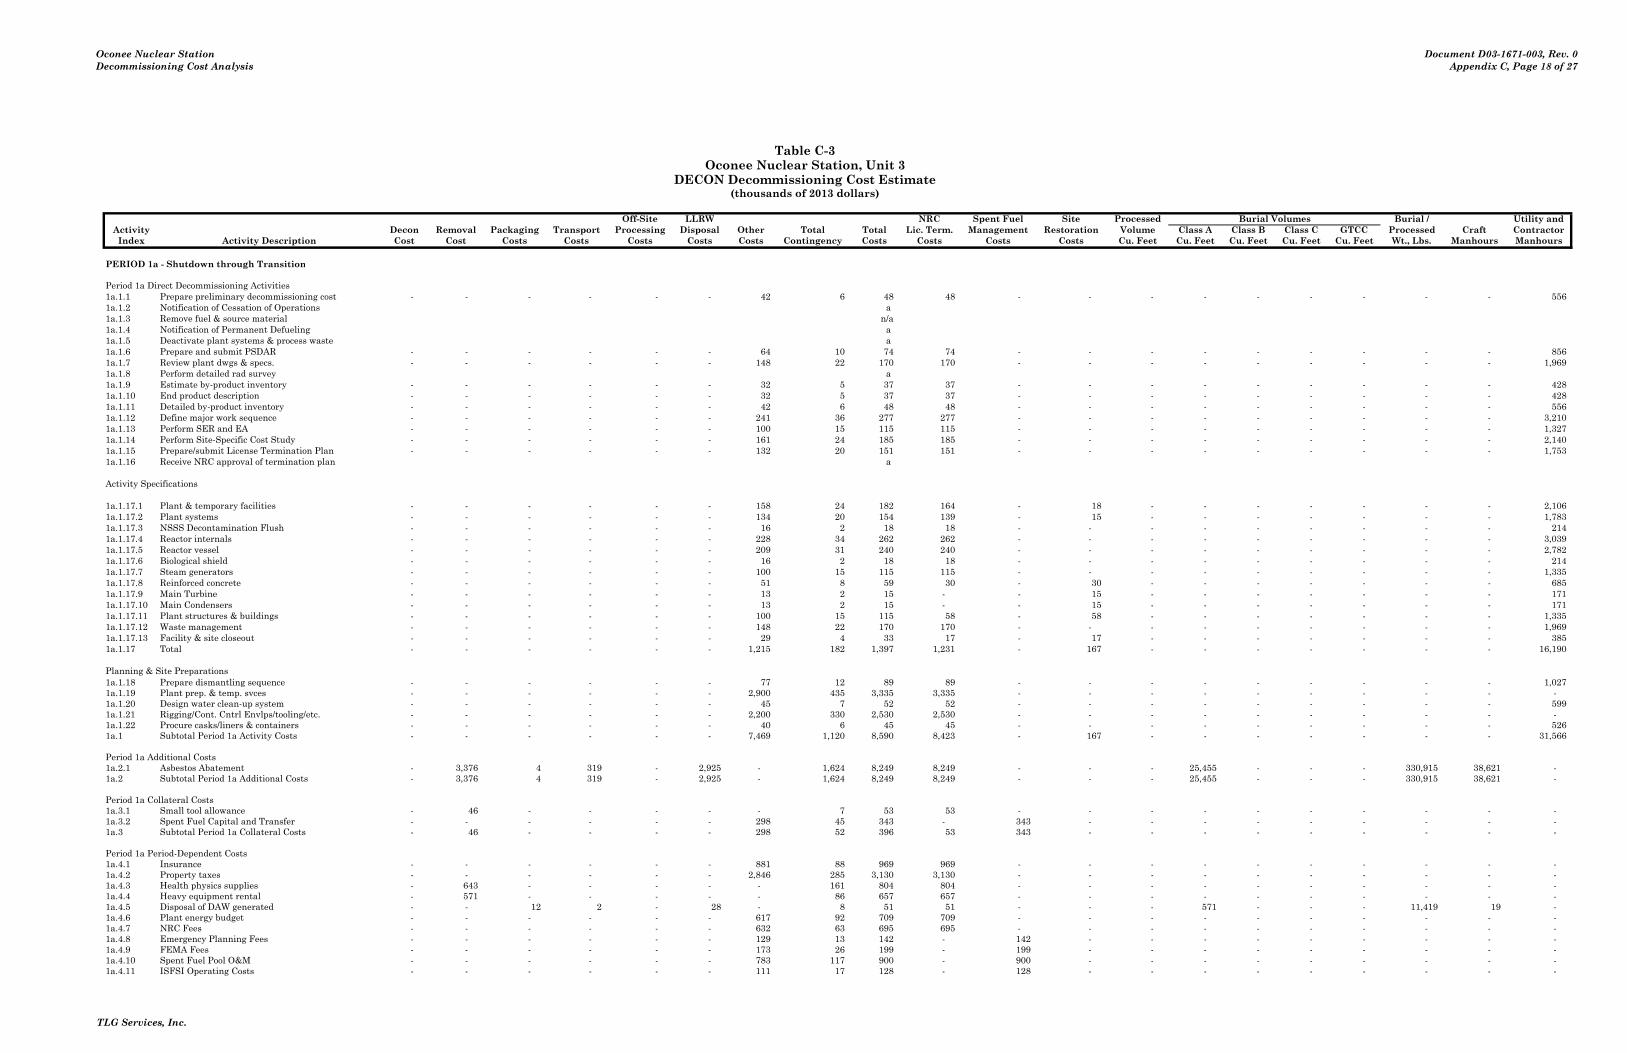
Oconee Nuclear StationDecommissioning Cost Analysis
Document D03-1671-003, Rev. 0Appendix C, Page 18 of 27
Table C-3Oconee Nuclear Station, Unit 3
DECON Decommissioning Cost Estimate(thousands of 2013 dollars)
Off-Site LLRW NRC Spent Fuel Site Processed Burial Volumes Burial / Utility andActivity Decon Removal Packaging Transport Processing Disposal Other Total Total Lic. Term. Management Restoration Volume Class A Class B Class C GTCC Processed Craft ContractorIndex Activity Description Cost Cost Costs Costs Costs Costs Costs Contingency Costs Costs Costs Costs Cu. Feet Cu. Feet Cu. Feet Cu. Feet Cu. Feet Wt., Lbs. Manhours Manhours
PERIOD 1a - Shutdown through Transition
Period 1a Direct Decommissioning Activities1a.1.1 Prepare preliminary decommissioning cost - - - - - - 42 6 48 48 - - - - - - - - - 556 1a.1.2 Notification of Cessation of Operations a 1a.1.3 Remove fuel & source material n/a1a.1.4 Notification of Permanent Defueling a 1a.1.5 Deactivate plant systems & process waste a 1a.1.6 Prepare and submit PSDAR - - - - - - 64 10 74 74 - - - - - - - - - 856 1a.1.7 Review plant dwgs & specs. - - - - - - 148 22 170 170 - - - - - - - - - 1,969 1a.1.8 Perform detailed rad survey a 1a.1.9 Estimate by-product inventory - - - - - - 32 5 37 37 - - - - - - - - - 428 1a.1.10 End product description - - - - - - 32 5 37 37 - - - - - - - - - 428 1a.1.11 Detailed by-product inventory - - - - - - 42 6 48 48 - - - - - - - - - 556 1a.1.12 Define major work sequence - - - - - - 241 36 277 277 - - - - - - - - - 3,210 1a.1.13 Perform SER and EA - - - - - - 100 15 115 115 - - - - - - - - - 1,327 1a.1.14 Perform Site-Specific Cost Study - - - - - - 161 24 185 185 - - - - - - - - - 2,140 1a.1.15 Prepare/submit License Termination Plan - - - - - - 132 20 151 151 - - - - - - - - - 1,753 1a.1.16 Receive NRC approval of termination plan a
Activity Specifications
1a.1.17.1 Plant & temporary facilities - - - - - - 158 24 182 164 - 18 - - - - - - - 2,106 1a.1.17.2 Plant systems - - - - - - 134 20 154 139 - 15 - - - - - - - 1,783 1a.1.17.3 NSSS Decontamination Flush - - - - - - 16 2 18 18 - - - - - - - - - 214 1a.1.17.4 Reactor internals - - - - - - 228 34 262 262 - - - - - - - - - 3,039 1a.1.17.5 Reactor vessel - - - - - - 209 31 240 240 - - - - - - - - - 2,782 1a.1.17.6 Biological shield - - - - - - 16 2 18 18 - - - - - - - - - 214 1a.1.17.7 Steam generators - - - - - - 100 15 115 115 - - - - - - - - - 1,335 1a.1.17.8 Reinforced concrete - - - - - - 51 8 59 30 - 30 - - - - - - - 685 1a.1.17.9 Main Turbine - - - - - - 13 2 15 - - 15 - - - - - - - 171 1a.1.17.10 Main Condensers - - - - - - 13 2 15 - - 15 - - - - - - - 171 1a.1.17.11 Plant structures & buildings - - - - - - 100 15 115 58 - 58 - - - - - - - 1,335 1a.1.17.12 Waste management - - - - - - 148 22 170 170 - - - - - - - - - 1,969 1a.1.17.13 Facility & site closeout - - - - - - 29 4 33 17 - 17 - - - - - - - 385 1a.1.17 Total - - - - - - 1,215 182 1,397 1,231 - 167 - - - - - - - 16,190
Planning & Site Preparations1a.1.18 Prepare dismantling sequence - - - - - - 77 12 89 89 - - - - - - - - - 1,027 1a.1.19 Plant prep. & temp. svces - - - - - - 2,900 435 3,335 3,335 - - - - - - - - - - 1a.1.20 Design water clean-up system - - - - - - 45 7 52 52 - - - - - - - - - 599 1a.1.21 Rigging/Cont. Cntrl Envlps/tooling/etc. - - - - - - 2,200 330 2,530 2,530 - - - - - - - - - - 1a.1.22 Procure casks/liners & containers - - - - - - 40 6 45 45 - - - - - - - - - 526 1a.1 Subtotal Period 1a Activity Costs - - - - - - 7,469 1,120 8,590 8,423 - 167 - - - - - - - 31,566
Period 1a Additional Costs1a.2.1 Asbestos Abatement - 3,376 4 319 - 2,925 - 1,624 8,249 8,249 - - - 25,455 - - - 330,915 38,621 - 1a.2 Subtotal Period 1a Additional Costs - 3,376 4 319 - 2,925 - 1,624 8,249 8,249 - - - 25,455 - - - 330,915 38,621 -
Period 1a Collateral Costs1a.3.1 Small tool allowance - 46 - - - - - 7 53 53 - - - - - - - - - - 1a.3.2 Spent Fuel Capital and Transfer - - - - - - 298 45 343 - 343 - - - - - - - - - 1a.3 Subtotal Period 1a Collateral Costs - 46 - - - - 298 52 396 53 343 - - - - - - - - -
Period 1a Period-Dependent Costs1a.4.1 Insurance - - - - - - 881 88 969 969 - - - - - - - - - - 1a.4.2 Property taxes - - - - - - 2,846 285 3,130 3,130 - - - - - - - - - - 1a.4.3 Health physics supplies - 643 - - - - - 161 804 804 - - - - - - - - - - 1a.4.4 Heavy equipment rental - 571 - - - - - 86 657 657 - - - - - - - - - - 1a.4.5 Disposal of DAW generated - - 12 2 - 28 - 8 51 51 - - - 571 - - - 11,419 19 - 1a.4.6 Plant energy budget - - - - - - 617 92 709 709 - - - - - - - - - - 1a.4.7 NRC Fees - - - - - - 632 63 695 695 - - - - - - - - - - 1a.4.8 Emergency Planning Fees - - - - - - 129 13 142 - 142 - - - - - - - - - 1a.4.9 FEMA Fees - - - - - - 173 26 199 - 199 - - - - - - - - - 1a.4.10 Spent Fuel Pool O&M - - - - - - 783 117 900 - 900 - - - - - - - - - 1a.4.11 ISFSI Operating Costs - - - - - - 111 17 128 - 128 - - - - - - - - -
TLG Services, Inc.
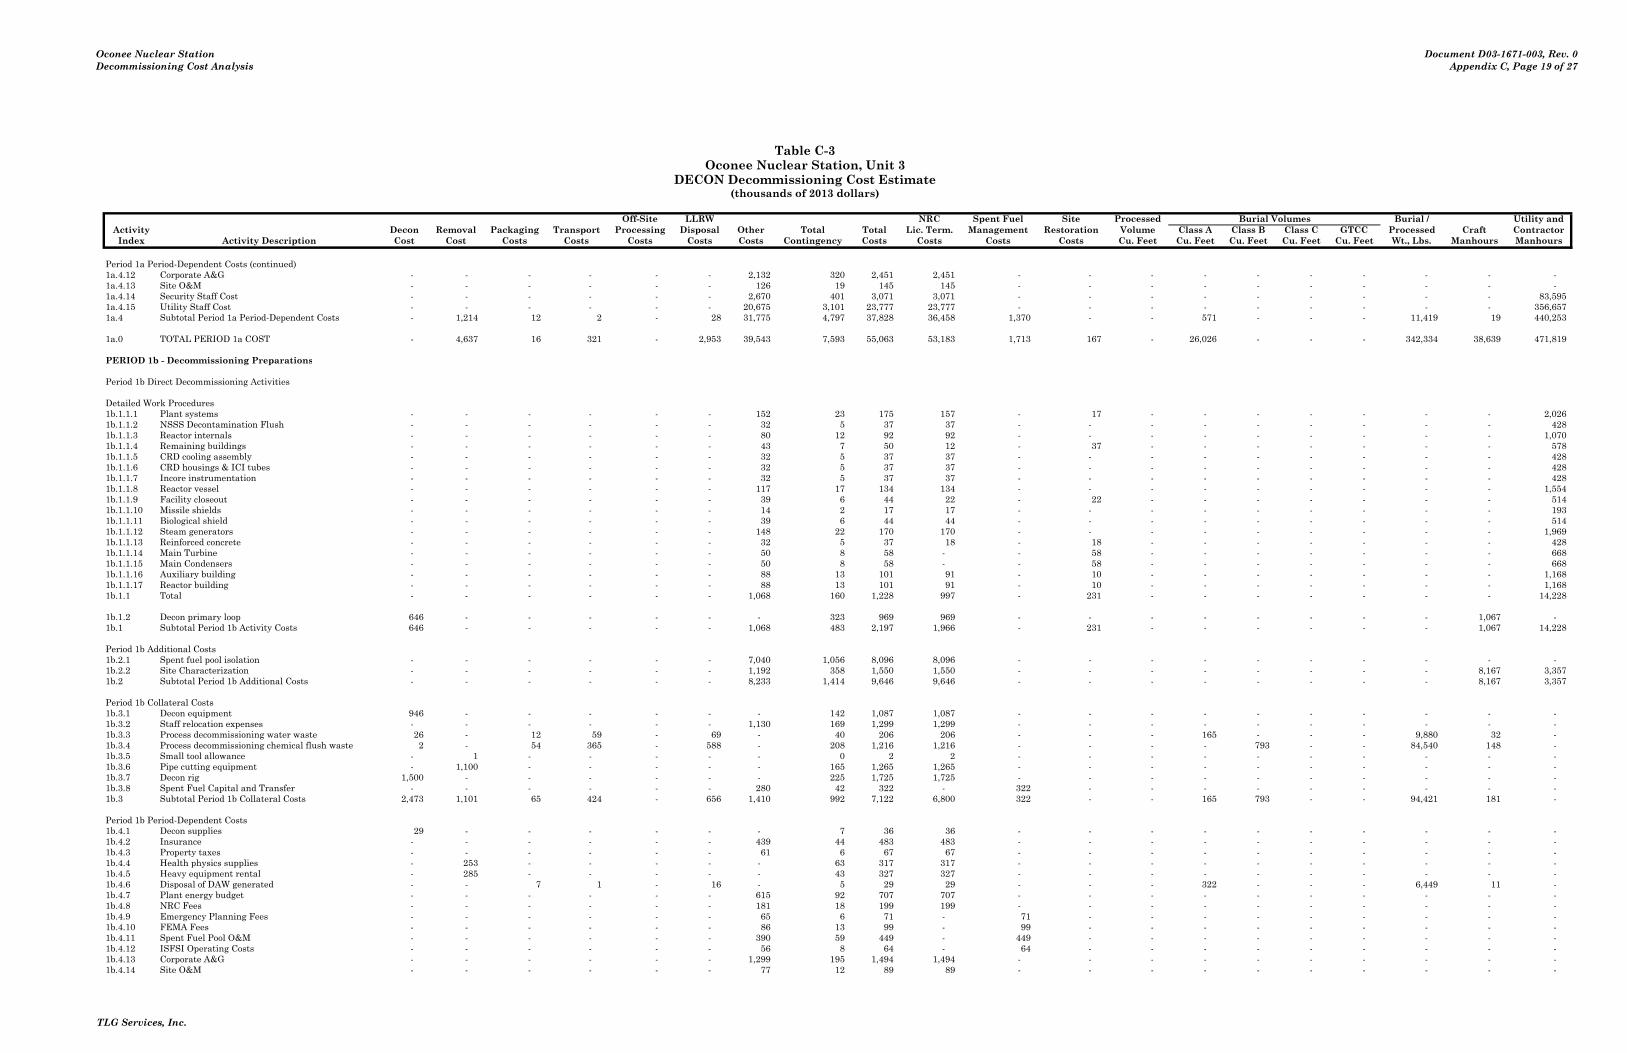
Oconee Nuclear StationDecommissioning Cost Analysis
Document D03-1671-003, Rev. 0Appendix C, Page 19 of 27
Table C-3Oconee Nuclear Station, Unit 3
DECON Decommissioning Cost Estimate(thousands of 2013 dollars)
Off-Site LLRW NRC Spent Fuel Site Processed Burial Volumes Burial / Utility andActivity Decon Removal Packaging Transport Processing Disposal Other Total Total Lic. Term. Management Restoration Volume Class A Class B Class C GTCC Processed Craft ContractorIndex Activity Description Cost Cost Costs Costs Costs Costs Costs Contingency Costs Costs Costs Costs Cu. Feet Cu. Feet Cu. Feet Cu. Feet Cu. Feet Wt., Lbs. Manhours Manhours
Period 1a Period-Dependent Costs (continued)1a.4.12 Corporate A&G - - - - - - 2,132 320 2,451 2,451 - - - - - - - - - - 1a.4.13 Site O&M - - - - - - 126 19 145 145 - - - - - - - - - - 1a.4.14 Security Staff Cost - - - - - - 2,670 401 3,071 3,071 - - - - - - - - - 83,595 1a.4.15 Utility Staff Cost - - - - - - 20,675 3,101 23,777 23,777 - - - - - - - - - 356,657 1a.4 Subtotal Period 1a Period-Dependent Costs - 1,214 12 2 - 28 31,775 4,797 37,828 36,458 1,370 - - 571 - - - 11,419 19 440,253
1a.0 TOTAL PERIOD 1a COST - 4,637 16 321 - 2,953 39,543 7,593 55,063 53,183 1,713 167 - 26,026 - - - 342,334 38,639 471,819
PERIOD 1b - Decommissioning Preparations
Period 1b Direct Decommissioning Activities
Detailed Work Procedures1b.1.1.1 Plant systems - - - - - - 152 23 175 157 - 17 - - - - - - - 2,026 1b.1.1.2 NSSS Decontamination Flush - - - - - - 32 5 37 37 - - - - - - - - - 428 1b.1.1.3 Reactor internals - - - - - - 80 12 92 92 - - - - - - - - - 1,070 1b.1.1.4 Remaining buildings - - - - - - 43 7 50 12 - 37 - - - - - - - 578 1b.1.1.5 CRD cooling assembly - - - - - - 32 5 37 37 - - - - - - - - - 428 1b.1.1.6 CRD housings & ICI tubes - - - - - - 32 5 37 37 - - - - - - - - - 428 1b.1.1.7 Incore instrumentation - - - - - - 32 5 37 37 - - - - - - - - - 428 1b.1.1.8 Reactor vessel - - - - - - 117 17 134 134 - - - - - - - - - 1,554 1b.1.1.9 Facility closeout - - - - - - 39 6 44 22 - 22 - - - - - - - 514 1b.1.1.10 Missile shields - - - - - - 14 2 17 17 - - - - - - - - - 193 1b.1.1.11 Biological shield - - - - - - 39 6 44 44 - - - - - - - - - 514 1b.1.1.12 Steam generators - - - - - - 148 22 170 170 - - - - - - - - - 1,969 1b.1.1.13 Reinforced concrete - - - - - - 32 5 37 18 - 18 - - - - - - - 428 1b.1.1.14 Main Turbine - - - - - - 50 8 58 - - 58 - - - - - - - 668 1b.1.1.15 Main Condensers - - - - - - 50 8 58 - - 58 - - - - - - - 668 1b.1.1.16 Auxiliary building - - - - - - 88 13 101 91 - 10 - - - - - - - 1,168 1b.1.1.17 Reactor building - - - - - - 88 13 101 91 - 10 - - - - - - - 1,168 1b.1.1 Total - - - - - - 1,068 160 1,228 997 - 231 - - - - - - - 14,228
1b.1.2 Decon primary loop 646 - - - - - - 323 969 969 - - - - - - - - 1,067 - 1b.1 Subtotal Period 1b Activity Costs 646 - - - - - 1,068 483 2,197 1,966 - 231 - - - - - - 1,067 14,228
Period 1b Additional Costs1b.2.1 Spent fuel pool isolation - - - - - - 7,040 1,056 8,096 8,096 - - - - - - - - - - 1b.2.2 Site Characterization - - - - - - 1,192 358 1,550 1,550 - - - - - - - - 8,167 3,357 1b.2 Subtotal Period 1b Additional Costs - - - - - - 8,233 1,414 9,646 9,646 - - - - - - - - 8,167 3,357
Period 1b Collateral Costs1b.3.1 Decon equipment 946 - - - - - - 142 1,087 1,087 - - - - - - - - - - 1b.3.2 Staff relocation expenses - - - - - - 1,130 169 1,299 1,299 - - - - - - - - - - 1b.3.3 Process decommissioning water waste 26 - 12 59 - 69 - 40 206 206 - - - 165 - - - 9,880 32 - 1b.3.4 Process decommissioning chemical flush waste 2 - 54 365 - 588 - 208 1,216 1,216 - - - - 793 - - 84,540 148 - 1b.3.5 Small tool allowance - 1 - - - - - 0 2 2 - - - - - - - - - - 1b.3.6 Pipe cutting equipment - 1,100 - - - - - 165 1,265 1,265 - - - - - - - - - - 1b.3.7 Decon rig 1,500 - - - - - - 225 1,725 1,725 - - - - - - - - - - 1b.3.8 Spent Fuel Capital and Transfer - - - - - - 280 42 322 - 322 - - - - - - - - - 1b.3 Subtotal Period 1b Collateral Costs 2,473 1,101 65 424 - 656 1,410 992 7,122 6,800 322 - - 165 793 - - 94,421 181 -
Period 1b Period-Dependent Costs1b.4.1 Decon supplies 29 - - - - - - 7 36 36 - - - - - - - - - - 1b.4.2 Insurance - - - - - - 439 44 483 483 - - - - - - - - - - 1b.4.3 Property taxes - - - - - - 61 6 67 67 - - - - - - - - - - 1b.4.4 Health physics supplies - 253 - - - - - 63 317 317 - - - - - - - - - - 1b.4.5 Heavy equipment rental - 285 - - - - - 43 327 327 - - - - - - - - - - 1b.4.6 Disposal of DAW generated - - 7 1 - 16 - 5 29 29 - - - 322 - - - 6,449 11 - 1b.4.7 Plant energy budget - - - - - - 615 92 707 707 - - - - - - - - - - 1b.4.8 NRC Fees - - - - - - 181 18 199 199 - - - - - - - - - - 1b.4.9 Emergency Planning Fees - - - - - - 65 6 71 - 71 - - - - - - - - - 1b.4.10 FEMA Fees - - - - - - 86 13 99 - 99 - - - - - - - - - 1b.4.11 Spent Fuel Pool O&M - - - - - - 390 59 449 - 449 - - - - - - - - - 1b.4.12 ISFSI Operating Costs - - - - - - 56 8 64 - 64 - - - - - - - - - 1b.4.13 Corporate A&G - - - - - - 1,299 195 1,494 1,494 - - - - - - - - - - 1b.4.14 Site O&M - - - - - - 77 12 89 89 - - - - - - - - - -
TLG Services, Inc.
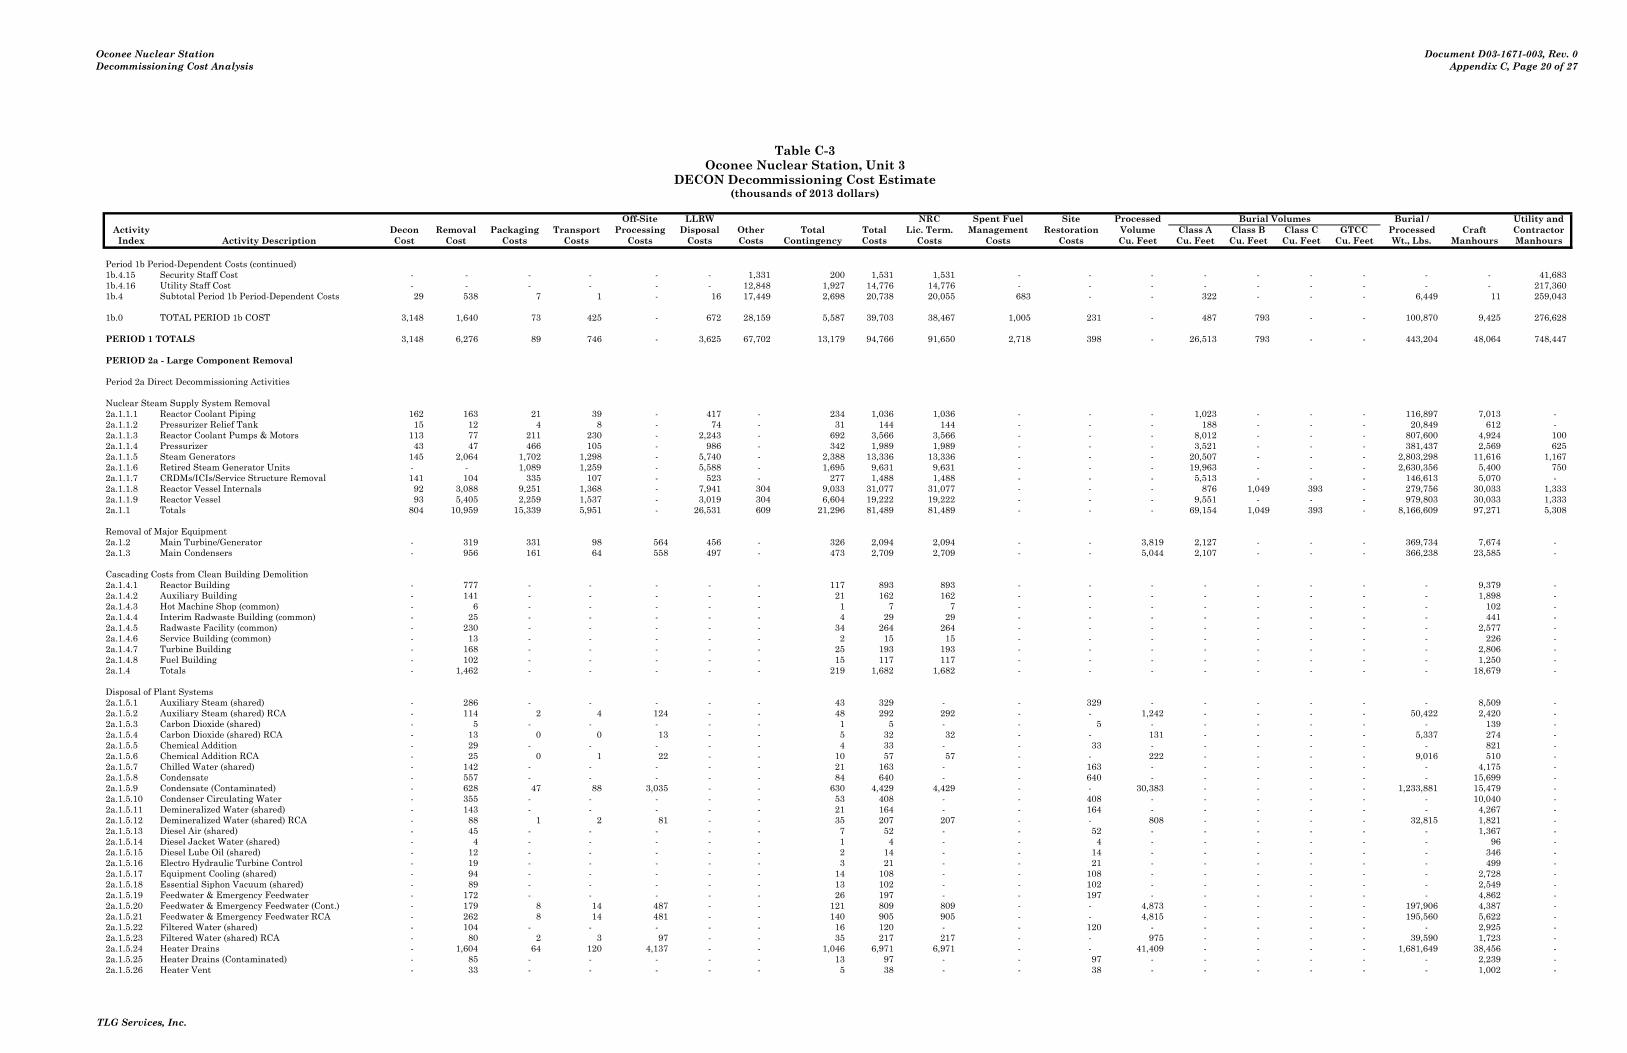
Oconee Nuclear StationDecommissioning Cost Analysis
Document D03-1671-003, Rev. 0Appendix C, Page 20 of 27
Table C-3Oconee Nuclear Station, Unit 3
DECON Decommissioning Cost Estimate(thousands of 2013 dollars)
Off-Site LLRW NRC Spent Fuel Site Processed Burial Volumes Burial / Utility andActivity Decon Removal Packaging Transport Processing Disposal Other Total Total Lic. Term. Management Restoration Volume Class A Class B Class C GTCC Processed Craft ContractorIndex Activity Description Cost Cost Costs Costs Costs Costs Costs Contingency Costs Costs Costs Costs Cu. Feet Cu. Feet Cu. Feet Cu. Feet Cu. Feet Wt., Lbs. Manhours Manhours
Period 1b Period-Dependent Costs (continued)1b.4.15 Security Staff Cost - - - - - - 1,331 200 1,531 1,531 - - - - - - - - - 41,683 1b.4.16 Utility Staff Cost - - - - - - 12,848 1,927 14,776 14,776 - - - - - - - - - 217,360 1b.4 Subtotal Period 1b Period-Dependent Costs 29 538 7 1 - 16 17,449 2,698 20,738 20,055 683 - - 322 - - - 6,449 11 259,043
1b.0 TOTAL PERIOD 1b COST 3,148 1,640 73 425 - 672 28,159 5,587 39,703 38,467 1,005 231 - 487 793 - - 100,870 9,425 276,628
PERIOD 1 TOTALS 3,148 6,276 89 746 - 3,625 67,702 13,179 94,766 91,650 2,718 398 - 26,513 793 - - 443,204 48,064 748,447
PERIOD 2a - Large Component Removal
Period 2a Direct Decommissioning Activities
Nuclear Steam Supply System Removal2a.1.1.1 Reactor Coolant Piping 162 163 21 39 - 417 - 234 1,036 1,036 - - - 1,023 - - - 116,897 7,013 - 2a.1.1.2 Pressurizer Relief Tank 15 12 4 8 - 74 - 31 144 144 - - - 188 - - - 20,849 612 - 2a.1.1.3 Reactor Coolant Pumps & Motors 113 77 211 230 - 2,243 - 692 3,566 3,566 - - - 8,012 - - - 807,600 4,924 100 2a.1.1.4 Pressurizer 43 47 466 105 - 986 - 342 1,989 1,989 - - - 3,521 - - - 381,437 2,569 625 2a.1.1.5 Steam Generators 145 2,064 1,702 1,298 - 5,740 - 2,388 13,336 13,336 - - - 20,507 - - - 2,803,298 11,616 1,167 2a.1.1.6 Retired Steam Generator Units - - 1,089 1,259 - 5,588 - 1,695 9,631 9,631 - - - 19,963 - - - 2,630,356 5,400 750 2a.1.1.7 CRDMs/ICIs/Service Structure Removal 141 104 335 107 - 523 - 277 1,488 1,488 - - - 5,513 - - - 146,613 5,070 - 2a.1.1.8 Reactor Vessel Internals 92 3,088 9,251 1,368 - 7,941 304 9,033 31,077 31,077 - - - 876 1,049 393 - 279,756 30,033 1,333 2a.1.1.9 Reactor Vessel 93 5,405 2,259 1,537 - 3,019 304 6,604 19,222 19,222 - - - 9,551 - - - 979,803 30,033 1,333 2a.1.1 Totals 804 10,959 15,339 5,951 - 26,531 609 21,296 81,489 81,489 - - - 69,154 1,049 393 - 8,166,609 97,271 5,308
Removal of Major Equipment2a.1.2 Main Turbine/Generator - 319 331 98 564 456 - 326 2,094 2,094 - - 3,819 2,127 - - - 369,734 7,674 - 2a.1.3 Main Condensers - 956 161 64 558 497 - 473 2,709 2,709 - - 5,044 2,107 - - - 366,238 23,585 -
Cascading Costs from Clean Building Demolition2a.1.4.1 Reactor Building - 777 - - - - - 117 893 893 - - - - - - - - 9,379 - 2a.1.4.2 Auxiliary Building - 141 - - - - - 21 162 162 - - - - - - - - 1,898 - 2a.1.4.3 Hot Machine Shop (common) - 6 - - - - - 1 7 7 - - - - - - - - 102 - 2a.1.4.4 Interim Radwaste Building (common) - 25 - - - - - 4 29 29 - - - - - - - - 441 - 2a.1.4.5 Radwaste Facility (common) - 230 - - - - - 34 264 264 - - - - - - - - 2,577 - 2a.1.4.6 Service Building (common) - 13 - - - - - 2 15 15 - - - - - - - - 226 - 2a.1.4.7 Turbine Building - 168 - - - - - 25 193 193 - - - - - - - - 2,806 - 2a.1.4.8 Fuel Building - 102 - - - - - 15 117 117 - - - - - - - - 1,250 - 2a.1.4 Totals - 1,462 - - - - - 219 1,682 1,682 - - - - - - - - 18,679 -
Disposal of Plant Systems2a.1.5.1 Auxiliary Steam (shared) - 286 - - - - - 43 329 - - 329 - - - - - - 8,509 - 2a.1.5.2 Auxiliary Steam (shared) RCA - 114 2 4 124 - - 48 292 292 - - 1,242 - - - - 50,422 2,420 - 2a.1.5.3 Carbon Dioxide (shared) - 5 - - - - - 1 5 - - 5 - - - - - - 139 - 2a.1.5.4 Carbon Dioxide (shared) RCA - 13 0 0 13 - - 5 32 32 - - 131 - - - - 5,337 274 - 2a.1.5.5 Chemical Addition - 29 - - - - - 4 33 - - 33 - - - - - - 821 - 2a.1.5.6 Chemical Addition RCA - 25 0 1 22 - - 10 57 57 - - 222 - - - - 9,016 510 - 2a.1.5.7 Chilled Water (shared) - 142 - - - - - 21 163 - - 163 - - - - - - 4,175 - 2a.1.5.8 Condensate - 557 - - - - - 84 640 - - 640 - - - - - - 15,699 - 2a.1.5.9 Condensate (Contaminated) - 628 47 88 3,035 - - 630 4,429 4,429 - - 30,383 - - - - 1,233,881 15,479 - 2a.1.5.10 Condenser Circulating Water - 355 - - - - - 53 408 - - 408 - - - - - - 10,040 - 2a.1.5.11 Demineralized Water (shared) - 143 - - - - - 21 164 - - 164 - - - - - - 4,267 - 2a.1.5.12 Demineralized Water (shared) RCA - 88 1 2 81 - - 35 207 207 - - 808 - - - - 32,815 1,821 - 2a.1.5.13 Diesel Air (shared) - 45 - - - - - 7 52 - - 52 - - - - - - 1,367 - 2a.1.5.14 Diesel Jacket Water (shared) - 4 - - - - - 1 4 - - 4 - - - - - - 96 - 2a.1.5.15 Diesel Lube Oil (shared) - 12 - - - - - 2 14 - - 14 - - - - - - 346 - 2a.1.5.16 Electro Hydraulic Turbine Control - 19 - - - - - 3 21 - - 21 - - - - - - 499 - 2a.1.5.17 Equipment Cooling (shared) - 94 - - - - - 14 108 - - 108 - - - - - - 2,728 - 2a.1.5.18 Essential Siphon Vacuum (shared) - 89 - - - - - 13 102 - - 102 - - - - - - 2,549 - 2a.1.5.19 Feedwater & Emergency Feedwater - 172 - - - - - 26 197 - - 197 - - - - - - 4,862 - 2a.1.5.20 Feedwater & Emergency Feedwater (Cont.) - 179 8 14 487 - - 121 809 809 - - 4,873 - - - - 197,906 4,387 - 2a.1.5.21 Feedwater & Emergency Feedwater RCA - 262 8 14 481 - - 140 905 905 - - 4,815 - - - - 195,560 5,622 - 2a.1.5.22 Filtered Water (shared) - 104 - - - - - 16 120 - - 120 - - - - - - 2,925 - 2a.1.5.23 Filtered Water (shared) RCA - 80 2 3 97 - - 35 217 217 - - 975 - - - - 39,590 1,723 - 2a.1.5.24 Heater Drains - 1,604 64 120 4,137 - - 1,046 6,971 6,971 - - 41,409 - - - - 1,681,649 38,456 - 2a.1.5.25 Heater Drains (Contaminated) - 85 - - - - - 13 97 - - 97 - - - - - - 2,239 - 2a.1.5.26 Heater Vent - 33 - - - - - 5 38 - - 38 - - - - - - 1,002 -
TLG Services, Inc.

Oconee Nuclear StationDecommissioning Cost Analysis
Document D03-1671-003, Rev. 0Appendix C, Page 21 of 27
Table C-3Oconee Nuclear Station, Unit 3
DECON Decommissioning Cost Estimate(thousands of 2013 dollars)
Off-Site LLRW NRC Spent Fuel Site Processed Burial Volumes Burial / Utility andActivity Decon Removal Packaging Transport Processing Disposal Other Total Total Lic. Term. Management Restoration Volume Class A Class B Class C GTCC Processed Craft ContractorIndex Activity Description Cost Cost Costs Costs Costs Costs Costs Contingency Costs Costs Costs Costs Cu. Feet Cu. Feet Cu. Feet Cu. Feet Cu. Feet Wt., Lbs. Manhours Manhours
Disposal of Plant Systems (continued)2a.1.5.27 High Pressure Extraction - 25 - - - - - 4 29 - - 29 - - - - - - 729 - 2a.1.5.28 High Pressure Service Water (shared) - 107 - - - - - 16 123 - - 123 - - - - - - 3,016 - 2a.1.5.29 Hydraulic Oil - 2 - - - - - 0 3 - - 3 - - - - - - 75 - 2a.1.5.30 Hydrogen - 29 - - - - - 4 34 - - 34 - - - - - - 848 - 2a.1.5.31 Hydrogen Seal Oil - 31 - - - - - 5 35 - - 35 - - - - - - 899 - 2a.1.5.32 Keowee Decompressing Air (shared) - 5 - - - - - 1 6 - - 6 - - - - - - 153 - 2a.1.5.33 Low Pressure Extraction - 37 - - - - - 6 43 - - 43 - - - - - - 1,096 - 2a.1.5.34 Low Pressure Service Water (shared) - 320 - - - - - 48 368 - - 368 - - - - - - 9,404 - 2a.1.5.35 Main Steam - 89 - - - - - 13 102 - - 102 - - - - - - 2,558 - 2a.1.5.36 Main Steam RCA - 326 45 80 2,778 - - 515 3,744 3,744 - - 27,808 - - - - 1,129,284 7,747 - 2a.1.5.37 Nitrogen (shared) - 50 - - - - - 8 58 - - 58 - - - - - - 1,501 - 2a.1.5.38 Nitrogen (shared) RCA - 75 1 2 53 - - 27 158 158 - - 534 - - - - 21,704 1,492 - 2a.1.5.39 Periodic Testing (shared) - 14 - - - - - 2 17 - - 17 - - - - - - 429 - 2a.1.5.40 Plant Heating Steam (shared) - 227 - - - - - 34 261 - - 261 - - - - - - 6,722 - 2a.1.5.41 Post Accident Monitoring - 30 1 1 40 - - 14 85 85 - - 401 - - - - 16,304 785 - 2a.1.5.42 Protected Water System (shared) - 51 - - - - - 8 59 - - 59 - - - - - - 1,366 - 2a.1.5.43 Reactor Building Spray - 95 3 6 210 - - 56 371 371 - - 2,105 - - - - 85,488 2,170 - 2a.1.5.44 Recirc Cooling Water - 192 - - - - - 29 221 - - 221 - - - - - - 5,547 - 2a.1.5.45 Recirc Cooling Water RCA - 135 3 5 173 - - 61 376 376 - - 1,727 - - - - 70,146 2,938 - 2a.1.5.46 Sample Monitoring - 117 14 15 24 146 - 73 389 389 - - 244 618 - - - 50,777 3,113 - 2a.1.5.47 Second Side Cool Trtment Pond (shared) - 39 - - - - - 6 45 - - 45 - - - - - - 1,108 - 2a.1.5.48 Service Air (shared) - 42 - - - - - 6 48 - - 48 - - - - - - 1,254 - 2a.1.5.49 Standby Shutdown Facility (shared) - 28 - - - - - 4 32 - - 32 - - - - - - 841 - 2a.1.5.50 Stator Coolant - 51 - - - - - 8 59 - - 59 - - - - - - 1,507 - 2a.1.5.51 Steam Drain - 86 - - - - - 13 99 - - 99 - - - - - - 2,668 - 2a.1.5.52 Steam Seal - 52 1 2 53 - - 21 129 129 - - 533 - - - - 21,649 1,169 - 2a.1.5.53 Turbine Oil - 128 - - - - - 19 147 - - 147 - - - - - - 3,518 - 2a.1.5.54 Vacuum - 120 - - - - - 18 138 - - 138 - - - - - - 3,438 - 2a.1.5 Totals - 7,669 199 356 11,810 146 - 3,414 23,593 19,169 - 4,423 118,213 618 - - - 4,841,527 201,044 -
2a.1.6 Scaffolding in support of decommissioning - 767 18 4 85 16 - 211 1,102 1,102 - - 771 68 - - - 39,175 23,141 -
2a.1 Subtotal Period 2a Activity Costs 804 22,133 16,049 6,473 13,017 27,646 609 25,939 112,669 108,246 - 4,423 127,847 74,073 1,049 393 - 13,783,280 371,393 5,308
Period 2a Additional Costs2a.2.1 Misc. Waste Disposal - - 36 239 - 1,716 - 468 2,460 2,460 - - - 17,591 - - - 487,058 1,076 - 2a.2.2 Remedial Action Surveys - - - - - - 1,627 488 2,115 2,115 - - - - - - - - 33,315 - 2a.2 Subtotal Period 2a Additional Costs - - 36 239 - 1,716 1,627 957 4,575 4,575 - - - 17,591 - - - 487,058 34,391 -
Period 2a Collateral Costs2a.3.1 Process decommissioning water waste 58 - 26 133 - 155 - 90 462 462 - - - 371 - - - 22,260 72 - 2a.3.3 Small tool allowance - 292 - - - - - 44 335 302 - 34 - - - - - - - - 2a.3.4 Spent Fuel Capital and Transfer - - - - - - 1,035 155 1,190 - 1,190 - - - - - - - - - 2a.3 Subtotal Period 2a Collateral Costs 58 292 26 133 - 155 1,035 289 1,988 764 1,190 34 - 371 - - - 22,260 72 -
Period 2a Period-Dependent Costs2a.4.1 Decon supplies 93 - - - - - - 23 116 116 - - - - - - - - - - 2a.4.2 Insurance - - - - - - 622 62 684 684 - - - - - - - - - - 2a.4.3 Property taxes - - - - - - 2,098 210 2,308 2,077 - 231 - - - - - - - - 2a.4.4 Health physics supplies - 2,645 - - - - - 661 3,306 3,306 - - - - - - - - - - 2a.4.5 Heavy equipment rental - 3,506 - - - - - 526 4,032 4,032 - - - - - - - - - - 2a.4.6 Disposal of DAW generated - - 110 16 - 247 - 75 448 448 - - - 5,057 - - - 101,134 165 - 2a.4.7 Plant energy budget - - - - - - 939 141 1,080 1,080 - - - - - - - - - - 2a.4.8 NRC Fees - - - - - - 558 56 614 614 - - - - - - - - - - 2a.4.9 Emergency Planning Fees - - - - - - 208 21 228 - 228 - - - - - - - - - 2a.4.10 Spent Fuel Pool O&M - - - - - - 1,254 188 1,443 - 1,443 - - - - - - - - - 2a.4.11 ISFSI Operating Costs - - - - - - 179 27 206 - 206 - - - - - - - - - 2a.4.12 Corporate A&G - - - - - - 4,146 622 4,767 4,767 - - - - - - - - - - 2a.4.13 Site O&M - - - - - - 403 60 463 463 - - - - - - - - - - 2a.4.14 Security Staff Cost - - - - - - 3,089 463 3,552 3,552 - - - - - - - - - 94,436 2a.4.15 Utility Staff Cost - - - - - - 42,286 6,343 48,629 48,629 - - - - - - - - - 693,643 2a.4 Subtotal Period 2a Period-Dependent Costs 93 6,151 110 16 - 247 55,781 9,478 71,877 69,770 1,876 231 - 5,057 - - - 101,134 165 788,079
2a.0 TOTAL PERIOD 2a COST 955 28,576 16,222 6,861 13,017 29,763 59,053 36,663 191,109 183,354 3,067 4,688 127,847 97,092 1,049 393 - 14,393,740 406,021 793,387
TLG Services, Inc.
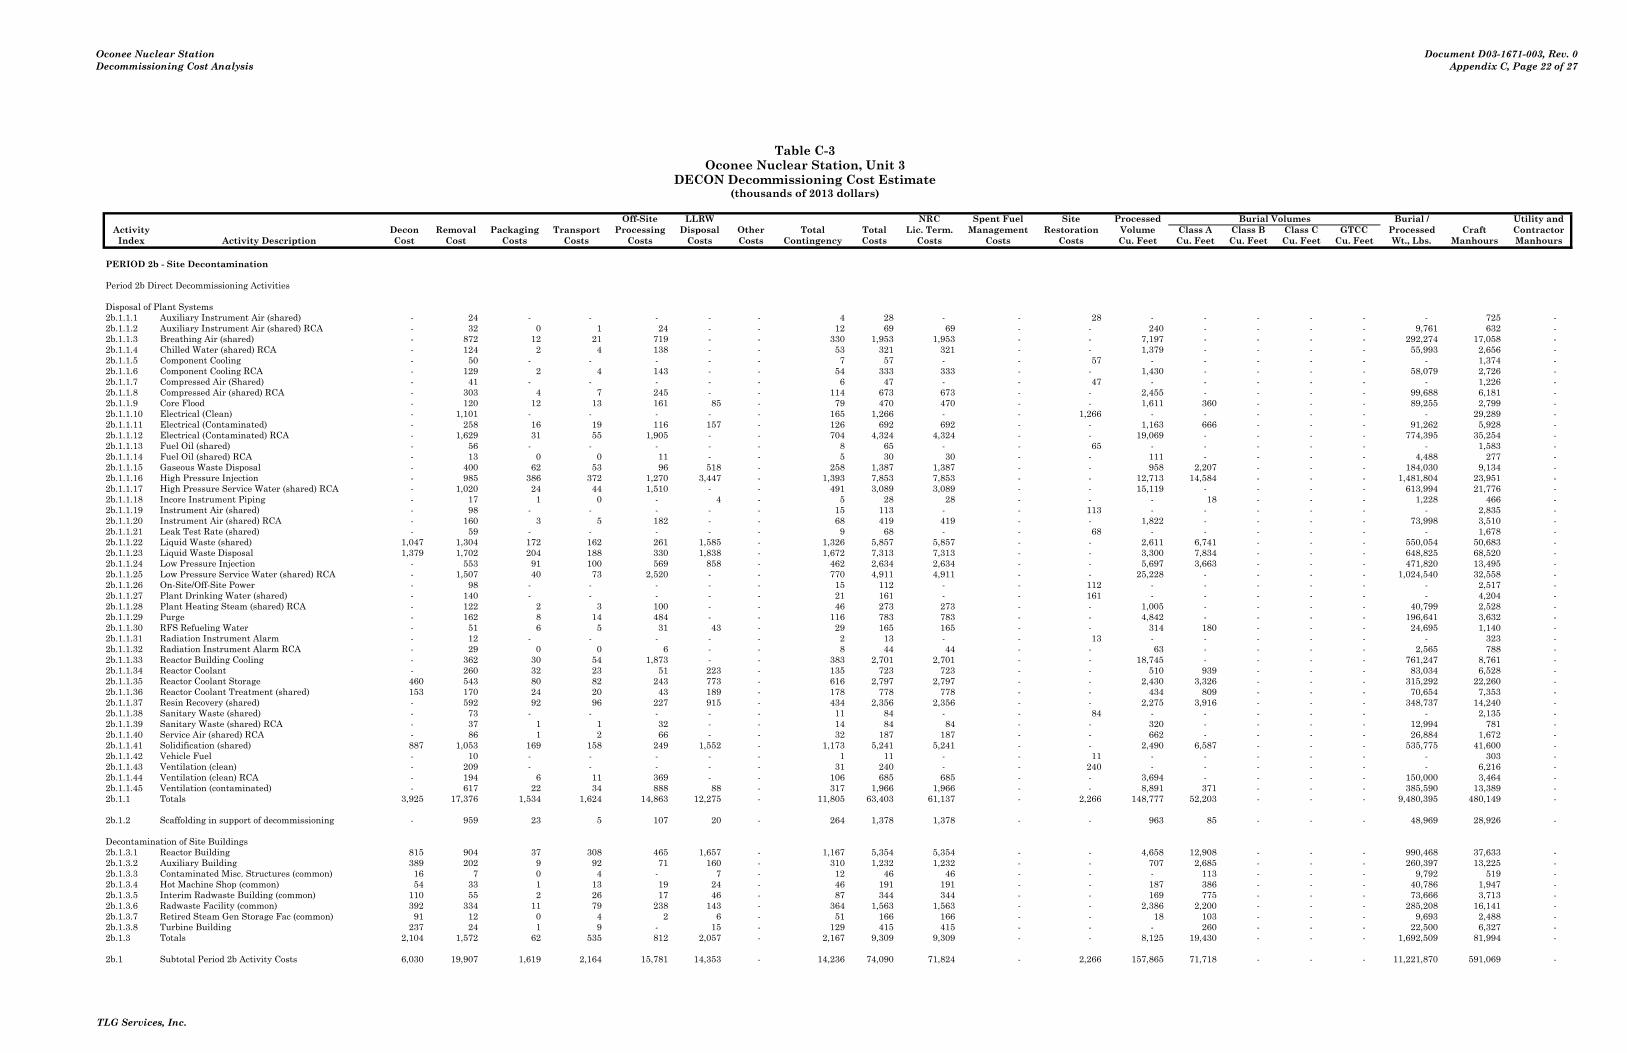
Oconee Nuclear StationDecommissioning Cost Analysis
Document D03-1671-003, Rev. 0Appendix C, Page 22 of 27
Table C-3Oconee Nuclear Station, Unit 3
DECON Decommissioning Cost Estimate(thousands of 2013 dollars)
Off-Site LLRW NRC Spent Fuel Site Processed Burial Volumes Burial / Utility andActivity Decon Removal Packaging Transport Processing Disposal Other Total Total Lic. Term. Management Restoration Volume Class A Class B Class C GTCC Processed Craft ContractorIndex Activity Description Cost Cost Costs Costs Costs Costs Costs Contingency Costs Costs Costs Costs Cu. Feet Cu. Feet Cu. Feet Cu. Feet Cu. Feet Wt., Lbs. Manhours Manhours
PERIOD 2b - Site Decontamination
Period 2b Direct Decommissioning Activities
Disposal of Plant Systems2b.1.1.1 Auxiliary Instrument Air (shared) - 24 - - - - - 4 28 - - 28 - - - - - - 725 - 2b.1.1.2 Auxiliary Instrument Air (shared) RCA - 32 0 1 24 - - 12 69 69 - - 240 - - - - 9,761 632 - 2b.1.1.3 Breathing Air (shared) - 872 12 21 719 - - 330 1,953 1,953 - - 7,197 - - - - 292,274 17,058 - 2b.1.1.4 Chilled Water (shared) RCA - 124 2 4 138 - - 53 321 321 - - 1,379 - - - - 55,993 2,656 - 2b.1.1.5 Component Cooling - 50 - - - - - 7 57 - - 57 - - - - - - 1,374 - 2b.1.1.6 Component Cooling RCA - 129 2 4 143 - - 54 333 333 - - 1,430 - - - - 58,079 2,726 - 2b.1.1.7 Compressed Air (Shared) - 41 - - - - - 6 47 - - 47 - - - - - - 1,226 - 2b.1.1.8 Compressed Air (shared) RCA - 303 4 7 245 - - 114 673 673 - - 2,455 - - - - 99,688 6,181 - 2b.1.1.9 Core Flood - 120 12 13 161 85 - 79 470 470 - - 1,611 360 - - - 89,255 2,799 - 2b.1.1.10 Electrical (Clean) - 1,101 - - - - - 165 1,266 - - 1,266 - - - - - - 29,289 - 2b.1.1.11 Electrical (Contaminated) - 258 16 19 116 157 - 126 692 692 - - 1,163 666 - - - 91,262 5,928 - 2b.1.1.12 Electrical (Contaminated) RCA - 1,629 31 55 1,905 - - 704 4,324 4,324 - - 19,069 - - - - 774,395 35,254 - 2b.1.1.13 Fuel Oil (shared) - 56 - - - - - 8 65 - - 65 - - - - - - 1,583 - 2b.1.1.14 Fuel Oil (shared) RCA - 13 0 0 11 - - 5 30 30 - - 111 - - - - 4,488 277 - 2b.1.1.15 Gaseous Waste Disposal - 400 62 53 96 518 - 258 1,387 1,387 - - 958 2,207 - - - 184,030 9,134 - 2b.1.1.16 High Pressure Injection - 985 386 372 1,270 3,447 - 1,393 7,853 7,853 - - 12,713 14,584 - - - 1,481,804 23,951 - 2b.1.1.17 High Pressure Service Water (shared) RCA - 1,020 24 44 1,510 - - 491 3,089 3,089 - - 15,119 - - - - 613,994 21,776 - 2b.1.1.18 Incore Instrument Piping - 17 1 0 - 4 - 5 28 28 - - - 18 - - - 1,228 466 - 2b.1.1.19 Instrument Air (shared) - 98 - - - - - 15 113 - - 113 - - - - - - 2,835 - 2b.1.1.20 Instrument Air (shared) RCA - 160 3 5 182 - - 68 419 419 - - 1,822 - - - - 73,998 3,510 - 2b.1.1.21 Leak Test Rate (shared) - 59 - - - - - 9 68 - - 68 - - - - - - 1,678 - 2b.1.1.22 Liquid Waste (shared) 1,047 1,304 172 162 261 1,585 - 1,326 5,857 5,857 - - 2,611 6,741 - - - 550,054 50,683 - 2b.1.1.23 Liquid Waste Disposal 1,379 1,702 204 188 330 1,838 - 1,672 7,313 7,313 - - 3,300 7,834 - - - 648,825 68,520 - 2b.1.1.24 Low Pressure Injection - 553 91 100 569 858 - 462 2,634 2,634 - - 5,697 3,663 - - - 471,820 13,495 - 2b.1.1.25 Low Pressure Service Water (shared) RCA - 1,507 40 73 2,520 - - 770 4,911 4,911 - - 25,228 - - - - 1,024,540 32,558 - 2b.1.1.26 On-Site/Off-Site Power - 98 - - - - - 15 112 - - 112 - - - - - - 2,517 - 2b.1.1.27 Plant Drinking Water (shared) - 140 - - - - - 21 161 - - 161 - - - - - - 4,204 - 2b.1.1.28 Plant Heating Steam (shared) RCA - 122 2 3 100 - - 46 273 273 - - 1,005 - - - - 40,799 2,528 - 2b.1.1.29 Purge - 162 8 14 484 - - 116 783 783 - - 4,842 - - - - 196,641 3,632 - 2b.1.1.30 RFS Refueling Water - 51 6 5 31 43 - 29 165 165 - - 314 180 - - - 24,695 1,140 - 2b.1.1.31 Radiation Instrument Alarm - 12 - - - - - 2 13 - - 13 - - - - - - 323 - 2b.1.1.32 Radiation Instrument Alarm RCA - 29 0 0 6 - - 8 44 44 - - 63 - - - - 2,565 788 - 2b.1.1.33 Reactor Building Cooling - 362 30 54 1,873 - - 383 2,701 2,701 - - 18,745 - - - - 761,247 8,761 - 2b.1.1.34 Reactor Coolant - 260 32 23 51 223 - 135 723 723 - - 510 939 - - - 83,034 6,528 - 2b.1.1.35 Reactor Coolant Storage 460 543 80 82 243 773 - 616 2,797 2,797 - - 2,430 3,326 - - - 315,292 22,260 - 2b.1.1.36 Reactor Coolant Treatment (shared) 153 170 24 20 43 189 - 178 778 778 - - 434 809 - - - 70,654 7,353 - 2b.1.1.37 Resin Recovery (shared) - 592 92 96 227 915 - 434 2,356 2,356 - - 2,275 3,916 - - - 348,737 14,240 - 2b.1.1.38 Sanitary Waste (shared) - 73 - - - - - 11 84 - - 84 - - - - - - 2,135 - 2b.1.1.39 Sanitary Waste (shared) RCA - 37 1 1 32 - - 14 84 84 - - 320 - - - - 12,994 781 - 2b.1.1.40 Service Air (shared) RCA - 86 1 2 66 - - 32 187 187 - - 662 - - - - 26,884 1,672 - 2b.1.1.41 Solidification (shared) 887 1,053 169 158 249 1,552 - 1,173 5,241 5,241 - - 2,490 6,587 - - - 535,775 41,600 - 2b.1.1.42 Vehicle Fuel - 10 - - - - - 1 11 - - 11 - - - - - - 303 - 2b.1.1.43 Ventilation (clean) - 209 - - - - - 31 240 - - 240 - - - - - - 6,216 - 2b.1.1.44 Ventilation (clean) RCA - 194 6 11 369 - - 106 685 685 - - 3,694 - - - - 150,000 3,464 - 2b.1.1.45 Ventilation (contaminated) - 617 22 34 888 88 - 317 1,966 1,966 - - 8,891 371 - - - 385,590 13,389 - 2b.1.1 Totals 3,925 17,376 1,534 1,624 14,863 12,275 - 11,805 63,403 61,137 - 2,266 148,777 52,203 - - - 9,480,395 480,149 -
2b.1.2 Scaffolding in support of decommissioning - 959 23 5 107 20 - 264 1,378 1,378 - - 963 85 - - - 48,969 28,926 -
Decontamination of Site Buildings2b.1.3.1 Reactor Building 815 904 37 308 465 1,657 - 1,167 5,354 5,354 - - 4,658 12,908 - - - 990,468 37,633 - 2b.1.3.2 Auxiliary Building 389 202 9 92 71 160 - 310 1,232 1,232 - - 707 2,685 - - - 260,397 13,225 - 2b.1.3.3 Contaminated Misc. Structures (common) 16 7 0 4 - 7 - 12 46 46 - - - 113 - - - 9,792 519 - 2b.1.3.4 Hot Machine Shop (common) 54 33 1 13 19 24 - 46 191 191 - - 187 386 - - - 40,786 1,947 - 2b.1.3.5 Interim Radwaste Building (common) 110 55 2 26 17 46 - 87 344 344 - - 169 775 - - - 73,666 3,713 - 2b.1.3.6 Radwaste Facility (common) 392 334 11 79 238 143 - 364 1,563 1,563 - - 2,386 2,200 - - - 285,208 16,141 - 2b.1.3.7 Retired Steam Gen Storage Fac (common) 91 12 0 4 2 6 - 51 166 166 - - 18 103 - - - 9,693 2,488 - 2b.1.3.8 Turbine Building 237 24 1 9 - 15 - 129 415 415 - - - 260 - - - 22,500 6,327 - 2b.1.3 Totals 2,104 1,572 62 535 812 2,057 - 2,167 9,309 9,309 - - 8,125 19,430 - - - 1,692,509 81,994 -
2b.1 Subtotal Period 2b Activity Costs 6,030 19,907 1,619 2,164 15,781 14,353 - 14,236 74,090 71,824 - 2,266 157,865 71,718 - - - 11,221,870 591,069 -
TLG Services, Inc.

Oconee Nuclear StationDecommissioning Cost Analysis
Document D03-1671-003, Rev. 0Appendix C, Page 23 of 27
Table C-3Oconee Nuclear Station, Unit 3
DECON Decommissioning Cost Estimate(thousands of 2013 dollars)
Off-Site LLRW NRC Spent Fuel Site Processed Burial Volumes Burial / Utility andActivity Decon Removal Packaging Transport Processing Disposal Other Total Total Lic. Term. Management Restoration Volume Class A Class B Class C GTCC Processed Craft ContractorIndex Activity Description Cost Cost Costs Costs Costs Costs Costs Contingency Costs Costs Costs Costs Cu. Feet Cu. Feet Cu. Feet Cu. Feet Cu. Feet Wt., Lbs. Manhours Manhours
Period 2b Additional Costs2b.2.1 Containment Paint Remediation 79 - 9 14 - 105 - 69 275 275 - - - 452 - - - - 800 - 2b.2.2 Landfill and Firing Range Closure - - - - - - 645 64 709 - - 709 - - - - - - - - 2b.2.3 Underground Services Excavation - 882 - - - - 508 209 1,599 - - 1,599 - - - - - - 10,000 - 2b.2.4 Pond Closures - - - - - - 1,068 160 1,228 - - 1,228 - - - - - - 2,572 - 2b.2.5 Remedial Action Surveys - - - - - - 2,439 732 3,171 3,171 - - - - - - - - 49,937 - 2b.2.6 RX Closure Head Disposal - 117 521 784 - 724 - 380 2,526 2,526 - - - 2,815 - - - 340,201 3,761 2,000 2b.2 Subtotal Period 2b Additional Costs 79 999 530 798 - 828 4,660 1,613 9,508 5,972 - 3,536 - 3,267 - - - 340,201 67,071 2,000
Period 2b Collateral Costs2b.3.1 Process decommissioning water waste 199 - 93 472 - 549 - 317 1,630 1,630 - - - 1,316 - - - 78,984 257 - 2b.3.2 Process decommissioning chemical flush waste 4 - 140 950 - 1,529 - 541 3,163 3,163 - - - 2,064 - - - 219,951 386 - 2b.3.3 Small tool allowance - 411 - - - - - 62 473 473 - - - - - - - - - - 2b.3.4 Spent Fuel Capital and Transfer - - - - - - 1,255 188 1,443 - 1,443 - - - - - - - - - 2b.3 Subtotal Period 2b Collateral Costs 203 411 233 1,421 - 2,078 1,255 1,108 6,710 5,266 1,443 - - 3,381 - - - 298,935 643 -
Period 2b Period-Dependent Costs2b.4.1 Decon supplies 1,306 - - - - - - 327 1,633 1,633 - - - - - - - - - - 2b.4.2 Insurance - - - - - - 932 93 1,025 1,025 - - - - - - - - - - 2b.4.3 Property taxes - - - - - - 2,461 246 2,707 2,707 - - - - - - - - - - 2b.4.4 Health physics supplies - 4,178 - - - - - 1,044 5,222 5,222 - - - - - - - - - - 2b.4.5 Heavy equipment rental - 5,204 - - - - - 781 5,985 5,985 - - - - - - - - - - 2b.4.6 Disposal of DAW generated - - 179 26 - 402 - 122 729 729 - - - 8,230 - - - 164,594 268 - 2b.4.7 Plant energy budget - - - - - - 1,111 167 1,278 1,278 - - - - - - - - - - 2b.4.8 NRC Fees - - - - - - 837 84 920 920 - - - - - - - - - - 2b.4.9 Emergency Planning Fees - - - - - - 311 31 342 - 342 - - - - - - - - - 2b.4.10 Spent Fuel Pool O&M - - - - - - 1,881 282 2,163 - 2,163 - - - - - - - - - 2b.4.11 Liquid Radwaste Processing Equipment/Services - - - - - - 477 72 549 549 - - - - - - - - - - 2b.4.12 ISFSI Operating Costs - - - - - - 268 40 308 - 308 - - - - - - - - - 2b.4.13 Corporate A&G - - - - - - 5,945 892 6,837 6,837 - - - - - - - - - - 2b.4.14 Site O&M - - - - - - 578 87 665 665 - - - - - - - - - - 2b.4.15 Security Staff Cost - - - - - - 4,631 695 5,326 5,326 - - - - - - - - - 141,573 2b.4.16 Utility Staff Cost - - - - - - 60,753 9,113 69,866 69,866 - - - - - - - - - 994,769 2b.4 Subtotal Period 2b Period-Dependent Costs 1,306 9,382 179 26 - 402 80,185 14,075 105,555 102,742 2,813 - - 8,230 - - - 164,594 268 1,136,341
2b.0 TOTAL PERIOD 2b COST 7,618 30,699 2,562 4,409 15,781 17,660 86,100 31,032 195,862 185,804 4,256 5,802 157,865 86,594 - - - 12,025,600 659,052 1,138,341
PERIOD 2c - Spent fuel delay prior to SFP decon
Period 2c Direct Decommissioning Activities
Period 2c Additional Costs2c.2.1 Landfill Post Closure Maintenance - - - - - - 153 15 169 - - 169 - - - - - - - - 2c.2 Subtotal Period 2c Additional Costs - - - - - - 153 15 169 - - 169 - - - - - - - -
Period 2c Collateral Costs2c.3.1 Spent Fuel Capital and Transfer - - - - - - 3,964 595 4,559 - 4,559 - - - - - - - - - 2c.3 Subtotal Period 2c Collateral Costs - - - - - - 3,964 595 4,559 - 4,559 - - - - - - - - -
Period 2c Period-Dependent Costs2c.4.1 Insurance - - - - - - 1,825 183 2,008 2,008 - - - - - - - - - - 2c.4.2 Property taxes - - - - - - 1,299 130 1,429 1,429 - - - - - - - - - - 2c.4.3 Health physics supplies - 1,712 - - - - - 428 2,139 2,139 - - - - - - - - - - 2c.4.4 Disposal of DAW generated - - 42 6 - 95 - 29 172 172 - - - 1,941 - - - 38,816 63 - 2c.4.5 Plant energy budget - - - - - - 580 87 667 667 - - - - - - - - - - 2c.4.6 NRC Fees - - - - - - 1,216 122 1,338 1,338 - - - - - - - - - - 2c.4.7 Emergency Planning Fees - - - - - - 609 61 670 - 670 - - - - - - - - - 2c.4.8 Spent Fuel Pool O&M - - - - - - 3,682 552 4,234 - 4,234 - - - - - - - - - 2c.4.9 ISFSI Operating Costs - - - - - - 524 79 603 - 603 - - - - - - - - - 2c.4.10 Corporate A&G - - - - - - 2,316 347 2,664 2,664 - - - - - - - - - - 2c.4.11 Site O&M - - - - - - 225 34 259 259 - - - - - - - - - - 2c.4.12 Security Staff Cost - - - - - - 6,999 1,050 8,049 8,049 - - - - - - - - - 208,493 2c.4.13 Utility Staff Cost - - - - - - 23,777 3,567 27,344 27,344 - - - - - - - - - 387,551 2c.4 Subtotal Period 2c Period-Dependent Costs - 1,712 42 6 - 95 43,054 6,667 51,576 46,068 5,507 - - 1,941 - - - 38,816 63 596,044
2c.0 TOTAL PERIOD 2c COST - 1,712 42 6 - 95 47,171 7,277 56,303 46,068 10,067 169 - 1,941 - - - 38,816 63 596,044
TLG Services, Inc.
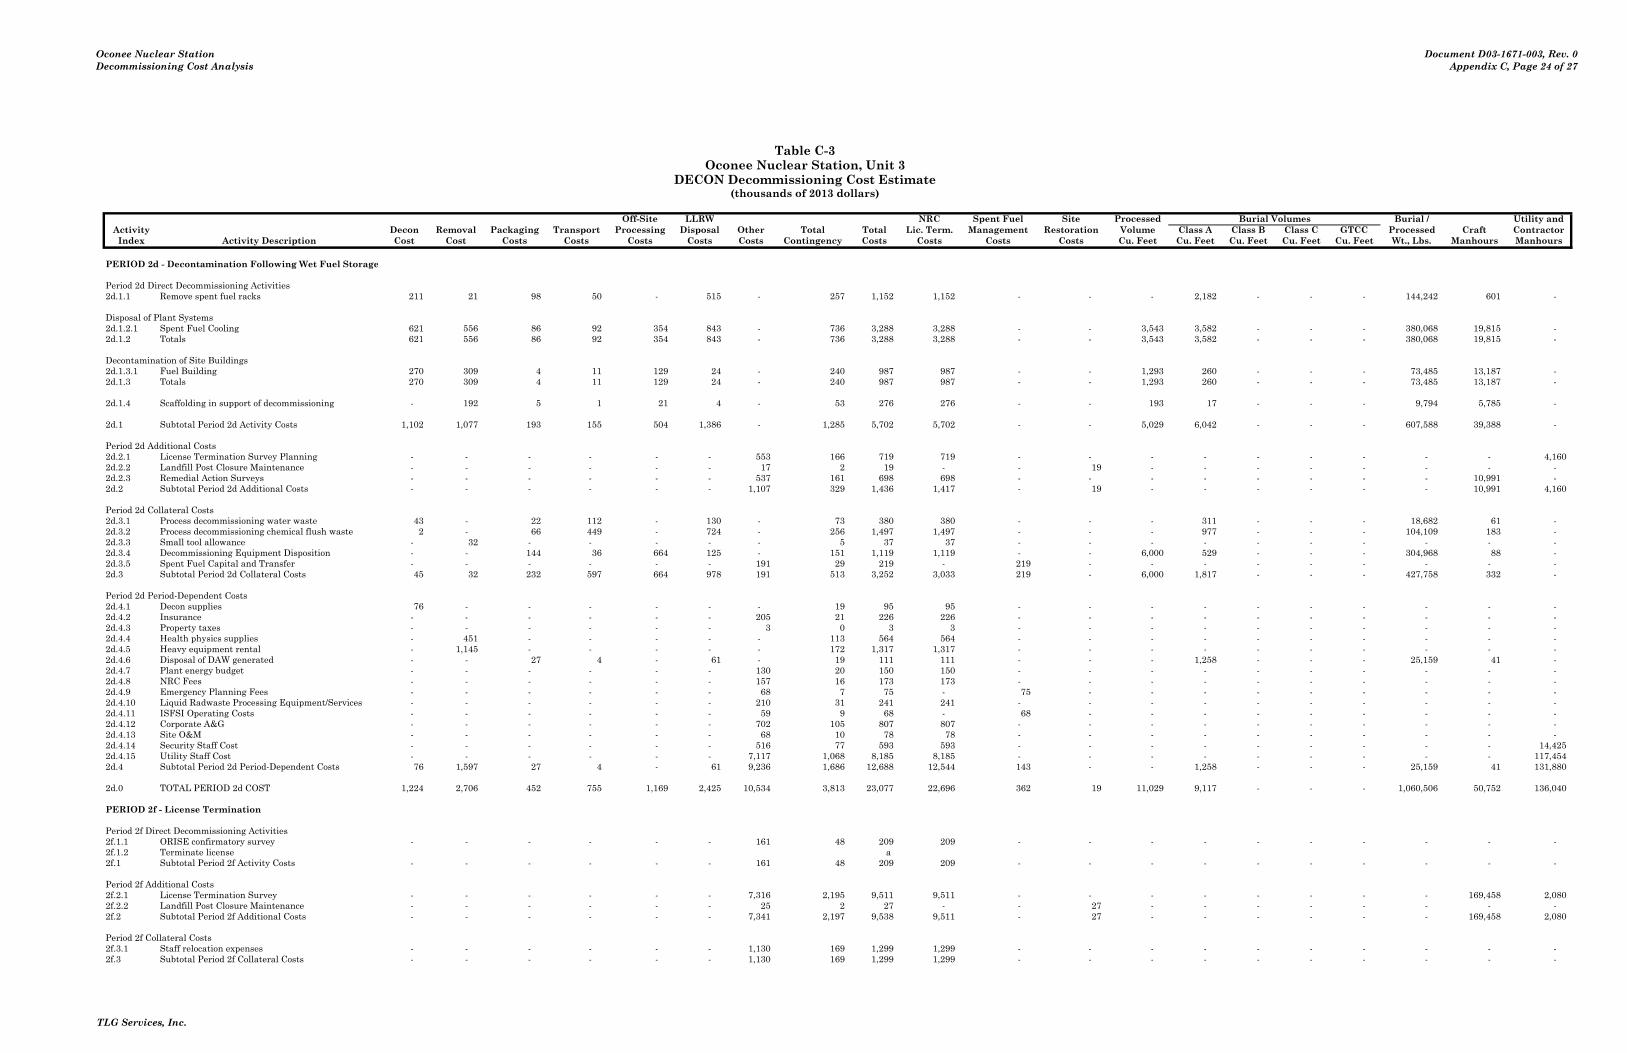
Oconee Nuclear StationDecommissioning Cost Analysis
Document D03-1671-003, Rev. 0Appendix C, Page 24 of 27
Table C-3Oconee Nuclear Station, Unit 3
DECON Decommissioning Cost Estimate(thousands of 2013 dollars)
Off-Site LLRW NRC Spent Fuel Site Processed Burial Volumes Burial / Utility andActivity Decon Removal Packaging Transport Processing Disposal Other Total Total Lic. Term. Management Restoration Volume Class A Class B Class C GTCC Processed Craft ContractorIndex Activity Description Cost Cost Costs Costs Costs Costs Costs Contingency Costs Costs Costs Costs Cu. Feet Cu. Feet Cu. Feet Cu. Feet Cu. Feet Wt., Lbs. Manhours Manhours
PERIOD 2d - Decontamination Following Wet Fuel Storage
Period 2d Direct Decommissioning Activities2d.1.1 Remove spent fuel racks 211 21 98 50 - 515 - 257 1,152 1,152 - - - 2,182 - - - 144,242 601 -
Disposal of Plant Systems2d.1.2.1 Spent Fuel Cooling 621 556 86 92 354 843 - 736 3,288 3,288 - - 3,543 3,582 - - - 380,068 19,815 - 2d.1.2 Totals 621 556 86 92 354 843 - 736 3,288 3,288 - - 3,543 3,582 - - - 380,068 19,815 -
Decontamination of Site Buildings2d.1.3.1 Fuel Building 270 309 4 11 129 24 - 240 987 987 - - 1,293 260 - - - 73,485 13,187 - 2d.1.3 Totals 270 309 4 11 129 24 - 240 987 987 - - 1,293 260 - - - 73,485 13,187 -
2d.1.4 Scaffolding in support of decommissioning - 192 5 1 21 4 - 53 276 276 - - 193 17 - - - 9,794 5,785 -
2d.1 Subtotal Period 2d Activity Costs 1,102 1,077 193 155 504 1,386 - 1,285 5,702 5,702 - - 5,029 6,042 - - - 607,588 39,388 -
Period 2d Additional Costs2d.2.1 License Termination Survey Planning - - - - - - 553 166 719 719 - - - - - - - - - 4,160 2d.2.2 Landfill Post Closure Maintenance - - - - - - 17 2 19 - - 19 - - - - - - - - 2d.2.3 Remedial Action Surveys - - - - - - 537 161 698 698 - - - - - - - - 10,991 - 2d.2 Subtotal Period 2d Additional Costs - - - - - - 1,107 329 1,436 1,417 - 19 - - - - - - 10,991 4,160
Period 2d Collateral Costs2d.3.1 Process decommissioning water waste 43 - 22 112 - 130 - 73 380 380 - - - 311 - - - 18,682 61 - 2d.3.2 Process decommissioning chemical flush waste 2 - 66 449 - 724 - 256 1,497 1,497 - - - 977 - - - 104,109 183 - 2d.3.3 Small tool allowance - 32 - - - - - 5 37 37 - - - - - - - - - - 2d.3.4 Decommissioning Equipment Disposition - - 144 36 664 125 - 151 1,119 1,119 - - 6,000 529 - - - 304,968 88 - 2d.3.5 Spent Fuel Capital and Transfer - - - - - - 191 29 219 - 219 - - - - - - - - - 2d.3 Subtotal Period 2d Collateral Costs 45 32 232 597 664 978 191 513 3,252 3,033 219 - 6,000 1,817 - - - 427,758 332 -
Period 2d Period-Dependent Costs2d.4.1 Decon supplies 76 - - - - - - 19 95 95 - - - - - - - - - - 2d.4.2 Insurance - - - - - - 205 21 226 226 - - - - - - - - - - 2d.4.3 Property taxes - - - - - - 3 0 3 3 - - - - - - - - - - 2d.4.4 Health physics supplies - 451 - - - - - 113 564 564 - - - - - - - - - - 2d.4.5 Heavy equipment rental - 1,145 - - - - - 172 1,317 1,317 - - - - - - - - - - 2d.4.6 Disposal of DAW generated - - 27 4 - 61 - 19 111 111 - - - 1,258 - - - 25,159 41 - 2d.4.7 Plant energy budget - - - - - - 130 20 150 150 - - - - - - - - - - 2d.4.8 NRC Fees - - - - - - 157 16 173 173 - - - - - - - - - - 2d.4.9 Emergency Planning Fees - - - - - - 68 7 75 - 75 - - - - - - - - - 2d.4.10 Liquid Radwaste Processing Equipment/Services - - - - - - 210 31 241 241 - - - - - - - - - - 2d.4.11 ISFSI Operating Costs - - - - - - 59 9 68 - 68 - - - - - - - - - 2d.4.12 Corporate A&G - - - - - - 702 105 807 807 - - - - - - - - - - 2d.4.13 Site O&M - - - - - - 68 10 78 78 - - - - - - - - - - 2d.4.14 Security Staff Cost - - - - - - 516 77 593 593 - - - - - - - - - 14,425 2d.4.15 Utility Staff Cost - - - - - - 7,117 1,068 8,185 8,185 - - - - - - - - - 117,454 2d.4 Subtotal Period 2d Period-Dependent Costs 76 1,597 27 4 - 61 9,236 1,686 12,688 12,544 143 - - 1,258 - - - 25,159 41 131,880
2d.0 TOTAL PERIOD 2d COST 1,224 2,706 452 755 1,169 2,425 10,534 3,813 23,077 22,696 362 19 11,029 9,117 - - - 1,060,506 50,752 136,040
PERIOD 2f - License Termination
Period 2f Direct Decommissioning Activities2f.1.1 ORISE confirmatory survey - - - - - - 161 48 209 209 - - - - - - - - - - 2f.1.2 Terminate license a 2f.1 Subtotal Period 2f Activity Costs - - - - - - 161 48 209 209 - - - - - - - - - -
Period 2f Additional Costs2f.2.1 License Termination Survey - - - - - - 7,316 2,195 9,511 9,511 - - - - - - - - 169,458 2,080 2f.2.2 Landfill Post Closure Maintenance - - - - - - 25 2 27 - - 27 - - - - - - - - 2f.2 Subtotal Period 2f Additional Costs - - - - - - 7,341 2,197 9,538 9,511 - 27 - - - - - - 169,458 2,080
Period 2f Collateral Costs2f.3.1 Staff relocation expenses - - - - - - 1,130 169 1,299 1,299 - - - - - - - - - - 2f.3 Subtotal Period 2f Collateral Costs - - - - - - 1,130 169 1,299 1,299 - - - - - - - - - -
TLG Services, Inc.
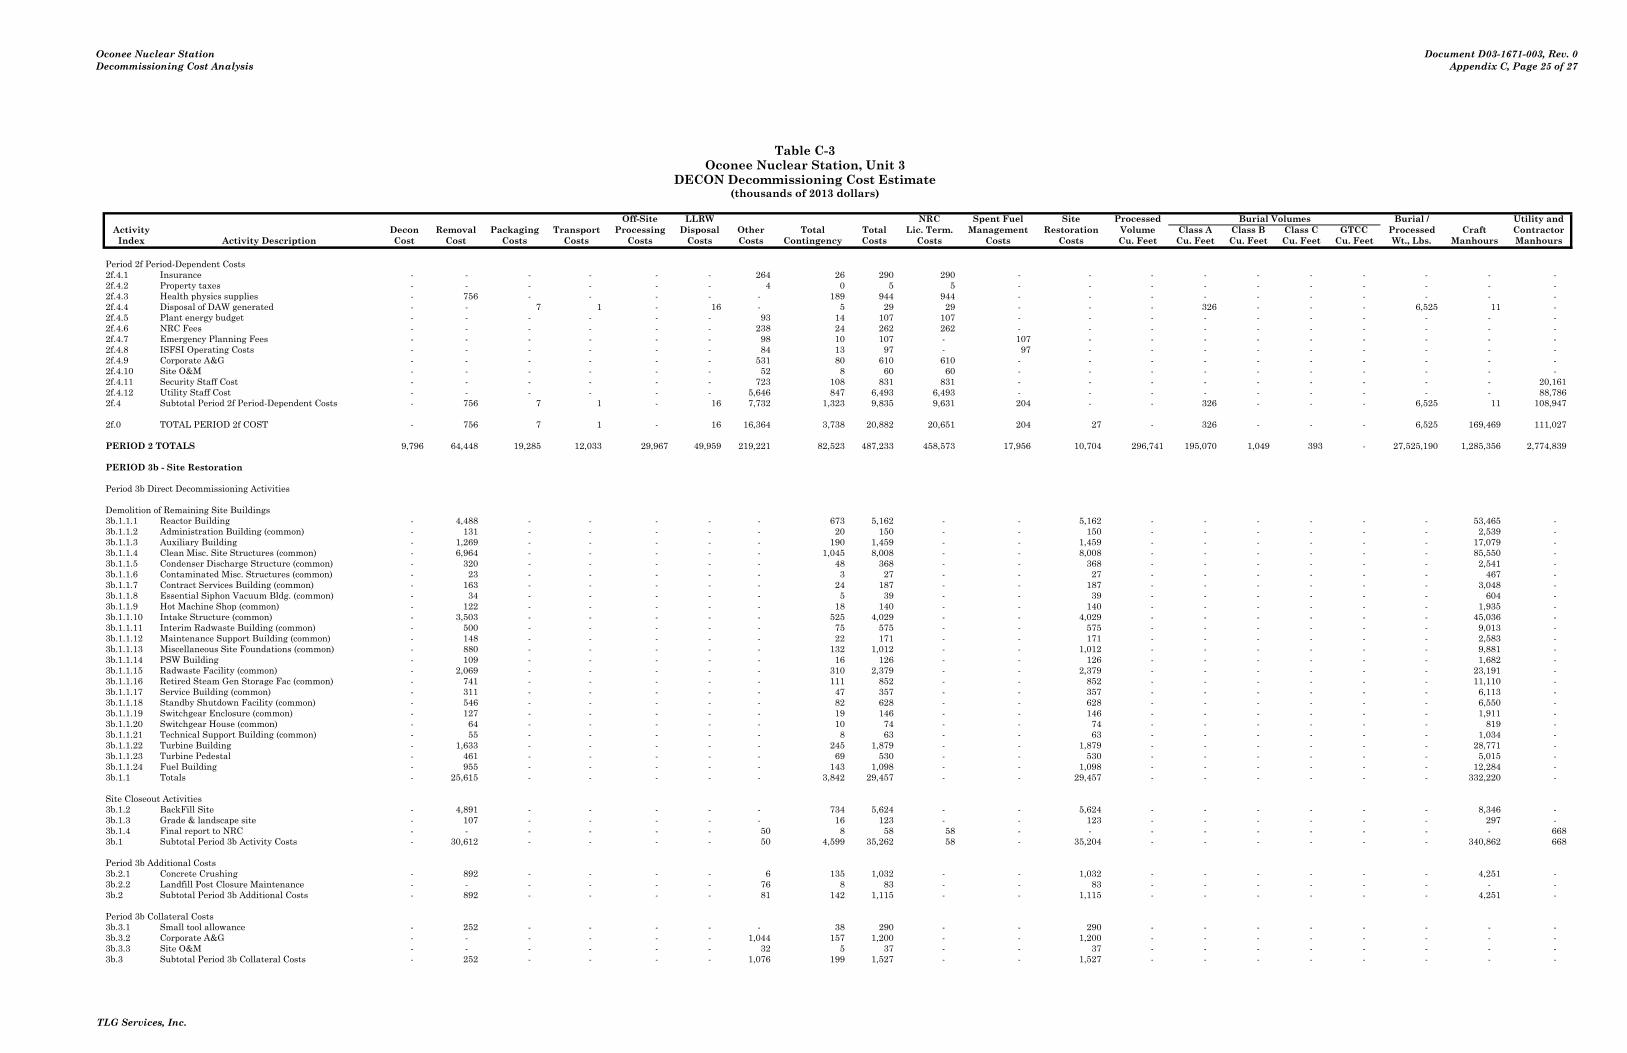
Oconee Nuclear StationDecommissioning Cost Analysis
Document D03-1671-003, Rev. 0Appendix C, Page 25 of 27
Table C-3Oconee Nuclear Station, Unit 3
DECON Decommissioning Cost Estimate(thousands of 2013 dollars)
Off-Site LLRW NRC Spent Fuel Site Processed Burial Volumes Burial / Utility andActivity Decon Removal Packaging Transport Processing Disposal Other Total Total Lic. Term. Management Restoration Volume Class A Class B Class C GTCC Processed Craft ContractorIndex Activity Description Cost Cost Costs Costs Costs Costs Costs Contingency Costs Costs Costs Costs Cu. Feet Cu. Feet Cu. Feet Cu. Feet Cu. Feet Wt., Lbs. Manhours Manhours
Period 2f Period-Dependent Costs2f.4.1 Insurance - - - - - - 264 26 290 290 - - - - - - - - - - 2f.4.2 Property taxes - - - - - - 4 0 5 5 - - - - - - - - - - 2f.4.3 Health physics supplies - 756 - - - - - 189 944 944 - - - - - - - - - - 2f.4.4 Disposal of DAW generated - - 7 1 - 16 - 5 29 29 - - - 326 - - - 6,525 11 - 2f.4.5 Plant energy budget - - - - - - 93 14 107 107 - - - - - - - - - - 2f.4.6 NRC Fees - - - - - - 238 24 262 262 - - - - - - - - - - 2f.4.7 Emergency Planning Fees - - - - - - 98 10 107 - 107 - - - - - - - - - 2f.4.8 ISFSI Operating Costs - - - - - - 84 13 97 - 97 - - - - - - - - - 2f.4.9 Corporate A&G - - - - - - 531 80 610 610 - - - - - - - - - - 2f.4.10 Site O&M - - - - - - 52 8 60 60 - - - - - - - - - - 2f.4.11 Security Staff Cost - - - - - - 723 108 831 831 - - - - - - - - - 20,161 2f.4.12 Utility Staff Cost - - - - - - 5,646 847 6,493 6,493 - - - - - - - - - 88,786 2f.4 Subtotal Period 2f Period-Dependent Costs - 756 7 1 - 16 7,732 1,323 9,835 9,631 204 - - 326 - - - 6,525 11 108,947
2f.0 TOTAL PERIOD 2f COST - 756 7 1 - 16 16,364 3,738 20,882 20,651 204 27 - 326 - - - 6,525 169,469 111,027
PERIOD 2 TOTALS 9,796 64,448 19,285 12,033 29,967 49,959 219,221 82,523 487,233 458,573 17,956 10,704 296,741 195,070 1,049 393 - 27,525,190 1,285,356 2,774,839
PERIOD 3b - Site Restoration
Period 3b Direct Decommissioning Activities
Demolition of Remaining Site Buildings3b.1.1.1 Reactor Building - 4,488 - - - - - 673 5,162 - - 5,162 - - - - - - 53,465 - 3b.1.1.2 Administration Building (common) - 131 - - - - - 20 150 - - 150 - - - - - - 2,539 - 3b.1.1.3 Auxiliary Building - 1,269 - - - - - 190 1,459 - - 1,459 - - - - - - 17,079 - 3b.1.1.4 Clean Misc. Site Structures (common) - 6,964 - - - - - 1,045 8,008 - - 8,008 - - - - - - 85,550 - 3b.1.1.5 Condenser Discharge Structure (common) - 320 - - - - - 48 368 - - 368 - - - - - - 2,541 - 3b.1.1.6 Contaminated Misc. Structures (common) - 23 - - - - - 3 27 - - 27 - - - - - - 467 - 3b.1.1.7 Contract Services Building (common) - 163 - - - - - 24 187 - - 187 - - - - - - 3,048 - 3b.1.1.8 Essential Siphon Vacuum Bldg. (common) - 34 - - - - - 5 39 - - 39 - - - - - - 604 - 3b.1.1.9 Hot Machine Shop (common) - 122 - - - - - 18 140 - - 140 - - - - - - 1,935 - 3b.1.1.10 Intake Structure (common) - 3,503 - - - - - 525 4,029 - - 4,029 - - - - - - 45,036 - 3b.1.1.11 Interim Radwaste Building (common) - 500 - - - - - 75 575 - - 575 - - - - - - 9,013 - 3b.1.1.12 Maintenance Support Building (common) - 148 - - - - - 22 171 - - 171 - - - - - - 2,583 - 3b.1.1.13 Miscellaneous Site Foundations (common) - 880 - - - - - 132 1,012 - - 1,012 - - - - - - 9,881 - 3b.1.1.14 PSW Building - 109 - - - - - 16 126 - - 126 - - - - - - 1,682 - 3b.1.1.15 Radwaste Facility (common) - 2,069 - - - - - 310 2,379 - - 2,379 - - - - - - 23,191 - 3b.1.1.16 Retired Steam Gen Storage Fac (common) - 741 - - - - - 111 852 - - 852 - - - - - - 11,110 - 3b.1.1.17 Service Building (common) - 311 - - - - - 47 357 - - 357 - - - - - - 6,113 - 3b.1.1.18 Standby Shutdown Facility (common) - 546 - - - - - 82 628 - - 628 - - - - - - 6,550 - 3b.1.1.19 Switchgear Enclosure (common) - 127 - - - - - 19 146 - - 146 - - - - - - 1,911 - 3b.1.1.20 Switchgear House (common) - 64 - - - - - 10 74 - - 74 - - - - - - 819 - 3b.1.1.21 Technical Support Building (common) - 55 - - - - - 8 63 - - 63 - - - - - - 1,034 - 3b.1.1.22 Turbine Building - 1,633 - - - - - 245 1,879 - - 1,879 - - - - - - 28,771 - 3b.1.1.23 Turbine Pedestal - 461 - - - - - 69 530 - - 530 - - - - - - 5,015 - 3b.1.1.24 Fuel Building - 955 - - - - - 143 1,098 - - 1,098 - - - - - - 12,284 - 3b.1.1 Totals - 25,615 - - - - - 3,842 29,457 - - 29,457 - - - - - - 332,220 -
Site Closeout Activities3b.1.2 BackFill Site - 4,891 - - - - - 734 5,624 - - 5,624 - - - - - - 8,346 - 3b.1.3 Grade & landscape site - 107 - - - - - 16 123 - - 123 - - - - - - 297 - 3b.1.4 Final report to NRC - - - - - - 50 8 58 58 - - - - - - - - - 668 3b.1 Subtotal Period 3b Activity Costs - 30,612 - - - - 50 4,599 35,262 58 - 35,204 - - - - - - 340,862 668
Period 3b Additional Costs3b.2.1 Concrete Crushing - 892 - - - - 6 135 1,032 - - 1,032 - - - - - - 4,251 - 3b.2.2 Landfill Post Closure Maintenance - - - - - - 76 8 83 - - 83 - - - - - - - - 3b.2 Subtotal Period 3b Additional Costs - 892 - - - - 81 142 1,115 - - 1,115 - - - - - - 4,251 -
Period 3b Collateral Costs3b.3.1 Small tool allowance - 252 - - - - - 38 290 - - 290 - - - - - - - - 3b.3.2 Corporate A&G - - - - - - 1,044 157 1,200 - - 1,200 - - - - - - - - 3b.3.3 Site O&M - - - - - - 32 5 37 - - 37 - - - - - - - - 3b.3 Subtotal Period 3b Collateral Costs - 252 - - - - 1,076 199 1,527 - - 1,527 - - - - - - - -
TLG Services, Inc.
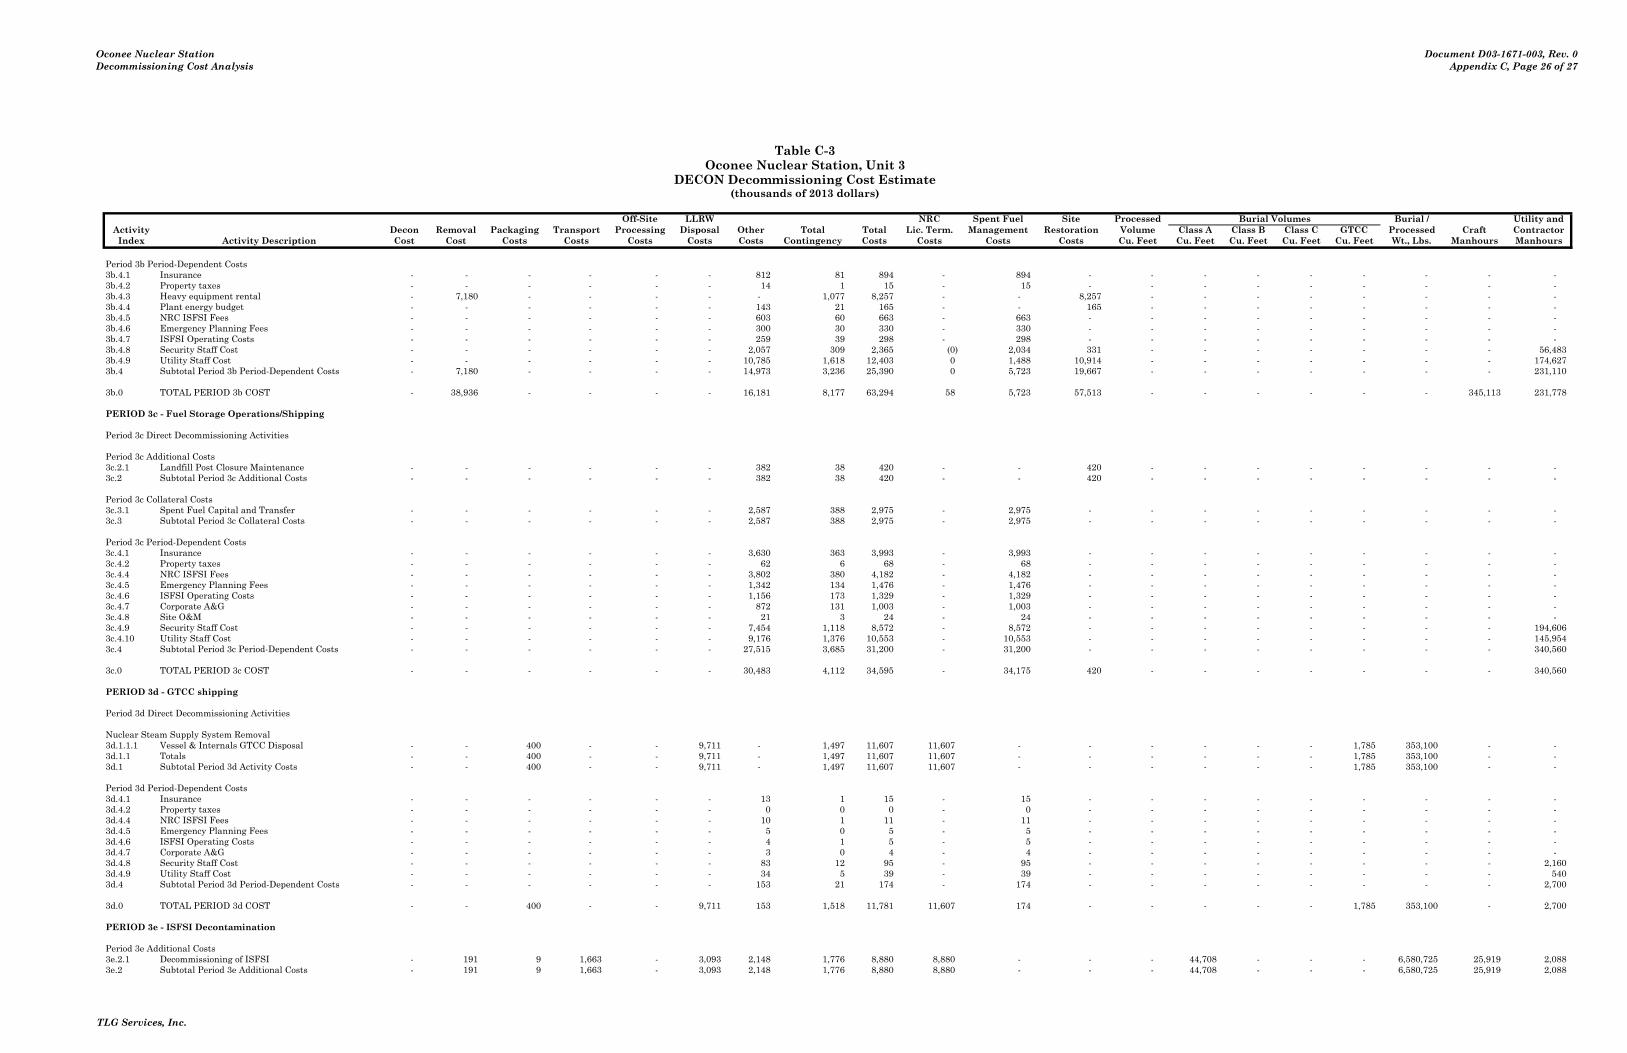
Oconee Nuclear StationDecommissioning Cost Analysis
Document D03-1671-003, Rev. 0Appendix C, Page 26 of 27
Table C-3Oconee Nuclear Station, Unit 3
DECON Decommissioning Cost Estimate(thousands of 2013 dollars)
Off-Site LLRW NRC Spent Fuel Site Processed Burial Volumes Burial / Utility andActivity Decon Removal Packaging Transport Processing Disposal Other Total Total Lic. Term. Management Restoration Volume Class A Class B Class C GTCC Processed Craft ContractorIndex Activity Description Cost Cost Costs Costs Costs Costs Costs Contingency Costs Costs Costs Costs Cu. Feet Cu. Feet Cu. Feet Cu. Feet Cu. Feet Wt., Lbs. Manhours Manhours
Period 3b Period-Dependent Costs3b.4.1 Insurance - - - - - - 812 81 894 - 894 - - - - - - - - - 3b.4.2 Property taxes - - - - - - 14 1 15 - 15 - - - - - - - - - 3b.4.3 Heavy equipment rental - 7,180 - - - - - 1,077 8,257 - - 8,257 - - - - - - - - 3b.4.4 Plant energy budget - - - - - - 143 21 165 - - 165 - - - - - - - - 3b.4.5 NRC ISFSI Fees - - - - - - 603 60 663 - 663 - - - - - - - - - 3b.4.6 Emergency Planning Fees - - - - - - 300 30 330 - 330 - - - - - - - - - 3b.4.7 ISFSI Operating Costs - - - - - - 259 39 298 - 298 - - - - - - - - - 3b.4.8 Security Staff Cost - - - - - - 2,057 309 2,365 (0) 2,034 331 - - - - - - - 56,483 3b.4.9 Utility Staff Cost - - - - - - 10,785 1,618 12,403 0 1,488 10,914 - - - - - - - 174,627 3b.4 Subtotal Period 3b Period-Dependent Costs - 7,180 - - - - 14,973 3,236 25,390 0 5,723 19,667 - - - - - - - 231,110
3b.0 TOTAL PERIOD 3b COST - 38,936 - - - - 16,181 8,177 63,294 58 5,723 57,513 - - - - - - 345,113 231,778
PERIOD 3c - Fuel Storage Operations/Shipping
Period 3c Direct Decommissioning Activities
Period 3c Additional Costs3c.2.1 Landfill Post Closure Maintenance - - - - - - 382 38 420 - - 420 - - - - - - - - 3c.2 Subtotal Period 3c Additional Costs - - - - - - 382 38 420 - - 420 - - - - - - - -
Period 3c Collateral Costs3c.3.1 Spent Fuel Capital and Transfer - - - - - - 2,587 388 2,975 - 2,975 - - - - - - - - - 3c.3 Subtotal Period 3c Collateral Costs - - - - - - 2,587 388 2,975 - 2,975 - - - - - - - - -
Period 3c Period-Dependent Costs3c.4.1 Insurance - - - - - - 3,630 363 3,993 - 3,993 - - - - - - - - - 3c.4.2 Property taxes - - - - - - 62 6 68 - 68 - - - - - - - - - 3c.4.4 NRC ISFSI Fees - - - - - - 3,802 380 4,182 - 4,182 - - - - - - - - - 3c.4.5 Emergency Planning Fees - - - - - - 1,342 134 1,476 - 1,476 - - - - - - - - - 3c.4.6 ISFSI Operating Costs - - - - - - 1,156 173 1,329 - 1,329 - - - - - - - - - 3c.4.7 Corporate A&G - - - - - - 872 131 1,003 - 1,003 - - - - - - - - - 3c.4.8 Site O&M - - - - - - 21 3 24 - 24 - - - - - - - - - 3c.4.9 Security Staff Cost - - - - - - 7,454 1,118 8,572 - 8,572 - - - - - - - - 194,606 3c.4.10 Utility Staff Cost - - - - - - 9,176 1,376 10,553 - 10,553 - - - - - - - - 145,954 3c.4 Subtotal Period 3c Period-Dependent Costs - - - - - - 27,515 3,685 31,200 - 31,200 - - - - - - - - 340,560
3c.0 TOTAL PERIOD 3c COST - - - - - - 30,483 4,112 34,595 - 34,175 420 - - - - - - - 340,560
PERIOD 3d - GTCC shipping
Period 3d Direct Decommissioning Activities
Nuclear Steam Supply System Removal3d.1.1.1 Vessel & Internals GTCC Disposal - - 400 - - 9,711 - 1,497 11,607 11,607 - - - - - - 1,785 353,100 - - 3d.1.1 Totals - - 400 - - 9,711 - 1,497 11,607 11,607 - - - - - - 1,785 353,100 - - 3d.1 Subtotal Period 3d Activity Costs - - 400 - - 9,711 - 1,497 11,607 11,607 - - - - - - 1,785 353,100 - -
Period 3d Period-Dependent Costs3d.4.1 Insurance - - - - - - 13 1 15 - 15 - - - - - - - - - 3d.4.2 Property taxes - - - - - - 0 0 0 - 0 - - - - - - - - - 3d.4.4 NRC ISFSI Fees - - - - - - 10 1 11 - 11 - - - - - - - - - 3d.4.5 Emergency Planning Fees - - - - - - 5 0 5 - 5 - - - - - - - - - 3d.4.6 ISFSI Operating Costs - - - - - - 4 1 5 - 5 - - - - - - - - - 3d.4.7 Corporate A&G - - - - - - 3 0 4 - 4 - - - - - - - - - 3d.4.8 Security Staff Cost - - - - - - 83 12 95 - 95 - - - - - - - - 2,160 3d.4.9 Utility Staff Cost - - - - - - 34 5 39 - 39 - - - - - - - - 540 3d.4 Subtotal Period 3d Period-Dependent Costs - - - - - - 153 21 174 - 174 - - - - - - - - 2,700
3d.0 TOTAL PERIOD 3d COST - - 400 - - 9,711 153 1,518 11,781 11,607 174 - - - - - 1,785 353,100 - 2,700
PERIOD 3e - ISFSI Decontamination
Period 3e Additional Costs3e.2.1 Decommissioning of ISFSI - 191 9 1,663 - 3,093 2,148 1,776 8,880 8,880 - - - 44,708 - - - 6,580,725 25,919 2,088 3e.2 Subtotal Period 3e Additional Costs - 191 9 1,663 - 3,093 2,148 1,776 8,880 8,880 - - - 44,708 - - - 6,580,725 25,919 2,088
TLG Services, Inc.

Oconee Nuclear StationDecommissioning Cost Analysis
Document D03-1671-003, Rev. 0Appendix C, Page 27 of 27
Table C-3Oconee Nuclear Station, Unit 3
DECON Decommissioning Cost Estimate(thousands of 2013 dollars)
Off-Site LLRW NRC Spent Fuel Site Processed Burial Volumes Burial / Utility andActivity Decon Removal Packaging Transport Processing Disposal Other Total Total Lic. Term. Management Restoration Volume Class A Class B Class C GTCC Processed Craft ContractorIndex Activity Description Cost Cost Costs Costs Costs Costs Costs Contingency Costs Costs Costs Costs Cu. Feet Cu. Feet Cu. Feet Cu. Feet Cu. Feet Wt., Lbs. Manhours Manhours
Period 3e Period-Dependent Costs3e.4.1 Insurance - - - - - - 117 29 146 146 - - - - - - - - - - 3e.4.2 Property taxes - - - - - - 2 1 3 3 - - - - - - - - - - 3e.4.3 Heavy equipment rental - 288 - - - - - 72 360 360 - - - - - - - - - - 3e.4.4 Plant energy budget - - - - - - 21 5 26 26 - - - - - - - - - - 3e.4.5 Corporate A&G - - - - - - 23 6 29 29 - - - - - - - - - - 3e.4.6 Site O&M - - - - - - 1 0 1 1 - - - - - - - - - - 3e.4.7 Security Staff Cost - - - - - - 198 50 248 248 - - - - - - - - - 5,096 3e.4.8 Utility Staff Cost - - - - - - 246 61 307 307 - - - - - - - - - 3,866 3e.4 Subtotal Period 3e Period-Dependent Costs - 288 - - - - 607 224 1,119 1,119 - - - - - - - - - 8,961
3e.0 TOTAL PERIOD 3e COST - 479 9 1,663 - 3,093 2,756 2,000 10,000 10,000 - - - 44,708 - - - 6,580,725 25,919 11,049
PERIOD 3f - ISFSI Site Restoration
Period 3f Direct Decommissioning Activities
Period 3f Additional Costs3f.2.1 Demolition of ISFSI - 1,812 - - - - 47 279 2,137 - - 2,137 - - - - - - 10,243 160 3f.2 Subtotal Period 3f Additional Costs - 1,812 - - - - 47 279 2,137 - - 2,137 - - - - - - 10,243 160
Period 3f Collateral Costs3f.3.1 Small tool allowance - 12 - - - - - 2 14 - - 14 - - - - - - - - 3f.3 Subtotal Period 3f Collateral Costs - 12 - - - - - 2 14 - - 14 - - - - - - - -
Period 3f Period-Dependent Costs3f.4.1 Insurance - - - - - - 58 6 64 - - 64 - - - - - - - - 3f.4.2 Property taxes - - - - - - 1 0 1 - - 1 - - - - - - - - 3f.4.3 Heavy equipment rental - 115 - - - - - 17 133 - - 133 - - - - - - - - 3f.4.4 Plant energy budget - - - - - - 10 2 12 - - 12 - - - - - - - - 3f.4.5 Corporate A&G - - - - - - 9 1 11 - - 11 - - - - - - - - 3f.4.6 Security Staff Cost - - - - - - 98 15 113 - - 113 - - - - - - - 2,527 3f.4.7 Utility Staff Cost - - - - - - 103 15 118 - - 118 - - - - - - - 1,569 3f.4 Subtotal Period 3f Period-Dependent Costs - 115 - - - - 280 56 451 - - 451 - - - - - - - 4,096
3f.0 TOTAL PERIOD 3f COST - 1,939 - - - - 326 337 2,603 - - 2,603 - - - - - - 10,243 4,256
PERIOD 3 TOTALS - 41,354 409 1,663 - 12,803 49,899 16,144 122,272 21,664 40,072 60,536 - 44,708 - - 1,785 6,933,825 381,275 590,343
TOTAL COST TO DECOMMISSION 12,944 112,078 19,782 14,442 29,967 66,388 336,823 111,846 704,271 571,887 60,746 71,638 296,741 266,291 1,842 393 1,785 34,902,210 1,714,696 4,113,629
TOTAL COST TO DECOMMISSION WITH 18.88% CONTINGENCY: $704,271 thousands of 2013 dollars
TOTAL NRC LICENSE TERMINATION COST IS 81.2% OR: $571,887 thousands of 2013 dollars
SPENT FUEL MANAGEMENT COST IS 8.69% OR: $60,746 thousands of 2013 dollars
NON-NUCLEAR DEMOLITION COST IS 10.11% OR: $71,638 thousands of 2013 dollars
TOTAL LOW-LEVEL RADIOACTIVE WASTE VOLUME BURIED (EXCLUDING GTCC): 268,526 cubic feet
TOTAL GREATER THAN CLASS C RADWASTE VOLUME GENERATED: 1,785 cubic feet
TOTAL SCRAP METAL REMOVED: 66,542 tons
TOTAL CRAFT LABOR REQUIREMENTS: 1,714,696 man-hours
End Notes:n/a - indicates that this activity not charged as decommissioning expense.a - indicates that this activity performed by decommissioning staff.0 - indicates that this value is less than 0.5 but is non-zero.a cell containing " - " indicates a zero value
TLG Services, Inc.

Oconee Nuclear Station Document D03-1671-003, Rev. 0 Decommissioning Cost Analysis Appendix D, Page 1 of 31
TLG Services, Inc.
APPENDIX D
DETAILED COST ANALYSIS
SAFSTOR
Table Page
D-1 Unit 1, SAFSTOR Decommissioning Cost Estimate ......................................... 2 D-2 Unit 2, SAFSTOR Decommissioning Cost Estimate ....................................... 12
D-3 Unit 3, SAFSTOR Decommissioning Cost Estimate ....................................... 21
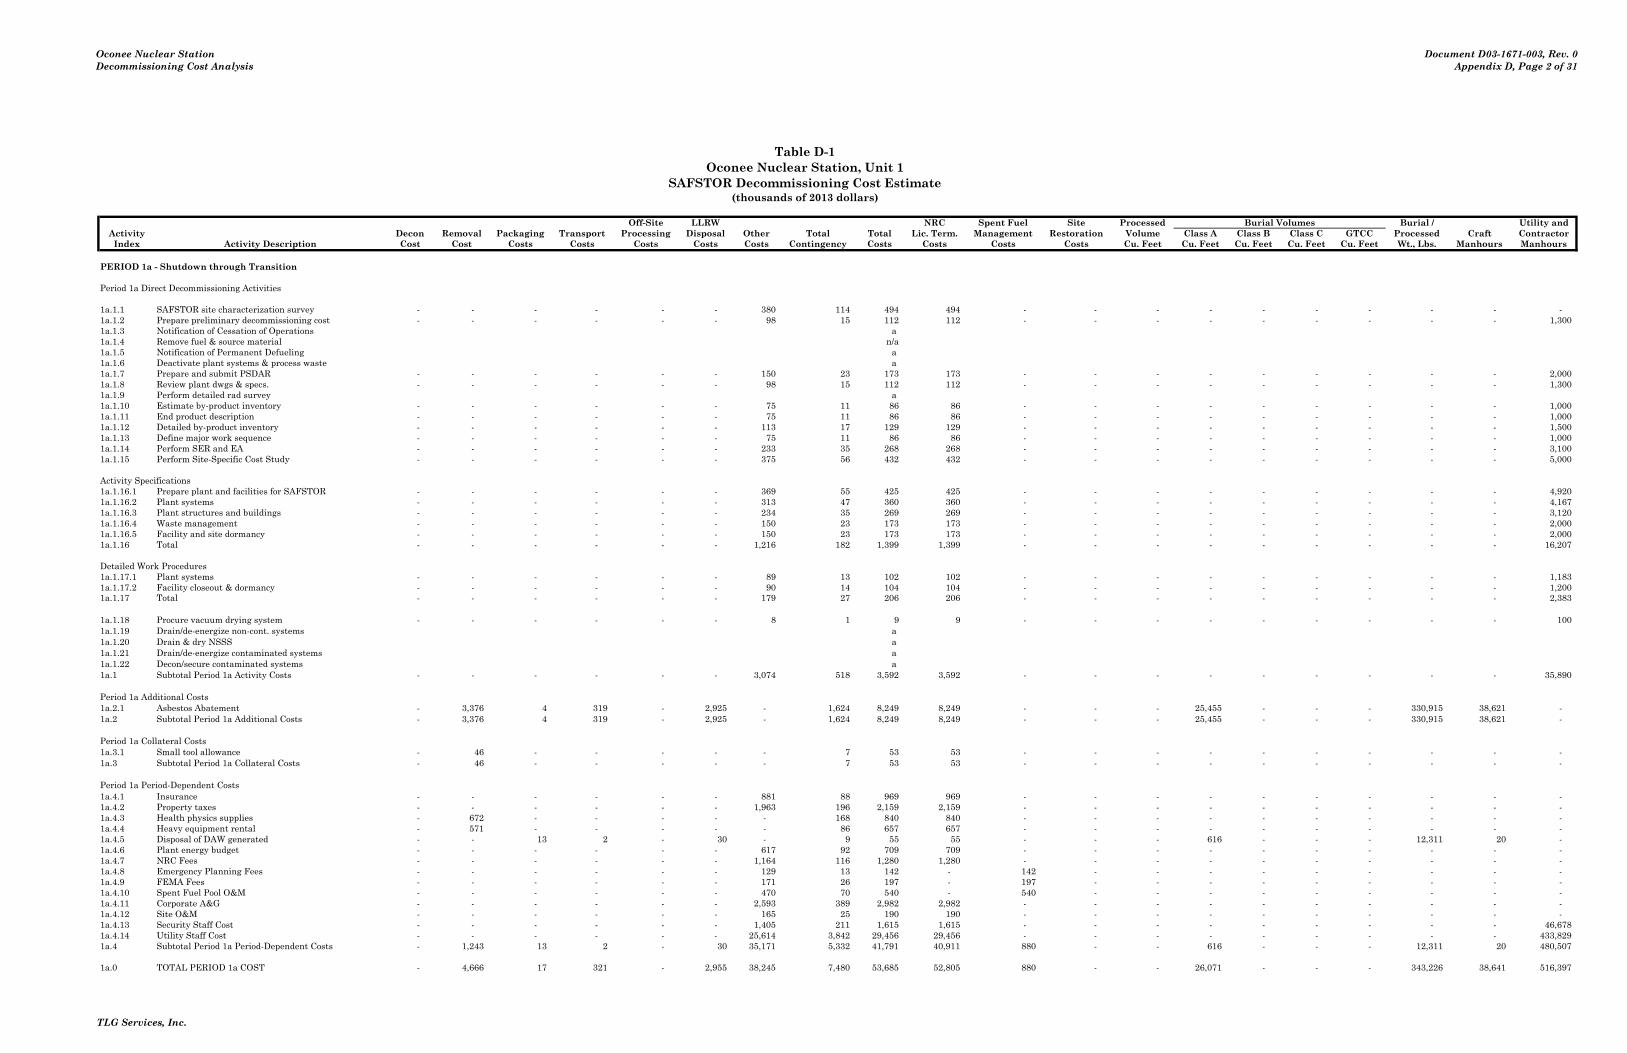
Oconee Nuclear StationDecommissioning Cost Analysis
Document D03-1671-003, Rev. 0Appendix D, Page 2 of 31
Table D-1Oconee Nuclear Station, Unit 1
SAFSTOR Decommissioning Cost Estimate(thousands of 2013 dollars)
Costs run: Wed, Oct 23, 2013 at 10:28:37 Off-Site LLRW NRC Spent Fuel Site Processed Burial Volumes Burial / Utility andActivity DECCER Version 2010.09.09i Decon Removal Packaging Transport Processing Disposal Other Total Total Lic. Term. Management Restoration Volume Class A Class B Class C GTCC Processed Craft ContractorIndex Activity Description Cost Cost Costs Costs Costs Costs Costs Contingency Costs Costs Costs Costs Cu. Feet Cu. Feet Cu. Feet Cu. Feet Cu. Feet Wt., Lbs. Manhours Manhours
PERIOD 1a - Shutdown through Transition
Period 1a Direct Decommissioning Activities
1a.1.1 SAFSTOR site characterization survey - - - - - - 380 114 494 494 - - - - - - - - - - 1a.1.2 Prepare preliminary decommissioning cost - - - - - - 98 15 112 112 - - - - - - - - - 1,300 1a.1.3 Notification of Cessation of Operations a 1a.1.4 Remove fuel & source material n/a1a.1.5 Notification of Permanent Defueling a 1a.1.6 Deactivate plant systems & process waste a 1a.1.7 Prepare and submit PSDAR - - - - - - 150 23 173 173 - - - - - - - - - 2,000 1a.1.8 Review plant dwgs & specs. - - - - - - 98 15 112 112 - - - - - - - - - 1,300 1a.1.9 Perform detailed rad survey a 1a.1.10 Estimate by-product inventory - - - - - - 75 11 86 86 - - - - - - - - - 1,000 1a.1.11 End product description - - - - - - 75 11 86 86 - - - - - - - - - 1,000 1a.1.12 Detailed by-product inventory - - - - - - 113 17 129 129 - - - - - - - - - 1,500 1a.1.13 Define major work sequence - - - - - - 75 11 86 86 - - - - - - - - - 1,000 1a.1.14 Perform SER and EA - - - - - - 233 35 268 268 - - - - - - - - - 3,100 1a.1.15 Perform Site-Specific Cost Study - - - - - - 375 56 432 432 - - - - - - - - - 5,000
Activity Specifications1a.1.16.1 Prepare plant and facilities for SAFSTOR - - - - - - 369 55 425 425 - - - - - - - - - 4,920 1a.1.16.2 Plant systems - - - - - - 313 47 360 360 - - - - - - - - - 4,167 1a.1.16.3 Plant structures and buildings - - - - - - 234 35 269 269 - - - - - - - - - 3,120 1a.1.16.4 Waste management - - - - - - 150 23 173 173 - - - - - - - - - 2,000 1a.1.16.5 Facility and site dormancy - - - - - - 150 23 173 173 - - - - - - - - - 2,000 1a.1.16 Total - - - - - - 1,216 182 1,399 1,399 - - - - - - - - - 16,207
Detailed Work Procedures1a.1.17.1 Plant systems - - - - - - 89 13 102 102 - - - - - - - - - 1,183 1a.1.17.2 Facility closeout & dormancy - - - - - - 90 14 104 104 - - - - - - - - - 1,200 1a.1.17 Total - - - - - - 179 27 206 206 - - - - - - - - - 2,383
1a.1.18 Procure vacuum drying system - - - - - - 8 1 9 9 - - - - - - - - - 100 1a.1.19 Drain/de-energize non-cont. systems a 1a.1.20 Drain & dry NSSS a 1a.1.21 Drain/de-energize contaminated systems a 1a.1.22 Decon/secure contaminated systems a 1a.1 Subtotal Period 1a Activity Costs - - - - - - 3,074 518 3,592 3,592 - - - - - - - - - 35,890
Period 1a Additional Costs1a.2.1 Asbestos Abatement - 3,376 4 319 - 2,925 - 1,624 8,249 8,249 - - - 25,455 - - - 330,915 38,621 - 1a.2 Subtotal Period 1a Additional Costs - 3,376 4 319 - 2,925 - 1,624 8,249 8,249 - - - 25,455 - - - 330,915 38,621 -
Period 1a Collateral Costs1a.3.1 Small tool allowance - 46 - - - - - 7 53 53 - - - - - - - - - - 1a.3 Subtotal Period 1a Collateral Costs - 46 - - - - - 7 53 53 - - - - - - - - - -
Period 1a Period-Dependent Costs1a.4.1 Insurance - - - - - - 881 88 969 969 - - - - - - - - - - 1a.4.2 Property taxes - - - - - - 1,963 196 2,159 2,159 - - - - - - - - - - 1a.4.3 Health physics supplies - 672 - - - - - 168 840 840 - - - - - - - - - - 1a.4.4 Heavy equipment rental - 571 - - - - - 86 657 657 - - - - - - - - - - 1a.4.5 Disposal of DAW generated - - 13 2 - 30 - 9 55 55 - - - 616 - - - 12,311 20 - 1a.4.6 Plant energy budget - - - - - - 617 92 709 709 - - - - - - - - - - 1a.4.7 NRC Fees - - - - - - 1,164 116 1,280 1,280 - - - - - - - - - - 1a.4.8 Emergency Planning Fees - - - - - - 129 13 142 - 142 - - - - - - - - - 1a.4.9 FEMA Fees - - - - - - 171 26 197 - 197 - - - - - - - - - 1a.4.10 Spent Fuel Pool O&M - - - - - - 470 70 540 - 540 - - - - - - - - - 1a.4.11 Corporate A&G - - - - - - 2,593 389 2,982 2,982 - - - - - - - - - - 1a.4.12 Site O&M - - - - - - 165 25 190 190 - - - - - - - - - - 1a.4.13 Security Staff Cost - - - - - - 1,405 211 1,615 1,615 - - - - - - - - - 46,678 1a.4.14 Utility Staff Cost - - - - - - 25,614 3,842 29,456 29,456 - - - - - - - - - 433,829 1a.4 Subtotal Period 1a Period-Dependent Costs - 1,243 13 2 - 30 35,171 5,332 41,791 40,911 880 - - 616 - - - 12,311 20 480,507
1a.0 TOTAL PERIOD 1a COST - 4,666 17 321 - 2,955 38,245 7,480 53,685 52,805 880 - - 26,071 - - - 343,226 38,641 516,397
TLG Services, Inc.
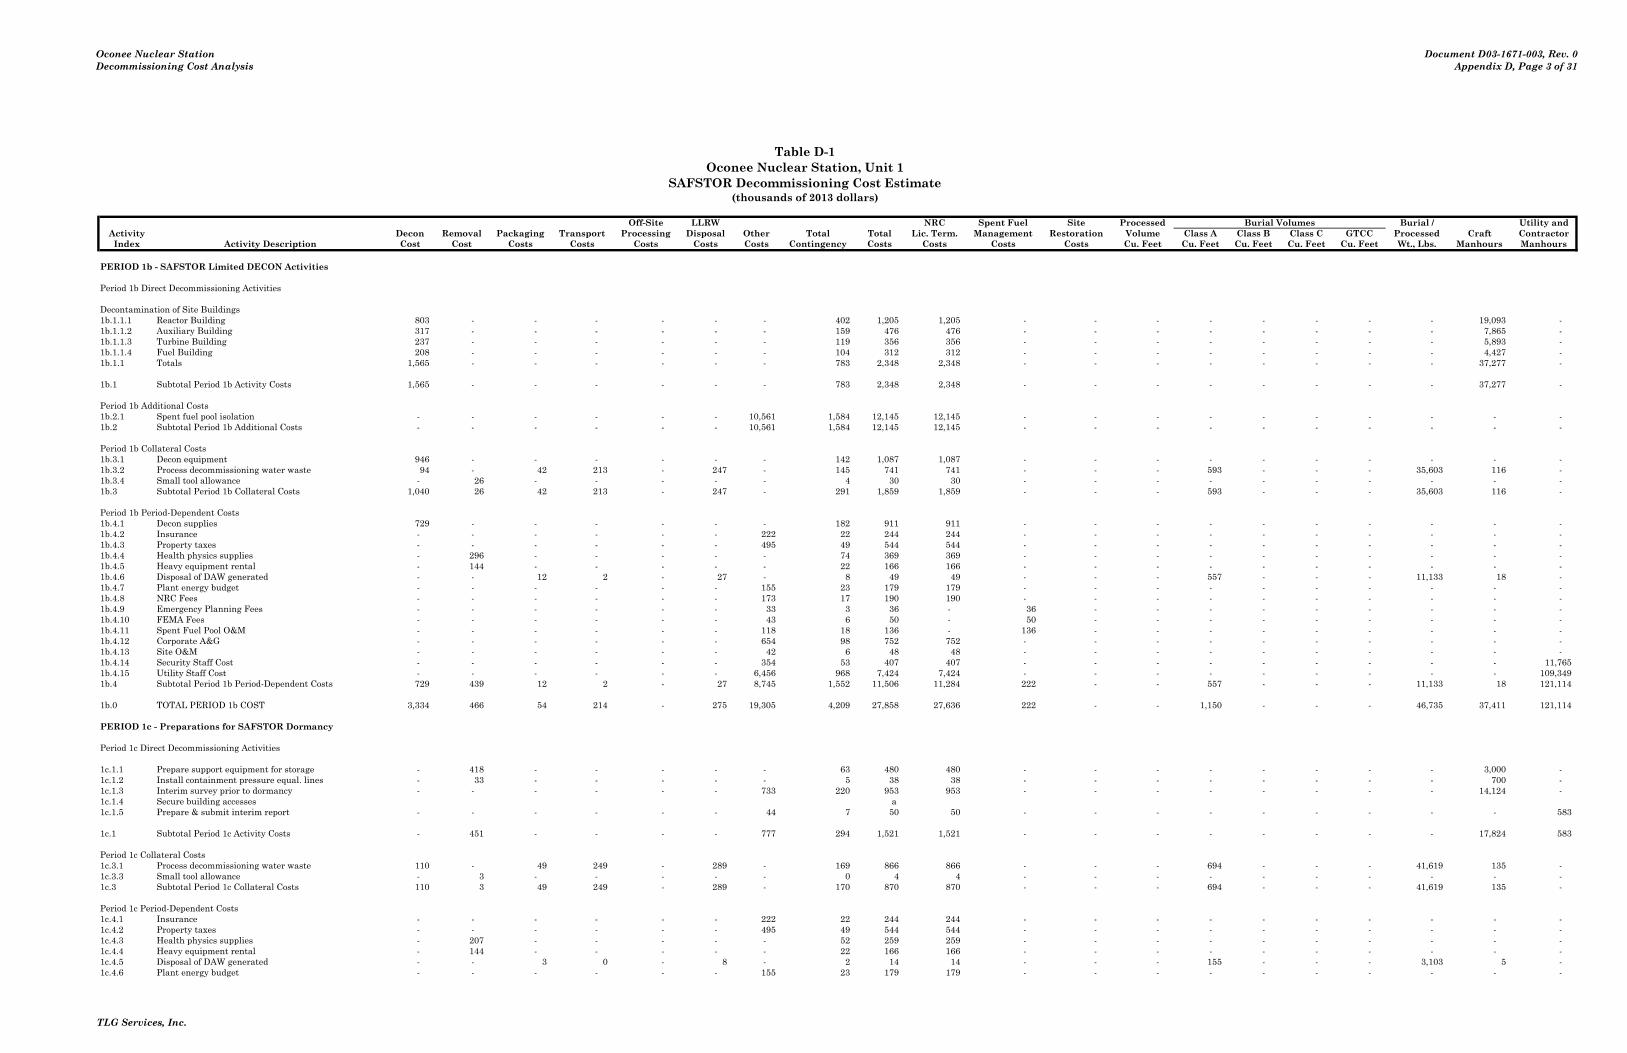
Oconee Nuclear StationDecommissioning Cost Analysis
Document D03-1671-003, Rev. 0Appendix D, Page 3 of 31
Table D-1Oconee Nuclear Station, Unit 1
SAFSTOR Decommissioning Cost Estimate(thousands of 2013 dollars)
Costs run: Wed, Oct 23, 2013 at 10:28:37 Off-Site LLRW NRC Spent Fuel Site Processed Burial Volumes Burial / Utility andActivity DECCER Version 2010.09.09i Decon Removal Packaging Transport Processing Disposal Other Total Total Lic. Term. Management Restoration Volume Class A Class B Class C GTCC Processed Craft ContractorIndex Activity Description Cost Cost Costs Costs Costs Costs Costs Contingency Costs Costs Costs Costs Cu. Feet Cu. Feet Cu. Feet Cu. Feet Cu. Feet Wt., Lbs. Manhours Manhours
PERIOD 1b - SAFSTOR Limited DECON Activities
Period 1b Direct Decommissioning Activities
Decontamination of Site Buildings1b.1.1.1 Reactor Building 803 - - - - - - 402 1,205 1,205 - - - - - - - - 19,093 - 1b.1.1.2 Auxiliary Building 317 - - - - - - 159 476 476 - - - - - - - - 7,865 - 1b.1.1.3 Turbine Building 237 - - - - - - 119 356 356 - - - - - - - - 5,893 - 1b.1.1.4 Fuel Building 208 - - - - - - 104 312 312 - - - - - - - - 4,427 - 1b.1.1 Totals 1,565 - - - - - - 783 2,348 2,348 - - - - - - - - 37,277 -
1b.1 Subtotal Period 1b Activity Costs 1,565 - - - - - - 783 2,348 2,348 - - - - - - - - 37,277 -
Period 1b Additional Costs1b.2.1 Spent fuel pool isolation - - - - - - 10,561 1,584 12,145 12,145 - - - - - - - - - - 1b.2 Subtotal Period 1b Additional Costs - - - - - - 10,561 1,584 12,145 12,145 - - - - - - - - - -
Period 1b Collateral Costs1b.3.1 Decon equipment 946 - - - - - - 142 1,087 1,087 - - - - - - - - - - 1b.3.2 Process decommissioning water waste 94 - 42 213 - 247 - 145 741 741 - - - 593 - - - 35,603 116 - 1b.3.4 Small tool allowance - 26 - - - - - 4 30 30 - - - - - - - - - - 1b.3 Subtotal Period 1b Collateral Costs 1,040 26 42 213 - 247 - 291 1,859 1,859 - - - 593 - - - 35,603 116 -
Period 1b Period-Dependent Costs1b.4.1 Decon supplies 729 - - - - - - 182 911 911 - - - - - - - - - - 1b.4.2 Insurance - - - - - - 222 22 244 244 - - - - - - - - - - 1b.4.3 Property taxes - - - - - - 495 49 544 544 - - - - - - - - - - 1b.4.4 Health physics supplies - 296 - - - - - 74 369 369 - - - - - - - - - - 1b.4.5 Heavy equipment rental - 144 - - - - - 22 166 166 - - - - - - - - - - 1b.4.6 Disposal of DAW generated - - 12 2 - 27 - 8 49 49 - - - 557 - - - 11,133 18 - 1b.4.7 Plant energy budget - - - - - - 155 23 179 179 - - - - - - - - - - 1b.4.8 NRC Fees - - - - - - 173 17 190 190 - - - - - - - - - - 1b.4.9 Emergency Planning Fees - - - - - - 33 3 36 - 36 - - - - - - - - - 1b.4.10 FEMA Fees - - - - - - 43 6 50 - 50 - - - - - - - - - 1b.4.11 Spent Fuel Pool O&M - - - - - - 118 18 136 - 136 - - - - - - - - - 1b.4.12 Corporate A&G - - - - - - 654 98 752 752 - - - - - - - - - - 1b.4.13 Site O&M - - - - - - 42 6 48 48 - - - - - - - - - - 1b.4.14 Security Staff Cost - - - - - - 354 53 407 407 - - - - - - - - - 11,765 1b.4.15 Utility Staff Cost - - - - - - 6,456 968 7,424 7,424 - - - - - - - - - 109,349 1b.4 Subtotal Period 1b Period-Dependent Costs 729 439 12 2 - 27 8,745 1,552 11,506 11,284 222 - - 557 - - - 11,133 18 121,114
1b.0 TOTAL PERIOD 1b COST 3,334 466 54 214 - 275 19,305 4,209 27,858 27,636 222 - - 1,150 - - - 46,735 37,411 121,114
PERIOD 1c - Preparations for SAFSTOR Dormancy
Period 1c Direct Decommissioning Activities
1c.1.1 Prepare support equipment for storage - 418 - - - - - 63 480 480 - - - - - - - - 3,000 - 1c.1.2 Install containment pressure equal. lines - 33 - - - - - 5 38 38 - - - - - - - - 700 - 1c.1.3 Interim survey prior to dormancy - - - - - - 733 220 953 953 - - - - - - - - 14,124 - 1c.1.4 Secure building accesses a 1c.1.5 Prepare & submit interim report - - - - - - 44 7 50 50 - - - - - - - - - 583
1c.1 Subtotal Period 1c Activity Costs - 451 - - - - 777 294 1,521 1,521 - - - - - - - - 17,824 583
Period 1c Collateral Costs1c.3.1 Process decommissioning water waste 110 - 49 249 - 289 - 169 866 866 - - - 694 - - - 41,619 135 - 1c.3.3 Small tool allowance - 3 - - - - - 0 4 4 - - - - - - - - - - 1c.3 Subtotal Period 1c Collateral Costs 110 3 49 249 - 289 - 170 870 870 - - - 694 - - - 41,619 135 -
Period 1c Period-Dependent Costs1c.4.1 Insurance - - - - - - 222 22 244 244 - - - - - - - - - - 1c.4.2 Property taxes - - - - - - 495 49 544 544 - - - - - - - - - - 1c.4.3 Health physics supplies - 207 - - - - - 52 259 259 - - - - - - - - - - 1c.4.4 Heavy equipment rental - 144 - - - - - 22 166 166 - - - - - - - - - - 1c.4.5 Disposal of DAW generated - - 3 0 - 8 - 2 14 14 - - - 155 - - - 3,103 5 - 1c.4.6 Plant energy budget - - - - - - 155 23 179 179 - - - - - - - - - -
TLG Services, Inc.
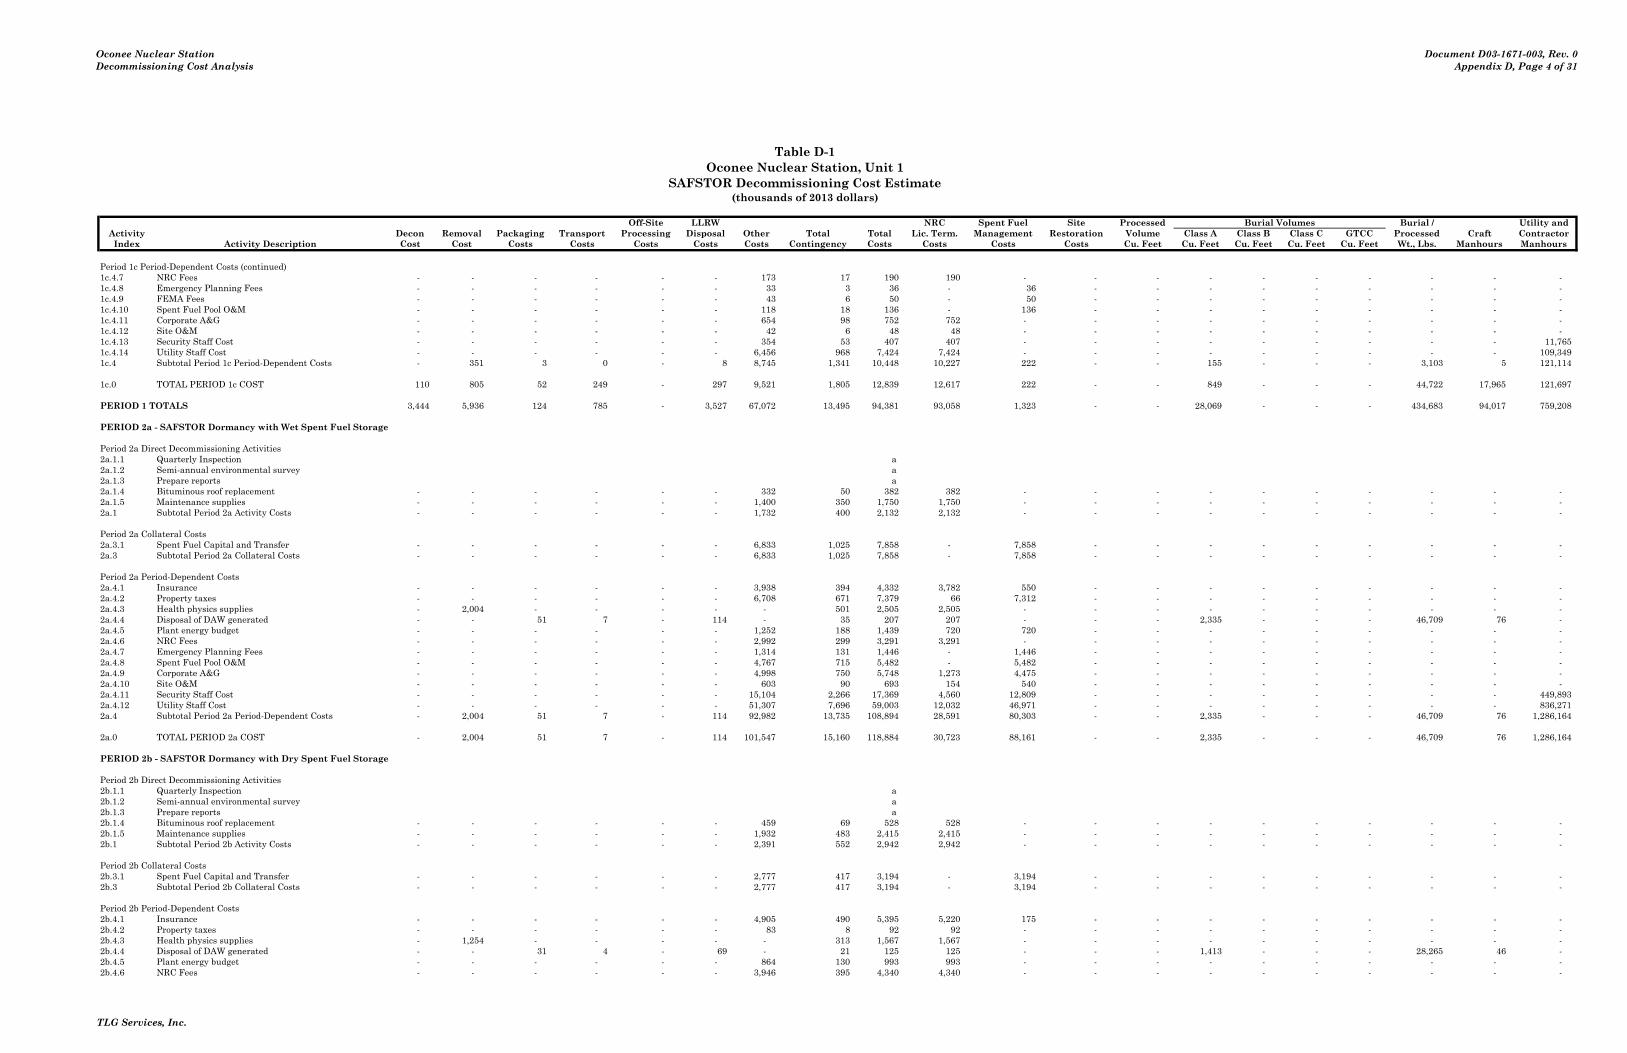
Oconee Nuclear StationDecommissioning Cost Analysis
Document D03-1671-003, Rev. 0Appendix D, Page 4 of 31
Table D-1Oconee Nuclear Station, Unit 1
SAFSTOR Decommissioning Cost Estimate(thousands of 2013 dollars)
Costs run: Wed, Oct 23, 2013 at 10:28:37 Off-Site LLRW NRC Spent Fuel Site Processed Burial Volumes Burial / Utility andActivity DECCER Version 2010.09.09i Decon Removal Packaging Transport Processing Disposal Other Total Total Lic. Term. Management Restoration Volume Class A Class B Class C GTCC Processed Craft ContractorIndex Activity Description Cost Cost Costs Costs Costs Costs Costs Contingency Costs Costs Costs Costs Cu. Feet Cu. Feet Cu. Feet Cu. Feet Cu. Feet Wt., Lbs. Manhours Manhours
Period 1c Period-Dependent Costs (continued)1c.4.7 NRC Fees - - - - - - 173 17 190 190 - - - - - - - - - - 1c.4.8 Emergency Planning Fees - - - - - - 33 3 36 - 36 - - - - - - - - - 1c.4.9 FEMA Fees - - - - - - 43 6 50 - 50 - - - - - - - - - 1c.4.10 Spent Fuel Pool O&M - - - - - - 118 18 136 - 136 - - - - - - - - - 1c.4.11 Corporate A&G - - - - - - 654 98 752 752 - - - - - - - - - - 1c.4.12 Site O&M - - - - - - 42 6 48 48 - - - - - - - - - - 1c.4.13 Security Staff Cost - - - - - - 354 53 407 407 - - - - - - - - - 11,765 1c.4.14 Utility Staff Cost - - - - - - 6,456 968 7,424 7,424 - - - - - - - - - 109,349 1c.4 Subtotal Period 1c Period-Dependent Costs - 351 3 0 - 8 8,745 1,341 10,448 10,227 222 - - 155 - - - 3,103 5 121,114
1c.0 TOTAL PERIOD 1c COST 110 805 52 249 - 297 9,521 1,805 12,839 12,617 222 - - 849 - - - 44,722 17,965 121,697
PERIOD 1 TOTALS 3,444 5,936 124 785 - 3,527 67,072 13,495 94,381 93,058 1,323 - - 28,069 - - - 434,683 94,017 759,208
PERIOD 2a - SAFSTOR Dormancy with Wet Spent Fuel Storage
Period 2a Direct Decommissioning Activities2a.1.1 Quarterly Inspection a 2a.1.2 Semi-annual environmental survey a 2a.1.3 Prepare reports a 2a.1.4 Bituminous roof replacement - - - - - - 332 50 382 382 - - - - - - - - - - 2a.1.5 Maintenance supplies - - - - - - 1,400 350 1,750 1,750 - - - - - - - - - - 2a.1 Subtotal Period 2a Activity Costs - - - - - - 1,732 400 2,132 2,132 - - - - - - - - - -
Period 2a Collateral Costs2a.3.1 Spent Fuel Capital and Transfer - - - - - - 6,833 1,025 7,858 - 7,858 - - - - - - - - - 2a.3 Subtotal Period 2a Collateral Costs - - - - - - 6,833 1,025 7,858 - 7,858 - - - - - - - - -
Period 2a Period-Dependent Costs2a.4.1 Insurance - - - - - - 3,938 394 4,332 3,782 550 - - - - - - - - - 2a.4.2 Property taxes - - - - - - 6,708 671 7,379 66 7,312 - - - - - - - - - 2a.4.3 Health physics supplies - 2,004 - - - - - 501 2,505 2,505 - - - - - - - - - - 2a.4.4 Disposal of DAW generated - - 51 7 - 114 - 35 207 207 - - - 2,335 - - - 46,709 76 - 2a.4.5 Plant energy budget - - - - - - 1,252 188 1,439 720 720 - - - - - - - - - 2a.4.6 NRC Fees - - - - - - 2,992 299 3,291 3,291 - - - - - - - - - - 2a.4.7 Emergency Planning Fees - - - - - - 1,314 131 1,446 - 1,446 - - - - - - - - - 2a.4.8 Spent Fuel Pool O&M - - - - - - 4,767 715 5,482 - 5,482 - - - - - - - - - 2a.4.9 Corporate A&G - - - - - - 4,998 750 5,748 1,273 4,475 - - - - - - - - - 2a.4.10 Site O&M - - - - - - 603 90 693 154 540 - - - - - - - - - 2a.4.11 Security Staff Cost - - - - - - 15,104 2,266 17,369 4,560 12,809 - - - - - - - - 449,893 2a.4.12 Utility Staff Cost - - - - - - 51,307 7,696 59,003 12,032 46,971 - - - - - - - - 836,271 2a.4 Subtotal Period 2a Period-Dependent Costs - 2,004 51 7 - 114 92,982 13,735 108,894 28,591 80,303 - - 2,335 - - - 46,709 76 1,286,164
2a.0 TOTAL PERIOD 2a COST - 2,004 51 7 - 114 101,547 15,160 118,884 30,723 88,161 - - 2,335 - - - 46,709 76 1,286,164
PERIOD 2b - SAFSTOR Dormancy with Dry Spent Fuel Storage
Period 2b Direct Decommissioning Activities2b.1.1 Quarterly Inspection a 2b.1.2 Semi-annual environmental survey a 2b.1.3 Prepare reports a 2b.1.4 Bituminous roof replacement - - - - - - 459 69 528 528 - - - - - - - - - - 2b.1.5 Maintenance supplies - - - - - - 1,932 483 2,415 2,415 - - - - - - - - - - 2b.1 Subtotal Period 2b Activity Costs - - - - - - 2,391 552 2,942 2,942 - - - - - - - - - -
Period 2b Collateral Costs2b.3.1 Spent Fuel Capital and Transfer - - - - - - 2,777 417 3,194 - 3,194 - - - - - - - - - 2b.3 Subtotal Period 2b Collateral Costs - - - - - - 2,777 417 3,194 - 3,194 - - - - - - - - -
Period 2b Period-Dependent Costs2b.4.1 Insurance - - - - - - 4,905 490 5,395 5,220 175 - - - - - - - - - 2b.4.2 Property taxes - - - - - - 83 8 92 92 - - - - - - - - - - 2b.4.3 Health physics supplies - 1,254 - - - - - 313 1,567 1,567 - - - - - - - - - - 2b.4.4 Disposal of DAW generated - - 31 4 - 69 - 21 125 125 - - - 1,413 - - - 28,265 46 - 2b.4.5 Plant energy budget - - - - - - 864 130 993 993 - - - - - - - - - - 2b.4.6 NRC Fees - - - - - - 3,946 395 4,340 4,340 - - - - - - - - - -
TLG Services, Inc.

Oconee Nuclear StationDecommissioning Cost Analysis
Document D03-1671-003, Rev. 0Appendix D, Page 5 of 31
Table D-1Oconee Nuclear Station, Unit 1
SAFSTOR Decommissioning Cost Estimate(thousands of 2013 dollars)
Costs run: Wed, Oct 23, 2013 at 10:28:37 Off-Site LLRW NRC Spent Fuel Site Processed Burial Volumes Burial / Utility andActivity DECCER Version 2010.09.09i Decon Removal Packaging Transport Processing Disposal Other Total Total Lic. Term. Management Restoration Volume Class A Class B Class C GTCC Processed Craft ContractorIndex Activity Description Cost Cost Costs Costs Costs Costs Costs Contingency Costs Costs Costs Costs Cu. Feet Cu. Feet Cu. Feet Cu. Feet Cu. Feet Wt., Lbs. Manhours Manhours
Period 2b Period-Dependent Costs (continued)2b.4.7 Emergency Planning Fees - - - - - - 1,814 181 1,995 - 1,995 - - - - - - - - - 2b.4.8 Corporate A&G - - - - - - 1,397 210 1,606 - 1,606 - - - - - - - - - 2b.4.9 Site O&M - - - - - - 168 25 193 - 193 - - - - - - - - - 2b.4.10 Security Staff Cost - - - - - - 10,072 1,511 11,582 6,293 5,289 - - - - - - - - 262,954 2b.4.11 Utility Staff Cost - - - - - - 13,314 1,997 15,311 - 15,311 - - - - - - - - 233,737 2b.4 Subtotal Period 2b Period-Dependent Costs - 1,254 31 4 - 69 36,562 5,281 43,201 18,630 24,570 - - 1,413 - - - 28,265 46 496,691
2b.0 TOTAL PERIOD 2b COST - 1,254 31 4 - 69 41,730 6,250 49,337 21,573 27,764 - - 1,413 - - - 28,265 46 496,691
PERIOD 2c - SAFSTOR Dormancy without Spent Fuel Storage
Period 2c Direct Decommissioning Activities2c.1.1 Quarterly Inspection a 2c.1.2 Semi-annual environmental survey a 2c.1.3 Prepare reports a 2c.1.4 Bituminous roof replacement - - - - - - 881 132 1,014 1,014 - - - - - - - - - - 2c.1.5 Maintenance supplies - - - - - - 3,711 928 4,639 4,639 - - - - - - - - - - 2c.1 Subtotal Period 2c Activity Costs - - - - - - 4,593 1,060 5,653 5,653 - - - - - - - - - -
Period 2c Period-Dependent Costs2c.4.1 Insurance - - - - - - 9,117 912 10,028 10,028 - - - - - - - - - - 2c.4.2 Property taxes - - - - - - 160 16 176 176 - - - - - - - - - - 2c.4.3 Health physics supplies - 2,424 - - - - - 606 3,030 3,030 - - - - - - - - - - 2c.4.4 Disposal of DAW generated - - 60 9 - 134 - 41 243 243 - - - 2,739 - - - 54,788 89 - 2c.4.5 Plant energy budget - - - - - - 1,659 249 1,908 1,908 - - - - - - - - - - 2c.4.6 NRC Fees - - - - - - 6,995 700 7,695 7,695 - - - - - - - - - - 2c.4.7 Corporate A&G - - - - - - 2,935 440 3,376 3,376 - - - - - - - - - - 2c.4.8 Site O&M - - - - - - 354 53 407 407 - - - - - - - - - - 2c.4.9 Security Staff Cost - - - - - - 10,513 1,577 12,090 12,090 - - - - - - - - - 280,657 2c.4.10 Utility Staff Cost - - - - - - 27,740 4,161 31,901 31,901 - - - - - - - - - 491,150 2c.4 Subtotal Period 2c Period-Dependent Costs - 2,424 60 9 - 134 59,474 8,754 70,855 70,855 - - - 2,739 - - - 54,788 89 771,807
2c.0 TOTAL PERIOD 2c COST - 2,424 60 9 - 134 64,067 9,814 76,508 76,508 - - - 2,739 - - - 54,788 89 771,807
PERIOD 2 TOTALS - 5,682 141 20 - 317 207,344 31,224 244,728 128,803 115,925 - - 6,488 - - - 129,761 212 2,554,663
PERIOD 3a - Reactivate Site Following SAFSTOR Dormancy
Period 3a Direct Decommissioning Activities3a.1.1 Prepare preliminary decommissioning cost - - - - - - 98 15 112 112 - - - - - - - - - 1,300 3a.1.2 Review plant dwgs & specs. - - - - - - 345 52 397 397 - - - - - - - - - 4,600 3a.1.3 Perform detailed rad survey a 3a.1.4 End product description - - - - - - 75 11 86 86 - - - - - - - - - 1,000 3a.1.5 Detailed by-product inventory - - - - - - 98 15 112 112 - - - - - - - - - 1,300 3a.1.6 Define major work sequence - - - - - - 563 84 647 647 - - - - - - - - - 7,500 3a.1.7 Perform SER and EA - - - - - - 233 35 268 268 - - - - - - - - - 3,100 3a.1.8 Perform Site-Specific Cost Study - - - - - - 375 56 432 432 - - - - - - - - - 5,000 3a.1.9 Prepare/submit License Termination Plan - - - - - - 307 46 354 354 - - - - - - - - - 4,096 3a.1.10 Receive NRC approval of termination plan a
Activity Specifications
3a.1.11.1 Re-activate plant & temporary facilities - - - - - - 553 83 636 573 - 64 - - - - - - - 7,370 3a.1.11.2 Plant systems - - - - - - 313 47 360 324 - 36 - - - - - - - 4,167 3a.1.11.3 Reactor internals - - - - - - 533 80 613 613 - - - - - - - - - 7,100 3a.1.11.4 Reactor vessel - - - - - - 488 73 561 561 - - - - - - - - - 6,500 3a.1.11.5 Biological shield - - - - - - 38 6 43 43 - - - - - - - - - 500 3a.1.11.6 Steam generators - - - - - - 234 35 269 269 - - - - - - - - - 3,120 3a.1.11.7 Reinforced concrete - - - - - - 120 18 138 69 - 69 - - - - - - - 1,600 3a.1.11.8 Main Turbine - - - - - - 30 5 35 - - 35 - - - - - - - 400 3a.1.11.9 Main Condensers - - - - - - 30 5 35 - - 35 - - - - - - - 400 3a.1.11.10 Plant structures & buildings - - - - - - 234 35 269 135 - 135 - - - - - - - 3,120 3a.1.11.11 Waste management - - - - - - 345 52 397 397 - - - - - - - - - 4,600 3a.1.11.12 Facility & site closeout - - - - - - 68 10 78 39 - 39 - - - - - - - 900 3a.1.11 Total - - - - - - 2,986 448 3,433 3,022 - 411 - - - - - - - 39,777
TLG Services, Inc.

Oconee Nuclear StationDecommissioning Cost Analysis
Document D03-1671-003, Rev. 0Appendix D, Page 6 of 31
Table D-1Oconee Nuclear Station, Unit 1
SAFSTOR Decommissioning Cost Estimate(thousands of 2013 dollars)
Costs run: Wed, Oct 23, 2013 at 10:28:37 Off-Site LLRW NRC Spent Fuel Site Processed Burial Volumes Burial / Utility andActivity DECCER Version 2010.09.09i Decon Removal Packaging Transport Processing Disposal Other Total Total Lic. Term. Management Restoration Volume Class A Class B Class C GTCC Processed Craft ContractorIndex Activity Description Cost Cost Costs Costs Costs Costs Costs Contingency Costs Costs Costs Costs Cu. Feet Cu. Feet Cu. Feet Cu. Feet Cu. Feet Wt., Lbs. Manhours Manhours
Planning & Site Preparations3a.1.12 Prepare dismantling sequence - - - - - - 180 27 207 207 - - - - - - - - - 2,400 3a.1.13 Plant prep. & temp. svces - - - - - - 2,900 435 3,335 3,335 - - - - - - - - - - 3a.1.14 Design water clean-up system - - - - - - 105 16 121 121 - - - - - - - - - 1,400 3a.1.15 Rigging/Cont. Cntrl Envlps/tooling/etc. - - - - - - 2,200 330 2,530 2,530 - - - - - - - - - - 3a.1.16 Procure casks/liners & containers - - - - - - 92 14 106 106 - - - - - - - - - 1,230 3a.1 Subtotal Period 3a Activity Costs - - - - - - 10,557 1,584 12,141 11,729 - 411 - - - - - - - 72,703
Period 3a Additional Costs3a.2.1 Site Characterization - - - - - - 2,788 837 3,625 3,625 - - - - - - - - 19,100 7,852 3a.2 Subtotal Period 3a Additional Costs - - - - - - 2,788 837 3,625 3,625 - - - - - - - - 19,100 7,852
Period 3a Period-Dependent Costs3a.4.1 Insurance - - - - - - 339 34 373 373 - - - - - - - - - - 3a.4.2 Property taxes - - - - - - 6 1 7 7 - - - - - - - - - - 3a.4.3 Health physics supplies - 430 - - - - - 108 538 538 - - - - - - - - - - 3a.4.4 Heavy equipment rental - 571 - - - - - 86 657 657 - - - - - - - - - - 3a.4.5 Disposal of DAW generated - - 11 2 - 25 - 8 46 46 - - - 514 - - - 10,287 17 - 3a.4.6 Plant energy budget - - - - - - 617 92 709 709 - - - - - - - - - - 3a.4.7 NRC Fees - - - - - - 381 38 419 419 - - - - - - - - - - 3a.4.8 Corporate A&G - - - - - - 1,546 232 1,778 1,778 - - - - - - - - - - 3a.4.9 Site O&M - - - - - - 105 16 121 121 - - - - - - - - - - 3a.4.10 Security Staff Cost - - - - - - 665 100 765 765 - - - - - - - - - 25,905 3a.4.11 Utility Staff Cost - - - - - - 15,285 2,293 17,578 17,578 - - - - - - - - - 258,629 3a.4 Subtotal Period 3a Period-Dependent Costs - 1,001 11 2 - 25 18,943 3,006 22,989 22,989 - - - 514 - - - 10,287 17 284,533
3a.0 TOTAL PERIOD 3a COST - 1,001 11 2 - 25 32,289 5,426 38,754 38,343 - 411 - 514 - - - 10,287 19,117 365,088
PERIOD 3b - Decommissioning Preparations
Period 3b Direct Decommissioning Activities
Detailed Work Procedures3b.1.1.1 Plant systems - - - - - - 467 70 537 483 - 54 - - - - - - - 4,733 3b.1.1.2 Reactor internals - - - - - - 247 37 284 284 - - - - - - - - - 2,500 3b.1.1.3 Remaining buildings - - - - - - 133 20 153 38 - 115 - - - - - - - 1,350 3b.1.1.4 CRD cooling assembly - - - - - - 99 15 113 113 - - - - - - - - - 1,000 3b.1.1.5 CRD housings & ICI tubes - - - - - - 99 15 113 113 - - - - - - - - - 1,000 3b.1.1.6 Incore instrumentation - - - - - - 99 15 113 113 - - - - - - - - - 1,000 3b.1.1.7 Reactor vessel - - - - - - 358 54 412 412 - - - - - - - - - 3,630 3b.1.1.8 Facility closeout - - - - - - 118 18 136 68 - 68 - - - - - - - 1,200 3b.1.1.9 Missile shields - - - - - - 44 7 51 51 - - - - - - - - - 450 3b.1.1.10 Biological shield - - - - - - 118 18 136 136 - - - - - - - - - 1,200 3b.1.1.11 Steam generators - - - - - - 454 68 522 522 - - - - - - - - - 4,600 3b.1.1.12 Reinforced concrete - - - - - - 99 15 113 57 - 57 - - - - - - - 1,000 3b.1.1.13 Main Turbine - - - - - - 154 23 177 - - 177 - - - - - - - 1,560 3b.1.1.14 Main Condensers - - - - - - 154 23 177 - - 177 - - - - - - - 1,560 3b.1.1.15 Auxiliary building - - - - - - 269 40 310 279 - 31 - - - - - - - 2,730 3b.1.1.16 Reactor building - - - - - - 269 40 310 279 - 31 - - - - - - - 2,730 3b.1.1 Total - - - - - - 3,182 477 3,659 2,950 - 710 - - - - - - - 32,243 3b.1 Subtotal Period 3b Activity Costs - - - - - - 3,182 477 3,659 2,950 - 710 - - - - - - - 32,243
Period 3b Collateral Costs3b.3.1 Decon equipment 946 - - - - - - 142 1,087 1,087 - - - - - - - - - - 3b.3.2 Staff relocation expenses - - - - - - 1,130 169 1,299 1,299 - - - - - - - - - - 3b.3.3 Pipe cutting equipment - 1,100 - - - - - 165 1,265 1,265 - - - - - - - - - - 3b.3 Subtotal Period 3b Collateral Costs 946 1,100 - - - - 1,130 476 3,652 3,652 - - - - - - - - - -
Period 3b Period-Dependent Costs3b.4.1 Decon supplies 29 - - - - - - 7 37 37 - - - - - - - - - - 3b.4.2 Insurance - - - - - - 198 20 217 217 - - - - - - - - - - 3b.4.3 Property taxes - - - - - - 3 0 3 3 - - - - - - - - - - 3b.4.4 Health physics supplies - 238 - - - - - 60 298 298 - - - - - - - - - - 3b.4.5 Heavy equipment rental - 291 - - - - - 44 335 335 - - - - - - - - - - 3b.4.6 Disposal of DAW generated - - 6 1 - 14 - 4 26 26 - - - 292 - - - 5,831 10 - 3b.4.7 Plant energy budget - - - - - - 314 47 361 361 - - - - - - - - - - 3b.4.8 NRC Fees - - - - - - 194 19 214 214 - - - - - - - - - -
TLG Services, Inc.

Oconee Nuclear StationDecommissioning Cost Analysis
Document D03-1671-003, Rev. 0Appendix D, Page 7 of 31
Table D-1Oconee Nuclear Station, Unit 1
SAFSTOR Decommissioning Cost Estimate(thousands of 2013 dollars)
Costs run: Wed, Oct 23, 2013 at 10:28:37 Off-Site LLRW NRC Spent Fuel Site Processed Burial Volumes Burial / Utility andActivity DECCER Version 2010.09.09i Decon Removal Packaging Transport Processing Disposal Other Total Total Lic. Term. Management Restoration Volume Class A Class B Class C GTCC Processed Craft ContractorIndex Activity Description Cost Cost Costs Costs Costs Costs Costs Contingency Costs Costs Costs Costs Cu. Feet Cu. Feet Cu. Feet Cu. Feet Cu. Feet Wt., Lbs. Manhours Manhours
Period 3b Period-Dependent Costs (continued)3b.4.9 Corporate A&G - - - - - - 1,093 164 1,256 1,256 - - - - - - - - - - 3b.4.10 Site O&M - - - - - - 74 11 85 85 - - - - - - - - - - 3b.4.11 Security Staff Cost - - - - - - 339 51 390 390 - - - - - - - - - 13,201 3b.4.12 Utility Staff Cost - - - - - - 11,080 1,662 12,742 12,742 - - - - - - - - - 182,811 3b.4 Subtotal Period 3b Period-Dependent Costs 29 529 6 1 - 14 13,295 2,089 15,964 15,964 - - - 292 - - - 5,831 10 196,012
3b.0 TOTAL PERIOD 3b COST 975 1,629 6 1 - 14 17,607 3,043 23,276 22,566 - 710 - 292 - - - 5,831 10 228,255
PERIOD 3 TOTALS 975 2,631 18 3 - 39 49,896 8,469 62,030 60,909 - 1,121 - 806 - - - 16,119 19,126 593,343
PERIOD 4a - Large Component Removal
Period 4a Direct Decommissioning Activities
Nuclear Steam Supply System Removal4a.1.1.1 Reactor Coolant Piping 31 151 21 18 132 209 - 130 691 691 - - 483 511 - - - 112,096 4,014 - 4a.1.1.2 Pressurizer Relief Tank 3 11 4 3 26 37 - 18 102 102 - - 94 94 - - - 20,849 340 - 4a.1.1.3 Reactor Coolant Pumps & Motors 21 68 73 190 - 1,766 - 505 2,623 2,623 - - - 6,309 - - - 780,400 2,811 80 4a.1.1.4 Pressurizer 8 47 312 96 - 986 - 308 1,756 1,756 - - - 3,521 - - - 337,377 1,546 500 4a.1.1.5 Steam Generators 28 2,064 1,073 1,259 - 5,588 - 2,223 12,235 12,235 - - - 19,963 - - - 2,630,356 10,254 750 4a.1.1.6 Retired Steam Generator Units - - 1,073 1,259 - 5,588 - 1,693 9,614 9,614 - - - 19,963 - - - 2,630,356 5,400 750 4a.1.1.7 CRDMs/ICIs/Service Structure Removal 27 99 324 73 166 245 - 168 1,102 1,102 - - 1,823 3,253 - - - 136,066 2,687 - 4a.1.1.8 Reactor Vessel Internals 61 2,495 7,055 755 - 4,398 222 6,086 21,072 21,072 - - - 1,263 1,002 393 - 278,133 20,983 971 4a.1.1.9 Vessel & Internals GTCC Disposal - - - - - 9,711 - 1,457 11,167 11,167 - - - - - - 1,785 353,100 - - 4a.1.1.10 Reactor Vessel - 4,812 1,405 488 - 2,695 222 5,463 15,084 15,084 - - - 9,626 - - - 979,948 20,983 971 4a.1.1 Totals 178 9,746 11,340 4,142 324 31,221 444 18,050 75,445 75,445 - - 2,400 64,505 1,002 393 1,785 8,258,682 69,018 4,023
Removal of Major Equipment4a.1.2 Main Turbine/Generator - 282 224 34 593 - - 187 1,320 1,320 - - 4,020 - - - - 241,216 6,768 - 4a.1.3 Main Condensers - 858 116 17 588 - - 317 1,895 1,895 - - 5,310 - - - - 238,934 21,071 -
Cascading Costs from Clean Building Demolition4a.1.4.1 Reactor Building - 777 - - - - - 117 893 893 - - - - - - - - 9,379 - 4a.1.4.2 Auxiliary Building - 103 - - - - - 15 119 119 - - - - - - - - 1,333 - 4a.1.4.3 Turbine Building - 189 - - - - - 28 217 217 - - - - - - - - 3,027 - 4a.1.4.4 Fuel Building - 77 - - - - - 12 88 88 - - - - - - - - 961 - 4a.1.4 Totals - 1,146 - - - - - 172 1,318 1,318 - - - - - - - - 14,700 -
Disposal of Plant Systems4a.1.5.1 Chemical Addition - 29 - - - - - 4 33 - - 33 - - - - - - 821 - 4a.1.5.2 Chemical Addition RCA - 25 0 1 22 - - 10 57 57 - - 222 - - - - 9,016 510 - 4a.1.5.3 Condensate - 557 - - - - - 84 640 - - 640 - - - - - - 15,699 - 4a.1.5.4 Condensate (Contaminated) - 564 47 88 3,035 - - 614 4,349 4,349 - - 30,383 - - - - 1,233,881 13,824 - 4a.1.5.5 Condenser Circulating Water - 355 - - - - - 53 408 - - 408 - - - - - - 10,040 - 4a.1.5.6 Electro Hydraulic Turbine Control - 19 - - - - - 3 21 - - 21 - - - - - - 499 - 4a.1.5.7 Feedwater & Emergency Feedwater - 172 - - - - - 26 197 - - 197 - - - - - - 4,862 - 4a.1.5.8 Feedwater & Emergency Feedwater (Cont.) - 160 8 14 487 - - 116 784 784 - - 4,873 - - - - 197,906 3,878 - 4a.1.5.9 Feedwater & Emergency Feedwater RCA - 262 8 14 481 - - 140 905 905 - - 4,815 - - - - 195,560 5,622 - 4a.1.5.10 Heater Drains - 387 - - - - - 58 445 - - 445 - - - - - - 11,003 - 4a.1.5.11 Heater Drains (Contaminated) - 273 8 16 541 - - 153 991 991 - - 5,419 - - - - 220,074 6,646 - 4a.1.5.12 Heater Vent - 33 - - - - - 5 38 - - 38 - - - - - - 1,002 - 4a.1.5.13 High Pressure Extraction - 25 - - - - - 4 29 - - 29 - - - - - - 729 - 4a.1.5.14 Hydraulic Oil - 2 - - - - - 0 3 - - 3 - - - - - - 75 - 4a.1.5.15 Hydrogen - 29 - - - - - 4 34 - - 34 - - - - - - 848 - 4a.1.5.16 Hydrogen Seal Oil - 32 - - - - - 5 36 - - 36 - - - - - - 923 - 4a.1.5.17 Low Pressure Extraction - 37 - - - - - 6 43 - - 43 - - - - - - 1,096 - 4a.1.5.18 Main Steam - 89 - - - - - 13 102 - - 102 - - - - - - 2,558 - 4a.1.5.19 Main Steam RCA - 326 45 80 2,778 - - 515 3,744 3,744 - - 27,808 - - - - 1,129,284 7,747 - 4a.1.5.20 Moisture Separator Reheater Drains - 6 0 0 6 - - 3 16 16 - - 65 - - - - 2,629 147 - 4a.1.5.21 Post Accident Monitoring - 30 1 1 40 - - 14 85 85 - - 401 - - - - 16,304 785 - 4a.1.5.22 Reactor Building Spray - 95 3 6 210 - - 56 371 371 - - 2,105 - - - - 85,488 2,170 - 4a.1.5.23 Sample Monitoring - 105 11 12 49 105 - 62 343 343 - - 489 443 - - - 49,133 2,802 - 4a.1.5.24 Stator Coolant - 51 - - - - - 8 59 - - 59 - - - - - - 1,507 - 4a.1.5.25 Steam Drain - 86 - - - - - 13 99 - - 99 - - - - - - 2,668 - 4a.1.5.26 Steam Seal - 52 1 2 53 - - 21 129 129 - - 533 - - - - 21,649 1,169 - 4a.1.5.27 Turbine Oil - 128 - - - - - 19 147 - - 147 - - - - - - 3,518 -
TLG Services, Inc.

Oconee Nuclear StationDecommissioning Cost Analysis
Document D03-1671-003, Rev. 0Appendix D, Page 8 of 31
Table D-1Oconee Nuclear Station, Unit 1
SAFSTOR Decommissioning Cost Estimate(thousands of 2013 dollars)
Costs run: Wed, Oct 23, 2013 at 10:28:37 Off-Site LLRW NRC Spent Fuel Site Processed Burial Volumes Burial / Utility andActivity DECCER Version 2010.09.09i Decon Removal Packaging Transport Processing Disposal Other Total Total Lic. Term. Management Restoration Volume Class A Class B Class C GTCC Processed Craft ContractorIndex Activity Description Cost Cost Costs Costs Costs Costs Costs Contingency Costs Costs Costs Costs Cu. Feet Cu. Feet Cu. Feet Cu. Feet Cu. Feet Wt., Lbs. Manhours Manhours
Disposal of Plant Systems (continued)4a.1.5.28 Vacuum - 120 - - - - - 18 138 - - 138 - - - - - - 3,438 - 4a.1.5 Totals - 4,049 132 233 7,704 105 - 2,027 14,249 11,775 - 2,474 77,114 443 - - - 3,160,923 106,586 -
4a.1.6 Scaffolding in support of decommissioning - 428 10 2 48 9 - 118 615 615 - - 433 38 - - - 22,021 13,013 -
4a.1 Subtotal Period 4a Activity Costs 178 16,509 11,822 4,428 9,257 31,335 444 20,870 94,842 92,368 - 2,474 89,277 64,985 1,002 393 1,785 11,921,780 231,156 4,023
Period 4a Additional Costs4a.2.1 Remedial Action Surveys - - - - - - 1,257 377 1,634 1,634 - - - - - - - - 25,741 - 4a.2 Subtotal Period 4a Additional Costs - - - - - - 1,257 377 1,634 1,634 - - - - - - - - 25,741 -
Period 4a Collateral Costs4a.3.1 Process decommissioning water waste 3 - 3 16 - 18 - 9 49 49 - - - 44 - - - 2,642 9 - 4a.3.3 Small tool allowance - 185 - - - - - 28 213 191 - 21 - - - - - - - - 4a.3 Subtotal Period 4a Collateral Costs 3 185 3 16 - 18 - 36 261 240 - 21 - 44 - - - 2,642 9 -
Period 4a Period-Dependent Costs4a.4.1 Decon supplies 71 - - - - - - 18 89 89 - - - - - - - - - - 4a.4.2 Insurance - - - - - - 480 48 529 529 - - - - - - - - - - 4a.4.3 Property taxes - - - - - - 7 1 8 7 - 1 - - - - - - - - 4a.4.4 Health physics supplies - 1,761 - - - - - 440 2,202 2,202 - - - - - - - - - - 4a.4.5 Heavy equipment rental - 2,709 - - - - - 406 3,116 3,116 - - - - - - - - - - 4a.4.6 Disposal of DAW generated - - 70 10 - 157 - 48 286 286 - - - 3,227 - - - 64,532 105 - 4a.4.7 Plant energy budget - - - - - - 725 109 834 834 - - - - - - - - - - 4a.4.8 NRC Fees - - - - - - 744 74 819 819 - - - - - - - - - - 4a.4.9 Liquid Radwaste Processing Equipment/Services - - - - - - 492 74 565 565 - - - - - - - - - - 4a.4.10 Corporate A&G - - - - - - 2,825 424 3,249 3,249 - - - - - - - - - - 4a.4.11 Site O&M - - - - - - 287 43 330 330 - - - - - - - - - - 4a.4.12 Security Staff Cost - - - - - - 1,061 159 1,220 1,220 - - - - - - - - - 45,407 4a.4.13 Utility Staff Cost - - - - - - 28,617 4,293 32,910 32,910 - - - - - - - - - 472,663 4a.4 Subtotal Period 4a Period-Dependent Costs 71 4,471 70 10 - 157 35,239 6,137 46,156 46,155 - 1 - 3,227 - - - 64,532 105 518,070
4a.0 TOTAL PERIOD 4a COST 252 21,164 11,896 4,454 9,257 31,511 36,940 27,421 142,894 140,398 - 2,497 89,277 68,256 1,002 393 1,785 11,988,950 257,011 522,092
PERIOD 4b - Site Decontamination
Period 4b Direct Decommissioning Activities4b.1.1 Remove spent fuel racks 305 33 156 80 - 819 - 393 1,787 1,787 - - - 3,470 - - - 229,389 956 -
Disposal of Plant Systems4b.1.2.1 Component Cooling - 50 - - - - - 7 57 - - 57 - - - - - - 1,374 - 4b.1.2.2 Component Cooling RCA - 129 2 4 143 - - 54 333 333 - - 1,430 - - - - 58,079 2,726 - 4b.1.2.3 Core Flood - 109 3 6 211 - - 60 390 390 - - 2,110 - - - - 85,669 2,499 - 4b.1.2.4 Electrical (Clean) - 614 - - - - - 92 706 - - 706 - - - - - - 16,347 - 4b.1.2.5 Electrical (Contaminated) - 188 4 6 157 14 - 75 444 444 - - 1,571 59 - - - 67,733 4,239 - 4b.1.2.6 Electrical (Contaminated) RCA - 1,313 24 44 1,516 - - 565 3,463 3,463 - - 15,179 - - - - 616,410 28,392 - 4b.1.2.7 High Pressure Injection - 895 169 197 2,540 1,275 - 970 6,046 6,046 - - 25,429 5,398 - - - 1,389,890 21,082 - 4b.1.2.8 Incore Instrumentation - 15 1 0 - 4 - 5 26 26 - - - 18 - - - 1,228 421 - 4b.1.2.9 Low Pressure Injection - 500 54 65 827 426 - 371 2,243 2,243 - - 8,280 1,809 - - - 455,552 12,024 - 4b.1.2.10 On-Site/Off-Site Power - 98 - - - - - 15 112 - - 112 - - - - - - 2,517 - 4b.1.2.11 Purge - 162 8 14 484 - - 116 783 783 - - 4,842 - - - - 196,641 3,632 - 4b.1.2.12 RFS Refueling Water - 47 1 2 56 - - 20 126 126 - - 562 - - - - 22,826 1,017 - 4b.1.2.13 Radiation Instrument Alarm - 12 - - - - - 2 13 - - 13 - - - - - - 323 - 4b.1.2.14 Radiation Instrument Alarm RCA - 29 0 0 6 - - 8 44 44 - - 63 - - - - 2,565 788 - 4b.1.2.15 Reactor Building Cooling - 362 30 54 1,873 - - 383 2,701 2,701 - - 18,745 - - - - 761,247 8,761 - 4b.1.2.16 Reactor Coolant - 231 27 20 72 186 - 121 656 656 - - 723 783 - - - 81,371 5,766 - 4b.1.2.17 Reactor Coolant Storage - 493 60 64 384 539 - 331 1,872 1,872 - - 3,848 2,309 - - - 307,351 11,619 - 4b.1.2.18 Spent Fuel Cooling - 243 26 30 259 230 - 164 952 952 - - 2,592 976 - - - 169,772 5,723 - 4b.1.2.19 Ventilation (Clean) - 192 - - - - - 29 221 - - 221 - - - - - - 5,666 - 4b.1.2.20 Ventilation (Contaminated) - 558 15 27 937 - - 286 1,823 1,823 - - 9,382 - - - - 381,013 11,588 - 4b.1.2.21 Ventilation (clean) RCA - 258 8 14 492 - - 141 913 913 - - 4,925 - - - - 200,000 4,619 - 4b.1.2 Totals - 6,496 431 548 9,958 2,675 - 3,815 23,924 22,814 - 1,110 99,682 11,353 - - - 4,797,347 151,124 -
4b.1.3 Scaffolding in support of decommissioning - 642 16 3 72 14 - 177 923 923 - - 650 57 - - - 33,032 19,519 -
TLG Services, Inc.
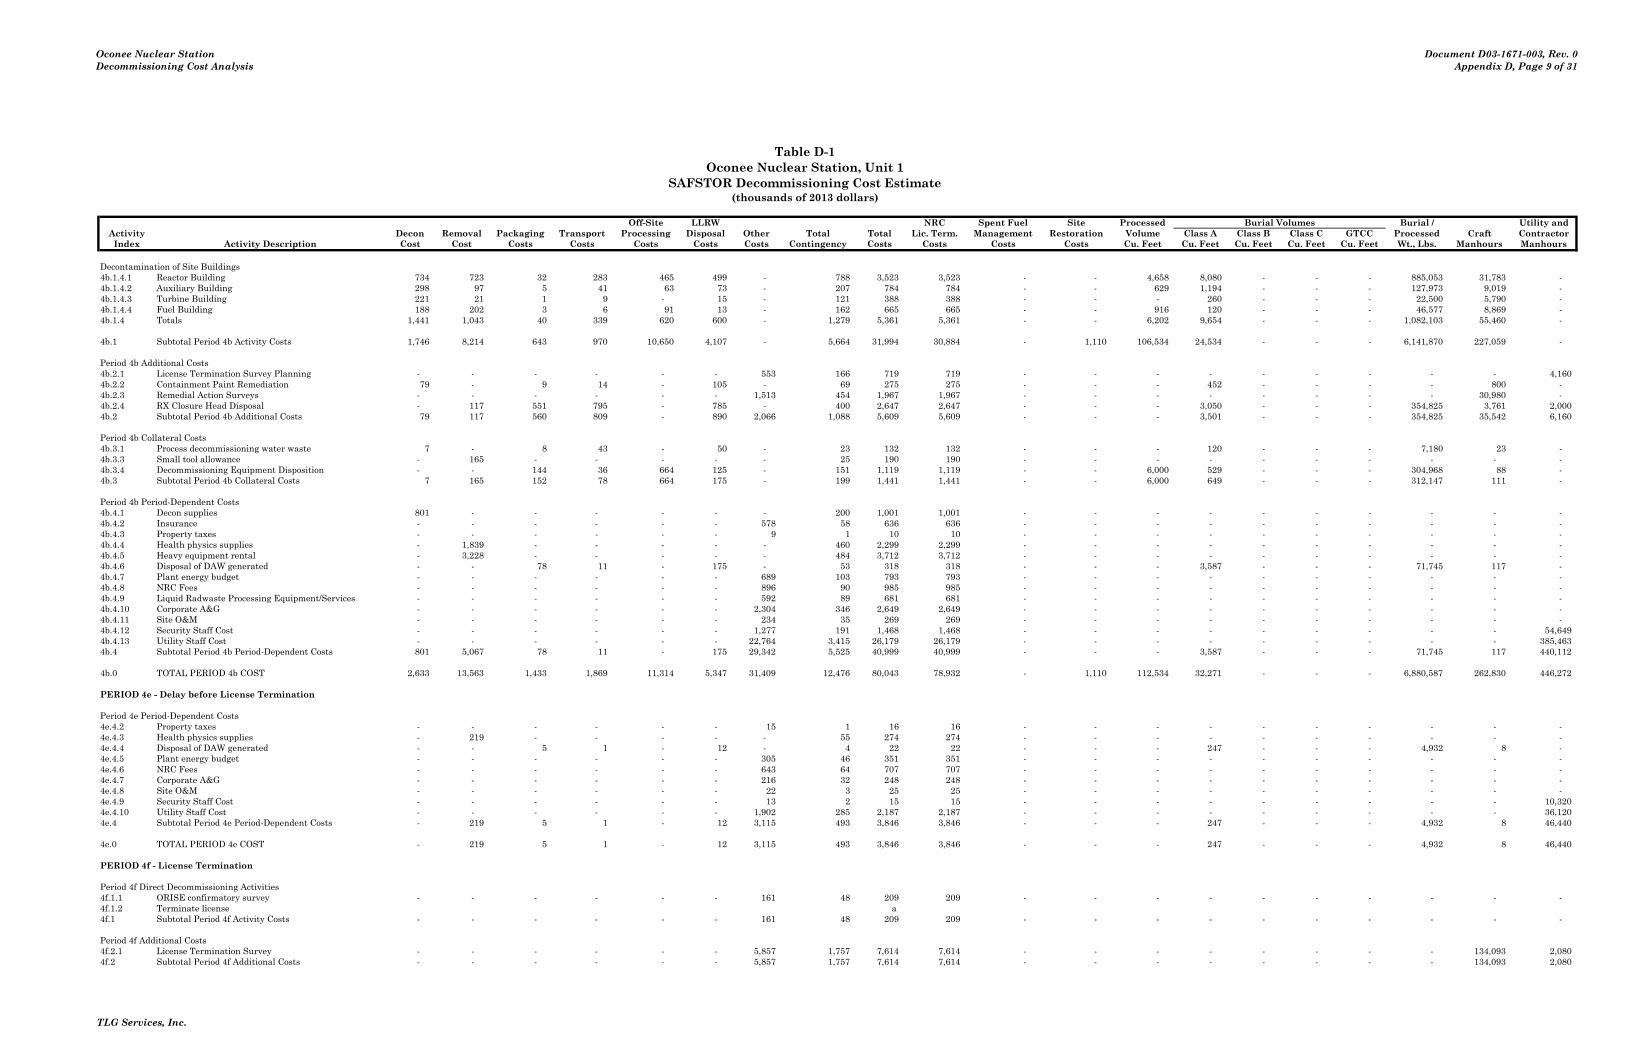
Oconee Nuclear StationDecommissioning Cost Analysis
Document D03-1671-003, Rev. 0Appendix D, Page 9 of 31
Table D-1Oconee Nuclear Station, Unit 1
SAFSTOR Decommissioning Cost Estimate(thousands of 2013 dollars)
Costs run: Wed, Oct 23, 2013 at 10:28:37 Off-Site LLRW NRC Spent Fuel Site Processed Burial Volumes Burial / Utility andActivity DECCER Version 2010.09.09i Decon Removal Packaging Transport Processing Disposal Other Total Total Lic. Term. Management Restoration Volume Class A Class B Class C GTCC Processed Craft ContractorIndex Activity Description Cost Cost Costs Costs Costs Costs Costs Contingency Costs Costs Costs Costs Cu. Feet Cu. Feet Cu. Feet Cu. Feet Cu. Feet Wt., Lbs. Manhours Manhours
Decontamination of Site Buildings4b.1.4.1 Reactor Building 734 723 32 283 465 499 - 788 3,523 3,523 - - 4,658 8,080 - - - 885,053 31,783 - 4b.1.4.2 Auxiliary Building 298 97 5 41 63 73 - 207 784 784 - - 629 1,194 - - - 127,973 9,019 - 4b.1.4.3 Turbine Building 221 21 1 9 - 15 - 121 388 388 - - - 260 - - - 22,500 5,790 - 4b.1.4.4 Fuel Building 188 202 3 6 91 13 - 162 665 665 - - 916 120 - - - 46,577 8,869 - 4b.1.4 Totals 1,441 1,043 40 339 620 600 - 1,279 5,361 5,361 - - 6,202 9,654 - - - 1,082,103 55,460 -
4b.1 Subtotal Period 4b Activity Costs 1,746 8,214 643 970 10,650 4,107 - 5,664 31,994 30,884 - 1,110 106,534 24,534 - - - 6,141,870 227,059 -
Period 4b Additional Costs4b.2.1 License Termination Survey Planning - - - - - - 553 166 719 719 - - - - - - - - - 4,160 4b.2.2 Containment Paint Remediation 79 - 9 14 - 105 - 69 275 275 - - - 452 - - - - 800 - 4b.2.3 Remedial Action Surveys - - - - - - 1,513 454 1,967 1,967 - - - - - - - - 30,980 - 4b.2.4 RX Closure Head Disposal - 117 551 795 - 785 - 400 2,647 2,647 - - - 3,050 - - - 354,825 3,761 2,000 4b.2 Subtotal Period 4b Additional Costs 79 117 560 809 - 890 2,066 1,088 5,609 5,609 - - - 3,501 - - - 354,825 35,542 6,160
Period 4b Collateral Costs4b.3.1 Process decommissioning water waste 7 - 8 43 - 50 - 23 132 132 - - - 120 - - - 7,180 23 - 4b.3.3 Small tool allowance - 165 - - - - - 25 190 190 - - - - - - - - - - 4b.3.4 Decommissioning Equipment Disposition - - 144 36 664 125 - 151 1,119 1,119 - - 6,000 529 - - - 304,968 88 - 4b.3 Subtotal Period 4b Collateral Costs 7 165 152 78 664 175 - 199 1,441 1,441 - - 6,000 649 - - - 312,147 111 -
Period 4b Period-Dependent Costs4b.4.1 Decon supplies 801 - - - - - - 200 1,001 1,001 - - - - - - - - - - 4b.4.2 Insurance - - - - - - 578 58 636 636 - - - - - - - - - - 4b.4.3 Property taxes - - - - - - 9 1 10 10 - - - - - - - - - - 4b.4.4 Health physics supplies - 1,839 - - - - - 460 2,299 2,299 - - - - - - - - - - 4b.4.5 Heavy equipment rental - 3,228 - - - - - 484 3,712 3,712 - - - - - - - - - - 4b.4.6 Disposal of DAW generated - - 78 11 - 175 - 53 318 318 - - - 3,587 - - - 71,745 117 - 4b.4.7 Plant energy budget - - - - - - 689 103 793 793 - - - - - - - - - - 4b.4.8 NRC Fees - - - - - - 896 90 985 985 - - - - - - - - - - 4b.4.9 Liquid Radwaste Processing Equipment/Services - - - - - - 592 89 681 681 - - - - - - - - - - 4b.4.10 Corporate A&G - - - - - - 2,304 346 2,649 2,649 - - - - - - - - - - 4b.4.11 Site O&M - - - - - - 234 35 269 269 - - - - - - - - - - 4b.4.12 Security Staff Cost - - - - - - 1,277 191 1,468 1,468 - - - - - - - - - 54,649 4b.4.13 Utility Staff Cost - - - - - - 22,764 3,415 26,179 26,179 - - - - - - - - - 385,463 4b.4 Subtotal Period 4b Period-Dependent Costs 801 5,067 78 11 - 175 29,342 5,525 40,999 40,999 - - - 3,587 - - - 71,745 117 440,112
4b.0 TOTAL PERIOD 4b COST 2,633 13,563 1,433 1,869 11,314 5,347 31,409 12,476 80,043 78,932 - 1,110 112,534 32,271 - - - 6,880,587 262,830 446,272
PERIOD 4e - Delay before License Termination
Period 4e Period-Dependent Costs4e.4.2 Property taxes - - - - - - 15 1 16 16 - - - - - - - - - - 4e.4.3 Health physics supplies - 219 - - - - - 55 274 274 - - - - - - - - - - 4e.4.4 Disposal of DAW generated - - 5 1 - 12 - 4 22 22 - - - 247 - - - 4,932 8 - 4e.4.5 Plant energy budget - - - - - - 305 46 351 351 - - - - - - - - - - 4e.4.6 NRC Fees - - - - - - 643 64 707 707 - - - - - - - - - - 4e.4.7 Corporate A&G - - - - - - 216 32 248 248 - - - - - - - - - - 4e.4.8 Site O&M - - - - - - 22 3 25 25 - - - - - - - - - - 4e.4.9 Security Staff Cost - - - - - - 13 2 15 15 - - - - - - - - - 10,320 4e.4.10 Utility Staff Cost - - - - - - 1,902 285 2,187 2,187 - - - - - - - - - 36,120 4e.4 Subtotal Period 4e Period-Dependent Costs - 219 5 1 - 12 3,115 493 3,846 3,846 - - - 247 - - - 4,932 8 46,440
4e.0 TOTAL PERIOD 4e COST - 219 5 1 - 12 3,115 493 3,846 3,846 - - - 247 - - - 4,932 8 46,440
PERIOD 4f - License Termination
Period 4f Direct Decommissioning Activities4f.1.1 ORISE confirmatory survey - - - - - - 161 48 209 209 - - - - - - - - - - 4f.1.2 Terminate license a 4f.1 Subtotal Period 4f Activity Costs - - - - - - 161 48 209 209 - - - - - - - - - -
Period 4f Additional Costs4f.2.1 License Termination Survey - - - - - - 5,857 1,757 7,614 7,614 - - - - - - - - 134,093 2,080 4f.2 Subtotal Period 4f Additional Costs - - - - - - 5,857 1,757 7,614 7,614 - - - - - - - - 134,093 2,080
TLG Services, Inc.
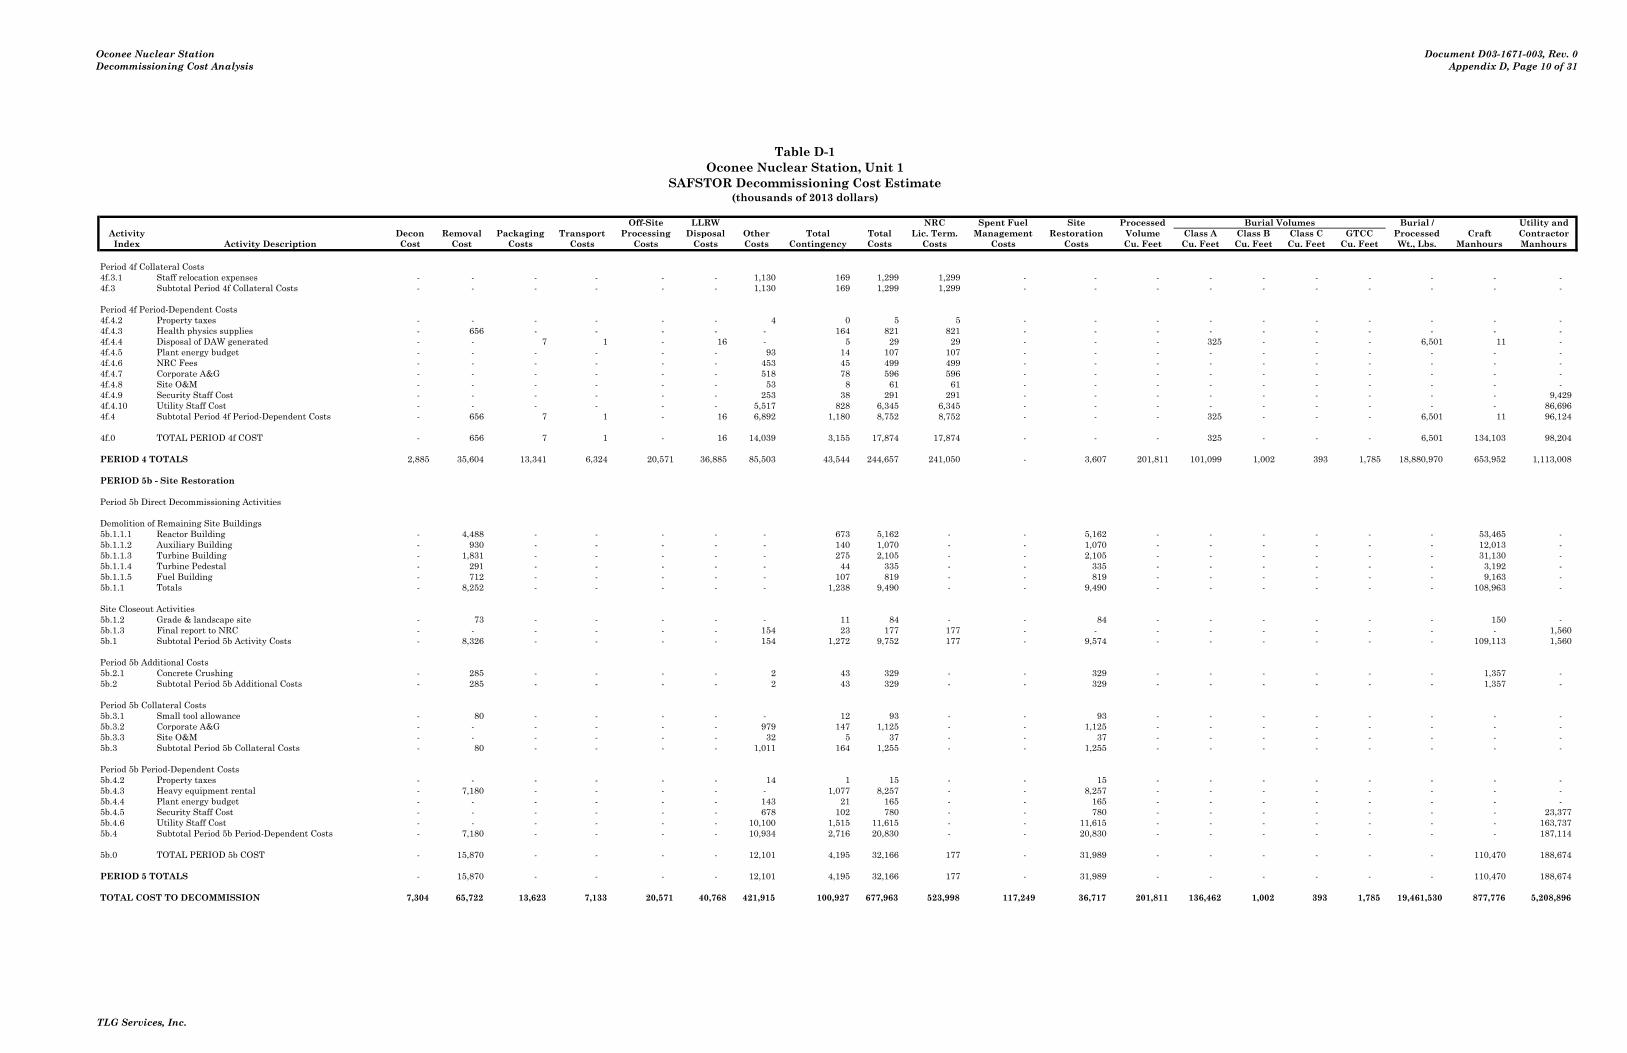
Oconee Nuclear StationDecommissioning Cost Analysis
Document D03-1671-003, Rev. 0Appendix D, Page 10 of 31
Table D-1Oconee Nuclear Station, Unit 1
SAFSTOR Decommissioning Cost Estimate(thousands of 2013 dollars)
Costs run: Wed, Oct 23, 2013 at 10:28:37 Off-Site LLRW NRC Spent Fuel Site Processed Burial Volumes Burial / Utility andActivity DECCER Version 2010.09.09i Decon Removal Packaging Transport Processing Disposal Other Total Total Lic. Term. Management Restoration Volume Class A Class B Class C GTCC Processed Craft ContractorIndex Activity Description Cost Cost Costs Costs Costs Costs Costs Contingency Costs Costs Costs Costs Cu. Feet Cu. Feet Cu. Feet Cu. Feet Cu. Feet Wt., Lbs. Manhours Manhours
Period 4f Collateral Costs4f.3.1 Staff relocation expenses - - - - - - 1,130 169 1,299 1,299 - - - - - - - - - - 4f.3 Subtotal Period 4f Collateral Costs - - - - - - 1,130 169 1,299 1,299 - - - - - - - - - -
Period 4f Period-Dependent Costs4f.4.2 Property taxes - - - - - - 4 0 5 5 - - - - - - - - - - 4f.4.3 Health physics supplies - 656 - - - - - 164 821 821 - - - - - - - - - - 4f.4.4 Disposal of DAW generated - - 7 1 - 16 - 5 29 29 - - - 325 - - - 6,501 11 - 4f.4.5 Plant energy budget - - - - - - 93 14 107 107 - - - - - - - - - - 4f.4.6 NRC Fees - - - - - - 453 45 499 499 - - - - - - - - - - 4f.4.7 Corporate A&G - - - - - - 518 78 596 596 - - - - - - - - - - 4f.4.8 Site O&M - - - - - - 53 8 61 61 - - - - - - - - - - 4f.4.9 Security Staff Cost - - - - - - 253 38 291 291 - - - - - - - - - 9,429 4f.4.10 Utility Staff Cost - - - - - - 5,517 828 6,345 6,345 - - - - - - - - - 86,696 4f.4 Subtotal Period 4f Period-Dependent Costs - 656 7 1 - 16 6,892 1,180 8,752 8,752 - - - 325 - - - 6,501 11 96,124
4f.0 TOTAL PERIOD 4f COST - 656 7 1 - 16 14,039 3,155 17,874 17,874 - - - 325 - - - 6,501 134,103 98,204
PERIOD 4 TOTALS 2,885 35,604 13,341 6,324 20,571 36,885 85,503 43,544 244,657 241,050 - 3,607 201,811 101,099 1,002 393 1,785 18,880,970 653,952 1,113,008
PERIOD 5b - Site Restoration
Period 5b Direct Decommissioning Activities
Demolition of Remaining Site Buildings5b.1.1.1 Reactor Building - 4,488 - - - - - 673 5,162 - - 5,162 - - - - - - 53,465 - 5b.1.1.2 Auxiliary Building - 930 - - - - - 140 1,070 - - 1,070 - - - - - - 12,013 - 5b.1.1.3 Turbine Building - 1,831 - - - - - 275 2,105 - - 2,105 - - - - - - 31,130 - 5b.1.1.4 Turbine Pedestal - 291 - - - - - 44 335 - - 335 - - - - - - 3,192 - 5b.1.1.5 Fuel Building - 712 - - - - - 107 819 - - 819 - - - - - - 9,163 - 5b.1.1 Totals - 8,252 - - - - - 1,238 9,490 - - 9,490 - - - - - - 108,963 -
Site Closeout Activities5b.1.2 Grade & landscape site - 73 - - - - - 11 84 - - 84 - - - - - - 150 - 5b.1.3 Final report to NRC - - - - - - 154 23 177 177 - - - - - - - - - 1,560 5b.1 Subtotal Period 5b Activity Costs - 8,326 - - - - 154 1,272 9,752 177 - 9,574 - - - - - - 109,113 1,560
Period 5b Additional Costs5b.2.1 Concrete Crushing - 285 - - - - 2 43 329 - - 329 - - - - - - 1,357 - 5b.2 Subtotal Period 5b Additional Costs - 285 - - - - 2 43 329 - - 329 - - - - - - 1,357 -
Period 5b Collateral Costs5b.3.1 Small tool allowance - 80 - - - - - 12 93 - - 93 - - - - - - - - 5b.3.2 Corporate A&G - - - - - - 979 147 1,125 - - 1,125 - - - - - - - - 5b.3.3 Site O&M - - - - - - 32 5 37 - - 37 - - - - - - - - 5b.3 Subtotal Period 5b Collateral Costs - 80 - - - - 1,011 164 1,255 - - 1,255 - - - - - - - -
Period 5b Period-Dependent Costs5b.4.2 Property taxes - - - - - - 14 1 15 - - 15 - - - - - - - - 5b.4.3 Heavy equipment rental - 7,180 - - - - - 1,077 8,257 - - 8,257 - - - - - - - - 5b.4.4 Plant energy budget - - - - - - 143 21 165 - - 165 - - - - - - - - 5b.4.5 Security Staff Cost - - - - - - 678 102 780 - - 780 - - - - - - - 23,377 5b.4.6 Utility Staff Cost - - - - - - 10,100 1,515 11,615 - - 11,615 - - - - - - - 163,737 5b.4 Subtotal Period 5b Period-Dependent Costs - 7,180 - - - - 10,934 2,716 20,830 - - 20,830 - - - - - - - 187,114
5b.0 TOTAL PERIOD 5b COST - 15,870 - - - - 12,101 4,195 32,166 177 - 31,989 - - - - - - 110,470 188,674
PERIOD 5 TOTALS - 15,870 - - - - 12,101 4,195 32,166 177 - 31,989 - - - - - - 110,470 188,674
TOTAL COST TO DECOMMISSION 7,304 65,722 13,623 7,133 20,571 40,768 421,915 100,927 677,963 523,998 117,249 36,717 201,811 136,462 1,002 393 1,785 19,461,530 877,776 5,208,896
TLG Services, Inc.
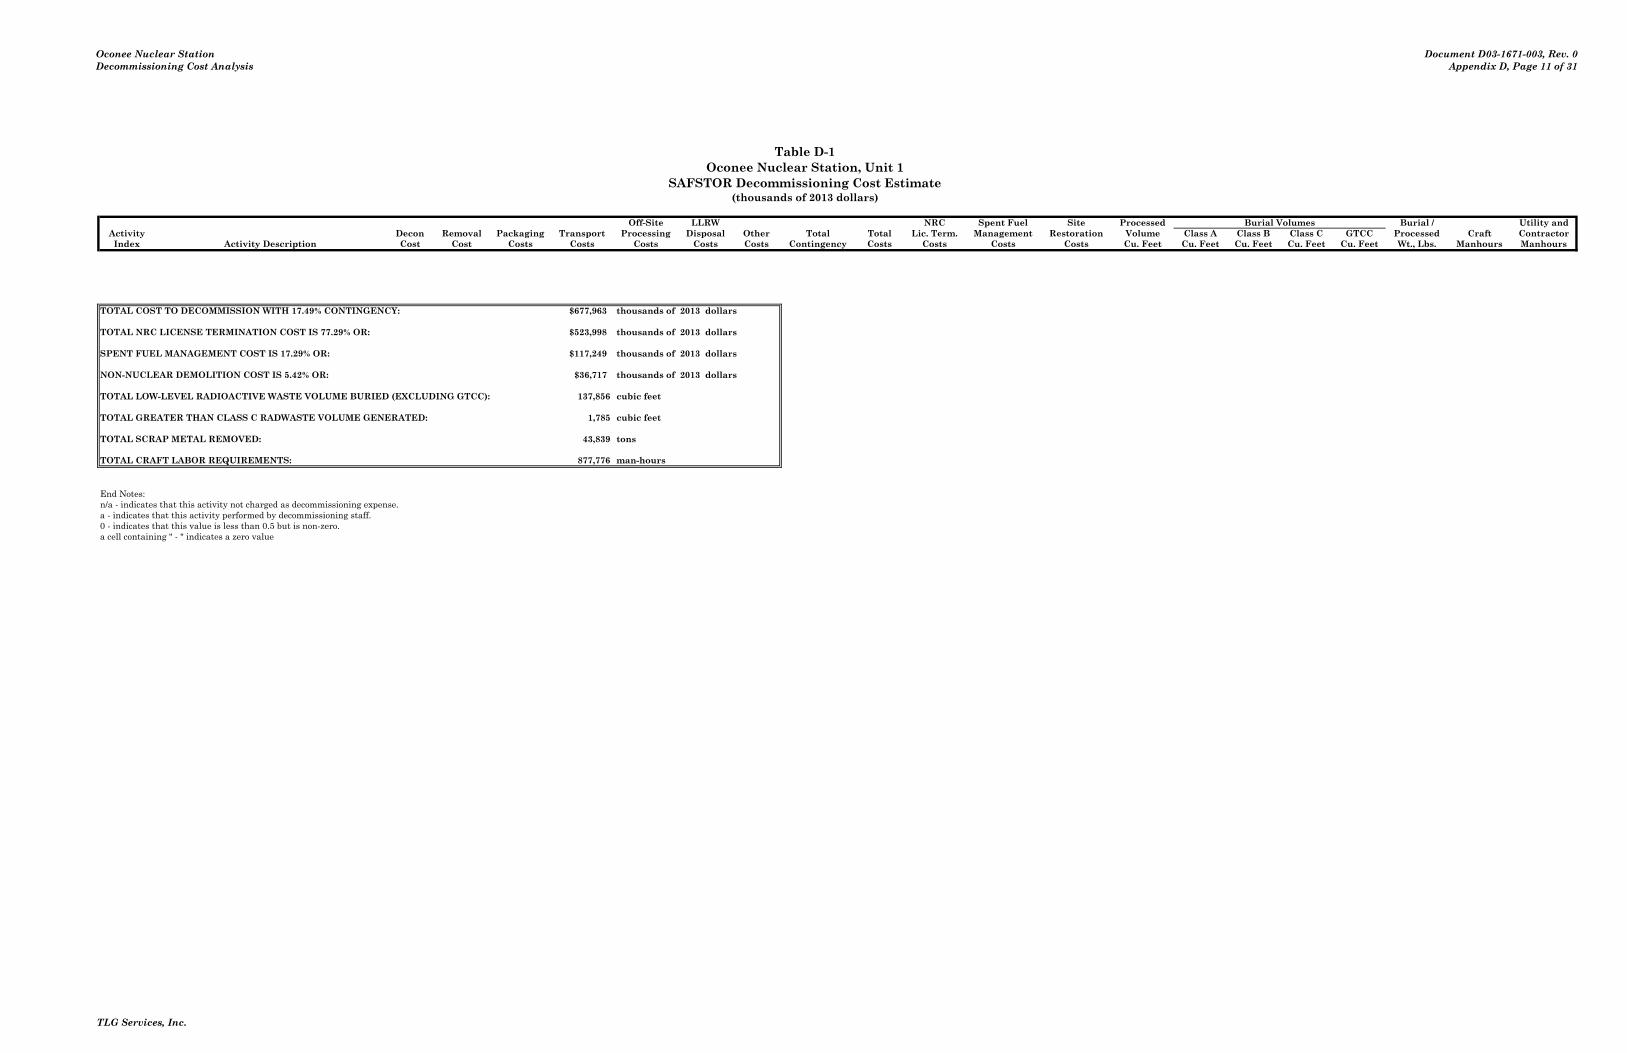
Oconee Nuclear StationDecommissioning Cost Analysis
Document D03-1671-003, Rev. 0Appendix D, Page 11 of 31
Table D-1Oconee Nuclear Station, Unit 1
SAFSTOR Decommissioning Cost Estimate(thousands of 2013 dollars)
Costs run: Wed, Oct 23, 2013 at 10:28:37 Off-Site LLRW NRC Spent Fuel Site Processed Burial Volumes Burial / Utility andActivity DECCER Version 2010.09.09i Decon Removal Packaging Transport Processing Disposal Other Total Total Lic. Term. Management Restoration Volume Class A Class B Class C GTCC Processed Craft ContractorIndex Activity Description Cost Cost Costs Costs Costs Costs Costs Contingency Costs Costs Costs Costs Cu. Feet Cu. Feet Cu. Feet Cu. Feet Cu. Feet Wt., Lbs. Manhours Manhours
TOTAL COST TO DECOMMISSION WITH 17.49% CONTINGENCY: $677,963 thousands of 2013 dollars
TOTAL NRC LICENSE TERMINATION COST IS 77.29% OR: $523,998 thousands of 2013 dollars
SPENT FUEL MANAGEMENT COST IS 17.29% OR: $117,249 thousands of 2013 dollars
NON-NUCLEAR DEMOLITION COST IS 5.42% OR: $36,717 thousands of 2013 dollars
TOTAL LOW-LEVEL RADIOACTIVE WASTE VOLUME BURIED (EXCLUDING GTCC): 137,856 cubic feet
TOTAL GREATER THAN CLASS C RADWASTE VOLUME GENERATED: 1,785 cubic feet
TOTAL SCRAP METAL REMOVED: 43,839 tons
TOTAL CRAFT LABOR REQUIREMENTS: 877,776 man-hours
End Notes:n/a - indicates that this activity not charged as decommissioning expense.a - indicates that this activity performed by decommissioning staff.0 - indicates that this value is less than 0.5 but is non-zero.a cell containing " - " indicates a zero value
TLG Services, Inc.
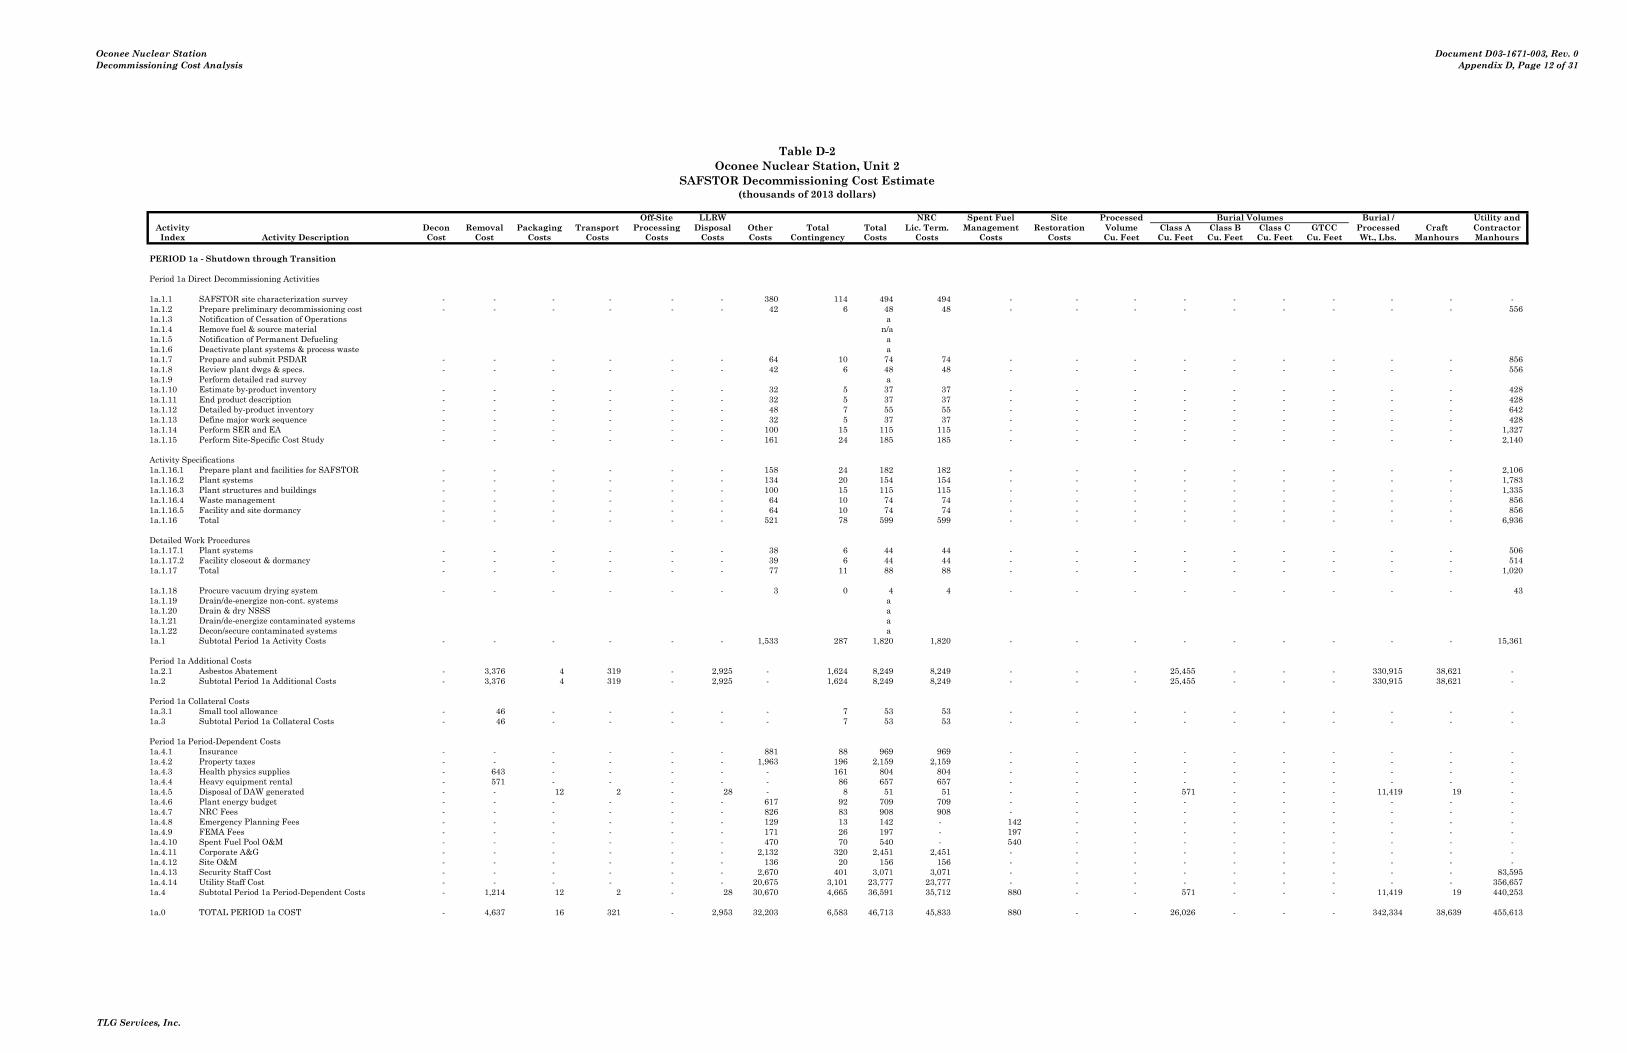
Oconee Nuclear StationDecommissioning Cost Analysis
Document D03-1671-003, Rev. 0Appendix D, Page 12 of 31
Table D-2Oconee Nuclear Station, Unit 2
SAFSTOR Decommissioning Cost Estimate(thousands of 2013 dollars)
Costs run: Wed, Oct 23, 2013 at 10:29:03 Off-Site LLRW NRC Spent Fuel Site Processed Burial Volumes Burial / Utility andActivity DECCER Version 2010.09.09i Decon Removal Packaging Transport Processing Disposal Other Total Total Lic. Term. Management Restoration Volume Class A Class B Class C GTCC Processed Craft ContractorIndex Activity Description Cost Cost Costs Costs Costs Costs Costs Contingency Costs Costs Costs Costs Cu. Feet Cu. Feet Cu. Feet Cu. Feet Cu. Feet Wt., Lbs. Manhours Manhours
PERIOD 1a - Shutdown through Transition
Period 1a Direct Decommissioning Activities
1a.1.1 SAFSTOR site characterization survey - - - - - - 380 114 494 494 - - - - - - - - - - 1a.1.2 Prepare preliminary decommissioning cost - - - - - - 42 6 48 48 - - - - - - - - - 556 1a.1.3 Notification of Cessation of Operations a 1a.1.4 Remove fuel & source material n/a1a.1.5 Notification of Permanent Defueling a 1a.1.6 Deactivate plant systems & process waste a 1a.1.7 Prepare and submit PSDAR - - - - - - 64 10 74 74 - - - - - - - - - 856 1a.1.8 Review plant dwgs & specs. - - - - - - 42 6 48 48 - - - - - - - - - 556 1a.1.9 Perform detailed rad survey a 1a.1.10 Estimate by-product inventory - - - - - - 32 5 37 37 - - - - - - - - - 428 1a.1.11 End product description - - - - - - 32 5 37 37 - - - - - - - - - 428 1a.1.12 Detailed by-product inventory - - - - - - 48 7 55 55 - - - - - - - - - 642 1a.1.13 Define major work sequence - - - - - - 32 5 37 37 - - - - - - - - - 428 1a.1.14 Perform SER and EA - - - - - - 100 15 115 115 - - - - - - - - - 1,327 1a.1.15 Perform Site-Specific Cost Study - - - - - - 161 24 185 185 - - - - - - - - - 2,140
Activity Specifications1a.1.16.1 Prepare plant and facilities for SAFSTOR - - - - - - 158 24 182 182 - - - - - - - - - 2,106 1a.1.16.2 Plant systems - - - - - - 134 20 154 154 - - - - - - - - - 1,783 1a.1.16.3 Plant structures and buildings - - - - - - 100 15 115 115 - - - - - - - - - 1,335 1a.1.16.4 Waste management - - - - - - 64 10 74 74 - - - - - - - - - 856 1a.1.16.5 Facility and site dormancy - - - - - - 64 10 74 74 - - - - - - - - - 856 1a.1.16 Total - - - - - - 521 78 599 599 - - - - - - - - - 6,936
Detailed Work Procedures1a.1.17.1 Plant systems - - - - - - 38 6 44 44 - - - - - - - - - 506 1a.1.17.2 Facility closeout & dormancy - - - - - - 39 6 44 44 - - - - - - - - - 514 1a.1.17 Total - - - - - - 77 11 88 88 - - - - - - - - - 1,020
1a.1.18 Procure vacuum drying system - - - - - - 3 0 4 4 - - - - - - - - - 43 1a.1.19 Drain/de-energize non-cont. systems a 1a.1.20 Drain & dry NSSS a 1a.1.21 Drain/de-energize contaminated systems a 1a.1.22 Decon/secure contaminated systems a 1a.1 Subtotal Period 1a Activity Costs - - - - - - 1,533 287 1,820 1,820 - - - - - - - - - 15,361
Period 1a Additional Costs1a.2.1 Asbestos Abatement - 3,376 4 319 - 2,925 - 1,624 8,249 8,249 - - - 25,455 - - - 330,915 38,621 - 1a.2 Subtotal Period 1a Additional Costs - 3,376 4 319 - 2,925 - 1,624 8,249 8,249 - - - 25,455 - - - 330,915 38,621 -
Period 1a Collateral Costs1a.3.1 Small tool allowance - 46 - - - - - 7 53 53 - - - - - - - - - - 1a.3 Subtotal Period 1a Collateral Costs - 46 - - - - - 7 53 53 - - - - - - - - - -
Period 1a Period-Dependent Costs1a.4.1 Insurance - - - - - - 881 88 969 969 - - - - - - - - - - 1a.4.2 Property taxes - - - - - - 1,963 196 2,159 2,159 - - - - - - - - - - 1a.4.3 Health physics supplies - 643 - - - - - 161 804 804 - - - - - - - - - - 1a.4.4 Heavy equipment rental - 571 - - - - - 86 657 657 - - - - - - - - - - 1a.4.5 Disposal of DAW generated - - 12 2 - 28 - 8 51 51 - - - 571 - - - 11,419 19 - 1a.4.6 Plant energy budget - - - - - - 617 92 709 709 - - - - - - - - - - 1a.4.7 NRC Fees - - - - - - 826 83 908 908 - - - - - - - - - - 1a.4.8 Emergency Planning Fees - - - - - - 129 13 142 - 142 - - - - - - - - - 1a.4.9 FEMA Fees - - - - - - 171 26 197 - 197 - - - - - - - - - 1a.4.10 Spent Fuel Pool O&M - - - - - - 470 70 540 - 540 - - - - - - - - - 1a.4.11 Corporate A&G - - - - - - 2,132 320 2,451 2,451 - - - - - - - - - - 1a.4.12 Site O&M - - - - - - 136 20 156 156 - - - - - - - - - - 1a.4.13 Security Staff Cost - - - - - - 2,670 401 3,071 3,071 - - - - - - - - - 83,595 1a.4.14 Utility Staff Cost - - - - - - 20,675 3,101 23,777 23,777 - - - - - - - - - 356,657 1a.4 Subtotal Period 1a Period-Dependent Costs - 1,214 12 2 - 28 30,670 4,665 36,591 35,712 880 - - 571 - - - 11,419 19 440,253
1a.0 TOTAL PERIOD 1a COST - 4,637 16 321 - 2,953 32,203 6,583 46,713 45,833 880 - - 26,026 - - - 342,334 38,639 455,613
TLG Services, Inc.

Oconee Nuclear StationDecommissioning Cost Analysis
Document D03-1671-003, Rev. 0Appendix D, Page 13 of 31
Table D-2Oconee Nuclear Station, Unit 2
SAFSTOR Decommissioning Cost Estimate(thousands of 2013 dollars)
Costs run: Wed, Oct 23, 2013 at 10:29:03 Off-Site LLRW NRC Spent Fuel Site Processed Burial Volumes Burial / Utility andActivity DECCER Version 2010.09.09i Decon Removal Packaging Transport Processing Disposal Other Total Total Lic. Term. Management Restoration Volume Class A Class B Class C GTCC Processed Craft ContractorIndex Activity Description Cost Cost Costs Costs Costs Costs Costs Contingency Costs Costs Costs Costs Cu. Feet Cu. Feet Cu. Feet Cu. Feet Cu. Feet Wt., Lbs. Manhours Manhours
PERIOD 1b - SAFSTOR Limited DECON Activities
Decontamination of Site Buildings1b.1.1.1 Reactor Building 803 - - - - - - 402 1,205 1,205 - - - - - - - - 19,093 - 1b.1.1.2 Auxiliary Building 317 - - - - - - 159 476 476 - - - - - - - - 7,865 - 1b.1.1.3 Turbine Building 218 - - - - - - 109 326 326 - - - - - - - - 5,402 - 1b.1.1.4 Fuel Building 208 - - - - - - 104 312 312 - - - - - - - - 4,427 - 1b.1.1 Totals 1,546 - - - - - - 773 2,319 2,319 - - - - - - - - 36,787 -
1b.1 Subtotal Period 1b Activity Costs 1,546 - - - - - - 773 2,319 2,319 - - - - - - - - 36,787 -
Period 1b Additional Costs1b.2.1 Spent fuel pool isolation - - - - - - 7,040 1,056 8,096 8,096 - - - - - - - - - - 1b.2 Subtotal Period 1b Additional Costs - - - - - - 7,040 1,056 8,096 8,096 - - - - - - - - - -
Period 1b Collateral Costs1b.3.1 Decon equipment 946 - - - - - - 142 1,087 1,087 - - - - - - - - - - 1b.3.2 Process decommissioning water waste 94 - 42 212 - 247 - 144 739 739 - - - 591 - - - 35,489 115 - 1b.3.4 Small tool allowance - 26 - - - - - 4 30 30 - - - - - - - - - - 1b.3.5 Spent Fuel Capital and Transfer - - - - - - 7 1 9 - 9 - - - - - - - - - 1b.3 Subtotal Period 1b Collateral Costs 1,039 26 42 212 - 247 7 291 1,865 1,856 9 - - 591 - - - 35,489 115 -
Period 1b Period-Dependent Costs1b.4.1 Decon supplies 725 - - - - - - 181 906 906 - - - - - - - - - - 1b.4.2 Insurance - - - - - - 222 22 244 244 - - - - - - - - - - 1b.4.3 Property taxes - - - - - - 495 49 544 544 - - - - - - - - - - 1b.4.4 Health physics supplies - 286 - - - - - 71 357 357 - - - - - - - - - - 1b.4.5 Heavy equipment rental - 144 - - - - - 22 166 166 - - - - - - - - - - 1b.4.6 Disposal of DAW generated - - 12 2 - 26 - 8 48 48 - - - 539 - - - 10,771 18 - 1b.4.7 Plant energy budget - - - - - - 155 23 179 179 - - - - - - - - - - 1b.4.8 NRC Fees - - - - - - 118 12 129 129 - - - - - - - - - - 1b.4.9 Emergency Planning Fees - - - - - - 33 3 36 - 36 - - - - - - - - - 1b.4.10 FEMA Fees - - - - - - 43 6 50 - 50 - - - - - - - - - 1b.4.11 Spent Fuel Pool O&M - - - - - - 118 18 136 - 136 - - - - - - - - - 1b.4.12 Corporate A&G - - - - - - 537 81 618 618 - - - - - - - - - - 1b.4.13 Site O&M - - - - - - 34 5 39 39 - - - - - - - - - - 1b.4.14 Security Staff Cost - - - - - - 673 101 774 774 - - - - - - - - - 21,071 1b.4.15 Utility Staff Cost - - - - - - 5,211 782 5,993 5,993 - - - - - - - - - 89,897 1b.4 Subtotal Period 1b Period-Dependent Costs 725 430 12 2 - 26 7,640 1,385 10,219 9,998 222 - - 539 - - - 10,771 18 110,968
1b.0 TOTAL PERIOD 1b COST 3,310 456 54 214 - 273 14,688 3,505 22,499 22,269 230 - - 1,130 - - - 46,260 36,920 110,968
PERIOD 1c - Preparations for SAFSTOR Dormancy
Period 1c Direct Decommissioning Activities
1c.1.1 Prepare support equipment for storage - 418 - - - - - 63 480 480 - - - - - - - - 3,000 - 1c.1.2 Install containment pressure equal. lines - 33 - - - - - 5 38 38 - - - - - - - - 700 - 1c.1.3 Interim survey prior to dormancy - - - - - - 733 220 953 953 - - - - - - - - 14,124 - 1c.1.4 Secure building accesses a 1c.1.5 Prepare & submit interim report - - - - - - 19 3 22 22 - - - - - - - - - 250
1c.1 Subtotal Period 1c Activity Costs - 451 - - - - 752 290 1,492 1,492 - - - - - - - - 17,824 250
Period 1c Collateral Costs1c.3.1 Process decommissioning water waste 110 - 49 249 - 289 - 169 866 866 - - - 694 - - - 41,619 135 - 1c.3.3 Small tool allowance - 3 - - - - - 0 4 4 - - - - - - - - - - 1c.3.4 Spent Fuel Capital and Transfer - - - - - - 138 21 158 - 158 - - - - - - - - - 1c.3 Subtotal Period 1c Collateral Costs 110 3 49 249 - 289 138 190 1,028 870 158 - - 694 - - - 41,619 135 -
Period 1c Period-Dependent Costs1c.4.1 Insurance - - - - - - 222 22 244 244 - - - - - - - - - - 1c.4.2 Property taxes - - - - - - 330 33 364 364 - - - - - - - - - - 1c.4.3 Health physics supplies - 200 - - - - - 50 249 249 - - - - - - - - - - 1c.4.4 Heavy equipment rental - 144 - - - - - 22 166 166 - - - - - - - - - - 1c.4.5 Disposal of DAW generated - - 3 0 - 7 - 2 13 13 - - - 144 - - - 2,878 5 - 1c.4.6 Plant energy budget - - - - - - 155 23 179 179 - - - - - - - - - - 1c.4.7 NRC Fees - - - - - - 118 12 129 129 - - - - - - - - - - 1c.4.8 Emergency Planning Fees - - - - - - 33 3 36 - 36 - - - - - - - - - 1c.4.9 FEMA Fees - - - - - - 43 6 50 - 50 - - - - - - - - - 1c.4.10 Spent Fuel Pool O&M - - - - - - 118 18 136 - 136 - - - - - - - - - 1c.4.11 Corporate A&G - - - - - - 537 81 618 618 - - - - - - - - - -
TLG Services, Inc.
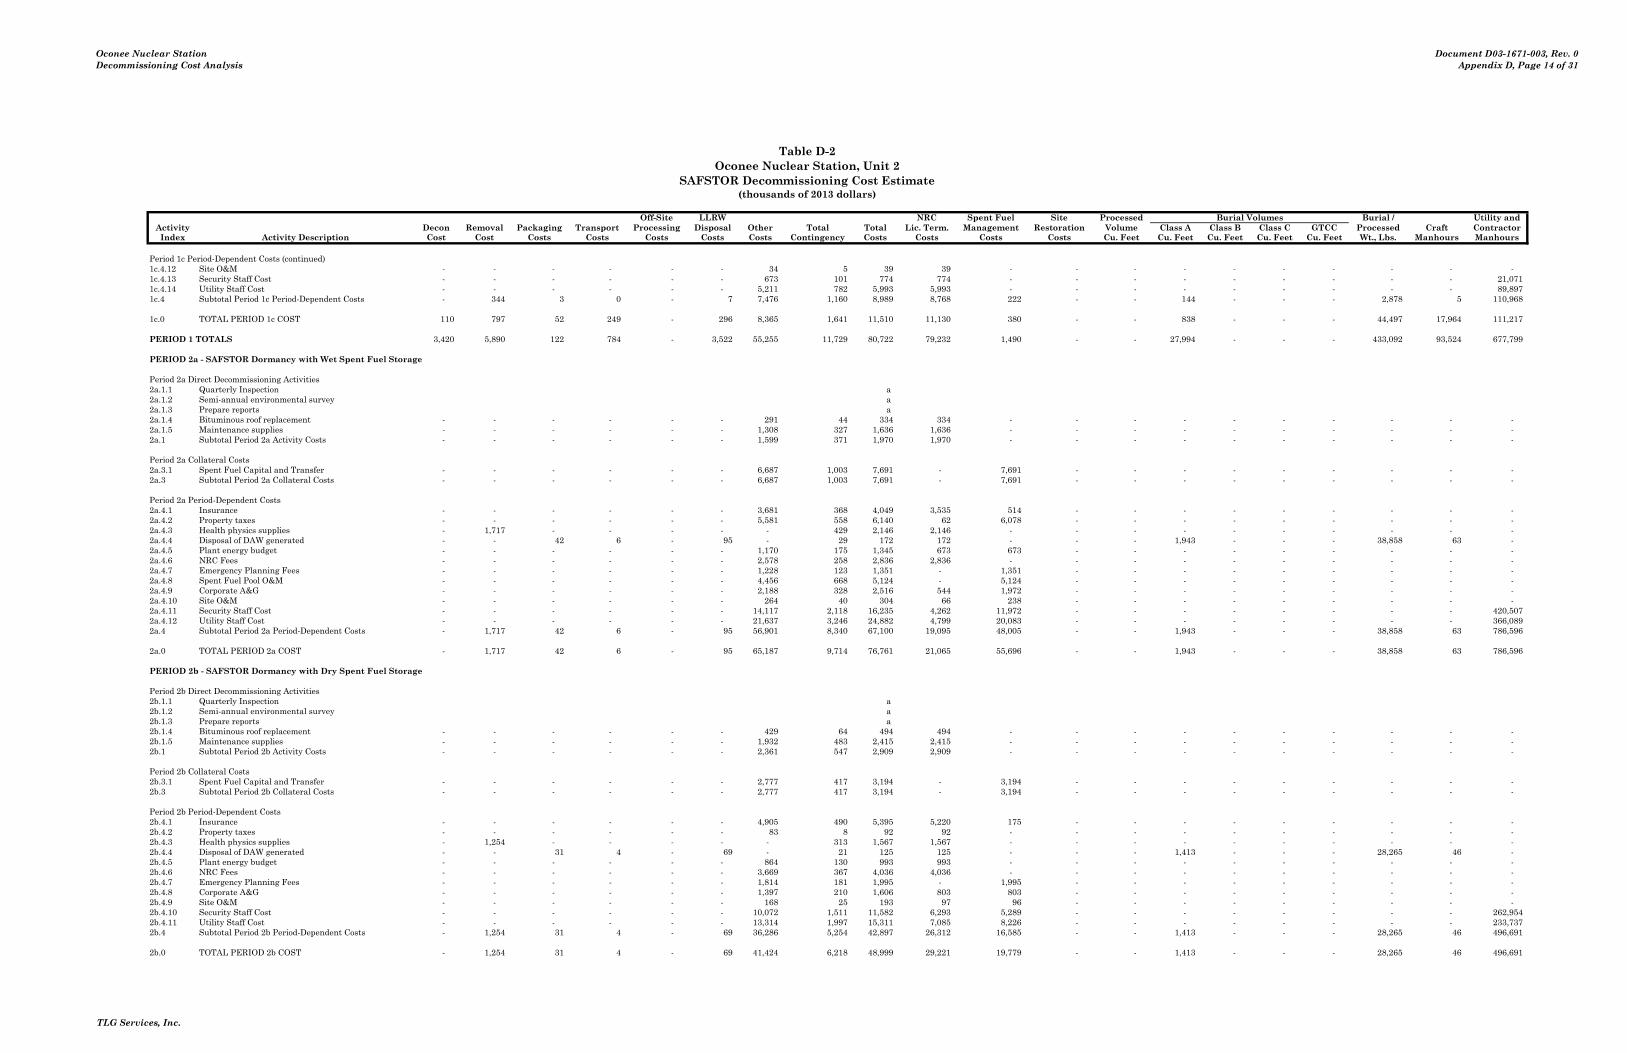
Oconee Nuclear StationDecommissioning Cost Analysis
Document D03-1671-003, Rev. 0Appendix D, Page 14 of 31
Table D-2Oconee Nuclear Station, Unit 2
SAFSTOR Decommissioning Cost Estimate(thousands of 2013 dollars)
Costs run: Wed, Oct 23, 2013 at 10:29:03 Off-Site LLRW NRC Spent Fuel Site Processed Burial Volumes Burial / Utility andActivity DECCER Version 2010.09.09i Decon Removal Packaging Transport Processing Disposal Other Total Total Lic. Term. Management Restoration Volume Class A Class B Class C GTCC Processed Craft ContractorIndex Activity Description Cost Cost Costs Costs Costs Costs Costs Contingency Costs Costs Costs Costs Cu. Feet Cu. Feet Cu. Feet Cu. Feet Cu. Feet Wt., Lbs. Manhours Manhours
Period 1c Period-Dependent Costs (continued)1c.4.12 Site O&M - - - - - - 34 5 39 39 - - - - - - - - - - 1c.4.13 Security Staff Cost - - - - - - 673 101 774 774 - - - - - - - - - 21,071 1c.4.14 Utility Staff Cost - - - - - - 5,211 782 5,993 5,993 - - - - - - - - - 89,897 1c.4 Subtotal Period 1c Period-Dependent Costs - 344 3 0 - 7 7,476 1,160 8,989 8,768 222 - - 144 - - - 2,878 5 110,968
1c.0 TOTAL PERIOD 1c COST 110 797 52 249 - 296 8,365 1,641 11,510 11,130 380 - - 838 - - - 44,497 17,964 111,217
PERIOD 1 TOTALS 3,420 5,890 122 784 - 3,522 55,255 11,729 80,722 79,232 1,490 - - 27,994 - - - 433,092 93,524 677,799
PERIOD 2a - SAFSTOR Dormancy with Wet Spent Fuel Storage
Period 2a Direct Decommissioning Activities2a.1.1 Quarterly Inspection a 2a.1.2 Semi-annual environmental survey a 2a.1.3 Prepare reports a 2a.1.4 Bituminous roof replacement - - - - - - 291 44 334 334 - - - - - - - - - - 2a.1.5 Maintenance supplies - - - - - - 1,308 327 1,636 1,636 - - - - - - - - - - 2a.1 Subtotal Period 2a Activity Costs - - - - - - 1,599 371 1,970 1,970 - - - - - - - - - -
Period 2a Collateral Costs2a.3.1 Spent Fuel Capital and Transfer - - - - - - 6,687 1,003 7,691 - 7,691 - - - - - - - - - 2a.3 Subtotal Period 2a Collateral Costs - - - - - - 6,687 1,003 7,691 - 7,691 - - - - - - - - -
Period 2a Period-Dependent Costs2a.4.1 Insurance - - - - - - 3,681 368 4,049 3,535 514 - - - - - - - - - 2a.4.2 Property taxes - - - - - - 5,581 558 6,140 62 6,078 - - - - - - - - - 2a.4.3 Health physics supplies - 1,717 - - - - - 429 2,146 2,146 - - - - - - - - - - 2a.4.4 Disposal of DAW generated - - 42 6 - 95 - 29 172 172 - - - 1,943 - - - 38,858 63 - 2a.4.5 Plant energy budget - - - - - - 1,170 175 1,345 673 673 - - - - - - - - - 2a.4.6 NRC Fees - - - - - - 2,578 258 2,836 2,836 - - - - - - - - - - 2a.4.7 Emergency Planning Fees - - - - - - 1,228 123 1,351 - 1,351 - - - - - - - - - 2a.4.8 Spent Fuel Pool O&M - - - - - - 4,456 668 5,124 - 5,124 - - - - - - - - - 2a.4.9 Corporate A&G - - - - - - 2,188 328 2,516 544 1,972 - - - - - - - - - 2a.4.10 Site O&M - - - - - - 264 40 304 66 238 - - - - - - - - - 2a.4.11 Security Staff Cost - - - - - - 14,117 2,118 16,235 4,262 11,972 - - - - - - - - 420,507 2a.4.12 Utility Staff Cost - - - - - - 21,637 3,246 24,882 4,799 20,083 - - - - - - - - 366,089 2a.4 Subtotal Period 2a Period-Dependent Costs - 1,717 42 6 - 95 56,901 8,340 67,100 19,095 48,005 - - 1,943 - - - 38,858 63 786,596
2a.0 TOTAL PERIOD 2a COST - 1,717 42 6 - 95 65,187 9,714 76,761 21,065 55,696 - - 1,943 - - - 38,858 63 786,596
PERIOD 2b - SAFSTOR Dormancy with Dry Spent Fuel Storage
Period 2b Direct Decommissioning Activities2b.1.1 Quarterly Inspection a 2b.1.2 Semi-annual environmental survey a 2b.1.3 Prepare reports a 2b.1.4 Bituminous roof replacement - - - - - - 429 64 494 494 - - - - - - - - - - 2b.1.5 Maintenance supplies - - - - - - 1,932 483 2,415 2,415 - - - - - - - - - - 2b.1 Subtotal Period 2b Activity Costs - - - - - - 2,361 547 2,909 2,909 - - - - - - - - - -
Period 2b Collateral Costs2b.3.1 Spent Fuel Capital and Transfer - - - - - - 2,777 417 3,194 - 3,194 - - - - - - - - - 2b.3 Subtotal Period 2b Collateral Costs - - - - - - 2,777 417 3,194 - 3,194 - - - - - - - - -
Period 2b Period-Dependent Costs2b.4.1 Insurance - - - - - - 4,905 490 5,395 5,220 175 - - - - - - - - - 2b.4.2 Property taxes - - - - - - 83 8 92 92 - - - - - - - - - - 2b.4.3 Health physics supplies - 1,254 - - - - - 313 1,567 1,567 - - - - - - - - - - 2b.4.4 Disposal of DAW generated - - 31 4 - 69 - 21 125 125 - - - 1,413 - - - 28,265 46 - 2b.4.5 Plant energy budget - - - - - - 864 130 993 993 - - - - - - - - - - 2b.4.6 NRC Fees - - - - - - 3,669 367 4,036 4,036 - - - - - - - - - - 2b.4.7 Emergency Planning Fees - - - - - - 1,814 181 1,995 - 1,995 - - - - - - - - - 2b.4.8 Corporate A&G - - - - - - 1,397 210 1,606 803 803 - - - - - - - - - 2b.4.9 Site O&M - - - - - - 168 25 193 97 96 - - - - - - - - - 2b.4.10 Security Staff Cost - - - - - - 10,072 1,511 11,582 6,293 5,289 - - - - - - - - 262,954 2b.4.11 Utility Staff Cost - - - - - - 13,314 1,997 15,311 7,085 8,226 - - - - - - - - 233,737 2b.4 Subtotal Period 2b Period-Dependent Costs - 1,254 31 4 - 69 36,286 5,254 42,897 26,312 16,585 - - 1,413 - - - 28,265 46 496,691
2b.0 TOTAL PERIOD 2b COST - 1,254 31 4 - 69 41,424 6,218 48,999 29,221 19,779 - - 1,413 - - - 28,265 46 496,691
TLG Services, Inc.
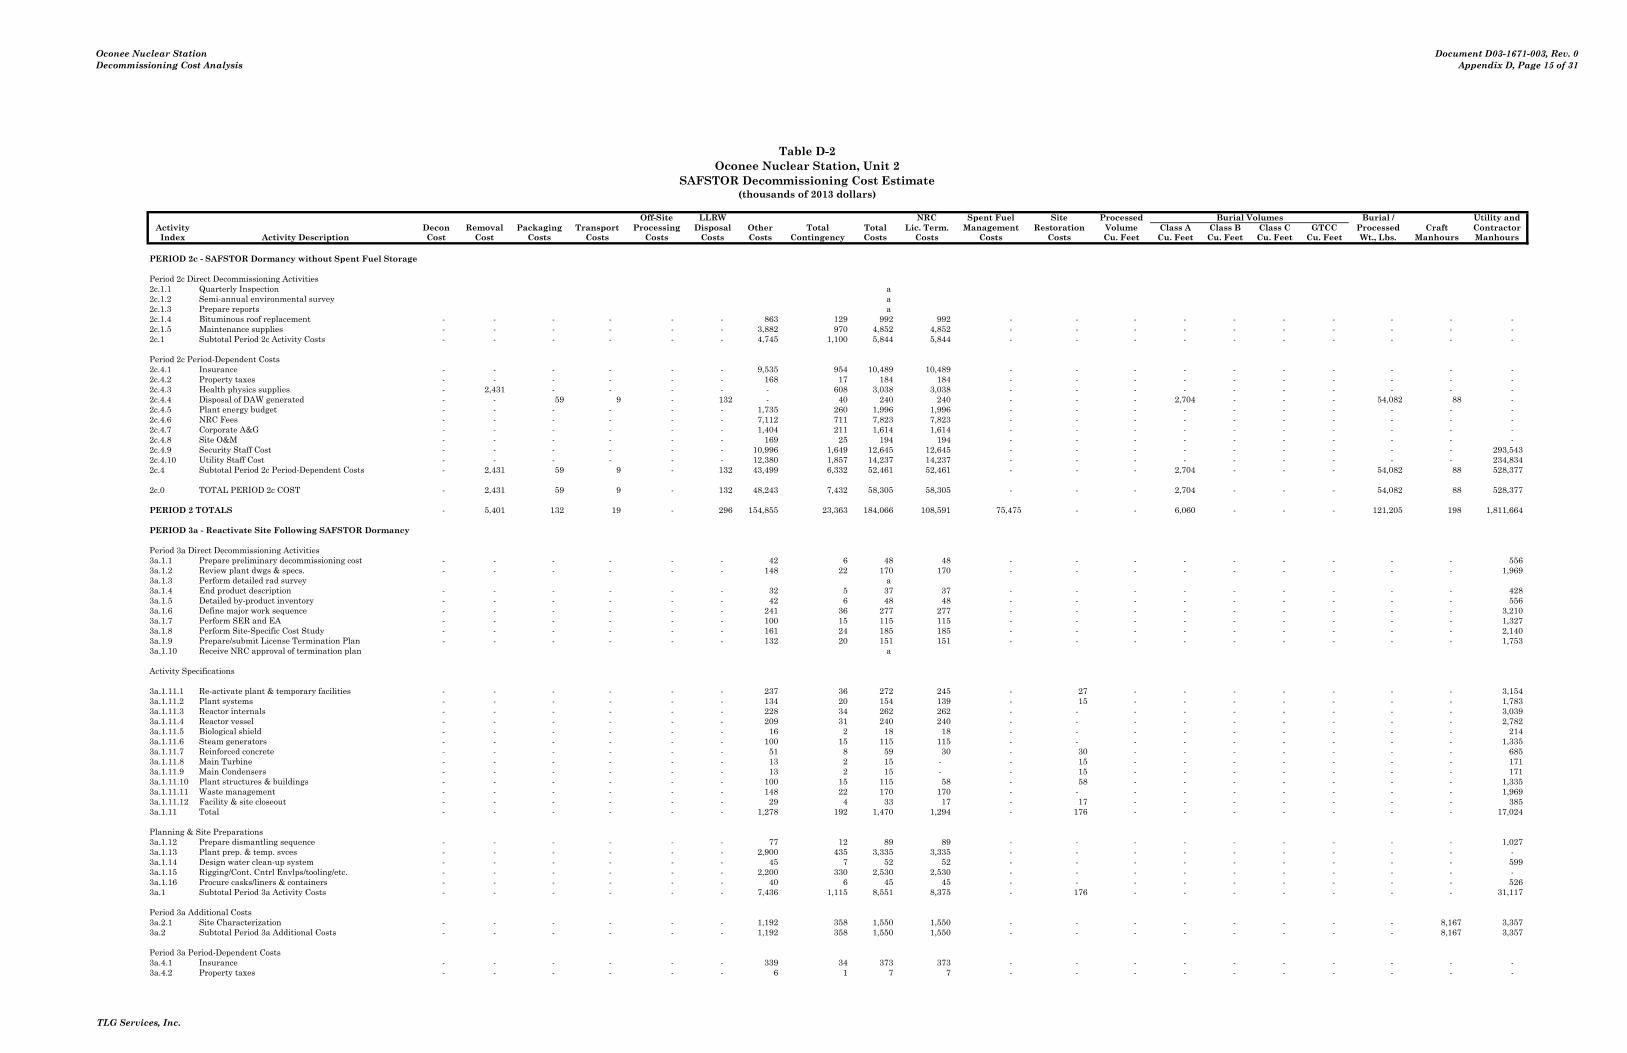
Oconee Nuclear StationDecommissioning Cost Analysis
Document D03-1671-003, Rev. 0Appendix D, Page 15 of 31
Table D-2Oconee Nuclear Station, Unit 2
SAFSTOR Decommissioning Cost Estimate(thousands of 2013 dollars)
Costs run: Wed, Oct 23, 2013 at 10:29:03 Off-Site LLRW NRC Spent Fuel Site Processed Burial Volumes Burial / Utility andActivity DECCER Version 2010.09.09i Decon Removal Packaging Transport Processing Disposal Other Total Total Lic. Term. Management Restoration Volume Class A Class B Class C GTCC Processed Craft ContractorIndex Activity Description Cost Cost Costs Costs Costs Costs Costs Contingency Costs Costs Costs Costs Cu. Feet Cu. Feet Cu. Feet Cu. Feet Cu. Feet Wt., Lbs. Manhours Manhours
PERIOD 2c - SAFSTOR Dormancy without Spent Fuel Storage
Period 2c Direct Decommissioning Activities2c.1.1 Quarterly Inspection a 2c.1.2 Semi-annual environmental survey a 2c.1.3 Prepare reports a 2c.1.4 Bituminous roof replacement - - - - - - 863 129 992 992 - - - - - - - - - - 2c.1.5 Maintenance supplies - - - - - - 3,882 970 4,852 4,852 - - - - - - - - - - 2c.1 Subtotal Period 2c Activity Costs - - - - - - 4,745 1,100 5,844 5,844 - - - - - - - - - -
Period 2c Period-Dependent Costs2c.4.1 Insurance - - - - - - 9,535 954 10,489 10,489 - - - - - - - - - - 2c.4.2 Property taxes - - - - - - 168 17 184 184 - - - - - - - - - - 2c.4.3 Health physics supplies - 2,431 - - - - - 608 3,038 3,038 - - - - - - - - - - 2c.4.4 Disposal of DAW generated - - 59 9 - 132 - 40 240 240 - - - 2,704 - - - 54,082 88 - 2c.4.5 Plant energy budget - - - - - - 1,735 260 1,996 1,996 - - - - - - - - - - 2c.4.6 NRC Fees - - - - - - 7,112 711 7,823 7,823 - - - - - - - - - - 2c.4.7 Corporate A&G - - - - - - 1,404 211 1,614 1,614 - - - - - - - - - - 2c.4.8 Site O&M - - - - - - 169 25 194 194 - - - - - - - - - - 2c.4.9 Security Staff Cost - - - - - - 10,996 1,649 12,645 12,645 - - - - - - - - - 293,543 2c.4.10 Utility Staff Cost - - - - - - 12,380 1,857 14,237 14,237 - - - - - - - - - 234,834 2c.4 Subtotal Period 2c Period-Dependent Costs - 2,431 59 9 - 132 43,499 6,332 52,461 52,461 - - - 2,704 - - - 54,082 88 528,377
2c.0 TOTAL PERIOD 2c COST - 2,431 59 9 - 132 48,243 7,432 58,305 58,305 - - - 2,704 - - - 54,082 88 528,377
PERIOD 2 TOTALS - 5,401 132 19 - 296 154,855 23,363 184,066 108,591 75,475 - - 6,060 - - - 121,205 198 1,811,664
PERIOD 3a - Reactivate Site Following SAFSTOR Dormancy
Period 3a Direct Decommissioning Activities3a.1.1 Prepare preliminary decommissioning cost - - - - - - 42 6 48 48 - - - - - - - - - 556 3a.1.2 Review plant dwgs & specs. - - - - - - 148 22 170 170 - - - - - - - - - 1,969 3a.1.3 Perform detailed rad survey a 3a.1.4 End product description - - - - - - 32 5 37 37 - - - - - - - - - 428 3a.1.5 Detailed by-product inventory - - - - - - 42 6 48 48 - - - - - - - - - 556 3a.1.6 Define major work sequence - - - - - - 241 36 277 277 - - - - - - - - - 3,210 3a.1.7 Perform SER and EA - - - - - - 100 15 115 115 - - - - - - - - - 1,327 3a.1.8 Perform Site-Specific Cost Study - - - - - - 161 24 185 185 - - - - - - - - - 2,140 3a.1.9 Prepare/submit License Termination Plan - - - - - - 132 20 151 151 - - - - - - - - - 1,753 3a.1.10 Receive NRC approval of termination plan a
Activity Specifications
3a.1.11.1 Re-activate plant & temporary facilities - - - - - - 237 36 272 245 - 27 - - - - - - - 3,154 3a.1.11.2 Plant systems - - - - - - 134 20 154 139 - 15 - - - - - - - 1,783 3a.1.11.3 Reactor internals - - - - - - 228 34 262 262 - - - - - - - - - 3,039 3a.1.11.4 Reactor vessel - - - - - - 209 31 240 240 - - - - - - - - - 2,782 3a.1.11.5 Biological shield - - - - - - 16 2 18 18 - - - - - - - - - 214 3a.1.11.6 Steam generators - - - - - - 100 15 115 115 - - - - - - - - - 1,335 3a.1.11.7 Reinforced concrete - - - - - - 51 8 59 30 - 30 - - - - - - - 685 3a.1.11.8 Main Turbine - - - - - - 13 2 15 - - 15 - - - - - - - 171 3a.1.11.9 Main Condensers - - - - - - 13 2 15 - - 15 - - - - - - - 171 3a.1.11.10 Plant structures & buildings - - - - - - 100 15 115 58 - 58 - - - - - - - 1,335 3a.1.11.11 Waste management - - - - - - 148 22 170 170 - - - - - - - - - 1,969 3a.1.11.12 Facility & site closeout - - - - - - 29 4 33 17 - 17 - - - - - - - 385 3a.1.11 Total - - - - - - 1,278 192 1,470 1,294 - 176 - - - - - - - 17,024
Planning & Site Preparations3a.1.12 Prepare dismantling sequence - - - - - - 77 12 89 89 - - - - - - - - - 1,027 3a.1.13 Plant prep. & temp. svces - - - - - - 2,900 435 3,335 3,335 - - - - - - - - - - 3a.1.14 Design water clean-up system - - - - - - 45 7 52 52 - - - - - - - - - 599 3a.1.15 Rigging/Cont. Cntrl Envlps/tooling/etc. - - - - - - 2,200 330 2,530 2,530 - - - - - - - - - - 3a.1.16 Procure casks/liners & containers - - - - - - 40 6 45 45 - - - - - - - - - 526 3a.1 Subtotal Period 3a Activity Costs - - - - - - 7,436 1,115 8,551 8,375 - 176 - - - - - - - 31,117
Period 3a Additional Costs3a.2.1 Site Characterization - - - - - - 1,192 358 1,550 1,550 - - - - - - - - 8,167 3,357 3a.2 Subtotal Period 3a Additional Costs - - - - - - 1,192 358 1,550 1,550 - - - - - - - - 8,167 3,357
Period 3a Period-Dependent Costs3a.4.1 Insurance - - - - - - 339 34 373 373 - - - - - - - - - - 3a.4.2 Property taxes - - - - - - 6 1 7 7 - - - - - - - - - -
TLG Services, Inc.
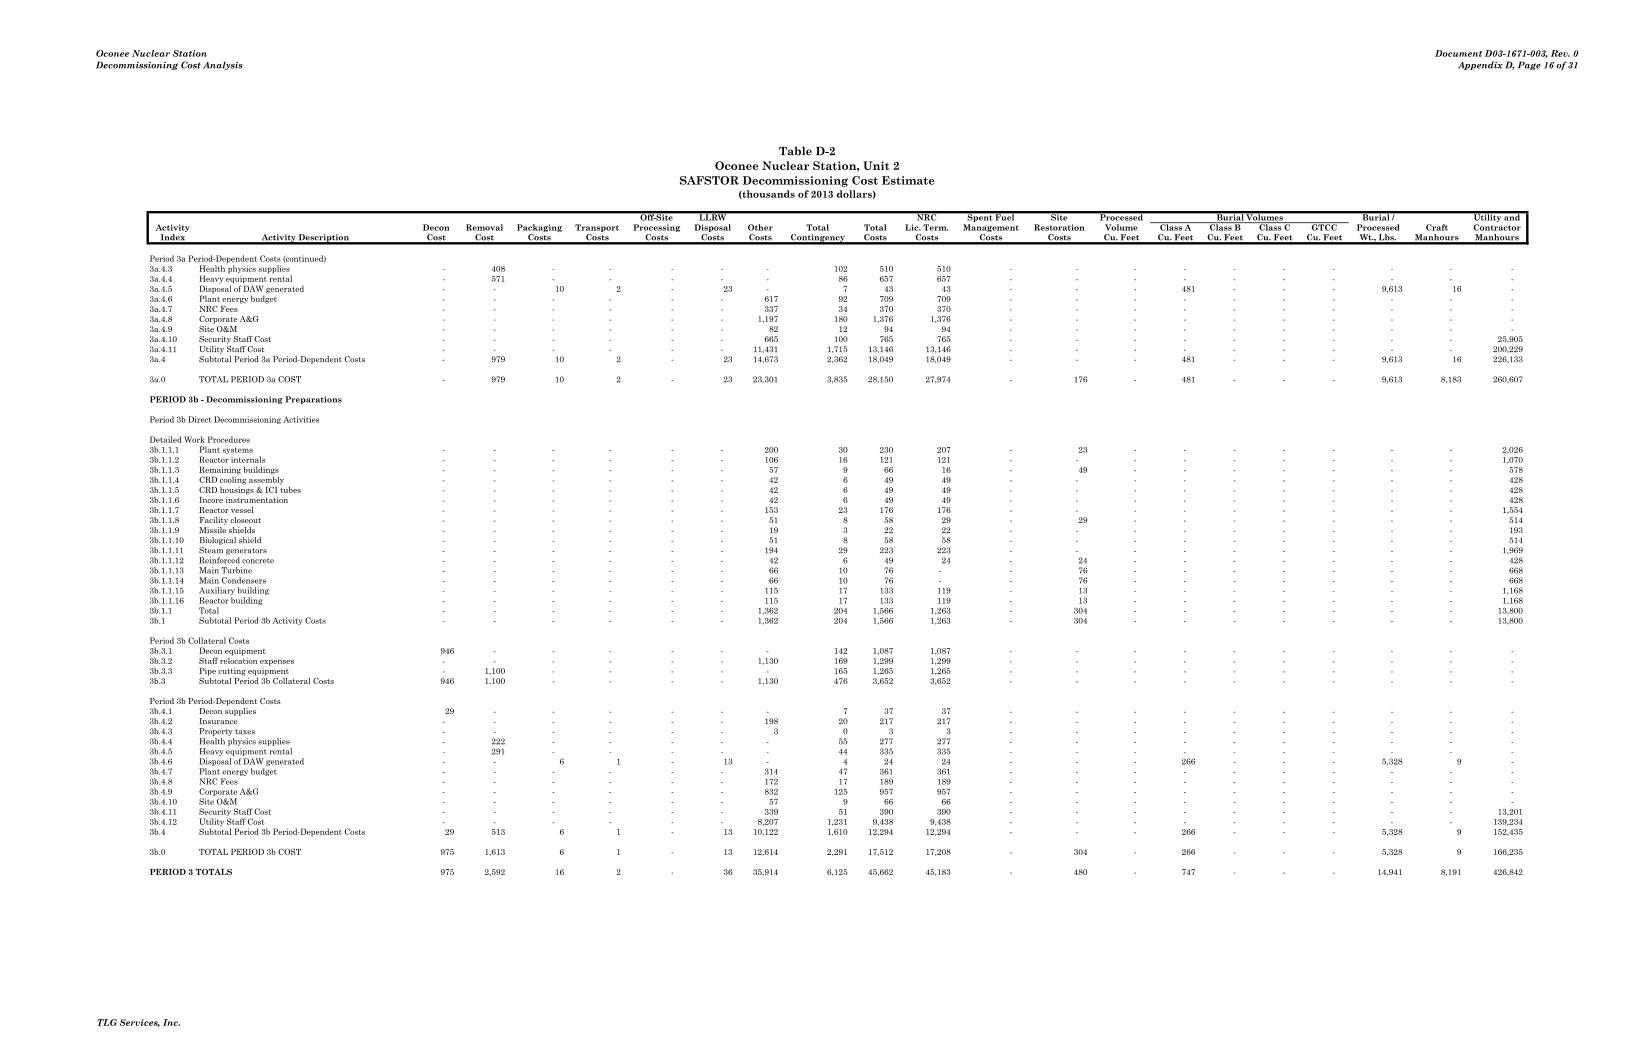
Oconee Nuclear StationDecommissioning Cost Analysis
Document D03-1671-003, Rev. 0Appendix D, Page 16 of 31
Table D-2Oconee Nuclear Station, Unit 2
SAFSTOR Decommissioning Cost Estimate(thousands of 2013 dollars)
Costs run: Wed, Oct 23, 2013 at 10:29:03 Off-Site LLRW NRC Spent Fuel Site Processed Burial Volumes Burial / Utility andActivity DECCER Version 2010.09.09i Decon Removal Packaging Transport Processing Disposal Other Total Total Lic. Term. Management Restoration Volume Class A Class B Class C GTCC Processed Craft ContractorIndex Activity Description Cost Cost Costs Costs Costs Costs Costs Contingency Costs Costs Costs Costs Cu. Feet Cu. Feet Cu. Feet Cu. Feet Cu. Feet Wt., Lbs. Manhours Manhours
Period 3a Period-Dependent Costs (continued)3a.4.3 Health physics supplies - 408 - - - - - 102 510 510 - - - - - - - - - - 3a.4.4 Heavy equipment rental - 571 - - - - - 86 657 657 - - - - - - - - - - 3a.4.5 Disposal of DAW generated - - 10 2 - 23 - 7 43 43 - - - 481 - - - 9,613 16 - 3a.4.6 Plant energy budget - - - - - - 617 92 709 709 - - - - - - - - - - 3a.4.7 NRC Fees - - - - - - 337 34 370 370 - - - - - - - - - - 3a.4.8 Corporate A&G - - - - - - 1,197 180 1,376 1,376 - - - - - - - - - - 3a.4.9 Site O&M - - - - - - 82 12 94 94 - - - - - - - - - - 3a.4.10 Security Staff Cost - - - - - - 665 100 765 765 - - - - - - - - - 25,905 3a.4.11 Utility Staff Cost - - - - - - 11,431 1,715 13,146 13,146 - - - - - - - - - 200,229 3a.4 Subtotal Period 3a Period-Dependent Costs - 979 10 2 - 23 14,673 2,362 18,049 18,049 - - - 481 - - - 9,613 16 226,133
3a.0 TOTAL PERIOD 3a COST - 979 10 2 - 23 23,301 3,835 28,150 27,974 - 176 - 481 - - - 9,613 8,183 260,607
PERIOD 3b - Decommissioning Preparations
Period 3b Direct Decommissioning Activities
Detailed Work Procedures3b.1.1.1 Plant systems - - - - - - 200 30 230 207 - 23 - - - - - - - 2,026 3b.1.1.2 Reactor internals - - - - - - 106 16 121 121 - - - - - - - - - 1,070 3b.1.1.3 Remaining buildings - - - - - - 57 9 66 16 - 49 - - - - - - - 578 3b.1.1.4 CRD cooling assembly - - - - - - 42 6 49 49 - - - - - - - - - 428 3b.1.1.5 CRD housings & ICI tubes - - - - - - 42 6 49 49 - - - - - - - - - 428 3b.1.1.6 Incore instrumentation - - - - - - 42 6 49 49 - - - - - - - - - 428 3b.1.1.7 Reactor vessel - - - - - - 153 23 176 176 - - - - - - - - - 1,554 3b.1.1.8 Facility closeout - - - - - - 51 8 58 29 - 29 - - - - - - - 514 3b.1.1.9 Missile shields - - - - - - 19 3 22 22 - - - - - - - - - 193 3b.1.1.10 Biological shield - - - - - - 51 8 58 58 - - - - - - - - - 514 3b.1.1.11 Steam generators - - - - - - 194 29 223 223 - - - - - - - - - 1,969 3b.1.1.12 Reinforced concrete - - - - - - 42 6 49 24 - 24 - - - - - - - 428 3b.1.1.13 Main Turbine - - - - - - 66 10 76 - - 76 - - - - - - - 668 3b.1.1.14 Main Condensers - - - - - - 66 10 76 - - 76 - - - - - - - 668 3b.1.1.15 Auxiliary building - - - - - - 115 17 133 119 - 13 - - - - - - - 1,168 3b.1.1.16 Reactor building - - - - - - 115 17 133 119 - 13 - - - - - - - 1,168 3b.1.1 Total - - - - - - 1,362 204 1,566 1,263 - 304 - - - - - - - 13,800 3b.1 Subtotal Period 3b Activity Costs - - - - - - 1,362 204 1,566 1,263 - 304 - - - - - - - 13,800
Period 3b Collateral Costs3b.3.1 Decon equipment 946 - - - - - - 142 1,087 1,087 - - - - - - - - - - 3b.3.2 Staff relocation expenses - - - - - - 1,130 169 1,299 1,299 - - - - - - - - - - 3b.3.3 Pipe cutting equipment - 1,100 - - - - - 165 1,265 1,265 - - - - - - - - - - 3b.3 Subtotal Period 3b Collateral Costs 946 1,100 - - - - 1,130 476 3,652 3,652 - - - - - - - - - -
Period 3b Period-Dependent Costs3b.4.1 Decon supplies 29 - - - - - - 7 37 37 - - - - - - - - - - 3b.4.2 Insurance - - - - - - 198 20 217 217 - - - - - - - - - - 3b.4.3 Property taxes - - - - - - 3 0 3 3 - - - - - - - - - - 3b.4.4 Health physics supplies - 222 - - - - - 55 277 277 - - - - - - - - - - 3b.4.5 Heavy equipment rental - 291 - - - - - 44 335 335 - - - - - - - - - - 3b.4.6 Disposal of DAW generated - - 6 1 - 13 - 4 24 24 - - - 266 - - - 5,328 9 - 3b.4.7 Plant energy budget - - - - - - 314 47 361 361 - - - - - - - - - - 3b.4.8 NRC Fees - - - - - - 172 17 189 189 - - - - - - - - - - 3b.4.9 Corporate A&G - - - - - - 832 125 957 957 - - - - - - - - - - 3b.4.10 Site O&M - - - - - - 57 9 66 66 - - - - - - - - - - 3b.4.11 Security Staff Cost - - - - - - 339 51 390 390 - - - - - - - - - 13,201 3b.4.12 Utility Staff Cost - - - - - - 8,207 1,231 9,438 9,438 - - - - - - - - - 139,234 3b.4 Subtotal Period 3b Period-Dependent Costs 29 513 6 1 - 13 10,122 1,610 12,294 12,294 - - - 266 - - - 5,328 9 152,435
3b.0 TOTAL PERIOD 3b COST 975 1,613 6 1 - 13 12,614 2,291 17,512 17,208 - 304 - 266 - - - 5,328 9 166,235
PERIOD 3 TOTALS 975 2,592 16 2 - 36 35,914 6,125 45,662 45,183 - 480 - 747 - - - 14,941 8,191 426,842
TLG Services, Inc.

Oconee Nuclear StationDecommissioning Cost Analysis
Document D03-1671-003, Rev. 0Appendix D, Page 17 of 31
Table D-2Oconee Nuclear Station, Unit 2
SAFSTOR Decommissioning Cost Estimate(thousands of 2013 dollars)
Costs run: Wed, Oct 23, 2013 at 10:29:03 Off-Site LLRW NRC Spent Fuel Site Processed Burial Volumes Burial / Utility andActivity DECCER Version 2010.09.09i Decon Removal Packaging Transport Processing Disposal Other Total Total Lic. Term. Management Restoration Volume Class A Class B Class C GTCC Processed Craft ContractorIndex Activity Description Cost Cost Costs Costs Costs Costs Costs Contingency Costs Costs Costs Costs Cu. Feet Cu. Feet Cu. Feet Cu. Feet Cu. Feet Wt., Lbs. Manhours Manhours
PERIOD 4a - Large Component Removal
Period 4a Direct Decommissioning Activities
Nuclear Steam Supply System Removal4a.1.1.1 Reactor Coolant Piping 31 151 21 18 132 209 - 130 691 691 - - 483 511 - - - 112,096 4,014 - 4a.1.1.2 Pressurizer Relief Tank 3 11 4 3 26 37 - 18 102 102 - - 94 94 - - - 20,849 340 - 4a.1.1.3 Reactor Coolant Pumps & Motors 24 68 75 197 - 2,243 - 627 3,233 3,233 - - - 8,012 - - - 807,600 2,883 80 4a.1.1.4 Pressurizer 8 47 312 96 - 986 - 308 1,756 1,756 - - - 3,521 - - - 337,377 1,546 500 4a.1.1.5 Steam Generators 28 2,064 1,073 1,259 - 5,588 - 2,223 12,235 12,235 - - - 19,963 - - - 2,630,356 10,254 750 4a.1.1.6 Retired Steam Generator Units - - 1,073 1,259 - 5,588 - 1,693 9,614 9,614 - - - 19,963 - - - 2,630,356 5,400 750 4a.1.1.7 CRDMs/ICIs/Service Structure Removal 27 99 324 73 166 245 - 168 1,102 1,102 - - 1,823 3,253 - - - 136,066 2,687 - 4a.1.1.8 Reactor Vessel Internals 61 2,495 7,055 755 - 4,410 222 6,092 21,090 21,090 - - - 1,263 1,002 393 - 278,133 20,983 971 4a.1.1.9 Vessel & Internals GTCC Disposal - - - - - 9,711 - 1,457 11,167 11,167 - - - - - - 1,785 353,100 - - 4a.1.1.10 Reactor Vessel - 4,812 1,405 488 - 2,695 222 5,463 15,084 15,084 - - - 9,626 - - - 979,948 20,983 971 4a.1.1 Totals 181 9,746 11,343 4,148 324 31,710 444 18,178 76,073 76,073 - - 2,400 66,207 1,002 393 1,785 8,285,882 69,090 4,023
Removal of Major Equipment4a.1.2 Main Turbine/Generator - 282 224 34 593 - - 187 1,320 1,320 - - 4,020 - - - - 241,216 6,768 - 4a.1.3 Main Condensers - 858 116 17 588 - - 317 1,895 1,895 - - 5,310 - - - - 238,934 21,071 -
Cascading Costs from Clean Building Demolition4a.1.4.1 Reactor Building - 777 - - - - - 117 893 893 - - - - - - - - 9,379 - 4a.1.4.2 Auxiliary Building - 103 - - - - - 15 119 119 - - - - - - - - 1,333 - 4a.1.4.3 Turbine Building - 160 - - - - - 24 184 184 - - - - - - - - 2,697 - 4a.1.4.4 Fuel Building - 77 - - - - - 12 88 88 - - - - - - - - 961 - 4a.1.4 Totals - 1,117 - - - - - 168 1,285 1,285 - - - - - - - - 14,370 -
Disposal of Plant Systems4a.1.5.1 Chemical Addition - 29 - - - - - 4 33 - - 33 - - - - - - 821 - 4a.1.5.2 Chemical Addition RCA - 25 0 1 22 - - 10 57 57 - - 222 - - - - 9,016 510 - 4a.1.5.3 Condensate - 557 - - - - - 84 640 - - 640 - - - - - - 15,699 - 4a.1.5.4 Condensate (Contaminated) - 564 47 88 3,035 - - 614 4,349 4,349 - - 30,383 - - - - 1,233,881 13,824 - 4a.1.5.5 Condenser Circulating Water - 355 - - - - - 53 408 - - 408 - - - - - - 10,040 - 4a.1.5.6 Electro Hydraulic Turbine Control - 19 - - - - - 3 21 - - 21 - - - - - - 499 - 4a.1.5.7 Feedwater & Emergency Feedwater - 172 - - - - - 26 197 - - 197 - - - - - - 4,862 - 4a.1.5.8 Feedwater & Emergency Feedwater (Cont.) - 160 8 14 487 - - 116 784 784 - - 4,873 - - - - 197,906 3,878 - 4a.1.5.9 Feedwater & Emergency Feedwater RCA - 262 8 14 481 - - 140 905 905 - - 4,815 - - - - 195,560 5,622 - 4a.1.5.10 Heater Drains - 387 - - - - - 58 445 - - 445 - - - - - - 11,003 - 4a.1.5.11 Heater Drains (Contaminated) - 273 8 16 541 - - 153 991 991 - - 5,419 - - - - 220,074 6,646 - 4a.1.5.12 Heater Vent - 33 - - - - - 5 38 - - 38 - - - - - - 1,002 - 4a.1.5.13 High Pressure Extraction - 25 - - - - - 4 29 - - 29 - - - - - - 729 - 4a.1.5.14 Hydraulic Oil - 2 - - - - - 0 3 - - 3 - - - - - - 75 - 4a.1.5.15 Hydrogen - 29 - - - - - 4 34 - - 34 - - - - - - 848 - 4a.1.5.16 Hydrogen Seal Oil - 32 - - - - - 5 36 - - 36 - - - - - - 923 - 4a.1.5.17 Low Pressure Extraction - 37 - - - - - 6 43 - - 43 - - - - - - 1,096 - 4a.1.5.18 Main Steam - 89 - - - - - 13 102 - - 102 - - - - - - 2,558 - 4a.1.5.19 Main Steam RCA - 326 45 80 2,778 - - 515 3,744 3,744 - - 27,808 - - - - 1,129,284 7,747 - 4a.1.5.20 Post Accident Monitoring - 30 1 1 40 - - 14 85 85 - - 401 - - - - 16,304 785 - 4a.1.5.21 Reactor Building Spray - 95 3 6 210 - - 56 371 371 - - 2,105 - - - - 85,488 2,170 - 4a.1.5.22 Recirc Cooling Water (Shared 1&2) - 192 - - - - - 29 221 - - 221 - - - - - - 5,547 - 4a.1.5.23 Recirc Cooling Water (shared 1&2) RCA - 135 3 5 173 - - 61 376 376 - - 1,727 - - - - 70,146 2,938 - 4a.1.5.24 Sample Monitoring - 105 11 12 49 105 - 62 343 343 - - 489 443 - - - 49,133 2,802 - 4a.1.5.25 Stator Coolant - 51 - - - - - 8 59 - - 59 - - - - - - 1,507 - 4a.1.5.26 Steam Drain - 86 - - - - - 13 99 - - 99 - - - - - - 2,668 - 4a.1.5.27 Steam Seal - 52 1 2 53 - - 21 129 129 - - 533 - - - - 21,649 1,169 - 4a.1.5.28 Turbine Oil - 128 - - - - - 19 147 - - 147 - - - - - - 3,518 - 4a.1.5.29 Vacuum - 120 - - - - - 18 138 - - 138 - - - - - - 3,438 - 4a.1.5 Totals - 4,370 134 238 7,870 105 - 2,114 14,830 12,135 - 2,695 78,777 443 - - - 3,228,440 114,924 -
4a.1.6 Scaffolding in support of decommissioning - 448 10 2 48 9 - 123 640 640 - - 433 38 - - - 22,021 13,672 -
4a.1 Subtotal Period 4a Activity Costs 181 16,821 11,827 4,439 9,423 31,824 444 21,086 96,043 93,348 - 2,695 90,939 66,688 1,002 393 1,785 12,016,490 239,895 4,023
Period 4a Additional Costs4a.2.1 Remedial Action Surveys - - - - - - 1,257 377 1,634 1,634 - - - - - - - - 25,741 - 4a.2 Subtotal Period 4a Additional Costs - - - - - - 1,257 377 1,634 1,634 - - - - - - - - 25,741 -
Period 4a Collateral Costs4a.3.1 Process decommissioning water waste 3 - 3 16 - 18 - 9 49 49 - - - 44 - - - 2,655 9 - 4a.3.3 Small tool allowance - 190 - - - - - 29 219 197 - 22 - - - - - - - - 4a.3 Subtotal Period 4a Collateral Costs 3 190 3 16 - 18 - 37 268 246 - 22 - 44 - - - 2,655 9 -
TLG Services, Inc.
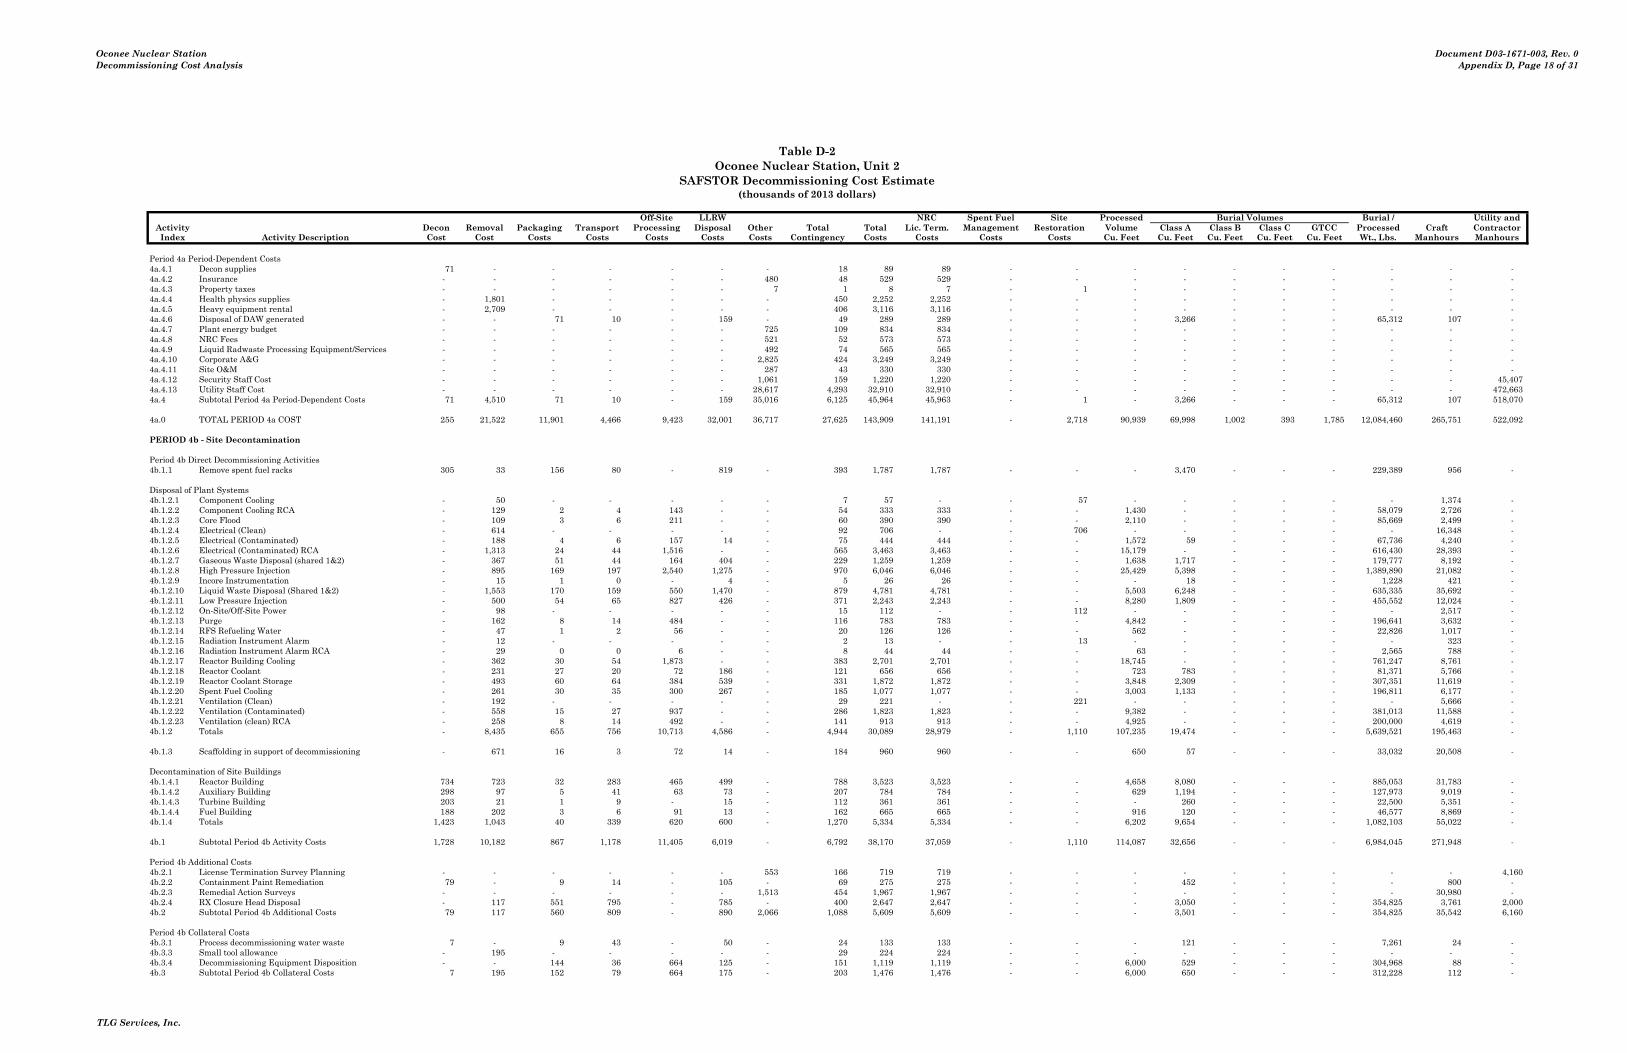
Oconee Nuclear StationDecommissioning Cost Analysis
Document D03-1671-003, Rev. 0Appendix D, Page 18 of 31
Table D-2Oconee Nuclear Station, Unit 2
SAFSTOR Decommissioning Cost Estimate(thousands of 2013 dollars)
Costs run: Wed, Oct 23, 2013 at 10:29:03 Off-Site LLRW NRC Spent Fuel Site Processed Burial Volumes Burial / Utility andActivity DECCER Version 2010.09.09i Decon Removal Packaging Transport Processing Disposal Other Total Total Lic. Term. Management Restoration Volume Class A Class B Class C GTCC Processed Craft ContractorIndex Activity Description Cost Cost Costs Costs Costs Costs Costs Contingency Costs Costs Costs Costs Cu. Feet Cu. Feet Cu. Feet Cu. Feet Cu. Feet Wt., Lbs. Manhours Manhours
Period 4a Period-Dependent Costs4a.4.1 Decon supplies 71 - - - - - - 18 89 89 - - - - - - - - - - 4a.4.2 Insurance - - - - - - 480 48 529 529 - - - - - - - - - - 4a.4.3 Property taxes - - - - - - 7 1 8 7 - 1 - - - - - - - - 4a.4.4 Health physics supplies - 1,801 - - - - - 450 2,252 2,252 - - - - - - - - - - 4a.4.5 Heavy equipment rental - 2,709 - - - - - 406 3,116 3,116 - - - - - - - - - - 4a.4.6 Disposal of DAW generated - - 71 10 - 159 - 49 289 289 - - - 3,266 - - - 65,312 107 - 4a.4.7 Plant energy budget - - - - - - 725 109 834 834 - - - - - - - - - - 4a.4.8 NRC Fees - - - - - - 521 52 573 573 - - - - - - - - - - 4a.4.9 Liquid Radwaste Processing Equipment/Services - - - - - - 492 74 565 565 - - - - - - - - - - 4a.4.10 Corporate A&G - - - - - - 2,825 424 3,249 3,249 - - - - - - - - - - 4a.4.11 Site O&M - - - - - - 287 43 330 330 - - - - - - - - - - 4a.4.12 Security Staff Cost - - - - - - 1,061 159 1,220 1,220 - - - - - - - - - 45,407 4a.4.13 Utility Staff Cost - - - - - - 28,617 4,293 32,910 32,910 - - - - - - - - - 472,663 4a.4 Subtotal Period 4a Period-Dependent Costs 71 4,510 71 10 - 159 35,016 6,125 45,964 45,963 - 1 - 3,266 - - - 65,312 107 518,070
4a.0 TOTAL PERIOD 4a COST 255 21,522 11,901 4,466 9,423 32,001 36,717 27,625 143,909 141,191 - 2,718 90,939 69,998 1,002 393 1,785 12,084,460 265,751 522,092
PERIOD 4b - Site Decontamination
Period 4b Direct Decommissioning Activities4b.1.1 Remove spent fuel racks 305 33 156 80 - 819 - 393 1,787 1,787 - - - 3,470 - - - 229,389 956 -
Disposal of Plant Systems4b.1.2.1 Component Cooling - 50 - - - - - 7 57 - - 57 - - - - - - 1,374 - 4b.1.2.2 Component Cooling RCA - 129 2 4 143 - - 54 333 333 - - 1,430 - - - - 58,079 2,726 - 4b.1.2.3 Core Flood - 109 3 6 211 - - 60 390 390 - - 2,110 - - - - 85,669 2,499 - 4b.1.2.4 Electrical (Clean) - 614 - - - - - 92 706 - - 706 - - - - - - 16,348 - 4b.1.2.5 Electrical (Contaminated) - 188 4 6 157 14 - 75 444 444 - - 1,572 59 - - - 67,736 4,240 - 4b.1.2.6 Electrical (Contaminated) RCA - 1,313 24 44 1,516 - - 565 3,463 3,463 - - 15,179 - - - - 616,430 28,393 - 4b.1.2.7 Gaseous Waste Disposal (shared 1&2) - 367 51 44 164 404 - 229 1,259 1,259 - - 1,638 1,717 - - - 179,777 8,192 - 4b.1.2.8 High Pressure Injection - 895 169 197 2,540 1,275 - 970 6,046 6,046 - - 25,429 5,398 - - - 1,389,890 21,082 - 4b.1.2.9 Incore Instrumentation - 15 1 0 - 4 - 5 26 26 - - - 18 - - - 1,228 421 - 4b.1.2.10 Liquid Waste Disposal (Shared 1&2) - 1,553 170 159 550 1,470 - 879 4,781 4,781 - - 5,503 6,248 - - - 635,335 35,692 - 4b.1.2.11 Low Pressure Injection - 500 54 65 827 426 - 371 2,243 2,243 - - 8,280 1,809 - - - 455,552 12,024 - 4b.1.2.12 On-Site/Off-Site Power - 98 - - - - - 15 112 - - 112 - - - - - - 2,517 - 4b.1.2.13 Purge - 162 8 14 484 - - 116 783 783 - - 4,842 - - - - 196,641 3,632 - 4b.1.2.14 RFS Refueling Water - 47 1 2 56 - - 20 126 126 - - 562 - - - - 22,826 1,017 - 4b.1.2.15 Radiation Instrument Alarm - 12 - - - - - 2 13 - - 13 - - - - - - 323 - 4b.1.2.16 Radiation Instrument Alarm RCA - 29 0 0 6 - - 8 44 44 - - 63 - - - - 2,565 788 - 4b.1.2.17 Reactor Building Cooling - 362 30 54 1,873 - - 383 2,701 2,701 - - 18,745 - - - - 761,247 8,761 - 4b.1.2.18 Reactor Coolant - 231 27 20 72 186 - 121 656 656 - - 723 783 - - - 81,371 5,766 - 4b.1.2.19 Reactor Coolant Storage - 493 60 64 384 539 - 331 1,872 1,872 - - 3,848 2,309 - - - 307,351 11,619 - 4b.1.2.20 Spent Fuel Cooling - 261 30 35 300 267 - 185 1,077 1,077 - - 3,003 1,133 - - - 196,811 6,177 - 4b.1.2.21 Ventilation (Clean) - 192 - - - - - 29 221 - - 221 - - - - - - 5,666 - 4b.1.2.22 Ventilation (Contaminated) - 558 15 27 937 - - 286 1,823 1,823 - - 9,382 - - - - 381,013 11,588 - 4b.1.2.23 Ventilation (clean) RCA - 258 8 14 492 - - 141 913 913 - - 4,925 - - - - 200,000 4,619 - 4b.1.2 Totals - 8,435 655 756 10,713 4,586 - 4,944 30,089 28,979 - 1,110 107,235 19,474 - - - 5,639,521 195,463 -
4b.1.3 Scaffolding in support of decommissioning - 671 16 3 72 14 - 184 960 960 - - 650 57 - - - 33,032 20,508 -
Decontamination of Site Buildings4b.1.4.1 Reactor Building 734 723 32 283 465 499 - 788 3,523 3,523 - - 4,658 8,080 - - - 885,053 31,783 - 4b.1.4.2 Auxiliary Building 298 97 5 41 63 73 - 207 784 784 - - 629 1,194 - - - 127,973 9,019 - 4b.1.4.3 Turbine Building 203 21 1 9 - 15 - 112 361 361 - - - 260 - - - 22,500 5,351 - 4b.1.4.4 Fuel Building 188 202 3 6 91 13 - 162 665 665 - - 916 120 - - - 46,577 8,869 - 4b.1.4 Totals 1,423 1,043 40 339 620 600 - 1,270 5,334 5,334 - - 6,202 9,654 - - - 1,082,103 55,022 -
4b.1 Subtotal Period 4b Activity Costs 1,728 10,182 867 1,178 11,405 6,019 - 6,792 38,170 37,059 - 1,110 114,087 32,656 - - - 6,984,045 271,948 -
Period 4b Additional Costs4b.2.1 License Termination Survey Planning - - - - - - 553 166 719 719 - - - - - - - - - 4,160 4b.2.2 Containment Paint Remediation 79 - 9 14 - 105 - 69 275 275 - - - 452 - - - - 800 - 4b.2.3 Remedial Action Surveys - - - - - - 1,513 454 1,967 1,967 - - - - - - - - 30,980 - 4b.2.4 RX Closure Head Disposal - 117 551 795 - 785 - 400 2,647 2,647 - - - 3,050 - - - 354,825 3,761 2,000 4b.2 Subtotal Period 4b Additional Costs 79 117 560 809 - 890 2,066 1,088 5,609 5,609 - - - 3,501 - - - 354,825 35,542 6,160
Period 4b Collateral Costs4b.3.1 Process decommissioning water waste 7 - 9 43 - 50 - 24 133 133 - - - 121 - - - 7,261 24 - 4b.3.3 Small tool allowance - 195 - - - - - 29 224 224 - - - - - - - - - - 4b.3.4 Decommissioning Equipment Disposition - - 144 36 664 125 - 151 1,119 1,119 - - 6,000 529 - - - 304,968 88 - 4b.3 Subtotal Period 4b Collateral Costs 7 195 152 79 664 175 - 203 1,476 1,476 - - 6,000 650 - - - 312,228 112 -
TLG Services, Inc.
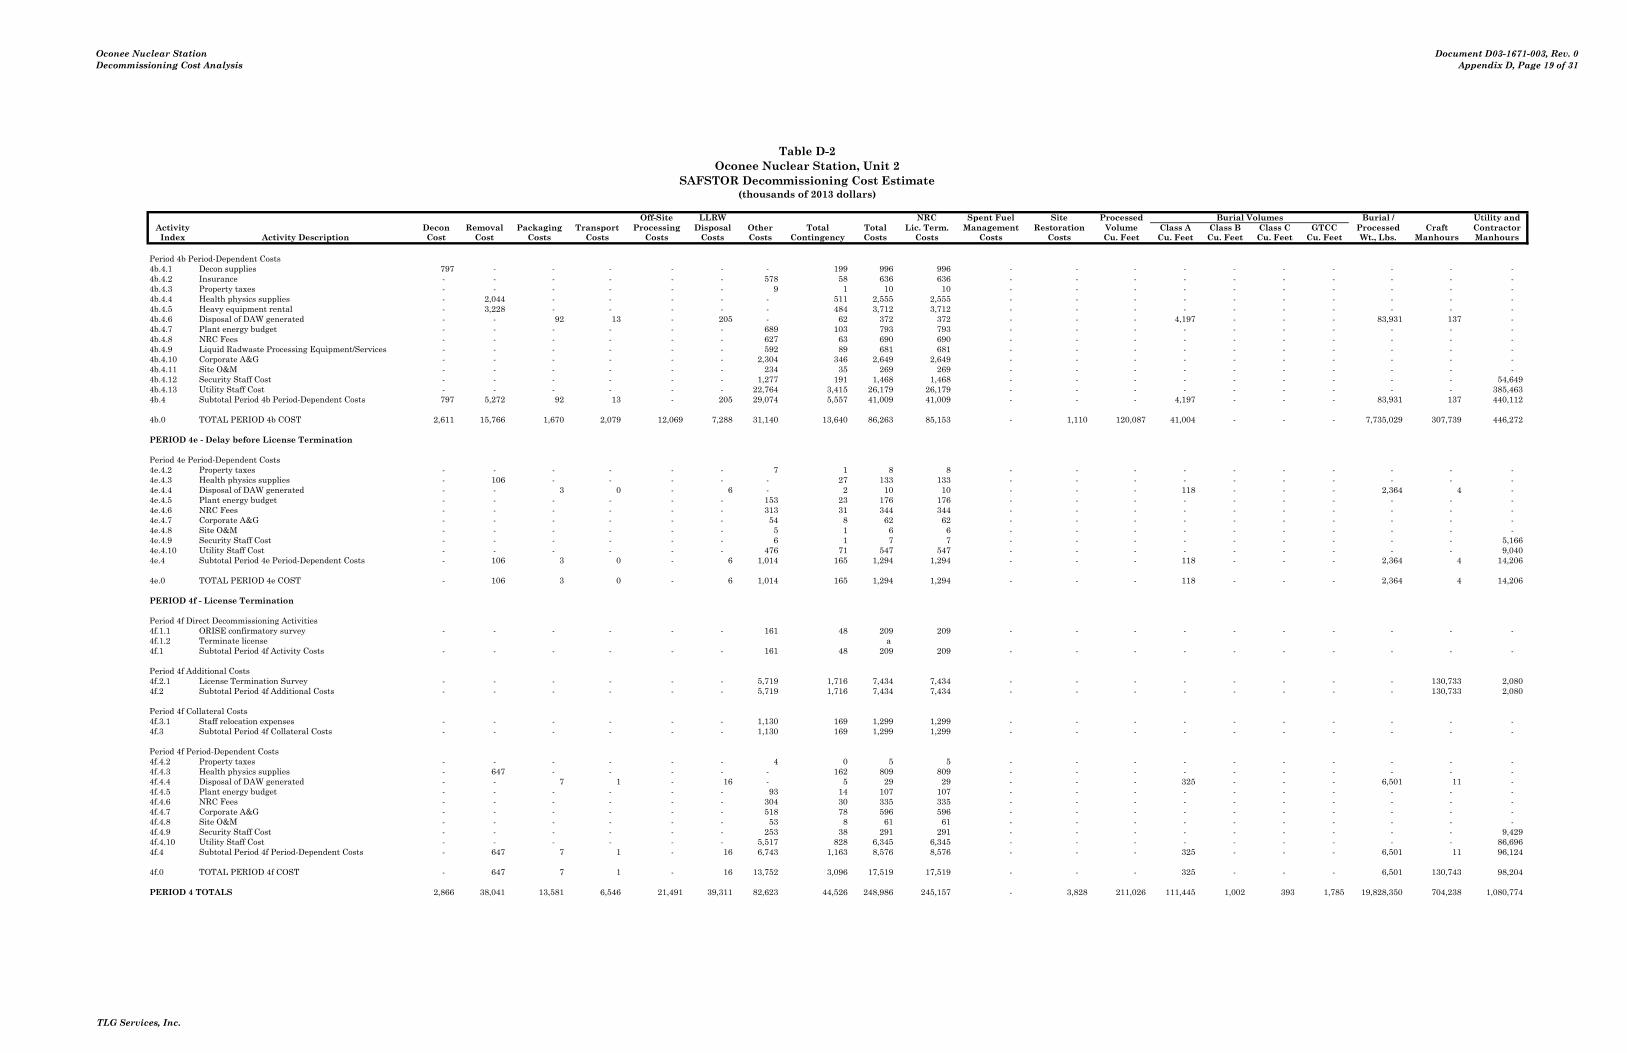
Oconee Nuclear StationDecommissioning Cost Analysis
Document D03-1671-003, Rev. 0Appendix D, Page 19 of 31
Table D-2Oconee Nuclear Station, Unit 2
SAFSTOR Decommissioning Cost Estimate(thousands of 2013 dollars)
Costs run: Wed, Oct 23, 2013 at 10:29:03 Off-Site LLRW NRC Spent Fuel Site Processed Burial Volumes Burial / Utility andActivity DECCER Version 2010.09.09i Decon Removal Packaging Transport Processing Disposal Other Total Total Lic. Term. Management Restoration Volume Class A Class B Class C GTCC Processed Craft ContractorIndex Activity Description Cost Cost Costs Costs Costs Costs Costs Contingency Costs Costs Costs Costs Cu. Feet Cu. Feet Cu. Feet Cu. Feet Cu. Feet Wt., Lbs. Manhours Manhours
Period 4b Period-Dependent Costs4b.4.1 Decon supplies 797 - - - - - - 199 996 996 - - - - - - - - - - 4b.4.2 Insurance - - - - - - 578 58 636 636 - - - - - - - - - - 4b.4.3 Property taxes - - - - - - 9 1 10 10 - - - - - - - - - - 4b.4.4 Health physics supplies - 2,044 - - - - - 511 2,555 2,555 - - - - - - - - - - 4b.4.5 Heavy equipment rental - 3,228 - - - - - 484 3,712 3,712 - - - - - - - - - - 4b.4.6 Disposal of DAW generated - - 92 13 - 205 - 62 372 372 - - - 4,197 - - - 83,931 137 - 4b.4.7 Plant energy budget - - - - - - 689 103 793 793 - - - - - - - - - - 4b.4.8 NRC Fees - - - - - - 627 63 690 690 - - - - - - - - - - 4b.4.9 Liquid Radwaste Processing Equipment/Services - - - - - - 592 89 681 681 - - - - - - - - - - 4b.4.10 Corporate A&G - - - - - - 2,304 346 2,649 2,649 - - - - - - - - - - 4b.4.11 Site O&M - - - - - - 234 35 269 269 - - - - - - - - - - 4b.4.12 Security Staff Cost - - - - - - 1,277 191 1,468 1,468 - - - - - - - - - 54,649 4b.4.13 Utility Staff Cost - - - - - - 22,764 3,415 26,179 26,179 - - - - - - - - - 385,463 4b.4 Subtotal Period 4b Period-Dependent Costs 797 5,272 92 13 - 205 29,074 5,557 41,009 41,009 - - - 4,197 - - - 83,931 137 440,112
4b.0 TOTAL PERIOD 4b COST 2,611 15,766 1,670 2,079 12,069 7,288 31,140 13,640 86,263 85,153 - 1,110 120,087 41,004 - - - 7,735,029 307,739 446,272
PERIOD 4e - Delay before License Termination
Period 4e Period-Dependent Costs4e.4.2 Property taxes - - - - - - 7 1 8 8 - - - - - - - - - - 4e.4.3 Health physics supplies - 106 - - - - - 27 133 133 - - - - - - - - - - 4e.4.4 Disposal of DAW generated - - 3 0 - 6 - 2 10 10 - - - 118 - - - 2,364 4 - 4e.4.5 Plant energy budget - - - - - - 153 23 176 176 - - - - - - - - - - 4e.4.6 NRC Fees - - - - - - 313 31 344 344 - - - - - - - - - - 4e.4.7 Corporate A&G - - - - - - 54 8 62 62 - - - - - - - - - - 4e.4.8 Site O&M - - - - - - 5 1 6 6 - - - - - - - - - - 4e.4.9 Security Staff Cost - - - - - - 6 1 7 7 - - - - - - - - - 5,166 4e.4.10 Utility Staff Cost - - - - - - 476 71 547 547 - - - - - - - - - 9,040 4e.4 Subtotal Period 4e Period-Dependent Costs - 106 3 0 - 6 1,014 165 1,294 1,294 - - - 118 - - - 2,364 4 14,206
4e.0 TOTAL PERIOD 4e COST - 106 3 0 - 6 1,014 165 1,294 1,294 - - - 118 - - - 2,364 4 14,206
PERIOD 4f - License Termination
Period 4f Direct Decommissioning Activities4f.1.1 ORISE confirmatory survey - - - - - - 161 48 209 209 - - - - - - - - - - 4f.1.2 Terminate license a 4f.1 Subtotal Period 4f Activity Costs - - - - - - 161 48 209 209 - - - - - - - - - -
Period 4f Additional Costs4f.2.1 License Termination Survey - - - - - - 5,719 1,716 7,434 7,434 - - - - - - - - 130,733 2,080 4f.2 Subtotal Period 4f Additional Costs - - - - - - 5,719 1,716 7,434 7,434 - - - - - - - - 130,733 2,080
Period 4f Collateral Costs4f.3.1 Staff relocation expenses - - - - - - 1,130 169 1,299 1,299 - - - - - - - - - - 4f.3 Subtotal Period 4f Collateral Costs - - - - - - 1,130 169 1,299 1,299 - - - - - - - - - -
Period 4f Period-Dependent Costs4f.4.2 Property taxes - - - - - - 4 0 5 5 - - - - - - - - - - 4f.4.3 Health physics supplies - 647 - - - - - 162 809 809 - - - - - - - - - - 4f.4.4 Disposal of DAW generated - - 7 1 - 16 - 5 29 29 - - - 325 - - - 6,501 11 - 4f.4.5 Plant energy budget - - - - - - 93 14 107 107 - - - - - - - - - - 4f.4.6 NRC Fees - - - - - - 304 30 335 335 - - - - - - - - - - 4f.4.7 Corporate A&G - - - - - - 518 78 596 596 - - - - - - - - - - 4f.4.8 Site O&M - - - - - - 53 8 61 61 - - - - - - - - - - 4f.4.9 Security Staff Cost - - - - - - 253 38 291 291 - - - - - - - - - 9,429 4f.4.10 Utility Staff Cost - - - - - - 5,517 828 6,345 6,345 - - - - - - - - - 86,696 4f.4 Subtotal Period 4f Period-Dependent Costs - 647 7 1 - 16 6,743 1,163 8,576 8,576 - - - 325 - - - 6,501 11 96,124
4f.0 TOTAL PERIOD 4f COST - 647 7 1 - 16 13,752 3,096 17,519 17,519 - - - 325 - - - 6,501 130,743 98,204
PERIOD 4 TOTALS 2,866 38,041 13,581 6,546 21,491 39,311 82,623 44,526 248,986 245,157 - 3,828 211,026 111,445 1,002 393 1,785 19,828,350 704,238 1,080,774
TLG Services, Inc.
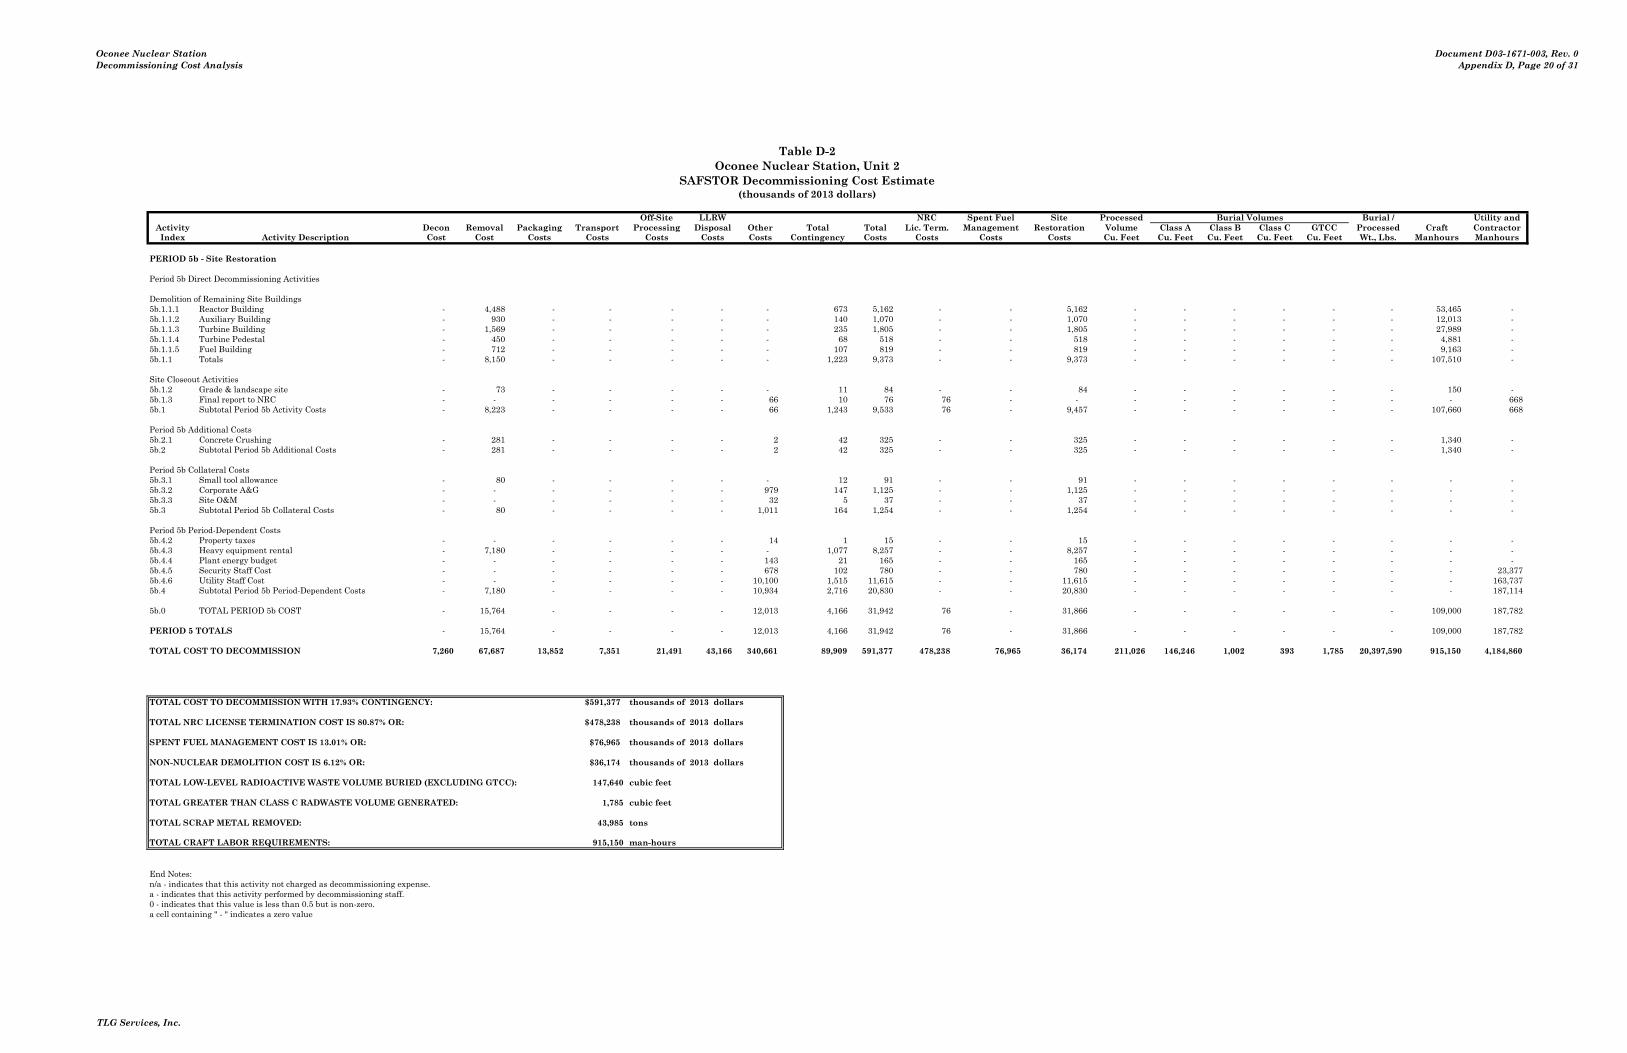
Oconee Nuclear StationDecommissioning Cost Analysis
Document D03-1671-003, Rev. 0Appendix D, Page 20 of 31
Table D-2Oconee Nuclear Station, Unit 2
SAFSTOR Decommissioning Cost Estimate(thousands of 2013 dollars)
Costs run: Wed, Oct 23, 2013 at 10:29:03 Off-Site LLRW NRC Spent Fuel Site Processed Burial Volumes Burial / Utility andActivity DECCER Version 2010.09.09i Decon Removal Packaging Transport Processing Disposal Other Total Total Lic. Term. Management Restoration Volume Class A Class B Class C GTCC Processed Craft ContractorIndex Activity Description Cost Cost Costs Costs Costs Costs Costs Contingency Costs Costs Costs Costs Cu. Feet Cu. Feet Cu. Feet Cu. Feet Cu. Feet Wt., Lbs. Manhours Manhours
PERIOD 5b - Site Restoration
Period 5b Direct Decommissioning Activities
Demolition of Remaining Site Buildings5b.1.1.1 Reactor Building - 4,488 - - - - - 673 5,162 - - 5,162 - - - - - - 53,465 - 5b.1.1.2 Auxiliary Building - 930 - - - - - 140 1,070 - - 1,070 - - - - - - 12,013 - 5b.1.1.3 Turbine Building - 1,569 - - - - - 235 1,805 - - 1,805 - - - - - - 27,989 - 5b.1.1.4 Turbine Pedestal - 450 - - - - - 68 518 - - 518 - - - - - - 4,881 - 5b.1.1.5 Fuel Building - 712 - - - - - 107 819 - - 819 - - - - - - 9,163 - 5b.1.1 Totals - 8,150 - - - - - 1,223 9,373 - - 9,373 - - - - - - 107,510 -
Site Closeout Activities5b.1.2 Grade & landscape site - 73 - - - - - 11 84 - - 84 - - - - - - 150 - 5b.1.3 Final report to NRC - - - - - - 66 10 76 76 - - - - - - - - - 668 5b.1 Subtotal Period 5b Activity Costs - 8,223 - - - - 66 1,243 9,533 76 - 9,457 - - - - - - 107,660 668
Period 5b Additional Costs5b.2.1 Concrete Crushing - 281 - - - - 2 42 325 - - 325 - - - - - - 1,340 - 5b.2 Subtotal Period 5b Additional Costs - 281 - - - - 2 42 325 - - 325 - - - - - - 1,340 -
Period 5b Collateral Costs5b.3.1 Small tool allowance - 80 - - - - - 12 91 - - 91 - - - - - - - - 5b.3.2 Corporate A&G - - - - - - 979 147 1,125 - - 1,125 - - - - - - - - 5b.3.3 Site O&M - - - - - - 32 5 37 - - 37 - - - - - - - - 5b.3 Subtotal Period 5b Collateral Costs - 80 - - - - 1,011 164 1,254 - - 1,254 - - - - - - - -
Period 5b Period-Dependent Costs5b.4.2 Property taxes - - - - - - 14 1 15 - - 15 - - - - - - - - 5b.4.3 Heavy equipment rental - 7,180 - - - - - 1,077 8,257 - - 8,257 - - - - - - - - 5b.4.4 Plant energy budget - - - - - - 143 21 165 - - 165 - - - - - - - - 5b.4.5 Security Staff Cost - - - - - - 678 102 780 - - 780 - - - - - - - 23,377 5b.4.6 Utility Staff Cost - - - - - - 10,100 1,515 11,615 - - 11,615 - - - - - - - 163,737 5b.4 Subtotal Period 5b Period-Dependent Costs - 7,180 - - - - 10,934 2,716 20,830 - - 20,830 - - - - - - - 187,114
5b.0 TOTAL PERIOD 5b COST - 15,764 - - - - 12,013 4,166 31,942 76 - 31,866 - - - - - - 109,000 187,782
PERIOD 5 TOTALS - 15,764 - - - - 12,013 4,166 31,942 76 - 31,866 - - - - - - 109,000 187,782
TOTAL COST TO DECOMMISSION 7,260 67,687 13,852 7,351 21,491 43,166 340,661 89,909 591,377 478,238 76,965 36,174 211,026 146,246 1,002 393 1,785 20,397,590 915,150 4,184,860
TOTAL COST TO DECOMMISSION WITH 17.93% CONTINGENCY: $591,377 thousands of 2013 dollars
TOTAL NRC LICENSE TERMINATION COST IS 80.87% OR: $478,238 thousands of 2013 dollars
SPENT FUEL MANAGEMENT COST IS 13.01% OR: $76,965 thousands of 2013 dollars
NON-NUCLEAR DEMOLITION COST IS 6.12% OR: $36,174 thousands of 2013 dollars
TOTAL LOW-LEVEL RADIOACTIVE WASTE VOLUME BURIED (EXCLUDING GTCC): 147,640 cubic feet
TOTAL GREATER THAN CLASS C RADWASTE VOLUME GENERATED: 1,785 cubic feet
TOTAL SCRAP METAL REMOVED: 43,985 tons
TOTAL CRAFT LABOR REQUIREMENTS: 915,150 man-hours
End Notes:n/a - indicates that this activity not charged as decommissioning expense.a - indicates that this activity performed by decommissioning staff.0 - indicates that this value is less than 0.5 but is non-zero.a cell containing " - " indicates a zero value
TLG Services, Inc.
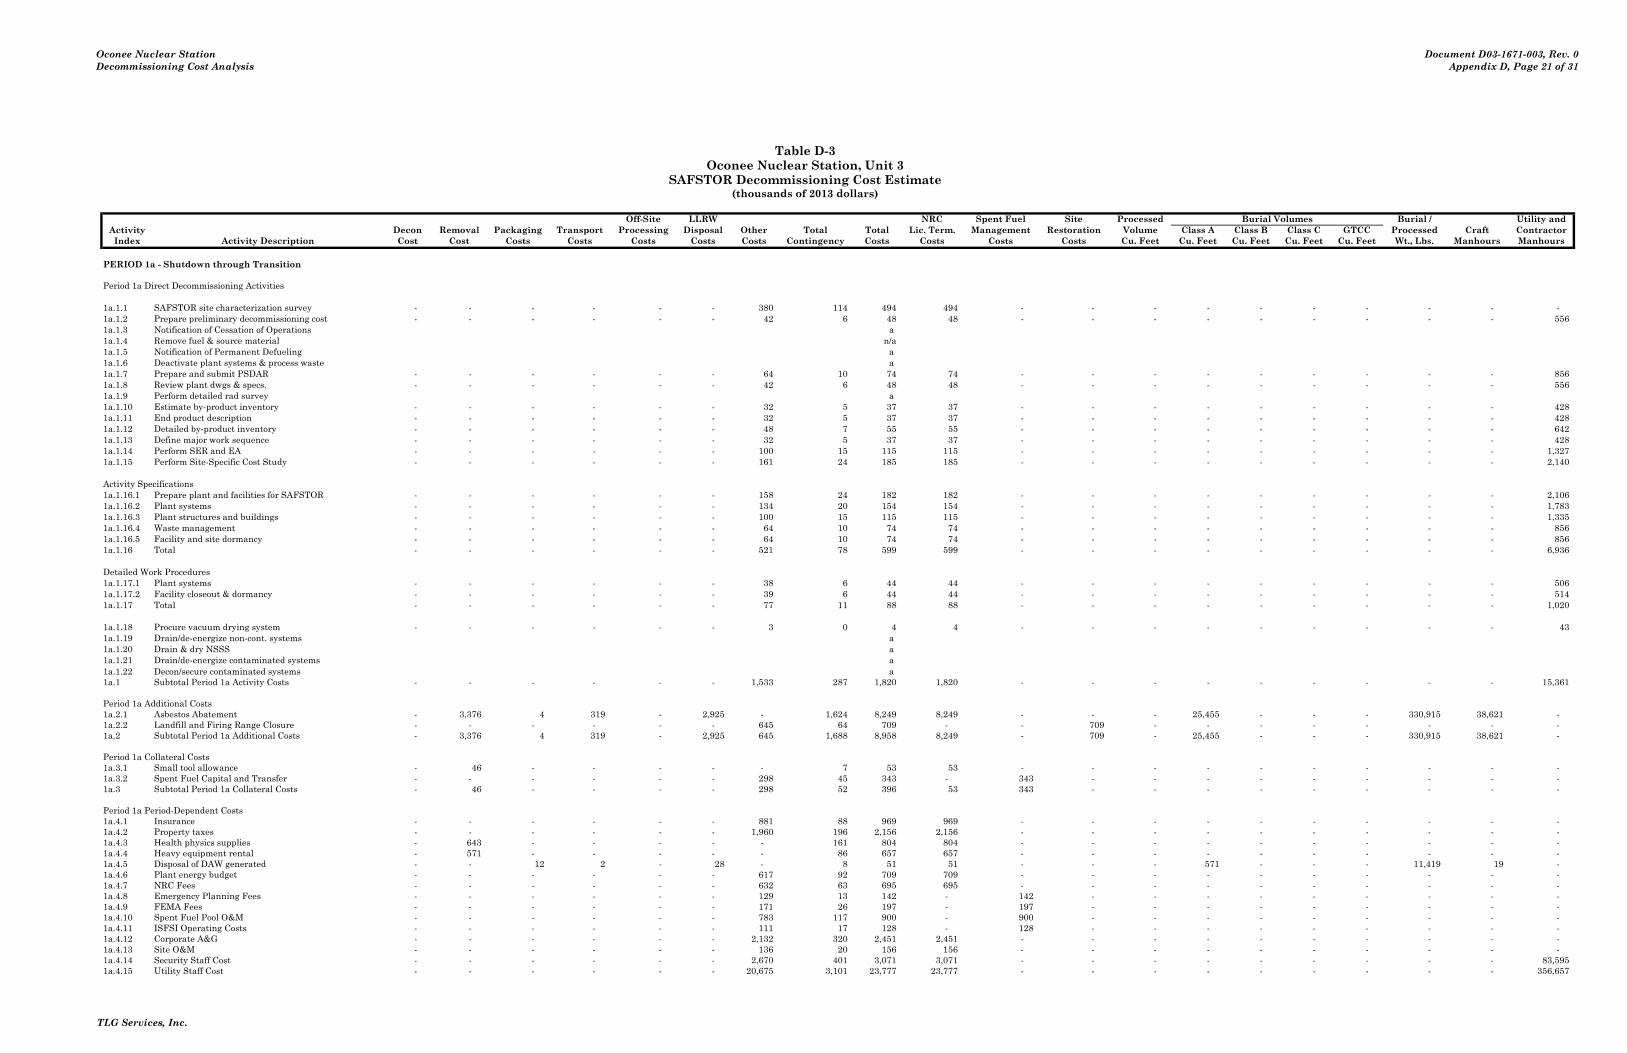
Oconee Nuclear StationDecommissioning Cost Analysis
Document D03-1671-003, Rev. 0 Appendix D, Page 21 of 31
Table D-3Oconee Nuclear Station, Unit 3
SAFSTOR Decommissioning Cost Estimate(thousands of 2013 dollars)
Costs run: Sun, Dec 1, 2013 at 13:27:10 Off-Site LLRW NRC Spent Fuel Site Processed Burial Volumes Burial / Utility andActivity DECCER Version 2010.09.09i Decon Removal Packaging Transport Processing Disposal Other Total Total Lic. Term. Management Restoration Volume Class A Class B Class C GTCC Processed Craft ContractorIndex Activity Description Cost Cost Costs Costs Costs Costs Costs Contingency Costs Costs Costs Costs Cu. Feet Cu. Feet Cu. Feet Cu. Feet Cu. Feet Wt., Lbs. Manhours Manhours
PERIOD 1a - Shutdown through Transition
Period 1a Direct Decommissioning Activities
1a.1.1 SAFSTOR site characterization survey - - - - - - 380 114 494 494 - - - - - - - - - - 1a.1.2 Prepare preliminary decommissioning cost - - - - - - 42 6 48 48 - - - - - - - - - 556 1a.1.3 Notification of Cessation of Operations a 1a.1.4 Remove fuel & source material n/a1a.1.5 Notification of Permanent Defueling a 1a.1.6 Deactivate plant systems & process waste a 1a.1.7 Prepare and submit PSDAR - - - - - - 64 10 74 74 - - - - - - - - - 856 1a.1.8 Review plant dwgs & specs. - - - - - - 42 6 48 48 - - - - - - - - - 556 1a.1.9 Perform detailed rad survey a 1a.1.10 Estimate by-product inventory - - - - - - 32 5 37 37 - - - - - - - - - 428 1a.1.11 End product description - - - - - - 32 5 37 37 - - - - - - - - - 428 1a.1.12 Detailed by-product inventory - - - - - - 48 7 55 55 - - - - - - - - - 642 1a.1.13 Define major work sequence - - - - - - 32 5 37 37 - - - - - - - - - 428 1a.1.14 Perform SER and EA - - - - - - 100 15 115 115 - - - - - - - - - 1,327 1a.1.15 Perform Site-Specific Cost Study - - - - - - 161 24 185 185 - - - - - - - - - 2,140
Activity Specifications1a.1.16.1 Prepare plant and facilities for SAFSTOR - - - - - - 158 24 182 182 - - - - - - - - - 2,106 1a.1.16.2 Plant systems - - - - - - 134 20 154 154 - - - - - - - - - 1,783 1a.1.16.3 Plant structures and buildings - - - - - - 100 15 115 115 - - - - - - - - - 1,335 1a.1.16.4 Waste management - - - - - - 64 10 74 74 - - - - - - - - - 856 1a.1.16.5 Facility and site dormancy - - - - - - 64 10 74 74 - - - - - - - - - 856 1a.1.16 Total - - - - - - 521 78 599 599 - - - - - - - - - 6,936
Detailed Work Procedures1a.1.17.1 Plant systems - - - - - - 38 6 44 44 - - - - - - - - - 506 1a.1.17.2 Facility closeout & dormancy - - - - - - 39 6 44 44 - - - - - - - - - 514 1a.1.17 Total - - - - - - 77 11 88 88 - - - - - - - - - 1,020
1a.1.18 Procure vacuum drying system - - - - - - 3 0 4 4 - - - - - - - - - 43 1a.1.19 Drain/de-energize non-cont. systems a 1a.1.20 Drain & dry NSSS a 1a.1.21 Drain/de-energize contaminated systems a 1a.1.22 Decon/secure contaminated systems a 1a.1 Subtotal Period 1a Activity Costs - - - - - - 1,533 287 1,820 1,820 - - - - - - - - - 15,361
Period 1a Additional Costs1a.2.1 Asbestos Abatement - 3,376 4 319 - 2,925 - 1,624 8,249 8,249 - - - 25,455 - - - 330,915 38,621 - 1a.2.2 Landfill and Firing Range Closure - - - - - - 645 64 709 - - 709 - - - - - - - - 1a.2 Subtotal Period 1a Additional Costs - 3,376 4 319 - 2,925 645 1,688 8,958 8,249 - 709 - 25,455 - - - 330,915 38,621 -
Period 1a Collateral Costs1a.3.1 Small tool allowance - 46 - - - - - 7 53 53 - - - - - - - - - - 1a.3.2 Spent Fuel Capital and Transfer - - - - - - 298 45 343 - 343 - - - - - - - - - 1a.3 Subtotal Period 1a Collateral Costs - 46 - - - - 298 52 396 53 343 - - - - - - - - -
Period 1a Period-Dependent Costs1a.4.1 Insurance - - - - - - 881 88 969 969 - - - - - - - - - - 1a.4.2 Property taxes - - - - - - 1,960 196 2,156 2,156 - - - - - - - - - - 1a.4.3 Health physics supplies - 643 - - - - - 161 804 804 - - - - - - - - - - 1a.4.4 Heavy equipment rental - 571 - - - - - 86 657 657 - - - - - - - - - - 1a.4.5 Disposal of DAW generated - - 12 2 - 28 - 8 51 51 - - - 571 - - - 11,419 19 - 1a.4.6 Plant energy budget - - - - - - 617 92 709 709 - - - - - - - - - - 1a.4.7 NRC Fees - - - - - - 632 63 695 695 - - - - - - - - - - 1a.4.8 Emergency Planning Fees - - - - - - 129 13 142 - 142 - - - - - - - - - 1a.4.9 FEMA Fees - - - - - - 171 26 197 - 197 - - - - - - - - - 1a.4.10 Spent Fuel Pool O&M - - - - - - 783 117 900 - 900 - - - - - - - - - 1a.4.11 ISFSI Operating Costs - - - - - - 111 17 128 - 128 - - - - - - - - - 1a.4.12 Corporate A&G - - - - - - 2,132 320 2,451 2,451 - - - - - - - - - - 1a.4.13 Site O&M - - - - - - 136 20 156 156 - - - - - - - - - - 1a.4.14 Security Staff Cost - - - - - - 2,670 401 3,071 3,071 - - - - - - - - - 83,595 1a.4.15 Utility Staff Cost - - - - - - 20,675 3,101 23,777 23,777 - - - - - - - - - 356,657
TLG Services, Inc.

Oconee Nuclear StationDecommissioning Cost Analysis
Document D03-1671-003, Rev. 0 Appendix D, Page 22 of 31
Table D-3Oconee Nuclear Station, Unit 3
SAFSTOR Decommissioning Cost Estimate(thousands of 2013 dollars)
Costs run: Sun, Dec 1, 2013 at 13:27:10 Off-Site LLRW NRC Spent Fuel Site Processed Burial Volumes Burial / Utility andActivity DECCER Version 2010.09.09i Decon Removal Packaging Transport Processing Disposal Other Total Total Lic. Term. Management Restoration Volume Class A Class B Class C GTCC Processed Craft ContractorIndex Activity Description Cost Cost Costs Costs Costs Costs Costs Contingency Costs Costs Costs Costs Cu. Feet Cu. Feet Cu. Feet Cu. Feet Cu. Feet Wt., Lbs. Manhours Manhours
1a.4 Subtotal Period 1a Period-Dependent Costs - 1,214 12 2 - 28 30,898 4,709 36,863 35,495 1,368 - - 571 - - - 11,419 19 440,253
1a.0 TOTAL PERIOD 1a COST - 4,637 16 321 - 2,953 33,373 6,736 48,037 45,617 1,711 709 - 26,026 - - - 342,334 38,639 455,613
PERIOD 1b - SAFSTOR Limited DECON Activities
Period 1b Direct Decommissioning Activities
Decontamination of Site Buildings1b.1.1.1 Reactor Building 803 - - - - - - 402 1,205 1,205 - - - - - - - - 19,093 - 1b.1.1.2 Auxiliary Building 366 - - - - - - 183 549 549 - - - - - - - - 9,084 - 1b.1.1.3 Contaminated Misc. Structures(common) 15 - - - - - - 8 23 23 - - - - - - - - 379 - 1b.1.1.4 Hot Machine Shop(common) 51 - - - - - - 26 77 77 - - - - - - - - 1,267 - 1b.1.1.5 Interim Radwaste Building(common) 103 - - - - - - 52 155 155 - - - - - - - - 2,570 - 1b.1.1.6 Radwaste Facility(common) 374 - - - - - - 187 562 562 - - - - - - - - 8,941 - 1b.1.1.7 Retired Steam Gen Storage Fac.(common) 81 - - - - - - 40 121 121 - - - - - - - - 1,942 - 1b.1.1.8 Turbine Building 210 - - - - - - 105 316 316 - - - - - - - - 5,127 - 1b.1.1.9 Fuel Building 241 - - - - - - 120 361 361 - - - - - - - - 5,111 - 1b.1.1 Totals 2,245 - - - - - - 1,123 3,368 3,368 - - - - - - - - 53,513 -
1b.1 Subtotal Period 1b Activity Costs 2,245 - - - - - - 1,123 3,368 3,368 - - - - - - - - 53,513 -
Period 1b Additional Costs1b.2.1 Spent fuel pool isolation - - - - - - 7,040 1,056 8,096 8,096 - - - - - - - - - - 1b.2.2 Misc. Waste Disposal - - 36 239 - 1,716 - 468 2,460 2,460 - - - 17,591 - - - 487,058 1,076 - 1b.2.3 Landfill Post Closure Maintenance - - - - - - 8 1 9 - - 9 - - - - - - - - 1b.2 Subtotal Period 1b Additional Costs - - 36 239 - 1,716 7,049 1,525 10,565 10,556 - 9 - 17,591 - - - 487,058 1,076 -
Period 1b Collateral Costs1b.3.1 Decon equipment 946 - - - - - - 142 1,087 1,087 - - - - - - - - - - 1b.3.2 Process decommissioning water waste 106 - 48 241 - 280 - 164 839 839 - - - 672 - - - 40,318 131 - 1b.3.4 Small tool allowance - 37 - - - - - 6 43 43 - - - - - - - - - - 1b.3.5 Spent Fuel Capital and Transfer - - - - - - 138 21 158 - 158 - - - - - - - - - 1b.3 Subtotal Period 1b Collateral Costs 1,052 37 48 241 - 280 138 332 2,128 1,970 158 - - 672 - - - 40,318 131 -
Period 1b Period-Dependent Costs1b.4.1 Decon supplies 1,133 - - - - - - 283 1,416 1,416 - - - - - - - - - - 1b.4.2 Insurance - - - - - - 222 22 244 244 - - - - - - - - - - 1b.4.3 Property taxes - - - - - - 494 49 543 543 - - - - - - - - - - 1b.4.4 Health physics supplies - 367 - - - - - 92 459 459 - - - - - - - - - - 1b.4.5 Heavy equipment rental - 144 - - - - - 22 166 166 - - - - - - - - - - 1b.4.6 Disposal of DAW generated - - 16 2 - 36 - 11 65 65 - - - 736 - - - 14,720 24 - 1b.4.7 Plant energy budget - - - - - - 155 23 179 179 - - - - - - - - - - 1b.4.8 NRC Fees - - - - - - 91 9 101 101 - - - - - - - - - - 1b.4.9 Emergency Planning Fees - - - - - - 33 3 36 - 36 - - - - - - - - - 1b.4.10 FEMA Fees - - - - - - 43 6 50 - 50 - - - - - - - - - 1b.4.11 Spent Fuel Pool O&M - - - - - - 197 30 227 - 227 - - - - - - - - - 1b.4.12 ISFSI Operating Costs - - - - - - 28 4 32 - 32 - - - - - - - - - 1b.4.13 Corporate A&G - - - - - - 537 81 618 618 - - - - - - - - - - 1b.4.14 Site O&M - - - - - - 34 5 39 39 - - - - - - - - - - 1b.4.15 Security Staff Cost - - - - - - 673 101 774 774 - - - - - - - - - 21,071 1b.4.16 Utility Staff Cost - - - - - - 5,211 782 5,993 5,993 - - - - - - - - - 89,897 1b.4 Subtotal Period 1b Period-Dependent Costs 1,133 511 16 2 - 36 7,720 1,523 10,941 10,597 345 - - 736 - - - 14,720 24 110,968
1b.0 TOTAL PERIOD 1b COST 4,430 549 100 482 - 2,032 14,906 4,504 27,003 26,490 503 9 - 18,999 - - - 542,096 54,743 110,968
PERIOD 1c - Preparations for SAFSTOR Dormancy
Period 1c Direct Decommissioning Activities
1c.1.1 Prepare support equipment for storage - 418 - - - - - 63 480 480 - - - - - - - - 3,000 - 1c.1.2 Install containment pressure equal. lines - 33 - - - - - 5 38 38 - - - - - - - - 700 - 1c.1.3 Interim survey prior to dormancy - - - - - - 733 220 953 953 - - - - - - - - 14,124 - 1c.1.4 Secure building accesses a 1c.1.5 Prepare & submit interim report - - - - - - 19 3 22 22 - - - - - - - - - 250
1c.1 Subtotal Period 1c Activity Costs - 451 - - - - 752 290 1,492 1,492 - - - - - - - - 17,824 250
TLG Services, Inc.
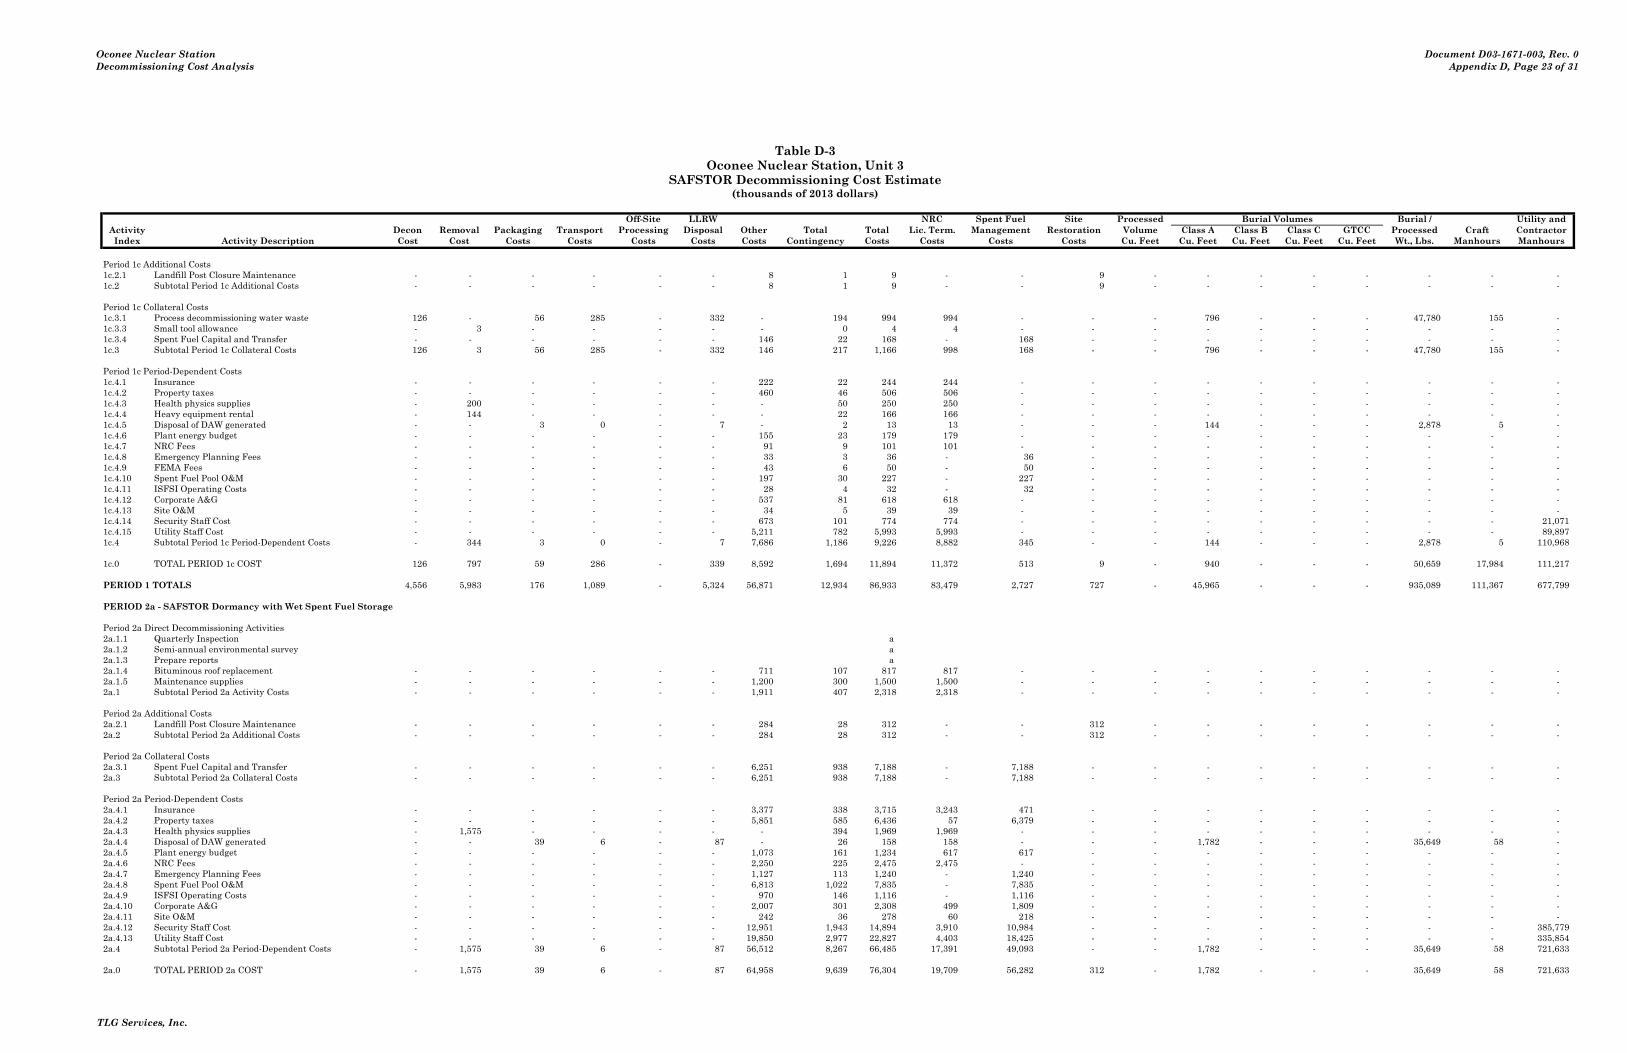
Oconee Nuclear StationDecommissioning Cost Analysis
Document D03-1671-003, Rev. 0 Appendix D, Page 23 of 31
Table D-3Oconee Nuclear Station, Unit 3
SAFSTOR Decommissioning Cost Estimate(thousands of 2013 dollars)
Costs run: Sun, Dec 1, 2013 at 13:27:10 Off-Site LLRW NRC Spent Fuel Site Processed Burial Volumes Burial / Utility andActivity DECCER Version 2010.09.09i Decon Removal Packaging Transport Processing Disposal Other Total Total Lic. Term. Management Restoration Volume Class A Class B Class C GTCC Processed Craft ContractorIndex Activity Description Cost Cost Costs Costs Costs Costs Costs Contingency Costs Costs Costs Costs Cu. Feet Cu. Feet Cu. Feet Cu. Feet Cu. Feet Wt., Lbs. Manhours Manhours
Period 1c Additional Costs1c.2.1 Landfill Post Closure Maintenance - - - - - - 8 1 9 - - 9 - - - - - - - - 1c.2 Subtotal Period 1c Additional Costs - - - - - - 8 1 9 - - 9 - - - - - - - -
Period 1c Collateral Costs1c.3.1 Process decommissioning water waste 126 - 56 285 - 332 - 194 994 994 - - - 796 - - - 47,780 155 - 1c.3.3 Small tool allowance - 3 - - - - - 0 4 4 - - - - - - - - - - 1c.3.4 Spent Fuel Capital and Transfer - - - - - - 146 22 168 - 168 - - - - - - - - - 1c.3 Subtotal Period 1c Collateral Costs 126 3 56 285 - 332 146 217 1,166 998 168 - - 796 - - - 47,780 155 -
Period 1c Period-Dependent Costs1c.4.1 Insurance - - - - - - 222 22 244 244 - - - - - - - - - - 1c.4.2 Property taxes - - - - - - 460 46 506 506 - - - - - - - - - - 1c.4.3 Health physics supplies - 200 - - - - - 50 250 250 - - - - - - - - - - 1c.4.4 Heavy equipment rental - 144 - - - - - 22 166 166 - - - - - - - - - - 1c.4.5 Disposal of DAW generated - - 3 0 - 7 - 2 13 13 - - - 144 - - - 2,878 5 - 1c.4.6 Plant energy budget - - - - - - 155 23 179 179 - - - - - - - - - - 1c.4.7 NRC Fees - - - - - - 91 9 101 101 - - - - - - - - - - 1c.4.8 Emergency Planning Fees - - - - - - 33 3 36 - 36 - - - - - - - - - 1c.4.9 FEMA Fees - - - - - - 43 6 50 - 50 - - - - - - - - - 1c.4.10 Spent Fuel Pool O&M - - - - - - 197 30 227 - 227 - - - - - - - - - 1c.4.11 ISFSI Operating Costs - - - - - - 28 4 32 - 32 - - - - - - - - - 1c.4.12 Corporate A&G - - - - - - 537 81 618 618 - - - - - - - - - - 1c.4.13 Site O&M - - - - - - 34 5 39 39 - - - - - - - - - - 1c.4.14 Security Staff Cost - - - - - - 673 101 774 774 - - - - - - - - - 21,071 1c.4.15 Utility Staff Cost - - - - - - 5,211 782 5,993 5,993 - - - - - - - - - 89,897 1c.4 Subtotal Period 1c Period-Dependent Costs - 344 3 0 - 7 7,686 1,186 9,226 8,882 345 - - 144 - - - 2,878 5 110,968
1c.0 TOTAL PERIOD 1c COST 126 797 59 286 - 339 8,592 1,694 11,894 11,372 513 9 - 940 - - - 50,659 17,984 111,217
PERIOD 1 TOTALS 4,556 5,983 176 1,089 - 5,324 56,871 12,934 86,933 83,479 2,727 727 - 45,965 - - - 935,089 111,367 677,799
PERIOD 2a - SAFSTOR Dormancy with Wet Spent Fuel Storage
Period 2a Direct Decommissioning Activities2a.1.1 Quarterly Inspection a 2a.1.2 Semi-annual environmental survey a 2a.1.3 Prepare reports a 2a.1.4 Bituminous roof replacement - - - - - - 711 107 817 817 - - - - - - - - - - 2a.1.5 Maintenance supplies - - - - - - 1,200 300 1,500 1,500 - - - - - - - - - - 2a.1 Subtotal Period 2a Activity Costs - - - - - - 1,911 407 2,318 2,318 - - - - - - - - - -
Period 2a Additional Costs2a.2.1 Landfill Post Closure Maintenance - - - - - - 284 28 312 - - 312 - - - - - - - - 2a.2 Subtotal Period 2a Additional Costs - - - - - - 284 28 312 - - 312 - - - - - - - -
Period 2a Collateral Costs2a.3.1 Spent Fuel Capital and Transfer - - - - - - 6,251 938 7,188 - 7,188 - - - - - - - - - 2a.3 Subtotal Period 2a Collateral Costs - - - - - - 6,251 938 7,188 - 7,188 - - - - - - - - -
Period 2a Period-Dependent Costs2a.4.1 Insurance - - - - - - 3,377 338 3,715 3,243 471 - - - - - - - - - 2a.4.2 Property taxes - - - - - - 5,851 585 6,436 57 6,379 - - - - - - - - - 2a.4.3 Health physics supplies - 1,575 - - - - - 394 1,969 1,969 - - - - - - - - - - 2a.4.4 Disposal of DAW generated - - 39 6 - 87 - 26 158 158 - - - 1,782 - - - 35,649 58 - 2a.4.5 Plant energy budget - - - - - - 1,073 161 1,234 617 617 - - - - - - - - - 2a.4.6 NRC Fees - - - - - - 2,250 225 2,475 2,475 - - - - - - - - - - 2a.4.7 Emergency Planning Fees - - - - - - 1,127 113 1,240 - 1,240 - - - - - - - - - 2a.4.8 Spent Fuel Pool O&M - - - - - - 6,813 1,022 7,835 - 7,835 - - - - - - - - - 2a.4.9 ISFSI Operating Costs - - - - - - 970 146 1,116 - 1,116 - - - - - - - - - 2a.4.10 Corporate A&G - - - - - - 2,007 301 2,308 499 1,809 - - - - - - - - - 2a.4.11 Site O&M - - - - - - 242 36 278 60 218 - - - - - - - - - 2a.4.12 Security Staff Cost - - - - - - 12,951 1,943 14,894 3,910 10,984 - - - - - - - - 385,779 2a.4.13 Utility Staff Cost - - - - - - 19,850 2,977 22,827 4,403 18,425 - - - - - - - - 335,854 2a.4 Subtotal Period 2a Period-Dependent Costs - 1,575 39 6 - 87 56,512 8,267 66,485 17,391 49,093 - - 1,782 - - - 35,649 58 721,633
2a.0 TOTAL PERIOD 2a COST - 1,575 39 6 - 87 64,958 9,639 76,304 19,709 56,282 312 - 1,782 - - - 35,649 58 721,633
TLG Services, Inc.
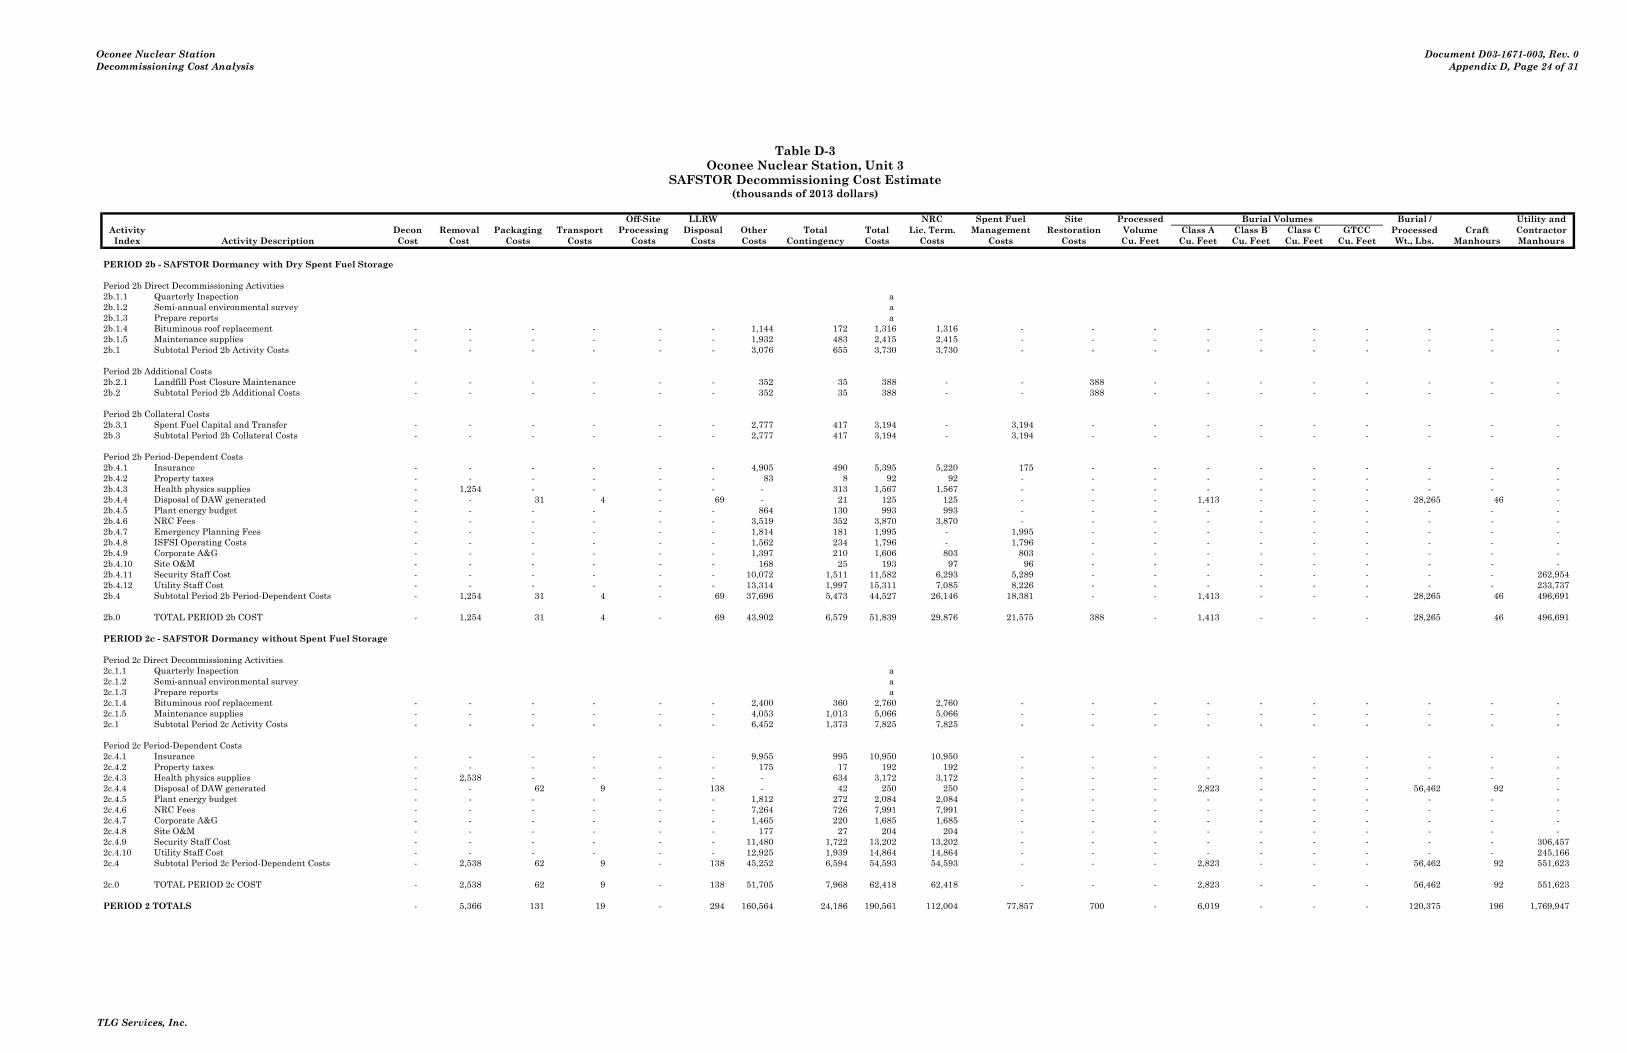
Oconee Nuclear StationDecommissioning Cost Analysis
Document D03-1671-003, Rev. 0 Appendix D, Page 24 of 31
Table D-3Oconee Nuclear Station, Unit 3
SAFSTOR Decommissioning Cost Estimate(thousands of 2013 dollars)
Costs run: Sun, Dec 1, 2013 at 13:27:10 Off-Site LLRW NRC Spent Fuel Site Processed Burial Volumes Burial / Utility andActivity DECCER Version 2010.09.09i Decon Removal Packaging Transport Processing Disposal Other Total Total Lic. Term. Management Restoration Volume Class A Class B Class C GTCC Processed Craft ContractorIndex Activity Description Cost Cost Costs Costs Costs Costs Costs Contingency Costs Costs Costs Costs Cu. Feet Cu. Feet Cu. Feet Cu. Feet Cu. Feet Wt., Lbs. Manhours Manhours
PERIOD 2b - SAFSTOR Dormancy with Dry Spent Fuel Storage
Period 2b Direct Decommissioning Activities2b.1.1 Quarterly Inspection a 2b.1.2 Semi-annual environmental survey a 2b.1.3 Prepare reports a 2b.1.4 Bituminous roof replacement - - - - - - 1,144 172 1,316 1,316 - - - - - - - - - - 2b.1.5 Maintenance supplies - - - - - - 1,932 483 2,415 2,415 - - - - - - - - - - 2b.1 Subtotal Period 2b Activity Costs - - - - - - 3,076 655 3,730 3,730 - - - - - - - - - -
Period 2b Additional Costs2b.2.1 Landfill Post Closure Maintenance - - - - - - 352 35 388 - - 388 - - - - - - - - 2b.2 Subtotal Period 2b Additional Costs - - - - - - 352 35 388 - - 388 - - - - - - - -
Period 2b Collateral Costs2b.3.1 Spent Fuel Capital and Transfer - - - - - - 2,777 417 3,194 - 3,194 - - - - - - - - - 2b.3 Subtotal Period 2b Collateral Costs - - - - - - 2,777 417 3,194 - 3,194 - - - - - - - - -
Period 2b Period-Dependent Costs2b.4.1 Insurance - - - - - - 4,905 490 5,395 5,220 175 - - - - - - - - - 2b.4.2 Property taxes - - - - - - 83 8 92 92 - - - - - - - - - - 2b.4.3 Health physics supplies - 1,254 - - - - - 313 1,567 1,567 - - - - - - - - - - 2b.4.4 Disposal of DAW generated - - 31 4 - 69 - 21 125 125 - - - 1,413 - - - 28,265 46 - 2b.4.5 Plant energy budget - - - - - - 864 130 993 993 - - - - - - - - - - 2b.4.6 NRC Fees - - - - - - 3,519 352 3,870 3,870 - - - - - - - - - - 2b.4.7 Emergency Planning Fees - - - - - - 1,814 181 1,995 - 1,995 - - - - - - - - - 2b.4.8 ISFSI Operating Costs - - - - - - 1,562 234 1,796 - 1,796 - - - - - - - - - 2b.4.9 Corporate A&G - - - - - - 1,397 210 1,606 803 803 - - - - - - - - - 2b.4.10 Site O&M - - - - - - 168 25 193 97 96 - - - - - - - - - 2b.4.11 Security Staff Cost - - - - - - 10,072 1,511 11,582 6,293 5,289 - - - - - - - - 262,954 2b.4.12 Utility Staff Cost - - - - - - 13,314 1,997 15,311 7,085 8,226 - - - - - - - - 233,737 2b.4 Subtotal Period 2b Period-Dependent Costs - 1,254 31 4 - 69 37,696 5,473 44,527 26,146 18,381 - - 1,413 - - - 28,265 46 496,691
2b.0 TOTAL PERIOD 2b COST - 1,254 31 4 - 69 43,902 6,579 51,839 29,876 21,575 388 - 1,413 - - - 28,265 46 496,691
PERIOD 2c - SAFSTOR Dormancy without Spent Fuel Storage
Period 2c Direct Decommissioning Activities2c.1.1 Quarterly Inspection a 2c.1.2 Semi-annual environmental survey a 2c.1.3 Prepare reports a 2c.1.4 Bituminous roof replacement - - - - - - 2,400 360 2,760 2,760 - - - - - - - - - - 2c.1.5 Maintenance supplies - - - - - - 4,053 1,013 5,066 5,066 - - - - - - - - - - 2c.1 Subtotal Period 2c Activity Costs - - - - - - 6,452 1,373 7,825 7,825 - - - - - - - - - -
Period 2c Period-Dependent Costs2c.4.1 Insurance - - - - - - 9,955 995 10,950 10,950 - - - - - - - - - - 2c.4.2 Property taxes - - - - - - 175 17 192 192 - - - - - - - - - - 2c.4.3 Health physics supplies - 2,538 - - - - - 634 3,172 3,172 - - - - - - - - - - 2c.4.4 Disposal of DAW generated - - 62 9 - 138 - 42 250 250 - - - 2,823 - - - 56,462 92 - 2c.4.5 Plant energy budget - - - - - - 1,812 272 2,084 2,084 - - - - - - - - - - 2c.4.6 NRC Fees - - - - - - 7,264 726 7,991 7,991 - - - - - - - - - - 2c.4.7 Corporate A&G - - - - - - 1,465 220 1,685 1,685 - - - - - - - - - - 2c.4.8 Site O&M - - - - - - 177 27 204 204 - - - - - - - - - - 2c.4.9 Security Staff Cost - - - - - - 11,480 1,722 13,202 13,202 - - - - - - - - - 306,457 2c.4.10 Utility Staff Cost - - - - - - 12,925 1,939 14,864 14,864 - - - - - - - - - 245,166 2c.4 Subtotal Period 2c Period-Dependent Costs - 2,538 62 9 - 138 45,252 6,594 54,593 54,593 - - - 2,823 - - - 56,462 92 551,623
2c.0 TOTAL PERIOD 2c COST - 2,538 62 9 - 138 51,705 7,968 62,418 62,418 - - - 2,823 - - - 56,462 92 551,623
PERIOD 2 TOTALS - 5,366 131 19 - 294 160,564 24,186 190,561 112,004 77,857 700 - 6,019 - - - 120,375 196 1,769,947
TLG Services, Inc.
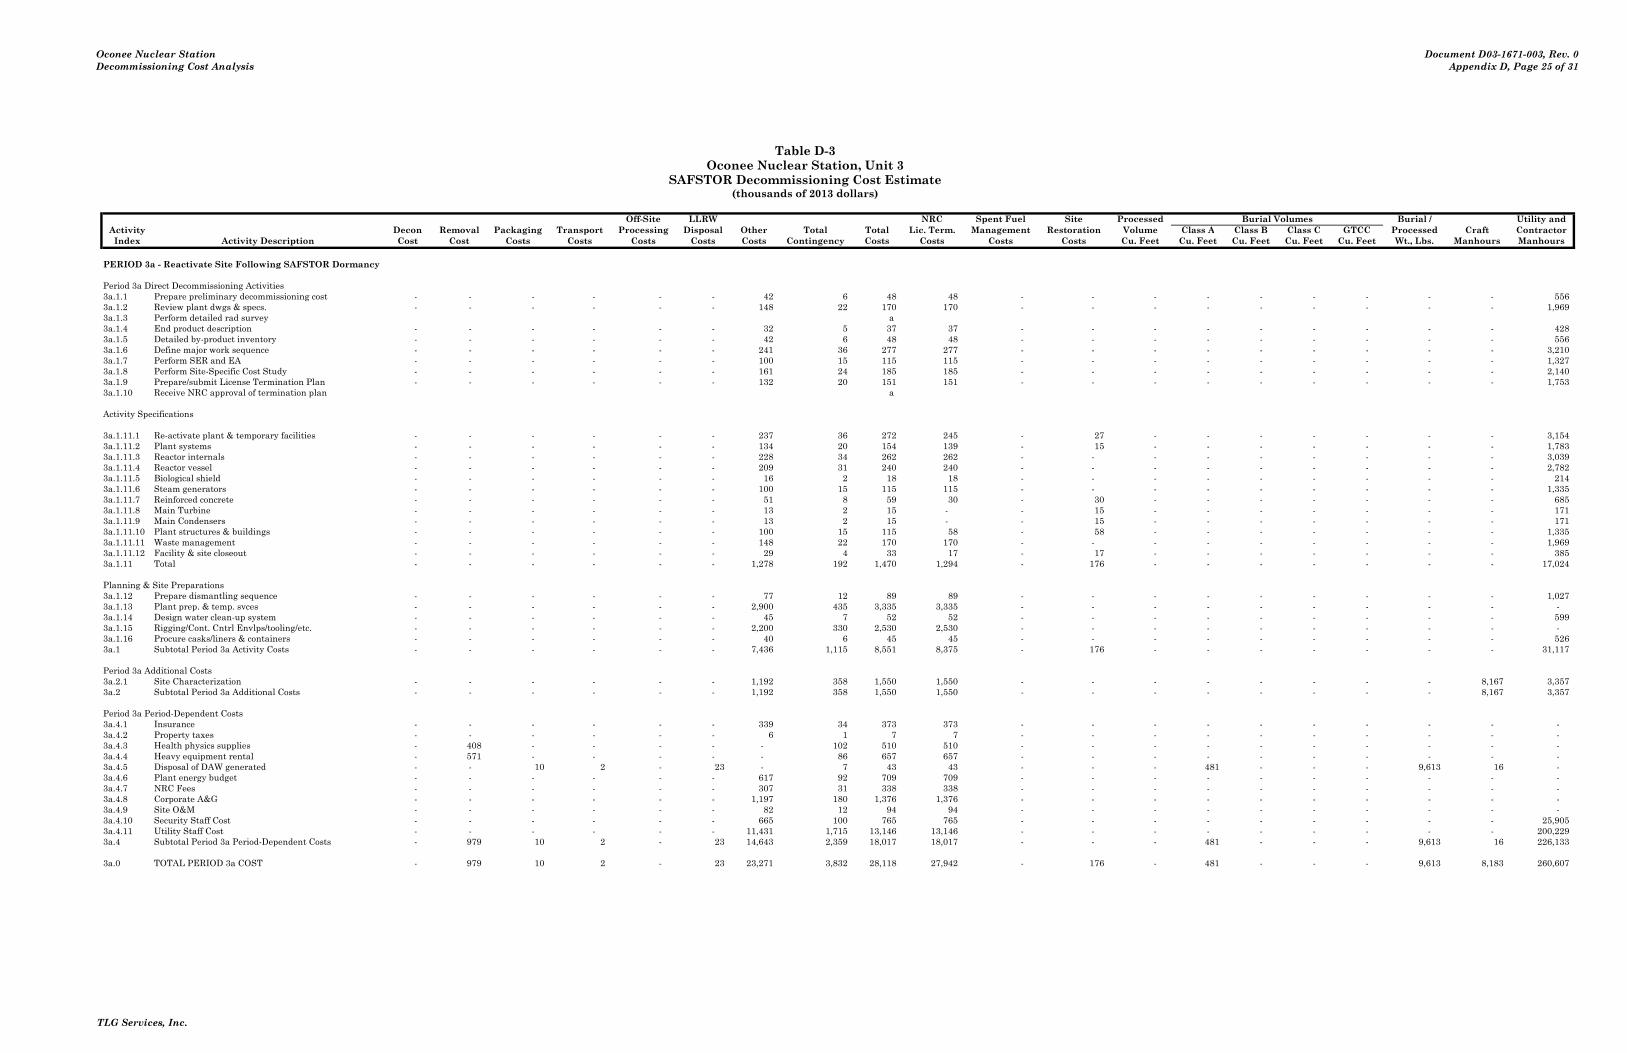
Oconee Nuclear StationDecommissioning Cost Analysis
Document D03-1671-003, Rev. 0 Appendix D, Page 25 of 31
Table D-3Oconee Nuclear Station, Unit 3
SAFSTOR Decommissioning Cost Estimate(thousands of 2013 dollars)
Costs run: Sun, Dec 1, 2013 at 13:27:10 Off-Site LLRW NRC Spent Fuel Site Processed Burial Volumes Burial / Utility andActivity DECCER Version 2010.09.09i Decon Removal Packaging Transport Processing Disposal Other Total Total Lic. Term. Management Restoration Volume Class A Class B Class C GTCC Processed Craft ContractorIndex Activity Description Cost Cost Costs Costs Costs Costs Costs Contingency Costs Costs Costs Costs Cu. Feet Cu. Feet Cu. Feet Cu. Feet Cu. Feet Wt., Lbs. Manhours Manhours
PERIOD 3a - Reactivate Site Following SAFSTOR Dormancy
Period 3a Direct Decommissioning Activities3a.1.1 Prepare preliminary decommissioning cost - - - - - - 42 6 48 48 - - - - - - - - - 556 3a.1.2 Review plant dwgs & specs. - - - - - - 148 22 170 170 - - - - - - - - - 1,969 3a.1.3 Perform detailed rad survey a 3a.1.4 End product description - - - - - - 32 5 37 37 - - - - - - - - - 428 3a.1.5 Detailed by-product inventory - - - - - - 42 6 48 48 - - - - - - - - - 556 3a.1.6 Define major work sequence - - - - - - 241 36 277 277 - - - - - - - - - 3,210 3a.1.7 Perform SER and EA - - - - - - 100 15 115 115 - - - - - - - - - 1,327 3a.1.8 Perform Site-Specific Cost Study - - - - - - 161 24 185 185 - - - - - - - - - 2,140 3a.1.9 Prepare/submit License Termination Plan - - - - - - 132 20 151 151 - - - - - - - - - 1,753 3a.1.10 Receive NRC approval of termination plan a
Activity Specifications
3a.1.11.1 Re-activate plant & temporary facilities - - - - - - 237 36 272 245 - 27 - - - - - - - 3,154 3a.1.11.2 Plant systems - - - - - - 134 20 154 139 - 15 - - - - - - - 1,783 3a.1.11.3 Reactor internals - - - - - - 228 34 262 262 - - - - - - - - - 3,039 3a.1.11.4 Reactor vessel - - - - - - 209 31 240 240 - - - - - - - - - 2,782 3a.1.11.5 Biological shield - - - - - - 16 2 18 18 - - - - - - - - - 214 3a.1.11.6 Steam generators - - - - - - 100 15 115 115 - - - - - - - - - 1,335 3a.1.11.7 Reinforced concrete - - - - - - 51 8 59 30 - 30 - - - - - - - 685 3a.1.11.8 Main Turbine - - - - - - 13 2 15 - - 15 - - - - - - - 171 3a.1.11.9 Main Condensers - - - - - - 13 2 15 - - 15 - - - - - - - 171 3a.1.11.10 Plant structures & buildings - - - - - - 100 15 115 58 - 58 - - - - - - - 1,335 3a.1.11.11 Waste management - - - - - - 148 22 170 170 - - - - - - - - - 1,969 3a.1.11.12 Facility & site closeout - - - - - - 29 4 33 17 - 17 - - - - - - - 385 3a.1.11 Total - - - - - - 1,278 192 1,470 1,294 - 176 - - - - - - - 17,024
Planning & Site Preparations3a.1.12 Prepare dismantling sequence - - - - - - 77 12 89 89 - - - - - - - - - 1,027 3a.1.13 Plant prep. & temp. svces - - - - - - 2,900 435 3,335 3,335 - - - - - - - - - - 3a.1.14 Design water clean-up system - - - - - - 45 7 52 52 - - - - - - - - - 599 3a.1.15 Rigging/Cont. Cntrl Envlps/tooling/etc. - - - - - - 2,200 330 2,530 2,530 - - - - - - - - - - 3a.1.16 Procure casks/liners & containers - - - - - - 40 6 45 45 - - - - - - - - - 526 3a.1 Subtotal Period 3a Activity Costs - - - - - - 7,436 1,115 8,551 8,375 - 176 - - - - - - - 31,117
Period 3a Additional Costs3a.2.1 Site Characterization - - - - - - 1,192 358 1,550 1,550 - - - - - - - - 8,167 3,357 3a.2 Subtotal Period 3a Additional Costs - - - - - - 1,192 358 1,550 1,550 - - - - - - - - 8,167 3,357
Period 3a Period-Dependent Costs3a.4.1 Insurance - - - - - - 339 34 373 373 - - - - - - - - - - 3a.4.2 Property taxes - - - - - - 6 1 7 7 - - - - - - - - - - 3a.4.3 Health physics supplies - 408 - - - - - 102 510 510 - - - - - - - - - - 3a.4.4 Heavy equipment rental - 571 - - - - - 86 657 657 - - - - - - - - - - 3a.4.5 Disposal of DAW generated - - 10 2 - 23 - 7 43 43 - - - 481 - - - 9,613 16 - 3a.4.6 Plant energy budget - - - - - - 617 92 709 709 - - - - - - - - - - 3a.4.7 NRC Fees - - - - - - 307 31 338 338 - - - - - - - - - - 3a.4.8 Corporate A&G - - - - - - 1,197 180 1,376 1,376 - - - - - - - - - - 3a.4.9 Site O&M - - - - - - 82 12 94 94 - - - - - - - - - - 3a.4.10 Security Staff Cost - - - - - - 665 100 765 765 - - - - - - - - - 25,905 3a.4.11 Utility Staff Cost - - - - - - 11,431 1,715 13,146 13,146 - - - - - - - - - 200,229 3a.4 Subtotal Period 3a Period-Dependent Costs - 979 10 2 - 23 14,643 2,359 18,017 18,017 - - - 481 - - - 9,613 16 226,133
3a.0 TOTAL PERIOD 3a COST - 979 10 2 - 23 23,271 3,832 28,118 27,942 - 176 - 481 - - - 9,613 8,183 260,607
TLG Services, Inc.
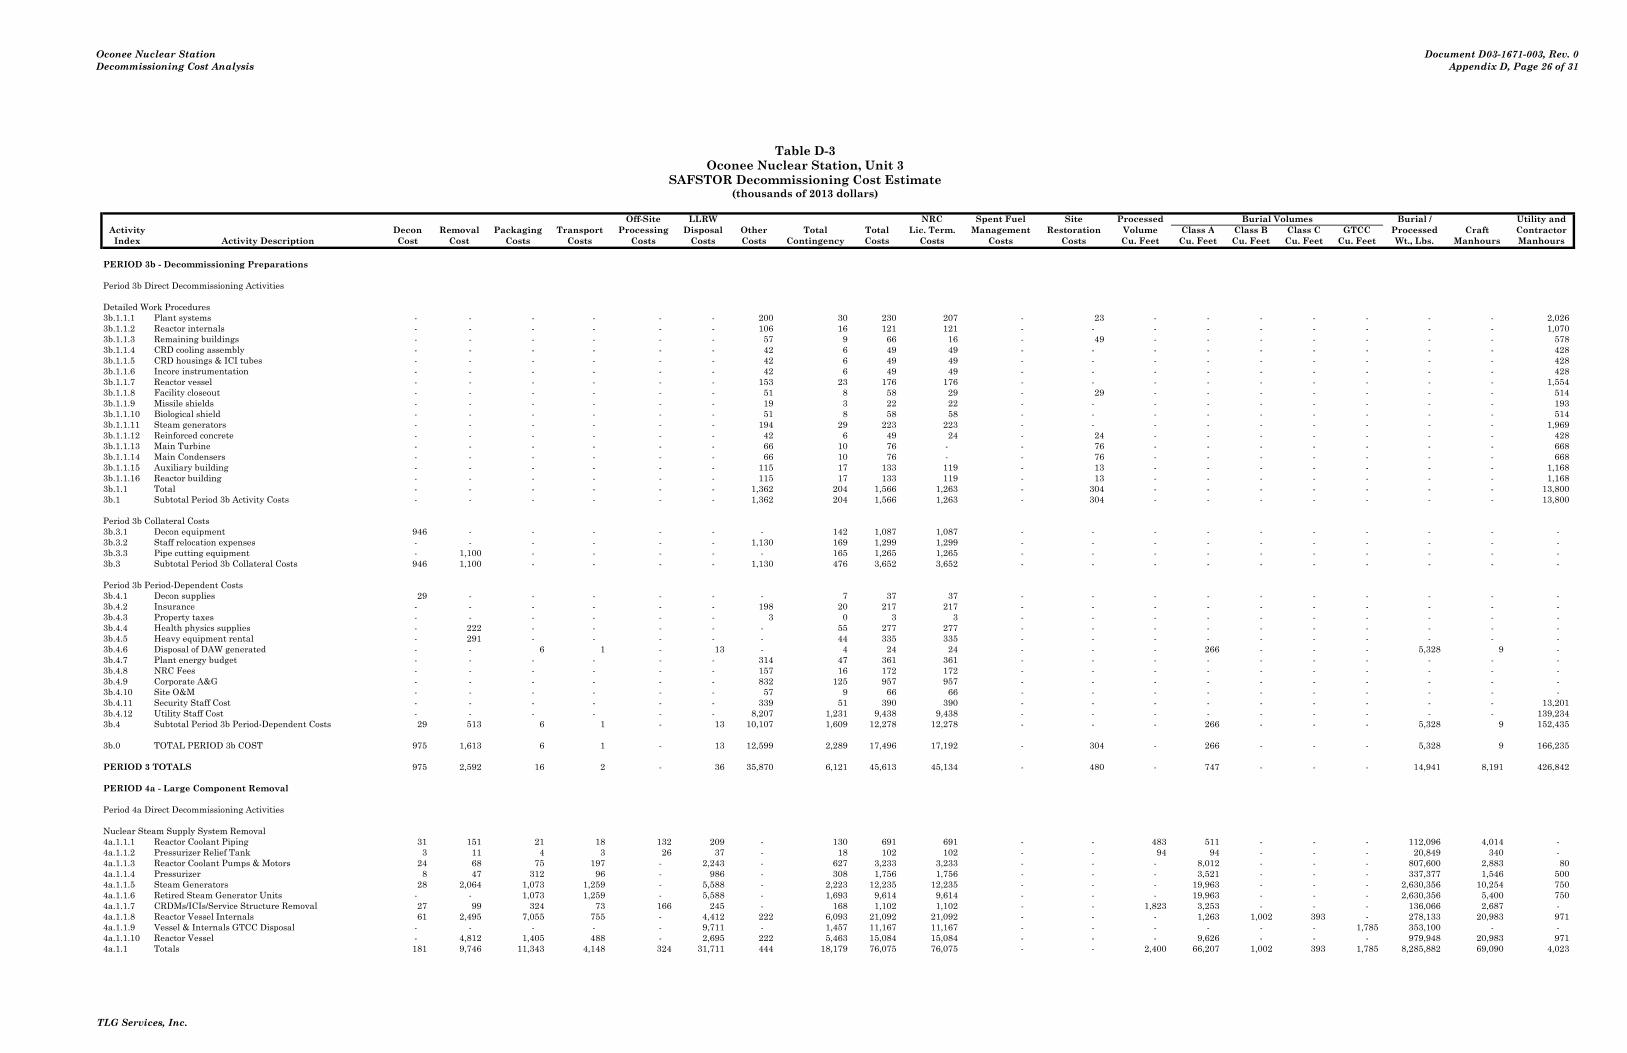
Oconee Nuclear StationDecommissioning Cost Analysis
Document D03-1671-003, Rev. 0 Appendix D, Page 26 of 31
Table D-3Oconee Nuclear Station, Unit 3
SAFSTOR Decommissioning Cost Estimate(thousands of 2013 dollars)
Costs run: Sun, Dec 1, 2013 at 13:27:10 Off-Site LLRW NRC Spent Fuel Site Processed Burial Volumes Burial / Utility andActivity DECCER Version 2010.09.09i Decon Removal Packaging Transport Processing Disposal Other Total Total Lic. Term. Management Restoration Volume Class A Class B Class C GTCC Processed Craft ContractorIndex Activity Description Cost Cost Costs Costs Costs Costs Costs Contingency Costs Costs Costs Costs Cu. Feet Cu. Feet Cu. Feet Cu. Feet Cu. Feet Wt., Lbs. Manhours Manhours
PERIOD 3b - Decommissioning Preparations
Period 3b Direct Decommissioning Activities
Detailed Work Procedures3b.1.1.1 Plant systems - - - - - - 200 30 230 207 - 23 - - - - - - - 2,026 3b.1.1.2 Reactor internals - - - - - - 106 16 121 121 - - - - - - - - - 1,070 3b.1.1.3 Remaining buildings - - - - - - 57 9 66 16 - 49 - - - - - - - 578 3b.1.1.4 CRD cooling assembly - - - - - - 42 6 49 49 - - - - - - - - - 428 3b.1.1.5 CRD housings & ICI tubes - - - - - - 42 6 49 49 - - - - - - - - - 428 3b.1.1.6 Incore instrumentation - - - - - - 42 6 49 49 - - - - - - - - - 428 3b.1.1.7 Reactor vessel - - - - - - 153 23 176 176 - - - - - - - - - 1,554 3b.1.1.8 Facility closeout - - - - - - 51 8 58 29 - 29 - - - - - - - 514 3b.1.1.9 Missile shields - - - - - - 19 3 22 22 - - - - - - - - - 193 3b.1.1.10 Biological shield - - - - - - 51 8 58 58 - - - - - - - - - 514 3b.1.1.11 Steam generators - - - - - - 194 29 223 223 - - - - - - - - - 1,969 3b.1.1.12 Reinforced concrete - - - - - - 42 6 49 24 - 24 - - - - - - - 428 3b.1.1.13 Main Turbine - - - - - - 66 10 76 - - 76 - - - - - - - 668 3b.1.1.14 Main Condensers - - - - - - 66 10 76 - - 76 - - - - - - - 668 3b.1.1.15 Auxiliary building - - - - - - 115 17 133 119 - 13 - - - - - - - 1,168 3b.1.1.16 Reactor building - - - - - - 115 17 133 119 - 13 - - - - - - - 1,168 3b.1.1 Total - - - - - - 1,362 204 1,566 1,263 - 304 - - - - - - - 13,800 3b.1 Subtotal Period 3b Activity Costs - - - - - - 1,362 204 1,566 1,263 - 304 - - - - - - - 13,800
Period 3b Collateral Costs3b.3.1 Decon equipment 946 - - - - - - 142 1,087 1,087 - - - - - - - - - - 3b.3.2 Staff relocation expenses - - - - - - 1,130 169 1,299 1,299 - - - - - - - - - - 3b.3.3 Pipe cutting equipment - 1,100 - - - - - 165 1,265 1,265 - - - - - - - - - - 3b.3 Subtotal Period 3b Collateral Costs 946 1,100 - - - - 1,130 476 3,652 3,652 - - - - - - - - - -
Period 3b Period-Dependent Costs3b.4.1 Decon supplies 29 - - - - - - 7 37 37 - - - - - - - - - - 3b.4.2 Insurance - - - - - - 198 20 217 217 - - - - - - - - - - 3b.4.3 Property taxes - - - - - - 3 0 3 3 - - - - - - - - - - 3b.4.4 Health physics supplies - 222 - - - - - 55 277 277 - - - - - - - - - - 3b.4.5 Heavy equipment rental - 291 - - - - - 44 335 335 - - - - - - - - - - 3b.4.6 Disposal of DAW generated - - 6 1 - 13 - 4 24 24 - - - 266 - - - 5,328 9 - 3b.4.7 Plant energy budget - - - - - - 314 47 361 361 - - - - - - - - - - 3b.4.8 NRC Fees - - - - - - 157 16 172 172 - - - - - - - - - - 3b.4.9 Corporate A&G - - - - - - 832 125 957 957 - - - - - - - - - - 3b.4.10 Site O&M - - - - - - 57 9 66 66 - - - - - - - - - - 3b.4.11 Security Staff Cost - - - - - - 339 51 390 390 - - - - - - - - - 13,201 3b.4.12 Utility Staff Cost - - - - - - 8,207 1,231 9,438 9,438 - - - - - - - - - 139,234 3b.4 Subtotal Period 3b Period-Dependent Costs 29 513 6 1 - 13 10,107 1,609 12,278 12,278 - - - 266 - - - 5,328 9 152,435
3b.0 TOTAL PERIOD 3b COST 975 1,613 6 1 - 13 12,599 2,289 17,496 17,192 - 304 - 266 - - - 5,328 9 166,235
PERIOD 3 TOTALS 975 2,592 16 2 - 36 35,870 6,121 45,613 45,134 - 480 - 747 - - - 14,941 8,191 426,842
PERIOD 4a - Large Component Removal
Period 4a Direct Decommissioning Activities
Nuclear Steam Supply System Removal4a.1.1.1 Reactor Coolant Piping 31 151 21 18 132 209 - 130 691 691 - - 483 511 - - - 112,096 4,014 - 4a.1.1.2 Pressurizer Relief Tank 3 11 4 3 26 37 - 18 102 102 - - 94 94 - - - 20,849 340 - 4a.1.1.3 Reactor Coolant Pumps & Motors 24 68 75 197 - 2,243 - 627 3,233 3,233 - - - 8,012 - - - 807,600 2,883 80 4a.1.1.4 Pressurizer 8 47 312 96 - 986 - 308 1,756 1,756 - - - 3,521 - - - 337,377 1,546 500 4a.1.1.5 Steam Generators 28 2,064 1,073 1,259 - 5,588 - 2,223 12,235 12,235 - - - 19,963 - - - 2,630,356 10,254 750 4a.1.1.6 Retired Steam Generator Units - - 1,073 1,259 - 5,588 - 1,693 9,614 9,614 - - - 19,963 - - - 2,630,356 5,400 750 4a.1.1.7 CRDMs/ICIs/Service Structure Removal 27 99 324 73 166 245 - 168 1,102 1,102 - - 1,823 3,253 - - - 136,066 2,687 - 4a.1.1.8 Reactor Vessel Internals 61 2,495 7,055 755 - 4,412 222 6,093 21,092 21,092 - - - 1,263 1,002 393 - 278,133 20,983 971 4a.1.1.9 Vessel & Internals GTCC Disposal - - - - - 9,711 - 1,457 11,167 11,167 - - - - - - 1,785 353,100 - - 4a.1.1.10 Reactor Vessel - 4,812 1,405 488 - 2,695 222 5,463 15,084 15,084 - - - 9,626 - - - 979,948 20,983 971 4a.1.1 Totals 181 9,746 11,343 4,148 324 31,711 444 18,179 76,075 76,075 - - 2,400 66,207 1,002 393 1,785 8,285,882 69,090 4,023
TLG Services, Inc.

Oconee Nuclear StationDecommissioning Cost Analysis
Document D03-1671-003, Rev. 0 Appendix D, Page 27 of 31
Table D-3Oconee Nuclear Station, Unit 3
SAFSTOR Decommissioning Cost Estimate(thousands of 2013 dollars)
Costs run: Sun, Dec 1, 2013 at 13:27:10 Off-Site LLRW NRC Spent Fuel Site Processed Burial Volumes Burial / Utility andActivity DECCER Version 2010.09.09i Decon Removal Packaging Transport Processing Disposal Other Total Total Lic. Term. Management Restoration Volume Class A Class B Class C GTCC Processed Craft ContractorIndex Activity Description Cost Cost Costs Costs Costs Costs Costs Contingency Costs Costs Costs Costs Cu. Feet Cu. Feet Cu. Feet Cu. Feet Cu. Feet Wt., Lbs. Manhours Manhours
Removal of Major Equipment4a.1.2 Main Turbine/Generator - 282 224 34 593 - - 187 1,320 1,320 - - 4,020 - - - - 241,216 6,768 - 4a.1.3 Main Condensers - 858 116 17 588 - - 317 1,895 1,895 - - 5,310 - - - - 238,934 21,071 -
Cascading Costs from Clean Building Demolition4a.1.4.1 Reactor Building - 777 - - - - - 117 893 893 - - - - - - - - 9,379 - 4a.1.4.2 Auxiliary Building - 141 - - - - - 21 162 162 - - - - - - - - 1,898 - 4a.1.4.3 Hot Machine Shop(common) - 6 - - - - - 1 7 7 - - - - - - - - 102 - 4a.1.4.4 Interim Radwaste Building(common) - 25 - - - - - 4 29 29 - - - - - - - - 441 - 4a.1.4.5 Radwaste Facility(common) - 230 - - - - - 34 264 264 - - - - - - - - 2,577 - 4a.1.4.6 Service Building(common) - 13 - - - - - 2 15 15 - - - - - - - - 226 - 4a.1.4.7 Turbine Building - 168 - - - - - 25 193 193 - - - - - - - - 2,806 - 4a.1.4.8 Fuel Building - 102 - - - - - 15 117 117 - - - - - - - - 1,250 - 4a.1.4 Totals - 1,462 - - - - - 219 1,682 1,682 - - - - - - - - 18,679 -
Disposal of Plant Systems4a.1.5.1 Auxiliary Steam (shared) - 286 - - - - - 43 329 - - 329 - - - - - - 8,509 - 4a.1.5.2 Auxiliary Steam (shared) RCA - 114 2 4 124 - - 48 292 292 - - 1,242 - - - - 50,422 2,420 - 4a.1.5.3 Carbon Dioxide (shared) - 5 - - - - - 1 5 - - 5 - - - - - - 139 - 4a.1.5.4 Carbon Dioxide (shared) RCA - 13 0 0 13 - - 5 32 32 - - 131 - - - - 5,337 274 - 4a.1.5.5 Chemical Addition - 29 - - - - - 4 33 - - 33 - - - - - - 821 - 4a.1.5.6 Chemical Addition RCA - 25 0 1 22 - - 10 57 57 - - 222 - - - - 9,016 510 - 4a.1.5.7 Chilled Water (shared) - 142 - - - - - 21 163 - - 163 - - - - - - 4,175 - 4a.1.5.8 Condensate - 557 - - - - - 84 640 - - 640 - - - - - - 15,699 - 4a.1.5.9 Condensate (Contaminated) - 564 47 88 3,035 - - 614 4,349 4,349 - - 30,383 - - - - 1,233,881 13,824 - 4a.1.5.10 Condenser Circulating Water - 355 - - - - - 53 408 - - 408 - - - - - - 10,040 - 4a.1.5.11 Demineralized Water (shared) - 143 - - - - - 21 164 - - 164 - - - - - - 4,267 - 4a.1.5.12 Demineralized Water (shared) RCA - 88 1 2 81 - - 35 207 207 - - 808 - - - - 32,815 1,821 - 4a.1.5.13 Diesel Air (shared) - 45 - - - - - 7 52 - - 52 - - - - - - 1,367 - 4a.1.5.14 Diesel Jacket Water (shared) - 4 - - - - - 1 4 - - 4 - - - - - - 96 - 4a.1.5.15 Diesel Lube Oil (shared) - 12 - - - - - 2 14 - - 14 - - - - - - 346 - 4a.1.5.16 Electro Hydraulic Turbine Control - 19 - - - - - 3 21 - - 21 - - - - - - 499 - 4a.1.5.17 Equipment Cooling (shared) - 94 - - - - - 14 108 - - 108 - - - - - - 2,728 - 4a.1.5.18 Essential Siphon Vacuum (shared) - 89 - - - - - 13 102 - - 102 - - - - - - 2,549 - 4a.1.5.19 Feedwater & Emergency Feedwater - 172 - - - - - 26 197 - - 197 - - - - - - 4,862 - 4a.1.5.20 Feedwater & Emergency Feedwater (Cont.) - 160 8 14 487 - - 116 784 784 - - 4,873 - - - - 197,906 3,878 - 4a.1.5.21 Feedwater & Emergency Feedwater RCA - 262 8 14 481 - - 140 905 905 - - 4,815 - - - - 195,560 5,622 - 4a.1.5.22 Filtered Water (shared) - 104 - - - - - 16 120 - - 120 - - - - - - 2,925 - 4a.1.5.23 Filtered Water (shared) RCA - 80 2 3 97 - - 35 217 217 - - 975 - - - - 39,590 1,723 - 4a.1.5.24 Heater Drains - 1,454 64 120 4,137 - - 1,008 6,784 6,784 - - 41,409 - - - - 1,681,649 34,373 - 4a.1.5.25 Heater Drains (Contaminated) - 85 - - - - - 13 97 - - 97 - - - - - - 2,239 - 4a.1.5.26 Heater Vent - 33 - - - - - 5 38 - - 38 - - - - - - 1,002 - 4a.1.5.27 High Pressure Extraction - 25 - - - - - 4 29 - - 29 - - - - - - 729 - 4a.1.5.28 High Pressure Service Water (shared) - 107 - - - - - 16 123 - - 123 - - - - - - 3,016 - 4a.1.5.29 Hydraulic Oil - 2 - - - - - 0 3 - - 3 - - - - - - 75 - 4a.1.5.30 Hydrogen - 29 - - - - - 4 34 - - 34 - - - - - - 848 - 4a.1.5.31 Hydrogen Seal Oil - 31 - - - - - 5 35 - - 35 - - - - - - 899 - 4a.1.5.32 Keowee Decompressing Air (shared) - 5 - - - - - 1 6 - - 6 - - - - - - 153 - 4a.1.5.33 Low Pressure Extraction - 37 - - - - - 6 43 - - 43 - - - - - - 1,096 - 4a.1.5.34 Low Pressure Service Water (shared) - 320 - - - - - 48 368 - - 368 - - - - - - 9,404 - 4a.1.5.35 Main Steam - 89 - - - - - 13 102 - - 102 - - - - - - 2,558 - 4a.1.5.36 Main Steam RCA - 326 45 80 2,778 - - 515 3,744 3,744 - - 27,808 - - - - 1,129,284 7,747 - 4a.1.5.37 Nitrogen (shared) - 50 - - - - - 8 58 - - 58 - - - - - - 1,501 - 4a.1.5.38 Nitrogen (shared) RCA - 75 1 2 53 - - 27 158 158 - - 534 - - - - 21,704 1,492 - 4a.1.5.39 Periodic Testing (shared) - 14 - - - - - 2 17 - - 17 - - - - - - 429 - 4a.1.5.40 Plant Heating Steam (shared) - 227 - - - - - 34 261 - - 261 - - - - - - 6,722 - 4a.1.5.41 Post Accident Monitoring - 30 1 1 40 - - 14 85 85 - - 401 - - - - 16,304 785 - 4a.1.5.42 Protected Water System (shared) - 51 - - - - - 8 59 - - 59 - - - - - - 1,366 - 4a.1.5.43 Reactor Building Spray - 95 3 6 210 - - 56 371 371 - - 2,105 - - - - 85,488 2,170 - 4a.1.5.44 Recirc Cooling Water - 192 - - - - - 29 221 - - 221 - - - - - - 5,547 - 4a.1.5.45 Recirc Cooling Water RCA - 135 3 5 173 - - 61 376 376 - - 1,727 - - - - 70,146 2,938 - 4a.1.5.46 Sample Monitoring - 105 11 12 49 105 - 62 343 343 - - 489 443 - - - 49,133 2,802 - 4a.1.5.47 Second Side Cool Trtment Pond (shared) - 39 - - - - - 6 45 - - 45 - - - - - - 1,108 - 4a.1.5.48 Service Air (shared) - 42 - - - - - 6 48 - - 48 - - - - - - 1,254 - 4a.1.5.49 Standby Shutdown Facility (shared) - 28 - - - - - 4 32 - - 32 - - - - - - 841 - 4a.1.5.50 Stator Coolant - 51 - - - - - 8 59 - - 59 - - - - - - 1,507 - 4a.1.5.51 Steam Drain - 86 - - - - - 13 99 - - 99 - - - - - - 2,668 -
TLG Services, Inc.
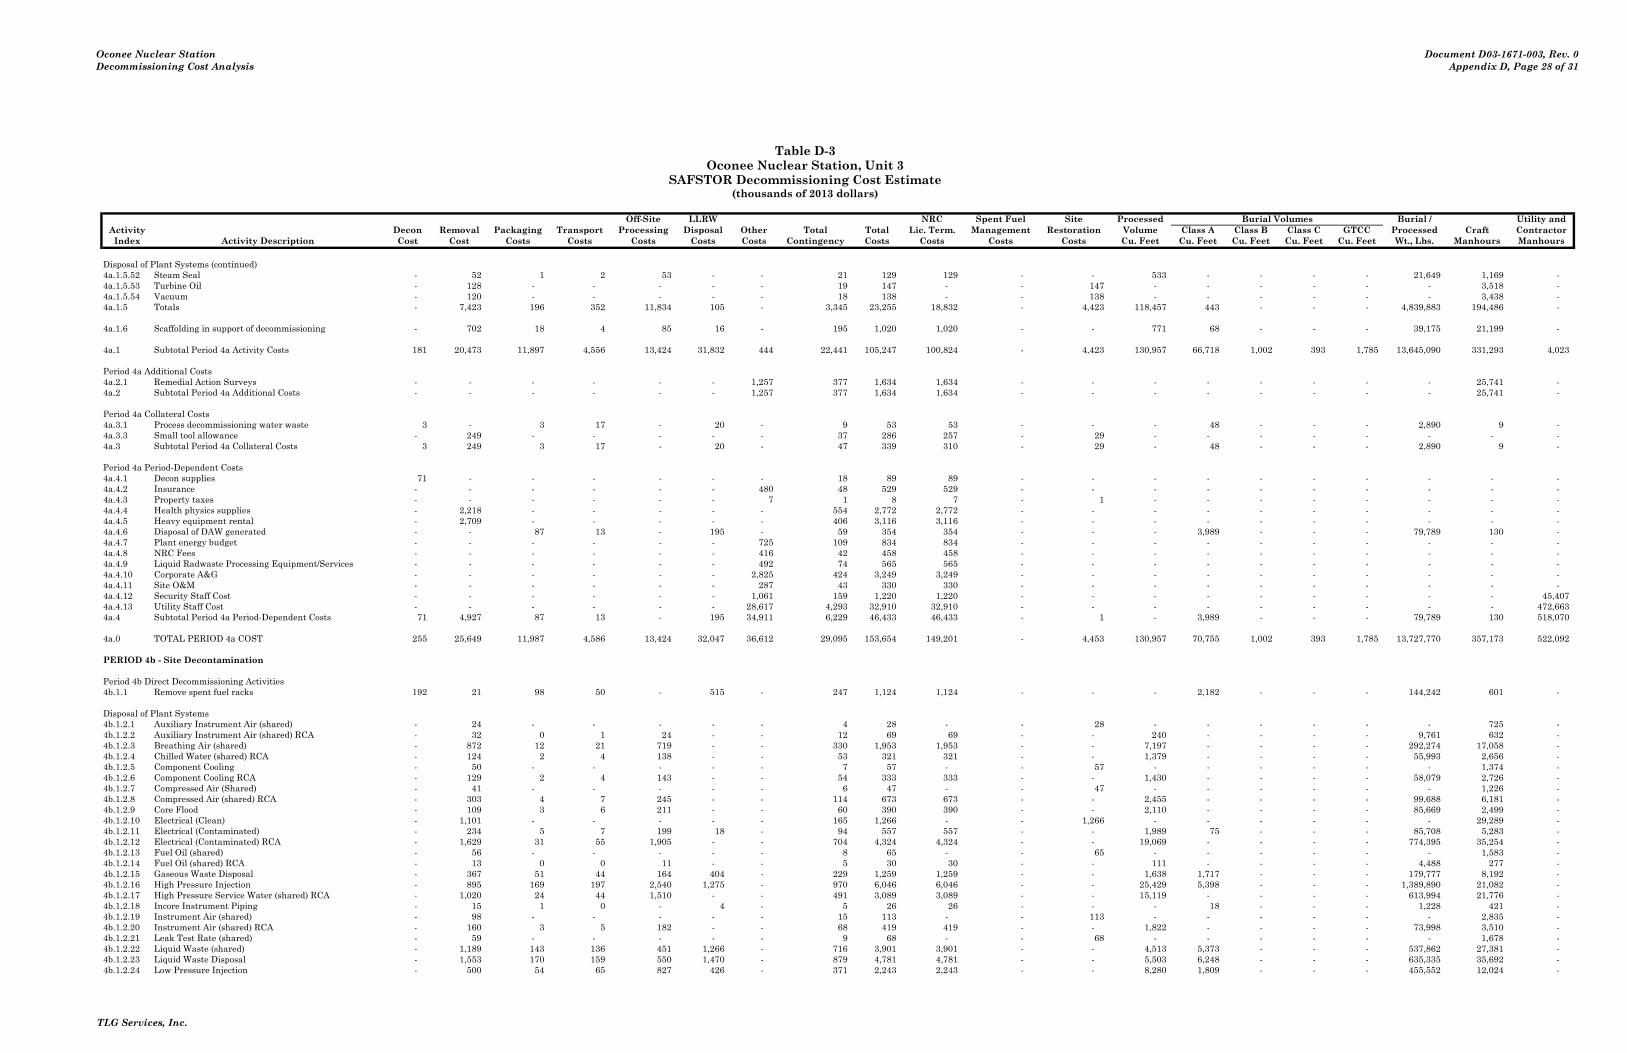
Oconee Nuclear StationDecommissioning Cost Analysis
Document D03-1671-003, Rev. 0 Appendix D, Page 28 of 31
Table D-3Oconee Nuclear Station, Unit 3
SAFSTOR Decommissioning Cost Estimate(thousands of 2013 dollars)
Costs run: Sun, Dec 1, 2013 at 13:27:10 Off-Site LLRW NRC Spent Fuel Site Processed Burial Volumes Burial / Utility andActivity DECCER Version 2010.09.09i Decon Removal Packaging Transport Processing Disposal Other Total Total Lic. Term. Management Restoration Volume Class A Class B Class C GTCC Processed Craft ContractorIndex Activity Description Cost Cost Costs Costs Costs Costs Costs Contingency Costs Costs Costs Costs Cu. Feet Cu. Feet Cu. Feet Cu. Feet Cu. Feet Wt., Lbs. Manhours Manhours
Disposal of Plant Systems (continued)4a.1.5.52 Steam Seal - 52 1 2 53 - - 21 129 129 - - 533 - - - - 21,649 1,169 - 4a.1.5.53 Turbine Oil - 128 - - - - - 19 147 - - 147 - - - - - - 3,518 - 4a.1.5.54 Vacuum - 120 - - - - - 18 138 - - 138 - - - - - - 3,438 - 4a.1.5 Totals - 7,423 196 352 11,834 105 - 3,345 23,255 18,832 - 4,423 118,457 443 - - - 4,839,883 194,486 -
4a.1.6 Scaffolding in support of decommissioning - 702 18 4 85 16 - 195 1,020 1,020 - - 771 68 - - - 39,175 21,199 -
4a.1 Subtotal Period 4a Activity Costs 181 20,473 11,897 4,556 13,424 31,832 444 22,441 105,247 100,824 - 4,423 130,957 66,718 1,002 393 1,785 13,645,090 331,293 4,023
Period 4a Additional Costs4a.2.1 Remedial Action Surveys - - - - - - 1,257 377 1,634 1,634 - - - - - - - - 25,741 - 4a.2 Subtotal Period 4a Additional Costs - - - - - - 1,257 377 1,634 1,634 - - - - - - - - 25,741 -
Period 4a Collateral Costs4a.3.1 Process decommissioning water waste 3 - 3 17 - 20 - 9 53 53 - - - 48 - - - 2,890 9 - 4a.3.3 Small tool allowance - 249 - - - - - 37 286 257 - 29 - - - - - - - - 4a.3 Subtotal Period 4a Collateral Costs 3 249 3 17 - 20 - 47 339 310 - 29 - 48 - - - 2,890 9 -
Period 4a Period-Dependent Costs4a.4.1 Decon supplies 71 - - - - - - 18 89 89 - - - - - - - - - - 4a.4.2 Insurance - - - - - - 480 48 529 529 - - - - - - - - - - 4a.4.3 Property taxes - - - - - - 7 1 8 7 - 1 - - - - - - - - 4a.4.4 Health physics supplies - 2,218 - - - - - 554 2,772 2,772 - - - - - - - - - - 4a.4.5 Heavy equipment rental - 2,709 - - - - - 406 3,116 3,116 - - - - - - - - - - 4a.4.6 Disposal of DAW generated - - 87 13 - 195 - 59 354 354 - - - 3,989 - - - 79,789 130 - 4a.4.7 Plant energy budget - - - - - - 725 109 834 834 - - - - - - - - - - 4a.4.8 NRC Fees - - - - - - 416 42 458 458 - - - - - - - - - - 4a.4.9 Liquid Radwaste Processing Equipment/Services - - - - - - 492 74 565 565 - - - - - - - - - - 4a.4.10 Corporate A&G - - - - - - 2,825 424 3,249 3,249 - - - - - - - - - - 4a.4.11 Site O&M - - - - - - 287 43 330 330 - - - - - - - - - - 4a.4.12 Security Staff Cost - - - - - - 1,061 159 1,220 1,220 - - - - - - - - - 45,407 4a.4.13 Utility Staff Cost - - - - - - 28,617 4,293 32,910 32,910 - - - - - - - - - 472,663 4a.4 Subtotal Period 4a Period-Dependent Costs 71 4,927 87 13 - 195 34,911 6,229 46,433 46,433 - 1 - 3,989 - - - 79,789 130 518,070
4a.0 TOTAL PERIOD 4a COST 255 25,649 11,987 4,586 13,424 32,047 36,612 29,095 153,654 149,201 - 4,453 130,957 70,755 1,002 393 1,785 13,727,770 357,173 522,092
PERIOD 4b - Site Decontamination
Period 4b Direct Decommissioning Activities4b.1.1 Remove spent fuel racks 192 21 98 50 - 515 - 247 1,124 1,124 - - - 2,182 - - - 144,242 601 -
Disposal of Plant Systems4b.1.2.1 Auxiliary Instrument Air (shared) - 24 - - - - - 4 28 - - 28 - - - - - - 725 - 4b.1.2.2 Auxiliary Instrument Air (shared) RCA - 32 0 1 24 - - 12 69 69 - - 240 - - - - 9,761 632 - 4b.1.2.3 Breathing Air (shared) - 872 12 21 719 - - 330 1,953 1,953 - - 7,197 - - - - 292,274 17,058 - 4b.1.2.4 Chilled Water (shared) RCA - 124 2 4 138 - - 53 321 321 - - 1,379 - - - - 55,993 2,656 - 4b.1.2.5 Component Cooling - 50 - - - - - 7 57 - - 57 - - - - - - 1,374 - 4b.1.2.6 Component Cooling RCA - 129 2 4 143 - - 54 333 333 - - 1,430 - - - - 58,079 2,726 - 4b.1.2.7 Compressed Air (Shared) - 41 - - - - - 6 47 - - 47 - - - - - - 1,226 - 4b.1.2.8 Compressed Air (shared) RCA - 303 4 7 245 - - 114 673 673 - - 2,455 - - - - 99,688 6,181 - 4b.1.2.9 Core Flood - 109 3 6 211 - - 60 390 390 - - 2,110 - - - - 85,669 2,499 - 4b.1.2.10 Electrical (Clean) - 1,101 - - - - - 165 1,266 - - 1,266 - - - - - - 29,289 - 4b.1.2.11 Electrical (Contaminated) - 234 5 7 199 18 - 94 557 557 - - 1,989 75 - - - 85,708 5,283 - 4b.1.2.12 Electrical (Contaminated) RCA - 1,629 31 55 1,905 - - 704 4,324 4,324 - - 19,069 - - - - 774,395 35,254 - 4b.1.2.13 Fuel Oil (shared) - 56 - - - - - 8 65 - - 65 - - - - - - 1,583 - 4b.1.2.14 Fuel Oil (shared) RCA - 13 0 0 11 - - 5 30 30 - - 111 - - - - 4,488 277 - 4b.1.2.15 Gaseous Waste Disposal - 367 51 44 164 404 - 229 1,259 1,259 - - 1,638 1,717 - - - 179,777 8,192 - 4b.1.2.16 High Pressure Injection - 895 169 197 2,540 1,275 - 970 6,046 6,046 - - 25,429 5,398 - - - 1,389,890 21,082 - 4b.1.2.17 High Pressure Service Water (shared) RCA - 1,020 24 44 1,510 - - 491 3,089 3,089 - - 15,119 - - - - 613,994 21,776 - 4b.1.2.18 Incore Instrument Piping - 15 1 0 - 4 - 5 26 26 - - - 18 - - - 1,228 421 - 4b.1.2.19 Instrument Air (shared) - 98 - - - - - 15 113 - - 113 - - - - - - 2,835 - 4b.1.2.20 Instrument Air (shared) RCA - 160 3 5 182 - - 68 419 419 - - 1,822 - - - - 73,998 3,510 - 4b.1.2.21 Leak Test Rate (shared) - 59 - - - - - 9 68 - - 68 - - - - - - 1,678 - 4b.1.2.22 Liquid Waste (shared) - 1,189 143 136 451 1,266 - 716 3,901 3,901 - - 4,513 5,373 - - - 537,862 27,381 - 4b.1.2.23 Liquid Waste Disposal - 1,553 170 159 550 1,470 - 879 4,781 4,781 - - 5,503 6,248 - - - 635,335 35,692 - 4b.1.2.24 Low Pressure Injection - 500 54 65 827 426 - 371 2,243 2,243 - - 8,280 1,809 - - - 455,552 12,024 -
TLG Services, Inc.

Oconee Nuclear StationDecommissioning Cost Analysis
Document D03-1671-003, Rev. 0 Appendix D, Page 29 of 31
Table D-3Oconee Nuclear Station, Unit 3
SAFSTOR Decommissioning Cost Estimate(thousands of 2013 dollars)
Costs run: Sun, Dec 1, 2013 at 13:27:10 Off-Site LLRW NRC Spent Fuel Site Processed Burial Volumes Burial / Utility andActivity DECCER Version 2010.09.09i Decon Removal Packaging Transport Processing Disposal Other Total Total Lic. Term. Management Restoration Volume Class A Class B Class C GTCC Processed Craft ContractorIndex Activity Description Cost Cost Costs Costs Costs Costs Costs Contingency Costs Costs Costs Costs Cu. Feet Cu. Feet Cu. Feet Cu. Feet Cu. Feet Wt., Lbs. Manhours Manhours
Disposal of Plant Systems (continued)4b.1.2.25 Low Pressure Service Water (shared) RCA - 1,507 40 73 2,520 - - 770 4,911 4,911 - - 25,228 - - - - 1,024,540 32,558 - 4b.1.2.26 On-Site/Off-Site Power - 98 - - - - - 15 112 - - 112 - - - - - - 2,517 - 4b.1.2.27 Plant Drinking Water (shared) - 140 - - - - - 21 161 - - 161 - - - - - - 4,204 - 4b.1.2.28 Plant Heating Steam (shared) RCA - 122 2 3 100 - - 46 273 273 - - 1,005 - - - - 40,799 2,528 - 4b.1.2.29 Purge - 162 8 14 484 - - 116 783 783 - - 4,842 - - - - 196,641 3,632 - 4b.1.2.30 RFS Refueling Water - 47 1 2 56 - - 20 126 126 - - 562 - - - - 22,826 1,017 - 4b.1.2.31 Radiation Instrument Alarm - 12 - - - - - 2 13 - - 13 - - - - - - 323 - 4b.1.2.32 Radiation Instrument Alarm RCA - 29 0 0 6 - - 8 44 44 - - 63 - - - - 2,565 788 - 4b.1.2.33 Reactor Building Cooling - 362 30 54 1,873 - - 383 2,701 2,701 - - 18,745 - - - - 761,247 8,761 - 4b.1.2.34 Reactor Coolant - 231 27 20 72 186 - 121 656 656 - - 723 783 - - - 81,371 5,766 - 4b.1.2.35 Reactor Coolant Storage - 493 60 64 384 539 - 331 1,872 1,872 - - 3,848 2,309 - - - 307,351 11,619 - 4b.1.2.36 Reactor Coolant Treatment (shared) - 156 19 16 71 144 - 90 495 495 - - 709 611 - - - 69,008 3,463 - 4b.1.2.37 Resin Recovery (shared) - 537 71 76 372 675 - 377 2,109 2,109 - - 3,720 2,880 - - - 340,242 12,717 - 4b.1.2.38 Sanitary Waste (shared) - 73 - - - - - 11 84 - - 84 - - - - - - 2,135 - 4b.1.2.39 Sanitary Waste (shared) RCA - 37 1 1 32 - - 14 84 84 - - 320 - - - - 12,994 781 - 4b.1.2.40 Service Air (shared) RCA - 86 1 2 66 - - 32 187 187 - - 662 - - - - 26,884 1,672 - 4b.1.2.41 Solidification (shared) - 963 139 132 445 1,220 - 646 3,546 3,546 - - 4,455 5,173 - - - 522,785 21,887 - 4b.1.2.42 Spent Fuel Cooling - 503 55 65 559 497 - 349 2,028 2,028 - - 5,595 2,108 - - - 366,462 11,891 - 4b.1.2.43 Vehicle Fuel - 10 - - - - - 1 11 - - 11 - - - - - - 303 - 4b.1.2.44 Ventilation (clean) - 209 - - - - - 31 240 - - 240 - - - - - - 6,216 - 4b.1.2.45 Ventilation (clean) RCA - 194 6 11 369 - - 106 685 685 - - 3,694 - - - - 150,000 3,464 - 4b.1.2.46 Ventilation (contaminated) - 561 22 34 888 88 - 303 1,896 1,896 - - 8,891 371 - - - 385,590 11,672 - 4b.1.2 Totals - 17,103 1,155 1,323 18,117 8,213 - 9,163 55,074 52,808 - 2,266 181,346 34,873 - - - 9,664,996 391,269 -
4b.1.3 Scaffolding in support of decommissioning - 1,053 28 6 128 24 - 292 1,531 1,531 - - 1,156 102 - - - 58,763 31,798 -
Decontamination of Site Buildings4b.1.4.1 Reactor Building 734 723 32 283 465 499 - 788 3,523 3,523 - - 4,658 8,080 - - - 885,053 31,783 - 4b.1.4.2 Auxiliary Building 344 108 5 47 71 83 - 238 896 896 - - 707 1,358 - - - 145,407 10,324 - 4b.1.4.3 Contaminated Misc. Structures(common) 14 3 0 2 - 3 - 9 32 32 - - - 57 - - - 4,908 401 - 4b.1.4.4 Hot Machine Shop(common) 48 19 1 7 19 13 - 36 142 142 - - 187 197 - - - 24,435 1,527 - 4b.1.4.5 Interim Radwaste Building(common) 97 29 1 14 17 24 - 66 248 248 - - 169 392 - - - 40,478 2,888 - 4b.1.4.6 Radwaste Facility(common) 348 239 9 44 238 82 - 297 1,257 1,257 - - 2,386 1,147 - - - 193,952 13,191 - 4b.1.4.7 Retired Steam Gen Storage Fac.(common) 82 7 0 2 2 3 - 44 139 139 - - 18 52 - - - 5,247 2,107 - 4b.1.4.8 Turbine Building 216 21 1 9 - 15 - 118 380 380 - - - 260 - - - 22,500 5,648 - 4b.1.4.9 Fuel Building 242 266 4 8 129 18 - 213 879 879 - - 1,293 158 - - - 64,622 11,574 - 4b.1.4 Totals 2,124 1,416 53 414 941 739 - 1,810 7,497 7,497 - - 9,418 11,700 - - - 1,386,601 79,442 -
4b.1 Subtotal Period 4b Activity Costs 2,316 19,593 1,334 1,793 19,186 9,491 - 11,512 65,225 62,960 - 2,266 191,920 48,857 - - - 11,254,600 503,110 -
Period 4b Additional Costs4b.2.1 License Termination Survey Planning - - - - - - 553 166 719 719 - - - - - - - - - 4,160 4b.2.2 Containment Paint Remediation 79 - 9 14 - 105 - 69 275 275 - - - 452 - - - - 800 - 4b.2.3 Underground Services Excavation - 882 - - - - 508 209 1,599 - - 1,599 - - - - - - 10,000 - 4b.2.4 Pond Closures - - - - - - 1,068 160 1,228 - - 1,228 - - - - - - 2,572 - 4b.2.5 Remedial Action Surveys - - - - - - 1,513 454 1,967 1,967 - - - - - - - - 30,980 - 4b.2.6 RX Closure Head Disposal - 117 521 784 - 724 - 380 2,526 2,526 - - - 2,815 - - - 340,201 3,761 2,000 4b.2.7 Decommissioning of ISFSI - 479 9 1,663 - 3,093 2,756 2,000 10,000 10,000 - - - 44,708 - - - 6,580,725 25,919 11,049 4b.2 Subtotal Period 4b Additional Costs 79 1,478 539 2,462 - 3,921 6,398 3,437 18,314 15,487 - 2,827 - 47,974 - - - 6,920,926 74,033 17,209
Period 4b Collateral Costs4b.3.1 Process decommissioning water waste 9 - 10 51 - 59 - 28 156 156 - - - 142 - - - 8,501 28 - 4b.3.3 Small tool allowance - 352 - - - - - 53 405 405 - - - - - - - - - - 4b.3.4 Decommissioning Equipment Disposition - - 144 36 664 125 - 151 1,119 1,119 - - 6,000 529 - - - 304,968 88 - 4b.3 Subtotal Period 4b Collateral Costs 9 352 154 86 664 184 - 231 1,680 1,680 - - 6,000 671 - - - 313,469 116 -
Period 4b Period-Dependent Costs4b.4.1 Decon supplies 1,204 - - - - - - 301 1,505 1,505 - - - - - - - - - - 4b.4.2 Insurance - - - - - - 578 58 636 636 - - - - - - - - - - 4b.4.3 Property taxes - - - - - - 9 1 10 10 - - - - - - - - - - 4b.4.4 Health physics supplies - 3,263 - - - - - 816 4,078 4,078 - - - - - - - - - - 4b.4.5 Heavy equipment rental - 3,228 - - - - - 484 3,712 3,712 - - - - - - - - - - 4b.4.6 Disposal of DAW generated - - 157 23 - 351 - 107 637 637 - - - 7,186 - - - 143,723 234 - 4b.4.7 Plant energy budget - - - - - - 689 103 793 793 - - - - - - - - - - 4b.4.8 NRC Fees - - - - - - 501 50 551 551 - - - - - - - - - - 4b.4.9 Liquid Radwaste Processing Equipment/Services - - - - - - 592 89 681 681 - - - - - - - - - -
TLG Services, Inc.
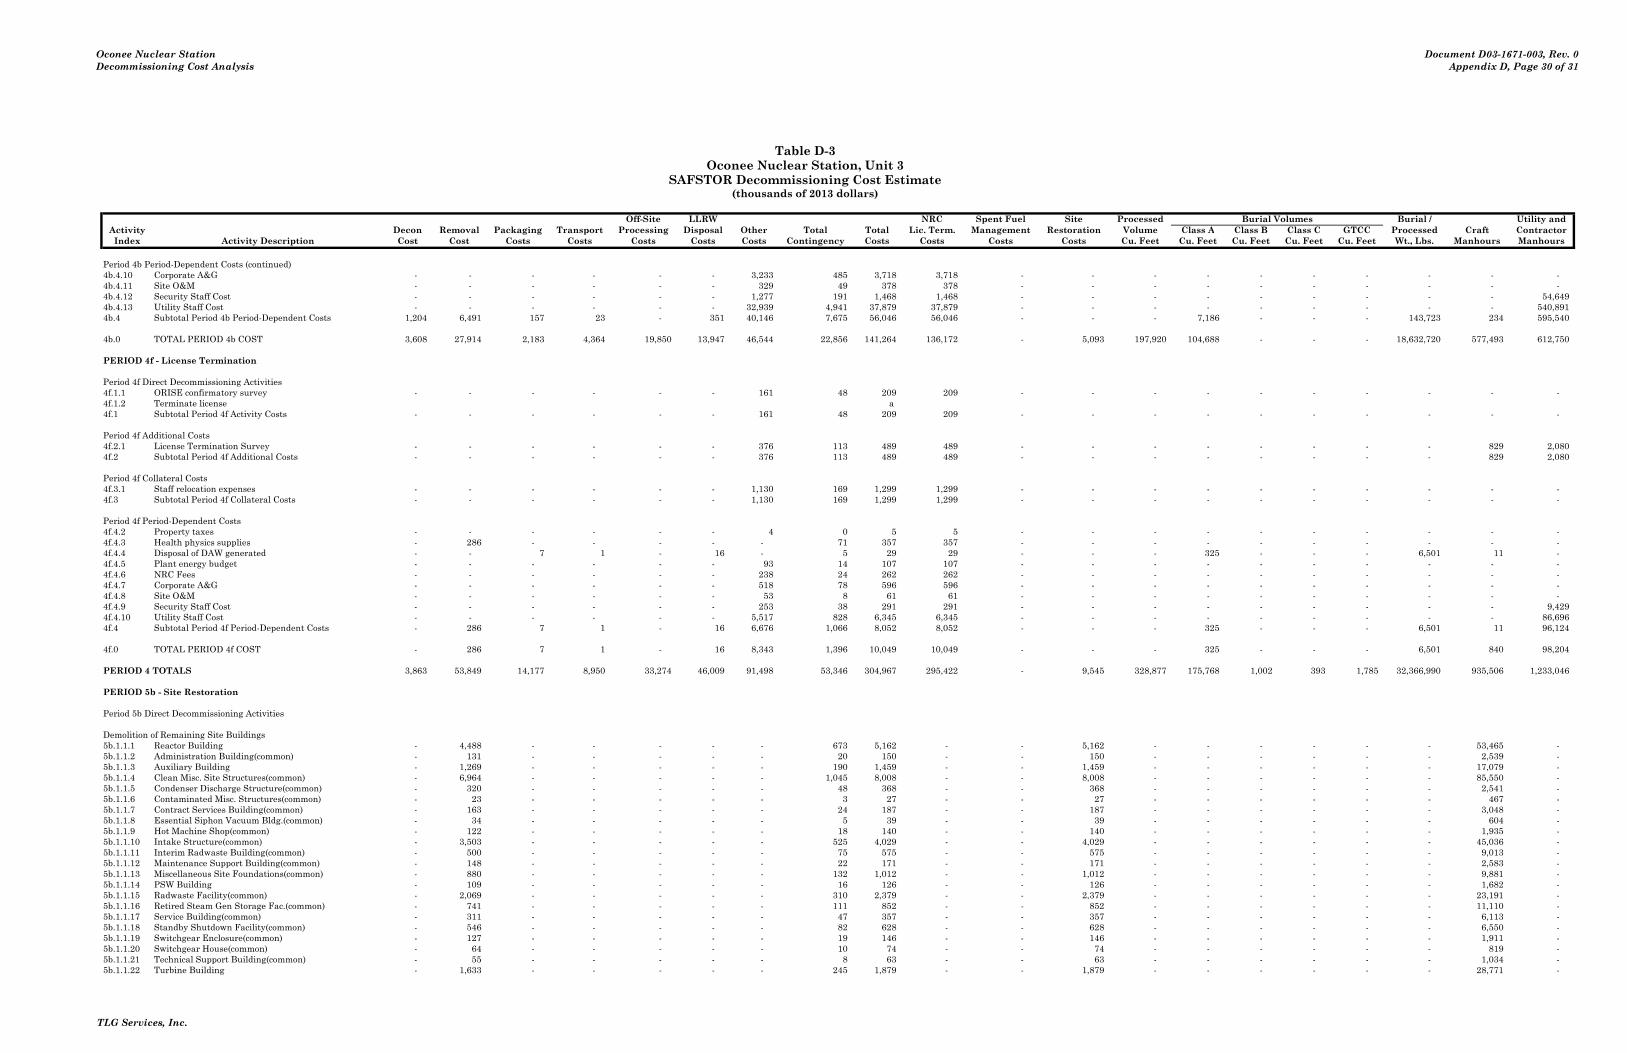
Oconee Nuclear StationDecommissioning Cost Analysis
Document D03-1671-003, Rev. 0 Appendix D, Page 30 of 31
Table D-3Oconee Nuclear Station, Unit 3
SAFSTOR Decommissioning Cost Estimate(thousands of 2013 dollars)
Costs run: Sun, Dec 1, 2013 at 13:27:10 Off-Site LLRW NRC Spent Fuel Site Processed Burial Volumes Burial / Utility andActivity DECCER Version 2010.09.09i Decon Removal Packaging Transport Processing Disposal Other Total Total Lic. Term. Management Restoration Volume Class A Class B Class C GTCC Processed Craft ContractorIndex Activity Description Cost Cost Costs Costs Costs Costs Costs Contingency Costs Costs Costs Costs Cu. Feet Cu. Feet Cu. Feet Cu. Feet Cu. Feet Wt., Lbs. Manhours Manhours
Period 4b Period-Dependent Costs (continued)4b.4.10 Corporate A&G - - - - - - 3,233 485 3,718 3,718 - - - - - - - - - - 4b.4.11 Site O&M - - - - - - 329 49 378 378 - - - - - - - - - - 4b.4.12 Security Staff Cost - - - - - - 1,277 191 1,468 1,468 - - - - - - - - - 54,649 4b.4.13 Utility Staff Cost - - - - - - 32,939 4,941 37,879 37,879 - - - - - - - - - 540,891 4b.4 Subtotal Period 4b Period-Dependent Costs 1,204 6,491 157 23 - 351 40,146 7,675 56,046 56,046 - - - 7,186 - - - 143,723 234 595,540
4b.0 TOTAL PERIOD 4b COST 3,608 27,914 2,183 4,364 19,850 13,947 46,544 22,856 141,264 136,172 - 5,093 197,920 104,688 - - - 18,632,720 577,493 612,750
PERIOD 4f - License Termination
Period 4f Direct Decommissioning Activities4f.1.1 ORISE confirmatory survey - - - - - - 161 48 209 209 - - - - - - - - - - 4f.1.2 Terminate license a 4f.1 Subtotal Period 4f Activity Costs - - - - - - 161 48 209 209 - - - - - - - - - -
Period 4f Additional Costs4f.2.1 License Termination Survey - - - - - - 376 113 489 489 - - - - - - - - 829 2,080 4f.2 Subtotal Period 4f Additional Costs - - - - - - 376 113 489 489 - - - - - - - - 829 2,080
Period 4f Collateral Costs4f.3.1 Staff relocation expenses - - - - - - 1,130 169 1,299 1,299 - - - - - - - - - - 4f.3 Subtotal Period 4f Collateral Costs - - - - - - 1,130 169 1,299 1,299 - - - - - - - - - -
Period 4f Period-Dependent Costs4f.4.2 Property taxes - - - - - - 4 0 5 5 - - - - - - - - - - 4f.4.3 Health physics supplies - 286 - - - - - 71 357 357 - - - - - - - - - - 4f.4.4 Disposal of DAW generated - - 7 1 - 16 - 5 29 29 - - - 325 - - - 6,501 11 - 4f.4.5 Plant energy budget - - - - - - 93 14 107 107 - - - - - - - - - - 4f.4.6 NRC Fees - - - - - - 238 24 262 262 - - - - - - - - - - 4f.4.7 Corporate A&G - - - - - - 518 78 596 596 - - - - - - - - - - 4f.4.8 Site O&M - - - - - - 53 8 61 61 - - - - - - - - - - 4f.4.9 Security Staff Cost - - - - - - 253 38 291 291 - - - - - - - - - 9,429 4f.4.10 Utility Staff Cost - - - - - - 5,517 828 6,345 6,345 - - - - - - - - - 86,696 4f.4 Subtotal Period 4f Period-Dependent Costs - 286 7 1 - 16 6,676 1,066 8,052 8,052 - - - 325 - - - 6,501 11 96,124
4f.0 TOTAL PERIOD 4f COST - 286 7 1 - 16 8,343 1,396 10,049 10,049 - - - 325 - - - 6,501 840 98,204
PERIOD 4 TOTALS 3,863 53,849 14,177 8,950 33,274 46,009 91,498 53,346 304,967 295,422 - 9,545 328,877 175,768 1,002 393 1,785 32,366,990 935,506 1,233,046
PERIOD 5b - Site Restoration
Period 5b Direct Decommissioning Activities
Demolition of Remaining Site Buildings5b.1.1.1 Reactor Building - 4,488 - - - - - 673 5,162 - - 5,162 - - - - - - 53,465 - 5b.1.1.2 Administration Building(common) - 131 - - - - - 20 150 - - 150 - - - - - - 2,539 - 5b.1.1.3 Auxiliary Building - 1,269 - - - - - 190 1,459 - - 1,459 - - - - - - 17,079 - 5b.1.1.4 Clean Misc. Site Structures(common) - 6,964 - - - - - 1,045 8,008 - - 8,008 - - - - - - 85,550 - 5b.1.1.5 Condenser Discharge Structure(common) - 320 - - - - - 48 368 - - 368 - - - - - - 2,541 - 5b.1.1.6 Contaminated Misc. Structures(common) - 23 - - - - - 3 27 - - 27 - - - - - - 467 - 5b.1.1.7 Contract Services Building(common) - 163 - - - - - 24 187 - - 187 - - - - - - 3,048 - 5b.1.1.8 Essential Siphon Vacuum Bldg.(common) - 34 - - - - - 5 39 - - 39 - - - - - - 604 - 5b.1.1.9 Hot Machine Shop(common) - 122 - - - - - 18 140 - - 140 - - - - - - 1,935 - 5b.1.1.10 Intake Structure(common) - 3,503 - - - - - 525 4,029 - - 4,029 - - - - - - 45,036 - 5b.1.1.11 Interim Radwaste Building(common) - 500 - - - - - 75 575 - - 575 - - - - - - 9,013 - 5b.1.1.12 Maintenance Support Building(common) - 148 - - - - - 22 171 - - 171 - - - - - - 2,583 - 5b.1.1.13 Miscellaneous Site Foundations(common) - 880 - - - - - 132 1,012 - - 1,012 - - - - - - 9,881 - 5b.1.1.14 PSW Building - 109 - - - - - 16 126 - - 126 - - - - - - 1,682 - 5b.1.1.15 Radwaste Facility(common) - 2,069 - - - - - 310 2,379 - - 2,379 - - - - - - 23,191 - 5b.1.1.16 Retired Steam Gen Storage Fac.(common) - 741 - - - - - 111 852 - - 852 - - - - - - 11,110 - 5b.1.1.17 Service Building(common) - 311 - - - - - 47 357 - - 357 - - - - - - 6,113 - 5b.1.1.18 Standby Shutdown Facility(common) - 546 - - - - - 82 628 - - 628 - - - - - - 6,550 - 5b.1.1.19 Switchgear Enclosure(common) - 127 - - - - - 19 146 - - 146 - - - - - - 1,911 - 5b.1.1.20 Switchgear House(common) - 64 - - - - - 10 74 - - 74 - - - - - - 819 - 5b.1.1.21 Technical Support Building(common) - 55 - - - - - 8 63 - - 63 - - - - - - 1,034 - 5b.1.1.22 Turbine Building - 1,633 - - - - - 245 1,879 - - 1,879 - - - - - - 28,771 -
TLG Services, Inc.

Oconee Nuclear StationDecommissioning Cost Analysis
Document D03-1671-003, Rev. 0 Appendix D, Page 31 of 31
Table D-3Oconee Nuclear Station, Unit 3
SAFSTOR Decommissioning Cost Estimate(thousands of 2013 dollars)
Costs run: Sun, Dec 1, 2013 at 13:27:10 Off-Site LLRW NRC Spent Fuel Site Processed Burial Volumes Burial / Utility andActivity DECCER Version 2010.09.09i Decon Removal Packaging Transport Processing Disposal Other Total Total Lic. Term. Management Restoration Volume Class A Class B Class C GTCC Processed Craft ContractorIndex Activity Description Cost Cost Costs Costs Costs Costs Costs Contingency Costs Costs Costs Costs Cu. Feet Cu. Feet Cu. Feet Cu. Feet Cu. Feet Wt., Lbs. Manhours Manhours
Demolition of Remaining Site Buildings (continued)5b.1.1.23 Turbine Pedestal - 461 - - - - - 69 530 - - 530 - - - - - - 5,015 - 5b.1.1.24 Fuel Building - 955 - - - - - 143 1,098 - - 1,098 - - - - - - 12,284 - 5b.1.1 Totals - 25,615 - - - - - 3,842 29,457 - - 29,457 - - - - - - 332,220 -
Site Closeout Activities5b.1.2 BackFill Site - 4,891 - - - - - 734 5,624 - - 5,624 - - - - - - 8,346 - 5b.1.3 Grade & landscape site - 107 - - - - - 16 123 - - 123 - - - - - - 297 - 5b.1.4 Final report to NRC - - - - - - 66 10 76 76 - - - - - - - - - 668 5b.1 Subtotal Period 5b Activity Costs - 30,612 - - - - 66 4,602 35,280 76 - 35,204 - - - - - - 340,862 668
Period 5b Additional Costs5b.2.1 Concrete Crushing - 892 - - - - 6 135 1,032 - - 1,032 - - - - - - 4,251 - 5b.2.2 Demolition of ISFSI - 1,812 - - - - 47 279 2,137 - - 2,137 - - - - - - 10,243 160 5b.2 Subtotal Period 5b Additional Costs - 2,703 - - - - 53 413 3,169 - - 3,169 - - - - - - 14,494 160
Period 5b Collateral Costs5b.3.1 Small tool allowance - 262 - - - - - 39 302 - - 302 - - - - - - - - 5b.3.2 Corporate A&G - - - - - - 979 147 1,125 - - 1,125 - - - - - - - - 5b.3.3 Site O&M - - - - - - 32 5 37 - - 37 - - - - - - - - 5b.3 Subtotal Period 5b Collateral Costs - 262 - - - - 1,011 191 1,464 - - 1,464 - - - - - - - -
Period 5b Period-Dependent Costs5b.4.2 Property taxes - - - - - - 14 1 15 - - 15 - - - - - - - - 5b.4.3 Heavy equipment rental - 7,180 - - - - - 1,077 8,257 - - 8,257 - - - - - - - - 5b.4.4 Plant energy budget - - - - - - 143 21 165 - - 165 - - - - - - - - 5b.4.5 Security Staff Cost - - - - - - 678 102 780 - - 780 - - - - - - - 23,377 5b.4.6 Utility Staff Cost - - - - - - 10,100 1,515 11,615 - - 11,615 - - - - - - - 163,737 5b.4 Subtotal Period 5b Period-Dependent Costs - 7,180 - - - - 10,934 2,716 20,830 - - 20,830 - - - - - - - 187,114
5b.0 TOTAL PERIOD 5b COST - 40,758 - - - - 12,063 7,923 60,744 76 - 60,668 - - - - - - 355,356 187,942
PERIOD 5 TOTALS - 40,758 - - - - 12,063 7,923 60,744 76 - 60,668 - - - - - - 355,356 187,942
TOTAL COST TO DECOMMISSION 9,394 108,548 14,500 10,061 33,274 51,664 356,867 104,510 688,818 536,114 80,584 72,120 328,877 228,499 1,002 393 1,785 33,437,400 1,410,617 4,295,576
TOTAL COST TO DECOMMISSION WITH 17.89% CONTINGENCY: $688,818 thousands of 2013 dollars
TOTAL NRC LICENSE TERMINATION COST IS 77.83% OR: $536,114 thousands of 2013 dollars
SPENT FUEL MANAGEMENT COST IS 11.7% OR: $80,584 thousands of 2013 dollars
NON-NUCLEAR DEMOLITION COST IS 10.47% OR: $72,120 thousands of 2013 dollars
TOTAL LOW-LEVEL RADIOACTIVE WASTE VOLUME BURIED (EXCLUDING GTCC): 229,894 cubic feet
TOTAL GREATER THAN CLASS C RADWASTE VOLUME GENERATED: 1,785 cubic feet
TOTAL SCRAP METAL REMOVED: 66,689 tons
TOTAL CRAFT LABOR REQUIREMENTS: 1,410,617 man-hours
End Notes:n/a - indicates that this activity not charged as decommissioning expense.a - indicates that this activity performed by decommissioning staff.0 - indicates that this value is less than 0.5 but is non-zero.a cell containing " - " indicates a zero value
TLG Services, Inc.
Oconee Nuclear Station Document D03-1671-003, Rev. 0 Decommissioning Cost Analysis Appendix E, Page 1 of 2
TLG Services, Inc.
APPENDIX E
ISFSI DECOMMISSIONING COST SUMMARY
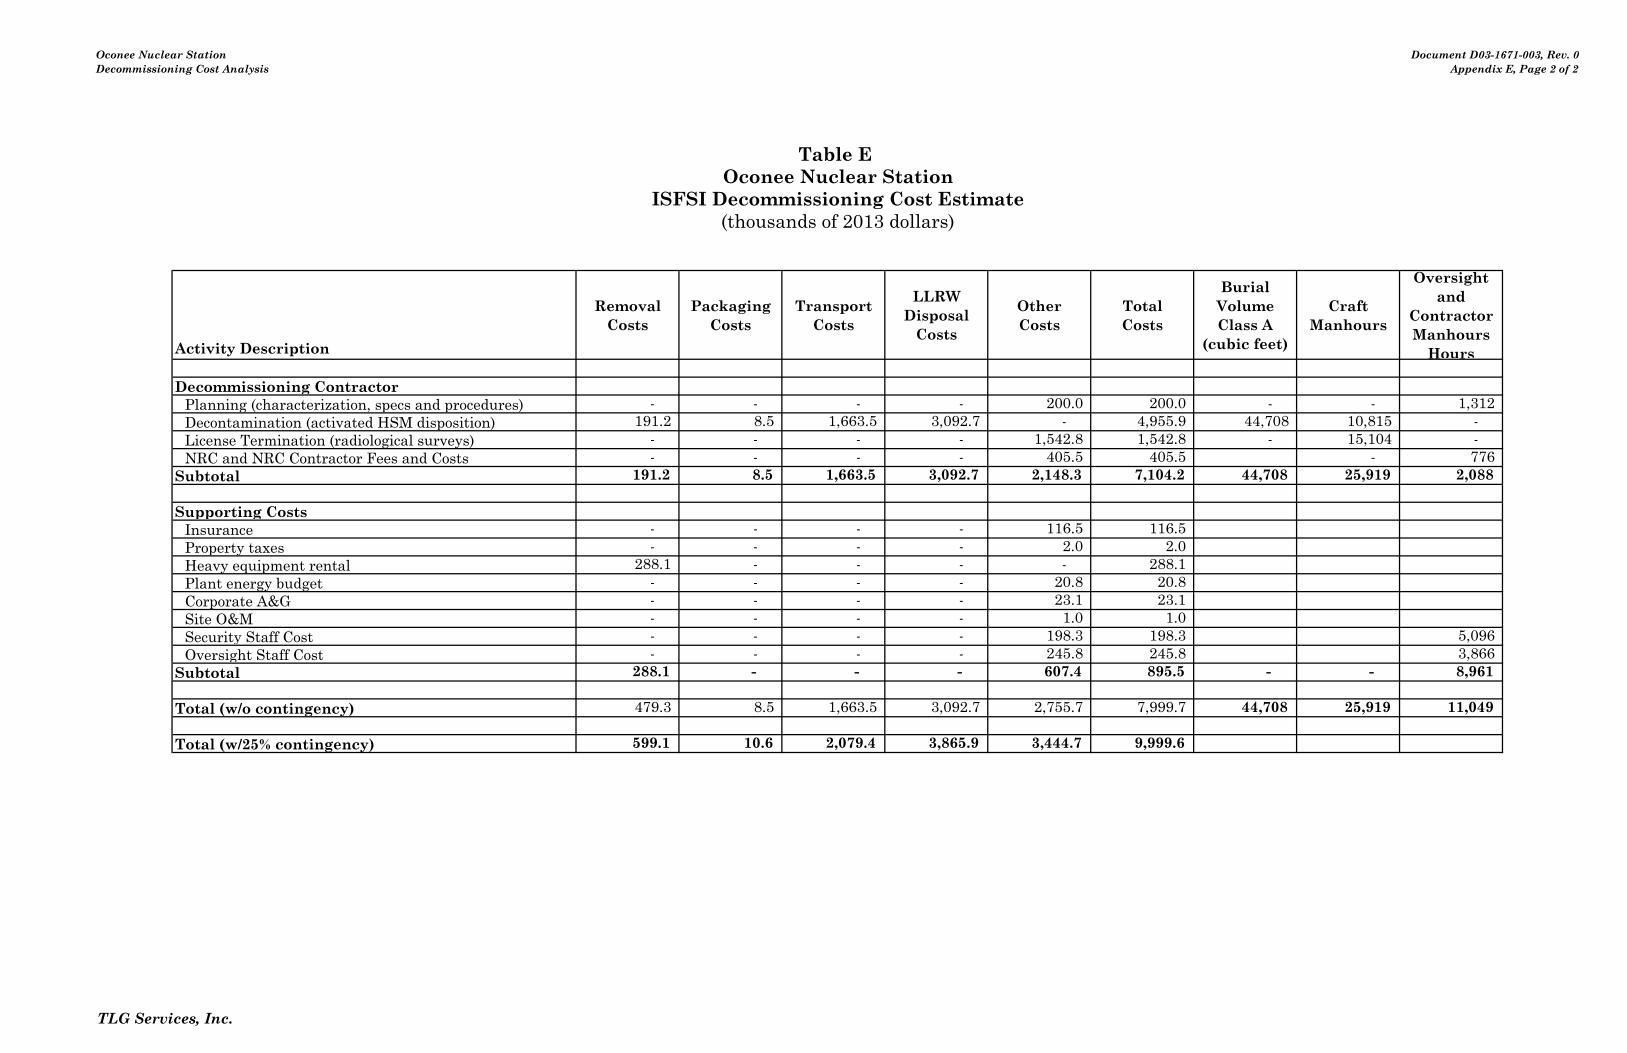
Oconee Nuclear StationDecommissioning Cost Analysis
Document D03-1671-003, Rev. 0Appendix E, Page 2 of 2
Activity Description
Removal Costs
Packaging Costs
Transport Costs
LLRW Disposal
Costs
Other Costs
Total Costs
Burial VolumeClass A
(cubic feet)
Craft Manhours
Oversight and
Contractor Manhours
Hours
Decommissioning ContractorPlanning (characterization, specs and procedures) - - - - 200.0 200.0 - - 1,312 Decontamination (activated HSM disposition) 191.2 8.5 1,663.5 3,092.7 - 4,955.9 44,708 10,815 - License Termination (radiological surveys) - - - - 1,542.8 1,542.8 - 15,104 - NRC and NRC Contractor Fees and Costs - - - - 405.5 405.5 - 776
Subtotal 191.2 8.5 1,663.5 3,092.7 2,148.3 7,104.2 44,708 25,919 2,088
Supporting CostsInsurance - - - - 116.5 116.5 Property taxes - - - - 2.0 2.0 Heavy equipment rental 288.1 - - - - 288.1 Plant energy budget - - - - 20.8 20.8 Corporate A&G - - - - 23.1 23.1 Site O&M - - - - 1.0 1.0 Security Staff Cost - - - - 198.3 198.3 5,096 Oversight Staff Cost - - - - 245.8 245.8 3,866
Subtotal 288.1 - - - 607.4 895.5 - - 8,961
Total (w/o contingency) 479.3 8.5 1,663.5 3,092.7 2,755.7 7,999.7 44,708 25,919 11,049
Total (w/25% contingency) 599.1 10.6 2,079.4 3,865.9 3,444.7 9,999.6
Table E Oconee Nuclear Station
ISFSI Decommissioning Cost Estimate(thousands of 2013 dollars)
TLG Services, Inc.