Decoding Movement States in Stepping Cycles based on ...€¦ · Decoding Movement States in...
15
Decoding Movement States in Stepping Cycles based on Subthalamic LFPs in Parkinsonian Patients Huiling Tan 1 , Petra Fischer 1 , Syed A Shah 1 , Diego Vidaurre 2 , Mark W. Woolrich 2 , and Peter Brown 1 1 MRC Brain Network Dynamics Unit and Nuffield Department of Clinical Neurosciences, University of Oxford, United Kingdom 2 Wellcome Centre for Integrative Neuroimaging, Oxford Centre for Human Brain Activity (OHBA), University of Oxford, United Kingdom Abstract Gait disturbances are a prominent feature of Parkinson’s disease (PD), often refractory to medication or continuous deep brain stimulation (DBS) on basal ganglia targets such as the subthalamic nucleus (STN). Here we sought to identify movement states during stepping cycles, such as left leg stance and right leg stance. To this end we analyzed local field potential (LFP) activity in STN using a combination of the multivariate autoregressive (MAR) model and the Hidden Markov model (HMM). Our results confirm that information is present in the STN related to movement states in stepping cycles, and that it is feasible to decode movement states based on STN LFPs recorded from DBS electrodes. This information can be used to implement temporally flexible stimulation strategies in order to facilitate patterns of neural modulation associated with better gait performance. I Introduction Many patients with Parkinson’s disease suffer from gait disturbances, which cause falls and strongly reduce patients’ quality of life. However, gait disturbances remain a major clinical challenge as they are often refractory to medication or continuous deep brain stimulation (DBS) of basal ganglia targets [1]. Previous EEG studies have shown that normal walking is associated with rhythmic modulation in beta/low gamma (20-35) and high gamma frequency (70-90 Hz) activities recorded over mesial sensorimotor cortex in healthy subjects [2, 3]. In a recent study, we observed modulation in the high beta frequency (20-30 Hz) activities in the subthalamic nucleus (STN) of Parkinsonian patients during stepping. In particular, the modulation was inverted in the left and right STNs, so that modulation was alternating in character [4]. These findings suggested that temporally patterned left-right alternating DBS may help facilitate beta modulation in STN during walking and might be a better treatment policy for gait disturbances than conventional continuous stimulation which attenuates beta activity throughout the whole gait cycle. However, locking such a DBS pattern to the gait cycle would require the accurate decoding of different movement states. The first aim of the (corresponding author: phone +44 (0) 1865 572483; [email protected]). Europe PMC Funders Group Author Manuscript Conf Proc IEEE Eng Med Biol Soc. Author manuscript; available in PMC 2018 December 03. Published in final edited form as: Conf Proc IEEE Eng Med Biol Soc. 2018 July ; 2018: 1384–1387. doi:10.1109/EMBC.2018.8512545. Europe PMC Funders Author Manuscripts Europe PMC Funders Author Manuscripts
Transcript of Decoding Movement States in Stepping Cycles based on ...€¦ · Decoding Movement States in...

Decoding Movement States in Stepping Cycles based on Subthalamic LFPs in Parkinsonian Patients
Huiling Tan1, Petra Fischer1, Syed A Shah1, Diego Vidaurre2, Mark W. Woolrich2, and Peter Brown1
1MRC Brain Network Dynamics Unit and Nuffield Department of Clinical Neurosciences, University of Oxford, United Kingdom
2Wellcome Centre for Integrative Neuroimaging, Oxford Centre for Human Brain Activity (OHBA), University of Oxford, United Kingdom
Abstract
Gait disturbances are a prominent feature of Parkinson’s disease (PD), often refractory to
medication or continuous deep brain stimulation (DBS) on basal ganglia targets such as the
subthalamic nucleus (STN). Here we sought to identify movement states during stepping cycles,
such as left leg stance and right leg stance. To this end we analyzed local field potential (LFP)
activity in STN using a combination of the multivariate autoregressive (MAR) model and the
Hidden Markov model (HMM). Our results confirm that information is present in the STN related
to movement states in stepping cycles, and that it is feasible to decode movement states based on
STN LFPs recorded from DBS electrodes. This information can be used to implement temporally
flexible stimulation strategies in order to facilitate patterns of neural modulation associated with
better gait performance.
I Introduction
Many patients with Parkinson’s disease suffer from gait disturbances, which cause falls and
strongly reduce patients’ quality of life. However, gait disturbances remain a major clinical
challenge as they are often refractory to medication or continuous deep brain stimulation
(DBS) of basal ganglia targets [1]. Previous EEG studies have shown that normal walking is
associated with rhythmic modulation in beta/low gamma (20-35) and high gamma frequency
(70-90 Hz) activities recorded over mesial sensorimotor cortex in healthy subjects [2, 3]. In a
recent study, we observed modulation in the high beta frequency (20-30 Hz) activities in the
subthalamic nucleus (STN) of Parkinsonian patients during stepping. In particular, the
modulation was inverted in the left and right STNs, so that modulation was alternating in
character [4]. These findings suggested that temporally patterned left-right alternating DBS
may help facilitate beta modulation in STN during walking and might be a better treatment
policy for gait disturbances than conventional continuous stimulation which attenuates beta
activity throughout the whole gait cycle. However, locking such a DBS pattern to the gait
cycle would require the accurate decoding of different movement states. The first aim of the
(corresponding author: phone +44 (0) 1865 572483; [email protected]).
Europe PMC Funders GroupAuthor ManuscriptConf Proc IEEE Eng Med Biol Soc. Author manuscript; available in PMC 2018 December 03.
Published in final edited form as:Conf Proc IEEE Eng Med Biol Soc. 2018 July ; 2018: 1384–1387. doi:10.1109/EMBC.2018.8512545.
Europe PM
C Funders A
uthor Manuscripts
Europe PM
C Funders A
uthor Manuscripts

current study is to investigate whether this can be achieved based on STN LFPs recorded
directly from DBS electrodes. If this proves to be the case, then temporally patterned DBS
synchronized to the gait cycle could eventually be implemented without additional external
sensors, and without additional power demands. The second aim of the current study is to
identify potential supplementary features in STN LFPs that might provide gait cycle-related
information, and which can shed further light on the neuronal population dynamics
associated with gait control in the basal ganglia.
II Methods
A Experimental Design & Recording
We recorded 16 Parkinson’s disease patients who had undergone bilateral implantation of
DBS electrodes in the STN. They were on their normal dopaminergic medication. The study
was approved by the local ethics committee and patients gave informed written consent
before the recording. For safety, patients were seated in a chair in front of a laptop, which
displayed a video of a walking cartoon man (see Fig.1A), which was looped after one
stepping cycle (i.e. one right and left step, separated by 1 second) such that the man was
walking in place. Two pressure sensors were placed on the floor under the feet of the
patients, such that they could comfortably reach the foot plates (Scythe, USB 3FS-2 foot
pedal or Biometrics Ltd ForcePlates). Patients were instructed to step onto the left- and
rightmost plate with their left and right foot, respectively, in synchrony with the footsteps of
the man in the video, while resting their arms on their lap. They were asked to synchronize
their steps with the steps in the video as precisely as possible. The duration of the video
shown in each run was 42 seconds and it thus contained 21 left and 21 right heel strikes.
Four runs were recorded in each patient with no additional manipulation of experimental
conditions. A TMSi Porti amplifier (2048 Hz sampling rate, common average reference,
TMS International, Netherlands) was used to record monopolar LFPs and the timing of the
heel strikes via the pressure sensors. More details of the paradigm and patient details are
presented in [4].
B Preprocessing
All analyses were performed in MATLAB (v. 2016a, The MathWorks Inc., Natick,
Massachusetts). The data were re-referenced offline to obtain more spatially focal bipolar
signals by subtracting the data from neighbouring electrode contacts. The data were band-
pass filtered between 2 Hz and 95 Hz (Butterworth filter, filter order = 6, passed forwards
and backwards) and down-sampled to 200 Hz. Time-frequency decomposition was obtained
on each bipolar channel by applying continuous Morlet wavelet transforms with a linear
frequency scale ranging from 3 Hz to 95 Hz and constant number (= 6) of cycles across all
calculated frequencies. Relative power was then calculated for each frequency by
normalizing the absolute power by its average across time for each channel: (power –
average power) / average power * 100. Average stepping related modulation in the power
spectra was calculated for each bipolar channel by taking the average of each 2s epoch
aligned to the contralateral heel strike. In order to minimize movement artefact in the
recorded LFP data, bipolar channels that were contaminated with artefacts resulting from
cable movement during stepping, and those with a broadband power peak locked to the heel-
Tan et al. Page 2
Conf Proc IEEE Eng Med Biol Soc. Author manuscript; available in PMC 2018 December 03.
Europe PM
C Funders A
uthor Manuscripts
Europe PM
C Funders A
uthor Manuscripts

strike were discarded from further analysis. This procedure resulted in 12 patients with
bipolar LFP recordings from both STNs. In addition, individual trials with movement
artefacts were also excluded following visual inspection. The bipolar channel in each STN
with the highest modulation in the 15-35 Hz (max-min within the [-0.5 s, 1.5 s] window
aligned to the contralateral heel strike) was selected for further processing.
C Labelling of movement states in stepping
The study aims to discriminate and characterize four movement states during a stepping
cycle (Fig 1B): State 1/3 = right/left heel strike while the other foot lifting up; State 2/4 =
right/left foot stance while the other foot swinging. The timing of each heel strike was
recorded through the foot pedal or the force plates. These timings were used to quantify the
phase of the step cycle ranging from –pi to pi, where the right heel strike was set as ±pi, the
left heel strike was set as 0, and the phase of each time point between the heel strikes was
calculated through linear interpolation. Then the time points with phase ≤ -7/8*pi or ≥
7/8*pi were labeled as State 1 (right heel strike). Time points with phase ranging between
[-6/8*pi, -2/8*pi], [-pi/8, pi/8], [2/8*pi, 6/8*pi] were labeled as State 2 (right foot stance), 3
(left heel strike) and 4 (left foot stance), respectively (Fig. 2). We acknowledge that the
choice of the phase ranges for state labelling is subjective, we will consider a data-driven
labeling procedure in future work.
D HMM-MAR modelling and configuration
In this work, we used the HMM-MAR, a method combining the multivariate autoregressive
(MAR) model and the Hidden Markov model (HMM) [5], to identify movement states and
to characterize those states by the neural dynamics in the left and right STNs during
stepping. The MAR model characterizes the behavior of time series by linear historical
interactions between input time series (Equation 1), where yt is a vector indicating the tth
sample of the input time series, m is the model order number, A(i) is the coefficient matrix at
lag i and ε is Gaussian noise:
yt = ∑i = 1m yt − i ⋅ A i + ε (1)
The Hidden Markov model (HMM) is a mathematical formalism that describes a time series
as a sequence of hidden states, where each state has its own model of the observed data (i.e.,
the observation model). In HMM-MAR, each state is related to a different set of MAR
coefficients (A and, potentially, ε). Thus, the states correspond to unique patterns of brain
activity that recur in different parts of the time series (Figure 3).
Here, we focused on 8 out of the 12 patients in whom heel strike-related beta modulation
was higher than 5% in both STNs, and in whom at least 30 seconds of continuous artefact-
free data were recorded. Scripts in an open source Matlab toolbox provided by Vidaurre et al. [5] (https://github.com/OHBA-analysis/HMM-MAR) were used in this analysis. As a
result, we obtained an estimation of the MAR coefficients for each state, the state transition
probability matrix, and the state probability time course matrix indicating the probability of
each state best representing the data at each time point. The state probability matrix has the
Tan et al. Page 3
Conf Proc IEEE Eng Med Biol Soc. Author manuscript; available in PMC 2018 December 03.
Europe PM
C Funders A
uthor Manuscripts
Europe PM
C Funders A
uthor Manuscripts
dimension of RM*N with M the number of time points and N the number of states. Each row
of the matrix is the state probability vector for each time point indicating the probability of
each state being active at that time point (which sum up to 1).
We tested the decoding capacity of the HMM-MAR model using as inputs either the bipolar
LFP time series from both left and right STNs, or the time-series of estimated amplitude of
different frequency bands from both left and right STNs. When the time series of LFP
measurements were used as inputs for the HMM-MAR modelling, different states were
characterized by their unique spectral properties including phase relations between the
electrodes, which are stable within each state. In this case, the preprocessed LFPs were
down sampled to 200 Hz, and the maximal MAR model order was set to 15, which
corresponds to at least one cycle of oscillation at 13 Hz and above. When the time series of
the power amplitude of different frequency bands were used as inputs, covariations in the
power of different frequency bands were also taken into account in characterizing different
states. In this case, the amplitude of 5 distinct frequency bands was calculated using a
continuous wavelet transform; the chosen bands were theta/alpha (4-10 Hz), low beta (14-22
Hz), high beta (23-35 Hz), low gamma (36-45 Hz) and high gamma (55-90 Hz) bands.
These frequency features were first normalized (to zero mean and standard deviation of 1),
and then down-sampled to 20 Hz by temporally averaging within 100ms sliding windows
with a 50% overlap between consecutive windows. The maximal MAR model order was set
to 5, which takes into account power changes over a time window of 300 ms. The maximal
state number was initially set to 5 to allow for other transitional states not specified in Fig 2.
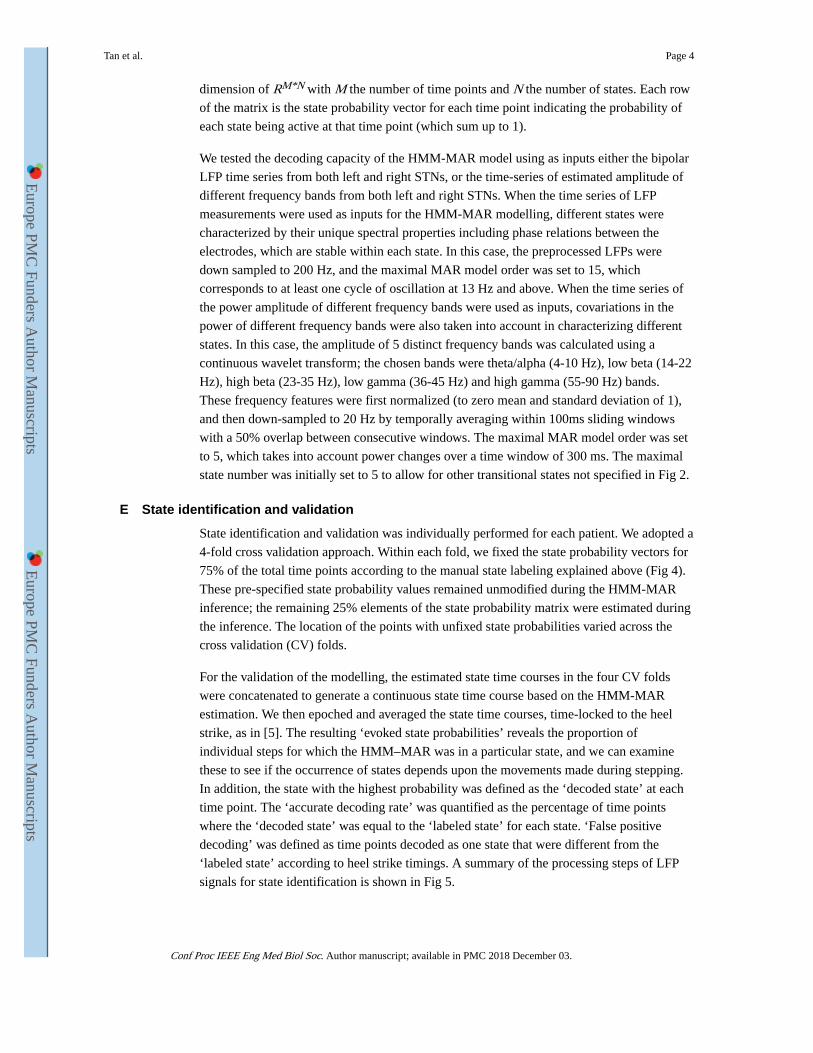
E State identification and validation
State identification and validation was individually performed for each patient. We adopted a
4-fold cross validation approach. Within each fold, we fixed the state probability vectors for
75% of the total time points according to the manual state labeling explained above (Fig 4).
These pre-specified state probability values remained unmodified during the HMM-MAR
inference; the remaining 25% elements of the state probability matrix were estimated during
the inference. The location of the points with unfixed state probabilities varied across the
cross validation (CV) folds.
For the validation of the modelling, the estimated state time courses in the four CV folds
were concatenated to generate a continuous state time course based on the HMM-MAR
estimation. We then epoched and averaged the state time courses, time-locked to the heel
strike, as in [5]. The resulting ‘evoked state probabilities’ reveals the proportion of
individual steps for which the HMM–MAR was in a particular state, and we can examine
these to see if the occurrence of states depends upon the movements made during stepping.
In addition, the state with the highest probability was defined as the ‘decoded state’ at each
time point. The ‘accurate decoding rate’ was quantified as the percentage of time points
where the ‘decoded state’ was equal to the ‘labeled state’ for each state. ‘False positive
decoding’ was defined as time points decoded as one state that were different from the
‘labeled state’ according to heel strike timings. A summary of the processing steps of LFP
signals for state identification is shown in Fig 5.
Tan et al. Page 4
Conf Proc IEEE Eng Med Biol Soc. Author manuscript; available in PMC 2018 December 03.
Europe PM
C Funders A
uthor Manuscripts
Europe PM
C Funders A
uthor Manuscripts

III Results
A Average STN LFP power modulation in stepping
The time-frequency plot averaged across all valid trials for one exemplar patient showed
modulation in LFPs in both STN aligned to the step cycle (Fig. 6). At the time of the heel
strike, when the opposite leg was lifted (State 1 and 3), beta activity (23-35 Hz in this
patient) decreased and high gamma activity (50-70 Hz in this patient) slightly increased.
Beta power was highest when the contralateral foot rested on the ground as shown by the
orange power increase in Fig. 6. This led to an opposite pattern of modulation in the beta
band in the two STNs, i.e. beta power was highest at different time points within a step cycle
for the left and right STN. Meanwhile, within each STN, beta power was low when gamma
power was high and vice versa. These observations are similar to those observed in STN
LFPs during hand gripping [6], and are also consistent with findings from EEG oscillations
recorded over central sensorimotor cortical areas [3].
B Identifying transient movement states based on STN LFPs in individual step cycles
Figure 7 shows the results of state time course estimation based on HMM-MAR in one
example patient, with pre-processed LFP time series (broad band pass filtered between 2 Hz
and 95 Hz) from both the left and right STN as model inputs. These plots show that with this
configuration, the HMM-MAR could identify states related to left and right foot stance
during stepping, but failed to identify the states capturing the heel strikes of either foot. If
the state with the largest probability was selected as the estimated state for each time point,
87.4% of the time points ‘labelled’ as State 2 were correctly decoded. 78.5% of the time
points ‘labelled’ as State 3 were correctly estimated to be in State 4. However, in this patient,
time points during heel strikes were also decoded as State 2, leading to a high false positive
decoding of 61% for State 2.
Figure 8 shows the HMM-MAR modelling results when the extracted frequency features
were used as model inputs for the same patient. With this configuration, the HMM-MAR
model was able to identify State 2 and 4 as well as a state related to heel strikes. ‘Accurate
decoding rate’ for State 2 was 81.3% with a ‘false positive detection rate’ of 27.5%, which
was reduced compared to the first configuration. ‘Accurate decoding rate’ for State 4 was
85.0% with a ‘false positive detection rate’ of 35.1%,
C Modelling results for all selected patients
Figure 9 shows the result of the HMM-MAR analysis individually on all 8 selected patients.
The maximal state number was set to 3 with both left and right heel strikes labelled to State
1. The methods produced state probabilities consistently modulated by stepping cycles in 5
out of 8 of the selected patients. The analysis also revealed considerable subject-to-subject
variability in the evoked state probabilities identified by the HMM-MAR.
IV Conclusion
Our study shows that there is information related to distinct movement states in a step cycle
present in the STN LFP. The results suggest a role of the basal ganglia in gait control with
Tan et al. Page 5
Conf Proc IEEE Eng Med Biol Soc. Author manuscript; available in PMC 2018 December 03.
Europe PM
C Funders A
uthor Manuscripts
Europe PM
C Funders A
uthor Manuscripts

both beta and gamma oscillatory activities modulated within a step cycle. In addition, we
show that it is possible to distinguish those transient movement states, especially left and
right foot stances in individual stepping cycles using HMM-MAR modelling.
Good decoding could be achieved in some patients, which is remarkable when it is
considered that some patients might have suffered temporary subthalamic stun effects so
soon following surgery, and patients did not perform true gait, but stepped from a sitting
position. Other configurations related to the HMM and MAR modelling can also be
investigated to further improve the accuracy of the method in state identification. For
example, the state transition matrix can be constrained by setting some transition
probabilities to zero. The advantage and disadvantage of the two modalities of HMM-MAR
modelling, using either filtered time series with phase information or using power amplitude
only as inputs, require further investigation. As a limitation of the study, we acknowledge
that the paradigm used in this study is stepping to a cued rhythm, and all analyses presented
here were carried out offline. It remains to be tested whether the same transient movement
states can be detected in real-time with minimal latency during free walking.
Acknowledgments
* Research supported by the MRC (MR/P012272/1 and MC_UU_12024/1), the Rosetrees Trust, and the National Institute of Health Research Oxford Biomedical Research Centre.
References
[1]. Fasano A, Aquino CC, Krauss JK, Honey CR, Bloem BR. Axial disability and deep brain stimulation in patients with Parkinson disease. Nat Rev Neurol. 2015; 11:98–110. [PubMed: 25582445]
[2]. Wagner J, Solis-Escalante T, Grieshofer P, Neuper C, Muller-Putz G, Scherer R. Level of participation in robotic-assisted treadmill walking modulates midline sensorimotor EEG rhythms in able-bodied subjects. NeuroImage. 2012; 63(3):1203–11. [PubMed: 22906791]
[3]. Seeber M, Scherer R, Wagner J, Solis-Escalante T, Muller-Putz G. High and low gamma EEG oscillations in central sensorimotor areas are conversely modulated during the human gait cycle. NeuroImage. 2015; 112:318–26. [PubMed: 25818687]
[4]. Fischer P, Yeh CH, Chen Z, Pogosyan A, Herz DM, Cheeran B, Green AL, Aziz TZ, Hyam H, Little S, Foltynie T, et al. Modulation of subthalamic nucleus beta oscillations during stepping in place is enhanced in the presence of auditory cues. Journal of Neuroscience. 2017
[5]. Vidaurre D, Quinn AJ, Baker AP, Dupret D, Tejero-Cantero A, Woolrich MW. Spectrally resolved fast transient brain states in electrophysiological data. NeuroImage. 2016; 6:81–95.
[6]. Tan H, Pogosyan A, Ashkan K, Green AL, Aziz TZ, Foltynie T, Limousin P, Zrinzo L, Hariz M, Brown P. Decoding gripping force based on local field potentials recorded from subthalamic nucleus in humans. eLife. 2016; 5:e19089. [PubMed: 27855780]
Tan et al. Page 6
Conf Proc IEEE Eng Med Biol Soc. Author manuscript; available in PMC 2018 December 03.
Europe PM
C Funders A
uthor Manuscripts
Europe PM
C Funders A
uthor Manuscripts

Figure 1. A) One example frame from the video that dictated the stepping rhythm. B) Sequence of
discrete states during stepping in place: 1/3 = right/left heel strike and the other foot lifting
up; 2/4 = right/left foot stance and the other foot swinging.
Tan et al. Page 7
Conf Proc IEEE Eng Med Biol Soc. Author manuscript; available in PMC 2018 December 03.
Europe PM
C Funders A
uthor Manuscripts
Europe PM
C Funders A
uthor Manuscripts

Figure 2. Labeling of the movement states according to the phase during a gait cycle estimated based
on the timing of heel strikes. State 1-4 was colored in blue, green, grey and pink,
respectively.
Tan et al. Page 8
Conf Proc IEEE Eng Med Biol Soc. Author manuscript; available in PMC 2018 December 03.
Europe PM
C Funders A
uthor Manuscripts
Europe PM
C Funders A
uthor Manuscripts

Figure 3. Graphical representation of the HMM-MAR modelling of electrophysiological data, adapted
from [5].
Tan et al. Page 9
Conf Proc IEEE Eng Med Biol Soc. Author manuscript; available in PMC 2018 December 03.
Europe PM
C Funders A
uthor Manuscripts
Europe PM
C Funders A
uthor Manuscripts

Figure 4. Cross-validation: the colored segments represent periods of time where the states have been
fixed.
Tan et al. Page 10
Conf Proc IEEE Eng Med Biol Soc. Author manuscript; available in PMC 2018 December 03.
Europe PM
C Funders A
uthor Manuscripts
Europe PM
C Funders A
uthor Manuscripts

Figure 5. LFP signal processing for state identification
Tan et al. Page 11
Conf Proc IEEE Eng Med Biol Soc. Author manuscript; available in PMC 2018 December 03.
Europe PM
C Funders A
uthor Manuscripts
Europe PM
C Funders A
uthor Manuscripts

Figure 6. Mean power modulation in right and left STN LFP, averaged across all valid steps and
aligned to the right heel strike (time 0, indicated by the vertical dashed line) and other states
during stepping for one exemplar patients.
Tan et al. Page 12
Conf Proc IEEE Eng Med Biol Soc. Author manuscript; available in PMC 2018 December 03.
Europe PM
C Funders A
uthor Manuscripts
Europe PM
C Funders A
uthor Manuscripts
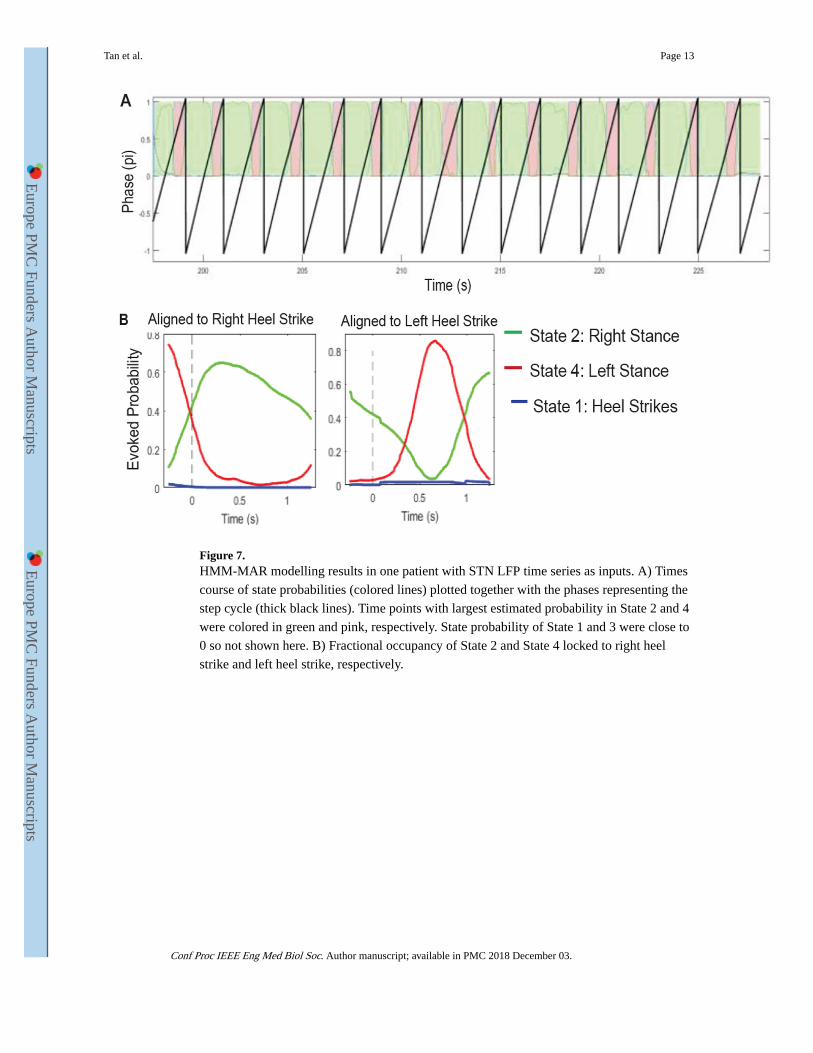
Figure 7. HMM-MAR modelling results in one patient with STN LFP time series as inputs. A) Times
course of state probabilities (colored lines) plotted together with the phases representing the
step cycle (thick black lines). Time points with largest estimated probability in State 2 and 4
were colored in green and pink, respectively. State probability of State 1 and 3 were close to
0 so not shown here. B) Fractional occupancy of State 2 and State 4 locked to right heel
strike and left heel strike, respectively.
Tan et al. Page 13
Conf Proc IEEE Eng Med Biol Soc. Author manuscript; available in PMC 2018 December 03.
Europe PM
C Funders A
uthor Manuscripts
Europe PM
C Funders A
uthor Manuscripts
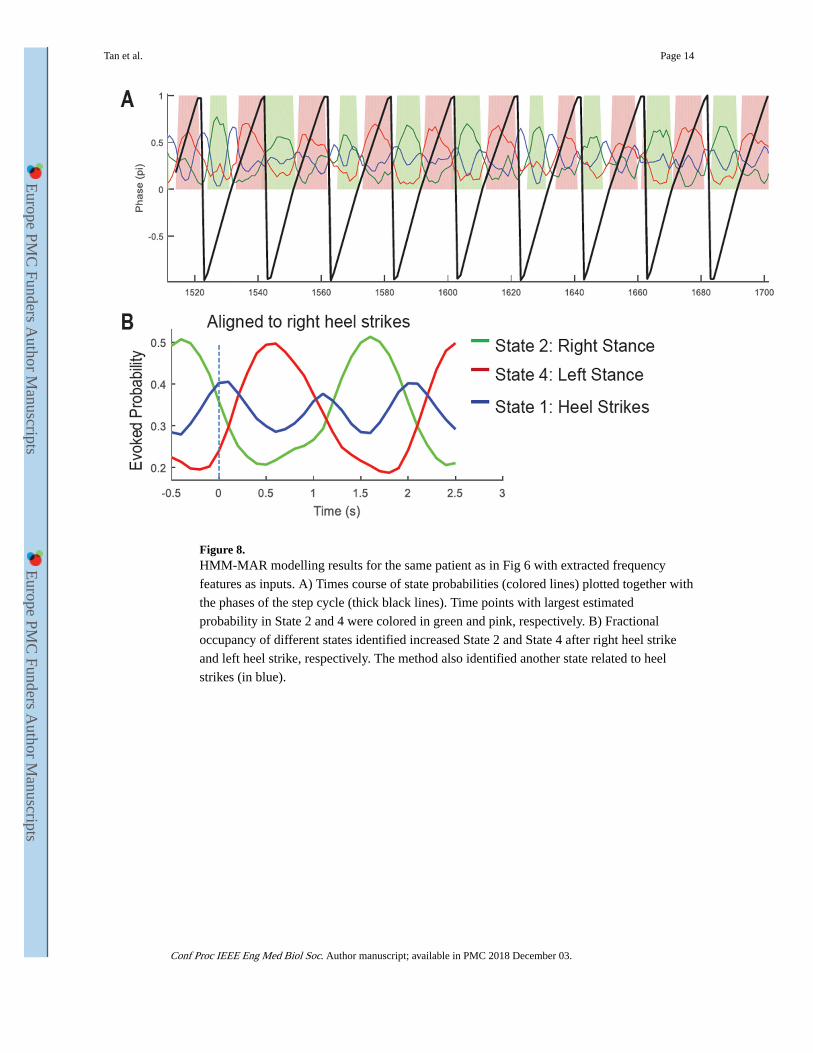
Figure 8. HMM-MAR modelling results for the same patient as in Fig 6 with extracted frequency
features as inputs. A) Times course of state probabilities (colored lines) plotted together with
the phases of the step cycle (thick black lines). Time points with largest estimated
probability in State 2 and 4 were colored in green and pink, respectively. B) Fractional
occupancy of different states identified increased State 2 and State 4 after right heel strike
and left heel strike, respectively. The method also identified another state related to heel
strikes (in blue).
Tan et al. Page 14
Conf Proc IEEE Eng Med Biol Soc. Author manuscript; available in PMC 2018 December 03.
Europe PM
C Funders A
uthor Manuscripts
Europe PM
C Funders A
uthor Manuscripts

Figure 9. Evoked probabilities aligned to the right heel strikes for State 1 (B), 2 (C) and 4(D) for all
subjects, compared to the labelled states (A). In plot B-D, time 0 is the timing of right heel
strike, thin lines showing the evoked probabilities from individual subjects. Thick lines show
the average across all patients.
Tan et al. Page 15
Conf Proc IEEE Eng Med Biol Soc. Author manuscript; available in PMC 2018 December 03.
Europe PM
C Funders A
uthor Manuscripts
Europe PM
C Funders A
uthor Manuscripts