Decoding analyses - lukas-snoek.com · on random/accidental relationships "Hmm, shirt color seems...
113
Decoding analyses Neuroimaging: Pattern Analysis 2017
Transcript of Decoding analyses - lukas-snoek.com · on random/accidental relationships "Hmm, shirt color seems...
Decoding analysesNeuroimaging: Pattern Analysis 2017

Scope
◉ Conceptual explanation of decoding/machine learning (ML) and related concepts;
◉ Not about mathematical basis of ML algorithms!

Learning goals
◉ Understand the difference (and surprising overlap) between statistics and machine learning;
◉ Recognize the major different "flavors" of decoding analyses;
◉ Understand the concepts of overfitting and cross-validation
◉ Know the most important steps in a decoding analysis pipeline;
Contents
◉ PART 1: what is machine learning?
○ … and how does it differ from statistics?
○ What "flavors" of decoding analyses are there?
○ Important ML concepts: cross-validation, overfitting
◉ PART 2: how to set up a ML pipeline?
○ From partitioning to significance testing

PART 1:WHAT IS MACHINE LEARNING?

Decoding
Terminology
◉ Decoding ≈ machine learning○ Decoding is the neuroimaging-specific
application of machine learning algorithms and techniques;
Algorithms
Cross-validation
Feature-selectionRegularization
Machine learning

Machine learning = statistics?
◉ Defining machine learning is (in a way) trivial:
○ Algorithms that learn how to model the data without an explicit instruction how to do so;
◉ But how it that different from traditional statistics?
○ Like the familiar GLM (linear regression, t-tests)?
○ Similar, but different ...
Machine learning = statistics?
◉ They have different origins:
○ Statistics is a subfield from mathematics
○ Machine learning is a subfield from computer science
○ "Science vs. engineering"
◉ They have a different goal:
○ Statistical models aim for inference about the population based on a limited sample
○ Machine learning models aim for accurate prediction of new samples
Machine learning = statistics?
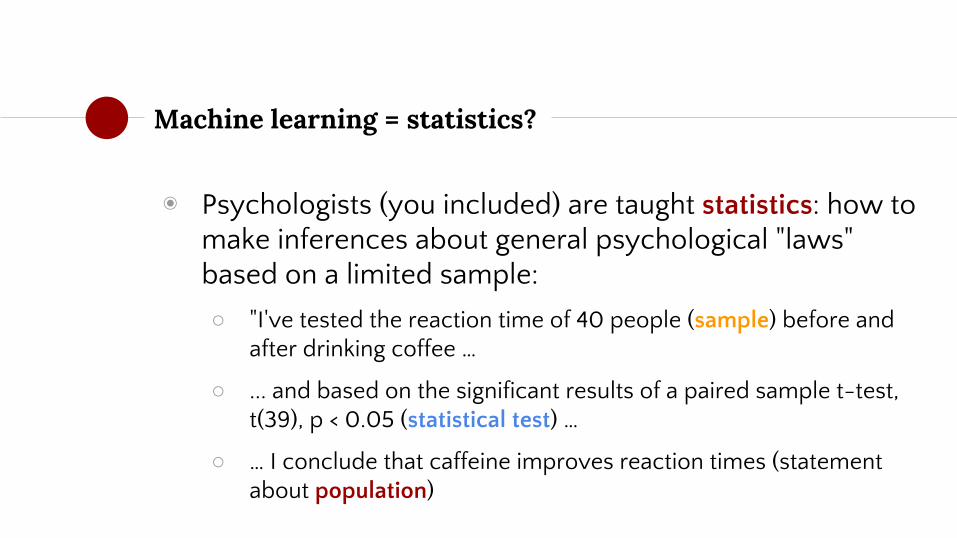
◉ Psychologists (you included) are taught statistics: how to make inferences about general psychological "laws" based on a limited sample:
○ "I've tested the reaction time of 40 people (sample) before and after drinking coffee …
○ ... and based on the significant results of a paired sample t-test, t(39), p < 0.05 (statistical test) …
○ … I conclude that caffeine improves reaction times (statement about population)

Machine learning = statistics?
◉ Crucially: we are quite certain that our findings in the sample will generalize to the population, if and only if assumptions of the model hold (and sample = truly random)
◉ Uses concepts like standard errors, confidence intervals, and p-values to generalize the model to the population
Sample Statistical model
fit/applyPopulation
infer
(if assumptions hold!)
Confidence intervals Standard errors
P-values
Machine learning = statistics?
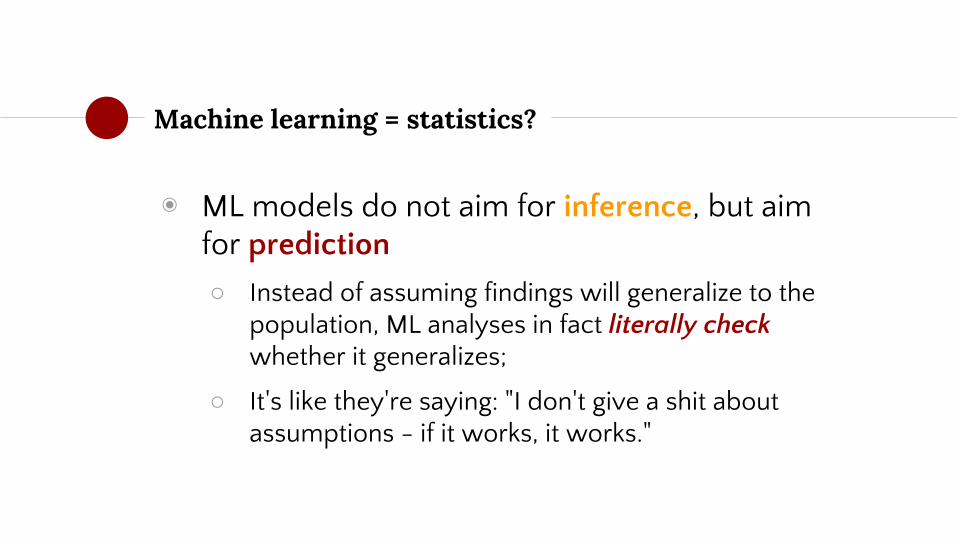
◉ ML models do not aim for inference, but aim for prediction
○ Instead of assuming findings will generalize to the population, ML analyses in fact literally check whether it generalizes;
○ It's like they're saying: "I don't give a shit about assumptions - if it works, it works."

Machine learning = statistics?
◉ Instead of assuming that the findings from the model will generalize beyond the sample, ML tests this explicitly by applying this to ("predicting") a new sample
◉ New sample is concretely part of your dataset! (not like "the population")
ML modelSample
fit/applyNew sample
Explicit generalization
(prediction to new sample)
Cross-validation
Machine learning = statistics?
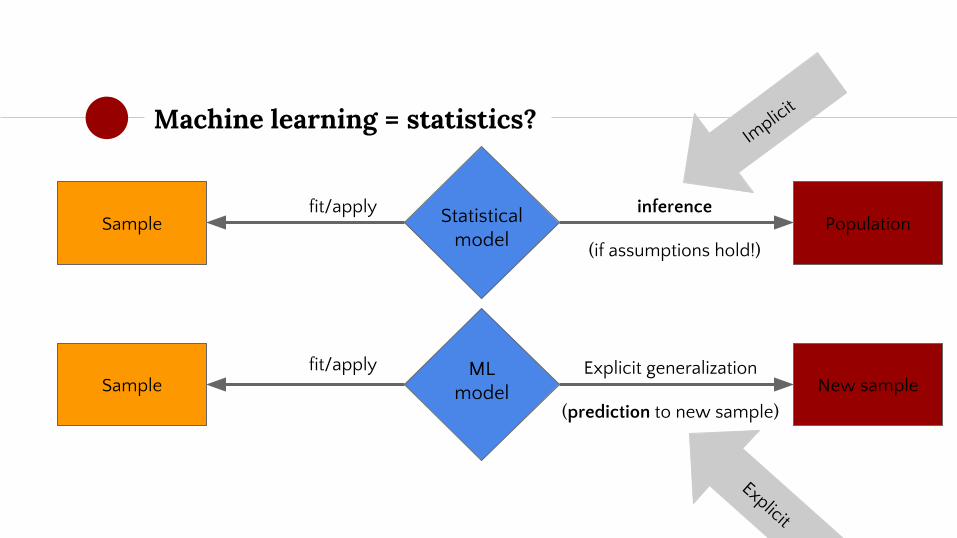
Sample Statistical model
fit/applyPopulation
inference
(if assumptions hold!)
SampleML
model
fit/applyNew sample
Explicit generalization
(prediction to new sample)
Implic
it
Explicit

Machine learning = statistics?
◉ While having a different goal, in the end both types of models simply try to model the data;
◉ Take for example linear regression:
○ It has a statistics 'version' (as defined in the GLM) …
○ … and an ML 'version' (using a mathematical technique called gradient descent to find the optimal βs)
So …?
◉ As said, statistics and ML are the same, yet different;
○ Both aim to model the data (with different techniques) ...
○ … but have a different way to generalize findings
◉ "But why do we have to learn a whole new paradigm (ML), then?", you might ask ...

Good question!
◉ Traditional statistical models do not fare well with high-dimensional problems
○ In decoding: dimensionality = amount of voxels
◉ Neuroimaging data likely violates many assumptions of traditional statistical models …
◉ Sometimes, decoding analyses actually need prediction: e.g. predict clinical treatment outcome

Back to the brain
What happens in that arrow?
"Features in the world" "Features in the brain"
DECODING Xy = model( )

Machine learning model
◉ Machine learning algorithms try to model the features (X) such that they approximate the target (y)
◉ In fMRI (decoding): can the voxel activities (X) be weighted such that they approximate the feature-of-interest (y)?

Machine learning model
ŷ = f(X)The predicted target variable, numerically coded (WORLD)
Samples-by-features matrix (BRAIN)
ML algorithm that specifies how to weigh X
(Logistic) regression
Support vector machines
Decision trees

f(X) is simply weighting!
ŷ = f(X)
β denotes the weighting parameters (or just "parameters" or "coefficients") for our features (in X)
βX denotes the (matrix) product of the weighting parameters and X - which means that y is approximated as a weighted linear combination of features
= βX

Linear vs. non-linear
◉ Disclaimer: the "βX" term implies that it is a linear model (i.e. a linear weighting of features)
◉ Decoding analyses almost always use linear models, because most world-brain relations are probably linear (cf. Naselaris & Kay)
◉ Non-linear models exist, but are rarely used
○ Also because they often perform worse than linear models

f(X) is weighting!
ŷ = f( X )
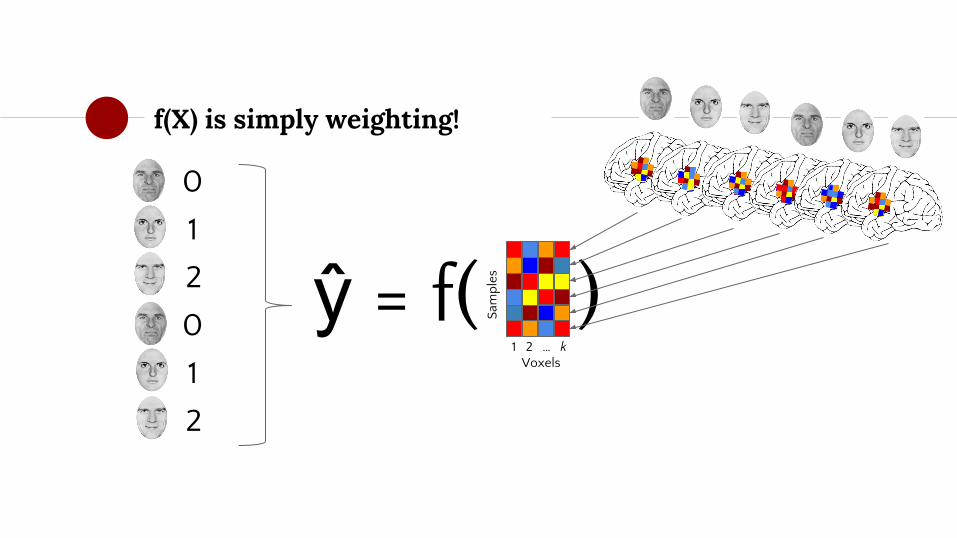
f(X) is simply weighting!
ŷ = f( ) 1 2 … k Voxels
Sam
ple
s
0
1
2
0
1
2

f(X) is simply weighting!
ŷ = β 1 2 … k Voxels
Sam
ple
s
0
1
2
0
1
2
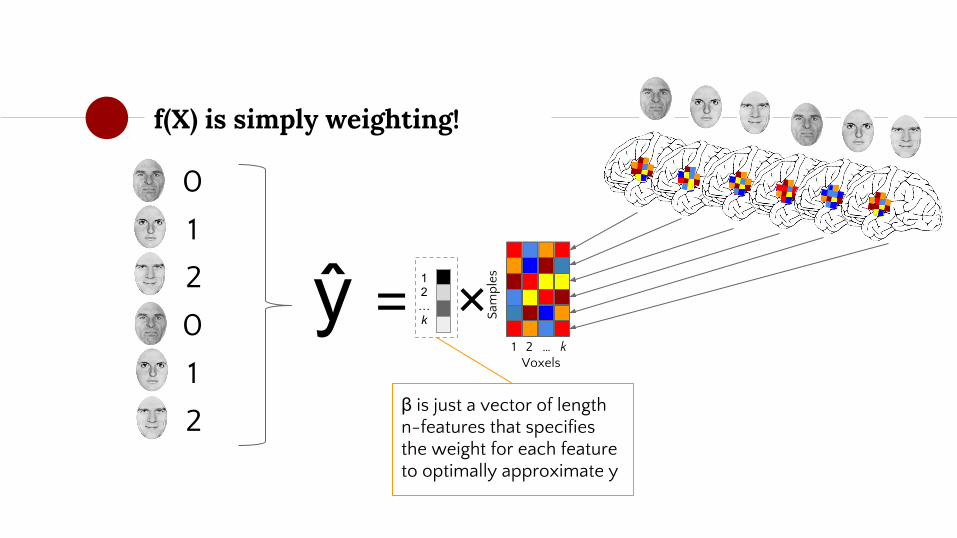
f(X) is simply weighting!
ŷ = 1 2 … k Voxels
Sam
ple
s
×
0
1
2
0
1
2
12…k
β is just a vector of length n-features that specifies the weight for each feature to optimally approximate y
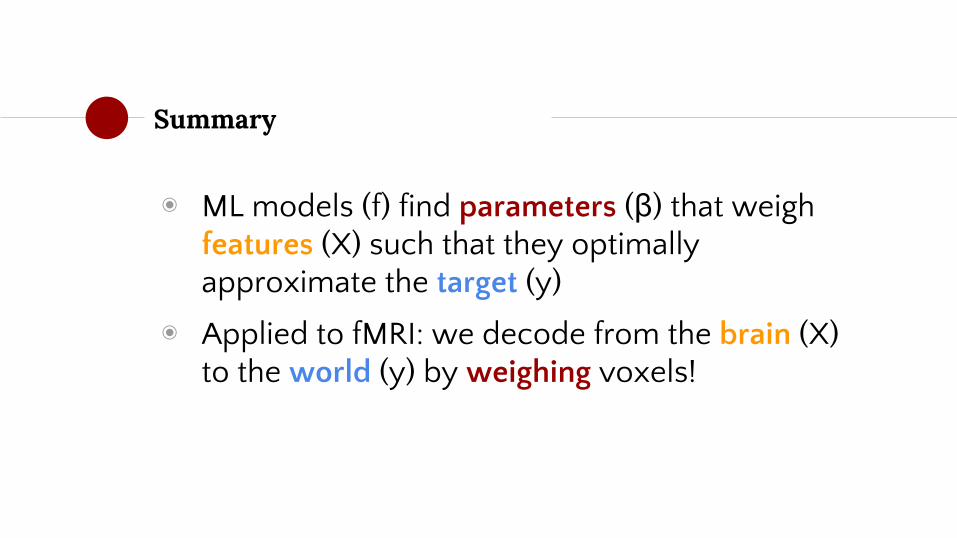
Summary
◉ ML models (f) find parameters (β) that weigh features (X) such that they optimally approximate the target (y)
◉ Applied to fMRI: we decode from the brain (X) to the world (y) by weighing voxels!

Questions so far?

Flavors of ML algorithms
◉ ML algorithms - f() - exist in different 'flavors'
What type of ML model should I choose?
Non-linear Linear
What do you assume is the relation between features and the target? (Probably linear …)
What is the nature of your target feature?
Classification
Categorical
Regression
Continuous

Regression vs. classification
Regression
◉ Target (y) is continuous
◉ "Predict someone's weight based on someone's height"
◉ Example models: linear regression, ridge regression, LASSO
Classification
◉ Target (y) is categorical
◉ "Predict someone's gender based on someone's height"
◉ Example models: support vector machine (SVM), logistic regression, decision trees,

Regression
◉ Regression models a continuous variableW
eigh
t (y
)
Height (X)100 200 (cm)
40
1
00 (K
G)
ŷweight
= βX* = βheight
Xheight
ŷweight
= 0.5Xheight
* We are ignoring the intercept here for simplicity
This is exactly like 'univariate' regression models, but instead of modelling in the encoding direction, this is in the decoding direction!

Regression vs. classification
Height (X1)
150 200 (cm)
♂ ♀ ♀♀ ♀♀ ♀ ♀ ♂ ♂ ♂ ♂ ♂ ♀ ♀♀ ♂
◉ Classification models a categorical variable
ŷ = squash(βheight
Xheight
) y = { , }♀ ♂
"squash()" is a function that forces the output of βX to be categorical
"If βX > 5, then ŷ = ♂ otherwise ŷ = ♀
ŷ = squash(20.5Xheight
)

Test your knowledge!
Subjects perform a memory task in which they have to give responses. Their responses can be either correct or incorrect.
I want to analyze whether the patterns in parietal cortex are predictive of whether someone is going to respond (in)correctly.
Classification Regression??

Test your knowledge!
During fMRI acquisition, subject see a set of images of varying emotional valence (from 0, very negative, to 100, very positive).
I want to decode stimulus valence from the bilateral insula.
Classification Regression??

Test your knowledge!
Subjects perform an attentional blink task in the scanner (during which we measure fMRI).
I want to predict whether someone has a relatively high IQ (>100) or low IQ (<100) based upon the patterns in dorsolateral PFC during the attentional blink task.
Classification Regression??
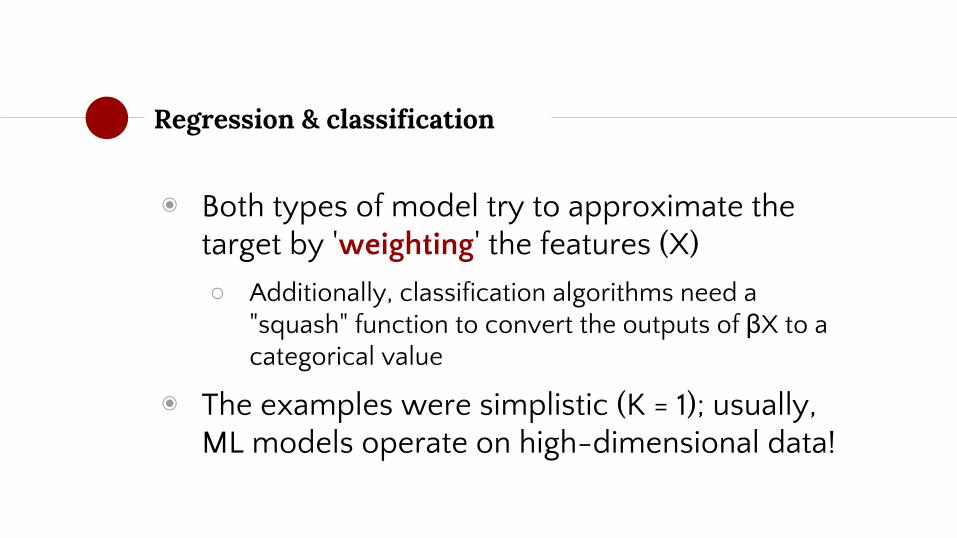
Regression & classification
◉ Both types of model try to approximate the target by 'weighting' the features (X)
○ Additionally, classification algorithms need a "squash" function to convert the outputs of βX to a categorical value
◉ The examples were simplistic (K = 1); usually, ML models operate on high-dimensional data!

Dimensionality
Height (X)150 200 (cm)
♂ ♀ ♀♀ ♀♀ ♀ ♀ ♂ ♂ ♂ ♂ ♂ ♀ ♀♀ ♂
K = 1
Height (X1)
150 200 (cm)
♂ ♀ ♀♀ ♀♀
♀ ♀ ♂ ♂ ♂
♂ ♂ ♀ ♀
♀ ♂ Wei
ght
(X2)
K = 2
♂
♂
Length (X1) W
eight (X 2
)
Age
(X
3)
♀♀
♀♀♀♀
♀♀
♂ ♂ ♂
♂ ♂
K = 3
K = >3?Difficult to visualize, but process is the same: weighting features such that a multidimensional plane is able to separate classes as well as possible in K-dimensional space

Model performance
◉ We know what ML models do (find weighting parameters β to approximate y), but how do we evaluate the model?
◉ In other words, what is the model performance?

Model performance
38
Regression
Wei
ght
Height100 200 (cm)
40
1
00
(K
G)
R2 = 0.92 [explained variance]MSE = 8.2 [mean deviation from prediction]
Accuracy = 18 / 20 = 90% [percent correct]
Classification
Height150 200 (cm)
♂
♀
♀♀ ♀♀ ♀
♀♂
♂
♂ ♂
♂ ♀
♀
♀♂ ♂
♂
♂

Model performance
◉ Performance is often evaluated not only on the original sample, but also on a “new sample”
◉ This process is called “cross-validation”

Model fitting
Model fitting & prediction
1 2 … k Voxels
- o + - o +
- = neg o = neu+ = pos
ŷ = -
o
+
β
“Train-accuracy” is 90%
“Train” set (original sample)
“Test” set (new sample)
1 2 … k Voxels
-
o
+Model cross-validation
“Test-accuracy” is 85%

Wei
ght
Height100 200 (cm)
40
10
0 (
KG
)
Train
Height100 200 (cm)
Model performance
◉ Model performance is often evaluated on a new ("unseen") sample: cross-validation
ML model New sample
Cross-validate model
fit
R2 = 0.82
Cross-validation
(prediction to new sample)
R2 = 0.64

Wei
ght
Height100 200 (cm)
40
10
0 (
KG
)
Model performance
◉ Model performance is often evaluated on a new ("unseen") sample: cross-validation
SampleML
modelfit
New sample
Cross-validate model
Acc = 0.90
♀
♀♀
♀♀
♀♀♀
♀
♂
♂ ♂ ♂
♂
♂ ♂
♀
♂
♂
♂
Height100 200 (cm)
Cross-validation
(prediction to new sample)
Acc = 0.80
♀
♀♀
♀♀
♀♀
♀
♀
♂ ♂ ♂
♂ ♂
♂ ♂
♀
♂
♂
♂

“
Why do we want (need) to do cross-validation?

“
Model fit ≠ good prediction
Overfitting
◉ When your fit on your train-set is better than on your test-set, you're overfitting
◉ Overfitting means you're modelling noise instead of signal

R2 = 0.98
Height
100 200 (cm)
Overfitting
Height
100 200 (cm)
True model
100 200 (cm)
True model + noise
Height
100 200 (cm)
R2 = 0.24
New sample(over)Fitted model
R2 = 0.98
>Overfitting
Height

Overfitting
◉ Overfitting = modeling noise
◉ Noise = random (uncorrelated from sample to sample)
◉ Therefore, a model based on noise will not generalize

What causes overfitting?
◉ A small sample/feature-ratio often causes overfitting
◉ When there are few samples or many features, models may fit on random/accidental relationships

What causes overfitting?
◉ When there are few samples, models may fit on random/accidental relationships
"Hmm, shirt color seems an excellent feature to use!"

What causes overfitting?
◉ When there are few samples, models may fit on random/accidental relationships
"Ah, gotta find another feature than shirt color ..."

What causes overfitting?
◉ Two options:
○ Gather more data (not always feasible)
○ Reduce the amount of features (more about this later)
○ [Regularization - beyond the scope of this course!]
◉ Feature selection/extraction is an often-used technique in decoding analyses
Cross-decoding!
◉ Sometimes, decoding analyses use a specific form of cross-validation to perform cross-decoding
◉ In cross-decoding, you aim to show “informational overlap” between two type of representations

Cross-decoding!
◉ For example: suppose you have the hypothesis attractiveness drives the perception of friendliness
1 2 … k Voxels
X y
“Do you find him/her attractive?”
“yes” (1) “no” (0) “yes” (1)
“yes” (1)
...
...
...
...“Do you think he/she is friendly?”
1 2 … k Voxels
X ... y“no” (0) “yes” (1) “yes” (1)
“no” (0)
fit cross-validate
Model

Summary
◉ ML models find weights to approximate a continuous (regression) or categorical (classification) dependent variable (y)
◉ Good fit ≠ good generalization …
◉ … therefore, cross-validate the model!
◉ Optimize the sample/feature ratio to reduce overfitting (spurious feature-DV correlations)
◉ Cross-decoding uses cross-validation to uncover shared representations ('informational overlap')

PART 2: BUILDING A DECODING PIPELINE

A typical decoding pipeline
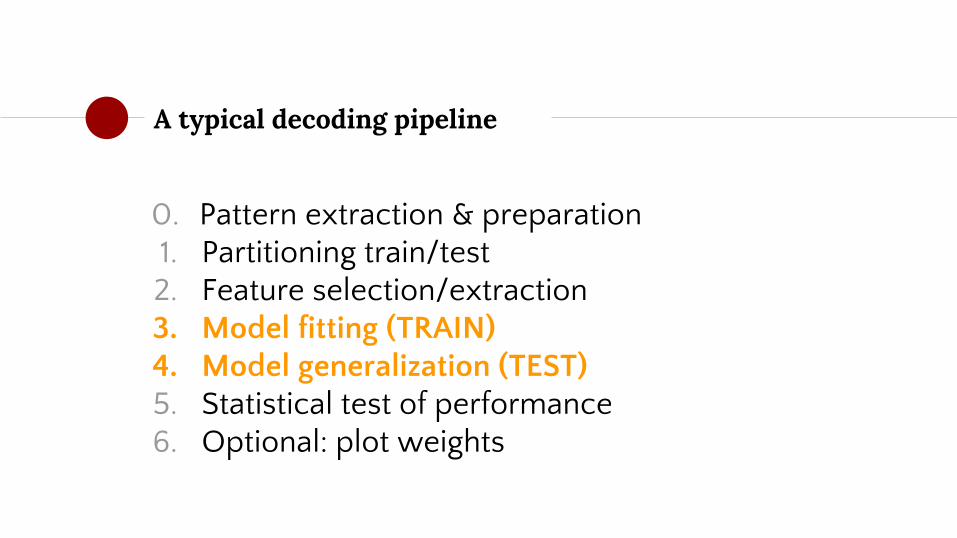
1. Partitioning train/test2. Feature selection/extraction3. Model fitting (TRAIN)4. Model generalization (TEST)5. Statistical test of performance6. Optional: plot weights
0. Pattern extraction & preparation

A typical decoding pipeline
1. Partitioning train/test2. Feature selection/extraction3. Model fitting (TRAIN)4. Model generalization (TEST)5. Statistical test of performance6. Optional: plot weights
0. Pattern extraction & preparation Week 1!

A typical decoding pipeline
1. Partitioning train/test2. Feature selection/extraction3. Model fitting (TRAIN)4. Model generalization (TEST)5. Statistical test of performance6. Optional: plot weights
0. Pattern extraction & preparation

Predict
Step 1: Partitioning
◉ Hold-out CV
TRAIN (e.g. 75%) TEST (25%)
All data (N samples)
ML modelFit
Only cross-validate once!
Kind of a "waste" of data … Reuse data?

Step 1: Partitioning
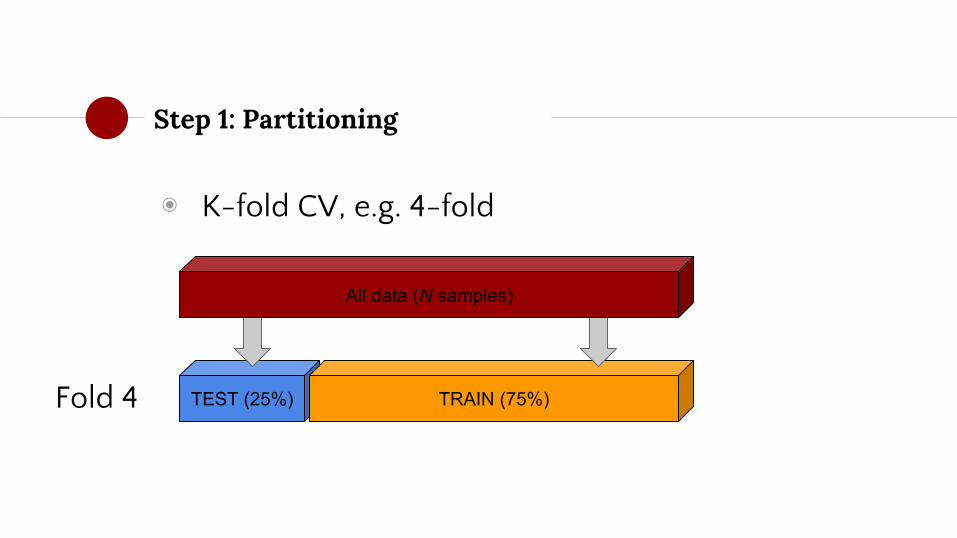
◉ K-fold CV, e.g. 4-fold
TRAIN (75%) TEST (25%)
All data (N samples)
Fold 1

Step 1: Partitioning
◉ K-fold CV, e.g. 4-fold
TRAIN (75%) TEST (25%)Fold 2
All data (N samples)

Step 1: Partitioning
◉ K-fold CV, e.g. 4-fold
TEST (25%)Fold 3 TRAIN (75%)
All data (N samples)
Step 1: Partitioning
◉ K-fold CV, e.g. 4-fold
TEST (25%)Fold 4 TRAIN (75%)
All data (N samples)

A typical decoding pipeline
1. Partitioning train/test2. Feature selection/extraction3. Model fitting (TRAIN)4. Model generalization (TEST)5. Statistical test of performance6. Optional: plot weights
0. Pattern extraction & preparation

Feature selection
◉ Goal: high sample/feature ratio!
◉ MRI: often many features (voxels), few samples (trials/instances/subjects)
◉ What to do???

Feature selection vs. extraction
◉ Reducing the dimensionality of patterns:
○ Select a subset of features (feature selection)
○ Transform features in lower-dimensional components (feature extraction)
Feature selection vs. extraction
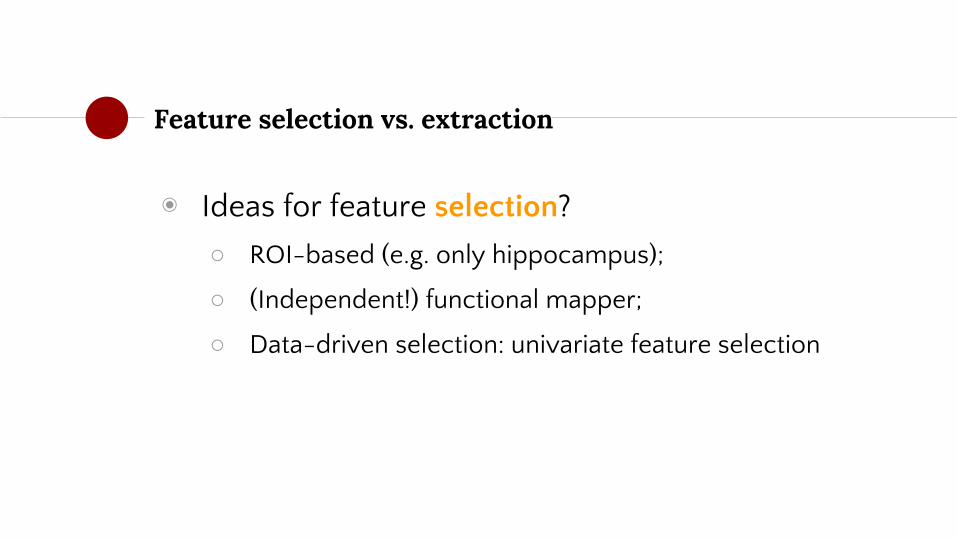
◉ Ideas for feature selection?
○ ROI-based (e.g. only hippocampus);
○ (Independent!) functional mapper;
○ Data-driven selection: univariate feature selection

Feature selection vs. extraction
◉ Ideas for feature selection?
○ ROI-based (e.g. only hippocampus);
○ (Independent!) functional mapper;
○ Data-driven selection: univariate feature selection

Univariate feature selection
◉ Use univariate difference scores (e.g. t-value/F-value) to select features
◉ Only select a subset of the voxels with the highest scores

Univariate feature selection
1 2 … k Voxels
Sam
ple
s2. Select only the "best" 100 voxels (or a percentage)
Steps: 1. Calculate test-statistic (t-test for difference happy/angry)
t-values3.2 1.1 -2.4 0.4
Cross-validation in FS
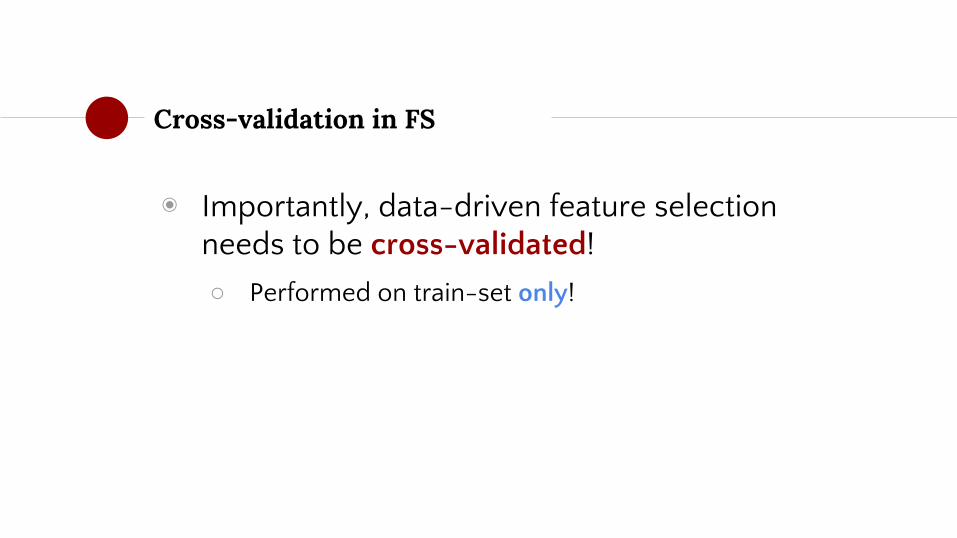
◉ Importantly, data-driven feature selection needs to be cross-validated!
○ Performed on train-set only!
Cross-validation in FS
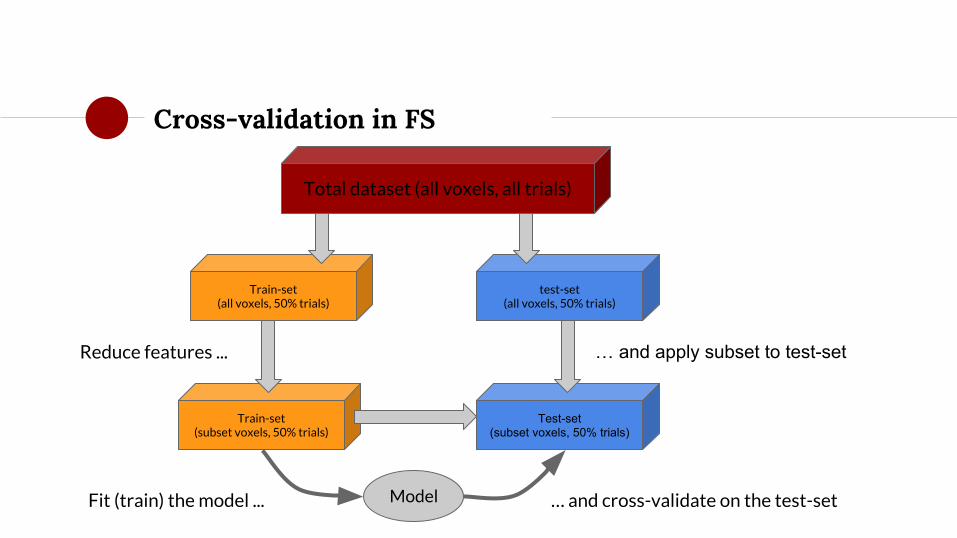
Total dataset (all voxels, all trials)
Train-set(all voxels, 50% trials)
test-set(all voxels, 50% trials)
ModelFit (train) the model ... … and cross-validate on the test-set
Train-set(subset voxels, 50% trials)
Reduce features ...
Test-set(subset voxels, 50% trials)
… and apply subset to test-set

ToThink: Why do you need to cross-validate your
feature selection?
Isn't cross-validating the model-fit enough?

ToThink: Why do you need to cross-validate your
feature selection?
Total dataset (all voxels, all trials)
Total dataset (subset voxels, all trials)
Train-set(all voxels, 50% trials)
test-set(all voxels, 50% trials)
Reduce features ...Here, you are using "information" from the test-set already!
Train & test-set are not independent anymore!
Feature selection vs. extraction
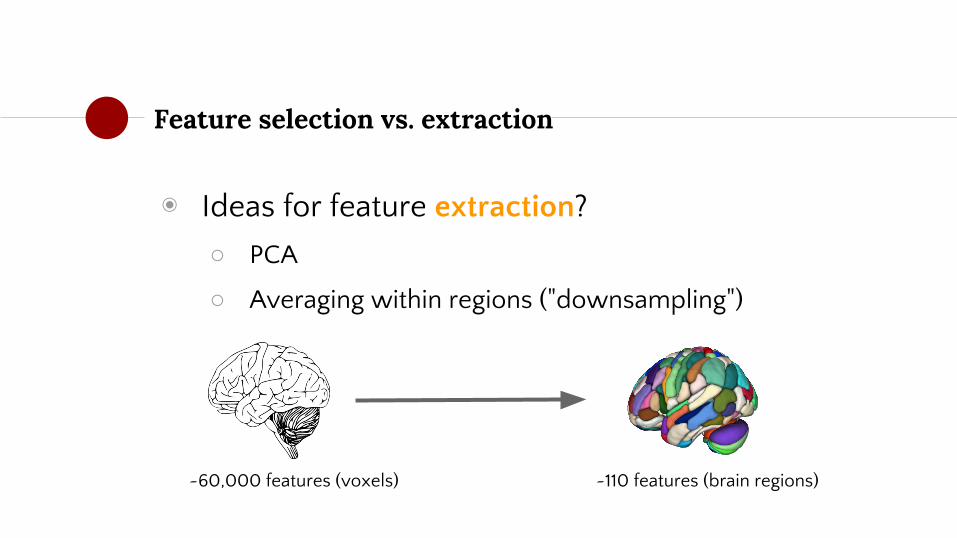
◉ Ideas for feature extraction?
○ PCA
○ Averaging within regions ("downsampling")
~60,000 features (voxels) ~110 features (brain regions)

Feature selection vs. extraction
◉ Ideas for feature extraction?
○ PCA
○ Averaging within regions ("downsampling")
◉ Feature extraction (often) does not need to be cross-validated
A typical decoding pipeline
1. Partitioning train/test2. Feature selection/extraction3. Model fitting (TRAIN)4. Model generalization (TEST)5. Statistical test of performance6. Optional: plot weights
0. Pattern extraction & preparation

A typical decoding pipeline
1. Partitioning train/test2. Feature selection/extraction3. Model fitting (TRAIN)4. Model generalization (TEST)5. Statistical test of performance6. Optional: plot weights
0. Pattern extraction & preparation

Statistical test of performance
◉ Remember I said ML does not use any statistical tests for inference?
○ I lied.
◉ Decoding analyses do use significance tests to infer whether decoding performance (R2 or % accuracy) would generalize to the population

Statistical test of performance
◉ Remember, if you want to statistically test something, you need to have a null- and alternative hypothesis:
○ H0: performance = chance level
○ Ha: performance > chance level

Statistical test of performance
◉ What is chance level?
◉ R2?
○ Cross-validated R2 null
: 0
◉ Accuracy?
○ 1 / number of classes
○ Decode negative/positive/neutral? Chance = 33%
y = { , , }
Statistical test of performance
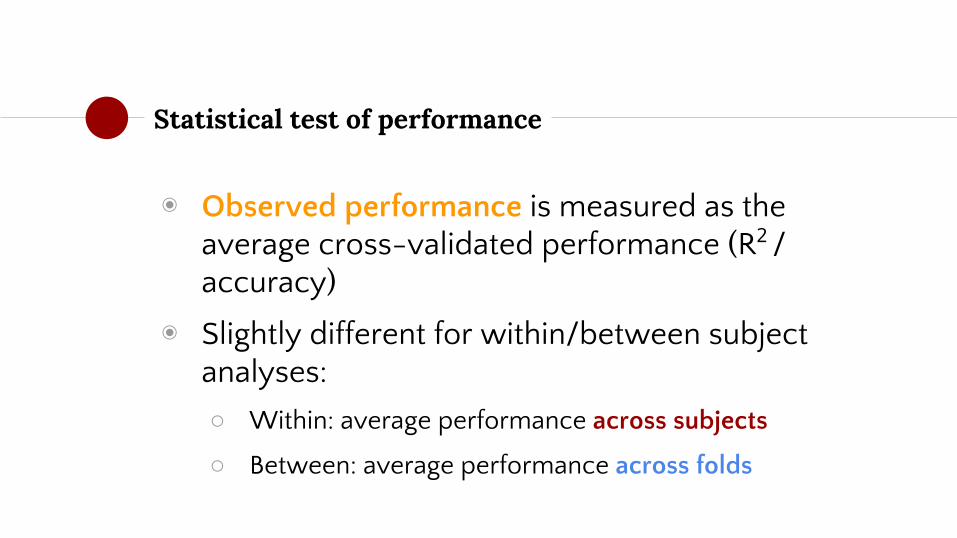
◉ Observed performance is measured as the average cross-validated performance (R2 / accuracy)
◉ Slightly different for within/between subject analyses:
○ Within: average performance across subjects
○ Between: average performance across folds
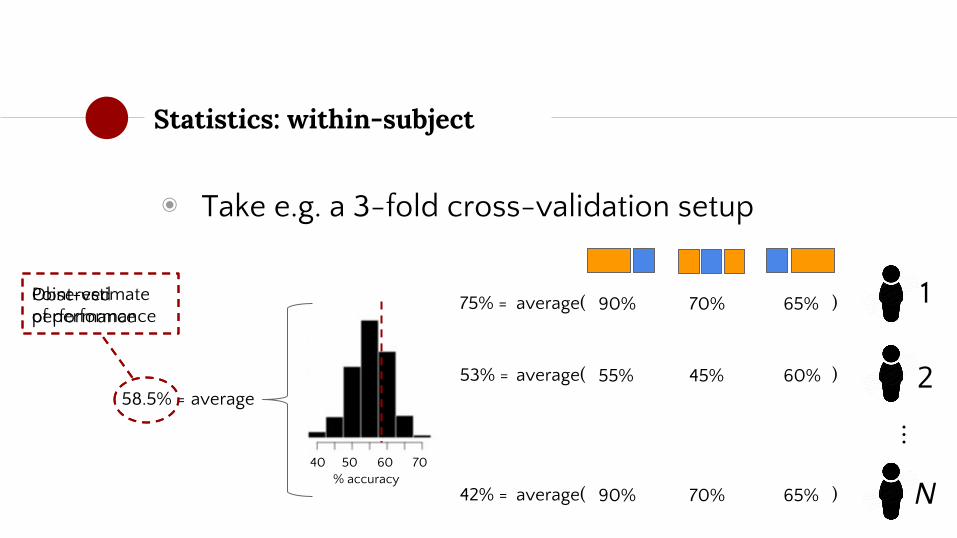
Statistics: within-subject
◉ Take e.g. a 3-fold cross-validation setup
...
1
2
N
90% 70% 65%
55% 45% 60%
90% 70% 65%
75% =
53% =
42% =
average58.5% =
Point-estimate of performance
average( )
average( )
average( )
40 50 60 70% accuracy
Observed performance
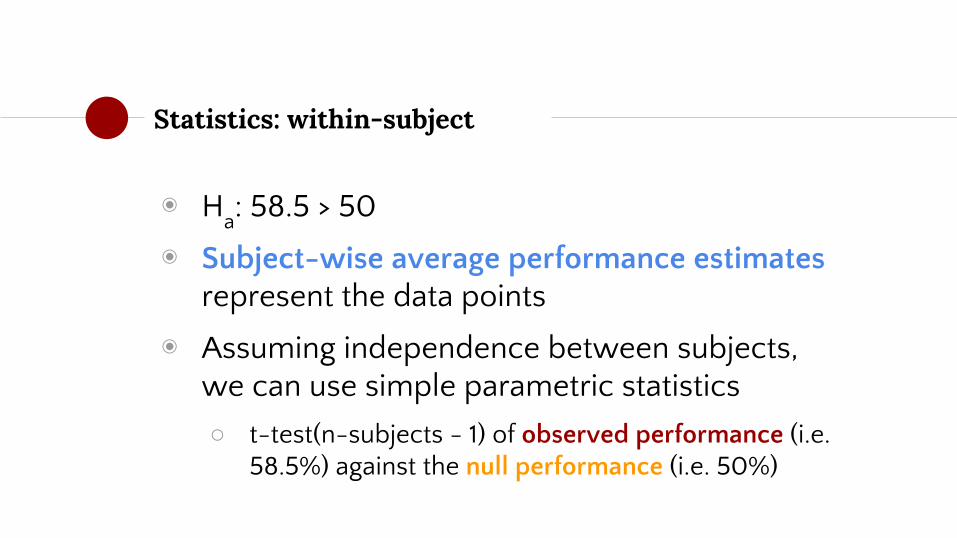
Statistics: within-subject
◉ Ha: 58.5 > 50
◉ Subject-wise average performance estimates represent the data points
◉ Assuming independence between subjects, we can use simple parametric statistics
○ t-test(n-subjects - 1) of observed performance (i.e. 58.5%) against the null performance (i.e. 50%)
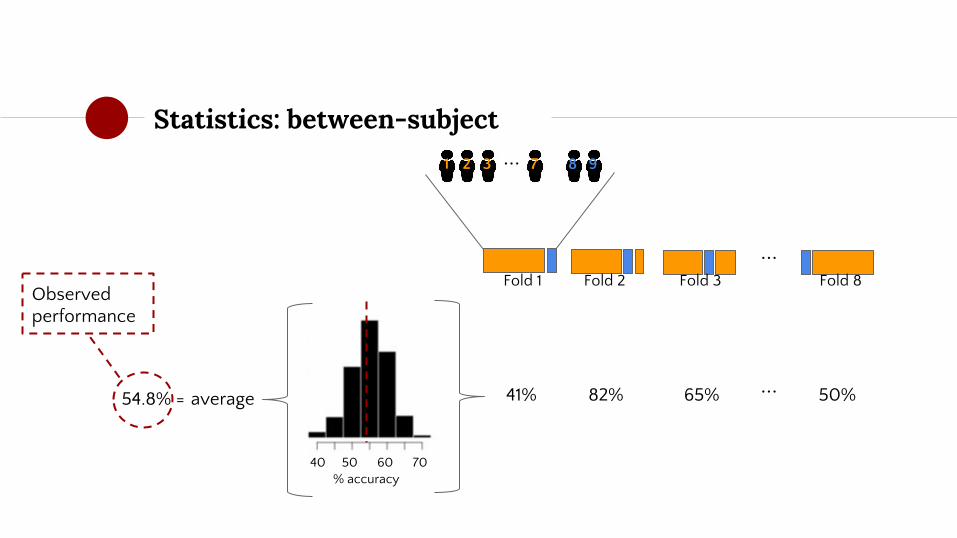
Statistics: between-subject
...Fold 1 Fold 2 Fold 3 Fold 8
...1 2 3 7 8 9
average 50%65%82%41% ...54.8% =
Observed performance
40 50 60 70% accuracy
Statistics: between-subject
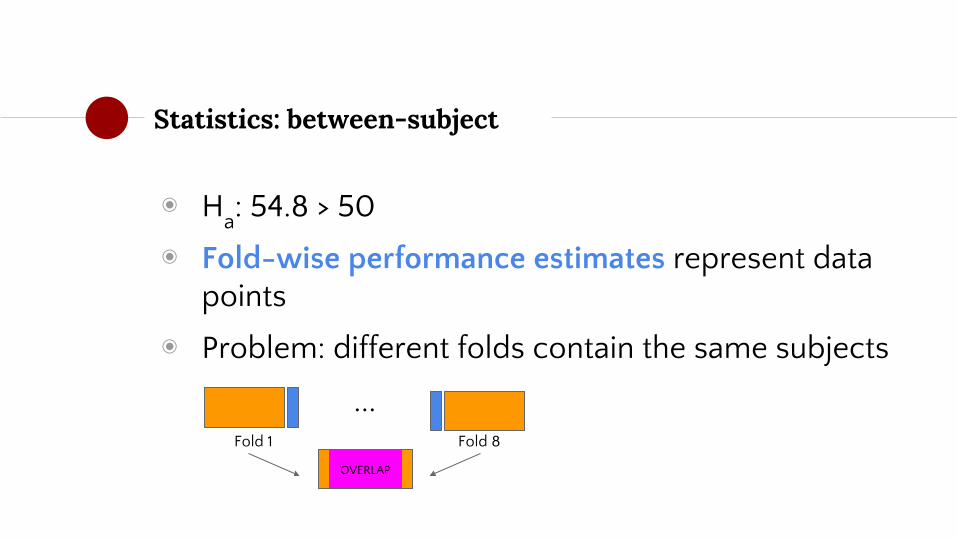
◉ Ha: 54.8 > 50
◉ Fold-wise performance estimates represent data points
◉ Problem: different folds contain the same subjects
OVERLAP
Fold 1 Fold 8
...
Statistics: between-subject
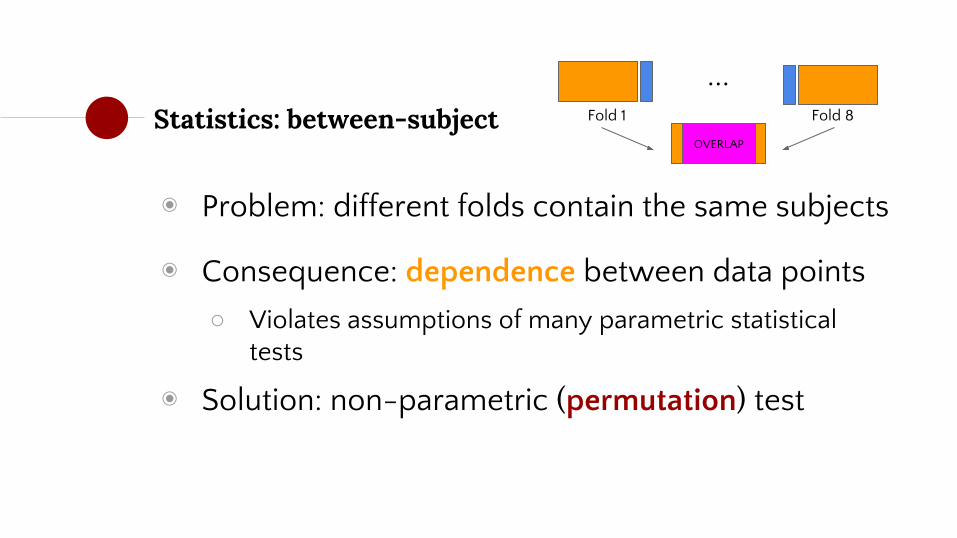
◉ Problem: different folds contain the same subjects
OVERLAP
Fold 1 Fold 8
...
◉ Consequence: dependence between data points
○ Violates assumptions of many parametric statistical tests
◉ Solution: non-parametric (permutation) test

Statistics: between-subject
◉ Permutation tests do not assume (the shape of) a null-distribution, but "simulate" them
◉ To simulate the null-distribution (results expected when H
0 is true), permutation tests
literally simulate "performance at chance"

Repeat 1000 times
Statistics: between-subject
A A A A B B B B A BCLASS =
Randomly shuffle labels
...B B B A B A A A A B
50% 45% 62%
B A B A B A B B B A A A A A B B B B A BA A A A B B B B A B A B A B B B A B A A
Permuted performance (averaged over folds):52%

Perm.1
Statistics: between-subject
41% 62% 51%
Permuted performance (averaged over folds):48%
...
40 50 60 70% accuracy
Simulated null-distribution!

Perm.2
Statistics: between-subject
51% 53% 49%
Permuted performance (averaged over folds):52%
...
40 50 60 70% accuracy
Simulated null-distribution!

Perm.3
Statistics: between-subject
62% 55% 53%
Permuted performance (averaged over folds):57%
...
40 50 60 70% accuracy
Simulated null-distribution!

Perm.4
Statistics: between-subject
51% 42% 47%
Permuted performance (averaged over folds):48%
...
40 50 60 70% accuracy
Simulated null-distribution!

Perm.5
Statistics: between-subject
49% 48% 53%
Permuted performance (averaged over folds):50%
...
40 50 60 70% accuracy
Simulated null-distribution!

Perm.6
Statistics: between-subject
41% 42% 49%
Permuted performance (averaged over folds):45%
...
40 50 60 70% accuracy
Simulated null-distribution!

Perm....
Statistics: between-subject
46% 53% 48%
Permuted performance (averaged over folds):48%
...
40 50 60 70% accuracy
Simulated null-distribution!

Perm.1000
Statistics: between-subject
40% 39% 52%
Permuted performance (averaged over folds):43%
...
40 50 60 70% accuracy
Simulated null-distribution!

Statistics: between-subject
"Non-parametric" p-value =
40 50 60 70
% accuracy
58.4%
∑(null-scores > observed-scores)
Number of permutations1000
52= 0.052

A typical decoding pipeline
1. Partitioning train/test2. Feature selection/extraction3. Model fitting (TRAIN)4. Model generalization (TEST)5. Statistical test of performance6. Optional: plot weights
0. Pattern extraction & preparation
If there is time left!

Weight mapping
◉ Often, researchers (read: reviewers) ask:
"Which features are important for which class?"
◉ Intrinsic need for blobs?
◉ What they want:

Weight mapping
◉ Technically, weights (β) in linear models are interpretable: higher = more important
○ Negative weights: evidence for class 0
○ Positive weights: evidence for class 1
ŷ = β 1 2 … k Voxels
Sam
ple
sClass 0
Class 1

Weight mapping
◉ Technically, weights (β) in linear models are interpretable: higher = more important
○ Negative weights: evidence for class 0
○ Positive weights: evidence for class 1
ŷ = 1 2 … k Voxels
Sam
ple
sClass 0
Class 1
×12…k
Reshape to 3D
Apply threshold
Plot on brain
Angry (0) Happy (1)Evidence for class❌

Weight mapping
◉ Haufe et al. (2014, NeuroImage) showed that high weights ≠ class importance
...
*voxels
*

Weight mapping
◉ Haufe et al. (2014, NeuroImage) showed that high weights ≠ class importance
◉ Features (voxels) may function like (class-independent) "filters"
○ E.g. reflect physiological noise
◉ Inherent problem for decoding analyses(brain → world)
Weight mapping
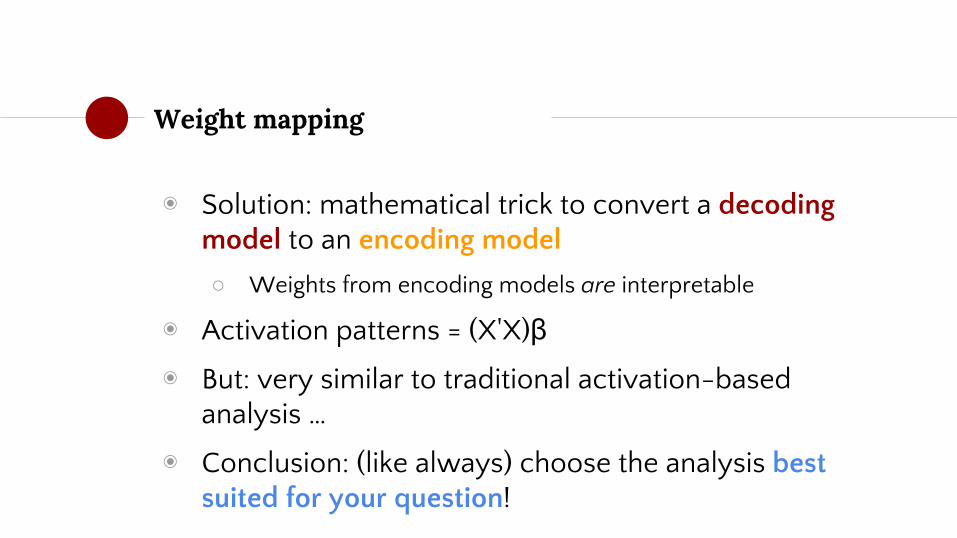
◉ Solution: mathematical trick to convert a decoding model to an encoding model
○ Weights from encoding models are interpretable
◉ Activation patterns = (X'X)β
◉ But: very similar to traditional activation-based analysis …
◉ Conclusion: (like always) choose the analysis best suited for your question!

Summary
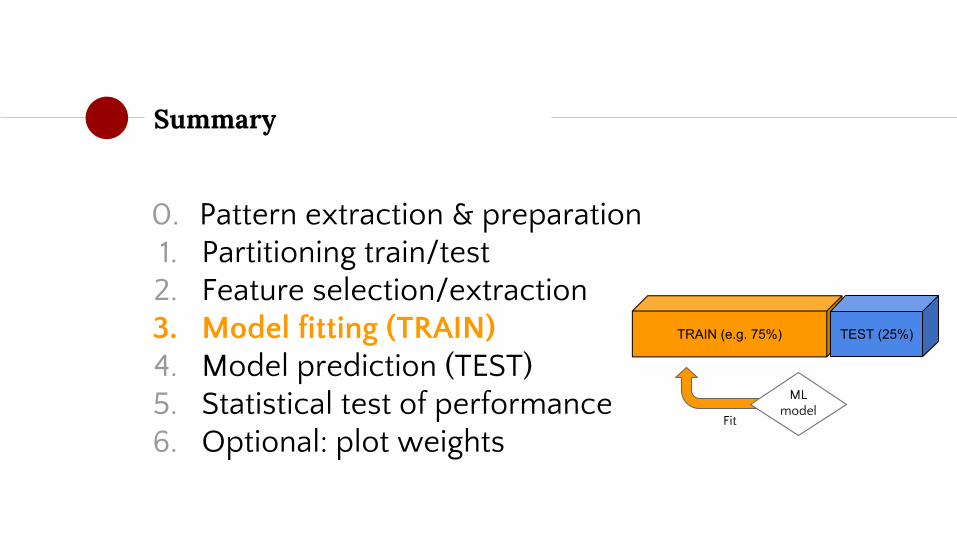
1. Partitioning train/test2. Feature selection/extraction3. Model fitting (TRAIN)4. Model prediction (TEST)5. Statistical test of performance6. Optional: plot weights
0. Pattern extraction & preparation Estimate and extract patterns such that X = N-samples by N-features (voxels)

Summary
1. Partitioning train/test2. Feature selection/extraction3. Model fitting (TRAIN)4. Model prediction (TEST)5. Statistical test of performance6. Optional: plot weights
0. Pattern extraction & preparation Use hold-out or K-fold partitioning
Summary
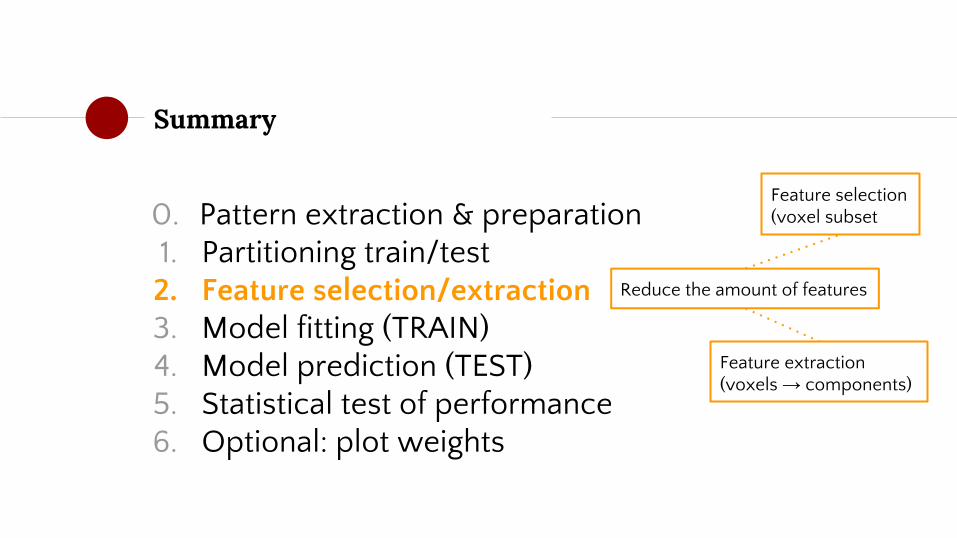
1. Partitioning train/test2. Feature selection/extraction3. Model fitting (TRAIN)4. Model prediction (TEST)5. Statistical test of performance6. Optional: plot weights
0. Pattern extraction & preparation
Reduce the amount of features
Feature selection (voxel subset
Feature extraction (voxels → components)
Summary
1. Partitioning train/test2. Feature selection/extraction3. Model fitting (TRAIN)4. Model prediction (TEST)5. Statistical test of performance6. Optional: plot weights
0. Pattern extraction & preparation
TRAIN (e.g. 75%) TEST (25%)
ML model
Fit
Summary
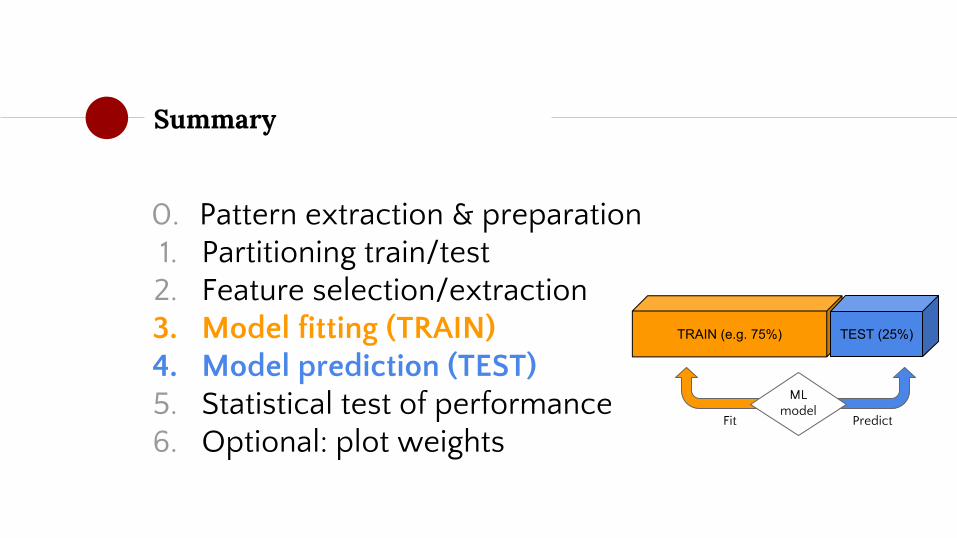
1. Partitioning train/test2. Feature selection/extraction3. Model fitting (TRAIN)4. Model prediction (TEST)5. Statistical test of performance6. Optional: plot weights
0. Pattern extraction & preparation
TRAIN (e.g. 75%)
Predict
TEST (25%)
ML model
Fit
Summary
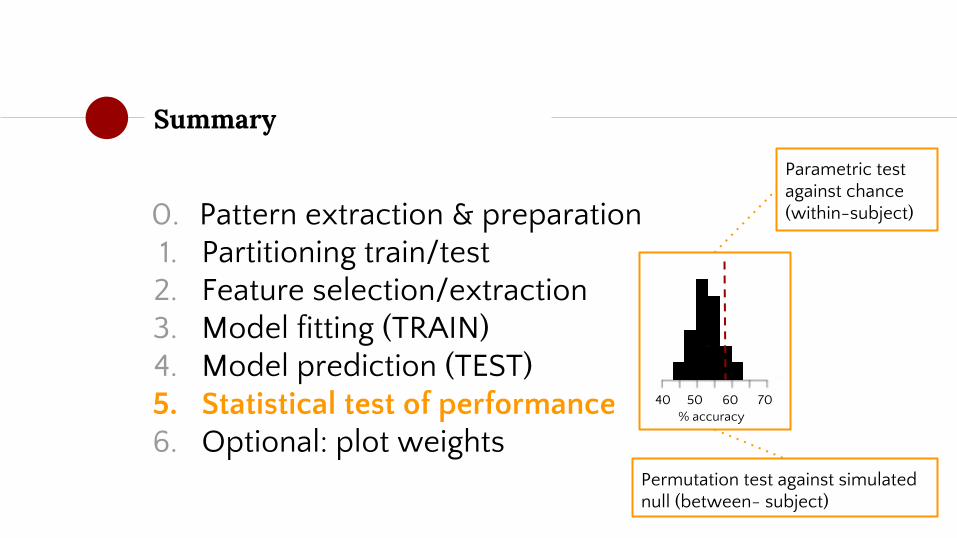
1. Partitioning train/test2. Feature selection/extraction3. Model fitting (TRAIN)4. Model prediction (TEST)5. Statistical test of performance6. Optional: plot weights
0. Pattern extraction & preparation
40 50 60 70% accuracy
Parametric test against chance (within-subject)
Permutation test against simulated null (between- subject)

Summary
1. Partitioning train/test2. Feature selection/extraction3. Model fitting (TRAIN)4. Model prediction (TEST)5. Statistical test of performance6. Optional: plot weights
0. Pattern extraction & preparation
Do not plot weights! A (complementary) univariate analysis would suffice
If you insist, plot the corresponding encoding model - (X'X)β
Literature
◉ Abraham et al: about the scikit-learn package for decoding analyses (read before tomorrow if possible!)
◉ Pereira et al: tutorial-style paper about decoding analyses