DECODE: Detecting Co-MovingWireless Devices
6
DECODE: Detecting Co-Moving Wireless Devices Gayathri Chandrasekaran, Mesut Ali Ergin, Marco Gruteser, and Rich Martin WINLAB, Rutgers, The State University of New Jersey, North Brunswick, NJ 08902 {chandrga, ergin, gruteser, rmartin} @winlab.rutgers.edu Jie Yang and Yingying Chen Stevens Institute of Technology, Hoboken, NJ 07030 {jyang, yingying.chen} @stevens.edu Abstract We present the DECODE technique to determine from a remote receiver whether a set of transmitters are co-moving, i.e., moving together in close proximity. Co-movement in- fonnation can find use in applications ranging fronz in- ventory tracking, to social network sensing, and to opti- mizing mobile device localization. DECODE detects co- moving transmitters by identifying correlations in commu- nication signal strength due to shadow fading. Unlike lo- calization systems, it can operate using measurementsfrom only a single receiver. It requires no changes in or coopera- tion from the tracked devices other than sporadic transmis- sion of packets. Using experiments from an office environ- ment, we show that DECODE can achieve near perfect co- movement detection at walking-speed mobility using corre- lation coefficients computed over approximately 60-second time intervals. 1 Introduction Many location-aware applications benefit from higher- level information about the movement of transmitters. One instance of such higher-level information is co-movement, which describes whether a set of transmitters are moving together on a common path. While it is straightforward to derive co-movement relationship from position coordinates and trajectories generated by a localization system, suffi- ciently accurate and precise data is not always available. Global Positioning System (GPS) accuracy is frequently de- graded in urban canyons [5] or not used in portable devices due to its energy consumption. For indoor environments, localization systems require the presence of multiple land- marks or receivers, which adds infrastructure cost. Coarse co-movement information can also be obtained from con- nectivity through short-range radios [7]. This, however, re- quires tracking software to be installed on all mobile de- vices, it can not easily be inferred through infrastructure so- lutions alone. 1-4244-2575-4/08/$20.00 @2008 IEEE Overview of Decode: In this paper, we study a co- movement detection technique that operates solely on com- munication signal strength traces, requires only a single re- ceiver (or landmark), and does not rely on modifications of the tracked devices (under the assumptions that the de- vices will periodically transmit messages to communicate). It exploits commonalities in the received signal power fad- ing patterns observed from a set of co-located transmitters. The wireless communications literature [17] distinguishes shadow and multi-path fading effects that attenuate a signal in addition to the path loss due to communication distance. Shadow fading refers to obstacles in the environment that attenuate the transmitted signal, when it travels through the object. The magnitude of this effect depends on the mate- rial and width of the object (e.g., about 10dB attenuation was observed when an outside antenna was moved inside of a vehicle [10]). Multi-path fading describes the effect that objects in the environment reflect and scatter the trans- mitted signal, so that the signal often arrives at the receiver along multiple paths. The signal components constructively or destructively interfere, leading to fast changes in received signal strength. Also, if the position of the receiver changes by merely one-half the wavelength of the communication frequency used (59mm for ISM Band 2.4GHz [14]), it will experience a very different multi-path fading channel, re- sulting in signal strength changes that can exceed 20dB. As transmitters or receivers move, the time varying attenuation due to these effects will be unique for each path. Two re- ceivers co-moving with a separation of less than one-half wavelength, will experience nearly identical signal power curves and thus can be distinguished from transmitter pairs separated by larger distances. For high communication fre- quencies in the unlicensed band, however, only few trans- mitters will be sufficiently close to allow such straightfor- ward detection. Thus, this paper presents the DECODE technique, which allows detection of co-moving transmitters through similar- ities in the shadow fading component of the received sig- nal. These similarities persist even if the separation between 315
Transcript of DECODE: Detecting Co-MovingWireless Devices

DECODE: Detecting Co-Moving Wireless Devices
Gayathri Chandrasekaran, Mesut Ali Ergin, Marco Gruteser, and Rich MartinWINLAB, Rutgers, The State University of New Jersey, North Brunswick, NJ 08902
{chandrga, ergin, gruteser, rmartin} @winlab.rutgers.edu
Jie Yang and Yingying ChenStevens Institute of Technology, Hoboken, NJ 07030
{jyang, yingying.chen} @stevens.edu
Abstract
We present the DECODE technique to determine from aremote receiver whether a set oftransmitters are co-moving,i.e., moving together in close proximity. Co-movement infonnation can find use in applications ranging fronz inventory tracking, to social network sensing, and to optimizing mobile device localization. DECODE detects comoving transmitters by identifying correlations in communication signal strength due to shadow fading. Unlike localization systems, it can operate using measurements fromonly a single receiver. It requires no changes in or cooperation from the tracked devices other than sporadic transmission ofpackets. Using experiments from an office environment, we show that DECODE can achieve near perfect comovement detection at walking-speed mobility using correlation coefficients computed over approximately 60-secondtime intervals.
1 Introduction
Many location-aware applications benefit from higherlevel information about the movement of transmitters. Oneinstance of such higher-level information is co-movement,which describes whether a set of transmitters are movingtogether on a common path. While it is straightforward toderive co-movement relationship from position coordinatesand trajectories generated by a localization system, sufficiently accurate and precise data is not always available.Global Positioning System (GPS) accuracy is frequently degraded in urban canyons [5] or not used in portable devicesdue to its energy consumption. For indoor environments,localization systems require the presence of multiple landmarks or receivers, which adds infrastructure cost. Coarseco-movement information can also be obtained from connectivity through short-range radios [7]. This, however, requires tracking software to be installed on all mobile devices, it can not easily be inferred through infrastructure solutions alone.
1-4244-2575-4/08/$20.00 @2008 IEEE
Overview of Decode: In this paper, we study a comovement detection technique that operates solely on communication signal strength traces, requires only a single receiver (or landmark), and does not rely on modificationsof the tracked devices (under the assumptions that the devices will periodically transmit messages to communicate).It exploits commonalities in the received signal power fading patterns observed from a set of co-located transmitters.The wireless communications literature [17] distinguishesshadow and multi-path fading effects that attenuate a signalin addition to the path loss due to communication distance.Shadow fading refers to obstacles in the environment thatattenuate the transmitted signal, when it travels through theobject. The magnitude of this effect depends on the material and width of the object (e.g., about 10dB attenuationwas observed when an outside antenna was moved insideof a vehicle [10]). Multi-path fading describes the effectthat objects in the environment reflect and scatter the transmitted signal, so that the signal often arrives at the receiveralong multiple paths. The signal components constructivelyor destructively interfere, leading to fast changes in receivedsignal strength. Also, if the position of the receiver changesby merely one-half the wavelength of the communicationfrequency used (59mm for ISM Band 2.4GHz [14]), it willexperience a very different multi-path fading channel, resulting in signal strength changes that can exceed 20dB. Astransmitters or receivers move, the time varying attenuationdue to these effects will be unique for each path. Two receivers co-moving with a separation of less than one-halfwavelength, will experience nearly identical signal powercurves and thus can be distinguished from transmitter pairsseparated by larger distances. For high communication frequencies in the unlicensed band, however, only few transmitters will be sufficiently close to allow such straightforward detection.
Thus, this paper presents the DECODE technique, whichallows detection of co-moving transmitters through similarities in the shadow fading component of the received signal. These similarities persist even if the separation between
315

transmitters is larger than one-half the wavelength. DECODE records, at one receiver, the signal power changesover multiple frames emitted from each of several transmitters. It then applies a three-step detection algorithm, whichbegins with extracting periods of high signal variance fromeach of the traces. It then filters out fast fading effects andcalculates correlation values over the resulting data for eachtransmitter pair. High correlation indicates co-movement ofthe transmitter pairs.
Uses of Co-Movement Information Many applicationscan benefit from co-movement information. Some of theimportant ones are:
Mapping Devices to Persons: Many location-aware application such as Friend finders are tracking devicesas a proxy to infer the position of the device owner.The proliferation of mobile devices and distinct radiotechnologies on each mobile device make monitoringthis mapping of devices to their owners increasinglycumbersome. For example, as a mobile device movesfrom outdoors to building location it may be trackedby a variety of different technologies, where each usesa different identifier (usually the radio MAC address)to identify the device. By monitoring co-movementof different transmitters a localization system may beable to infer which devices belong to the same owner,or which addresses represent the same device.
Social Network Mining: Recent work [7] has sought toinfer social relationships from mobile device connectivity patterns. Applications for such techniques include automatically determining access control policies and viral marketing. Current techniques monitor Bluetooth advertisement messages to determinewhen and how long devices from different ownersmeet. This requires software on mobile devices. Theco-movement techniques could also extract this information through external observations (from a communications base station).
Localization optimizations: Knowing that two mobile devices move together helps collaborative positioningmechanisms that provide lower energy consumption orbetter accuracy. For example, one device could powerdown its GPS receiver to conserve energy, while theother device's receiver still provides accurate positionupdates. In challenging environments for localization,position estimates may also be improved through redundancy.
The remainder of the paper is organized as follows: InSection 2, we review related research and Section 3 presentsthe DECODE technique. In Section 4, we discuss our experimental methodology and results. Concluding remarksare given in Section 5.
2 Related Work
The previous work on detecting co-located and comoving objects have either been based on absolute locationof the transmitters obtained using localization indoors andGPS outdoors or from proximity sensing using short rangeinfrared (IR) or Bluetooth devices. We know of no otherwork that infers co-location or co-movement directly fromsignal strength measurements. In this section we divide therelated work into 2 main categories.
Location based inference: There have been activeprior efforts in determining the locations of transmitters.RADAR [1] which works for 802.11 uses RF Fingerprintinformation observed at three receivers and performs a nearest neighbor matching algorithm to determine the locationof the transmitters with a three meters median accuracy.[8] uses Bayesian learning algorithm on RF fingerprints observed at three or more receivers to obtain a median 802.11localization accuracy of 3-4 meters. The most accurate802.11 location system to date is [12] which uses HiddenMarkov Model and Bayesian inference derived from observations at nine different receivers yielding a median accuracy of one meter. Further, the average localization accuracy employing RSS in a 802.15.4 (Zigbee) network [4] andan active RFID system [3] is about the same with median errors around 3-4m when using four receivers. All of these localization approaches need three or more receivers to workin concert to perform co-location detection . Whereas ourscheme only needs to work with one receiver.
Proximity Based inference: Proximity based colocation inference techniques mainly consist of using shortrange IR or Bluetooth devices to estimate distance betweenthe transmitters. Reality Mining project [7] [6] used Bluetooth capable GSM phones to record the other nearby bluetooth devices and transmit them to the central server for inferring social interaction patterns. SpotOn system [9] usedradio signal attenuation to estimate the relative distancebetween the special tags. Though these techniques lookattractive for co-location detection, they requires trackingsoftware on the devices themselves and are effective onlyfor detecting devices that have the same technology. Ourscheme is more generic as it involves measurement of RSSIwhich is common to GSM, WLAN, Zigbee, Bluetooth.
3 DECODE SYSTEM DESIGN
The environment in which wireless communication takesplace affects the received signal power (i.e., Signal-to-Noiseratio). The key idea underlying the DECODE technique isexploiting shadow fading, signal attenuation due to objectsblocking the path of communication. Two transmitters inclose proximity will be similarly affected by surroundingbuildings, furniture, or passing people. Therefore, the ob-
316
Declare Tj and Ti+1move independently
3.1 Alignment and Filtering Steps
Time alignment. The following co-movement detection seeks to compare RSSI values observed at the sametime from different transmitters. The packets originatingfrom transmitters attached to different devices may not besynchronized in time. Even if one attempts to synchronizetransmitters attached to the same device, the inherent channel access delays will cause packets to arrive at slightly different times. Depending on wireless channel conditions,packets are also lost due to collisions or path loss. Thus, thetime alignment step synchronizes and interpolates samplesreceived from two transmitters. Given the packet traces fortwo transmitters, our implementation matches every packetfrom the first transmitter with the last prior packet transmission from the second transmitter. If a sample is missingfrom the second transmitter, this procedure interpolate themissing sample with the last observed sample from the second transmitter.
Extracting high variance periods. Recall that DECODE focuses on periods of mobility because during theseperiods it can observe correlated signal changes due to largescale fading. Several techniques have been proposed to detect mobility [18, 13, 15, 11]. Of these, we choose thestraightforward signal strength variance threshold detectiontechnique. DECODE divides the RSSI traces into blocks. Itthen extracts and concatenates all blocks where the varianceexceeds the specified threshold. We empirically determined
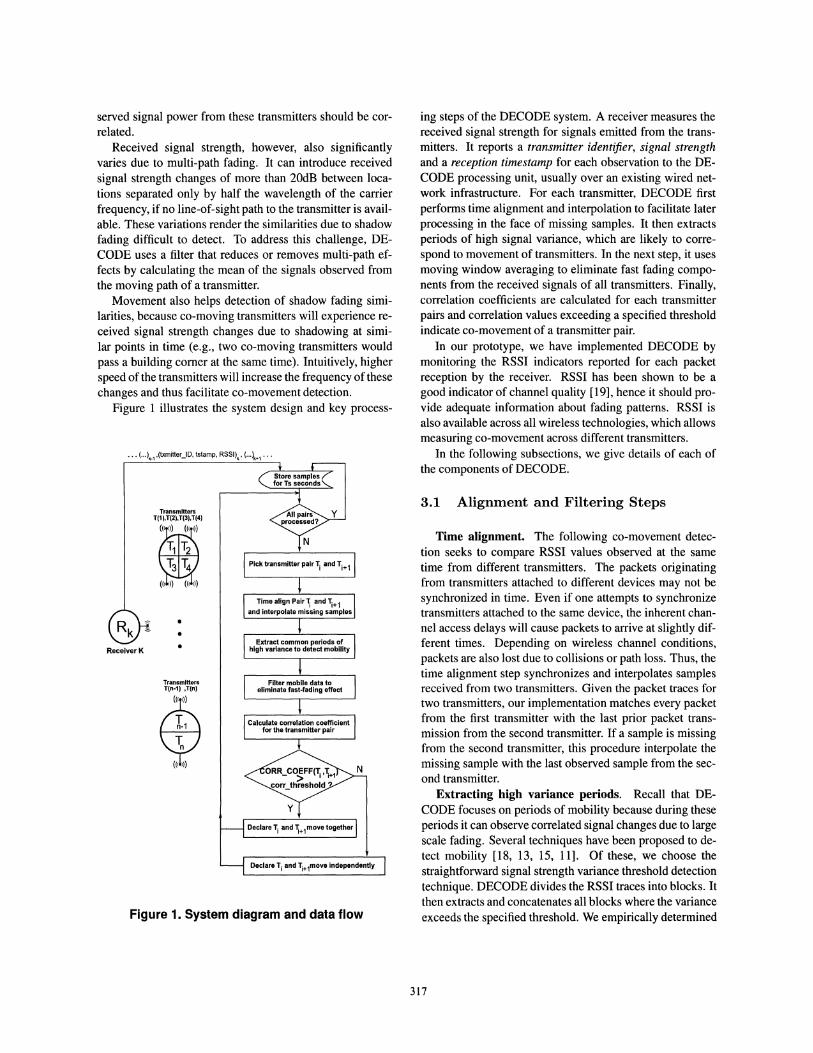
ing steps of the DECODE system. A receiver measures thereceived signal strength for signals emitted from the transmitters. It reports a transmitter identifier, signal strengthand a reception timestamp for each observation to the DECODE processing unit, usually over an existing wired network infrastructure. For each transmitter, DECODE firstperforms time alignment and interpolation to facilitate laterprocessing in the face of missing samples. It then extractsperiods of high signal variance, which are likely to correspond to movement of transmitters. In the next step, it usesmoving window averaging to eliminate fast fading components from the received signals of all transmitters. Finally,correlation coefficients are calculated for each transmitterpairs and correlation values exceeding a specified thresholdindicate co-movement of a transmitter pair.
In our prototype, we have implemented DECODE bymonitoring the RSSI indicators reported for each packetreception by the receiver. RSSI has been shown to be agood indicator of channel quality [19], hence it should provide adequate information about fading patterns. RSSI isalso available across all wireless technologies, which allowsmeasuring co-movement across different transmitters.
In the following subsections, we give details of each ofthe components of DECODE.
All pairs Yprocessed?
TransmittersT(1 ),T(2),T(3),T(4)
I(())) ((()))T1 T2T3 T4
((())) ((()))
•.. (···)k-1 ,(txmitteUD, tstamp, RSSI)k' (···~+1 ...
Receiver K
Figure 1. System diagram and data flow
served signal power from these transmitters should be correlated.
Received signal strength, however, also significantlyvaries due to multi-path fading. It can introduce receivedsignal strength changes of more than 20dB between locations separated only by half the wavelength of the carrierfrequency, if no line-of-sight path to the transmitter is available. These variations render the similarities due to shadowfading difficult to detect. To address this challenge, DECODE uses a filter that reduces or removes multi-path effects by calculating the mean of the signals observed fromthe moving path of a transmitter.
Movement also helps detection of shadow fading similarities, because co-moving transmitters will experience received signal strength changes due to shadowing at similar points in time (e.g., two co-moving transmitters wouldpass a building comer at the same time). Intuitively, higherspeed of the transmitters will increase the frequency of thesechanges and thus facilitate co-movement detection.
Figure 1 illustrates the system design and key process-
317
3.2 Detection of co-movement
4 Experimentation
where Bx and By are the sample standard deviations. Thecorrelation co-efficient lies in the interval [-1, 1], whereo indicates no correlation, +1 indicates maximum positivecorrelation, and -1 indicates maximum negative correlation.We empirically detennined a correlation coefficient threshold of 0.6 (see section 4.2), values that exceed this thresholdindicate co-movement.
I*Receivers I
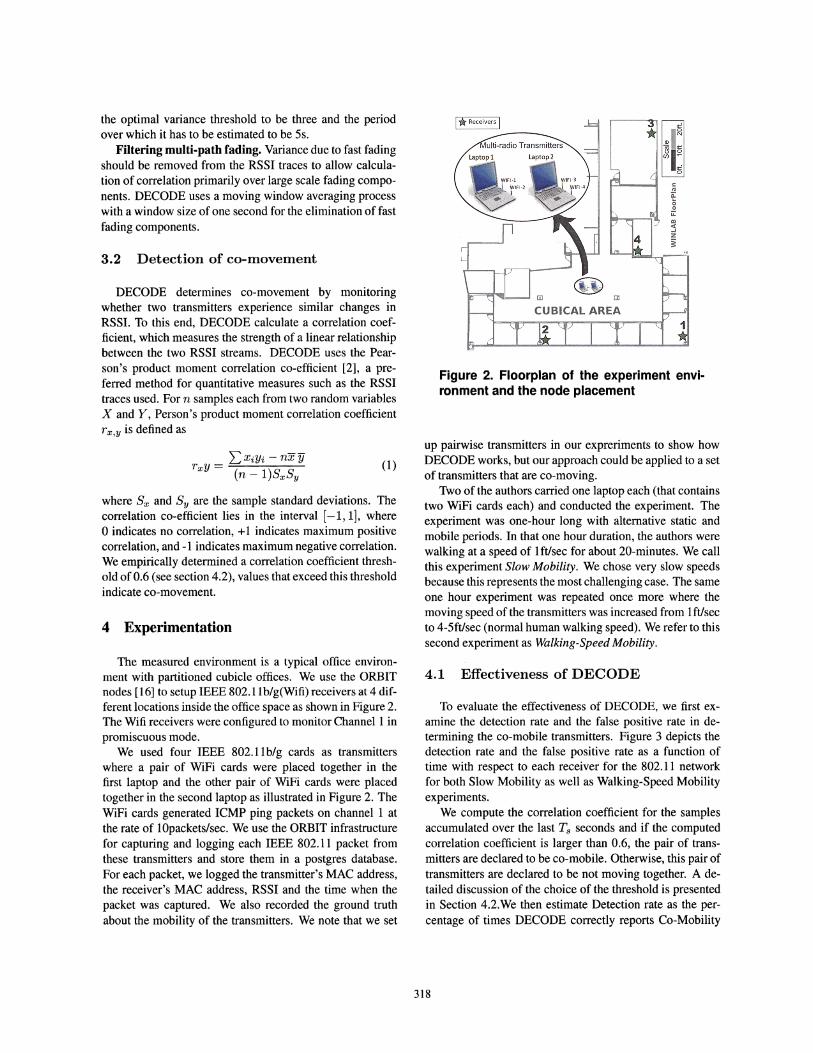
Figure 2. Floorplan of the experiment environment and the node placement
up pairwise transmitters in our expreriments to show howDECODE works, but our approach could be applied to a setof transmitters that are co-moving.
Two of the authors carried one laptop each (that containstwo WiFi cards each) and conducted the experiment. Theexperiment was one-hour long with alternative static andmobile periods. In that one hour duration, the authors werewalking at a speed of 1ft/sec for about 20-minutes. We callthis experiment Slow Mobility. We chose very slow speedsbecause this represents the most challenging case. The sameone hour experiment was repeated once more where themoving speed of the transmitters was increased from 1ft/secto 4-5ft/sec (normal human walking speed). We refer to thissecond experiment as Walking-Speed Mobility.
(1)~ XiYi - nxfi
TxY= ~-----(n - l)Bx By
DECODE determines co-movement by monitoringwhether two transmitters experience similar changes inRSSI. To this end, DECODE calculate a correlation coefficient, which measures the strength of a linear relationshipbetween the two RSSI streams. DECODE uses the Pearson's product moment correlation co-efficient [2], a preferred method for quantitative measures such as the RSSItraces used. For n samples each from two random variablesX and Y, Person's product moment correlation coefficientT x,y is defined as
the optimal variance threshold to be three and the periodover which it has to be estimated to be 5s.
Filtering multi-path fading. Variance due to fast fadingshould be removed from the RSSI traces to allow calculation of correlation primarily over large scale fading components. DECODE uses a moving window averaging processwith a window size of one second for the elimination of fastfading components.
The measured environment is a typical office environment with partitioned cubicle offices. We use the ORBITnodes [16] to setup IEEE 802.11b/g(Wifi) receivers at 4 different locations inside the office space as shown in Figure 2.The Wifi receivers were configured to monitor Channel 1 inpromiscuous mode.
We used four IEEE 802.11b/g cards as transmitterswhere a pair of WiFi cards were placed together in thefirst laptop and the other pair of WiFi cards were placedtogether in the second laptop as illustrated in Figure 2. TheWiFi cards generated ICMP ping packets on channell atthe rate of 10packets/sec. We use the ORBIT infrastructurefor capturing and logging each IEEE 802.11 packet fromthese transmitters and store them in a postgres database.For each packet, we logged the transmitter's MAC address,the receiver's MAC address, RSSI and the time when thepacket was captured. We also recorded the ground truthabout the mobility of the transmitters. We note that we set
4.1 Effectiveness of DECODE
To evaluate the effectiveness of DECODE, we first examine the detection rate and the false positive rate in determining the co-mobile transmitters. Figure 3 depicts thedetection rate and the false positive rate as a function oftime with respect to each receiver for the 802.11 networkfor both Slow Mobility as well as Walking-Speed Mobilityexperiments.
We compute the correlation coefficient for the samplesaccumulated over the last Ts seconds and if the computedcorrelation coefficient is larger than 0.6, the pair of transmitters are declared to be co-mobile. Otherwise, this pair oftransmitters are declared to be not moving together. A detailed discussion of the choice of the threshold is presentedin Section 4.2.We then estimate Detection rate as the percentage of times DECODE correctly reports Co-Mobility
318

--0.5·1
-·-5--10
100 150 200Time in Sec
80
50 100 150 200Time in Sec.
20
s:::::o
13 40~Cl
4.2 Sensitivity to Sampling Rate and Correlation Coefficient Threshold
In this section, we study the sensitivity of our schemewith respect to the different sampling rates and various correlation coefficient thresholds.
The sampling rate is defined as rate at which the transmitter transmits packets. We study the impact of varyingthe sampling rate on DECODE's effectiveness at detectingCo-Mobility.
400
-Rec1• Rec2
-+-Rec3--Rec4
SLOW MOBIUTY
100 200 300 400Time in Sec.
-Rec1aRec2
-+-Rec3--Rec4
-Rec1a Rec2
-+-Rec3-Rec4
50 100 150 200Time in Sec.
50 100 150 200Time in Sec
WALKING-SPEED M:lBlUTY
20
40
Figure 3. Effectiveness of DECODE in detecting Co-Mobility
when the pair of transmitters are indeed moving togetherand False positive rate as the percentage of times DECODEincorrectly reports Co-Mobility when the Transmitters areNOT moving together.
Figure 3 shows that in both the Walking-Speed Mobilityand Slow Mobility experiments, the detection rate increasesto 100% and the false positive rate drops to 0% as Ts increases. This is because, with more time, a better shadowfading profile that is common to the two co-mobile transmitters but completely different for the two non-eo-mobiletransmitters can be extracted.
We found that the mobility speed also has an impact onthe time required to achieve high detection rate and lowfalse positive rate. In the Walking-Speed Mobility experiment, it takes about 130 seconds to achieve 100% detectionrate with 0% false positive rate. Whereas it takes around370 seconds to achieve the same in the Slow Mobility experiment. This indicates that, with a higher moving speed,more of the shadow fading effects could be observed withina shorter duration and since we are essentially capturing theshadow fading effects for detecting co-mobile transmitters,a high detection rate could be achieved quicker in the experiment conducted under the walking speed. The results ofthe Slow Mobility experiment represent the worst case detection performance of DECODE. In the next sections, weprovide our analysis for the Walking-Speed Mobility experiment since it represents more typical scenarios for devicescarried by humans.
Figure 4. Sensitivity of DECODE to Samplingrate.
Figure 4 presents the detection rate and false positiverate as a function of time for packet sampling rates of 0.5pkt/sec, 1 pkt/sec, 5 pkt/sec, and 10 pkt/sec observed atReceiver-2. We do not present the results from other Receivers as the performance is very similar. The threshold ofthe correlation coefficient is empirically determined to be0.6. We found that for the sampling rates of 1 pkt/sec, 5pkt/sec, and 10 pkt/sec, the time taken to achieve 100% ofdetection rate and 0% of false positive rate is similar, about130 seconds, although when the sampling rate is 0.5 pkt/sec(Le., one packet every 2 seconds), the time to reach 100%detection rate increases marginally to 150 seconds. This isencouraging as it indicates that DECODE is not very sensitive to the sampling rates.
We next analyze the sensitivity of DECODE to the various thresholds T of correlation coefficients. Choosing anappropriate threshold will allow our detection scheme to berobust to false detections. Figure 5 presents the detectionrate and the false positive rate when T equals to 0.4, 0.5, 0.6,0.7 and 0.8 respectively. As expected, we observed that thedetection rate takes longer to reach 100% as the thresholdgoes up, while the false positive rate drops to 0% quicker.When T is 0.6, the false positive rate remains below 10% atall times and the detection rate reaches 100% at almost thesame time as that of smaller thresholds 0.4 and 0.5. Hence,we chose a correlation coefficient threshold of 0.6.
319

References
5 Conclusion
tiona In Proceedings ofthe Third Annual IEEE Communications Society Conference on Sensor, Mesh and Ad Hoc Communications and Networks (SECON), September 2006.
[5] Y. Cui and S. S. Ge. Autonomous vehicle positioning withgps in urban canyon environments. IEEE Transactions onRobotics and Automation, 19(1): 15-25, February 2003.
[6] N. Eagle and A. Pentland. Social serendipity: Mobilizingsocial software. IEEE Pervasive Computing, 4(2):28-34,2005.
[7] N. Eagle and A. S. Pentland. Reality mining: sensingcomplex social systems. Personal Ubiquitous Comput.,10(4):255-268, 2006.
[8] E. Elnahrawy, X. Li, , and R. P. Martin. The limits of localization using signal strength: A comparative study. InProceedings of the First IEEE International Conference onSensor and Adhoc Communcations and Networks (SECON),pages 406-414, oct 2004.
[9] J. Hightower, R. Want, and G. Borriello. SpotON: An In-door 3D Location Sensing Technology Based on RF Signal Strength. Technical Report UW CSE 2000-02-02, University of Washington, Department of Computer Science,February 2000.
[10] C. Hill and T. Kneisel. Portable radio antenna perfor-mance in the 150, 450, 800, and 900mhz bands outsideand in-vehicle. IEEE Transactions on Vehicular Technology,40(4):750-756, 1991.
[11] J. Krumm and E. Horvitz. Locadio: inferring motion andlocation from wi-fi signal strengths. In MOBIQUITOUS,pages 4-13, Aug 2004.
[12] A. M. Ladd, K. E. Bekris, A. Rudys, G. Marceau, L. E.Kavraki, and D. S. Wallach. Robotics-based location sensing using wireless ethernet. In MobiCom '02: Proceedings of the 8th annual international conference on Mobilecomputing and networking, pages 227-238, New York, NY,USA, 2002. ACM.
[13] K. Muthukrishnan, M. Lijding, N. Meratnia, and P. Havinga.Sensing motion using spectral and spatial analysis of wlanrssi. In EuroSSC, October 2007.
[14] P. Nepa, G. Manara, S. Mugnaini, G. Tribellini, S. Cioci,G. Albasini, and E. Sacchi. Differential planar antennasfor 2.4/5.2 ghz wlan applications. In IEEE Int. SymposiumofAntennas and Propagation Society, pages 973-976, July2006.
[15] N. Patwari and S. K. Kasera. Robust location distinctionusing temporal link signatures. In Proc ofACM MOBICOM,September 2007.
[16] D. Raychaudhuri, I. Seskar, M. Ott, S. Ganu, K. Ra-machandran, H. Kremo, R. Siracusa, H. Liu, and M. Singh.Overview of the orbit radio grid testbed for evaluation ofnext-generation wireless network protocols. In Proc. IEEEWCNC, volume 3, pages 1664-1669, March 2005.
[17] Z. Rong and T. S. Rappaport. Wireless Communications:Principles and Practice. Prentice Hall, 2002.
[18] T. Sohn, A. Varshavsky, A. LaMarca, M. Y. Chen, T. Choud-hury, I. Smith, S. Consolvo, J. Hightower, W. G. Griswold,and E. de Lara. Mobility detection using everyday gsmtraces. In UbiComp, pages 212-224, September 2006.
[19] K. Srinivasan and P. Levis. Rssi is under appreciated. In Pro-ceedings of the Third Workshop on Embedded NetworkedSensors (EmNets), May 2006.
30
70
60
50
40
20
1: :-:',.. ,:_--o_:_:_~'.,,: ..o 50 100 150 200
Time in Sec
100.---.---r-----
90
80
~ 't=0.4• 't =0.5
-. 't =0.6~ 't=0.7-0- 't =0.8
50 100 150 200Time in Sec.
20
10
[1] P. Bahl and V. Padmanabhan. Radar: an in-building rf-baseduser location and tracking system. In INFOCOM, pages775-784 vo1.2, 2000.
[2] K. G. Calkins. E-Book, An Introduction to Statistics.http://tinyurl.com/2jlrsu, 2008.
[3] Y. Chen, G. Chandrasekaran, E. Elnahrawy, J.-A. Francisco, K. Kleisouris, X. Li, R. P. Martin, R. S. Moore, andB. Turgut. Grail: General real time adaptable indoor localization. In Sensor Review, 2008.
[4] Y. Chen, J. Francisco, W. Trappe, and R. P. Martin. A practical approach to landmark deployment for indoor localiza-
Figure 5. Sensitivity of DECODE to Correlation Co-efficient Threshold. We pick a threshold of 0.6 for Co-Movement.
6 Acknowledgments
This material is based upon work supported by the National Science Foundation under Grant No. CNS 0627032.This work is supported in part by the US Army, Picatinny,under Contract No. W15QKN-05-D-001l.
In this work we presented DECODE, a system that detects co-moving wireless devices. DECODE's strategy isfounded on observing the correlation coefficient of streamsof RSSI values from the transmitters.
Given one minute of mobile data, DECODE can drivethe true positive rate to 100% and the false positive rate to0%. However, a key finding of this work is that mobilityis critical for our approach, and that the DECODE's effectiveness scales with both the time and speed of the devicesmobility. We also showed that DECODE's performance isinsensitive to the sampling rate and a sampling rate of 1packet/sec for 60 seconds was sufficient to achieve a nearperfect co-movement detectioin at Walking Speeds indicating that the approach is practical.
320