Decision Support for Life Cycle Management of Energy … · Decision Support for Life Cycle...
22
Petrie, Kempener, Beck, Cohen, and Basson, LCM 2007 1 Decision Support for Life Cycle Management of Energy Supply Networks Jim Petrie 12 Ruud Kempener 1 Jessica Beck 1 Brett Cohen 2 Lauren Basson 3 1. School of Chemical & Bio-molecular Engineering, Univ. of Sydney, Australia 2. Department of Chemical Engineering, University of Cape Town, South Africa 3. Centre for Environmental Strategy, University of Surrey, United Kingdon
Transcript of Decision Support for Life Cycle Management of Energy … · Decision Support for Life Cycle...

Petrie, Kempener, Beck, Cohen, and Basson, LCM 2007
1
Decision Support for Life Cycle Managementof Energy Supply Networks
Jim Petrie12
Ruud Kempener1
Jessica Beck1
Brett Cohen2
Lauren Basson3
1. School of Chemical & Bio-molecular Engineering, Univ. of Sydney, Australia2. Department of Chemical Engineering, University of Cape Town, South Africa3. Centre for Environmental Strategy, University of Surrey, United Kingdon

Petrie, Kempener, Beck, Cohen, and Basson, LCM 2007
System Influences on Decision Making
Decision making processof organisation
Social embeddedness Resource scarcity
Learning & adaptationBackground systemsMultiple autonomousdecision makers
Evolution of industrial system

Petrie, Kempener, Beck, Cohen, and Basson, LCM 2007
Global Vs Distributed Control
EFFECT CAUSE
Perspective for distributed control approach
EFFECT CAUSE
Has to make assumptions about the CAUSE and SYSTEM INTERACTION delivering a specific EFFECT.
Perspective for global control approach
CAUSE CAUSE
CAUSE
SYSTEM INTERACTION
SYSTEM INTERACTION
Can make no clear prediction about EFFECT. The EFFECT evolves based on CAUSE and SYSTEM INTERACTION.

Petrie, Kempener, Beck, Cohen, and Basson, LCM 2007
Global targets –Distributed performance
Present energy network performance
Network performance
Time
Desired energy network development pathway
Attainable energy network development pathway
GLOBAL CONTROL APPROACH: IRP setting
DISTRIBUTED CONTROL APPROACH: Analysis of possible policy intervention and feasibility of desired IRP

Petrie, Kempener, Beck, Cohen, and Basson, LCM 2007
Application of Framework
Simulation and optimization of industrial networks » Consideration of multiple objectives, dynamics, and uncertainty
Modeling of agent behavior in industrial networks – bioenergy in developing countries; coal-based power generation
Possible combined approach:» Using optimization to identify preferred trajectory» Using ABM to determine feasibility and means to narrow the gap» Applied in Beck et al., 2007; Kempener et al., 2007 (In Review)Beck, Kempener, Cohen & Petrie (2007), A Complex Systems Approach to Planning, Optimisation and
Decision Making for Energy Networks: A South African Bio-energy Case Study, Energy Policy, acceptedKempener, Beck & Petrie (2007), “An Integrated Analysis of Bio-energy Technologies – A complex
Adaptive Systems Approach, Eur Fed Chem E (B), PSEP, in review5
Petrie, Kempener, Beck, Cohen, and Basson, LCM 2007
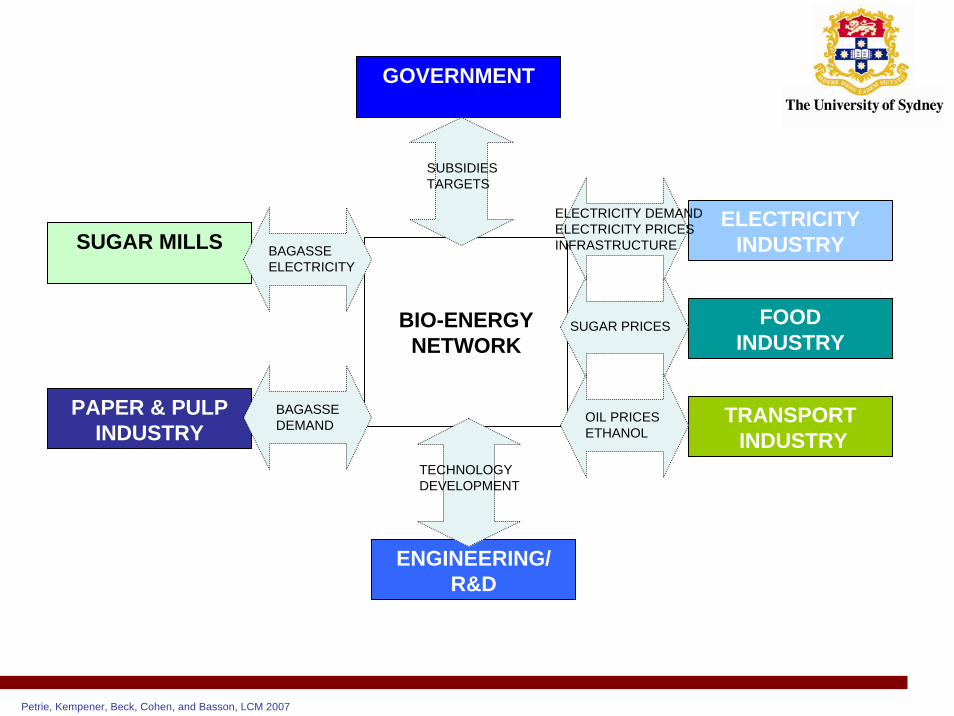
PAPER & PULP INDUSTRY
FOODINDUSTRY
ELECTRICITYINDUSTRY
TRANSPORTINDUSTRY
SUGAR MILLS
ENGINEERING/R&D
BIO-ENERGYNETWORK
GOVERNMENT
SUBSIDIESTARGETS
BAGASSEELECTRICITY
TECHNOLOGYDEVELOPMENT
BAGASSE DEMAND
SUGAR PRICES
OIL PRICESETHANOL
ELECTRICITY DEMANDELECTRICITY PRICESINFRASTRUCTURE
Petrie, Kempener, Beck, Cohen, and Basson, LCM 2007
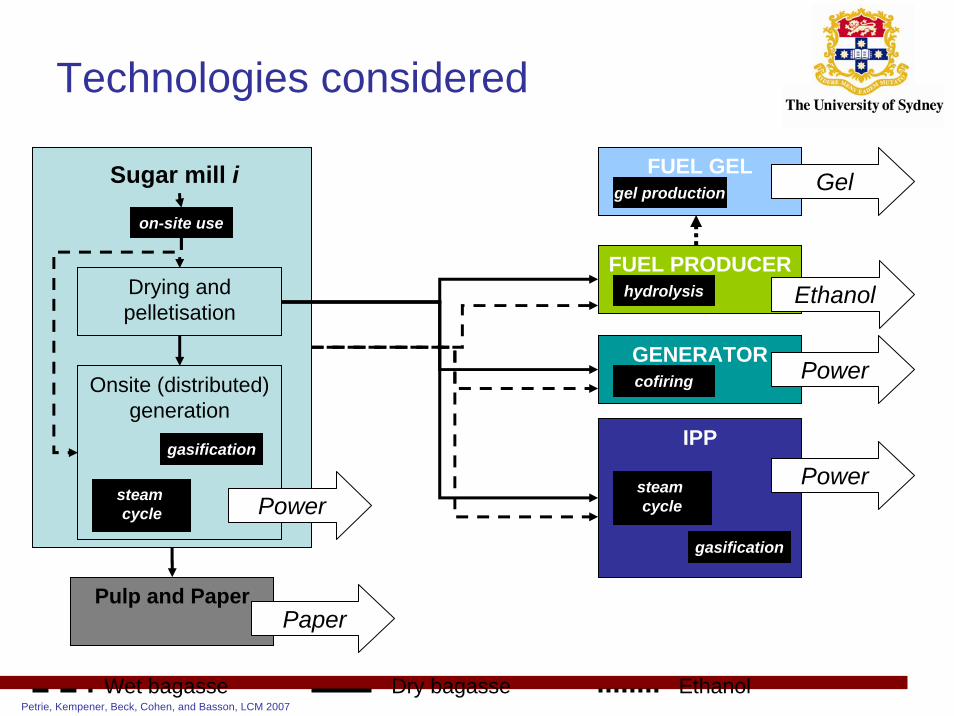
Technologies considered
Onsite (distributed)generation
GENERATOR
IPP
Drying and pelletisation
gasification
steam cycle
gasification
steam cycle
Wet bagasse Dry bagasse Ethanol
Sugar mill i
Power
Power
Pulp and Paper
Power
Paper
cofiring
FUEL PRODUCEREthanolhydrolysis
FUEL GELGelgel production
on-site use
Petrie, Kempener, Beck, Cohen, and Basson, LCM 2007
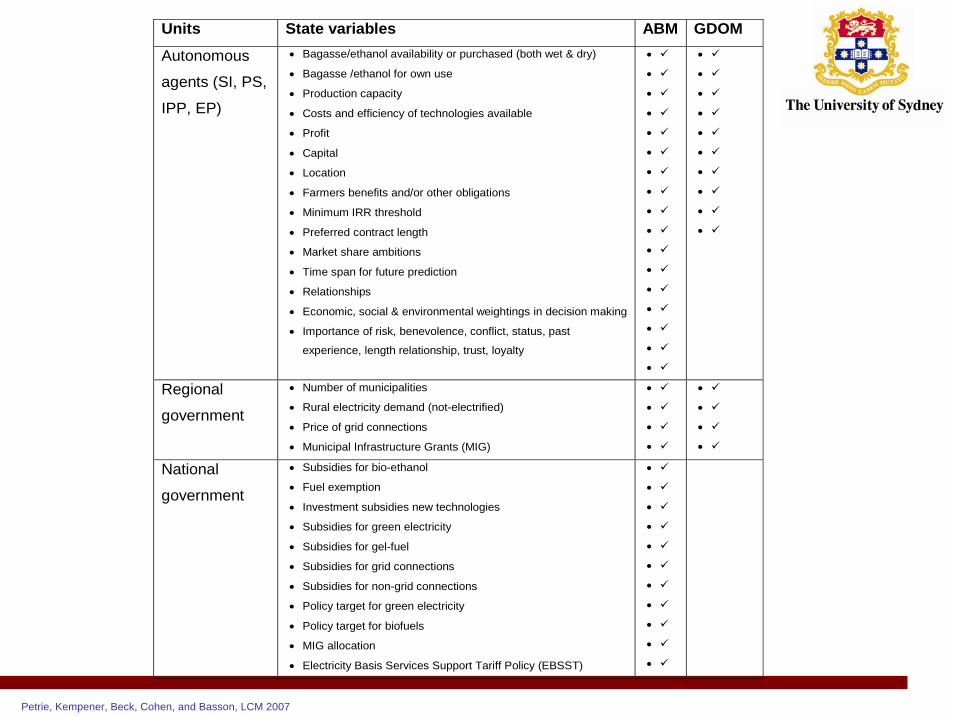
Units State variables ABM GDOM
Autonomous
agents (SI, PS,
IPP, EP)
• Bagasse/ethanol availability or purchased (both wet & dry)
• Bagasse /ethanol for own use
• Production capacity
• Costs and efficiency of technologies available
• Profit
• Capital
• Location
• Farmers benefits and/or other obligations
• Minimum IRR threshold
• Preferred contract length
• Market share ambitions
• Time span for future prediction
• Relationships
• Economic, social & environmental weightings in decision making
• Importance of risk, benevolence, conflict, status, past
experience, length relationship, trust, loyalty
•
•
•
•
•
•
•
•
•
•
•
•
•
•
•
•
•
•
•
•
•
•
•
•
•
•
•
Regional
government
• Number of municipalities
• Rural electricity demand (not-electrified)
• Price of grid connections
• Municipal Infrastructure Grants (MIG)
•
•
•
•
•
•
•
•
National
government
• Subsidies for bio-ethanol
• Fuel exemption
• Investment subsidies new technologies
• Subsidies for green electricity
• Subsidies for gel-fuel
• Subsidies for grid connections
• Subsidies for non-grid connections
• Policy target for green electricity
• Policy target for biofuels
• MIG allocation
• Electricity Basis Services Support Tariff Policy (EBSST)
•
•
•
•
•
•
•
•
•
•
•

Petrie, Kempener, Beck, Cohen, and Basson, LCM 2007
0
50
100
150
200
250
300
350
400
450
0 3 6 9 12 15 18 21 24 27 30
years
elec
trici
ty (G
Wh/
mon
th
0
20
40
60
80
100
120
140
160
etha
nol (
1000
m3/
mon
th
electricity production ethanol production
1.
2.
3. 4.
Infrastructure Shifts

Petrie, Kempener, Beck, Cohen, and Basson, LCM 2007
S6S5S4S3S1 S2 S12S10S9S7 S8
grid
EP PS IPP
local
GP
rural development
S11pel pel
electricity
bagasseethanol
gel
S6S5S4S3S1 S2 S12S10S9S7 S8
grid
EP PS IPP
local
GP
rural development
S11pel pel pel pel
electricity
bagasseethanol
gel
S6S5S4S3S1 S2 S12S10S9S7 S8
grid
EP PS IPP
local
GP
rural development
S11pel pel pel pel
electricity
bagasseethanol
gel
S6S5S4S3S1 S2 S12S10S9S7 S8
grid
EP PS IPP
local
GP
rural development
S11pel pel pel pel pel pel pel pel pel pel pel pel
electricity
bagasseethanol
gel
1. 2.
4.3.
Network Structures
yr.9 yr.15
yr.18 yr.21

Petrie, Kempener, Beck, Cohen, and Basson, LCM 2007
0
100
200
300
400
500
600
700
0 3 6 9 12 15 18 21 24 27 30years
MW
S12S10S5S8
S3S2S11S1S7S6
S4S9PS
0
100
200
300
400
500
600
700
0 3 6 9 12 15 18 21 24 27 30
years
MW
S12S11S10S9S8S7S6S5S4S3S2S1PS
market price dry bagasse
0
500
1000
1500
2000
2500
3000
3500
0 3 6 9 12 15 18 21 24 27 30
years
R/M
Wh
(eq.
)
green electricity subsidy low IRR
ethanol production
0
50
100
150
200
250
300
0 3 6 9 12 15 18 21 24 27 30
years
1000
m3/
day
green electricity subsidy low IRR
Network evolution under green electricity subsidies Network evolution under low IRRs
Emergent Behaviour

Petrie, Kempener, Beck, Cohen, and Basson, LCM 2007
Comparison GDOM and ABM
economic environmental social energy
provision
(billion ZAR) (Mt CO2 averted)
(rural energy supply) (PJ)
Economically rational agents 6.6 36.9 1.1 121.7 Agents who allow MCDM 3.4 186.9 16.0 355.8
economic environmental social energy
provision
(billion rand)
(Mtonnes co2 averted)
(rural energy supply) (PJ)
Environmental behaviour 0.2 308.3 0 637 Social behaviour -59.3 102.2 415.8 1219 Economic rational 12.7 226.6 0 913
GDOM
ABM

Petrie, Kempener, Beck, Cohen, and Basson, LCM 2007
Comparison – no biofuels
0
0.2
0.4
0.6
0.8
1
0 50 100 150 200 250 300 350TWh
environmental social economic

Petrie, Kempener, Beck, Cohen, and Basson, LCM 2007
Bio Energy Network Conclusions
The bio-energy network develops only when the price of electricity rises to a factor of 3-4 above the current price in South Africa.
Under a set of reasonable assumptions, this will likely happen only about 15 years from now (though sometimes as early as 5 years)
There is genuine potential to address rural electrification needs by decentralised power production at the various sugar mills.
Under a wide range of scenarios, Power Producers take up the bagasse resource
The production of green electricity on the basis of wet bagasse is detrimental to the environment, as CO2 emissions from transport would outweigh the CO2 averted through the production of green electricity.
It seems that investment subsidies are more beneficial than price subsidies.
Investment subsidies would allow sugar mills to invest in pelletisers, which would allow Power Producers to produce green electricity more quickly and with higher profit margins

Petrie, Kempener, Beck, Cohen, and Basson, LCM 2007
Coal Network Considered
PS 2
Adjacent Mine
Alternative Mine
Coal up to“contracted” LF
Additional Coal sourced In one of three ways
Road
Conveyor
PS 1
Adjacent Mine
Alternative Mine
Road
Conveyor
PS n
National electricity demand
Other non-coal based electricity sources (nuclear,
hydro etc)H2O CO2 SO2
H2OCO2 SO2
Ash
SO2CO2
Emissions/inputs

Petrie, Kempener, Beck, Cohen, and Basson, LCM 2007
31000
36000
41000
46000
51000
56000
2002 2003 2004 2005 2006 2007 2008 2009 2010 2011 2012 2013 2014 2015 2016 2017 2018 2019 2020 2021
Cum
ulat
ive
capa
city
(MW
)
Existing system Recommisioned coal stations Open cycle gas turbineCoal fired Fluidized bed combustion (FBC) Coal-Fired Pulverized fuel combustion (PF) Pebble bed modular reactorCombined cycle gas turbine (pipeline) Advanced light water nuclear reactor Peak demand

Petrie, Kempener, Beck, Cohen, and Basson, LCM 2007
0.0E+00
5.0E+06
1.0E+07
1.5E+07
2.0E+07
2.5E+07
3.0E+07
3.5E+07
Arnot O
C/OC
Duvha
OC/U
GHen
drina
OC/U
GKrie
l UG/U
GMatl
a UG/U
GLe
thabo
OC/U
G
Majuba
Wet
UG/UG
Tutuka
UG/U
GCam
den O
C/OC
Grootvl
ei OC/U
GKom
ati O
C/UG
Kenda
l UG/O
C
Majuba
Dry
UG/OC
Matimba
OC/U
G
New 1
- PF O
C/OC
New 2
- PF O
C/UG
New 3
- FBC O
C/UG
MW
hSO
contracted additional (contracted) additional (alt conv) additional (alt road)
Wet/Wet Wet/Dry Dry/Dry
Least Cost: Year 8
Lethabo and KomatiOnly run at contracted load
Some source additionalcoal from contracted mineothers from alternative mine

Petrie, Kempener, Beck, Cohen, and Basson, LCM 2007
0.0E+00
5.0E+06
1.0E+07
1.5E+07
2.0E+07
2.5E+07
3.0E+07
3.5E+07
Arnot O
C/OC
Duvha
OC/U
GHen
drina
OC/U
GKrie
l UG/U
GMatl
a UG/U
GLe
thabo
OC/U
G
Majuba
Wet
UG/UG
Tutuka
UG/U
GCam
den O
C/OC
Grootvl
ei OC/U
GKom
ati O
C/UG
Kenda
l UG/O
C
Majuba
Dry
UG/OC
Matimba
OC/U
G
New 1
- PF O
C/OC
New 2
- PF O
C/UG
New 3
- FBC O
C/UG
MW
hSO
contracted additional (contracted) additional (alt conv) additional (alt road)
Wet/Wet Wet/Dry Dry/Dry
Least CO2: Year 8
Lethabo and Komatistill only run at contracted load, as well as Camden
Conveyor from alternative mine preferred to road

Petrie, Kempener, Beck, Cohen, and Basson, LCM 2007
SO2 Emissions/MWhSO
0.009
0.0095
0.01
0.0105
0.011
0.0115
0.012
1 2 3 4 5 6 7 8 9 10 11 12 13 14 15 16
Year
t/MW
hSO
Base Case - Least Cost Base Case - Least SO2
Alternative Build Plan least Cost Alternative Build Plan Least SO2

Petrie, Kempener, Beck, Cohen, and Basson, LCM 2007
CO2 emissions/MWhSO
0.99
1
1.01
1.02
1.03
1.04
1.05
1.06
1.07
1.08
1.09
1 2 3 4 5 6 7 8 9 10 11 12 13 14 15 16
Year
t/MW
hSO
Base Case - Least Cost Base Case - Least CO2Alternative Build Plan - Least Cost Alternative Build Plan - Least CO2

Petrie, Kempener, Beck, Cohen, and Basson, LCM 2007
Model Opportunities
Nature of coal mine-power station supply contracts:» Length of contracts» Quality and price considerations» Opportunity for renegotiation» Decision related to coal sourcing» Decision making around transport modes
Improved resolution on coal quality
Trade offs between beneficiation and desulphurisationtechnologies
Geographical Specificity

Petrie, Kempener, Beck, Cohen, and Basson, LCM 2007
Overall Conclusions
• A combination of Agent-based models and Global optimisation models has real potential for analysis of complex industry networks
• Insights helpful in guiding policy formulation, rolling out investment and development strategies, and positioning industries for enhanced competitive advantage