Decision Framework for Selection of Managed Lanes Strategies
56
Technical Report Documentation Page 1. Report No. FHWA/TX-05/0-4160-21 2. Government Accession No. 3. Recipient's Catalog No. 5. Report Date July 2005 Resubmitted: November 2005 4. Title and Subtitle DECISION FRAMEWORK FOR SELECTION OF MANAGED LANES STRATEGIES 6. Performing Organization Code 7. Author(s) Grant Fisher and Ginger Goodin 8. Performing Organization Report No. Report 0-4160-21 10. Work Unit No. (TRAIS) 9. Performing Organization Name and Address Texas Transportation Institute The Texas A&M University System College Station, Texas 77843-3135 11. Contract or Grant No. Project 0-4160 13. Type of Report and Period Covered Technical Report: September 2003 - May 2005 12. Sponsoring Agency Name and Address Texas Department of Transportation Research and Technology Implementation Office P. O. Box 5080 Austin, Texas 78763-5080 14. Sponsoring Agency Code 15. Supplementary Notes Project performed in cooperation with the Texas Department of Transportation and the Federal Highway Administration. Project Title: Operating Freeways with Managed Lanes – Task 6: Decision Matrix URL: http://tti.tamu.edu/documents/0-4160-21.pdf 16. Abstract This report documents the development of a decision support methodology that accomplishes two objectives: (1) sorts out the relationships between managed lanes concepts and strategies, and (2) maps the knowledge territory in order to identify gaps. In conjunction with this particular research task, a user-friendly preliminary screening tool has been developed to assist the Texas Department of Transportation (TxDOT) in identifying managed lanes strategy options very early in the conceptual planning process. The framework for the decision support methodology is the backbone for the Managed Lanes Handbook, which offers the resources and guidance to develop a managed lanes project, addressing characteristics unique to individual facilities. This report also summarizes the evolution of managed lanes in Texas over the last five years, the legislative initiatives that have shaped TxDOT’s current approach to implementation, and the gaps in the knowledge base that still leave many questions unanswered. At the national level managed lanes are a relatively new and emerging concept. However, TxDOT has led the nation in research and development with two high- occupancy toll (HOT) lanes and 10 freeway high-occupancy vehicle (HOV) facilities in operation and over a dozen managed lanes projects currently under development in 10 Texas cities. Even with the experience to date, there are still many unanswered questions related to the long-term operation of managed lanes and numerous unknown factors that will require further research and documented practical experience through diligent monitoring and evaluation of facilities as they are implemented. 17. Key Words Managed Lanes, Express Toll Lanes, HOV Lanes, HOT Lanes, Express Lanes, Exclusive Transitways, Dedicated Truck Lanes, Exclusive Truck Lanes, Truck Restricted Lanes 18. Distribution Statement No restrictions. This document is available to the public through NTIS: National Technical Information Service Springfield, Virginia 22161 http://www.ntis.gov 19. Security Classif.(of this report) Unclassified 20. Security Classif.(of this page) Unclassified 21. No. of Pages 56 22. Price Form DOT F 1700.7 (8-72) Reproduction of completed page authorized
Transcript of Decision Framework for Selection of Managed Lanes Strategies
Technical Report Documentation Page 1. Report No. FHWA/TX-05/0-4160-21
2. Government Accession No.
3. Recipient's Catalog No. 5. Report Date July 2005 Resubmitted: November 2005
4. Title and Subtitle DECISION FRAMEWORK FOR SELECTION OF MANAGED LANES STRATEGIES
6. Performing Organization Code
7. Author(s) Grant Fisher and Ginger Goodin
8. Performing Organization Report No. Report 0-4160-21 10. Work Unit No. (TRAIS)
9. Performing Organization Name and Address Texas Transportation Institute The Texas A&M University System College Station, Texas 77843-3135
11. Contract or Grant No. Project 0-4160 13. Type of Report and Period Covered Technical Report: September 2003 - May 2005
12. Sponsoring Agency Name and Address Texas Department of Transportation Research and Technology Implementation Office P. O. Box 5080 Austin, Texas 78763-5080
14. Sponsoring Agency Code
15. Supplementary Notes Project performed in cooperation with the Texas Department of Transportation and the Federal Highway Administration. Project Title: Operating Freeways with Managed Lanes – Task 6: Decision Matrix URL: http://tti.tamu.edu/documents/0-4160-21.pdf 16. Abstract This report documents the development of a decision support methodology that accomplishes two objectives: (1) sorts out the relationships between managed lanes concepts and strategies, and (2) maps the knowledge territory in order to identify gaps. In conjunction with this particular research task, a user-friendly preliminary screening tool has been developed to assist the Texas Department of Transportation (TxDOT) in identifying managed lanes strategy options very early in the conceptual planning process. The framework for the decision support methodology is the backbone for the Managed Lanes Handbook, which offers the resources and guidance to develop a managed lanes project, addressing characteristics unique to individual facilities.
This report also summarizes the evolution of managed lanes in Texas over the last five years, the legislative initiatives that have shaped TxDOT’s current approach to implementation, and the gaps in the knowledge base that still leave many questions unanswered. At the national level managed lanes are a relatively new and emerging concept. However, TxDOT has led the nation in research and development with two high-occupancy toll (HOT) lanes and 10 freeway high-occupancy vehicle (HOV) facilities in operation and over a dozen managed lanes projects currently under development in 10 Texas cities. Even with the experience to date, there are still many unanswered questions related to the long-term operation of managed lanes and numerous unknown factors that will require further research and documented practical experience through diligent monitoring and evaluation of facilities as they are implemented. 17. Key Words Managed Lanes, Express Toll Lanes, HOV Lanes, HOT Lanes, Express Lanes, Exclusive Transitways, Dedicated Truck Lanes, Exclusive Truck Lanes, Truck Restricted Lanes
18. Distribution Statement No restrictions. This document is available to the public through NTIS: National Technical Information Service Springfield, Virginia 22161 http://www.ntis.gov
19. Security Classif.(of this report) Unclassified
20. Security Classif.(of this page) Unclassified
21. No. of Pages 56
22. Price
Form DOT F 1700.7 (8-72) Reproduction of completed page authorized


DECISION FRAMEWORK FOR SELECTION OF MANAGED LANES STRATEGIES
by
Grant Fisher Student Technician IV
Texas Transportation Institute
and
Ginger Goodin Research Engineer
Texas Transportation Institute
Report 0-4160-21 Project 0-4160
Project Title: Operating Freeways with Managed Lanes – Task 6: Decision Matrix
Performed in Cooperation with the Texas Department of Transportation
and the Federal Highway Administration
July 2005 Resubmitted: November 2005
TEXAS TRANSPORTATION INSTITUTE The Texas A&M University System College Station, Texas 77843-3135

v
DISCLAIMER
The contents of this report reflect the views of the authors, who are responsible for the
facts and the accuracy of the data presented herein. The contents do not necessarily reflect the
official view or policies of the Federal Highway Administration (FHWA) or the Texas
Department of Transportation (TxDOT). This report does not constitute a standard,
specification, or regulation. The engineer in charge was Ginger Goodin, Texas P.E. # 64560.

vi
ACKNOWLEDGMENTS
This project was conducted in cooperation with TxDOT and FHWA. The authors would
like to thank the research program coordinator Gary K. Trietsch, Houston District Engineer, and
project director Carlos Lopez, Director of Traffic Operations Division (TRF) of TxDOT, for
their leadership and guidance. The authors are also grateful to John Wikander and Heather Ford
of the Texas Transportation Institute, who supported this task.
Additionally, the authors would like to extend their sincere appreciation to members of
the Project Monitoring Committee, TxDOT Research and Technology Implementation Office
(RTI) staff, and TxDOT Managed Lanes Project Managers Committee from across the state, who
offered thoughtful insight vital to the research. The research team thanks the following
individuals for their participation on these committees:
• Wade Odell, P.E., RTI, TxDOT
• Andrew Griffith, RTI, TxDOT
• Sharon Barta, RTI, TxDOT
• Alex Powers, TRF, TxDOT
• Joseph Carrizales, P.E., Austin District, TxDOT
• Thien Nguyen, Austin District, TxDOT
• Diana Schulze, Austin District, TxDOT
• Matt MacGregor, Dallas District, TxDOT
• Marty Boyd, P.E., El Paso District, TxDOT
• Mohammed Al Hweil, Ft. Worth District, TxDOT
• Curtis Hanan, Ft. Worth District, TxDOT
• Greg Ofield, P.E., Houston District, TxDOT
• Roger Gonzalez, Houston District, TxDOT
• Hassan Nikooei, Houston District, TxDOT
• Jennifer Moczygemba, San Antonio District, TxDOT
• Judy Friesenhahn, P.E., San Antonio District, TxDOT
• Brian Fariello, San Antonio District, TxDOT
• Julie Brown, P.E., San Antonio District, TxDOT
• Frank Fonseco, San Antonio District, TxDOT

vii
• Randy Redmond, Tyler District, TxDOT
• John Obr, Waco District, TxDOT
• Alisa Polansky, Waco District, TxDOT
• Reggie Richardson, Waco District, TxDOT
• David Neumann, Waco District, TxDOT
• Charles H. Berry, P.E., El Paso District, TxDOT
• David B. Casteel, P.E., San Antonio District, TxDOT
• Maribel P. Chavez, P.E., Fort Worth District, TxDOT
• Robert B. Daigh, P.E., Austin, TxDOT
• Clint Jumper, P.E., Traffic Operations Division, TxDOT
• William L. Hale, P.E., Dallas District, TxDOT
• Mark A. Marek, P.E., Design Division, TxDOT
• Mary M. Owen, P.E., Tyler District, TxDOT
• James Randall, Transportation Planning and Programming Division, TxDOT
• Carol Rawson, P.E., Traffic Operations Division, TxDOT
• Phillip Russell, P.E., Texas Turnpike Authority, TxDOT
• Amadeo Saenz, Jr., P.E., Assistant Executive Director for Engineering Operations,
TxDOT
• Richard Skopik, P.E., Waco District, TxDOT

ix
TABLE OF CONTENTS
Page List of Figures................................................................................................................................ x List of Tables ................................................................................................................................ xi Chapter 1: Introduction .............................................................................................................. 1
Purpose of Study ......................................................................................................................... 1 Overview of Managed Lanes ...................................................................................................... 1
Candidate Strategies for Managed Lanes in Texas................................................................. 4 Policy and Legislative Framework for Managed Lanes Strategy Selection ............................... 5
Chapter 2: Managed Lanes Development Process ................................................................... 7 Chapter 3: Strategy Selection Screening Tool......................................................................... 11
Background on Screening Tool ................................................................................................ 11 Goals and Objectives for Managed Lanes ................................................................................ 12
User Input of Objectives in Screening Tool ......................................................................... 16 Correlation of Objectives to Strategies ................................................................................. 16 Weighting of Objectives ....................................................................................................... 18
Corridor Considerations............................................................................................................ 19 Exclusionary Tests ................................................................................................................ 20
Results from the Strategy Selection Tool ................................................................................. 22 Defining User Groups ............................................................................................................... 22
Chapter 4: Research Gaps ........................................................................................................ 25 Explanation of the Gaps Identified in the Project 0-4160 Research......................................... 25
Planning and Policy Research Gaps ..................................................................................... 25 Design and Operations Research Gaps ................................................................................. 26 Future Research .................................................................................................................... 27
References.................................................................................................................................... 29 Appendix A: Expert Survey................................................................................................................31 Appendix B: Survey Responses in Array...……………………………………………...……...35 Appendix C: Data Requirements for Screening Tool………………………………………………39 Appendix D: Screening Tool Rating System for Exclusionary Tests........................................ 41

x
LIST OF FIGURES Page Figure 1. Types of Managed Lanes (3). .......................................................................................... 3 Figure 2. Managed Lanes Project Development Process................................................................ 8 Figure 3. Simplified Conceptual Decision Process Flow Diagram. ............................................... 9 Figure 4. Flow Diagram Showing Elements of the Decision Process Incorporated into the
Strategy Selection Tool......................................................................................................... 11 Figure 5. Flow Diagram for Strategy Screening Tool. ................................................................. 13 Figure 6. Weighting Screen. ......................................................................................................... 19 Figure 7. Life Cycle of a Facility (3). ........................................................................................... 23

xi
LIST OF TABLES Page Table 1. Descriptions of Managed Lanes Strategies....................................................................... 4 Table 2. Possible Managed Lanes Goals. ..................................................................................... 14 Table 3. Typical Project Objectives for Managed Lanes.............................................................. 15 Table 4. Managed Lane Strategies and Associated Objectives. ................................................... 17 Table 5. Corridor Considerations in Strategy Selection. .............................................................. 20 Table 6. Potential Vehicle User Group Scenarios. ....................................................................... 24


1
CHAPTER 1:
INTRODUCTION
PURPOSE OF STUDY
This report documents one task in the managed lanes research effort to develop a decision
support methodology – also known as the “decision matrix” – that accomplishes two objectives:
• sorts out relationships between managed lanes concepts and strategies; and
• maps the knowledge territory, identifying gaps in knowledge.
The framework for the decision support methodology is the backbone for the managed
lanes handbook, which offers the resources and guidance to develop a managed lanes project,
addressing characteristics unique to individual facilities. In conjunction with this research task, a
user-friendly preliminary screening tool has been developed to assist the Texas Department of
Transportation (TxDOT) project managers with identifying managed lanes strategy options very
early in the conceptual planning process.
This report also summarizes the evolution of managed lanes in Texas over the last five
years and the legislative initiatives that have shaped TxDOT’s current approach to
implementation of managed lanes facilities. Although managed lanes is a newly emerging
concept nationally, TxDOT has led the nation in research and development of facilities with two
high-occupancy toll (HOT) lanes and 10 freeway high-occupancy vehicle (HOV) facilities in
operation and over a dozen managed lanes projects currently under development in 10 Texas
cities. Even with the research developed to date and the hands-on experience of TxDOT project
managers, there are still many unanswered questions related to the long-term operation of
managed lanes facilities and unknown factors that will require further research and documented
practice through diligent monitoring and evaluation of facilities as they are implemented.
OVERVIEW OF MANAGED LANES
The term managed lanes evokes different meanings and connotations depending on the
public agency or individual project. There is no nationally recognized definition of managed
lanes. However, TxDOT developed a definition in 2000 in conjunction with this research project

2
that serves as the agency’s official definition. It defines managed lanes in very broad terms to
allow flexibility within the diverse urban areas across the state:
“A managed lane facility is one that increases freeway efficiency by packaging
various operational and design actions. Lane management operations may be
adjusted at any time to better match regional goals (1).”
As specific managed lanes projects in Texas undergo the planning and design process, the
definition has been tailored to address specific project needs. For example, the following
variation on the TxDOT definition was developed for the I-635 (LBJ) managed lanes project in
Dallas:
“Managed lanes increase freeway efficiency by offering a predictable trip
with little congestion for those who carpool, ride bus transit, vanpool, ride a
motorcycle or if driving alone, are willing to pay a toll. Lane management
operations and pricing structure may be adjusted at any time to better serve
modal needs (2).”
This project definition narrows the broad statewide definition by specifically addressing
priority user groups and the use of pricing as a means to achieve objectives for the LBJ managed
lanes project.
Figure 1 is a diagram that captures the potential lane management applications that fall
into this broad definition of managed lanes. On the left of the diagram are the applications of a
single operational strategy – pricing, vehicle eligibility, or access control – and on the right are
the more complicated managed lanes facilities that blend more than one of these strategies. The
multifaceted facilities on the far right of the diagram are those that incorporate or blend multiple
lane management strategies.

3
Express LanesReversible Lanes
HOT Lanes
AccessControl
VehicleEligibility
Pricing Value Priced LanesToll Lanes
HOV LanesTruck Lane RestrictionsUse of HOV Lanes byOther Vehicle Groups
BuswaysTransitwaysExclusive Truck
Facilities
MultifacetedManaged Lanes
Facilities
Lane
Man
agem
ent S
trate
gy
Increasing Complexity with Active Management
Incorporates Multiple Lane Management
Strategies
Figure 1. Types of Managed Lanes (3).
The Federal Highway Administration (FHWA) also views managed lanes in this broad
sense, as highway facilities or a set of lanes where operational strategies are proactively (real-
time) implemented and managed in response to changing conditions (3). Agencies have used
lane management strategies for decades to improve flow on freeway facilities. The distinction
between managed lanes and other traditional forms of freeway lane management is the operating
philosophy of “active management.” Under this philosophy, the operating agency proactively
manages demand and available capacity on the facility by applying new strategies or modifying
existing strategies. The agency defines from the outset the operating objectives for the managed
lanes and the kinds of actions that will be taken once predefined performance thresholds are met.
The following examples show how demand on a managed lane facility can be reduced through a
specific action:
• To maintain a speed of 60 mph, the operating agency raises the toll rate on a priced
facility.
• To ensure that bus operating speeds of 50 mph can be maintained, the agency raises
the occupancy requirement to use a HOV lane.
4
• To operate within a volume threshold of 1500 vehicles per hour per lane, the agency
closes an on-ramp to express lanes during peak periods.
At the core of the active management philosophy is the development of clear
performance objectives and operating threshold values that directly relate to the goals of the
project. Additionally, a managed lane facility can be designed and operated to achieve different
objectives during different days of the week or different times of the day. For example, a facility
could operate as a HOV or HOT lane during peak periods, toll express lanes during off-peaks,
and potentially serve as a truck-only facility at certain times of the day.
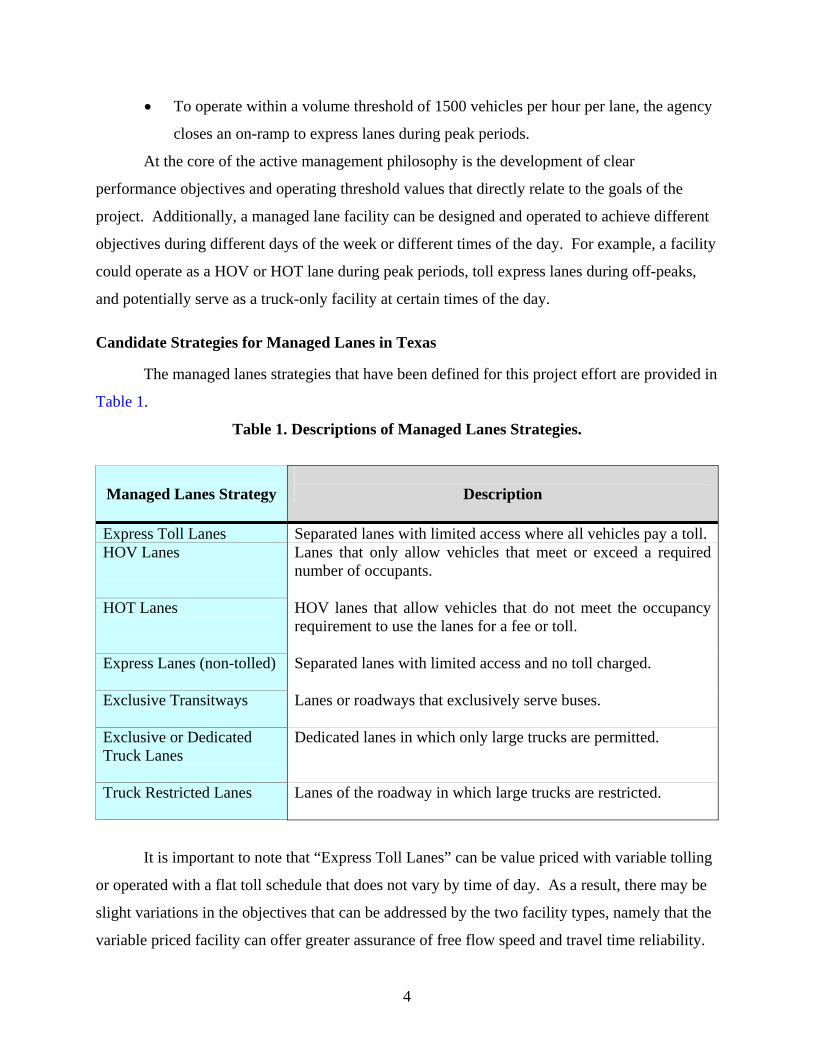
Candidate Strategies for Managed Lanes in Texas
The managed lanes strategies that have been defined for this project effort are provided in
Table 1.
Table 1. Descriptions of Managed Lanes Strategies.
Managed Lanes Strategy
Description
Express Toll Lanes Separated lanes with limited access where all vehicles pay a toll. HOV Lanes
Lanes that only allow vehicles that meet or exceed a required number of occupants.
HOT Lanes
HOV lanes that allow vehicles that do not meet the occupancy requirement to use the lanes for a fee or toll.
Express Lanes (non-tolled)
Separated lanes with limited access and no toll charged.
Exclusive Transitways
Lanes or roadways that exclusively serve buses.
Exclusive or Dedicated Truck Lanes
Dedicated lanes in which only large trucks are permitted.
Truck Restricted Lanes
Lanes of the roadway in which large trucks are restricted.
It is important to note that “Express Toll Lanes” can be value priced with variable tolling
or operated with a flat toll schedule that does not vary by time of day. As a result, there may be
slight variations in the objectives that can be addressed by the two facility types, namely that the
variable priced facility can offer greater assurance of free flow speed and travel time reliability.
5
POLICY AND LEGISLATIVE FRAMEWORK FOR MANAGED LANES STRATEGY SELECTION
Motivation for managed lanes has evolved in Texas since the beginning of this research
project in 2000. Early emphasis was placed on a broad definition of managed lanes that
embraces multiple operating strategies, with pricing (specifically variable toll rates) viewed
primarily as one of a number of demand management techniques. At that time, little importance
was placed on revenue implications. With the passage of HB 3588 by the Texas Legislature in
2003 – legislation that instituted broad sweeping changes in the way Texas highways are
financed – a philosophical shift has taken place in the view of managed lanes in the state. The
new view of managed lanes places greater emphasis on pricing as a means to offset
implementation and operating costs.
Most urban areas in Texas are now evaluating managed lanes in existing highway
corridors, partially as a means to offer travel options but with greater interest as a mechanism to
implement new departmental policy that requires all new capacity to be evaluated for tolling.
Revenue expectations for managed lanes have been predictably low, particularly for single-lane
directional facilities, and cost recovery has traditionally assumed to be at a level that covers
operations and possibly a small portion of capital costs. TxDOT has nonetheless adopted the
approach that revenue generated from tolling new lanes is a prudent policy, in that it frees up
funding that would have otherwise been needed for operations and maintenance of the facility.
The far-reaching and rapid paradigm shift within the department has translated into an evolution
of the original expectations of the research project since its inception five years ago. The
philosophical shift, however, has potentially led to more widespread implementation of managed
lanes in Texas than would have otherwise naturally developed, albeit with a greater emphasis on
the revenue-producing benefits of the facility.
As the managed lanes philosophy in Texas has evolved, the resulting “decision matrix” or
strategy selection methodology developed under this research task represents TxDOT’s policies
toward tolling and managed lanes.

7
CHAPTER 2: MANAGED LANES DEVELOPMENT PROCESS
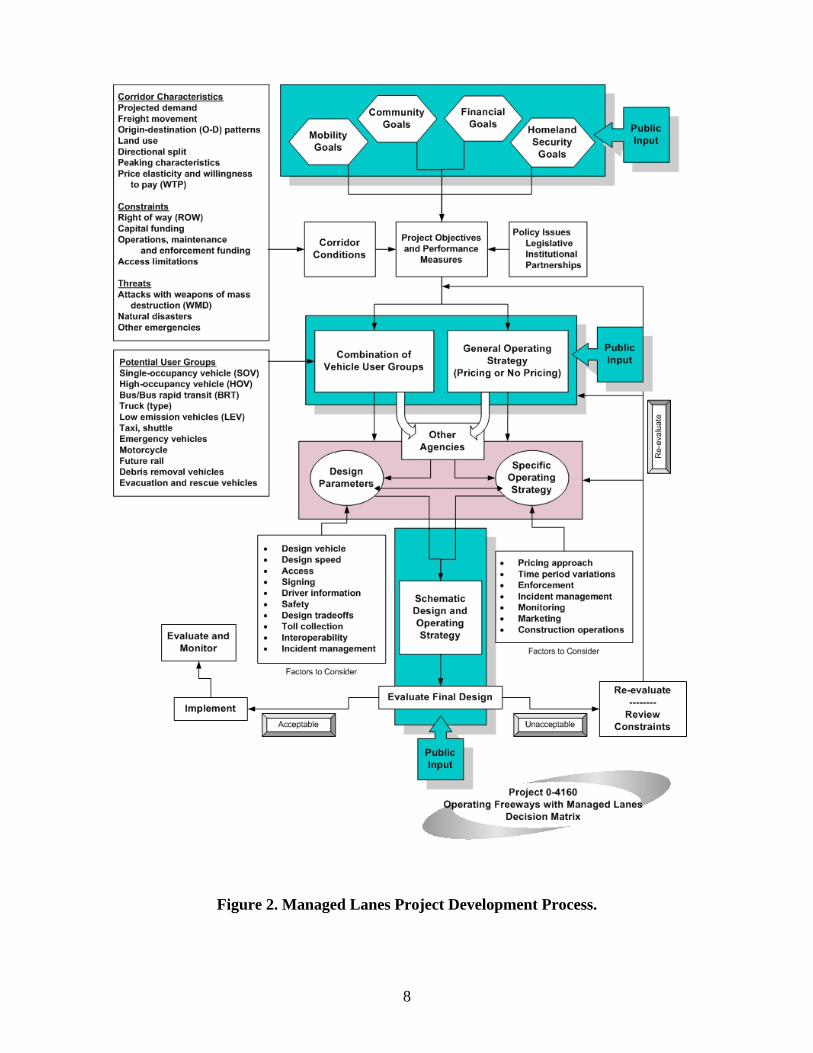
The first step in developing a decision support process was the construction of the flow
chart presented in Figure 2. The flow chart maps the general project development process with
additional elements unique to managed lanes: identification of managed lanes operating strategy
and potential user groups (4). The flow chart benefited from review by a group of TxDOT
project managers, the TTI Advisory Committee, and a national peer review by individuals
involved in pricing projects throughout the country. Even with the evolution of TxDOT’s
philosophy on managed lanes over the course of the project, the flow diagram has remained
relevant.
Figure 3 provides a simplified version of the flow diagram. The intent of this research
task is to develop a decision framework for the upper area of the flow chart:
• to identify potential managed lanes strategies for a corridor that are based on goals
and objectives for the project, and
• to use the project objectives coupled with corridor influences to narrow the strategy
list.
The bottom portion of the simplified flow chart shows that operational considerations and
design parameters come into play once the operating strategy and resulting user groups are
defined. The other tasks for the larger Project 0-4160 research effort support the lower boxes of
the flow diagram with development steps that involve the design of the facility and the
operational components necessary for implementation. These are briefly highlighted below and
can be found in more detail in the managed lanes handbook:
• geometric design – access type and spacing, weaving distances;
• traffic control devices – signs and markings for driver information;
• enforcement – approaches for ensuring compliance;
• incident management – guidance for operational approaches;
• interim use – use of managed lanes under special situations;
• evaluation and monitoring – guidance for post-project monitoring; and
• staffing and training – staffing needs given complexities of operation.
8
Figure 2. Managed Lanes Project Development Process.

9
Figure 3. Simplified Conceptual Decision Process Flow Diagram.
In the next chapter, a methodology for preliminary screening is presented that can assist
with the identification of potential managed lanes strategies for a given corridor.
GoalsMobility Community Financial
Project ObjectivesCorridor
Characteristics
Policy Issues
Resulting Operating Strategy
Operational Considerations
Design Parameters
Project 0-4160
Research
Vehicle User GroupsProject 0-4160
Research


11
CHAPTER 3: STRATEGY SELECTION SCREENING TOOL
BACKGROUND ON SCREENING TOOL
The purpose of the strategy selection tool is to provide a preliminary screening
instrument for TxDOT project managers to use that helps define the types of managed lanes
strategies that would be conducive for a given corridor. The screening tool is based on the upper
elements in the flow diagram shown in the outlined box in Figure 4. It is a simple tool that
primarily relies on the defined objectives for the improvements in defining the potential
operating strategies.
Figure 4. Flow Diagram Showing Elements of the Decision Process Incorporated into the
Strategy Selection Tool.
GoalsMobility Community Financial
Project Objectives
Operational Considerations
Design Parameters
Project 0-4160
Research
Vehicle User GroupsProject 0-4160
Research
Corridor Characteristics
Policy Issues
Resulting Operating Strategy
Managed Lanes Strategy Screening Tool

12
The managed lanes strategy screening tool was created to facilitate the decision-making
process by identifying potential managed lanes scenarios to implement. The program
incorporates many different calculations made to determine the best possible scenario based
upon the objectives chosen by the user. It is important to note that it is a very quick and simple
tool to be used early in the planning process to help sort out possible managed lanes operating
scenarios. Other screening tools offer further refinement of potential strategies, such as the High
Occupancy Toll Strategy Analysis Tool (HOT START) developed for Project 0-4898. That
particular tool evaluates the use of HOT lanes in HOV corridors, either through adapting existing
HOV lanes or by building HOT lanes instead of HOV lanes in corridors where HOV lanes are
planned. As an illustration, if the managed lanes strategy screening tool identifies HOV and
HOT as strong candidate strategies, the analyst may consider using the HOT START tool to
further refine the decision.
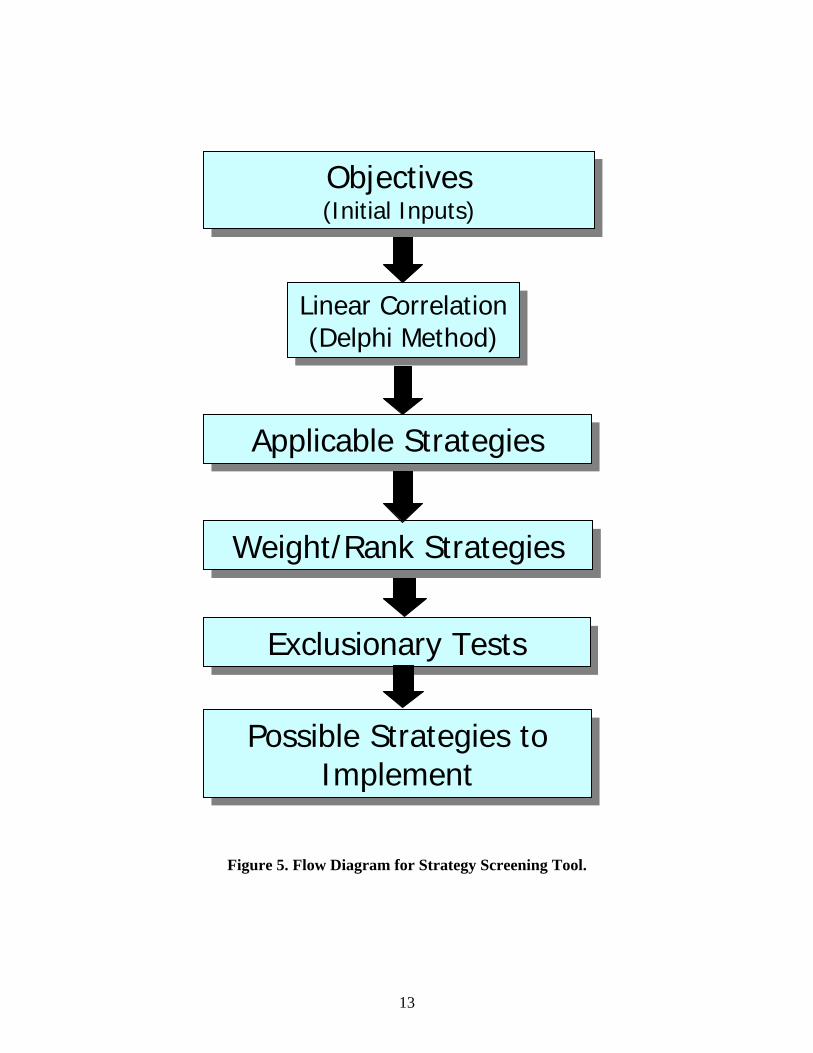
The flow diagram shown in Figure 5 illustrates the steps the screening tool uses to
develop a list of candidate strategies. The program itself has four critical steps in determining
the appropriate scenario to advocate: the choice of objectives, weighting of the objectives
(optional), the constraints, and the processing of the final solution.
The remaining portion of this chapter describes the methodology and underlying
assumptions used in the program.
GOALS AND OBJECTIVES FOR MANAGED LANES
The overall goals for the implementation of managed lanes can be divided into three
distinct groups: mobility goals, community goals, and financial goals. First, the mobility goals
of managed lanes are focused upon such wide topics as demand and accessibility. These goals
are characterized as mobility goals because they aim to improve the mobility of the facility or
system in question. The second category of goals is the community goals. Community goals are
generally defined as goals which aim to help maintain or improve the local community based on
the interests of its constituents. Financial goals, much like their name implies, are goals which
aim to address the financial realities of infrastructure expansion with limited funding and the
financing methods by which an agency pursues the development of projects. Table 2 highlights
different mobility, community, and financial goals that may be associated with managed lanes.
13
Figure 5. Flow Diagram for Strategy Screening Tool.
Objectives(Initial Inputs)
Applicable Strategies
Exclusionary Tests
Possible Strategies to Implement
Weight/Rank Strategies
Linear Correlation (Delphi Method)

14
Table 2. Possible Managed Lanes Goals.
Category of Goal Possible Goals
Mobility Goals
• Provide a transportation system that can handle current and future demand • Increase mobility and accessibility by offering travel options • Provide additional facility capacity • Optimize existing managed lanes capacity • Provide congestion relief • Modify travel demand • Enhance alternative modes • Improve accessibility
Community Goals
• Improve the safety of corridor travel • Minimize environmental impacts • Preserve neighborhoods • Maintain an urban form • Maintain land-use patterns
Financial Goals
• Develop transportation improvements that are financially self-sustaining
The overall objectives of various managed lanes can be linked to individual objectives
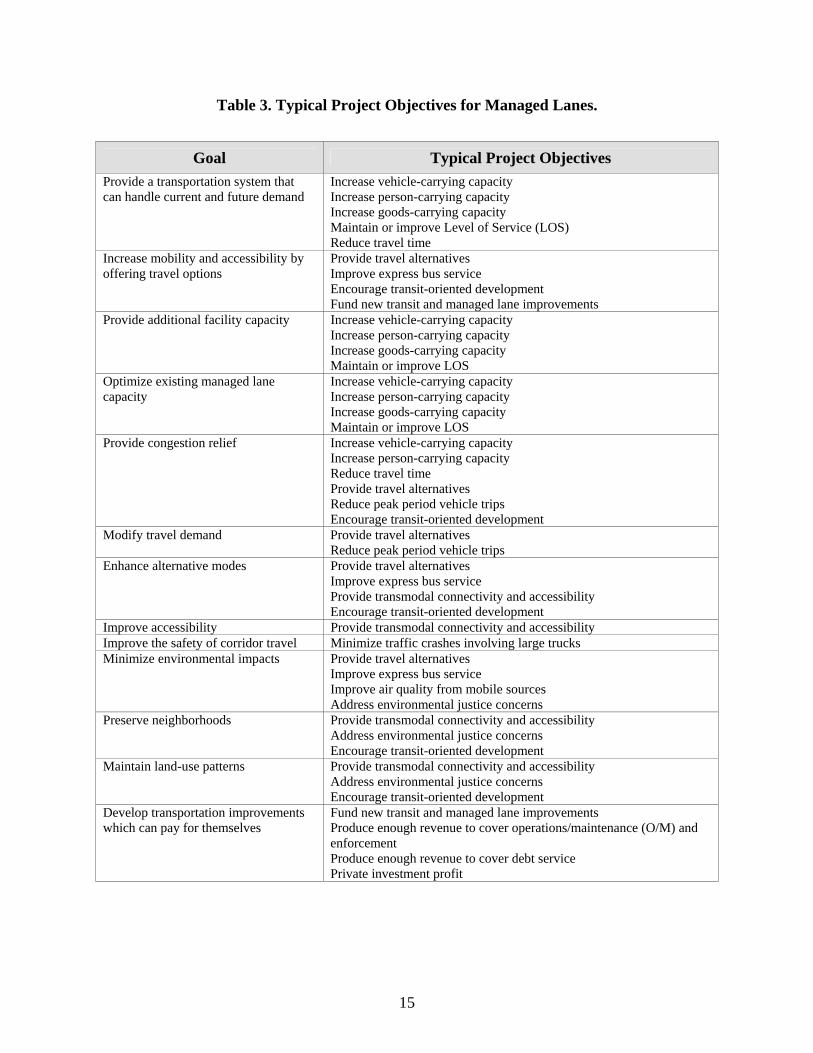
which they are trying to achieve. Table 3 lists the goals above with potential project objectives.
The objectives listed in Table 3 were developed over the course of this research project through
literature review and meetings with TxDOT staff.
15
Table 3. Typical Project Objectives for Managed Lanes.
Goal Typical Project Objectives Provide a transportation system that can handle current and future demand
Increase vehicle-carrying capacity Increase person-carrying capacity Increase goods-carrying capacity Maintain or improve Level of Service (LOS) Reduce travel time
Increase mobility and accessibility by offering travel options
Provide travel alternatives Improve express bus service Encourage transit-oriented development Fund new transit and managed lane improvements
Provide additional facility capacity Increase vehicle-carrying capacity Increase person-carrying capacity Increase goods-carrying capacity Maintain or improve LOS
Optimize existing managed lane capacity
Increase vehicle-carrying capacity Increase person-carrying capacity Increase goods-carrying capacity Maintain or improve LOS
Provide congestion relief Increase vehicle-carrying capacity Increase person-carrying capacity Reduce travel time Provide travel alternatives Reduce peak period vehicle trips Encourage transit-oriented development
Modify travel demand Provide travel alternatives Reduce peak period vehicle trips
Enhance alternative modes Provide travel alternatives Improve express bus service Provide transmodal connectivity and accessibility Encourage transit-oriented development
Improve accessibility Provide transmodal connectivity and accessibility Improve the safety of corridor travel Minimize traffic crashes involving large trucks Minimize environmental impacts Provide travel alternatives
Improve express bus service Improve air quality from mobile sources Address environmental justice concerns
Preserve neighborhoods Provide transmodal connectivity and accessibility Address environmental justice concerns Encourage transit-oriented development
Maintain land-use patterns Provide transmodal connectivity and accessibility Address environmental justice concerns Encourage transit-oriented development
Develop transportation improvements which can pay for themselves
Fund new transit and managed lane improvements Produce enough revenue to cover operations/maintenance (O/M) and enforcement Produce enough revenue to cover debt service Private investment profit

16
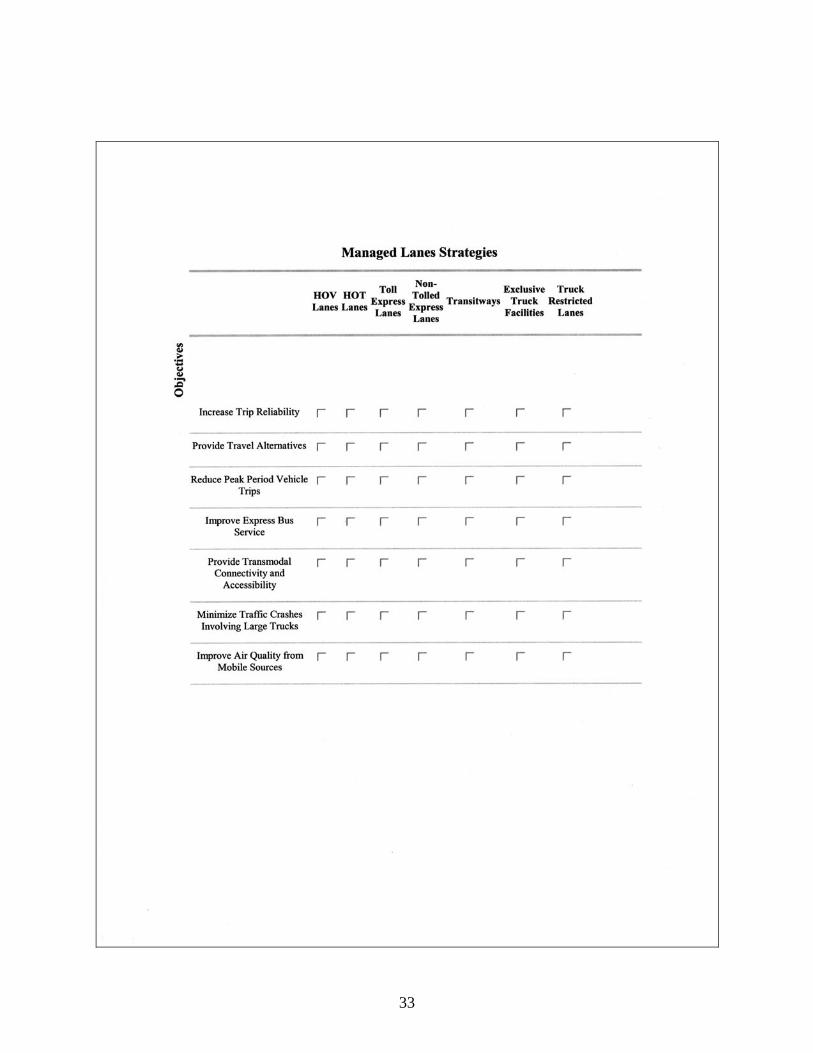
User Input of Objectives in Screening Tool
Initially, the program gathers the input from the user in the form of objectives a user would
like to see addressed. This is done by a series of check boxes for which the user can select the
appropriate objectives. There are 19 objectives available for the user to select for the screening
tool. The list of the possible objectives follows:
1. Increase vehicle-carrying capacity.
2. Increase person-carrying capacity.
3. Increase goods-carrying capacity.
4. Maintain free flow speeds.
5. Maintain or improve the LOS.
6. Reduce travel time.
7. Increase trip reliability.
8. Provide travel alternatives.
9. Reduce peak period vehicle trips.
10. Improve express bus service.
11. Provide transmodal connectivity and accessibility.
12. Minimize traffic crashes involving large trucks.
13. Improve air quality from mobile sources.
14. Address environmental justice concerns.
15. Encourage transit-oriented development.
16. Fund new transit and managed lanes improvements.
17. Produce enough revenue to cover O/M and enforcement.
18. Produce enough revenue to cover debt services.
19. Private investment return on investment.
Correlation of Objectives to Strategies
From the list of objectives provided in Table 3, various objectives can be related to
different managed lanes strategies. Table 4 below shows the various objectives (on the right)
and how they can relate to the different strategies (on the left). Presented in the table are eight
different managed lanes strategies and potential objectives to be achieved by them. This
relationship between the objectives and the strategies is based on a web-based survey of

17
practitioners and experts. Electronic mailing lists of professionals involved in managed lanes
were used to solicit respondents, including Project 0-4160 managed lanes listserv and
Transportation Research Board (TRB) Managed Lanes Joint Subcommittee mailing list. Screen
shots of the survey are provided in Appendix A. Twenty-nine responses were received. A linear
correlation, or Delphi Method, was used to analyze input from experts and form a direct linear
correlation between objectives and strategies. Their answers were aggregated, and the results
from their input form the determination used to relate the two sets. The researchers asked the
experts about how each objective (taken in isolation) can be fulfilled by the strategies. The
results were used by the researchers to combine different objectives to find the best strategy or
strategies for achieving the composite objective.
Appendix B shows the initial weighted table for the values associated with the objectives
gathered from the expert survey. This array forms the basis for the decision algorithm that
identifies the strategies that are a best fit for the objectives selected.
Table 4. Managed Lanes Strategies and Associated Objectives.
Managed Lane Strategy Objectives
Express Toll Lanes Separated lanes with limited access where all vehicles pay a toll.
Increase vehicle-carrying capacity Reduce travel time Provide travel alternatives Fund new transit and managed lane improvements Produce enough revenue to cover O/M and enforcement Produce enough revenue to cover debt service Private investment profit
HOV Lanes Lanes that only allow vehicles that meet or exceed a required number of occupants.
Increase vehicle-carrying capacity Increase person-carrying capacity Reduce travel time Increase trip reliability Provide travel alternatives Reduce peak period vehicle trips Improve express bus service Improve air quality from mobile sources Address environmental justice concerns Encourage transit-oriented development
Express Lanes Separated lanes with limited access.
Increase vehicle-carrying capacity Reduce travel time Provide travel alternatives

18
Table 4. Managed Lane Strategies and Associated Objectives (cont.).
Weighting of Objectives
Once a user has determined the appropriate objectives, the values for those rows are
summed into a master row, hereafter referred to as “the values.” After this step has been
completed, the user has the opportunity to “weight” objectives.
The purpose of weighting objectives is to place greater importance upon some of the
objectives, while diminishing the importance of others. The option to weight objectives is
initially hidden. In order to weight the objectives, the user must enable the weighting process.
This option is hidden from the user by default because any choices made in this option will affect
the initial array of data created by the experts. Changing the array data, while useful in many
circumstances, must be done carefully.
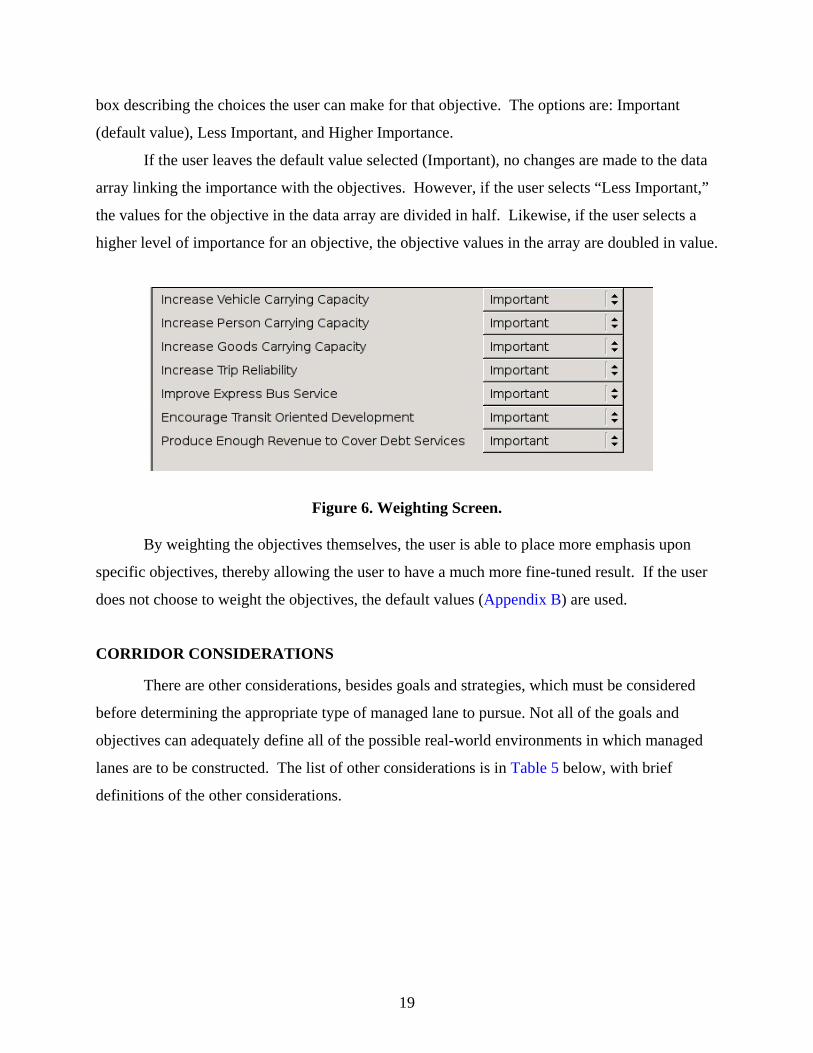
Once the user has enabled the weighting process, he/she is presented with a list of the
options he/she had selected earlier in the process (Figure 6). Next to each of the objectives is a
Exclusive Transitways Lanes or roadways which are meant to exclusively serve buses.
Increase person-carrying capacity Reduce travel time Increase trip reliability Provide travel alternatives Reduce peak period vehicle trips Improve express bus service Provide transmodal connectivity and accessibility Improve air quality from mobile sources Address environmental justice concerns Encourage transit-oriented development
Exclusive Truck Lanes Dedicated lanes in which only large trucks are permitted.
Increase vehicle-carrying capacity Increase goods-carrying capacity Maintain free flow speed Reduce travel time Minimize traffic crashes involving large trucks
Truck Restricted Lanes Lanes of the roadway in which large trucks are restricted.
Maintain free flow speed Maintain or improve LOS Minimize traffic crashes involving large trucks
HOT Lanes HOV lanes which allow vehicles that do not meet the occupancy requirement to use the lanes for a fee or toll.
Increase vehicle-carrying capacity Increase person-carrying capacity Maintain free flow speed Reduce travel time Improve express bus service Improve air quality from mobile sources Address environmental justice concerns Encourage transit-oriented development Fund new transit and managed lane improvements Produce enough revenue to cover O/M and enforcement Produce enough revenue to cover debt service Private investment profit
19
box describing the choices the user can make for that objective. The options are: Important
(default value), Less Important, and Higher Importance.
If the user leaves the default value selected (Important), no changes are made to the data
array linking the importance with the objectives. However, if the user selects “Less Important,”
the values for the objective in the data array are divided in half. Likewise, if the user selects a
higher level of importance for an objective, the objective values in the array are doubled in value.
Figure 6. Weighting Screen.
By weighting the objectives themselves, the user is able to place more emphasis upon
specific objectives, thereby allowing the user to have a much more fine-tuned result. If the user
does not choose to weight the objectives, the default values (Appendix B) are used.
CORRIDOR CONSIDERATIONS
There are other considerations, besides goals and strategies, which must be considered
before determining the appropriate type of managed lane to pursue. Not all of the goals and
objectives can adequately define all of the possible real-world environments in which managed
lanes are to be constructed. The list of other considerations is in Table 5 below, with brief
definitions of the other considerations.

20
Table 5. Corridor Considerations in Strategy Selection.
Corridor Condition Characteristic Physical constraints Physical constraints, including cross-section limitations, right-of-way
restrictions, and access limitations may impact the type of strategy that can be used.
Truck characteristics Level and type of truck traffic, safety considerations, availability of alternative truck routes may have an effect on the choice of strategy.
Origin-destination patterns
The selection of a managed lane strategy may depend on the origin-destination patterns in the corridor.
Land use Related to origin-destination patterns, the land use (existing and future) may have a bearing on appropriate managed lane strategy to implement.
Price elasticity and willingness to pay
Price elasticity and WTP help quantify the role of value pricing in the corridor and the funding available for improvements.
Funding Capital funding refers to the initial cost of the project and may exclude possible strategies due to cost and related funding availability. Operations funding refers to the ongoing management, maintenance, and enforcement of the facility.
Exclusionary Tests
After the user has selected the objectives that he or she feels are important, the user is
then presented with a list of constraints that must be filled out to rule out possible managed lanes
scenarios from being provided to the user at the conclusion of the program. There are 20 general
constraints which are directly tied to the seven possible managed lanes strategies. Appendix C
lists all of the constraint questions and the data sources necessary for the end user to answer
them.
The constraints questions are provided below:
1. Is there currently enough right of way within the existing or proposed development
to add a lane in each direction?
2. Is there currently enough right of way within the existing or proposed development
to add two additional lanes?
3. Do other corridors in the region currently have HOV lanes?
4. What percentage of crashes are caused by trucks?
5. Is the route currently a hazardous materials (HAZMAT) route?
6. How long is the proposed managed lane?
7. Do you expect to recover operating costs and more than 10 percent of capital costs
from revenue generated by the facility?
8. What percentage of peak period traffic is freight?

21
9. What type of drivers use the roadway most often?
10. What type of trucks use the roadway?
11. Are there currently truck restricted lanes on the corridor?
12. Is the corridor a trucking route?
13. Are there parallel alternative truck routes nearby?
14. Does the proposed route serve a major activity center?
15. What is the congestion index for the roadway in question?
16. What is the median family income in the corridor?
17. What is the average number of vehicles per household in the corridor?
18. Besides buses, is there another form of mass transit in the corridor?
19. How many buses will use this managed lane per day?
20. Is there political opposition to toll roads in your city?
Once the user enters the constraints section, a queue is formed using all of the previous
answers. The queue has a list of all of the possible strategies to implement along with values
associated with each strategy. The data for the queue come directly from the above-mentioned
steps (choosing the objectives and weighting the objectives). The constraints section takes the
values in the queue and lowers the values depending upon the user’s answers of the various
constraints. Appendix D provides the point system used to adjust scores according to the
answers to the constraints questions.
The viability of the strategies is largely based in the initial section of the program where
the objectives are matched to the strategies. The corridor constraints function only excludes the
possibilities based upon responses to the constraint questions. So, depending upon the inputs a
user makes initially when choosing the objectives, applicable strategies are identified using the
data gleaned from the expert survey.
The reason there are constraints is that the strategies advocated by the experts were too
close in some fields, most notably truck traffic and financial considerations. So, the constraints
were identified to separate the possible strategies to determine whether or not trucks should be
advocated or not, and also tolling or not. Essentially, the answers given by the experts were too
similar (points wise) between strategies that were very different (hypothetically, truck lane

22
restrictions and HOV, which are very different). Therefore, the constraints are put into place to
determine which one should be given as an appropriate answer.
The constraints can be configured to be strict or lenient. If the “strict” constraints are
selected, a much more strict method in reducing the values in the queue is implemented (thereby
eliminating more possible strategies). However, if the “lenient” constraints are selected, a
managed lane strategy will not necessarily be eliminated due to constraints alone. Although it
will be pushed down in the queue of appropriate strategies to implement, the values will not be
as low as with the strict interpretation. The algorithm developed to filter the constraints is then
run on the possible strategies, eliminating those that do not meet the basic criteria for use in the
corridor.
These scores are then totaled for each of the strategies and are parsed by an algorithm
(which takes into account if the constraints should be interpreted loosely or not). The remaining
sum for each strategy is then divided by the sum gathered in the objective stage to determine the
appropriate strategies to implement.
RESULTS FROM THE STRATEGY SELECTION TOOL
The final screen presented to the user takes all of the input and offers three strategy
options and their scoring. This task takes the values associated with the objectives and totals the
values to determine which possible scenario best meets the criteria of the user. The constraints
are then applied depending upon the user’s preference (lenient or strict), and the final array is
completed containing all of the possible strategies listed in order of acceptability. After this step
is complete, the answers are then displayed to the end user for approval. Next to each possible
strategy is the final queue value for that particular strategy. This “score” is used to determine the
placement in the queue and can vary drastically in number between 200 and 1.
DEFINING USER GROUPS
Once an operating strategy or multiple operating strategies are identified, defining vehicle
user groups for a managed lane facility is the next important step in the managed lanes
development process for several reasons:
• It helps in evaluating financing for the project if non-paying or exempt users are
identified.

23
• It establishes the design vehicle used to control the geometrics of the facility design
elements.
• It offers insight into driver communication and signing needs, especially if the user
group can be categorized as a familiar, semi-familiar, or non-familiar user.
• It offers insight into potential enforcement opportunities and challenges.
• It provides a starting point for establishing a long-term “concept of operations,”
where variations in user eligibility can be illustrated over time in order to maintain
operational performance thresholds and communicate expected changes over time.
This is illustrated in Figure 7, which shows how one HOT lane facility over time is
expected to modify operations – both in terms of who can use the HOT lane and who
will be tolled (3).
Figure 7. Life Cycle of a Facility (3).
Table 6 depicts the seven operational strategies and candidate user groups for each
strategy. There are several issues to keep in mind when defining potential user groups for a
project:
• The table below has a broad definition of “trucks.” The objectives and
characteristics of each individual facility will have to be carefully examined to

24
determine if trucks should be included and the type of truck allowed (single unit
versus semi-trailer, for example).
• There may be a desire to incorporate rail as a future component of a managed lanes
envelope. As such, design criteria should reflect the stricter vertical and horizontal
criteria for rail vehicles and associated bridge loadings.
• “Emergency Vehicles” as listed below includes not only on-duty police, fire, and
emergency medical vehicles, but also vehicles necessary to respond to threats such
as natural disasters or terrorist attacks. This would include debris removal vehicles
and evacuation/rescue vehicles.
Table 6. Potential Vehicle User Group Scenarios.
Potential Vehicle User Groups Managed Lanes Strategy
Tolled Non-tolled
Express Toll Lanes
• SOV • HOV • Trucks • LEV • Taxi/Shuttle • Motorcycle
• Bus/BRT • Emergency Vehicles
HOV Lanes
• HOV • Bus/BRT • LEV • Taxi/Shuttle • Motorcycle • Emergency Vehicles
HOT Lanes
• SOV • Trucks
• HOV • Bus/BRT • LEV • Taxi/Shuttle • Motorcycle • Emergency Vehicles
Express Lanes (non-tolled) All vehicle user groups
Exclusive Transitways
• Bus/BRT
Exclusive or Dedicated Truck Lanes
• Trucks
Truck Restricted Lanes
All vehicle user groups except trucks

25
CHAPTER 4: RESEARCH GAPS
EXPLANATION OF THE GAPS IDENTIFIED IN THE PROJECT 0-4160 RESEARCH
The five-year Project 0-4160 research effort focused largely on design and operations
issues associated with managed lanes and delved to a lesser degree into some of the policy,
legislative, financial, and public outreach concerns. While the managed lanes research program
has offered TxDOT direct guidance for application in current project development, the program
has also identified new challenges and areas for further exploration. Of particular interest are the
next generation projects that are incorporating managed lanes as a mobility strategy
encompassing a broad range of operational possibilities, challenges, and complexities (5,6).
Each of the new challenges pose tough questions that have not been tackled in the projects
currently in operation.
Planning and Policy Research Gaps
A summary of the research gaps related to managed lanes planning and policy is provided
below:
• the role of revenue generation and the competing objectives of maximizing person
movement through HOV exemptions and maximizing revenue generated by the
project;
• the role of bus transit, including BRT, and its integration in managed lanes
operations;
• analytical tools that estimate travel demand, revenue projections, and operational
impacts interactively;
• evaluation of managed lanes in the National Environmental Policy Act (NEPA)
analysis, including the relationship of managed lanes to purpose and need, revenue
forecasts versus regional forecasts, and how managed lanes are considered in the
alternatives analysis and fiscal constraint analysis;
• equity and environmental justice concerns, including burden of cost, distribution of
funds, and geographic equity;
• evaluation of public/private initiatives involving managed lanes;
26
• legislative authority, particularly related to operating agencies and their powers to
operate as toll authorities in collecting fines and enforcing compliance using
automated techniques;
• integration of managed lanes projects into the existing and planned transportation
system (freeway, arterial, and transit systems) and connectivity with other managed
lanes;
• feasibility and application of truck-only toll lanes; and
• economic impact of communities served by managed lanes.
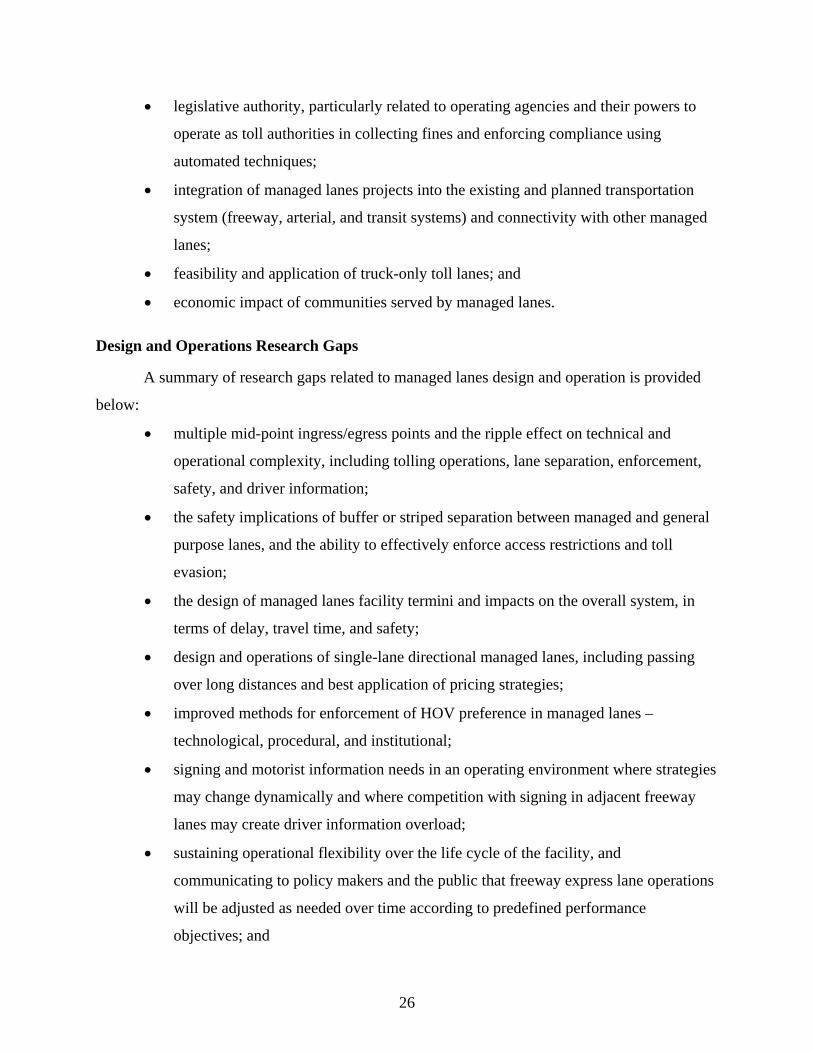
Design and Operations Research Gaps
A summary of research gaps related to managed lanes design and operation is provided
below:
• multiple mid-point ingress/egress points and the ripple effect on technical and
operational complexity, including tolling operations, lane separation, enforcement,
safety, and driver information;
• the safety implications of buffer or striped separation between managed and general
purpose lanes, and the ability to effectively enforce access restrictions and toll
evasion;
• the design of managed lanes facility termini and impacts on the overall system, in
terms of delay, travel time, and safety;
• design and operations of single-lane directional managed lanes, including passing
over long distances and best application of pricing strategies;
• improved methods for enforcement of HOV preference in managed lanes –
technological, procedural, and institutional;
• signing and motorist information needs in an operating environment where strategies
may change dynamically and where competition with signing in adjacent freeway
lanes may create driver information overload;
• sustaining operational flexibility over the life cycle of the facility, and
communicating to policy makers and the public that freeway express lane operations
will be adjusted as needed over time according to predefined performance
objectives; and

27
• dynamic operations beyond pricing, including methods and approaches to
dynamically modify vehicle eligibility or access on a managed lanes facility.
Future Research
FHWA is in the process of developing a 10-year research plan for managed lanes. Most
of the above-mentioned topics have been identified as research issues. TxDOT continues to
serve as a leader in advancing research in the managed lanes arena through participation in
national level research efforts and through its own research program. Listed below are the FY 05
and FY 06 TxDOT research projects that will address some of the topics above. Several of these
research studies were developed as the direct result of the ongoing work of the larger managed
lanes research effort:
• Project 0-4898 – Criteria for Adapting HOV Lanes to HOT Lanes,
• Project 0-5208 – Evaluation of Environmental Justice Aspects of the Tolling of
Existing Non-Toll and Toll Roads,
• Project 0-5079 – Use of Traveler Information to Enhance Toll Road Operations,
• Project 0-6446 – Guidelines for Signs and Markings on Toll Roads,
• Project 0-5284 – Feasibility and Guidelines for Applying Managed Lane Strategies
to Ramps,
• Project 0-5286 – The Role of Preferential Carpool Treatment in Managed Lane
Facilities,
• Project 0-5426 – Separation Treatments between Toll and Non-Toll Lanes, and
• Project 0-5547 – Best Practices for Access between Toll Lanes and Free Lanes.


29
REFERENCES 1 B.T. Kuhn and V.D. Goodin. Year 1 Annual Report of Progress: Operating Freeways with
Managed Lanes, Research Report 0-4160-2. Texas Transportation Institute, College Station, TX, January 2002.
2 LBJ Circular. Texas Department of Transportation. Summer 2001. 3 T.S. Collier and V.D. Goodin. Managed Lanes: A Cross-Cutting Study, FHWA-HOP-05-037.
Federal Highway Administration, McLean, VA. November 2005. 4 Project Development Process Manual. Texas Department of Transportation. August 2003.
http://manuals.dot.state.tx.us/dynaweb/coldesig/pdp. 5 Managed and Priced Lanes: Summary of Workshop Results, FHWA and Transportation
Research Board, Key Biscayne, FL, November 2003. 6 Texas Department of Transportation, Research Project 0-4160, Operating Freeways with
Managed Lanes. Presentation to External Stakeholder Committee, September 22, 2004.

30

31
APPENDIX A: EXPERT SURVEY

32
33

34

35
APPENDIX B: SURVEY RESPONSES IN ARRAY
Entries in the Array
Objectives
1. Increase Vehicle-Carrying Capacity
2. Increase Person-Carrying Capacity
3. Increase Goods-Carrying Capacity
4. Maintain Free Flow Speeds
5. Maintain or Improve the LOS
6. Reduce Travel Time
7. Increase Trip Reliability
8. Provide Travel Alternatives
9. Reduce Peak Period Vehicle Trips
10. Improve Express Bus Service
11. Provide Transmodal Connectivity and Accessibility
12. Minimize Traffic Crashes Involving Large Trucks
13. Improve Air Quality from Mobile Sources
14. Address Environmental Justice Concerns
15. Encourage Transit-Oriented Development
16. Fund New Transit and Managed Lanes Improvements
17. Produce Enough Revenue to Cover O/M and Enforcement
18. Produce Enough Revenue to Cover Debt Services
19. Private Investment Return on Investment
Strategy Abbreviations
TE: Tolled Express
NTE: Non-Tolled Express
Transit: Transitways
Dedicated: Dedicated Truck Lanes
Restricted: Truck Restricted Lanes

36
Obj HOV HOT TE NTE Transit. Dedicated Restricted
1 9 21 20 24 6 9 12
2 24 22 10 10 25 4 2
3 2 4 14 9 4 25 10
4 18 23 23 9 13 11 13
5 16 20 21 15 15 14 15
6 25 25 25 17 18 15 14
7 19 20 24 11 22 15 11
8 22 22 20 9 20 9 4
9 21 11 12 4 17 0 3
10 23 17 12 5 24 0 0
11 15 8 5 4 19 14 4
12 3 4 5 1 3 22 19
13 21 14 15 8 22 10 3
14 16 9 4 8 15 3 1
15 13 6 5 0 24 0 0
16 0 16 20 0 0 0 0
17 0 16 21 0 0 0 0
18 0 12 20 0 0 0 0
19 0 9 19 2 1 5 0
37
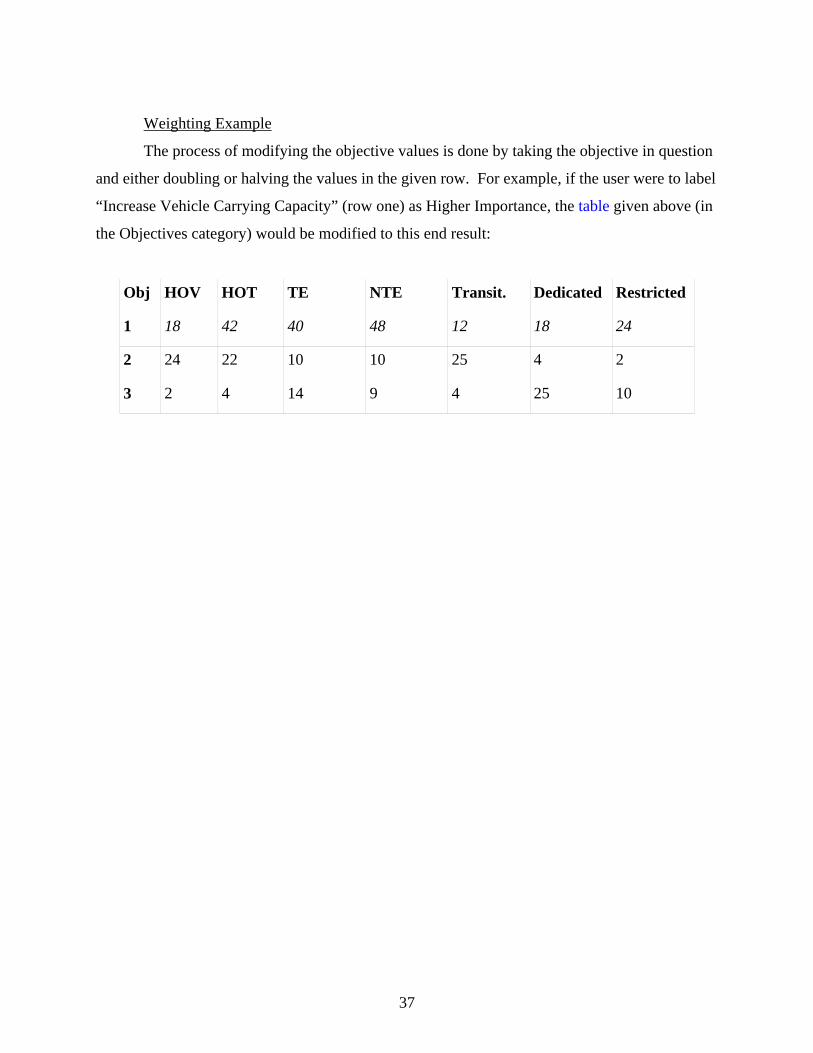
Weighting Example
The process of modifying the objective values is done by taking the objective in question
and either doubling or halving the values in the given row. For example, if the user were to label
“Increase Vehicle Carrying Capacity” (row one) as Higher Importance, the table given above (in
the Objectives category) would be modified to this end result:
Obj HOV HOT TE NTE Transit. Dedicated Restricted
1 18 42 40 48 12 18 24
2 24 22 10 10 25 4 2
3 2 4 14 9 4 25 10

38

39
APPENDIX C: DATA REQUIREMENTS FOR SCREENING TOOL
Question Data Required Resources Needed Less than 16 feet,
maintaining a 10 foot shoulder
Is there currently enough right-of-way (ROW) within the existing or proposed development to add an additional lane?
More than 16 feet, maintaining a 10 foot
shoulder
Lane geometric design and measurements
Less than 28 feet, maintaining a 10 foot
shoulder
Is there currently enough ROW within the existing or proposed development to add two additional lanes?
More than 28 feet, maintaining a 10 foot
shoulder
Lane geometric design and measurements
No Do other corridors currently have HOV lanes? Yes
Less than 20% What percentage of accidents are caused by trucks? More than 20%
Crash data; DPS or local source
No Is the route currently a HAZMAT route?
Yes
National Hazardous Materials Route Registry http://hazmat.fmcsa.dot.gov/nhmrr/query.wc
Less than 7 miles How long is the proposed managed lane? More than 7 miles
Preliminary Plans
No Do you expect to recover operating costs and more than 10% of capital costs from revenue generated by the facility?
Yes
Financial analysis
Less than 20% What percentage of peak period traffic is freight? More than 20%
Field data (classification counts), travel demand model/link or market analysis
Residents (local) What types of drivers use the roadway most often? People passing
through (external)
Travel demand model/link or market analysis
Non-freight (light duty)
What types of trucks use the roadway?
Freight
Classification counts
No Are there currently truck-restricted lanes in the city? Yes
No Is the corridor a trucking route? Yes

40
Question Data Required Resources Needed
No Are there parallel alternative truck routes? Yes
No Does the proposed route serve a major activity center? Yes
Less than 1 What is the congestion index for the roadway in question?
More than 1
http://mobility.tamu.edu/ums/ report/methodology_appB.pdf Page 28, Equation 16 without arterial components
Less than $30,000 What is the median family income in the corridor? More than $30,000
Census
Less than 1 What is the average number of vehicles per household in the corridor? More than 1
Census
No Besides buses, is there another form of mass transit in your city? Yes
Less than 100 How many buses will use the managed lane per day? More than 100
Data from transit agencies
No Is there political opposition to toll roads in your city? Yes
“Unknown” is an alternative answer for every question if you are unsure of the question or do not wish to answer it.

41
APPENDIX D: SCREENING TOOL RATING SYSTEM FOR EXCLUSIONARY TESTS
The rating system used for the exclusionary tests involving corridor constraints is
provided in this appendix.
1. Is there currently enough ROW in each direction within the existing or proposed freeway section to add a lane?
If available space in one direction is less than 16 ft, maintaining a 10 ft shoulder: HOV: +100 HOT: +100 TE: +100 NTE: +100 Transitways: +100 Truck Dedicated: +100 2. Is there currently enough ROW in each direction within the existing or proposed
freeway section to add 2 lanes? If available space in one direction is more than 28 ft, maintaining a 10 ft shoulder:
HOV: -10 HOT: -10
TE: -10 NTE: -10 Transitways: -10 Truck Dedicated: -10 3. Do other corridors in the region currently have HOV lanes? If Yes: HOV: -5 HOT: -5 4. What percentage of accidents are caused by trucks? If More Than 20%: Truck Dedicated: -20 Truck Restricted: -20 HOV: +10 HOT: +10 TE: +10 NTE: +10 Transitways: +10

42
If less than 20%: Truck Dedicated: +10 Truck Restricted: +10 5. Is the route currently a HAZMAT route? If Yes: Truck Dedicated: -5 6. How long is the proposed managed lane? If Less Than 7 Miles: HOV: +10 HOT: +10 Transitways: +10 7. Do you expect to recover operating costs and more than 10% of capital costs from
revenue generated by the facility? If Yes: HOV: +10 HOT: +5 Tolled express: -10 Non-tolled express: +10 Transitways: +10 Truck dedicated: +10 Truck lane restrictions: +10 8. What percentage of peak period traffic is freight? If More Than 20%: HOV: +10 HOT: +10 Tolled Express: +10 Non-Tolled Express: +10 Transitways: +10 Truck Dedicated: -10 Truck Restricted: -10
9. What types of drivers use the roadway most often? If Residents: Truck Dedicated: +10 Truck Restricted: +10

43
10. What types of trucks use the roadway? If Non-Freight: Truck Dedicated: +10 Truck Restricted: +10 11. Are there currently truck restricted lanes in your city? If Yes: Truck Dedicated: -10 12. Is the corridor a trucking route? If Yes: HOV: +5 HOT: +5 Tolled Express: +5 Non-Tolled Express: +5 Transitways: +5 Truck Dedicated: -20 Truck Restricted: -20 13. Are there parallel alternative truck routes? If Yes: Truck Restricted: -10 14. Does the proposed route serve a major activity center? If No: HOV: +5 HOT: +5 Tolled Express: +2 Non-Tolled Express: +2 Transitways: +2 15. What is the congestion index for the roadway in question? If Less Than 1: HOV: +5 HOT: +5 Tolled Express: +5 Non-Tolled Express: +5 Transitways: +5 16. What is the median family income in the corridor? If Less Than $30,000: HOV: -5 HOT: -5 Tolled Express: +5 Transitways: -10

44
17. How many vehicles per household are in the corridor? If Less Than 1: Transitways: -10 18. Do you have another form of mass transit in the corridor? If Yes: Transitways: +10 19. How many buses will use this managed lane per day? If Less Than 100: Transitways: +15 20. Is there political opposition to toll roads in your city? If Yes: HOT: +10 Tolled Express: +15