Decentralization of Urban Service Activities: an Empirical ...
262
Portland State University Portland State University PDXScholar PDXScholar Dissertations and Theses Dissertations and Theses 1994 Decentralization of Urban Service Activities: an Decentralization of Urban Service Activities: an Empirical Study Empirical Study Wonseon Kyung Portland State University Follow this and additional works at: https://pdxscholar.library.pdx.edu/open_access_etds Part of the Urban Studies Commons Let us know how access to this document benefits you. Recommended Citation Recommended Citation Kyung, Wonseon, "Decentralization of Urban Service Activities: an Empirical Study" (1994). Dissertations and Theses. Paper 1338. https://doi.org/10.15760/etd.1337 This Dissertation is brought to you for free and open access. It has been accepted for inclusion in Dissertations and Theses by an authorized administrator of PDXScholar. Please contact us if we can make this document more accessible: [email protected].
Transcript of Decentralization of Urban Service Activities: an Empirical ...

Portland State University Portland State University
PDXScholar PDXScholar
Dissertations and Theses Dissertations and Theses
1994
Decentralization of Urban Service Activities: an Decentralization of Urban Service Activities: an
Empirical Study Empirical Study
Wonseon Kyung Portland State University
Follow this and additional works at: https://pdxscholar.library.pdx.edu/open_access_etds
Part of the Urban Studies Commons
Let us know how access to this document benefits you.
Recommended Citation Recommended Citation Kyung, Wonseon, "Decentralization of Urban Service Activities: an Empirical Study" (1994). Dissertations and Theses. Paper 1338. https://doi.org/10.15760/etd.1337
This Dissertation is brought to you for free and open access. It has been accepted for inclusion in Dissertations and Theses by an authorized administrator of PDXScholar. Please contact us if we can make this document more accessible: [email protected].
DECENTRALIZATION OF URBAN SERVICE ACTIVITIES:
AN EMPIRICAL STUDY
by
WONSEON KYUNG
A dissertation submitted in partial fulfillment of therequirements for the degree of
DOCTOR OF PHILOSOPHYin
URBAN STUDIES
Portland State University©1994

DISSERTATION APPROVAL
The abstract and dissertation of Wonseon Kyung for the Doctor of Philosophy in
Urban Studies were presented March 11, 1994, and accepted by the dissertation
committee.
APPROVALS:J mes G. Strathman~ Chair
----William A. Rabiega "
Kuan-Pin Lin
Kenneth J. Dueker
Abdul ----------Representative of the Office of Graduate Studies
*********************************************
ACCEPTED FOR PORTLAND STATE UNIVERSITY LIBRARY
by onc:1/ ~taH?k. /ttZP1=
ABSTRACT
An abstract of the dissertation of Wonseon Kyung for the Doctor of Philosophy
in Urban Studies presented March 11, 1994.
Title: Decentralization of Urban Service Activities: An Empirical Study
PostMwar metropolitan development in the United States has been mainly
due to suburban growth which resulted in dispersal of population, retailing,
manufacturing, wholesaling and services. What is known about service
suburbanization is primarily derived from survey research on location choices
done in localized cases. There has been no comprehensive work done using
secondary data on revealed behavior.
This dissertation attempts that comprehensive study. The research
analyzes the dynamics of locational structure of services in U.S. metropolitan
areas from 1969 to 1989. The descriptive analysis of changes in the location
coefficients provides evidence to demonstrate a spatial shifting of consumer
oriented services roughly opposite to that of business oriented services. The top
ranked business centers tend to exhibit a tendency toward greater centralization.
There is a countervailing tendency toward decentralization of business oriented
services in small and relatively underdeveloped service areas.
According to the regional analysis, there is no clear tendency of business
oriented services for the 1969M79 and 1979M89 periods. The tendency for
decentralization of business oriented services, however, appears to be strong for
the 1969M89 period, especially for the Manufactul'ingbelt and South. Models for
decentralization of consumer oriented and business oriented services indicate
that the spatial dynamics of business services are different from those of

2consumer services. Relocation costs appear to be greater for business services
than for consumer services. By contrast, service demand and racial composition
seem to have a greater influence on decentralization of consumer services than
on business services.
The relocation costs are also likely to encourage more centralization of
consumer and business services over a longer time span. The locational effects
of corporate demand and decentralization of manufacturing activity, on the
contrary, appear to weaken over a longer time span.

DEDICATION
To God,
my grandmother, my parents and
my two younger brothers
with love.
ii

iiiACKNOWLEDGEMENTS
This research was made possible by the contributions of many individuals.
Foremost among these contributors is Professor James G. Strathman, my
principal advisor, without whose insight, devotion and support during the
course of this research, this study would not have been possible. Thanks to the
Professors William A. Rabiega, Kuan-Pin Lin, Kenneth J. Dueker, and Abdul
Qayum of Portland State University and Whan Chyang Lin of the University of
North Carolina, Charlotte for their helpful advise on the research.
I received financial support through a graduate assistantship from
Portland State University from December 16, 1990 to June 15, 1991 during the
period of my doctorate program. I gratefully acknowledge the financial
assistance and academic excellence of the School of Urban and Public Affairs at
the University.
My warmest thanks and appreciation to my mother and my two younger
brothers for their encouragement, prayers and support.

iv
TABLE OF CONTENTS
ACKNOWLEDGEMENTS. . . . . • . • . . • . . . . . . . . . . . . . . • . • . • . . . • . iii
LIST OF TABLES. . . . . . . . . . . . . . . . . . . . . . . . . . . . . . . . . . . . . . . . . . viii
LIST OF FIGURES. . . . . . . . . . . . . . . . . . . . . . . . . . . . . . . . . . . . . . . . . xi
CHAPTER
I
II
INTRODUCTION ....•..•...........•..........
REVIEW OF THE LITERATURE ...•.....•.....What are Services? ...•........
1
33
The Relevant Theoretical Framework. . . . . . 4
Contact Theory ....•.•..•..•... 4Intrametropolitan Office Location
Theory. . . . . . . . . . . . . . . 5Bid-Rent Theory .....•..••.•... 7External Economies of Scale ..•.. 9Information Diffusion Theory •... 10Behavioral Theory ••.......•... 12Central Place Theory •.•...•.•.. 13General Interaction Theory .••... 14Consumer Service Location Models. 15
Different Locational Patterns among Services. 16
Centralization of Service Activities. • 16Decentralization of Service Activities . 18Relocation of Service Activities .•... 18Effects of Telecommunication
Technology............. 19Service Location Patterns in Future. . 20
Corel Peripheral Studies on Urban ServiceActivities .....•......•.•......... 21

v
Service Growth Differential ••••••• 21Service Function Differential •••••• 22Office Function Differential ••••••• 22
Summary ............................... 23
III TREND OF LOCATION PATTERN OF URBANSERVICE ACTIVITIES ••..••••••..•.•••••• 26
Rank Order of Changes in Decentralizationof Urban Service Activities •••••.••• 28
Rank Order Analysis: ConsumerOriented Services ..•••••• 28
Rank Order Analysis: BusinessOriented Services ••.••••• 33
Changes in Decentralization of Urban ServiceActivities among Metropolitan SizeGroups ......................... 38
Metropolitan Analysis: ConsumerOriented Services ..•••••. 39
Metropolitan Analysis: BusinessOriented Services •••••••• 39
Regional Variations in Decentralization of UrbanService Activities ••••••.•• 41
Regional Analysis: ConsumerOriented Services •••••.•• 44
Regional Analysis: BusinessOriented Services •.•••••• 44
Summary ............................... 52
IV METHODOLOGY OF MULTIPLE REGRESSIONANALYSIS .............................. 54
Conceptual Models •.•.•.•••••.••••.•••••• 54
Conceptual Model of Decentralizationof Consumer OrientedServices ............... 54
viConceptual Model of Decentralization
of Business OrientedServices ••••.•.••••••.••• 56
Operational Models ••••••••••••••••••••••• 59
Operational Models of Decentralizationof Consumer OrientedServices. . . . . . . . . . . . . . . . . 59
Operational Models of DecentraHzationof Business Oriented
Services. . . • . • • . . . . . . . • • • • 59Expected Signs of Variables ••••.•.•• 61
Variable Measurement and Data Sources...... 65
Analysis of Data •••.••.•..••••.....•.•.•••• 68
Summary . ~ . . . . . . . . . . . . . . . . . . . . . . . . . . . . . .. 70
V RESULTS OF MULTIPLE REGRESSION ANALYSES. 71
Results of Service Decentralization Models,1969-79 and 1979-89 • • • • • • • . • . . . • . 73
Structural Change Variables. •• . •.• • 73Relocation Cost Variables. • • • • • • • •• 77Manufacturing Decentralization
Variable .••...•..••••••• 78Service Demand Variable •••••.•••• 78Racial Composition Variable. • • . • • •• 79Corporate Influence Variables... ••• 80Regional Location Variables ••.••.• 81
Results of Service Decentralization Models,1969-89 . . . . . . . . . . . . . . . . . . . . . . . . . 82
Structural Change Variables. • • . • • • 82Relocation Cost Variables •••••••• 84Manufacturing Decentralization
Variable. • • . . . • . . . . • • • • 85Service Demand Variable .••••.••. 86Racial Tension Variable •••••.•••• 87Corporate Influence Variables... •• 87Regional Location Variables. • . . • . • 88
vii
Analytical Implications and Limitation of Data. 89
Summary 90
VI SUMMARY AND CONCLUSIONS. . • • • . • . . . . . . . . . . . • 93
Summary. . . . . . . . . . . . . . . . . . . . . . . . . . . . . . . . . 93
Conclusions . . . . . . . . . . . . . . . . . . . . . . . . . . . . . . . 96
The Significance of this Study .....•....•.•.. 97
Theory Implications •. . . . . . . . . . . . . . . . . . . . . 97
Policy Implications. . . • . . . . . . . . . . . . . . . . . . • •• 98
REFERENCES . . . . . . . . . . . . . . . . . . . . . . . . . . . . . . . . . . . . . . . . . . . . . . . . .. 100
APPENDICES
A LOCATIONAL PATTERN CHANGES OF SERVICEACTIVITIES AMONG METROPOLITAN SIZEGROUPS 108
B GAUSS ECONOMETRIC PROGRAMS FORMULTIPLE REGRESSION ANALySES ..... 126
C DATA FOR REGRESSION MODELS. . . . . . • . . . . • . . .• 153
D GAUSS ECONOMETRIC OUTPUT .•.•...........• 176

viii
LIST OF TABLES
TABLE PAGE
3.1. Core Counties with the Largest Change in Location
Pattern of Consumer Oriented Services,
1969-79 ........................... 29
3.2. Core Counties with the Largest Change in Location
Pattern of Consumer Oriented Services,
1979-89 ........................... 31
3.3. Core Counties with the Largest Change in Location
Pattern of Consumer Oriented Services,
1969-89 ........................... 32
3.4. Core Counties with the Largest Change in Location
Pattern of Business Oriented Services,
1969-79 ........................... 34
3.5. Core Counties with the Largest Change in Location
Pattern of Business Oriented Services,
1979-89 ........................... 35
3.6. Core Counties with the Largest Change in Location
Pattern of Business Oriented Services,
1969-89 ........................... 36
3.7. The Change in the Means of Location Coefficients of
Consumer Oriented Services by Metropolitan
Size Groups. . . . . . . . . . . . . . . . . . . . . . . . 38
ix3.8. The Change in the Means of Location Coefficients of
Business Oriented Services by Metropolitan
Size Groups ........................... 40
3.9. The Change in the Means of Location Coefficients of
Consumer Oriented Services by Regions of
the Core Counties •..•••.•..•.•••...•••• 41
3.10. The Change in the Means of Location Coefficients of
Business Oriented Services by Regions of
the Core Counties •••••..••....•••..•••• 47
4.1. An Expected Sign of the Variables Associated with the
Change in Decentralization of Consumer
Oriented and Business Oriented Services .. 61
5.1. OLS Results Using The Changes of Decentralization
of Consumer Oriented and Business Oriented
Services of the Core Counties, 1969-79 and
1979-89 .............................. 75
5.2. OLS Results Using The Changes of Decentralization
of Consumer Oriented and Business Oriented
Services of the Core Counties, 1969-89 ... 83
7.1. Location Coefficient Change, 1969-79 for Consumer
Oriented Services by Metropolitan Size
Groups .............................. 109
7.2. Location Coefficient Change, 1979-89 for Consumer
Oriented Services by Metropolitan Size
Groups .............................. 112
x7.3. Location Coefficient Change, 1969-89 for Consumer
Oriented Services by Metropolitan Size
Groups ............................... 115
7.4. Location Coefficient Change, 1969-79 for Business
Oriented Services by Metropolitan Size
Groups ............................... 118
7.5. Location Coefficient Change, 1979-89 for Business
Oriented Services by Metropolitan Size
Groups ............................... 120
7.6. Location Coefficient Change, 1969-89 for Business
Oriented Services by Metropolitan Size
Groups. . . . . . . . . . . . . . . . . . . . . . . . . . . . . . . 123
8.1. WLS Results Using The Changes of Decentralization
of Consumer Oriented and Business Oriented
Services of the Core Counties. • • • • • • • • • . . 179

LIST OF FIGURESxi
FIGURE PAGE
1. U.S. Census Divisions and Regions •.• 42
2. The Change in the Means of Location
Coefficients for Consumer Oriented
Services by Regions of the Core
Counties, 1969-79 .•.••••....•••.. 43
3. The Change in the Means of Location
Coefficients for Consumer Oriented
Services by Regions of the Core
Counties, 1979-89 •.•.••••..•.•••• 45
4. The Change in the Means of Location
Coefficients for Consumer Oriented
Services by Regions of the Core
Counties, 1969-89 ••••.••••....••• 46
5. The Change in the Means of Location
Coefficients for Business Oriented
Services by Regions of the Core
Counties, 1969-79 •.•••.••.....•.• 48
6. The Change in the Means of Location
Coefficients for Business Oriented
Services by Regions of the Core
Counties, 1979-89 .•••••...•••••.. 49
7. The Change in the Means of Location
Coefficients for Business Oriented
Services by Regions of the Core
Counties, 1969-89 ••.••••••••.••••
xii
51
CHAPTER I
INTRODUCTION
Post-war metropolitan development in the United States has been mainly
due to suburban growth, which resulted in dispersal of population, retailing,
manufacturing, wholesaling and services. Suburban locations are now seen as
having advantages for a wide spectrum of economic activities.
What is known about service suburbanization is primarily derived from
survey research on location choices done in localized cases. There has been no
comprehensive work done using secondary data on revealed behavior.
This dissertation deals with changes in locational patterns of urban
services in the U.S. metropolitan counties for the period from 1969 to 1989. The
research proceeds on two levels: first, an analysis of the trend in locational
patterns of business oriented and consumer oriented services; and second,
regression models of locational determinants of these service categories.
Theoretical studies of service location activities provide the conceptual
framework. It analyzes how changes in decentralization of service firms are
related to some or all of the following factors: structural changes, inertia of the
existing spatial pattern, business relocation costs, manufacturing decentral
ization, corporate influence, racial composition, level of service demand and
regional location.
This study is organized into six chapters. Chapter II lays the foundation
for the study by reviewing earlier studies of locational patterns among services,
core/peripheral studies of urban service activities, and the relevant theoretical
framework. Chapter III presents descriptive results of changes in service
location patterns, and variations in decentralization of urban service activities

2
b.y size of metropolitan area and by region. Chapter IV discusses the collection
of secondary data, the methods of analysis, and the hypotheses for this research.
Chapter V analyzes the relationships between structural changes, inertia of the
existing spatial pattern, business relocation costs, manufacturing decentral
ization, corporate influence, racial composition, level of service demand, regional
location, and decentralization of business oriented services. In addition, the
relationships between structural changes, inertia of the existing spatial patterns,
racial composition, level of service demand, regional location, and
decentralization of consumer oriented services are explored. The final chapter
discusses the implications of the study for theories of service location activities.
CHAPTER II
REVIEW OF THE LITERATURE
This study analyzes the trend in locational patterns of service activities,
and locational determinants of these activities. The concepts pertinent to service
locational patterns provide theoretical explanations about location of service
activities. Thus, this chapter reviews the theoretical studies on service location
activities. In addition, the empirical studies of locational patterns among
services and core/peripheral studies on service activities are reviewed. Before
examining these studies, the definition of services is discussed since it is not
universally known.
"What are Services?"
Differing from goods, services can be defined in simplest terms as "the
exchange of a commodity which does not have a tangible form" (Price and Blair,
1989: p. 2). In practice, service categories are defined in Standard Industrial
Classifications (SiCs). For example, the service sector comprises 15 categories
(2-digit SICs) (US Department of Commerce, 1989). Among these categories are:
Personal (SIC 72), Business (SIC 73), Repair (SIC 75-76), Recreation (SIC 79),
Health (SIC 80), Legal (SIC 81), Educational (SIC 82), Social (SIC 83), and
Management Services (SIC 87). More generally, services constitute Trans
portation, Communications and Utilities, F.I.R.E (Finance, Insurance and Real
Estate), Wholesale and Retail Trade, and private and public services (price and
Blair, 1989; Beyers, 1989; Coffey and Polese, 1987; Daniels, 1985; Stanback,
1979). The sectors defined as services for this study are business services, and
retail trade and other consumer related services.

4THE RELEVANT THEORETICAL FRAMEWORK
This section reviews the theories pertinent to service locational patterns,
and evaluates the relevance of the theories to a study of loc3i:ional determinants
of urban services. Theoretical studies of office location patterns are also
reviewed because business service activities are largely office-based.
Contact Theory
Contact theory postulates that different decision levels, namely,
'orientation' (non-programmed), 'planning' and 'programmed' decisions give
rise to corresponding contacts. 'Non-programmed' decisions are broad and
diverse in scope, and involve complicated and unstructured decisions. These
decisions cause 'orientation' contacts involving predominantly face-to-face
meetings with feedbacks (Goddard, 1971). On the contrary, 'programmed'
decisions are relatively narrow and limited in scope, and involve standardized
and routine decisions. Hence, these decisions result in 'programmed' contacts
carried out by telephone, implying more suitability of telecommunication uses.
Finally, 'planning' decisions lie between the two extremes (i.e., 'non
programmed' and 'programmed' decisions) (Goddard, 1971).
Pye (1979) similarly maintains that 'orientation' contacts are likely to
occur when a manager's role requires a significant change, whereas
'programmed' contacts involve routine changes, and, therefore, will be short,
and telephone contacts rather than meetings. The contact types, a key concept of
contact theory, provide theoretical explanations about locational patterns of
urban services. Business services involving intensive 'orientation' contacts
(arranged, long and face-to-face contacts) would be locationally constrained
(Pye, 1979; Goddard, 1973). In contrast, services relying largely on unarranged,
5
short and regular telephone contacts (programmed contacts) (Pye, 1979;
Goddard and Morris, 1976; Goddard, 1971) are more suitable for
telecommunication uses. For example, computer services involving 'pro
grammed' decisions (Howells and Green, 1986) are likely to be susceptible to
telecommunication impacts, and thus are more likely to be decentralized.
The contrasting nature of contacts also provides insight into office location
patterns. For example, a firm's administrative unit which relies on active
personal contacts for information exhibits high rates of frequency of contacts
with the administrative units of other firms, and thus exhibits locational
centralization. On the contrary, its operating units involving few personal
contacts with administrative units are locationally dispersed (Tornqvist, 1968).
The observed location patterns of urban service and office activities
support the theoretical concept of contact types (Hutton and Ley, 1987; Daniels,
1986,1985; Marshall, 1985; Dunning and Norman, 1983; Clapp, 1980; Manners,
1974). Further operationalization of this concept will provide more applications
in reality for location patterns of urban service activities.
Intrametropolitan Office Location Theory
Intrametropolitan office location theory emphasizes the notion that
contact (or communication) costs involving face-to-face meetings or contact
maintenance among offices are a significant location factor because information
is a major input and output for office activities (Coffey and Polese, 1987;
Tauchen and Witte, 1983; Pye, 1977; Goddard, 1971). Other location factors
important for office activities are: recruitment and retension of employees, floor
space needs, and prestige (Daniels, 1979; Pye, 1977).
Under the assumption of firm's choice of profit maximizing location, the
theoretical importance of contact (communication) costs as a key location factor
6
is extensively shown by the intrametropolitan office location models. In their
model, Tauchen and Witte (1983) postulate that firm location and contact
patterns are jointly determined by firms making profit-maximizing decisions.
Assuming that the contacts require face-to-face meetings, locational equilibrium
is obtained by profit maximizing number of contacts with other firms.
Consequently, a firm does not have an incentive to leave a CnD in which it can
minimize its contact costs. Thus, the contact-expense curve rises with a firm's
increasing distance from the center. The model suggests interdependency
bdween contact patterns and firm locations, but does not adequately
incorporate the firm's interactions involving 'orientation' contacts characterized
as long and arranged contacts (Goddard and Morris, 1976) which also involve
predominantly face-to-face meetings with feedbacks (Goddard, 1971).
Similarly, Coffey and Polese's (1987) location model for office-based
activities explains office clusters generated by the firms pursuing minimization
of communication cost associated with service output. It is thus suggested that
'organization-oriented' services relying on links with their head offices by
intrafirm trade will produce locational concentration in pursuit of minimization
of the associated communication costs. Assuming low communication costs for
output, engineering services and other high tech services would exhibit a
spatially dispersed pattern, although they are strongly S-type input (skilled
management or professional resources) oriented. Also, local market-oriented
services (e.g., repair, construction and rental services) and computer services
which are weakly associated with intrafirm trade channels are likely to be
spatially dispersed.
Pye's (1977) model emphasizes contact cost savings in central locations
and explains the resistance of relocations among London area firms, especially
due to contact maintenance (e.g., travel for meetings). Hence, it addresses cost-

7
effective relocation by comparison between office relocation costs and relocation
benefits, such as economic savings in rents and salaries.
Intrametropolitan office location theory based on a cost minimization
objective is especially useful to interpret the locational concentration of office
based business services, which seek central locations in pursuit of information
cost savings. But the theory fails to incorporate the effects of technology and
policy changes on contact benefits (Daniels, 1985). Further developments in
communications technology may weaken communication linkages, a significant
office location factor. The optimal location in theory also leads to limitations: in
unpredictable times, events outside a firm's control is likely to change its optimal
location.
Bid-Rent Theory
Alonso (1964) postulated decreasing land rents with distance from the
eBD based on very rigid assumptions of uniform urban geography. Bid-~ent
models with an emphasis on access to information in the enD provide an insight
into intraurban individual service locations (Daniels, 1985). Niedercorn's (1971)
model assumes that the profits of an information service firm depend on its
location in relation to the city center in which it minimizes its communication
costs. Hence, the communication cost per unit of service rises with the
increasing distance from the city center. This accounts for the location of
information intensive service firms in the city center.
Taking a similar approach, the Tauchen-Witte (1983) model assumes that
contact costs are lower at locations which offer greater accessibility, and thus
contact cost saving is balanced by higher rent. Although firms at distant
locations from the enD make fewer contacts, they can not overcome the

8
increasing costs of contact maintenance with the CBD. Therefore, the office rent
for firms declines rapidly with distance from the CBD.
O'Hara (1977) assumes a uniform distribution of firms that rely on
exogenous contacts, who also benefit equally from access to information in the
CBD. Under these assumptions, office rent declines with the square of a firm's
radial distance from the CBD, thereby obtaining a concave rent function.
According to Sullivan (1986), the inverse curve of office rents is attributed
to increasing travel costs (per central market trip) with increasing distance from
the central market area, which provides the advantages of face-to-face contacts.
Clapp's (1980) model also incorporates face-to-face contacts in the CBD; hence,
office rent increases with a move closer to the CBD. Also, a higher office rent is
caused by amenities of office buildings and neighborhoods, as found at suburban
centers. In Clapp's analysis of 105 office buildings in Los Angeles, access to
face-to-face contacts appears to have a stronger influence on office rent than
other factors such as suburban office centers and access to suburban employee
residences.
Conventional bid-rent models which postulate the CBD as the most
accessible location for communication activities are useful to interpret the
centralization of business services. These models, however, do not necessarily
apply to services emphasizing national and int~rmetropoliu.m.linkages, such as
investment banking (Wheeler, 1986). The strong emphasis on access to
information in the CBD and a lack of consideration of suburban centers in the
bid-rent models also limit their usefulness for application to the modern
metropolis (Erickson, 1982). Models which incorporate more realistic
considerations, such as the suburb's enhanced accessibility to the metropolitan
market and the central city's congestion would better account for service
location patterns in the modern metropolises.

9External Economies of Scale
External economies of scale (agglomeration economies) are generated by
interactions among linked firms, hence inducing the spatial clustering of these
firms (Greene, 1980). This will increase the market for the user firms, thereby
lowering the service input costs. The office sector is also subject to external
economies of scale in that its average production costs decrease with the growth
of a central market (Sulli"an, 1986).
The theoretical importance of these agglomeration benefits is shown by
the Tauchen and Witte (1983) model, which suggests that external economies
playa key role in a firm's location. It is assumed that the agglomeration benefits
are the contact benefits from interactions among the firms in the CBD. The
enhanced agglomeration benefits generated by the greater density of CBD firms
will allow firms to increase their number of contacts until average revenue per
contact declines.
Notions about external economies offer valuable insights into service
locational behaviour; services with different market functions which
consequently use different degree of economies of scale exhibit different spatial
patterns. The centralization of sophisticated business services in urban centers
is largely attributable to large urban economies of scale. The advantages of
urban economies of scale are: (a) savings in communication and labor costs; (b)
specialized information services; and (c) specialized expertise (PJ;'ice and Blair,
1989; Noyelle and Stanback, 1984; Goddard and Morris, 1979; Daniels, 1979;
Pred, 1977, 1974).
Urban economies of scale increase contact benefits in both quantity
(number of contacts) and quality (frequence, diversity and ease of contacts),
hence attracting advanced business services to the large urban centers.
Stanback and his associates (1981) argue that economies of scale appear after
10
producer services have been specialized: In the later development process of the
producer service market, economies of scale increase the market for the user
firms, hence lowering service input costs.
There is a close correspondence between the specialization of services and
size of market (measured by total population) associated with urban economies
of scale (Noyelle and Stanback, 1984; Meyer, 1980; Stanback, 1979). In fact, the
size of market and external economies of scale have been major location factors
of export services, such as business services and head offices. Dunning and
Norman (1983) similarly assert that business services are relatively more
significant in larger metropolises than in small metropolises.
On a smaller scale, agglomeration economies significantly influence
locational patterns of local market-oriented consumer services (Price and Blair,
1989). Erickson's (1983) model suggests that modern consumer shopping
behavior (e.g., multipurpose trip-making and comparison shopping) has
contributed to the increased importance of consumer economies of scale.
The importance of the benefits of external economies of scale has been
supported by the observed spatial patterns of service activities. On the contrary,
disadvantages of diseconomies of scale, such as congestion, reinforce the trend of
service decentralization.
Information Diffusion Theory
Information diffusion theory accounts for the concentration of business
services and corporate headquarters in the U.S. large metropolitan areas (Pred,
1977). The large share of non-local specialized information channels in these
metropolitan areas is attributed to such advantages as a high concentration of
contact-intensive employees, specialized services and headquarters, and the
convenience of face-to-face contacts (Pred, 1974). In this view, service location

11
patterns reflect the location decisions of individual firms or corporate firms,
which rely on specialized information as well as accessibility to this information
(Daniels, 1985).
Information diffusion occurs between large cities, and also from smaller to
larger places when inventions are first used in smaller places. These diffusion
patterns do not, therefore, necessarily follow the rigid hierarchical principles of
central place theory; in the strict hierarchical view, the information diffusion
occurs from the largest places to successively lower down the hierarchy (Pred,
1977). In the U.S., the stability of geographical diffusion of specialized
information is, however, attributable to the stability of a firm's communication
channels over time and the geographical inertia of firms (Pred, 1974).
Specialized information diffusion provides an understanding of a
concentration of information-oriented services in certain cities. Information
diffusion theory is also supported by Stanback's analysis of business service
employment (Stanback, 1979). He found that the metropolitan centers with a
significant share of business service employment in 1960 also experienced a high
growth of the business service jobs in the subsequent decade. This indicates that
the stable routes of specialized information, a key input for business services,
have remained the same in these metropolitan centers.
While geographical theory implies that the diffusion of business services is
necessary to narrow the gap between service developed areas and service
underdeveloped areas (Daniels, 1985), behavioral theory attributes this widening
gap to organizational structure, as will be discussed in detail in the following
section.

12Behavioral Theory
Behavioral theory reflects the location choices of decision-makers (Lloyd
and Dicken, 1977). Hence, it potentially offers a more realistic perspective on a
firm's location choice than neoclassical least cost location theory. The
behavioral theory recognizes the importance of changes in a firm's internal and
external environment. The internal environmental factors include a firm's
policies and organization, and the nature of control in a firm. In contrast,
external environmental factors include changes in market and in population
character (Daniels, 1985, 1979; Edwards, 1983).
The theoretical importance of organizational factors is supported by
Edwards model of office location decision-making (Edwards, 1983). Her model
emphasizes the role of organizational character (e.g., investment and locational
policy, and internal systems). It is suggested that organization factors have a
greater influence on office suburbanization (Marshall, 1985; Edgington, 1982),
than traditional location factors such as transportation costs, accessibility and
rents (Edgington, 1982).
The nature of control factors in the behavioral theory provides an insight
into the distinctions between core and peripheral regions. Thus, it is useful in
understanding of the widening gap between service developed areas and service
underdeveloped areas. Behavioral models which incorporate a firm's internal
and external environmental factors adequately illustrate the locational decision
making of individual service firms. These models are, therefore, more useful to
interpret the locational patterns of individual service types than central place
theory (Daniels, 1985).

13Central Place Theory
The hierarchical concept associated with market size in central place
theory provides insight into inter-metropolitan service locations (Manners,
1974). The hierarchical concept was initially outlined by Christaller (1933). In
his view, higher level services are found in the larger central places, which also
offer all the services of smaller places under the assumption of an evenly
distributed population. Hierarchical levels of service specialization are consistent
with the size hierarchy of metropolitan areas (Stanback et al., 1981). That is, the
largest metropolitan areas are characterized by provision of the highest
specialized services and the most diversified service types.
Central place theory, with its very simplistic assumptions of a uniform
distribution of consumers, minimum travel distance and omnidirectional travel
provides insight into the spatial organization of retail trade and other consumer
services which serve suburbanized populations (Stanback, 1979). Central place
theory's market threshold requirement, along with its hierarchical structure
explains the range of choices offered to consumers between small and large
places (Kellerman, 1985). This is thus much more useful in understanding and
persuasive in interpreting the inter-metropolitan service locations, especially the
distribution of shopping centers and other consumer services (Price and Blair,
1989; Kellerman, 1985; Daniels, 1985) than in clarifying intra-metropolitan
service locations (Manners, 1974).
The theory is, however, inadequate to apply its hierarchical principles to
areas with varied functional bases such as different population densities and
income levels. The strong emphasis on market size in the theory leads to
limitations. Although market size is important, agglomeration benefits also
attract business services to the larger urban areas (Stanback, 1979).

14
Contrary to the tenets of central place theory, level of service
specialization is not directly related to metropolitan size, since organizational
structure and agglomeration economies can distort the urban service hierarchy
(Daniels, 1985). Burns and Healy's analysis of 185 metropolitan areas, for
example, shows that the level of service specialization is not directly related to
metropolitan size (Daniels, 1985). Furthermore, central place theory cannot
provide insights into the longer term evolution of service location patterns
(Kellerman, 1985).
General Interaction Theory
Like central place theory, general interaction theory concerns the pulling
power of competing retail centers influencing shopping movements, and it thus
provides insights into shopping center locations (Daniels, 1985). The break
point model identifies a point between two competing retail centers representing
consumer choice of one retail center rather than the other. It is assumed that the
identified point applies to all the services in a shopping center without
considering the different types of services with different market requirements
(Daniels, 1985). This rigid assumption imposes limitations with regard to a
consumer's choice of retail centers. The area inside the identified break-point
will not have uniform consumer demand because of the presence of different
types of services. The shortcoming in the model is partially overcome by Huers
probability model which specifies the probabilities of consumers choosing one of
the competing retail centers (Price and Blair, 1989).
Both central place theory and general interaction theory are especially
useful to account for locational patterns of retail activities, but fail to take
account of services with different market requirements, therefore are not
adequate to apply to individual service locations.

15Consumer Service Location Models
Consumer service location models include more realistic assumptions of
consumer shopping behavior, such as multi-purpose and comparison shoppings,
and different time needs (Dudey, 1990; Stahl, 1987; Ingene, 1984; Erickson,
1983; Greene, 1980; Eaton and Lipsey, 1979). In their model of comparison
shopping, Eaton and Lipsey (1979) postulate that customers bear the transport
cost for information, and thus seek for minimizing this cost. Assuming fixed
price, customers must compare nonprice factors, for instance quality, delivery
dates, and servicing arrangements. The model provides theoretical explanations
about the clustering of firms, which can reduce transportation costs. According
to Horton (1968), retailers are likely to cluster when the expected benefits from
comparison shopping are greater than the consumer's search costs.
Stahl's (1987) model of firm location choice similarly suggests the
importance of benefits of comparison shopping, which lead to firm c1usterings.
Assuming that consumers don't expect lower prices in places where large
numbers of firms are located, firm c1usterings are likely to occur when
consumers are attracted to places which offer a large variety of products. These
c1usterings benefit both consumers and businesses. For instance, the Greene
model of multi-purpose trip economies suggests that the clustered firms will
benefit by an increase in demand (Greene, 1980). According to Dudey's model,
firm c1usterings are also likely to facilitate price comparison and search by
consumers under the assumption of not too intense local competition (Dudey,
1990).
Since many services require a location in proximity to final consumer
markets, the theoretical importance of consumer demand as a key location factor
is extensively shown by the consumer service location models (e.g., Dudey, 1990;
Stahl, 1987; Greene, 1980; Eaton and Lipsey, 1979; White, 1975). These models
16
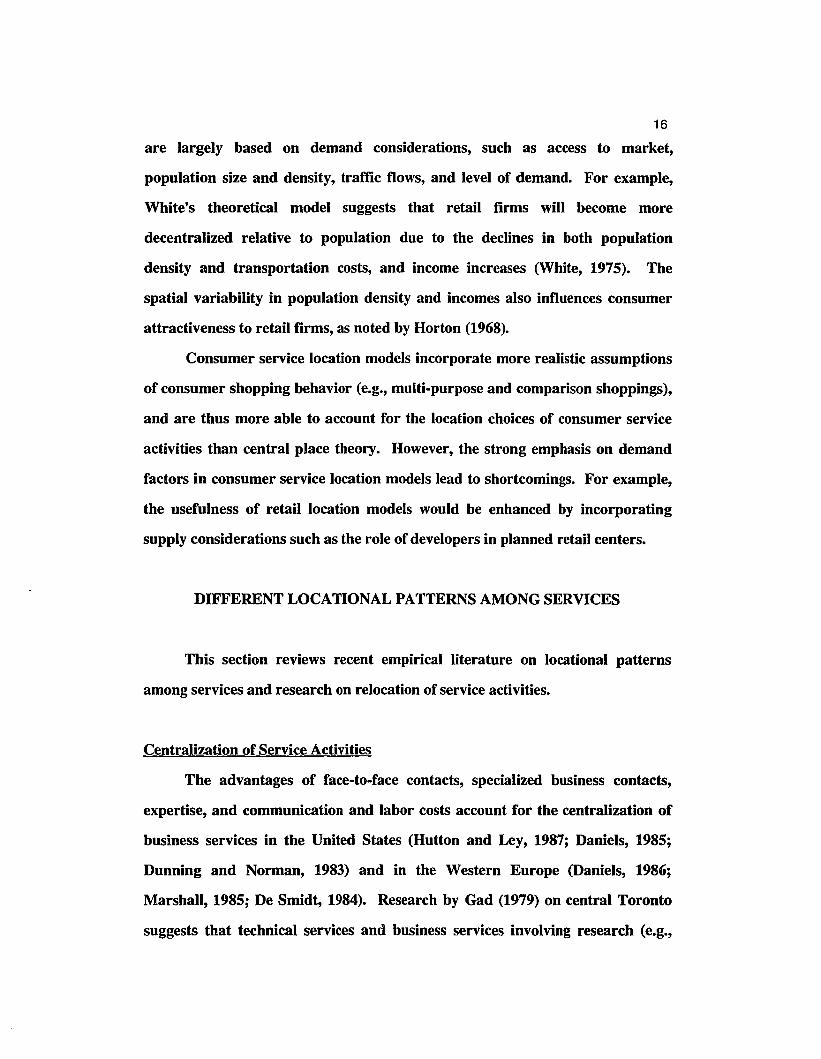
are largely based on demand considerations, such as access to market,
population size and density, traffic flows, and level of demand. For example,
White's theoretical model suggests that retail firms will become more
decentralized relative to population due to the declines in both population
density and transportation costs, and income increases (White, 1975). The
spatial variability in population density and incomes also influences consumer
attractiveness to retail firms, as noted by Horton (1968).
Consumer service location models incorporate more realistic assumptions
of consumer shopping behavior (e.g., multi-purpose and comparison shoppings),
and are thus more able to account for the location choices of consumer service
activities than central place theory. However, the strong emphasis on demand
factors in consumer service location models lead to shortcomings. For example,
the usefulness of retail location models would be enhanced by incorporating
supply considerations such as the i'ole of developers in planned retail centers.
DIFFERENT LOCATIONAL PATTERNS AMONG SERVICES
This section reviews recent empirical literature on locational patterns
among services and research on relocation of service activities.
Centralization of Service Activities
The advantages of face-to-face contacts, specialized business contacts,
expertise, and communication and labor costs account for the centralization of
business services in the United States (Hutton and Ley, 1987; Daniels, 1985;
Dunning and Norman, 1983) and in the Western Europe (Daniels, 1986;
Marshall, 1985; De Smidt, 1984). Research by Gad (1979) on central Toronto
suggests that technical services and business services involving research (e.g.,

17
market research and engineering consultants), which involve the relatively low
levels of communication activity, exhibit spatial dispersal.
In both the United States and the United Kingdom, business service
locations are strongly tied to headquarter locations (Giiiespie and Green, 1987;
Wheeler, 1986; Noyelle and Stanback, 1984; Stanback et aI., 1981). Researchers
have suggested the linkages between business services and corporate
headquarters are important factors in the continuing centralization of business
services and headquarters in urban centers (Wheeler, 1986; Noyelle and
Stanback, 1984; Stanback et al., 1981).
The role of headquarters with high-level decision-making functions on
service purchases leads to a reinforcement of the centralization of business
services in the urban centers. For example, headquarters ex~rt influence on
their branches to purchase business services from the firms in the urban centers
(Howells and Green, 1986; Daniels, 1985). In contrast, the local services (e.g.,
repair, construction and rental services), engineering services, technical services,
computer services and other high· tech services are spatially dispersed because
they are not tied to the location of headquarters.
Other researchers identified the following factors as important for
centralization: availability of specialized services, prestige of a CBD address, and
access to business clients and international air-transportation facilities (Noyelle
and Stanback, 1984; Daniels, 1982; Pred, 1977; Manners,1974). For example,
Noyelle and Stanback (1984) and Pred (1977) argue that international air
transportation facilities are an important location factor for business services
because of the importance of air travel for business meetings.

18
Decentralization of Service Activities
Researchers suggest that suburban freeways have contributed to the
decentralization of service activities (Daniels, 1985; Kellerman, 1985; Mills and
Price, 1984; Erickson, 1983; Muller, 1981; Wright, 1978). Suburban freeways
provide access to the metropolitan market and savings in transportation costs
(Erickson, 1983), and also connect suburban residences and office centers
(Erickson, 1983; Muller, 1981; Wright, 1978; Alexander, 1978). The CBDs are
no longer the most accessible locations to consumers in modern metropolitan
areas (Price and Blair, 1989). Furthermore, suburban locations provide the
following advantages: (a) avoidance of the congestion of central cities; (b) space
for expansion; (c) parking; (d) environmental and neighborhood amenities; and
(e) accessibility to part-time female labor, to employee residences, and to clients
(Mills, 1988; Daniels, 1985; Stanback, 1979; Tarpley et al., 1970). These
advantages especially attract retail and other consumer related service firms,
hence accounting for their decentralization. The same interpretation pertains to
F.I.R.E (finance, insurance and real estate), whose activities rely on links with
consumer clients (Noyelle and Stanback, 1984). Other residential services, such
as education and health, also exhibit a decentralization pattern.
Relocation of Service Activities
Empirical studies of firm relocations have identified the following
variables as key factors of central cities' service firms resistance to relocation:
contact (communication) costs, labor costs (search of specialized expertise), and
linkages with other CBD firms and multi-site clients (Daniels, 1985; Marshall,
1985; Goddard and Pye, 1977; Fernie, 1977; Goddard and Morris, 1976).
Goddard and Morris's (1976) survey reveals that the London firms which do not
relocate tend to engage in more face-to-face contacts than the movers. The firms
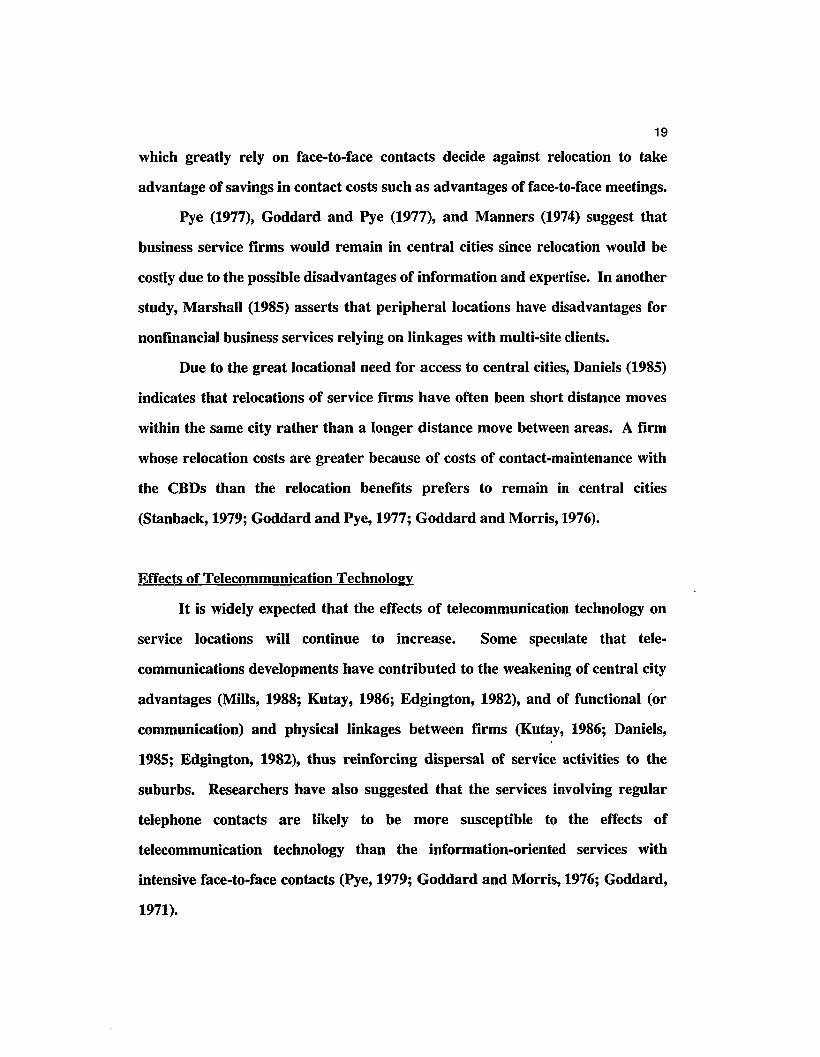
19
which greatly rely on face-to-face contacts decide against relocation to take
advantage of savings in contact costs such as advantages of face-to-face meetings.
Pye (1977), Goddard and Pye (1977), and Manners (1974) suggest that
business service firms would remain in central cities since relocation would be
costly due to the possible disadvantages of information and expertise. In another
study, Marshall (1985) asserts that peripheral locations have disadvantages for
nonfinancial business services relying on linkages with multi-site clients.
Due to the great locational need for access to central cities, Daniels (1985)
indicates that relocations of service firms have often been short distance moves
within the same city rather than a longer distance move between areas. A firm
whose relocation costs are greater because of costs of contact-maintenance with
the CBDs than the relocation benefits prefers to remain in central cities
(Stanback, 1979; Goddard and Pye, 1977; Goddard and Morris, 1976).
Effects of Telecommunication Technology
It is widely expected that the effects of telecommunication technology on
service locations will continue to increase. Some speculate that tele
communications developments have contributed to the weakening of central city
advantages (Mills, 1988; Kutay, 1986; Edgington, 1982), and of functional (or
communication) and physical linkages between firms (Kutay, 1986; Daniels,
1985; Edgington, 1982), thus reinforcing dispersal of service activities to the
suburbs. Researchers have also suggested that the services involving regular
telephone contacts are likely to be more susceptible to the effects of
telecommunication technology than the information-oriented services with
intensive face-to-face contacts (Pye, 1979; Goddard and Morris, 1976; Goddard,
1971).
20
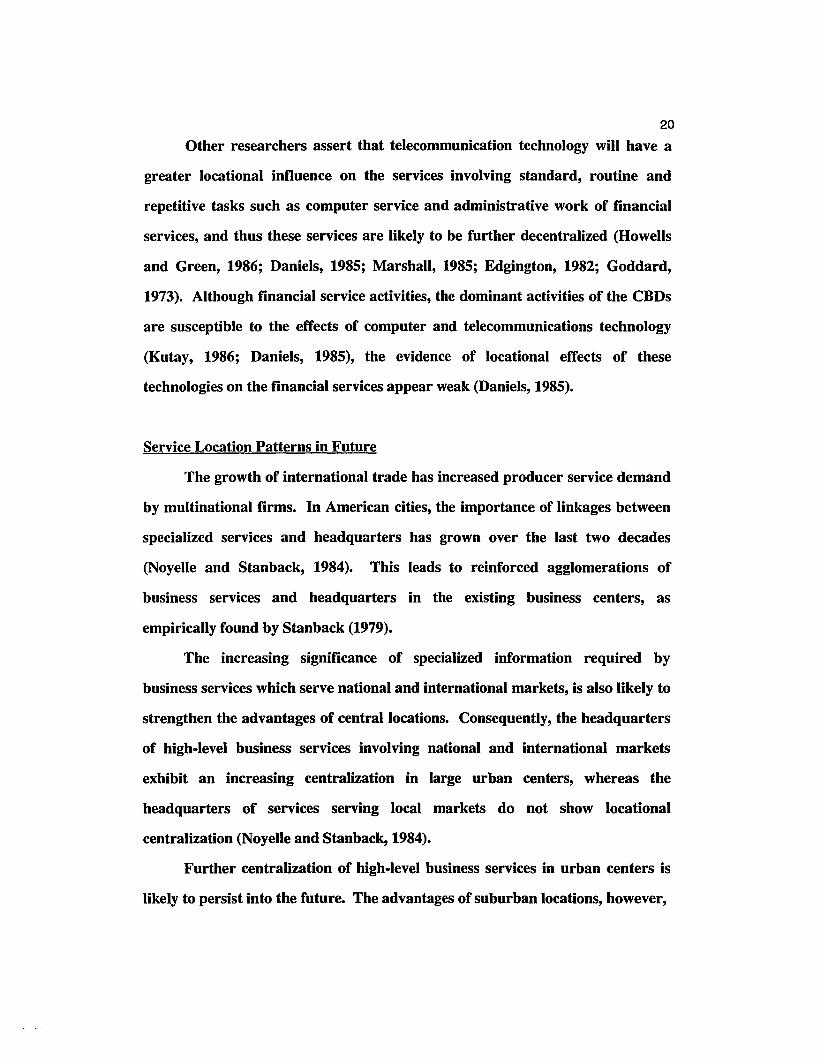
Other researchers assert that telecommunication technology will have a
greater locational influence on the services involving standard, routine and
repetitive tasks such as computer service and administrative work of financial
services, and thus these services are likely to be further decentralized (Howells
and Green, 1986; Daniels, 1985; Marshall, 1985; Edgington, 1982; Goddard,
1973). Although financial service activities, the dominant activities of the CBDs
are susceptible to the effects of computer and telecommunications technology
(Kutay, 1986; Daniels, 1985), the evidence of locational effects of these
technologies on the financial services appear weak (Daniels, 1985).
Service Location Patterns in Future
The growth of international trade has increased producer service demand
by multinational firms. In American cities, the importance of linkages between
specialized services and headquarters has grown over the last two decades
(Noyelle and Stanback, 1984). This leads to reinforced agglomerations of
business services and headquarters in the existing business centers, as
empirically found by Stanback (1979).
The increasing significance of specialized information required by
business services which serve national and international markets, is also likely to
strengthen the advantages of central locations. Consequently, the headquarters
of high-level business services involving national and international markets
exhibit an increasing centralization in large urban centers, whereas the
headquarters of services serving local markets do not show locational
centralization (Noyelle and Stanback, 1984).
Further centralization of high-level business services in urban centers is
likely to persist into the future. The advantages of suburban locations, however,

21
should continue to encourage the decentralization of lower-level service
activities.
COREl PERIPHERAL STUDIES ON URBAN SERVICE ACTIVITIES
This section reviews studies of the corel peripheral differences of urban
service activities in two aspects- service growth and service functions. In
addition, the research which has been done on differences of office activities
between central city and suburbs is reviewed.
Service Growth Differential
Service growth differentials between central city and suburbs during the
post-war period is attributable to population suburbanization (Kellerman, 1985;
Alexander and Dawson, 1979; Stanback, 1979), and in particular to the increase
in demand for residential services by the middle class (Stanback, 1979). As a
result, the faster service growth in the suburbs in the U.S. has mainly been led
by local market-oriented services (Schneider and Fernandez, 1989; Mills, 1988;
Friedrichs et al., 1987; Stanback, 1979).
On the contrary, the slower growth of the central city is largely
attributable to negative externalities: traffic congestion, high land costs, high
rents, lack of affordable housing, and shortage of parking (Mills, 1988; Daniels,
1985; Mills and Price, 1984; Tarpley et aI., 1970; Richardson, 1969).

22Service Function Differential
The status of the CBD in the U.S. as a specialized service center despite
having lost traditional advantages (Muller, 1981) reflect the service function
differential between central city and suburbs. Research by Friedrichs and his
associates (1987) on the downtowns of Baltimore and Hamburg suggests that the
overwhelming growth of office-based business services caused the downtown
recoveries from the 1970s to 1980s, despite the decline of both central cities
relative to their suburbs. Daniels's Washington, D.C. study indicates that
accessibility to business clients is a significant factor for producer service firms
in the CBD, whereas this factor was found to be insignificant for the outer
suburbs (Daniels, 1985).
The distinct characteristics of services offered by central cities and
suburbs are empirically indicated by a greater centralization of business services
(Stanback, 1979; Manners, 1974). Since the central cities provide more
specialized services than the suburbs (Friedrichs et aI., 1987; Kellerman and
Krakover, 1986; Stanback, 1979), relocated firms in the suburbs have
continually relied on the central city's advanced services (Stanback, 1979). De
Smidt's analysis suggests that urban core's contact patterns are distinct from the
subcenters by providing a more diverse levels of contact intensity (De Smidt,
1984).
Office Function Differential
Office activities are differentiated in terms of functions between city and
suburbs. The organizational head offices with high-level management, control
and decision-making functions, are concentrated in central cities, whereas offices
involving routine, repetitive and standardized tasks such as branch offices and
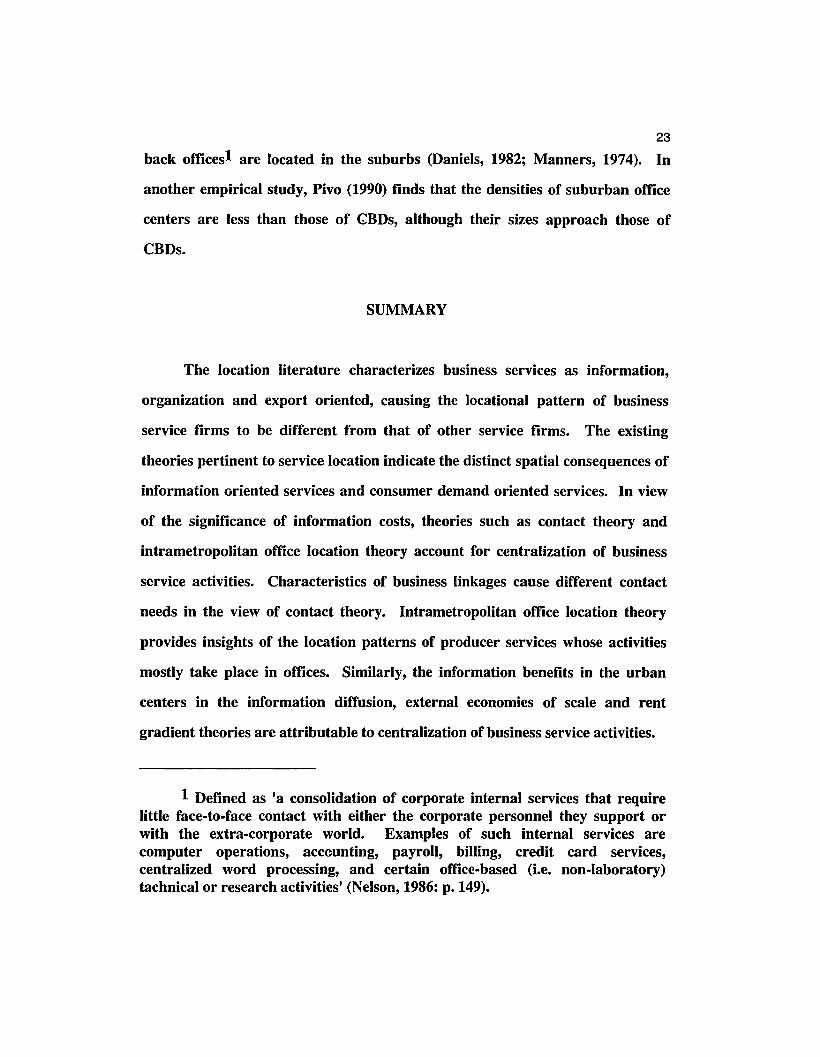
23
back offices1 are located in the suburbs (Daniels, 1982; Manners, 1974). In
another empirical study, Pivo (1990) finds that the densities of suburban office
centers are less than those of eBDs, although their sizes approach those of
CBDs.
SUMMARY
The location literature characterizes business services as information,
organization and export oriented, causing the locational pattern of business
service firms to be different from that of other service firms. The existing
theories pertinent to service location indicate the distinct spatial consequences of
information oriented services and consumer demand oriented services. In view
of the significance of information costs, theories such as contact theory and
intrametropolitan office location theory account for centralization of business
service activities. Characteristics of business linkages cause different contact
needs in the view of contact theory. Intrametropolitan office location theory
provides insights of the location patterns of producer services whose activities
mostly take place in offices. Similarly, the information benefits in the urban
centers in the information diffusion, external economies of scale and rent
gradient theories are attributable to centralization of business service activities.
1 Defined as 'a consolidation of corporate internal services that requirelittle face-to-face contact with either the corporate personnel they support orwith the extra-corporate world. Examples of such internal services arecomputer operations, acccunting, payroll, billing, credit card services,centralized word processing, and certain office-based (i.e. non-laboratory)tachnical or research activities' (Nelson, 1986: p. 149).

24
The market threshold in central place theory is useful to account for
shopping center locations. The general interaction theory of consumer choice
also provides insight into location patterns of retail centers. The more realistic
assumptions of consumer shopping behavior in the consumer service location
models imply more applications in reality for location patterns of consumer
services.
The service relocation studies attribute the often short distance relocations
of service firms to their great needs for the access to the central cities. The
business service firms are likely to decide against relocation from central
locations due to the costly relocation costs: contact (communication) costs, high
skilled labor costs, business linkages with other CBD firms and with multi-site
clients. On the contrary, relocation benefits such as avoidance of the congestion
of central cities and accessibility to suburban part-time female labor are often
greater for retail and other consumer related firms, and for local market
oriented firms such as F.I.R.E (finance, insurance and real estate), hence
accounting for their decentralization.
Business services strongly linked to corporate headquarters exhibit
concentration in the urban centers, whereas other services weakly tied to
headquarters show a dispersed pattern. They are: local services (e.g., repair,
construction and rental services), engineering services, technical services,
computer services and other high tech services.
Central locations offer an aggregate set of attractive features: specialized
business contacts, ease of face-to-face contacts, expertise and specialized
information. This draws export services to the urban centers, acting as a
centralizing pull. It also leads to service function differentials between core and
peripheral locations.

25
The centralization of producer services in the urban centers is expected to
continue in the immediate future according to the following arguments: (a) the
increasing importance of linkages between business services and headquarters in
the U.S. cities; (b) the increasing significance of specialized information for
business service activities; (c) the increasing demand for producer services in
international trade; and (d) the increasing externalization of service purchases of
headquarters in the urban centers. Decentralization of service activities will,
however, continue with the enhanced advantages of peripheral locations and the
decentralization of population. Telecommunication technology is also likely to
increase decentralization of engineering, technical, computer and other high tech
services, but the evidences of its locational effect on financial services appear
weak.
CHAPTER III
TREND OF LOCATION PATTERN OF URBAN SERVICE ACTIVITIES
This chapter describes the decentralization of consumer oriented and
business oriented services in the 89 core counties2 for the period from 1969 to
1989. Among urban services, both consumer oriented and business oriented
services are selected as those Standard Industrial Classifications (U.S.
Department of Commerce, 1989) with a major output of consumer services and
of business services respectively. The consumer oriented services with their SIC
codes (Beyers, 1989; Daniels, 1985; Bergsman et al., 1972):
72
75
76
5200-5999
Personal Services
Auto Repair, Services, and Parking
Miscellaneous Repair Services
Retail Trade.
Also, the business oriented services with their SIC codes (Howells, 1987; Polese,
1982; Bergsman et aI., 1972):
60
73
81
Depository Institutions
Business Services
Legal Services.
2 Defined as the largest population counties among the componentcounties of U.S. metropolitan areas with three or more component counties.

27The decentralization of these services for the time periods of 1969-79,
1979-89 and 1969-89 are measured as changes in location coefficients (Hoerter
and Wiseman, 1988). A positive location coefficient indicates that service
employment is centralizing faster than the employment average for its
metropolitan area. A minus sign indicates that the core county's service
employment is decentralizing faster than its metropolitan average. The location
coefficients are defined as (Hoerter and Wiseman, 1988):
LCci =LCbi =
where:
(COEijt I MCOjt)1 (TEitl MTEt)
(BOEijt / MBOjt) / (TEitl MTEt)
t =time (1969-79, 1979-89, 1969-89);
j =service type: consumer oriented and business oriented services;
i =core county;
COE =consumer oriented service employment;
BOE =business oriented service employment;
MCO =consumer oriented service employment for a core county's metropolitan
area;
MBO = business oriented service employment for a core county's metropolitan
area;
TE = total employment of a core county;
MTE = total employment for a core county's metropolitan area.
This chapter is divided into three sections. The first section discusses the
decentralization of consumer oriented and business oriented services. The
second section discusses the decentralization of these services by size of
metropolitan area. The third section discusses this by region.

28
RANK ORDER OF CHANGES IN DECENTRALIZATION OFURBAN SERVICE ACTIVITIES
For core counties, changes' in location coefficients for consumer oriented
and business oriented services are calculated and interpreted by ranking of
counties (Tables 3.1 through 3.6).
Rank Order Analysis: Consumer Oriented Services
Rank Order Results for Consumer Oriented Services, 1969-79. Looking
at Table 3.1, the core counties with the largest gain in centralization of consumer
oriented services between 1969 and 1979 are in the relatively underdeveloped
service areas except for Kings and Salt Lake counties. Most top ranked counties
are in small metropolitan areas with less than 1 million population; the
exceptions are Kings, Salt Lake, Middlesex and Essex counties. The tendency
for the greatest change in centralization appears to be strong in the core counties
of the small metropolitan areas. Also, almost half of the top ranked counties are
in the Northeast and East North Central regions.
Over half of the counties that experienced the largest change in
decentralization of consumer oriented services for the period of 1969-79 are in
medium and large metropolitan areas with 1 -2 million and over 2 million
population respectively. The largest decentralization of consumer oriented
services during this period is in the core counties in the urban service centers.
Most top ranked counties are also in the Sunbelt region, and others in
Manufacturingbelt and Rural Middle regions. The results of the top ranked
counties seem to indicate the effect of urban size and the trend toward dispersion
of consumer oriented services to the relatively underdeveloped areas.

29TABLE 3.1
CORE COUNTIES WITH THE LARGEST CHANGE IN LOCATIONPATTERN OF CONSUMER ORIENTED SERVICES, 1969-79
Centralization Decentralization1. Kings, NY (New York, NY) 1. Jefferson, OH (Steubenville-Weirton,(0.11) OH-WV)
(-0.33)2. Sullivan, TN (Johnson City- 2. Baltimore City, MD (Baltimore, MD)Kingsport-Bristol, TN-VA) (-0.19)(0.08)3. Belmont, OH (Wheeling, WV-OH) 3. Greenville, SC (Greenville-(0.07) Spartanburg, SC)
(-0.14)4. Luzerne, PA (Scranton-Wilkes- 4. Mecklenburg, NC (Charlotte-Barre, PA) Gastonia-Rock Hill, NC-SC)(0.04) (-0.13)4. Salt Lake, UT (Salt Lake City- 5. Lehigh, PA (Allentown-Bethlehem-Ogden, UT) Easton, PA-NJ)(0.04) (-0.11)4. Middlesex, NJ (Middlesex-Somerset- S. St. Louis, MO (St. Louis, MO-IL)Hunterdon, NJ) (-0.11)(0.04)5. Fayette, KY (Lexington-Fayette, KY) 5. Fulton, GA (Atlanta, GA)(0.03) (-0.11)5. Montgomery, OH (Dayton- 6. Peoria, IL (Peoria, IL)Springfield, OH) (-0.10)(0.03)5. Wake, NC (Raleigh-Durham, NC) 6. Lynchburg City, VA (Lynchburg,(0.03) VA)
(-0.10)5. Essex, NJ (Newark, NJ) 6. Hennepin, MN (Minneapolis-St.(0.03) Paul, MN-WI)
(-0.10)5. Scott, IA (Davenport-Rock Island- 7. San Francisco, CA (San Francisco,Moline,IA-IL) CA)(0.03) (-0.09)
*Changes in location coefficient values for the 1969-79 period are in parentheses.
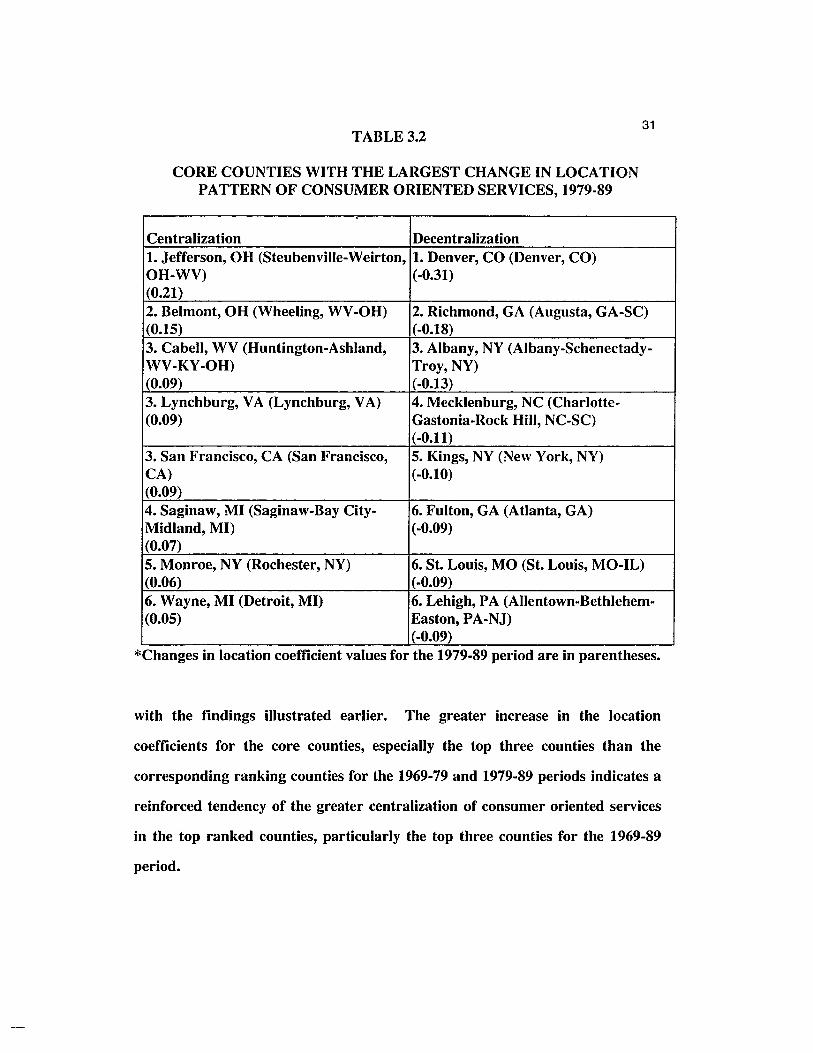
Rank Order Results for Consumer Oriented Services, 1979-89. Table 3.2
shows that most counties with the largest gain in centralization of consumer
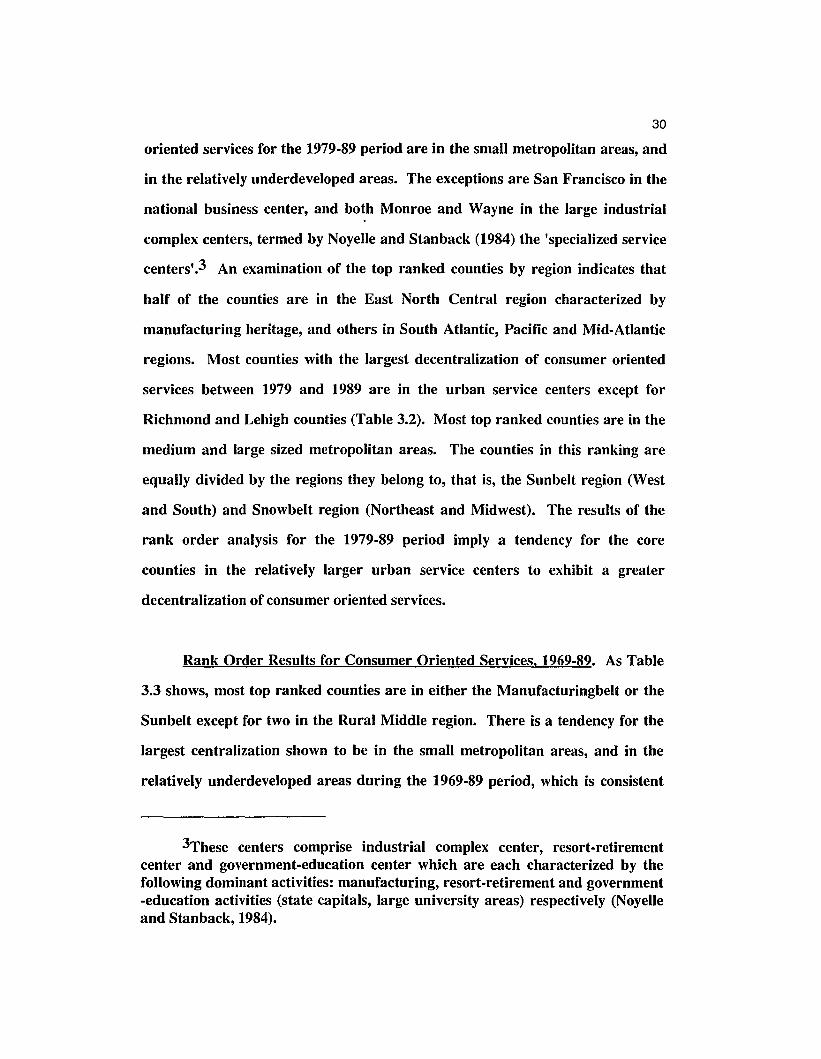
30
oriented services for the 1979-89 period are in the small metropolitan areas, and
in the relatively underdeveloped areas. The exceptions are San Francisco in the
national business center, and both Monroe and Wayne in the large industrial
complex centers, termed by Noyelle and Stanback (1984) the 'specialized service
centers'} An examination of the top ranked counties by region indicates that
half of the counties are in the East North Central region characterized by
manufacturing heritage, and others in South Atlantic, Pacific and Mid-Atlantic
regions. Most counties with the largest decentralization of consumer oriented
services between 1979 and 1989 are in the urban service centers except for
Richmond and Lehigh counties (Table 3.2). Most top ranked counties are in the
medium and large sized metropolitan areas. The counties in this ranking are
equally divided by the regions they belong to, that is, the Sunbelt region (West
and South) and Snowbelt region (Northeast and Midwest). The results of the
rank order analysis for the 1979-89 period imply a tendency for the core
counties in the relatively larger urban service centers to exhibit a greater
decentralization of consumer oriented services.
Rank Order Results for Consumer Oriented Services. 1969-89. As Table
3.3 shows, most top ranked counties are in either the Manufacturingbelt or the
Sunbelt except for two in the Rural Middle region. There is a tendency for the
largest centralization shown to be in the small metropolitan areas, and in the
relatively underdeveloped areas during the 1969-89 period, which is consistent
3These centers comprise industrial complex center, resort-retirementcenter and government-education center which are each characterized by thefollowing dominant activities: manufacturing, resort-retirement and government-education activities (state capitals, large university areas) respectively (Noyelleand Stanback, 1984).
31TABLE 3.2
CORE COUNTIES WITH THE LARGEST CHANGE IN LOCATIONPATTERN OF CONSUMER ORIENTED SERVICES, 1979-89
Centralization Decentralization1. Jefferson, OH (Steubenville-Weirton, 1. Denver, CO (Denver, CO)OH-WV) (-0.31)(0.21)2. Belmont, OH (Wheeling, WV-OH) 2. Richmond, GA (Augusta, GA-SC)(0.15) (-0.18)3. Cabell, WV (Huntington-Ashland, 3. Albany, NY (Albany-Schenectady-WV-KY-OH) Troy, NY)(0.09) (-0.13)3. Lynchburg, VA (Lynchburg, VA) 4. Mecklenburg, NC (Charlotte-(0.09) Gastonia-Rock Hill, NC-SC)
(-0.11)3. San Francisco, CA (San Francisco, 5. Kings, NY (New York, NY)CA) (-0.10)(0.09)4. Saginaw, MI (Saginaw-Bay City- 6. Fulton, GA (Atlanta, GA)Midland, MI) (-0.09)(0.07)5. Monroe, NY (Rochester, NY) 6. St. Louis, MO (St. Louis, MO-IL)(0.06) (-0.09)6. Wayne, MI (Detroit, MI) 6. Lehigh, PA (Allentown-Bethlehem-(0.05) Easton, PA-NJ)
(-0.09)*Changes in location coefficient values for the 1979-89 period are in parentheses.
with the findings illustrated earlier. The greater increase in the location
coefficients for the core counties, especially the top three counties than the
corresponding ranking counties for the 1969-79 and 1979-89 periods indicates a
reinforced tendency of the greater centralization of consumer oriented services
in the top ranked counties, particularly the top three counties for the 1969-89
period.

32TABLE 3.3
CORE COUNTIES WITH THE LARGEST CHANGE IN LOCATIONPATTERN OF CONSUMER ORIENTED SERVICES, 1969-89
Centralization Decentralization1. Albemarle, VA (Charlottesville, VA) 1. Denver, CO (Denver, CO)(0.31) (-0.38)2. Belmont, OH (Wheeling, WV-OH) 2. Baltimore, MD (Baltimore, MD)(0.22) (-0.25)3. Sullivan, TN (Johnson City- 3. Mecklenburg, NC (Charlotte-Kingsport-Bristol, TN-VA) Gastonia-Rock Hill, NC-SC)(0.12) (-0.24)4. Cabell, WV (Huntington-Ashland, 3. Richmond, GA (Augusta, GA-SC)WV-KY-OH) (-0.24)(0.10)5. Middlesex, NJ (Middlesex-Somerset- 4. Albany, NY (Albany-Schenectady-Hunterdon, NJ) Troy, NY)(0.06) (-0.20)6. Stearns, MN (St. Cloud, MN) 4. Lehigh, PA (Allentown-Bethlehem-(0.05) Easton, PA-NJ)
(-0.20)7. Saginaw, MI (Saginaw-Bay City- 4. St. Louis, MO (St. Louis, MO-IL)Midland, MI) (-0.20)(0.04)8. Jackson, MO (Kansas City, MO-KS) 4. Fulton, GA (Atlanta, GA)(0.03) (-0.20)8. Wake, NC (Raleigh-Durham, NC) 5. Peoria, IL (Peoria, IL)(0.03) (-0.18)8. Luzerne, PA (Scranton-Wilkes- 6. Greenville, SC (Greenville-Barre, PA) Spartanburg, SC)(0.03) (-0.16)8. Sebastian, AR (Ft. Smith, AR-OK) 7. Hennepin, MN (Minneapolis-St.(0.03) Paul, MN-WI)
(-0.14)8. Salt Lake, UT (Salt Lake City- 8. Jefferson, OH (Steubenville-Weirton,Ogden, UT) OH-WV)(0.03) (-0.12)8. Vanderburgh, IN (Evansville, IN- 8. Middlesex, MA (Boston, MA)KY) (-0.12)(0.03)
*Changes in location coefficient values for the 1969-89 period are in parentheses.

33
There is a tendency for greater decentralization of consumer oriented
services in the urban service centers, and in the medium and large sized
metropolitan areas which seems to change little for most top ranked counties
from the one decade (Tables 3.1 and 3.2) to the two decades (Table 3.3). Table
3.3 shows, however, the much greater increase in the location coefficients for the
top ranked counties during the 1969-89 period than the corresponding ranking
counties during the 1969-79 and 1979-89 periods.
Rank Order Analvsis: Business Oriented Services
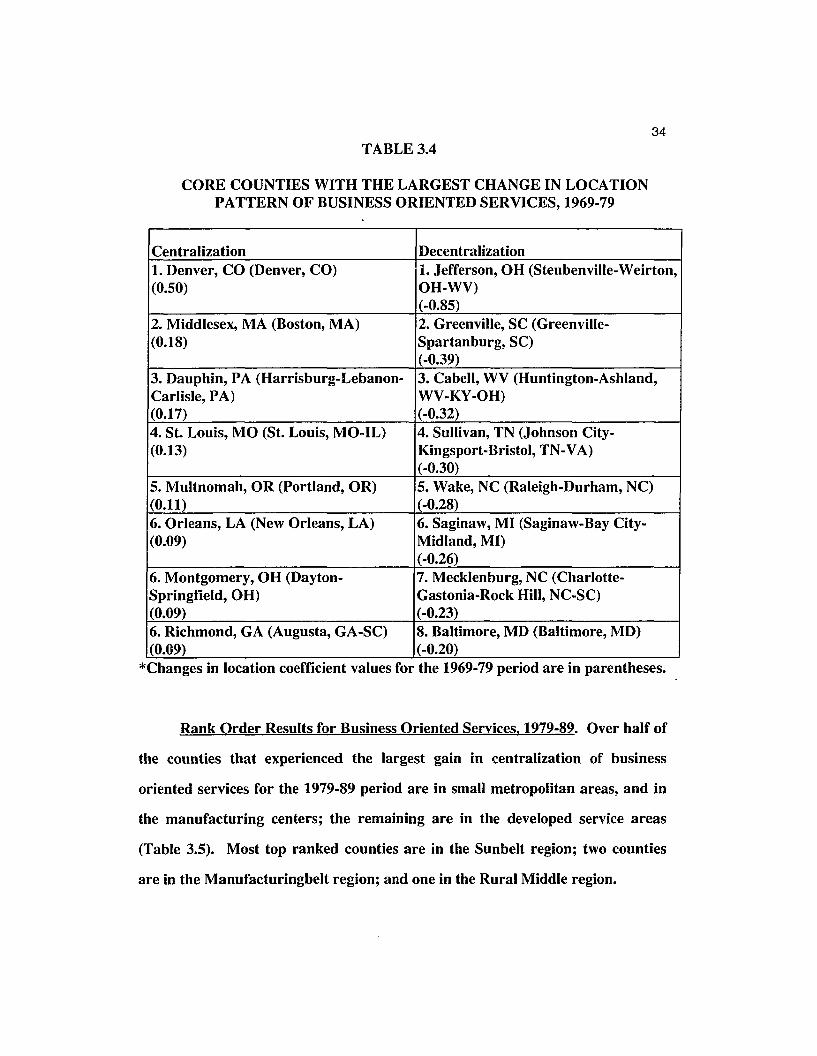
Rank Order Results for Business Oriented Services, 1969-79. The core
counties with the largest gain in centralization of business oriented services for
the period 1969-79 are now examined (Table 3.4). Most top ranked counties are
in the medium and large sized metropolitan areas, and in business centers
(except for Dauphin, Montgomery and Richmond counties). The counties in this
ranking are in either the Manufacturingbelt or the Sunbelt region except for one
in the Rural Middle region. The tendency for core counties in the relatively
larger business centers to exhibit a greater centralization of business oriented
services seems to be related to the fact that such areas are reinforcing the
comparative advantages in the business oriented services with the support of
corporate activities and service infrastructure.
The largest decentralization of business oriented services for the 1969-79
period are in the small metropolitan areas, and in the manufacturing centers
except for Mecklenburg and Baltimore counties (Table 3.4). The majority of the
top ranked counties are in the South, and two are in the Manufacturingbelt.
The tendency for greater decentralization of business oriented services is shown
to be strong in the manufacturing production areas, which seems to indicate that
they lack service infrastructure necessary to support business service growth.
34TABLE 3.4
CORE COUNTIES WITH THE LARGEST CHANGE IN LOCATIONPATTERN OF BUSINESS ORIENTED SERVICES, 1969-79
Centralization Decentralization1. Denver, CO (Denver, CO) 1. Jefferson, OH (Steubenville-Weirton,(0.50) OH-WV)
(-0.85)2. Middlesex, MA (Boston, MA) 2. Greenville, SC (Greenville-(0.18) Spartanburg, SC)
(-0.39)3. Dauphin, PA (Harrisburg-Lebanon- 3. Cabell, WV (Huntington-Ashland,Carlisle, PA) WV-KY-OH)(0.17) (-0.32)4. St. Louis, MO (St. Louis, MO-IL) 4. Sullivan, TN (Johnson City-(0.13) Kingsport-Bristol, TN-VA)
(-0.30)5. Multnomah, OR (Portland, OR) 5. Wake, NC (Raleigh-Durham, NC)(0.11) (-0.28)6. Orleans, LA (New Orleans, LA) 6. Saginaw, MI (Saginaw-Bay City-(0.09) Midland, MI)
(-0.26)6. Montgomery, OH (Dayton- 7. Mecklenburg, NC (Charlotte-Springfield, OU) Gastonia-Rock Hill, NC-SC)(0.09) (-0.23)6. Richmond, GA (Augusta, GA-SC) 8. Baltimore, MD (Baltimore, MD)(0.09) (-0.20)
*Changes in location coefficient values for the 1969-79 period are in parentheses.
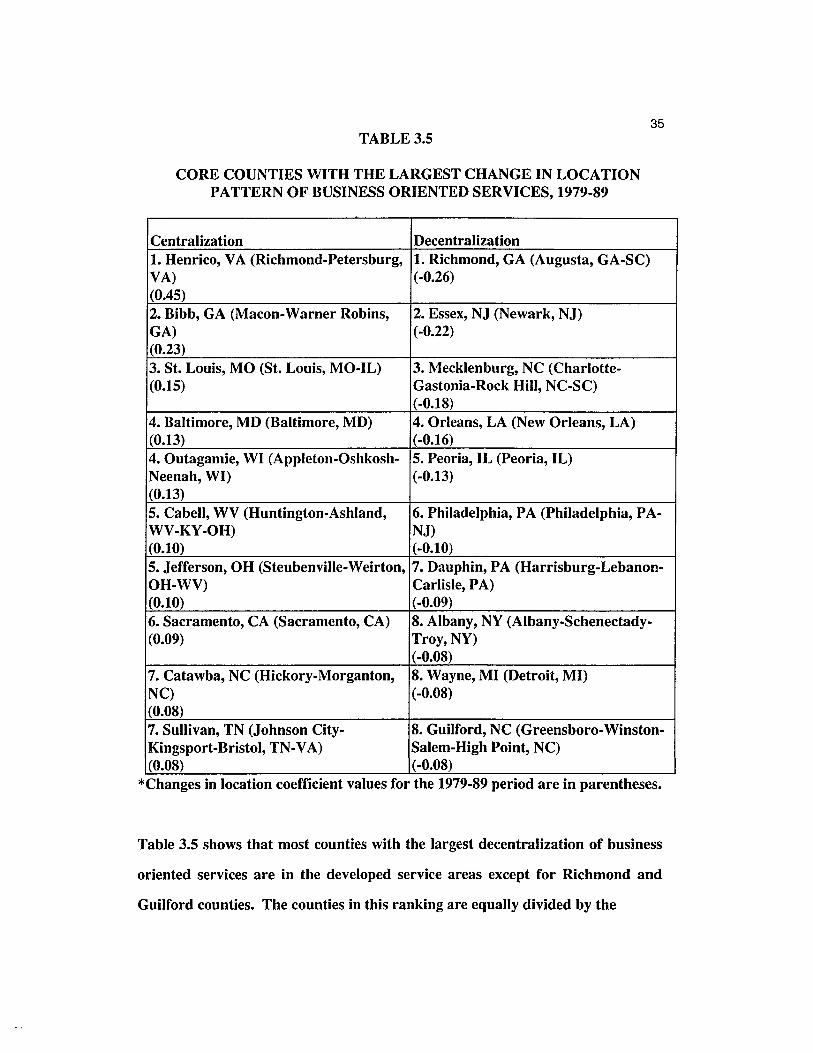
Rank Order Results for Business Oriented Services. 1979-89. Over half of
the counties that experienced the largest gain in centralization of business
oriented services for the 1979-89 period are in small metropolitan areas, and in
the manufacturing centers; the remaining are in the developed service areas
(Table 3.5). Most top ranked counties are in the Sunbelt region; two counties
are in the Manufacturingbelt region; and one in the Rural Middle region.
35TABLE 3.5
CORE COUNTIES WITH THE LARGEST CHANGE IN LOCATIONPATTERN OF BUSINESS ORIENTED SERVICES, 1979-89
Centralization Decentralization1. Henrico, VA (Richmond-Petersburg, 1. Richmond, GA (Augusta, GA-SC)VA) (-0.26)(0.45)2. Bibb, GA (Macon-Warner Robins, 2. Essex, NJ (Newark, NJ)GA) (-0.22)(0.23)3. St. Louis, MO (St. Louis, MO-IL) 3. Mecklenburg, NC (Charlotte-(0.15) Gastonia-Rock Hill, NC-SC)
(-0.18)4. Baltimore, MD (Baltimore, MD) 4. Orleans, LA (New Orleans, LA)(0.13) (-0.16)4. Outagamie, WI (Appleton-Oshkosh- 5. Peoria, IL (Peoria, IL)Neenah, WI) (-0.13)(0.13)5. Cabell, WV (Huntington-Ashland, 6. Philadelphia, PA (Philadelphia, PA-WV-KY-OH) NJ)(0.10) (-0.10)5. Jefferson, OH (Steubenville-Weirton, 7. Dauphin, PA (Harrisburg-Lebanon-OH-WV) Carlisle, PA)(0.10) (-0.09)6. Sacramento, CA (Sacramento, CA) 8. Albany, NY (Albany-Schenectady-(0.09) Troy, NY)
(-0.08)7. Catawba, NC (Hickory-Morganton, 8. Wayne, MI (Detroit, MI)NC) (-0.08)(0.08)7. Sullivan, TN (Johnson City- 8. Guilford, NC (Greensboro-Winston-Kingsport-Bristol, TN-VA) Salem-High Point, NC)(0.08) (-0.08)
*Changes in location coefficient values for the 1979-89 period are in parentheses.
Table 3.5 shows that most counties with the largest decentralization of business
oriented services are in the developed service areas except for Richmond and
Guilford counties. The counties in this ranking are equally divided by the
36TABLE 3.6
CORE COUNTIES WITH THE LARGEST CHANGE IN LOCATIONPATTERN OF BUSINESS ORIENTED SERVICES, 1969-89
Centralization Decentralization1. Denver, CO (Denver, CO) 1. Jefferson, OH (Steubenville-Weirton,(0.43) OH-WV)
(-0.75)2. Henrico, VA (Richmond-Petersburg, 2. Mecklenburg, NC (Charlotte-VA) Gastonia-Rock Hill, NC-SC)(0.31) (-0.41)3. St. Louis, MO (St. Louis, MO-IL) 3. Greenville, SC (Greenville-(0.28) Spartanburg, SC)
(-0.37)4. Middlesex, MA (Boston, MA) 4. Saginaw, MI (Saginaw-Bay City-(0.20) Midland, MI)
(-0.32)5. Outagamie, WI (Appleton-Oshkosh- 5. Wake, NC (Raleigh-Durham, NC)Neenah, WI) (-0.27)(0.16)6. Montgomery, OH (Dayton- 6. Essex, NJ (Newark, NJ)Springfield,OH) (-0.24)(0.13)7. Sacramento, CA (Sacramento, CA) 7. Wayne, MI (Detroit, MI)(0.09) (-0.23)8. Multnomah, OR (Portland, OR) 7. Guilford, NC (Greensboro-Winston-(0.08) Salem-High Point, NC)
(-0.23)8. Orange, FL (Orlando, FL) 8. Cabell, WV (Huntington-Ashland,(0.08) WV-KY-OH)
(-0.22)8. Dauphin, PA (Harrisburg-Lebanon- 8. Sullivan, TN (Johnson City-Carlisle, PA) Kingsport-Bristol, TN-VA)(0.08) (-0.22)
*Changes in location coefficient values for the 1969-89 period are in parentheses.
metropolitan size groups which they belong to, that is, the relatively larger
(medium and large) metropolitan areas and small metropolitan areas. The
majority of them are in the Manufacturingbelt, and the remaining are in the

37
South. The tendency for greater decentralization of business oriented services
appears to be strong in the core counties of the older metropolitan areas.
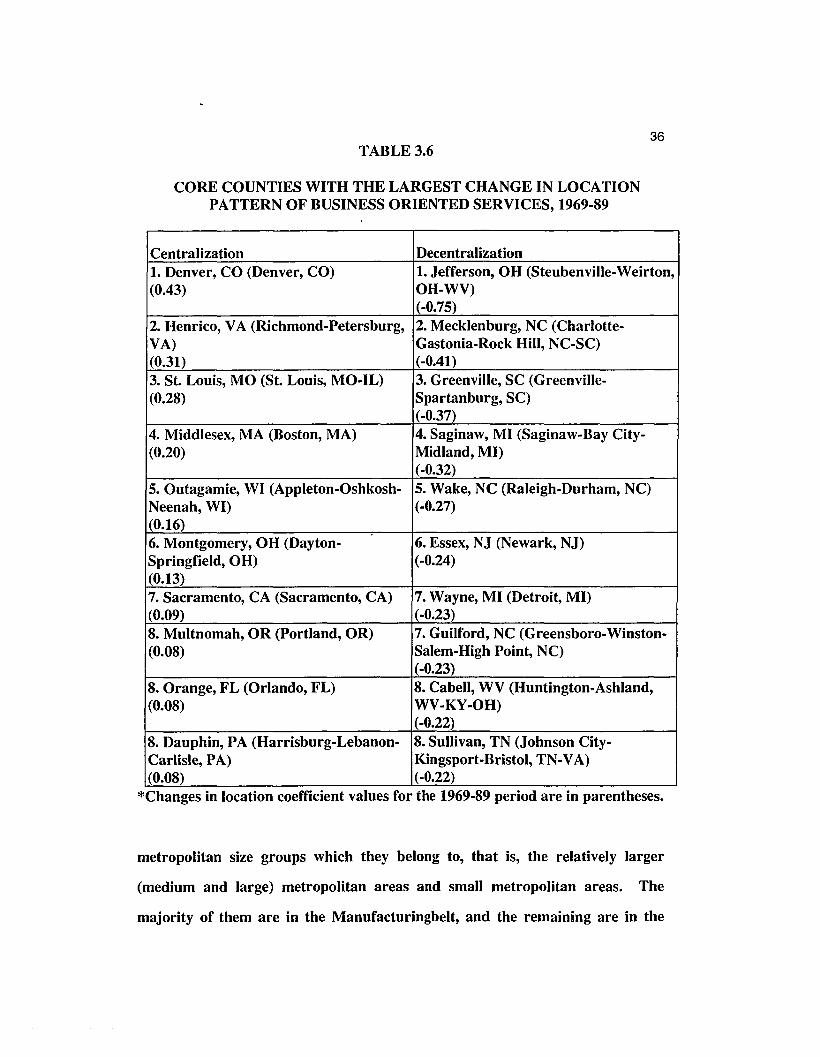
Rank Order Results for Business Oriented Services. 1969-89. A tendency
for greater centralization of business oriented services during the period of 1969
89 appears to be strong in the core counties of the medium and large
metropolitan areas, and of the urban service centers (Table 3.6). Half of the top
ranked counties are in the Sunbelt region; four counties are in the
Manufacturingbelt region; and one in the Rural Middle region. The results
indicate increasing centralization of business oriented services in the relatively
larger service centers, reflecting the importance of large size and service
infrastructure. This would be consistent with trends in business services
observed in the large U.S. cities (Stanback et al., 1981; Daniels, 1979; Stanback,
1979).
Table 3.6 shows that a tendency for greater decentralization of business
oriented services during the period of 1969-89 is strong in the Sunbelt region,
and in the small metropolitan areas; the exceptions are Mecklenburg, Essex and
Wayne counties. The much greater increase in the location coefficients for the
top ranked counties than the corresponding ranking counties for the 1979-89
period indicates a reinforced tendency of greater decentralization of business
oriented services in the top ranked counties for the 1969·89 period. There is also
a definite tendency for non-business service centers to exhibit greater
decentralization of business oriented services with the exception of Mecklenburg
county.
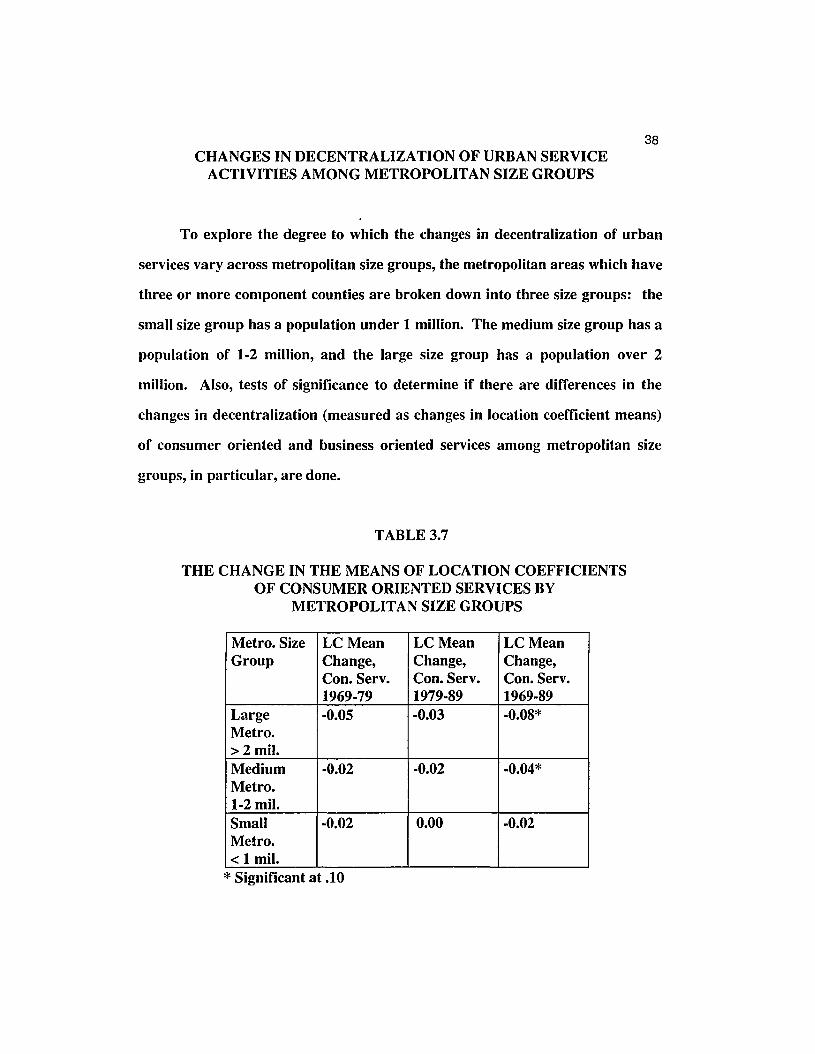
38CHANGES IN DECENTRALIZATION OF URBAN SERVICE
ACTIVITIES AMONG METROPOLITAN SIZE GROUPS
To explore the degree to which the changes in decentralization of urban
services vary across metropolitan size groups, the metropolitan areas which have
three or more component counties are broken down into three size groups: the
small size group has a population under 1 million. The medium size group has a
population of 1-2 million, and the large size group has a population over 2
million. Also, tests of significance to determine if there are differences in the
changes in decentralization (measured as changes in location coefficient means)
of consumer oriented and business oriented services among metropolitan size
groups, in particular, are done.
TABLE 3.7
THE CHANGE IN THE MEANS OF LOCATION COEFFICIENTSOF CONSUMER ORIENTED SERVICES BY
METROPOLITAN SIZE GROUPS
Metro. Size LC Mean LCMean LCMeanGroup Change, Change, Change,
Con. Servo Con. Servo Con. Servo1969-79 1979-89 1969-89
Large -0.05 -0.03 -0.08*Metro.> 2 mil.Medium -0.02 -0.02 -0.04*Metro.1-2 mil.Small -0.02 0.00 -0.02Metro.< 1 mil.
* Significant at .10
39Metropolitan Analysis: Consumer Oriented Services
The largest change in the location coefficient means of consumer oriented
services for the 1969-79 period (Table 3.7) is shown for the large metropolitan
group. The magnitude of the change in the mean values of consumer oriented
services for the 1979-89 period rises as we move from the small to the large
metropolitan size group (Table 3.7). This indicates a tendency toward
progressively greater decentralization of consumer oriented services, as we move
from the small to the large group's counties.
Both medium and large groups show a slightly more change in the means
of location coefficients of consumer oriented services for the 1969-89 period
(Table 3.7). This suggests a reinforced tendency of decentralization of consumer
oriented services in the core counties in both medium and large groups. The
change in the mean values for large metropolitan group suggests that the core
counties in the large group experience slightly greater decentralization of
consumer oriented services than those in other groups, and a statistically
significant (at .10 percent) change in the decentralization of consumer oriented
services over the period 1969 to 1989. Table 3.7 also shows that the medium
group experience slightly greater decentralization of consumer oriented services
than the small group during the 1969-89 period, which is statistically significant
(at .10 percent) as well.
Metrop-olitan Analysis: Business Oriented Services
The large group's mean changes for business oriented services for the
1969-79 period indicate that decentralization of business oriented services is
greater than the medium group's, but less than the small group's. It seems that
the small group experienced greater decentralization of business oriented
services than the other groups, and a statistically significant (at .05 percent)

40
TABLE 3.8
THE CHANGE IN THE MEANS OF LOCATION COEFFICIENTSOF BUSINESS ORIENTED SERVICES BY
METROPOLITAN SIZE GROUPS
Metro. Size LC Mean LC Mean LC MeanGroup Change, Change, Change,
Bus. Servo Bus. Servo Bus. Servo1969-79 1979-89 1969-89
Large -0.02 0.01 -0.02Metro.> 2 mil.Medium 0.04 -0.03 0.00Metro.1-2 mil.Small -0.08* 0.02 -0.06*Metro.< 1 mil.
*Significant at .05
change in the decentralization of business oriented services for the 1969-79
period (Table 3.8). Meanwhile, the change in the mean values for medium
metropolitan group during the 1979-89 period indicates that decentralization of
business oriented services is greater than those of other groups.
The largest change in the means of location coefficients of business
oriented services during the 1969-89 period is shown for the small group,
followed by the large group, and no change in the magnitude for the medium
group (Table 3.8). The small metropolitan group also shows a statistically
significant (at .05 percent) change in the decentralization of business oriented
services over the period. The results indicate that the small group experienced
slightly greater decentralization of business oriented services than other groups
during the 1969-89 period.

41REGIONAL VARIATIONS IN DECENTRALIZATION
OF URBAN SERVICE ACTIVITIES
To examine the degree to which changes in the decentralization of
consumer oriented and business oriented services vary across the U.S. regions,
changes in means of location coefficients for these services for the nine U.S.
census regions (Figure 1) are calculated (Tables 3.9 and 3.10). These changes are
also mapped across the regions (Figures 2 through 7). In addition, tests to
determine if there are significant differences in the changes by the regions are
done.
TABLE 3.9
THE CHANGE IN THE MEANS OF LOCATION COEFFICIENTSOF CONSUMER ORIENTED SERVICES BY REGIONS
OF THE CORE COUNTIES
U.S. Regions LC Mean LCMean LCMeanChange, Change, Change,Con. Servo Con. Servo Con. Servo1969-79 1979-89 1969-89
New -0.02 -0.02 -0.04En~land
W. South -0.01 -0.01 -0.02CentralE. South 0.01 -0.02* -0.01CentralPacific -0.04 0.00 -0.04Mountain -0.02 -0.16 -0.18South -0.05 0.00 -0.04AtlanticW. North -0.02 -0.01 -0.03CentralE. North -0.03 0.01 -0.02CentralMid-Atlantic -0.01 -0.02 -0.04
* Significant at .10

.0 a.
"\It>PACIFIC
WEST
tI
MIDWEST
SOUTH
~ u.s. census divisions and regions.Source: Statistical Abstract of the U.S., 1991.
y.,~~S'\o~'\~ NEW E
Miles
o 200 400

" . ')--_.~~,
(' , d-;. ',rr'"
,2~:1t}:!-o.ost >.;.:Y:: :: (~J
rc::;,;,') \~.. "
\ .. ,'~ :;
, "
·c~
-0.02-0.02
:Eig..b The change in the means of location coefficients for consumeroriented services by regions of the core counties, 1969-79,

44Regional Analysis: Consumer Oriented Services
Looking at Figure 2, there is an overwhelming tendency for spatial
decentralization of consumer oriented services in most regions during the 1969
79 period, ranging from South "Atlantic region (with a change in location
coefficient means of -0.05) to West South Central and Mid-Atlantic regions (with
-0.01). The tendency for decentralization of consumer oriented services remains
in most regions for the 1979-89 period (Figure 3); this tendency appears to be
reinforced, especially in both Mountain and East South Central regions.
The Mountain region's counties with -0.16 which fell from -0.02 exhibit
greater decentralization of consumer oriented services than the other regions.
The East South Central region's counties with -0.02 which fell from 0.01 not only
exhibit a tendency for decentralization of consumer oriented services for the
1979-89 period, but also show a statistically significant (at .10 percent) change in
the decentralization as well (Table 3.9). Conversely, South Atlantic, East North
Central and Pacific regions tend to exhibit a tendency toward centralization for
the 1979-89 period (Figure 3).
All the regions show an increasing tendency for decentralization of
consumer oriented services over the period 1969 to 1989 (Figure 4). The
Mountain region stands out again as the leading group (with -0.18) which exhibit
the greater decentralization of consumer oriented services than the other
regions, followed by the Northeast, South Atlantic and Pacific regions (with
0.04).
Regional Analysis: Business Oriented Services
There is no dominant tendency for decentralization of business oriented
services for the 1969-79 period (Figure 5). The Mountain region (with 0.27)
exhibit greater centralization of business oriented services than both the

~
,.
.;:"~'/l'~'='~
~"""~1" .... '\.
&;-'1 -0.02 "iY'j,~ - -",,',' ',''''''
," " " " " " '1 f',"" ,'"J" " , ,'," .... ,',/l ....,,1-0 02[",1 .t-£.L.-~,'-\ . ,''''"'--_ ....','...' ...',' , , ,,~~--~-'!....~l·, "':;
0.00
""
'"'/7~
'/
-0.01 '),
'.n.- '"
...._- ...
'III '7,
'III .~
'I.T.T.T
-0.01...,
VI '.TL'.
~ .~
~'" ~~~'"~;~
I, .
~:-.~ .
J:-:-~~-:~:~.:~:~-.· .· .· .· .· .· .
: : : :: 1-0·161: :::::
,\.
.~
0.00
Bg..J.. The change in the means of location coefficients for consumeroriented services by regions of the core counties, 1979-89.

. ,--------. ;. !
I
:....
,)', f<>' ~~~~~
~~~ ,
(f)0Q
I
I
III
II .
~:

47TABLE 3.10
THE CHANGE IN THE MEANS OF LOCATION COEFFICIENTSOF BUSINESS ORIENTED SERVICES BY REGIONS
OF THE CORE COUNTIES
U.S. Regions LCMean LC Mean LC MeanChange, Change, Change,Bus. Servo Bus. Servo Bus. Servo1969-79 1979-89 1969-89
New 0.03 0.02 0.04En~land
W. South 0.00 -0.01 -0.01CentralE. South -0.07* 0.00 -0.08**CentralPacific 0.03 0.04 0.06Mountain 0.27 -0.06 0.21South -0.14* 0.04 -0.10AtlanticW. North 0.00 0.02 0.02CentralE. North -0.08 0.00 -0.07CentralMid-Atlantic 0.01 -0.05 -0.04
** Significant at .05* Significant at .10
Northeast (with 0.01-0.03) and Pacific (with 0.03) regions. The South Atlantic
region (with -0.14), on the contrary, shows statistically significant (at .10
percent) decentralization (Table 3.10), and exhibits greater decentralization of
business ol'iented services than both the East North Central (with -0.08) and
East South Central (with -0.07) regions.

'/'"?
~
0.00
0.00
.Eig2. The change in the means of location coefficients for businessoriented services by regions of the core counties, 1969-79.
;;;1- -- -'~;-7
5.:::... 1..\.... """'11.~ . . . . ~ .. ,.
~- _. <1. : •••••~:".r: ~
~:'l :O.i4l ::,Y
~.- .-. : : : : (:>/J--",~).,." ~ : :
'\: :\, .. {~... \
\>~.~j
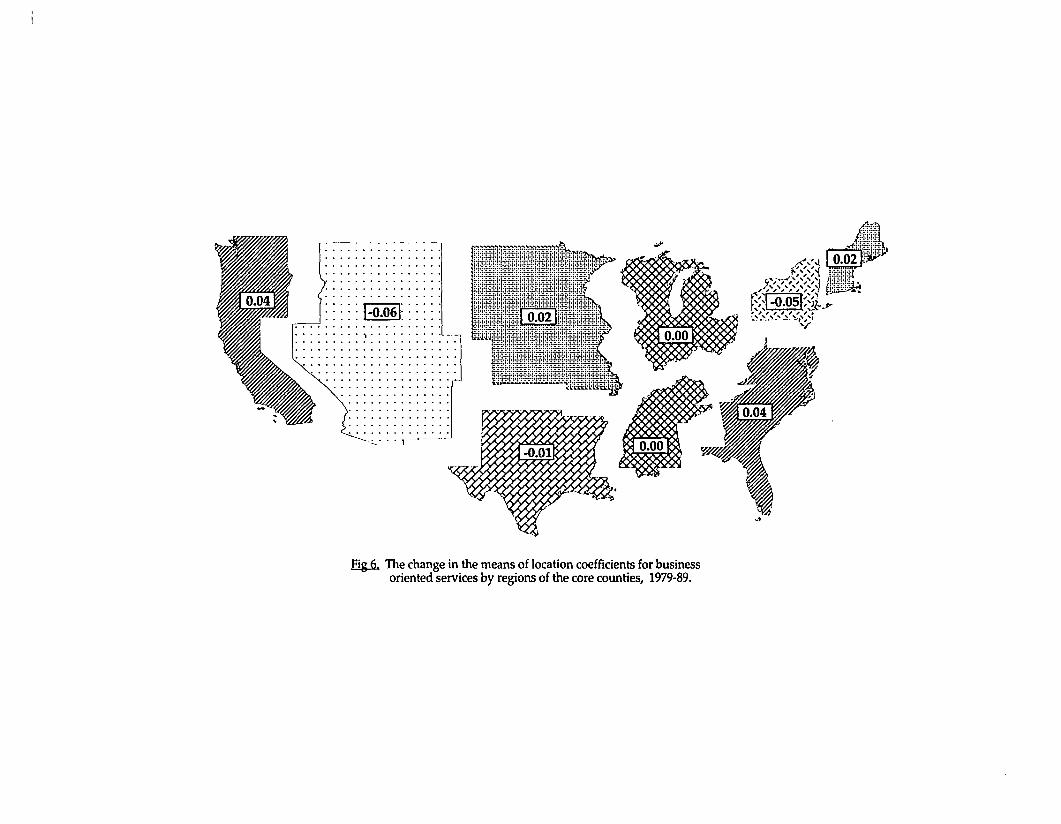
/~,:-l 1..9·,0~,;__,,;:~~~~~ j1~~~~~!~~~~:t.
/~""""""~ r.;':j±i:l~"'" 'ri\"'i\i:l "t'" •r~~~~~~t;P«~_~~~.,~~~.~,~'I
V
....., --
- ."7':T:T:T7'7 .~
'7777
YYYY -0.01..-,'(:/
Y7 "/L
'0' ~
~Y.v~y.~;I
,--------_.. -------
Eig..6. The change in the means of location coefficients for businessoriented services by regions of the core counties, 1979-89.

50
The spatial tendency of business oriented services across these regions for
the 1969-79 period contrasts with that for the 1979-89 period. Both Mountain
and Mid-Atlantic regions exhibit ~ tendency toward decentralization during the
1979-89 period (Figure 6). Conversely, the South Atlantic region shows a
tendency for centralization (with 0.04) of these services for the 1979-89 period.
Both Manufacturingbelt and South regions, on the whole, show a
tendency for decentralization of business oriented services over the period 1969
to 1989 (Figure 7). The Mid-Atlantic and East North Central regions (with -0.04
and -0.07) respectively exhibit a tendency toward the decentralization of these
services during the 1969-89 period. There is a tendency toward progressively
greater decentrali-zation of business oriented services across the South, as we
move from the West South Central region (with -0.01) through the East South
Central region (with -0.08 ) to the South Atlantic region (with -0.10); the East
South Central region also shows a statistically significant (at .05 percent) change
in decentralization (Table 3.10) as well.
The tendency for decentralization of business oriented services in the Mid
Atlantic region appears to partially reflect the tendency for corporate activities
of the Greater New York area to become more dispersed, while that for East
South Central region seems to be related, in part, to a lack of major urban
service centers. The Western region, on the contrary, shows a tendency for
centralization of business oriented services for the 1969-89 period; the Mountain
region shows a greater centralization of business oriented services (with 0.21)
than the Pacific region (with 0.06).
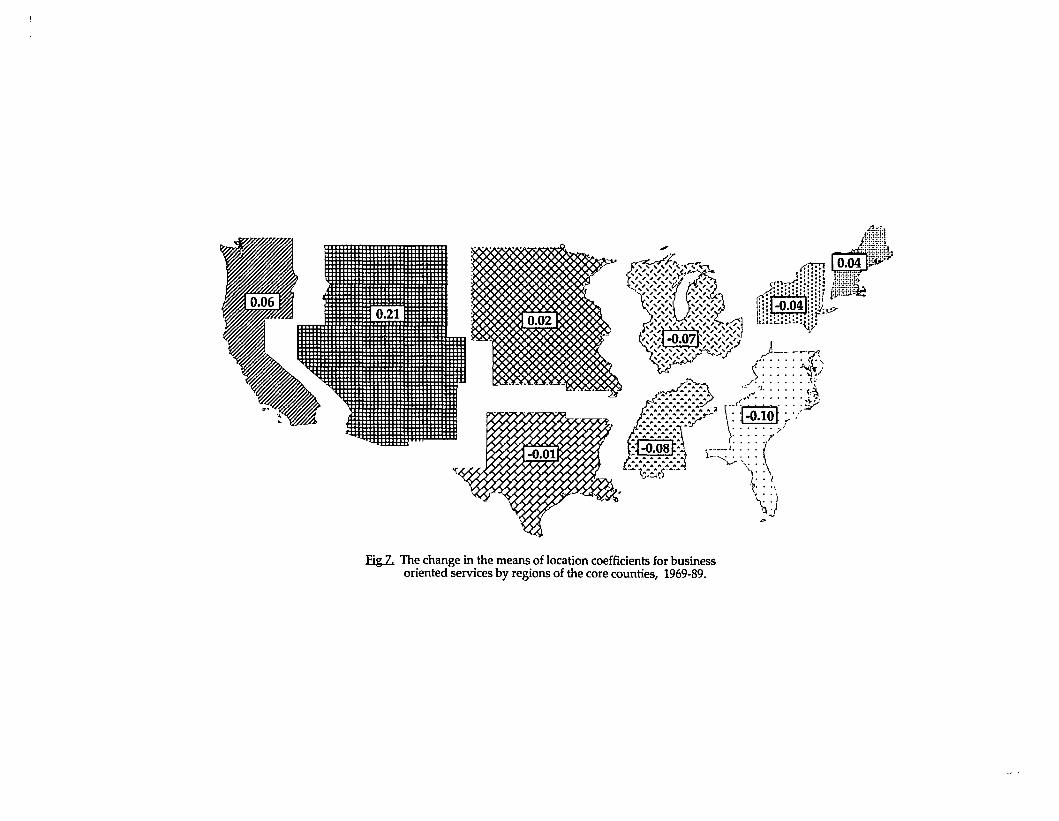
f.:T:n~:: :::: ~
~:~:r:1:H:::;~':"""::::f:': (-9 :O~):: :~-p7[:i:",.:,:.:.: ~r'····t...:.a_....l •••'.!- 'V
~
/L -~
.•• l'"... ~~ .\. •••••• 'lJ/
'/"1:::::: ;*~~ ,J ••••V
~!.::::::::::~ )<iiID ~:...;..
::~~~~~~~:r~·:~ ~ :~ ~ :\;/:~-o.08~: i~~: : .1':..•••••.:.:.: '\ ..
~~ ••••••~-~-~ / .. i-\/:.<tJ ,~...,
,,~ :)q~}
-0.01
0.02
0;'-
Eg2. The change in the means of location coefficients for businessoriented services by regions of the core counties, 1969-89.

52SUMMARY
The analysis provides evidence for the relatively larger urban service
centers to demonstrate a spatial behavior of consumer oriented services roughly
opposite to that of those in the small and relatively underdeveloped service
areas. There is a tendency for greater decentralization of consumer oriented
services in the relatively larger urban service centers for the time periods of
1969-79, 1979-89 and 1969-89; this tendency also appears to be reinforced over
the period 1969 to 1989. This reflects urban size and the trend toward
dispersion of consumer oriented services to the relatively underdeveloped service
areas. The greater centralization of consumer oriented services appears to be
strong in the small and relatively underdeveloped service areas.
The spatial tendency for consumer oriented services contrasts with that
for business oriented services. A tendency for greater centralization of business
oriented services is shown for the business centers for the 1969-79 and 1969-89
periods. An increasing trend for greater decentralization of business oriented
services appears for the small and relatively underdeveloped service areas
during these periods, which indicates the importance of size and service
infrastructure necessary to support growth of business oriented services.
The analysis of changes in the means of location coefficients among
metropolitan size groups suggests that the large metropolitan group experienced
slightly greater decentralization of consumer oriented services than other groups
for the one and two decade periods. The tendency of decentralization of
consumer oriented services appears to be reinforced in both medium and large
size groups over the period 1969 to 1989. Meanwhile, the small metropolitan
group shows slightly greater decentralization of business oriented services than

53
other groups, and a statistically significant change in the decentralization for the
1969-79 and 1969-89 periods.
The analysis shows that the tendency for spatial decentralization of
consumer oriented services appears to be reinforced in most regions. There is no
consistent spatial tendency of business oriented services for the 1969-79 and
1979-89 periods. An increasing tendency for decentralization of business
oriented services in most regions, however, appears for the 1969·89 period; the
Manufacturingbelt and the South show a tendency toward decentralization
during this period.

CHAPTER IV
METHODOLOGY OF MULTIPLE REGRESSION ANALYSIS
This chapter will analyze how the changes in metropolitan decentral
ization of service activities are related to economic structural changes, inertia of
the existing spatial pattern, communications activity, decentralization of
manufacturing, corporate influence, racial composition, level of demand, and
regional location. These relationships are analyzed for the core counties which
are the largest population counties among the component counties of the U.S.
metropolitan areas with three or more component counties for the periods from
1969 to 1989. There is a lot of variation in the extent to which the core county is
built out; What is the extent to which core counties can be considered 'central'?
This was considered in designing the sample of metropolitan areas. The sample
was selected to distinguish core and peripheral counties in metropolitan areas.
Since the core counties also tend to be varied by geographical size, this research
analyzes regional variables. In this research the unit of analysis is the county.
CONCEPTUAL MODELS
Conceptual Model of Decentralization of Consumer Oriented Services
The changes in decentralization of consumer oriented services in the core
counties can be seen as a function of economic structural changes, inertia of the
existing spatial pattern, racial composition, the level of service demand and
regional location. Stated as a conceptual model:
LCC = F (MPC, CE, INER, MB, PI, REG)

w~re: ~
LCC =change in decentralization of consumer oriented services in a core
county;
MPC = change in a core cou"nty's metropolitan population;
CE =change in consumer oriented service employment;
INER =inertia of the existing decentralization of consumer oriented
services;
MB = change in a core county's metropolitan black population;
PI = change in real per capita income;
REG = regional dummy.
The decentralization of consumer oriented services is attributable to the
accessibility to consumer clients and to employee residences (Mills, 1988;
Daniels, 1985; Stanback, 1979), and, therefore, is directly linked with the
decentralization of both consumers and employees. Thus, changes in the
decentralization of consumer oriented services will depend on metropolitan
population changes (MPC) and county employment changes (CE) which
represent structural changes.
Firms seek cost-effective relocation by comparison between their
relocation costs and relocation benefits (Pye, 1977); the geographical inertia of
the firms implies relocation costs. Thus, the changes in the decentralization of
consumer oriented services will depend on the inertia (lNER) of the existing
decentralization of consumer oriented services, which reflects the geographical
inertia of the consumer oriented service firms.
Consumer service location models are largely based on demand
considerations such as access to market, traffic flows, and the level of service
demand (Dudey, 1990; Stahl, 1987; Greene, 1980; White, 1975). Thus, the

56changes in metropolitan decentralization of consumer oriented services will
depend on changes in metropolitan black population (MB) and in per capita
income (PI).
The Sunbelt (South and West) cities do not face a tough structural change
from a manufacturing oriented economy to a service oriented economy. Thus,
they experience faster service growth than the older Northeastern cities (Noyelle
and Stanback, 1984). The county sizes also tend to become larger from Eastern
region towards Western region, hence the Western region is likely to experience
less decentralization of services than the Eastern region. Therefore, the changes
in decentralization of consumer oriented service firms will depend on the
regional location (REG) of the firms.
Conceptual Model of Decentralization of Business Oriented Services
The changes in decentralization of business oriented services can be seen
as a function of economic structural changes, inertia of the existing spatial
pattern, communications activity, decentralization of manufacturing, corporate
influence, racial composition, the level of service demand and regional location.
Stated as a conceptual model:
LCB = F (MPC, BE, INER, MAN, COM, HQ, CS, MB, PI, REG)
where:
LCB =change in decentralization of business oriented services in a
core county;
MPC = change in metropolitan population;
BE =change in business oriented service employment;
INER = inertia of the existing decentralization of business oriented
services;
MAN =change in decentralization of manufacturing;

COM =change in employment in communications;
HQ = corporate headquarters dummy;
CS = corporate sales;
MB = change in metropolitaon black population;
PI = change in real per capita income;
REG =regional dummy.
57
The accessibility to better educated employees in the suburbs has
encouraged relocation of office-based business service firms from central cities
(Cervero, 1986; Daniels, 1985). Thus, changes in the decentralization of business
oriented services will depend on metropolitan population changes (MPC) and
county employment changes (BE), which represent structural changes.
The stable pattern of centralization of business services in the large urban
centers reflects the geographical inertia of business service firms (Pred, 1977,
1974); the inertia of the existing decentralization of business oriented services
reflects the geographical inertia of business oriented service firms. Given the
locational effects of the inertia, the changes in metropolitan decentralization of
business oriented services will depend on the inertia (INER) of the existing
decentralization of business oriented services.
Since information is a major input and output for business service firms,
communications benefits are important locational factors (Price and Blair, 1989;
Noyelle and Stanback, 1984; Daniels, 1979). Thus, changes in the
decentralization of business oriented services will depend on changes in
communications activity (COM). Business service firms provide inputs required
in the production process of manufacturing firms (Daniels, 1984; Marshall,
1982); the link between business services and manufacturing appears to explain
the locations of both business services and manufacturing in central cities (Mills,

58
1988). Thus, changes in metropolitan decentralization of business oriented
services will depend on changes in decentralization of manufacturing activity
(MAN).
Business service locations are tied to corporate headquarter locations
since business service firms provide inputs for headquarter activity (Gillespie
and Green, 1987; Wheeler, 1986; Noyelle and Stanback, 1984). Corporate
headquarters with high-level decision-making functions significantly influence
these locations through contm: of senice purchases (Gillespie and Green, 1987;
Daniels, 1983, 1979). Thus, the changes in the metropolitan decentralization of
business oriented services will depend on headquarter locations (HQ) and
corporate sales (CS) which represent corporate influence.
It is hypothesized that the relocation of firms from central cities is partly
attributable to racial factors (Mills, 1988). Thus, changes in metropolitan
decentralization of business oriented service firms will depend on changes in
metropolitan black populations (MB). The decentralization of service activity is
also tied to the decentralization of residents, especially, the middle and upper
income groups (Mills, 1988; Stanback, 1979). It is hypothesized that changes in
decentralization of business oriented services will depend on changes in per
capita income (PI).
The older Northeastern cities with manufacturing heritage are expected to
show slower service growth than Sunbelt cities (Noyelle and Stanback, 1984).
County sizes in the Western region also tend to be larger than those of Eastern
region, implying the locational effects of geographical size. Therefore, changes
in decentralization of business oriented service firms will be likely depend on the
regional location (REG) of the firms.

59
OPERATIONAL MODELS
Operational Models of Decentrali~ationof Consumer Oriented Services
The models of decentralization of consumer oriented services take the
following linear form:
LCCit =a+bMPCjt*+cCEit+dINERit**+eMBit*+fPIit+gREGi
where:
LCCjt =change in the location coefficient of consumer oriented services in a
core county i and time t;
MPCit* = change in metropolitan population;
CEit =change in consumer oriented service employment;
INERit** =inertia of the existing decentralization: the LCCjt**;
MBit* = change in metropolitan black population;
PIit =change in real per capita income (per capita income expressed in constant
1989 values by using the Consumer Price Index);
REGi =regional dummies: one if core county is in Northeast, West, South,
Midwest region, otherwise zero;
t = time (1969-79,1979-89,1969-89);
t* = time (1970-80, 1980-90, 1970-90);
t** = time (1959-69, 1969-79,1959-79);
a = intercept;
b - g =the slope coefficient.
Operational Models of Decentralization of Business Oriented Services
The models of decentralization of business oriented services take the
following linear form:

60
LCBit =a+bMPCit*+cBEit+dINERit**+eMANit+fCOMit+gHQi+hCSi+iMBit*
+jPIit+kREGi
where:
LCBit =change in the location coefficient of business oriented services in a core
county i and time t;
MPCit* = change in metropolitan population;
BEit = change in business oriented service employment;
INERit** =inertia of the existing decentralization: the LCBit**;
MANit =change in the location coefficient of manufacturing (SIC 2000-3999):
the LC(manufacturing)it;
COMit =change in employment of communications (SIC 4800);
HQi = corporate headquarters dummy: one for core county's metropolitan area
with 'Fortune' 500 corporate headquarter, otherwise zero in each 1969
and 1979;
CSi = corporate sales (in million dollars): the sales for 'Fortune' 500 industrial
corporations in core county's metropolitan area in each 1969 and 1979;
MBit* =change in metropolitan black population;
PIit = change in real per capita income (per capita income expressed in constant
1989 values by using the Consumer Price Index);
REGi =regional dummies: one if core county is in Northeast, West, South,
Midwest region, otherwise zero;
t = time (1969-79, 1979-89, 1969-89);
t* = time (1970-80, 1980-90, 1970-90);
t** = time (1959-69, 1969-79, 1959-79);
a = intercept;
b - k = the slope coefficient.

61
Expected Signs of Variables
The expected coefficient signs of the explanatory variables are presented
in Table 4.1. The accessibility to clients in the suburbs given the population
decentralization has encouraged relocation of consumer service firms from
central cities (Daniels, 1985; Stanback, 1979); The faster the population growth,
the more the consumer oriented services are likely to decentralize. Thus, the
change in the location coefficients of consumer oriented services is hypothesized
to be inversely related to the changes in metropolitan populations (POPUC), as
indicated by the minus sign (Table 4.1).
TABLE 4.1
AN EXPECTED SIGN OF THE VARIABLESASSOCIATED WITH THE CHANGE IN DECENTRALIZATION
OF CONSUMER ORIENTED AND BUSINESS ORIENTED SERVICES
Coef. of Hypothesized Sign with Dependent VariableChange in Change inDecentr. of Decentr. of
Variable Symbol Con. O. Servo Bus. O. Servo
Metro Population POPUCChange
Inertia of the Existing INERTIADecentralization
Change in Employment COSEMPCof Cons. O. Servo
Change in Employment BUSEMPCof Bus. O. Servo
+
+

TABLE 4.1(continued)
AN EXPECTED SIGN OF THE VARIABLESASSOCIATED WITH THE CHANGE IN DECENTRALIZATION
OF CONSUMER ORIENTED"AND BUSINESS ORIENTED SERVICES
62
Change in Decentr.of Manufacturing
MANUFC
Change in Employment COMEMPCof Communications
+
CorporateHeadquarter
CorporateSales
Metro BlackChange
Per Capita IncomeChange
Northeast
Midwest
West
HQUARTER
CPSALES
BLACKC
PERINCC
NORTHEAST
MIDWEST
WEST +
+
+
+
The relocation of business oriented service firms from central cities is
attributable to accessibility to employee residences in the suburbs (Cervero,
1986; Daniels, 1985). The faster the residential growth, the more likely the firms
relocate to the suburbs. Thus, it is hypothesized that the change in the location
coefficients of business oriented services is inversely related to the changes in
metropolitan populations (POPUC).
63
The locations of service firms are tied to the firms' geographical inertia,
which implies their relocation costs (Pred, 1977, 1974). It is hypothesized that
the change in the location coefficients of consumer oriented services is inversely
related to the inertia (INERTIA) of the existing decentralization of the services,
as indicated by the minus sign (Table 4.1). Likewise, the change in the location
coefficients of business oriented services is hypothesized to be inversely related
to the inertia (INERTIA) of the existing decentralization of the services.
Service activity is subject to external economies of scale as average
production costs decrease and as the spatial clustering of the linked service firms
increases (Price and Blair, 1989; Stanback et aI., 1981; Meyer, 1980). The faster
the service employment growth, the more external economies of scale increase.
It is hypothesized that the change in the location coefficients of consumer
oriented services is positively related to the change in employment of consumer
oriented services (COSEMPC). Likewise, the change in the location coefficients
of business oriented services is hypothesized to be positively related to the
change in employment of business oriented services (BUSEMPC), as indicated
by the plus sign (Table 4.1).
The locations of business services seem to be tied to the locations of
manufacturing activity, partly, due to their linkages (Mills, 1988; Daniels, 1984;
Marshall, 1982); the faster the growth of manufacturing activity, the activity
given the trend of manufacturing decentralization (Stanback et aI., 1981) is more
likely to decentralize. Thus, it is hypothesized that the change in the location
coefficients of business oriented services is inversely related to the change in
decentralization of manufacturing activity (MANUFC).
Communication costs are a major locational factor of business service
firms (Stanback, 1979; Goddard and Pye, 1977; Goddard and Morris, 1976).
The faster the growth of communications activity, the more likely the
64communication economies of scale increases, hence lowering communication
costs (Pred, 1974). Thus, the change in the location coefficients of business
oriented services is hypothesized to be positively related to changes in
communications activity (COMEMPC), as indicated by the plus sign (Table 4.1).
Due to business links, the locations of business services are closely tied to
the locations of corporate headquarters (Gillespie and Green, 1987; Wheeler,
1986; Noyelle and Stanback, 1984); these linkages reinforce agglomeration
benefits, such as specialized information and expertise (Stanback, 1979). The
greater the corporate demand for service inputs, the more these agglomeration
benefits increase. Therefore, the change in the location coefficients of business
oriented services is hypothesized to be positively related to headquarter locations
(HQUARTER) and to corporate sales (CPSALES), which represent corporate
demand.
The decentralization of consumer service activity that relies on access to
households is tied to the decentralization of residents (Kellerman, 1985;
Alexander and Dawson, 1979; Stanback, 1979). The concentration of black
populations in the central cities seems to either induce relocation of employers to
the suburbs or reflect the consequences of such relocation (Mills, 1988). Thus,
the change in the location coefficients of consumer oriented services is
hypothesized to be inversely related to the change in black population
(BLACKC), as indicated by the minus sign (Table 4.1). Likewise, the change in
the location coefficients of business oriented services is hypothesized to be
inversely related to the change in black population (BLACKC).
The location of consumer services is attributable to the level of service
demand (Dudey, 1990; Stahl, 1987; Greene, 1980; White, 1975). The faster the
growth of per capita income, the greater the service activity trend of
decentralization (Stanback, 1979). Therefore, it is hypothesized that the change

65
in the location coefficients of consumer oriented services is inversely related to
per capita income (PERINCC). Likewise, the change in the location coefficients
of business oriented services is hYl?othesized to be inversely related to per capita
income (PERINCC), as indicated by the minus sign (Table 4.1).
The Manufacturingbelt cities are experiencing slow service growth, due
partly to a difficult structural transition to a service oriented economy (Noyelle
and Stanback, 1984). The fast growing economy in the Sunbelt reflects the
region's fast service growth (Hall, 1988). The faster growth of service activity is
likely to produce greater agglomeration economies, thus resulting in relatively
more centralization of service activity in the West. The geographical sizes of
counties also tend to be larger in the Western region. While plus signs are
expected on the coefficients of WEST, minus signs are expected for the
coefficients of the NORTHEAST and MIDWEST, regional variables (Table 4.1).
VARIABLE MEASUREMENT AND DATA SOURCES
For the core-peripheral classification, all U.S. metropolitan areas with
three or more component counties were included in the initial sample, giving 94
metropolitan areas and 471 counties (94 core counties and 377 peripheral
counties). The metropolitan statistical area (MSA) sample was from Rand
McNally Atlas (1992). Because of the four counties which belong to the multiple
metropolitan areas and one county with missing data, the initial sample was
reduced to 455 counties (89 core counties and 366 peripheral counties), and 89
metropolitan areas.4
4 The sample contains 69 metropolitan areas classified as MSAs, and therest classified as PMSAs (Primary Metropolitan Statistical Areas).
66Employment data provided by the 1969, 1979, and 1989 Coullty Busilless
Patterns (CBP) was used to create the data on location coefficients of business
oriented and consumer oriented services: LCCi (1969-79); LCCi (1979-89);
LCCi (1969-89); LCBi (1969-79);" LCBi (1979-89); and LCBi (1969-89)' Since
the consumer oriented and business oriented services are classified by SIC codes
as illustrated earlier, the CBP data is appropriate for this study.
The CBP data is also necessary for the computation of the employment
based location coefficients. With these reasons, the 1969, 1979, and 1989 CBP
data was used to create the manufacturing spatial pattern variable (MANUFC),
measured in terms of change in the values of location coefficients of
manufacturing for the time period of 1969-79, 1979-89 and 1969-89
(LC(manufacturing)h 1969-79, 1979-89, 1969-89)'
To reflect the business relocation cost, two variables were created, one for
INERTIA and one for communications (COMEMPC). The INERTIA variable
was created based on the 1959, 1964, 1969, and 1979 CBP. Since CBP data was
combined for several counties until its 1962 publication, data for some of the
individual counties could not be obtained, thus affecting the sample size. Hence,
the 1964 CBP data was included here to make the sample size for the LCBi
(1969-89) model to be more compatible with that of the LCBi (1979-89) model.
Like the dependent variables, the 1969, 1979, and 1989 CBP were used to create
the data for the COMEMPC, which is measured in terms of change in the
employment of communications (SIC 4800) in the core counties. The advantage
of the CBP data is that the longitudinal comparisons of communications
establishments' locational changes over time are possible.
Since Fortulle magazine has consistently published detailed data for
corporate headquarters, the Fortune 500 Directory for 1969 and 1979 was used
here to develop two corporate influence variables. The first is a corporate

67
headquarter dummy variable (HQUARTER) which equals one for metropolitan
areas with a 'Fortune 500' corporate headquarter, and zero otherwise. The
second variable (CPSALES) is 'sales (in million dollars) for 'Fortune 500'
industrial corporations located in the metropolitan area in 1969 and 1979
(Fortune, 1970, 1980).
The Consumer Price Index was used to adjust 1969 and 1979 per capita
income to 1989 values, hence creating real per capita income variable
(PERINCC), measured in terms of change in real per capita income in the core
counties for the 1969-79, 1979-89 and 1969-89 periods, reflecting level of service
demand. The data for PERINCC was extracted from the 1970 and 1980 Census
of Population, and 1990 Census of Population and Housing. To compute the
change in the metropolitan black population (BLACKC), the data was also
developed from the information provided by the 1970 Census of Population, and
1980 and 1990 Census of Population and Housing.
To create variables for economic structural change (POPUC, COSEMPC
and BUSEMPC) two sources were used. The 1970, 1980, and 1990 Census of
Population were used to calculate the change in a core county's metropolitan
population (POPUC). The data for both COSEMPC and BUSEMPC variables,
which are each measured in terms of the change in consumer oriented and
business oriented service employment, 1969-79, 1979-89 and 1969-89, were
provided by the 1969, 1979, and 1989 County Business Patterns. Finally, the
U.S. region variables were broken down into four dichotomous variables
representing the census geographic divisions: Northeast, Midwest, South, and
West.
68ANALYSIS OF DATA
Multiple-regression analysis is used to analyze the data for the variables in
the models of decentralization of consumer oriented and business oriented
services. The normality test is carried out to examine whether these models hold
the assumption of normal distribution. The test statistic (Greene, 1990: p. 135)
is:
L=n[skewness2/6 + (kurtosis-3)2/24]
where:
n: number of observations;
skewness: a measure of asymmetric distribution, i.e. E[(x-f..l)3] (E[x]=the
expected value of a random variable x, f..l=mean of a random variable);
kurtosis: a measure of the thickness of the distribution's tails, i.e. E[(x-f..l)4]
(Greene, 1990: p. 60).
These measures are calculated from the ordinary least squares analysis. If
the calculated L statistic does not exceed the critical chi-square value with two
degrees of freedom, the models satisfy the assumption of normal distribution.
To determine whether these models have problems of heteroskedasticity
(i.e., unequal variances for different observations), the Breusch-Pagan (B-P) and
White tests are conducted. These tests are appropriate when the models satisfy
the normality assumption; if the models violate normality, the Koenkar-Basset
(K-B) test is m~re reasonable (Greene, 1990). The heteroskedasticity test
procedures are as follows:
y=a + bx + e (OLS model) (eq.l-l)
(eq.I-2)
69
where:
a: intercept; b:slope coefficient; e:error.
e2=a + bx + ee (derived from the eq.l-l)
The B-P statistic is: ESS/2[(sum(e2)/N)2]
where:
ESS:explained sum of square; N: number of observations; ee: error (Greene,
1990: p. 421).
The K-B statistic is: ESSI [sum(e2-s2)2/N]
where: s2= sum(e2)/N (Greene, 1990: p. 422).
e2=a + bx + cx2 + d(cross-product among x)+ u
The White statistic is: N*R-square
where,
u: error; N: number of observations (Greene, 1990: p. 420).
(eq.I-3)
If these calculated statistics are greater than the critical chi-square values
(degrees of freedom: number of explanatory variables), heteroskedasticity is
present in the models. As a correction weighted least squares (WLS) analysis is
conducted. The weight is specified as follows:
weight= 1/ fitted bp, fitted bp= ee21 s2 (from the eq.I-2)
where: ee2 (fitted e2)=e2-ee; s2=mean(e2).

70
The WLS analysis is carried out by the GAUSS Least Squares econometric
program.5
SUMMARY
This study examines changes in decentralization of consumer oriented and
business oriented services in the core counties in U.S. metropolitan areas with
three or more component counties for the periods from 1969 to 1989. The
variables for this study are used in multiple regression analyses. Data for 455
counties (89 core counties and 366 peripheral counties) are from various sources
which consist of an Atlas, Fortune 500 Directory, and the Census publications
for various years.
The dependent variables are the changes in decentralization of consumer
oriented and business oriented services in a core county. The independent
variables consist of economic structural changes, inertia of the existing location
pattern, communications activity, location pattern of manufacturing, corporate
influence, racial composition, level of service demand, and regional location.
The results of multiple regression analyses for the period from 1969 to 1989 are
presented in the following chapter.
5 The sources: Applied Data Associates, P.O. Box 8976, Portland, OR97207; Aptech Systems, Inc., 26250 196th Place S.E., Kent, WA 98042.

CHAPTER V
RESULTS OF MULTIPLE REGRESSION ANALYSES
The models of decentralization of consumer oriented and business
oriented services were estimated separately for the two sub-periods (1969-79,
1979-89) and the total period (1969-89). The results for the sub-periods are
discussed in the first section of this chapter, and for the total period in the
second section.
There are no significant violations of regression assumptions such as
orthogonality, normality and collinearity in the model of decentralization of
business oriented services for the period of 1969-79, and in the model of
decentralization of consumer oriented services for the 1969-89 period.
Meanwhile, the Koenkar-Basset test was carried out for the model of
decentralization of consumer oriented services for the 1969-79 and 1979-89
periods, which do not satisfy the normality assumption. The test was also
conducted for the models of decentralization of business oriented services for the
periods 1979-89 and 1969-89.
The Koenkar-Basset test indicates that heteroskedasticity is not present in
the model of decentralization of consumer oriented services for the 1969-79
period, and in the models of decentralization of business oriented services for the
period of 1979-89 and model II for the period of 1969-89. But the Koenkar
Basset test indicates the presence of heteroskedasticity in the model of
decentralization of consumer oriented services for the 1979-89 period and in the
model I of decentralization of business oriented services for the 1969-89 period.
The Breusch-Pagan and White tests were conducted for the model II of
decentralization of business oriented services, 1969-79 and for the model of
72
decentralization of consumer oriented services, 1969-89. The results show the
presence of heteroskedasticity in these models. The available techniques
(weighted least squares) as discussed in Chapter IV were used to correct for the
heteroskedasticity problem. The results of weighted least squares (WLS) for
both models show much higher R2 values and greater heteroskedasticity as
compared to those of ordinary least squares (OLS), hence the results of OLS
estimations are discussed here (see Appendix D for the WLS results).
Based on the article by Hoerter and Wiseman (1988) the location
coefficients were calculated for the dependent variables. For clarification, this
location coefficient represents a measure of relative concentration or
deconcentration of jobs in core counties as compared to their metropolitan areas.
For instance, the outcome of the centralization tendency of the core county's jobs
may be a result of one of the four possible processes. That is, the jobs grow more
in the core counties than in the rest of the metropolitan area. The second one is
that jobs are growing in the core counties, but not growing in the rest of the
metropolitan area. The third one is that jobs are not declining as much in the
core counties as in the rest of the metropolitan area. The last one is that jobs are
stable in the core counties, but are declining in the rest of the metropolitan area.
The models, on the whole, explain a fair portion of the variability in
decentralization of consumer oriented and business oriented services for the sub
periods (1969-79, 1979-89) and for the total period (1969-89), as indicated by the
adjusted R2 values. They also show a low standard error of estimate. Most of
the coefficients have the expected signs, and many are statistically significant.

73
RESULTS OF SERVICE DECENTRALIZATIONMODELS, 1969-79 and 1979-89
This section discusses the results of the models of decentralization of
consumer oriented and business oriented services for the sub-periods (1969-79,
1979-89). The OLS results for these models and the test statistics are
summarized in Table 5.1. Since the 1969 CBP data for some of core counties
shows a complete centralization of consumer oriented services (i.e., COEijt
=MCOjt in the LCci), the sample size (Table 5.1) was reduced in the model of
decentralization of consumer oriented services for the period of 1969-79 from
that of the model for the period of 1979-89. The corporate sales variable in the
model I of decentralization of business oriented services for the periods of 1969-
79 and 1979-89 causes the sample sizes (Table 5.1) to drop from those of the
model II for both periods.
Structural Change Variables
The effects of the structural change variables on change in
decentralization of consumer oriented and business oriented services for the
1969-79 and 1979-89 periods are summarized in Table 5.1. The coefficients of
POPUC have the expected signs except for the consumer oriented services for
the 1969-79 period. The minus sign on the POPUC measuring metropolitan
structural change supports its hypothesized relationship with the changes in
decentralization of consumer oriented and business oriented services. In the
POPUC, the result shows much larger coefficients with a much higher
significance (at .01 percent) in the models for the 1979-89 period than for the
1969-79 period. This indicates that metropolitan population growth has a much
greater effect on the decentralization of consumer oriented and business oriented

74
services between 1979 and 1989 as compared to the preceding period, 1969-79.
The coefficients of POPUC are -4.7920 for the consumer oriented services for the
1979-89 period, and -0.2283 for the business oriented services for the 1969-79
period and -4.7409 for the 1979-89 period. Thus 1 percent increase in the core
county's metropolitan population decreases the location coefficient value of
consumer oriented services by 4.7920 percent, and the value of business oriented
services by 0.2283 percent and by 4.7409 percent.
In comparison, the differences in coefficients on POPUC lead to different
conclusions about the probable effects of faster growth of metro~'}olitan
populations that increase decentralization of business oriented services. The
coefficient of POPUC in the model of decentralization of business oriented
services for the 1969-79 period implies that the business oriented services slightly
decentralize if metropolitan populations increase 1 percent. The POPUC
variable in the models of decentralization of consumer oriented and business
oriented services for the period of 1979-1989 indicates that the changes in
decentralization of consumer oriented and business oriented services in the core
counties are very responsive to the rates of growth of their metropolitan
populations.
The COSEMPC and BUSEMPC variables, which represent a core
county's structural change, are significant in all models and have the expected
signs. The small positive coefficients on COSEMPC for the period of 1969-79
and on BUSEMPC for the 1969-79 and 1979-89 periods imply that the service
employment growth causes consumer oriented and business oriented services to
centralize slightly. But, it results in greater centralization of consumer oriented
services for the 1979-89 period.

75TABLE 5.1
OLS RESULTS USING THE CHANGES OF DECENTRALIZATION OFCONSUMER ORIENTED AND BUSIENSS ORIENTED SERVICES
OF THE CORE COUNTIES, 1969-79 AND 1979-89
Con.O. Con.O. Bus.O. Bus.O. Bus.O. Bus.O.Variable Servo Servo Servo I Serv.I Servo II Servo II
1969-79 1979-89 1969-79 1979-89 1969-79 1979-89
constant -0.0579** -0.0400** -0.1083* -0.0813** -0.0885* -0.0441*(-2.2945) (-2.4456) (-1.8335) (-2.4910) (-1.3444) (-1.3203)
popuc -0.2283* -0.1002(-1.5107) (-0.7520)
popuc» 0.9862 -4.7920*** -1.8730 -4.7409**(1.0636) (-3.7173) (-0.5972) (-2.1469)
cosempc 0.0502*(1.1674)
cosempc» 4.8696***(12.080)
busempc 0.1057** 0.1133*** 0.0867** 0.0917***(2.6741) (3.4100) (2.3038) (2.9732)
inertia 0.2328* -0.1437* -0.7789*** -0.1376* -0.6496*** -0.1677*(1.5360) (-1.1942) (-3.9523) (-1.2913) (-3.8086) (-1.6101)
comempc 0.0214 0.0705*(0.5047) (1.8042)
manufe -0.5835*** -0.6599*** -0.1683 -0.0786(-2.7998) (-3.9557) (-0.9314) (-0.7968)
perincc» 0.1495 -3.5833*** -0.4659 0.1563 -3.4880* -0.0972(0.1248) (-3.6814) (-0.1604) (0.0966) (-1.4431) (-0.0643)
blackc 0.0385 0.0204(0.5753) (0.3466)
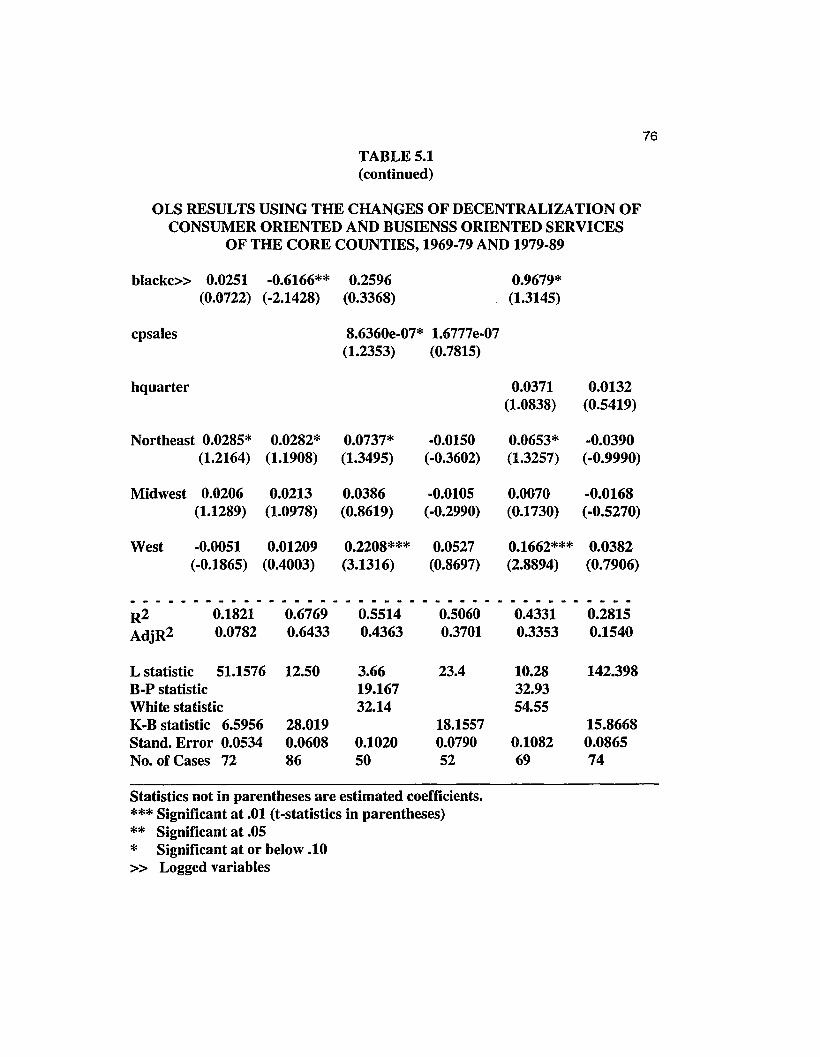
76
TABLE 5.1(continued)
OLS RESULTS USING THE CHANGES OF DECENTRALIZATION OFCONSUMER ORIENTED AND BUSIENSS ORIENTED SERVICES
OF THE CORE COUNTIES, 1969-79 AND 1979-89
blackc» 0.0251 -0.6166** 0.2596 0.9679*(0.0722) (-2.1428) (0.3368) (1.3145)
cpsales 8.6360e-07* 1.6777e-07(1.2353) (0.7815)
hquarter 0.0371 0.0132(1.0838) (0.5419)
Northeast 0.0285* 0.0282* 0.0737* -0.0150 0.0653* -0.0390(1.2164) (1.1908) (1.3495) (-0.3602) (1.3257) (-0.9990)
Midwest 0.0206 0.0213 0.0386 -0.0105 0.0070 -0.0168(1.1289) (1.0978) (0.8619) (-0.2990) (0.1730) (-0.5270)
West -0.0051 0.01209 0.2208*** 0.0527 0.1662*** 0.0382(-0.1865) (0.4003) (3.1316) (0.8697) (2.8894) (0.7906)
- - - - - - - - . -- - - - - - - - - - . - - - . . - . . . - - - . - - - - . -R2 0.1821 0.6769 0.5514 0.5060 0.4331 0.2815AdjR2 0.0782 0.6433 0.4363 0.3701 0.3353 0.1540
L statistic 51.1576 12.50 3.66 23.4 10.28 142.398B-P statistic 19.167 32.93White statistic 32.14 54.55K-B statistic 6.5956 28.019 18.1557 15.8668Stand. Error 0.0534 0.0608 0.1020 0.0790 0.1082 0.0865No. of Cases 72 86 50 52 69 74
Statistics not in parentheses are estimated coefficients.*** Significant at .01 (t-statistics in parentheses)** Significant at .05* Significant at or below .10» Logged variables
77
Relocation Cost Variables
The coefficients of INERTIA have the expected signs except for consumer
oriented services for the 1969-79 ~eriod, and are significant in all models. The
result shows larger coefficients with a much higher significance in the models of
business oriented services than in the models for consumer oriented services.
The results of the INERTIA variable which reflects the geographical inertia of
the services may be due to the greater effects of business relocation cost on the
changes of decentralization of business oriented services than on those of
consumer oriented services. This supports the findings that the geographical
inertia of the services which implies service relocation costs influences the
locations of services (Pred, 1977, 1974).
The significant coefficients on INERTIA for the time periods of 1969-79
and 1979-89 support the hypotheses that changes in the location coefficients of
consumer oriented and business oriented services are inversely related to the
inertia of the existing decentralization of consumer oriented and business
oriented services. The significant effect of the existing decentralization trend has
implications on service decentralization policy. The less restrictive policy that
encourages going against decentralization trend might encourage more
decentralization of urban services given the significance of the existing
decentralization trend.
The coefficient of COMEMPC for the 1979-89 period indicates that the
location coefficient value of business oriented services will increase by 0.0705
percent if the core county's communications employment increases by 1 percent.
The coefficient on COMEMPC, a proxy for communications activity supports
the hypothesis that change in the location coefficients of business oriented
services is positively related to changes in communications activity.

78The growth of communications activity causes the communication
economies of scale to increase, and thus leads to lowering communication costs, a
major locational factor for business services (Stanback, 1979; Goddard and Pye,
1977; Goddard and Morris, 1976). Thus, communications investment policy in
the core counties might promote communications industry, hence influencing
their business oriented services to locate there.
Manufacturing Decentralization Variable
The MANUFC variable in the models of business oriented services for the
time periods of 1969-79 and 1979-89 indicates the significant effect of
decentralization of manufacturing activity on decentralization of business
oriented services. The significant coefficients on MANUFC support the
hypothesis that change in the location coefficients of business oriented services is
inversely related to change in decentralization of manufacturing activity.
The effect of manufacturing decentralization may be due to the business
linkages between business services and manufacturing activity (Daniels, 1984;
Marshall, 1982). The results of the MANUFC variable support Mills' (1988)
speculations about the locational effects of related activities. The findings on
MANUFC imply that the core counties with a greater decentralization of
manufacturing activity are also likely to experience a greater decentralization of
their business oriented services.
Service Demand Variable
The coefficients of PERINCC are -3.5833 for consumer oriented services
for the 1979-89 period, and -3.4880 for business oriented services for the 1969-79
period. Thus 1 percent increase in the core county's real per capita income
decreases the location coefficient value of consumer oriented services by 3.5833

79percent, and the value of business oriented services by 3.4880 percent. This
indicates that the growth of real per capita income results in greater
decentralization of consumer oriented and business oriented services. The
results support the hypotheses that changes in the location coefficients of
consumer oriented and business oriented services are inversely related to
changes in real per capita income.
The significant coefficients on PERINCC, a proxy for the level of service
demand imply that relocations of consumer oriented and business oriented
services are very responsive to relocation of higher income population. Hence,
the greater decentralization of middle and high income residents (Stanback,
1979) will cause the more urban services to relocate from the core counties.
Therefore, the counties with a large proportion of low income residents are in
greater disadvantage to keep or attract urban service activity.
Racial Composition Variable
The coefficients of BLACKC in the models show the effects of black
populations on changes in decentralization of each consumer oriented and
business oriented services. The coefficients are -0.6166 for consumer oriented
services for the 1979-89 period, and 0.9679 for business oriented services for the
1969-79 period. This indicates that 1 percent increase in the metropolitan black
populations decreases the location coefficient value of consumer oriented
services by 0.6166 percent, and increases the value of business oriented services
by 0.9679 percent. The minus sign on the BLACKC supports its hypothesized
relationship with the change in decentralization of consumer oriented services.
The findings on BLACKC variable in the model of consumer oriented
services imply that core counties with a faster growth of their metropolitan black
populations are likely to experience a greater decentralization among these black

80
populations, causing further dispersal in the consumer oriented services. Also,
the BLACKC variable, a proxy for racial tension, would indicate that consumer
oriented services are relocating from core counties to avoid racial tension.
The positive coefficient of BLACKC in the model of business oriented
services implies that growth of metropolitan black populations does not induce
business oriented services to move away from the core counties. Perhaps
business service firms take greater considerations of other locational needs, such
as specialized information and linkages with other firms in urban centers
(Daniels, 1985; Marshall, 1985).
Corporate Influence Variables
The CPSALES variable in the model of business oriented services between
1969 and 1979 indicates that a core county with a higher initial level of corporate
sales is likely to experience slightly more centralization of business oriented
services. The positive coefficient on CPSALES supports the hypothesis that
change in the location coefficients of business oriented services is positively
related to corporate sales. The findings on CPSALES variable, which represents
corporate demand, suggest that the larger corporate demand causes more
centralization of business oriented services.
The corporate headquarter variables, HQUARTER have the expected
positive signs, thus supporting the hypothesized positive relationship between
the headquarter locations and the change in the location coefficients of business
oriented services. But, the influence of the presence of corporate headquarters
on the centralization of business oriented services appears weak, as indicated by
the insignificant coefficients on HQUARTER. Although others report the close
locational linkage between business services and corporate headquarters
81
(Gillespie and Green, 1987; Wheeler, 1986), the results here show that corporate
influence is better represented by sales than by the presence of headquarters.
Regional Location Variables
The coefficients of the regional variables representing the Northeast and
Midwest have the expected signs in the models of business oriented services for
the period of 1979-89, but are insignificant. Meanwhile, the coefficients of
Northeast are positive and significant in the models of consumer oriented
services for the periods of 1969-79 and 1979-89 and in the models for business
oriented services for the 1969-79 period. These coefficients indicate that core
counties in the Northeast are likely to experience slightly greater centralization
of consumer oriented and business oriented services than those in the South.
The coefficients for MIDWEST are very similar to those of
NORTHEAST, but lack statistical significance. The coefficients of WEST have
the expected signs, except for the consumer oriented services for the period of
1969-79. The positive and significant coefficients of WEST in the models of
business oriented services for the 1969-79 period indicate that the centralization
of business oriented services would be relatively greater in the core counties in
the West than those in the South. The results support the hypothesis that the
core counties in the West are likely to experience relatively more centralization
of business oriented services than those in the South.
The effects of the regional dummies, classical control variables, suggest
that a core county's prospect of urban service growth is associated with its
region. For example, the core counties in the West are in relatively greater
advantage to keep their service activities as compared to those in the South.
82
RESULTS OF SERVICE DECENTRALIZATIONMODELS, 1969-89
This section discusses the results of the models of decentralization of
consumer oriented and business oriented services for the total period (1969-89).
The results of the OLS analysis and the test statistics are presented in Table 5.2.
Structural Change Variables
The coefficients of POPUC variable in the models of consumer oriented
and business oriented services for the period of 1969-89 have the expected signs.
The coefficients of POPUC are -1.1371 for consumer oriented services, and
1.5314 for business oriented services. Thus a 1 percent increase in a
metropolitan population decreases the location coefficient value of consumer
oriented services by 1.1371 percent, and the value of business oriented services
by 1.5314 percent. This indicates that the changes in decentralization of
consumer oriented and business oriented services in the core counties are very
responsive to the rates of growth of their metropolitan populations. The findings
of POPUC variable support the hypotheses that changes in the location
coefficients of consumer oriented and business oriented services are inversely
related to changes in metropolitan populations.
The coefficient of COSEMPC for the 1969-89 period indicates that the
location coefficient value of consumer oriented services will increase by 0.0457
percent if the core county's consumer oriented service employment increases by
1 percent. The small, but significant coefficients on the BUSEMPC variables for
the period of 1969-89 suggest that the business oriented services slightly
centralize if the business oriented service employment increases 1 percent. The

83TABLE 5.2
OLS RESULTS USING THE CHANGES OF DECENTRALIZATION OFCONSUMER ORIENTED AND BUSIENSS ORIENTED
SERVICES OF THE CORE COUNTIES, 1969-89
Con.O. Bus.O. Bus.O.Variable Servo Serv.I Servo II
1969-89 1969-89 1969-89
constant 0.0278 -0.0097 -0.0032(0.7299) (-0.1379) (-0.0522)
popue» -1.1371* -1.5044 -1.5314*(-1.2292) (-1.0528) (-1.3846)
cosempc 0.0457*(1.4581)
busempc 0.0473*** 0.0390***(4.1163) (3.7387)
inertia 0.6935*** 0.6719*** 0.7029***(6.3785) (4.6335) (5.7157)
manufe -0.0706 0.0165(-0.4643) (0.1209)
perinee -0.3135* -0.2891**(-1.7927) (-2.1483)
perinee» -1.5563*(-1.2311)
blaeke -0.0228* 0.0322 0.0161(-1.3463) (1.0702) (0.6135)
epsales 4.0953e-07(0.6229)
hquarter 0.0159(0.5344)

TABLE 5.2(continued)
84
OLS RESULTS USING THE CHANGES OF DECENTRALIZATION OFCONSUMER ORIENTED AND BUSIENSS ORIENTED
SERVICES OF THE CORE COUNTIES, 1969-89
Northeast
Midwest
West
0.0131 -0.0459 -0.0391(0.4941) (-0.8680) (-0.9022)
0.0119 -0.0229 -0.0151(0.4401) (-0.4554) (-0.3846)
-0.0273 0.1982*** 0.1107**(-0.7920) (2.8591) (2.0839)
- - . - - - - . - - - - - - . - - - - - - - . - - - - - - - - - - -- - -- - -R2 0.5159 0.6555 0.5938AdjR2 0.4544 0.5671 0.5238
L statistic 7.36 19.896 127.27B-P statistic 41.17White statistic 38.59K-B statistic 30.344 20.003Stand. Error 0.065 0.099 0.097No. of Cases 72 50 69
Statistics not in parentheses are estimated coefficients.*** Significant at .01 (t-statistics in parentheses)** Significant at .05* Significant at or below .10» Logged variables
plus signs on these variables support their hypothesized relationships with the
changes in centralization of consumer oriented and business oriented services.
Relocation Cost Variables
The positive and significant coefficients of INERTIA in all models indicate
that the inertia of the existing locational patterns of consumer oriented and
85
business oriented services exerts a greater influence on the trend of
centralization of consumer oriented and business oriented services over a longer
time span.
The findings on the INERTIA imply that business relocation costs are a
major factor encouraging centralization of consumer oriented and business
oriented services over a longer time span. The effects of business relocation costs
have implications for service decentralization policy. Service activities are likely
to be reinforced in the service developed counties; the investment programs to
promote service infrastructure in the peripheral areas might induce service
activities to locate there.
Manufacturing Decentralization Variable
The minus sign on MANUFC in the model I of business oriented services
for the period of 1969-89 supports the hypothesized negative relationship
between the change in decentralization of manufacturing activity and the change
in the location coefficients of business oriented services. The influence of
decentralization of manufacturing activity on decentralization of business
oriented services, however, appears weak as indicated by the insignificant
coefficient on MANUFC. It may be that business oriented services become
significantly influenced by other major locational forces such as relocation costs
(e.g., costs of information and expertise) (Pye, 1977; Goddard and Pye, 1977;
Manners, 1974). This might result in a decline of the locational effects of
business linkages between business services and manufacturing activity (Daniels,
1984; Marshall, 1982) over a longer time span.
86Service Demand Variable
In the PERINCC, the result shows much larger coefficient in the model of
consumer oriented services for the period of 1969-89 than in the models of
business oriented services for the 1969-89 period. The coefficients of PERINCC
are -1.5563 in the model of consumer oriented services, and -0.3135 in the model
I and -0.2891 in the model II of business oriented services. Thus 1 percent
increase in the core county's real per capita income decreases the location
coefficient value of consumer oriented services by 1.5563 percent, and the value
of business oriented services by 0.3135 and 0.2891 percent. The findings on the
PERINCC variable support the hypotheses that changes in the location
coefficients of consumer oriented and business oriented services are inversely
related to changes in the real per capita income.
In comparison, the differences in coefficients on PERINCC lead to
different conclusions about the probable effects of growth of per capita income
and decentralization of business oriented services. The coefficients of PERINCC
in the models of decentralization of business oriented services indicate that
growth of per capita income causes a small increase in decentralization of
business oriented services. The results of PERINCC, a proxy for the level of
service demand demonstrate that the level of service demand exerts a much
stronger influence on the decentralization of consumer oriented services than on
business oriented services. This seems to support the consumer service location
models which are overwhelmingly consumer demand based (Dudey, 1990; Stahl,
1987; Greene, 1980; White, 1975). Meanwhile, the significant effects of service
demand imply that the relocation of urban services, especially, consumer
oriented services relying, particularly, on linkages with households (Noyelle and
Stanback, 1984) are very responsive to relocation of higher income populations.
Consequently, relatively low income counties would face greater difficulty in

87maintaining urban service activities, and will, therefore, experience more
decentralization of their service activities, particularly, consumer related
services.
Racial Composition Variable
The coefficient of BLACKC for the 1969-89 period indicates that the
location coefficient value of consumer oriented services will decrease by 0.0228
percent if the core county's metropolitan black population increases by 1
percent. The negative coefficient on BLACKC supports the hypothesis that
changes in the location coefficients of consumer oriented services are inversely
related to changes in the black population. The coefficient of BLACKC in the
model of decentralization of consumer oriented services for the period of 1969-89
implies that the consumer oriented services slightly decentralize if the black
population increases 1 percent.
It may be that the faster growth of black populations causes the black
populations to decentralize. That obviously leads to more dispersal in the
consumer oriented services. The effects of black population growth on changes
in decentralization of consumer oriented services could be also caused by these
services giving consideration to racial tension when relocating from the core
counties. This is consistent with the findings of Mills (1988) about the racial
effects on job relocations.
Corporate Influence Variables
The coefficients of the corporate influence (CPSALES, HQUARTER)
variables have the expected signs. The plus sign on CPSALES supports the
hypothesized positive relationships between the corporate sales and the change
in the location coefficients of business oriented services. The effects of corporate

88sales on the changes in centralization of business oriented services appear weak,
as indicated by the insignificant coefficient on CPSALES. Business oriented
services may give greater locational considerations on other advantages such as
business linkages with specialized service activities (Muller, 1981; Stanback,
1979), thus having a greater locational need for the access to the urban centers
(Daniels, 1985).
A plus sign accompanies the coefficient for the headquarter dummy,
HQUARTER, thus supporting the hypothesized positive relationships between
the headquarter locations and the change in the location coefficients of business
oriented services. The HQUARTER lacks statistical significance, and therefore
the locational influence of the presence of corporate headquarters on the
changes in centralization of business oriented services appears weak. It may be
that locations of business oriented service firms relying on information, the
major input and output are more affected by other needs such as maintenance of
contacts with other related firms (Stanback, 1979; Goddard and Pye, 1977;
Goddard and Morris, 1976). This might lead to a decline of the effects of the
locational linkage between business oriented services and corporate
headquarters (Gillespie and Green, 1987; Wheeler, 1986) over a longer time
span.
Re.:ional Location Variables
The coefficients of the regional location variables, NORTHEAST and
MIDWEST have the expected minus signs except for the consumer oriented
services for the period of 1969-89, but lack statistical significance. In the WEST,
the result shows slightly larger coefficient with a higher significance in the model
I of decentralization of business oriented services for the 1969-89 period than in
the model II for the 1969-89 period. The positive and significant coefficients on

89
WEST indicate that the centralization of business oriented services would be
relatively greater in the core counties in the West than those in the South. This
is consistent with Hall's (1988) finding that the West exhibits strong
performance of information services due to its high population growth.
ANALYTICAL IMPLICATIONS AND LIMITATION OF DATA
Since the U.S. Census Bureau reports detailed employment data by SIC
(Standard Industrial Classification) and by county, the location pattern
variables in this study could not be measured at local level. Despite the County
Business Patterns' detailed information on employment of establishments, the
employment data is not specified by levels of skills. Hence, a more detailed
measure of the location pattern variables was not obtained. Considering
business oriented service firms which are highly dependent on high skilled
employment, the changes in location patterns of business oriented service firms
in the core counties are expected to be sensitive to the rates of growth of their
high skilled employment in service industries. Due to the limitation of such a
more detailed measure, this could not be analyzed in this research.
The data for the corporate influence variables was obtained from the
Fortune 500 Directory. The measures for these variables are, therefore, based
on Fortune 500 corporations instead of all corporations in the metropolitan
areas. Despite the limitation of corporate data, the corporate influence measures
used in this study were proved to be adequate to reflect the conceptual effects.
In spite of the shortcomings as discussed here, it is apparent that the
measures used for the location pattern variables are useful in analyzing the
changes in location patterns of consumer oriented and business oriented service
firms.

SUMMARY 90
The regression analysis of metropolitan structural changes by time
periods indicates different spatial"implications: metropolitan population growth
results in greater decentralization of consumer oriented and business oriented
services for the 1979-89 period than for the preceding period, 1969-79. The
analysis for the total period (1969-89) shows that decentralization of consumer
oriented and business oriented services is responsive to the rate of growth of
metropolitan population. The analysis of employment change implies that
service employment growth causes a much greater centralization of consumer
oriented services for the 1979-89 period than for the 1969-79 period, and causes
business oriented services to centralize slightly. The analysis for the 1969-89
period shows that the service employment growth results in slightly greater
centralization of consumer oriented and business oriented services.
The analysis of inertia effects for the 1969-79 and 1979-89 periods
indicates stronger effects of inertia on the decentralization of business oriented
services than on consumer oriented services. The inertia results for the 1969-89
period imply that business relocation costs are a major factor encouraging
centralization of consumer oriented and business oriented services over a longer
time span. Analysis of communications activity indicates a close correspondence
between the growth of communications activity and the changes in the
centralization of business oriented services.
Regression analysis for the 1969-79 and 1979-89 time periods indicates
that decentralization of manufacturing activity has a significant effect on
decentralization of business oriented services. The analysis for the 1969-89
period implies that linkages between business oriented services and
manufacturing activity decline over a longer time span.

91The analysis of service demand for the 1969-79 and 1979-89 periods shows
that decentralization of consumer oriented and business oriented services in the
core counties was very responsive to the growth of real per capita income. The
service demand results for the 1969-89 period demonstrate that the level of
service demand exerts a much stronger influence on the decentralization of
consumer oriented services than on business oriented services.
The analysis of the effects of black population growth for the two sub
periods (1969-79 and 1979-89) by consumer oriented and business oriented
services indicates that metropolitan black populations are significant factors
encouraging decentralization of consumer oriented services, but affecting the
changes in centralization of business oriented services in the core counties. The
analysis for the 1969-89 period shows that decentralization of consumer oriented
services in the core counties was responsive to the growth of their metropolitan
black populations.
The analysis of the corporate demand effects implies that the level of
corporate demand is an important factor encouraging more centralization of
business oriented services. The results of corporate influences support their
expected relationships with changes in centralization of business oriented
services, but the corporate influences (corporate demand and presence of
corporate headquarters) appear weak for the 1969-89 period.
The significant effects of the Northeast for the two sub-periods (1969-79
and 1979-89) indicate that the centralization of consumer oriented and business
oriented services would be relatively greater in the core counties in the Northeast
than those in the South. The results also demonstrate that the core counties in
the West experienced relatively greater centralization of business oriented
services than those in the South. Finally, analysis of regional effects for the
1969-89 period shows that the performance of the West stands out. The West

92
exhibited greater centralization of business oriented services compared to the
other regions.
CHAPTER VI
SUMMARY AND CONCLUSIONS
SUMMARY
This research has analyzed the dynamics of locational structure of services
in U.S. metropolitan areas from 1969 to 1989. Models for decentralization of
consumer oriented and business oriented services provide insights about the
determinants of service sector decentralization.
The spatial tendency of consumer oriented services in the relatively larger
urban service centers appears to be opposite to that in the small and relatively
underdeveloped service areas. This analysis indicates a tendency for greater
centralization of consumer oriented services in small and relatively under
developed service areas. Decentralization of consumer oriented services is
greater in the relatively larger urban service centers.
The analysis also provides evidence to demonstrate a spatial shifting of
consumer oriented services roughly opposite to that of business oriented services.
The top ranked business centers tend to exhibit a tendency toward greater
centralization. There is a countervailing tendency toward decentralization of
business oriented services in small and relatively underdeveloped service areas.
The descriptive analysis of changes in the location coefficients over time
suggests that the greatest decentralization of consumer oriented services took
place in the large metropolitan group. The analysis for business oriented
services suggests that the greatest decentralization took place in the small
metropolitan group.

94According to the regional analysis, there is no clear tendency of business
oriented services for the 1969-79 and 1979-89 periods. The tendency for
decentralization of business oriented services, however, appears to be strong for
the 1969-89 period, especially for the Manufacturingbelt and South.
The regression results for consumer and business services show that most
variables have the expected signs, and many are statistically significant. The
comparison of structural changes for the 1969-79 and 1979-89 periods indicates
that metropolitan population changes exert a much stronger influence on
decentralization of consumer and business services for the 1979-89 period than
for the preceding period, 1969-79; and that service employment changes exert a
much stronger influence on centralization of consumer services for the 1979-89
period than for the 1969-79 period. For the total period (1969-89), population
growth results in greater decentralization of consumer and business services.
Service employment growth, on the contrary, causes consumer and business
services to centralize slightly.
Comparison of inertia effects for the 1969-79 and 1979·89 periods shows
that existing locational patterns have a stronger effect on the decentralization of
business services than on consumer services. The effects of relocation costs may
be greater for business services than for consumer services, which would explain
slower decentralization of business services (Kellerman and Krakover, 1986;
Daniels, 1985; Stanback, 1979). This interpretation is also supported by the
analysis of communications activity: the growth of communications activity has
a significant effect on the centralization of business oriented services. The
analysis of the 1969-89 period shows the reinforced inertia effects for consumer
services, and significant inertia effects for business services as well. The analysis
implies that relocation costs are factors encouraging more centralization of
consumer and business services over a longer time span.

95The analysis of the service demand for the 1969-79 and 1979-89 periods
shows that the growth of real per capita income results in greater
decentralization of both consumer and business services. A higher income
population appears to have a higher propensity to decentralize, thus
encouraging more decentralization of services. The analysis for the 1969-89
period demonstrates that the level of service demand has a much stronger effect
on decentralization of consumer services than on business services. Consumer
services appear to be very responsive to the relocation of population.
Growth of the black population is strongly related to the decentralization
of consumer services, and to centralization of business services. The
decentralization of manufacturing activity has a significant effect on
decentralization of business services. Thus, the linkages between business
services and manufacturing activity appear to be strong. Regression results for
the 1969-79 and 1979-89 periods also support Mills' (1988) speculations about
the location of these related activities. The linkages between business services
and manufacturing activity seem to decline over a longer time period, as
suggested by the analysis for the 1969-89 period.
The analysis of corporate sales, a proxy for corporate demand, shows that
corporate demand is a significant factor encouraging centralization of business
services. The locational effects of the corporate demand appear weaker over a
longer time span, as suggested by the results for the 1969-89 period. The
analysis of the headquarters effects shows that the presence of corporate
headquarters is weakly related to centralization of business services. Corporate
influence seems to be better represented by sales than by the presence of
headquarters.
The analysis of regional effects shows that the Northeast region exhibits
relatively greater centralization of consumer and business services compared to
96the South. The centralization of business services is also relatively greater in the
West than in the South. This finding is supported by the analysis for the 1969
89 period: increasing centralization in the West seems to be related to its more
rapid growth and increasing use of information services (Hall, 1988).
CONCLUSIONS
From the above summary, several conclusions about the locational
dynamics of service activities are presented.
1. Structural changes for the 1969-79 period differ from those for
the 1979-89 period. Metropolitan structural changes have a much stronger
influence on decentralization of consumer and business services for the 1979-89
period than for the 1969-79 period. Service employment changes are m~ely to
cause centralization of consumer oriented services for the 1979-89 period than
for the 1969-79 period.
2. The results indicate that the spatial dynamics of business
services are different from those of consumer services. Relocation costs appear
to be greater for business services than for consumer services. By contrast,
service demand and racial composition seem to have a greater influence on
decentralization of consumer services than on business services.
3. The centralization of consumer and business services was found
to be relatively greater in the Northeast than in the South. The Western region
also appears to exhibit relatively greater centralization of business services
compared to the South.
4. The results imply that relocation costs are likely to encourage
more centralization of consumer and business services over a longer time span.

97The locational effects of corporate demand and decentralization of
manufacturing activity, on the contrary, appear to weaken over a longer time
span.
THE SIGNIFICANCE OF THIS STUDY
This study provides a better understanding of factors that are critical in
determining dynamic locational patterns of service activities in U.S.
metropolitan areas. This research finds significant evidence that factors such as
the level of service demand and racial composition affect locational patterns of
business services differently from consumer services. It thus provides insight
into distinctions between business and consumer services. Moreover, the
analysis adds to our understanding of the determinants of decentralization of
these services and how they differ over time.
THEORY IMPLICATIONS
The effects of corporate demand and manufacturing activity in this
research indicate that their locational effects on business services are significant,
and thus the linkages of business services with corporate demand and
manufacturing activity appear strong. In view of agglomeration economies,
these related activities are locationally tied to each other. This notion was
reinforced by the corporate demand factor findings in this research. The
empirical results indicate that the centralizing pull of corporate demand acting
as an agglomerating force, draws business services.
The significant effects of inertia imply that relocation costs have a
stronger locational effect on business services than on consumer services, and

98their centralization effects become stronger over a longer time span. It appears
to support the notion of intrametropolitan office location and rent gradient
theories that communication cost savings in central locations account for
centralization of business services.
The significant effect of communications activity indicates that the growth
of communications encourages centralization of business services. Evidence
from the communications activity factor provides empirical support for contact
and intrametropolitan office location theories, which emphasize information
costs.
In this study, the level of service demand has a much stronger effect on
decentralization of consumer services than on business services. Consumer
services have a greater need for access to the consumer market. Thus, consumer
service location models are overwhelmingly consumer demand based. The
results of the level of service demand seem to empirically support the demand
oriented models. Finally, the different outcomes by time period in this research
indicate a need for a framework to account for short and long-term locational
trends of urban services.
POLICY IMPLICATIONS
The relocations of consumer and business services were found to be very
responsive to the relocations of higher income population. Considering this
population with a higher propensity for decentralization (Stanback, 1979), the
relatively low income counties are likely to have a more difficulty to attract
service activities. Thus, when making an urban development strategy, thought
should also be given to inducing higher income population as well.

99
This study has shown that locational behavior of business services is
affected by corporate demand. This implies that the ability of a core county to
maintain and promote growth of ·business service activities is dependent on the
corporate decision makers' locational decisions. If the policy promotes business
amenity or corporate incentives, it might induce more corporate activity which
could encourage centralization of business services. Thus, planners and policy
makers need to consider both business services and corporate activity when
making a service growth policy.

REFERENCES
Alexander, I. 1978. Office decentralization in Sydney. Town Planning Review
49: 402-416.
Alexander, I. and J. A. Dawson. 1979. Suburbanization of retailing sales and
employment in Australian Cities. Australian Geographical Studies 17 (1):
76-83.
Alonso, W. 1964. Location and Land Use: Toward a General Theory of Land
Rent. Cambridge, Mass.: Harvard University Press.
Bergsman, J., P. et a1.1972. The agglomeration process in urban growth. Urban
Studies 9: 263-264.
Beyers, W. B.1989. Exports and Regional Growth: Experiences in the United
States, 1974-1985. Presented at the American Collegiate Schools of
Planning Conference, October.
Cervero, R. 1986. Suburban Gridlock. New Brunswick, NJ: Center for Urban
Policy Research, Rutgers University.
Christaller, W.1933. Die Zentralen Orte in Suddeutschland. Translated by
Baskin, C. 1966, as Central Places in Southern Germany. Englewood
Cliffs: Prentice-Hall.
Clapp, J. M. 1980. The intrametropolitan location of office activities• .Journal of
Regional Science 20 (3): 388-390.
Coffey, W. J. and M. Polese. 1987. Intrafirm trade in business services:
implications for the location of office-based activities. Papers Of The
Regional Science Association 62: 71-80.
101Daniels, P. W. 1979. Perspectives on office location research. In Spatial Patterns
of Office Growth and Location, ed. P.W. Daniels, pp.I-28. Chichester:
John Wiley & Sons.
____• 1982. An exploratory study of office location behaviour in Seattle.
Urban Geography 3 (1): 58-78.
____• 1983. Business service offices in British provincial cities: location and
control. Environment and Planning A 15: 1101-1120.
____,. 1984. Business service offices in provincial cities: sources of input
and destination of output. Tijdschrift voor Econ. en Soc. Geografie 75 (2):
123-139.
____• 1985. Service Industries: A Geographical Appraisal. London:
Methuen.
____'. 1986. The geography of services. Progress in Human Geography 10
(3): 436-444.
De Smidt, M. 1984. Office location and the urban functional mosaic: a
comparative study of five cities in the Netherlands. Tijdschrift voor Econ.
en Soc. Geografie 75 (2): 110-122.
Dudey, M. 1990. Competition by choice: the effect of consumer search on firm
location decisions. The American Economic Review 80 (5): 1092-1104.
Dunning, J. H. and G. Norman. 1983. The theory of multinational enterprise: an
application to multinational office location. Environment and Planning A
15: 675-692.
Eaton, B. C. and R. G. Lipsey. 1979. Comparison shopping and the clustering of
homogeneous firms. Journal of Regional Science 19 (4): 421-435.
Edgington, D. W. 1982. Changing patterns of central business district office
activity in Melbourne. Australian Geographer 15 (4): 231-242.

102
Edwards, L. E. 1983. Towards a process model of office location decision
making. Environment and Planning A 15: 1327-1342.
Erickson, R. A. 1982. Employment density variation in the Baltimore
metropolitan area. Environment and Planning A 14: 591-601.
____• 1983. The evolution of the suburban space economy. Urban
Geography 4 (2): 95-121.
Fernie, J. 1977. Office linkages and location: an evaluation of patterns in three
cities. Town Planning Review. 48: 78-89.
Fortune. Fortune Directory of the 500 Largest Industrial Corporations. May
1970, May 1980.
Friedrichs, J. and A. C. Goodman, et. al.1987. The Changing Downtown: A
Comparative Study of Baltimore and Hamburg. Berlin: Water de
Gruyter.
Gad, G. H. K. 1979. Face-to-face linkages and office decentralization potentials:
a study of Toronto. In Spatial Patterns of Office Growth and Location, ed.
P.W. Daniels, pp. 277-324. Chichester: John Wiley & Sons.
Gillespie, A. E. and A. E. Green. 1987. The changing geography of producer
services employment in Britain. Regional Studies 21 (5): 397-412.
Goddard, J. B. 1971. Office communication and office location: a review of
current research. Regional Studies 5: 263-280.
____• 1973. Office linkages and location: a study of communications and
spatial patterns in central London. Progress in Planning 1: 109-232.
Goddard, J. B. and D. Morris. 1976. The communications factor in office
decentralization. Progress in Planning 6: 1-80.

103
Goddard, J. B. and R. Pye. 1977. Telecommunications and office location.
Regional Studies 11: 19-30.
Goddard, J. B. and D. Morris. 1979. The communications factor in office
decentralization. In Progress in Planning, ed. D.R. Diamond and J.B.
Mcloughlin, pp. 1-80. Oxford: Pergamon.
Greene, D. L. 1980. Urban subcenters: recent trends in urban spatial
structure. Growth and Change 11: 29-40.
Greene, W. H. 1990. Econometric Analysis. New York: Macmillan Publishing
Co.
Hall, P. 1988. Regions in the transition to the information economy. In America's
New Market Geography:Nation, Region and Metropolis, eds. G. Sternlieb
and J.W. Hughes, pp. 137-159. New Brunswick, New Jersey: The State
University of New Jersey, Center for Urban Policy Research.
Hoerter, D. and M. Wiseman. 1988. Metropolitan development in the San
Francisco Bay Area. The Annals of Regional Science 22: 11-33.
Horton, F. E. 1968. Location factors as determinants of consumer attraction to
retail firms. Annals of the Association of American Geographers 58 (4):
787-801.
Howells, J. 1987. Developments in the location, technology and industrial
organization of computer services: some trends and research issues.
Regional Studies 21: 493-503.
Howells, J. and A. E. Green. 1986. Location, technology and industrial
organization in U.K. services. Progress in Planning 26: 83-184.
HuUon, T. and D. Ley. 1987. Location, linkages, and labor: the downtown
complex of corporate activities in a medium size city, Vancouver, British
Columbia. Economic Geography 63: 127-129.
104
Ingene, C. A. 1984. Temporal influences upon spatial shopping behaviour of
consumers. Papers of The Regional Science Association 54: 71-87.
Kellerman, A. 1985. The evolution of service economies: a geographical
perspective. The Professional Geographer 37 (2): 133-143.
Kellerman, A. and S. Krakover. 1986. Multi-sectoral urban growth in space and
time: an empirical approach. Regional Studies 20 (2): 117-129.
Kutay, A. 1986. Effects oftelecommunications technology on office location.
Urban Geography 7(3): 243-257.
Lloyd, P. E. and P. Dicken. 1977. Location in Space: A Theoretical Approach to
Economic Geography. London: Harper and Row.
Manners, G. 1974. The office in metropolis: an opportunity for shaping
metropolitan America. Economic Geography 50(2): 93-110.
Marshall, J. N. 1982. Linkages between manufacturing industry and business
services. Environment and Planning A 14: 1523-1540.
____,.1985. Business services, the regions and regional policy. Regional
Studies 19 (4): 353-363.
Meyer, D. R. 1980. A dynamic model of the integration of frontier urban places
into the United States system of cities. Economic Geography 56(2):120
140.
Mills, E. S. and R. Price. 1984. Metropolitan suburbanization and central city
problems. Journal of Urban Economics 15: 1-17.
Mills, E. S. 1988. Service sector suburbanization. In America's New Market
Geography: Nation, Region and Metropolis, eds. G. Sternlieb and J, W.
Hughes, pp. 243-254. New Brunswick, New Jersey: The State University of
New Jersey, Center For Urban Policy Research.

105Muller, P. 0.1981. Contemporary Suburban America. Englewood Cliffs, New
Jersey: Prentice-Hall.
Nelson, K. 1986. Labor demand, I~bor supply and the suburbanization of low
wage office work. In Production, Work, Territory: The geographical
anatomy of industrial capitalism, ed. A.J. Scott and M. Storper, pp. 149
171. Boston: Allen&Unwin.
Niedercorn, J. H. 1971. A negative exponential model of urban land use densities
and its implications for metropolitan development. Journal of Regional
Science 11 (3): 317-326.
Noyelle, T. and T. M. Stanback, Jr. 1984. The Economic Transformation of
American Cities. Totowa: Rowman and Allanheid.
O'Hara, D. J. 1977. Location of firms within a square central business district.
Journal of Political Economy 85 (6): 1189-1207.
Pivo, G. 1990. The net of mixed beads: suburban office development in six
metropolitan regions. APA Journal (Autumn). 457-469.
Polese, M. 1982. Regional demand for business services and interregional service
flows in a small Canadian region. Papers of the Regional Science
Association 50: 151-163.
Pred, A. 1974. Industry, information and city-system interdependencies. In
Spatial Perspectives on Industrial Organization and Decision-making, ed.
F,E.I. Hamilton, pp. 105-139. London: John Wiley & Sons.
___"1977. City Systems in Advanced Economies. London: Hutchinson.
Price, D. G. and A. M. Blair, 1989. The Changing Geography of the Service
Sector. London: Belhaven Press.
Pye, R. 1977. Office location and the cost of maintaining contact. Environment
and Planning A 9:149-168.

106
Pye, R. 1979. Office location: the role of communications and technology. In
Spatial Patterns of Office Growth and Location, ed. P.W. Daniels, pp. 239
275. London: Wiley.
Rand McNally. 1992. Commercial Atlas & Marketing Guide, 123rd edition.
Rand McNally & Company, USA.
Richardson, H. W. 1969. Regional Economics: Location Theory. Urban
Structure, and Regional Change. New York: Praeger.
Schneider, M. and F. Fernandez. 1989. The emerging suburban service
economy: changing patterns of employment. Urban Affairs Ouarterly
24(4): 537-555.
Stahl, K. 1987. Theories of urban business location. In Handbook of Regional
and Urban Economics, ed. E.S. Mills, pp. 759-820. North-Holland:
Elsevier Science Publishers.
Stanback, T. M., Jr. 1979. Understanding the Service Economy: Employment.
Productivity. Location. Baltimore, Maryland: Johns Hopkins University
Press.
Stanback, T. M., Jr.; P. J. Bearse; T. J. Noyelle; and R. A. Karasek. 1981.
Services: The New Economy. Allanhelld: Osmun.
Sullivan, A. M. 1986. A general equilibrium model with agglomerative
economies and decentralized employment• .Journal of Urban Economics
20: 55-74.
Tarpley, Jr., F. A., et al. 1970. Flight to the fringes: an empirical study of office
decentralization in Atlanta, Georgia. The Review of Regional Studies 1:
117-140.
Tauchen, H. and A. D. Witte. 1983. An equilibrium model of office location and
contact patterns. Environment and Planning A 15: 1311-1326.

107
Tornqvist, G. 1968. Flows of information and the location of economic activities.
Geografiska Annaler 50 B: 99-107.
U.S. Department of Commerce, Bureau Of The Census. Census of Population.
1970.1980.1990.
U.S. Department of Commerce, Bureau Of The Census. Census of Population
and Housing. 1980. 1990.
U.S. Department of Commerce, Bureau Of The Census. County Business
Patterns. 1959. 1964. 1969. 1979. 1989.
U.S. Department of Commerce, Statistical Abstract of the U.S.. 1991, lllth
edition.
Wheeler, J. 0.1986. Corporate spatial links with financial institutions: the role
of the metropolitan hierarchy. Annals of the Association of American
Geographers 76 (2): 262-274.
White, L. J. 1975. The spatial distribution of retail firms. Regional Science and
Urban Economics 5: 325-333.
Wright, A. S., III. 1978. The office market: central Atlanta vs. suburbs. Atlanta
Economic Review 28 (January-February): 34-36.
APPENDIX A
LOCATIONAL PATTERN CHANGES OF SERVICE ACTIVITIES AMONGMETROPOLITAN SIZE GROUPS
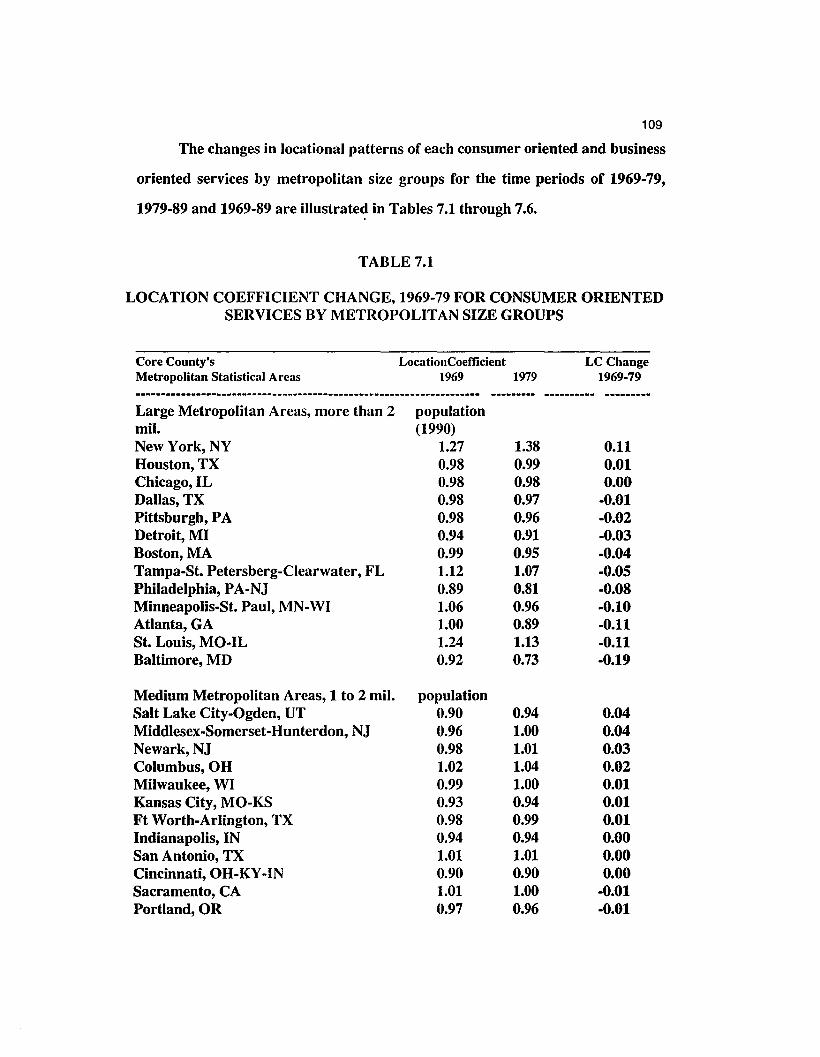
109
The changes in locational patterns of each consumer oriented and business
oriented services by metropolitan size groups for the time periods of 1969-79,
1979-89 and 1969-89 are iIlustrate~ in Tables 7.1 through 7.6.
TABLE 7.1
LOCATION COEFFICIENT CHANGE, 1969-79 FOR CONSUMER ORIENTEDSERVICES BY METROPOLITAN SIZE GROUPS
Core County's LocationCoefficient LC ChangeMetropolitan Statistical Areas 1969 1979 1969-79-_....._--_..-...._--_.--------_.-----------_.....---------......_-- .--.-_... -------..- ------_..Large Metropolitan Areas, more than 2 populationmil. (1990)New York, NY 1.27 1.38 0.11Houston, TX 0.98 0.99 0.01Chicago,IL 0.98 0.98 0.00Dallas, TX 0.98 0.97 -0.01Pittsburgh, PA 0.98 0.96 -0.02Detroit, MI 0.94 0.91 -0.03Boston, MA 0.99 0.95 -0.04Tampa-St. Petersberg-Clearwater, FL 1.12 1.07 -0.05Philadelphia, PA-NJ 0.89 0.81 -0.08Minneapolis-St. Paul, MN-WI 1.06 0.96 -0.10Atlanta, GA 1.00 0.89 -0.11St. Louis, MO-IL 1.24 1.13 -0.11Baltimore, MD 0.92 0.73 -0.19
Medium Metropolitan Areas, 1 to 2 mil. populationSalt Lake City-Ogden, UT 0.90 0.94 0.04Middlesex-Somerset-Hunterdon, NJ 0.96 1.00 0.04Newark,NJ 0.98 1.01 0.03Columbus, OH 1.02 1.04 0.02Milwaukee, WI 0.99 1.00 0.01Kansas City, MO-KS 0.93 0.94 0.01Ft Worth-Arlington, TX 0.98 0.99 0.01Indianapolis, IN 0.94 0.94 0.00San Antonio, TX 1.01 1.01 0.00Cincinnati, OH-KY-IN 0.90 0.90 0.00Sacramento, CA 1.01 1.00 -0.01Portland, OR 0.97 0.96 -0.01

TABLE 7.1110
(continued)
LOCATION COEFFICIENT CHANGE, 1969-79 FOR CONSUMERORIENTED SERVICES BY METROPOLITAN SIZE GROUPS
Cleveland,OH 0.98 0.96 -0.02Hartford, CT 0.96 0.94 -0.02Orlando, FL 0.99 0.95 -0.04Rochester, NY 0.93 0.88 -0.05Denver, CO 0.89 0.82 -0.07New Orleans, LA 0.94 0.86 -0.08San Francisco, CA 0.88 0.79 -0.09Charlotte-Gastonia-Rock Hill, NC-SC 1.21 1.08 -0.13
Small Metropolitan Areas, less than 1 mil. populationJohnson City-Kingsport-Bristol, TN-VA 0.87 0.95 0.08Wheelim!. WY-OH 1.01 1.08 0.07Scranton-Wilkes-Barre, PA 0.97 1.01 0.04Lexington-Fayette, KY 1.04 1.07 0.03Dayton-Springfield,OH 0.96 0.99 0.03Raleigh-Durham, NC 1.04 1.07 0.03Davenport-Rock Island-Moline, IA-IL 1.00 1.03 0.03Greensboro-Winston-Salem-High Point, 1.11 1.13 0.02NCBaton Rouge, LA 0.99 1.01 0.02Manchester, NH 0.89 0.91 0.02Ft. Wayne, IN 1.01 1.03 0.02Burlington, YT 0.97 0.99 0.02St. Cloud, MN 1.01 1.03 0.02Ft. Smith, AR-OK 0.92 0.94 0.02Nashville, TN 0.99 1.01 0.02Birmingham, AL 0.99 1.00 0.01Jackson,MS 1.02 1.03 0.01Charleston, SC 1.04 1.05 0.01Austin, TX 1.00 1.01 0.01Macon-Warner Robins, GA 0.93 0.94 0.01Huntington-Ashland, WY-KY-OH 1.04 1.05 0.01Des Moines, IA 0.97 0.98 0.01Tulsa, OK 0.98 0.99 0.01Littl~ Rock-North Little Rock, AR 1.01 1.02 0.01Memphis, TN-AR-MS 0.98 0.99 0.01Omaha, NE-IA 0.94 0.94 0.00Syracuse, NY 0.96 0.96 0.00

111TABLE 7.1(continued)
LOCATION COEFFICIENT CHANGE, 1969-79 FOR CONSUMERORIENTED SERVICES BY METROPOLITAN SIZE GROUPS
Evansville,IN-KYMontgomery, ALChattanooga, TN-GAAppleton-Oshkosh-Neenah, WIHickory-Morganton, NCLansing-East Lansing, MIToledo,OHOklahoma City, OKHarrisburg-Lebanon-Carlisle, PASaginaw-Bay City-Midland, MIWilmington, DE-NJ-MDJacksonville, FLAthens, GALouisville, KY-INKnoxville, TNAugusta, GA-SCBeaumont-Port Arthur, TXProvidence, RIAlbany-Schenectady-Troy, NYCharlottesville, VARichmond-Petersburg, VALynchburg, VAPeoria.ILAllentown-Bethlehem-Easton. PA-N.lGreenville-Spartanburg, SCSteubenville-Weirton, 0 H-WV
1.021.001.021.071.090.951.020.950.921.031.021.001.111.011.071.321.040.901.100.631.231.071.101.221.111.44
1.021.001.021.071.080.931.000.930.901.000.990.971.070.971.021.260.980.831.020.551.150.971.001.110.971.11
0.000.000.000.00
-0.01-0.02-0.02-0.02-0.02-0.03-0.03-0.03-0.04-0.04-0.05-0.06-0.06-0.07-0.08-0.08-0.08-0.10-0.10-0.11-0.14-0.33
* The location coefficient change values were calculated from the locationcoefficient values (four places of decimals), and then the fractions wereautomatically rounded off to two decimal places by computer (EXCELprogram).

TABLE 7.2
LOCATION COEFFICIENT CHANGE, 1979-89 FOR CONSUMERORIENTED SERVICES BY METROPOLITAN SIZE GROUPS
112
Core County's Location Coefficient LC ChangeMetropolitan Statistical Areas 1979 1989 1979-89*--_..._---------_._---.-_._--_...-_.._-----------_..--.--------_._-- --------- ._----._-- .----_.Large Metropolitan Areas, more than 2 populationmil. (1990)Detroit, MI 0.91 0.95 0.05Philadelphia, PA-NJ 0.82 0.85 0.03Chicago,IL 0.98 0.98 0.00Houston, TX 1.00 0.99 -0.01Pittsburgh, PA 0.96 0.95 -0.01Tampa-St. Petersberg-Clearwater, FL 1.07 1.05 -0.02Dallas, TX 0.97 0.95 -0.02Minneapolis-St. Paul, MN-WI 0.96 0.92 -0.04Baltimore, MD 0.73 0.68 -0.05Boston, MA 0.95 0.87 -0.08St. Louis, MO-IL 1.13 1.04 -0.09Atlanta, GA 0.89 0.80 -0.09New York, NY 1.38 1.28 -0.10
Medium Metropolitan Areas, 1 to 2 populationmil.San Francisco, CA 0.79 0.88 0.09Rochester, NY 0.88 0.94 0.06Middlesex-Somerset-Hunterdon, NJ 1.00 1.02 0.02Kansas City, MO-KS 0.94 0.96 0.02Hartford, CT 0.94 0.94 0.00Indianapolis, IN 0.94 0.94 0.00Cincinnati, OH-KY-IN 0.91 0.90 -0.01Milwaukee, WI 1.00 0.99 -0.01San Antonio, TX 1.01 1.00 -0.01Ft. Worth-Arlington, TX 0.99 0.98 -0.01Salt Lake City-Ogden, UT 0.94 0.93 -0.01Cleveland,OH 0.96 0.95 -0.01Columbus, OH 1.04 1.02 -0.02Sacramento, CA 1.00 0.98 -0.02Newark, NJ 1.01 0.98 -0.03New Orleans, LA 0.87 0.84 -0.03Orlando, FL 0.95 0.90 -0.05

113TABLE 7.2(continued)
LOCATION COEFFICIENT CHANGE, 1979-89 FOR CONSUMERORIENTED SERVICES BY METROPOLITAN SIZE GROUPS
Portland, OR 0.96 0.90 -0.06Charlotte-Gastonia-Rock Hill, NC-SC 1.08 0.97 -0.11Denver, CO 0.82 0.51 -0.31
Small Metropolitan Areas, less than 1 mil. populationCharlottesville, VA 0.55 0.94 0.39Steubenville-Weirton. 0 H-WV 1.11 1.32 0.21Wheeling, WV-OH 1.08 1.23 0.15Huntington-Ashland, WV-KY-OH 1.05 1.14 0.09Lynchburg, VA 0.97 1.06 0.09Saginaw-Bay City-Midland, MI 0.99 1.06 0.07Johnson City-Kingsport-Bristol, TN- 0.95 0.99 0.04VASt. Cloud, MN 1.03 1.06 0.03Richmond-Petersburg, VA 1.15 1.18 0.03Evansville,IN-KY 1.02 1.05 0.03Athens, GA 1.08 1.10 0.02Knoxville, TN 1.03 1.05 0.02Ft. Smith, AR-OK 0.94 0.95 0.01Memphis, TN-AR-MS 0.99 1.00 0.01Beaumont-Port Arthur, TX 0.99 0.99 0.00Omaha, NE-IA 0.94 0.94 0.00Tulsa, OK 0.99 0.99 0.00Des Moines, IA 0.99 0.99 0.00Appleton-Oshkosh-Neenah, WI 1.07 1.07 0.00Raleigh-Durham, NC 1.08 1.08 0.00Louisville, KY-IN 0.97 0.97 0.00Syracuse, NY 0.96 0.96 0.00Providence, RI 0.83 0.83 0.00Chattanooga, TN-GA 1.02 1.02 0.00Toledo,OH 1.00 1.00 0.00Scranton-Wilkes-Barre, PA 1.02 1.01 -0.01Manchester, NH 0.92 0.91 -0.01Burlington, VT 0.99 0.98 -0.01Wilmington, DE-NJ-MD 0.99 0.98 -0.01Montgomery, AL 1.00 0.99 -0.01Oklahoma City, OK 0.92 0.91 -0.01

114TABLE 7.2(continued)
LOCATION COEFFICIENT CHANGE, 1979-89 FOR CONSUMERORIENTED SERVICES BY METROPOLITAN SIZE GROUPS
Hickory-Morganton, NCBaton Rouge, LAGreenville-Spartanburg, SCLittle Rock-North Little Rock, ARBirmingham, ALHarrisburg-Lebanon-Carlisle, PADayton-Springfield,OUMacon-Warner Robins, GADavenport-Rock Island-Moline, IA-ILFt. Wayne, INCharleston, SCAustin, TXLansing-East Lansing, MILexington-Fayette, KYJacksonville, FLGreensboro-Winston-Salem-HighPoint, NCJackson, MSPeoria,ILNashville, TNAllentown-Bethlehem-Easton. PA-N.1Albanv-Schenectadv-Trov. NYAugusta, GA-SC
1.081.020.971.021.000.900.990.941.031.031.051.010.931.070.971.13
1.031.001.011.111.031.26
1.061.000.951.000.980.880.970.921.011.011.030.980.901.030.921.08
0.970.920.931.020.901.08
-0.02-0.02-0.02-0.02-0.02-0.02-0.02-0.02-0.02-0.02-0.02-0.03-0.03-0.04-0.05-0.05
-0.06-0.08-0.08-0.09-0.13-0.18
* The location coefficient change values were calculated from the locationcoefficient values (four places of decimals), and then the fractions wereautomatically rounded off to two decimal places by computer (EXCELprogram).

TABLE 7.3
LOCATION COEFFICIENT CHANGE, 1969-89 FOR CONSUMERORIENTED SERVICES BY METROPOLITAN SIZE GROUPS
115
Core County'sMetropolitan Statistical Areas
Location Coefficient1969 1989
LC Change1969-89*
Large Metropolitan Areas, more than 2mil.Detroit, MINew York, NYHouston, TXChicago,ILPittsburgh, PADallas, TXPhiladelphia, PA-NJTampa-St. Petersberg-Clearwater, FLBoston, MAMinneapolis-St. Paul, MN-WIAtlanta, GASt. Louis, MO-ILBaltimore, MD
Medium Metropolitan Areas, 1 to 2mil.Middlesex-Somerset-Hunterdon, NJKansas City, MO-KSSalt Lake City-Ogden, UTRochester, NYMilwaukee, WINewark,NJIndianapolis, INColumbus, OHFt. Worth-Arlington, TXSan Francisco, CASan Antonio. TXCincinnati,OH-KY-INHartford, CTSacramento, CACleveland,OHPortland, OROrlando, FLNew Orleans, LACharlotte-Gastonia-Rock Hill, NC-SC
population(1990)0.93 0.951.26 1.280.99 0.990.98 0.980.98 0.950.97 0.940.89 0.851.11 1.040.99 0.871.06 0.921.00 0.801.24 1.040.92 0.67
population
0.96 1.020.93 0.960.90 0.930.93 0.940.99 1.000.98 0.980.94 0.941.02 1.020.98 0.980.88 0.881.01 1.000.91 0.900.96 0.931.01 0.980.98 0.950.97 0.900.99 0.900.94 0.831.21 0.97
0.020.020.000.00
-0.03-0.03-0.04-0.07-0.12-0.14-0.20-0.20-0.25
0.060.030.030.010.010.000.000.000.000.00
-0.01-0.01-0.03-0.03-0.03-0.07-0.09-0.11-0.24

116TABLE 7.3(continued)
LOCATION COEFFICIENT CHANGE, 1969-89 FOR CONSUMERORIENTED SERVICES BY METROPOLITAN SIZE GROUPS
Denver, CO 0.89 0.51 -0.38
Small Metropolitan Areas, less than 1 mil. populationCharlottesville, VA 0.63 0.94 0.31Wheeling, WV-OH 1.01 1.23 0.22Johnson City-Kingsport-Bristol, TN-VA 0.87 0.99 0.12Huntington-Ashland, WV-KY-OH 1.04 1.14 0.10St. Cloud, MN 1.01 1.06 0.05Saginaw-Bay City-Midland, MI 1.02 1.06 0.04Raleigh-Durham, NC 1.05 1.08 0.03Scranton-Wilkes-Barre, PA 0.98 1.01 0.03Ft. Smith, AR-OK 0.92 0.95 0.03Evansville, IN-KY 1.02 1.05 0.03Manchester, NH 0.90 0.91 0.01Dayton-Springfield, OH 0.96 0.97 0.01Des Moines, IA 0.97 0.98 0.01Tulsa, OK 0.98 0.99 0.01Burlington, VT 0.97 0.98 0.01Memphis, TN-AR-MS 0.98 0.99 0.01Omaha, NE-IA 0.93 0.94 0.01Baton Rouge, LA 0.99 1.00 0.01Davenport-Rock Island-Moline, IA-IL 1.00 1.00 0.00Syracuse, NY 0.96 0.96 0.00Appleton-Oshkosh-Neenah, WI 1.07 1.07 0.00Ft. Wayne, IN 1.01 1.01 0.00Chattanooga, TN-GA 1.02 1.02 0.00Lynchburg, VA 1.07 1.07 0.00Birmingham, AL 0.99 0.98 -0.01Lexington-Fayette, KY 1.04 1.03 -0.01Charleston, SC 1.04 1.03 -0.01Macon-Warner Robins, GA 0.93 0.92 -0.01Little Rock-North Little Rock, AR 1.01 1.00 -0.01Montgomery, AL 0.99 0.98 -0.01Athens, GA 1.12 1.10 -0.02Toledo,OH 1.02 1.00 -0.02Austin, TX 1.00 0.98 -0.02Knoxville, TN 1.07 1.05 -0.02Hickory-Morganton, NC 1.08 1.06 -0.02
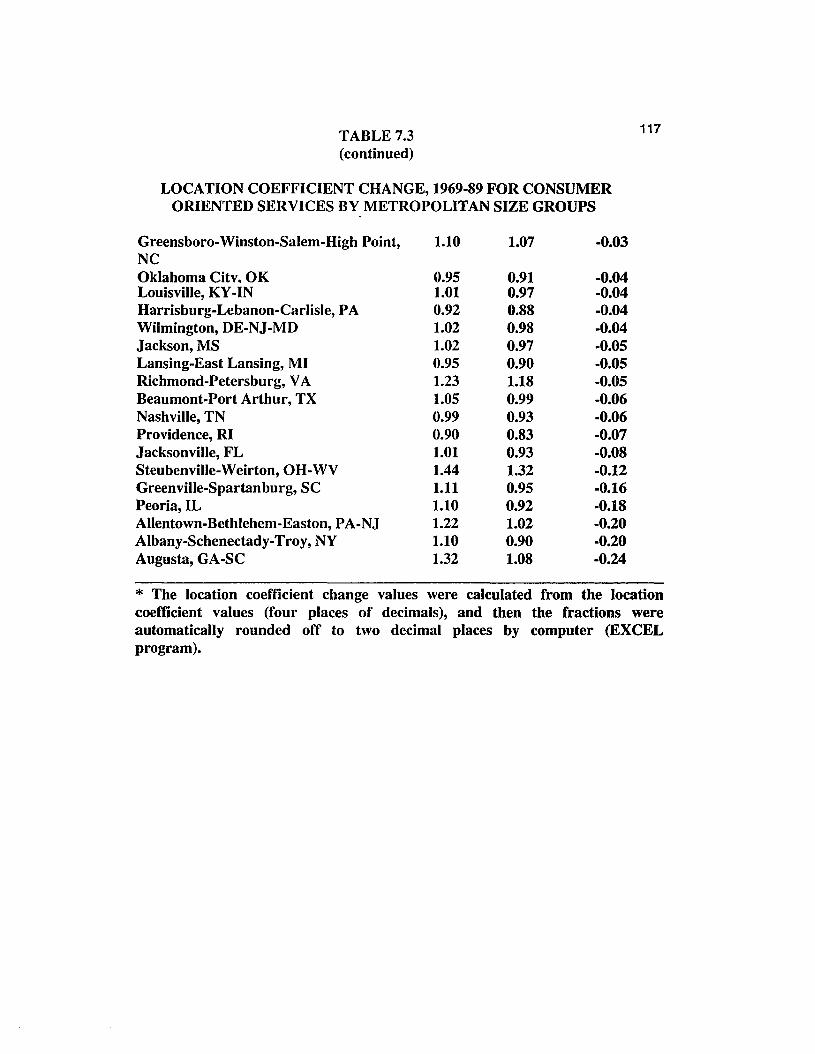
TABLE 7.3(continued)
LOCATION COEFFICIENT CHANGE, 1969-89 FOR CONSUMERORIENTED SERVICES BY METROPOLITAN SIZE GROUPS
Greensboro-Winston-Salem-High Point, 1.10 1.07 -0.03NCOklahoma Citv. OK 0.95 0.91 -0.04Louisville, KY-IN 1.01 0.97 -0.04Harrisburg-Lebanon-Carlisle, PA 0.92 0.88 -0.04Wilmington, DE-NJ-MD 1.02 0.98 -0.04Jackson, MS 1.02 0.97 -0.05Lansing-East Lansing, MI 0.95 0.90 -0.05Richmond-Petersburg, VA 1.23 1.18 -0.05Beaumont-Port Arthur. TX 1.05 0.99 -0.06Nashville, TN 0.99 0.93 -0.06Providence, RI 0.90 0.83 -0.07Jacksonville, FL 1.01 0.93 -0.08Steubenville-Weirton, 0 H-WV 1.44 1.32 -0.12Greenville-Spartanburg, SC 1.11 0.95 -0.16Peoria,IL 1.10 0.92 -0.18Allentown-Bethlehem-Easton, PA-NJ 1.22 1.02 -0.20Albany-Schenectady-Troy, NY 1.10 0.90 -0.20Augusta, GA-SC 1.32 1.08 -0.24
117
* The location coefficient change values were calculated from the locationcoefficient values (four places of decimals), and then the fractions wereautomatically rounded off to two decimal places by computer (EXCELprogram).
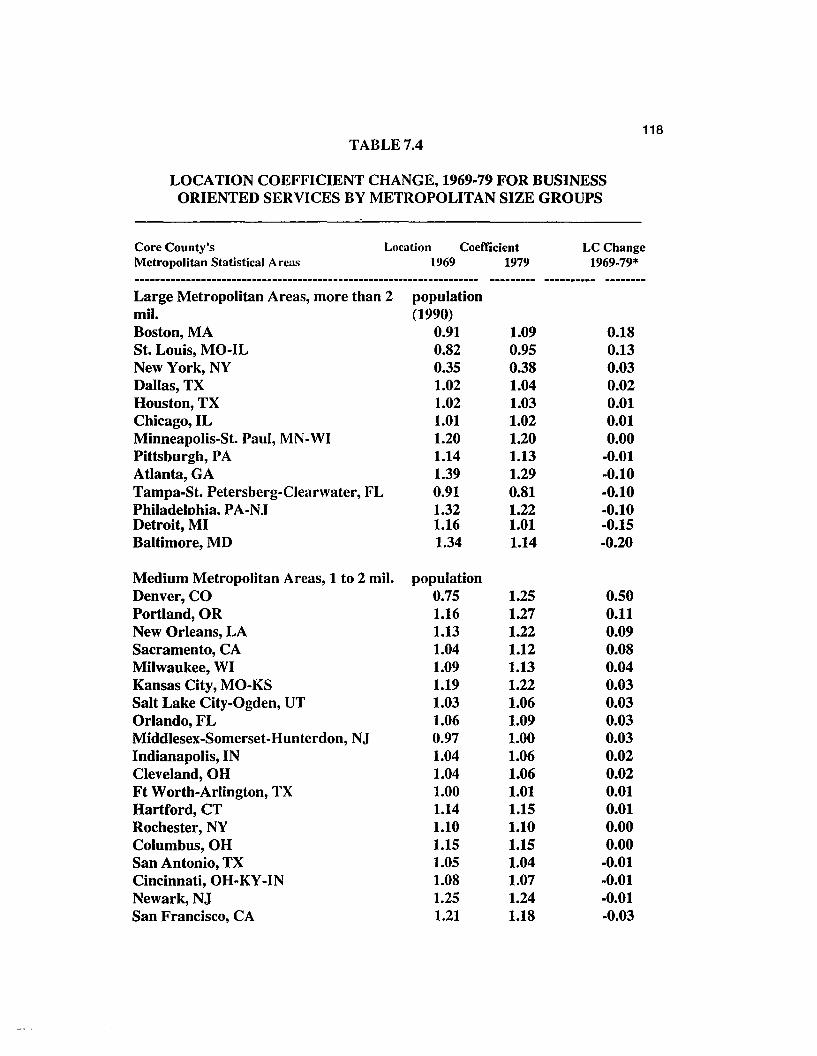
118TABLE 7.4
LOCATION COEFFICIENT CHANGE, 1969-79 FOR BUSINESSORIENTED SERVICES BY METROPOLITAN SIZE GROUPS
Core County's Location Coefficient LC ChangeMetropolitan Statistical Arcas 1969 1979 1969-79*.-----._---_.---_..._-..--------------.--------_._....---_.._-_._._. -------_. -----..... --------Large Metropolitan Areas, more than 2 populationmil. (1990)Boston, MA 0.91 1.09 0.18St. Louis, MO-IL 0.82 0.95 0.13New York, NY 0.35 0.38 0.03Dallas, TX 1.02 1.04 0.02Houston, TX 1.02 1.03 0.01Chicago,IL 1.01 1.02 0.01Minneapolis-St. Paul, MN-WI 1.20 1.20 0.00Pittsburgh, PA 1.14 1.13 -0.01Atlanta, GA 1.39 1.29 -0.10Tampa-St. Petersberg-Clearwater, FL 0.91 0.81 -0.10Philadelohia. PA-N.T 1.32 1.22 -0.10Detroit, MI 1.16 1.01 -0.15Baltimore, MD 1.34 1.14 -0.20
Medium Metropolitan Areas, 1 to 2 mil. populationDenver, CO 0.75 1.25 0.50Portland, OR 1.16 1.27 0.11New Orleans, LA 1.13 1.22 0.09Sacramento, CA 1.04 1.12 0.08Milwaukee, WI 1.09 1.13 0.04Kansas City, MO-KS 1.19 1.22 0.03Salt Lake City-Ogden, UT 1.03 1.06 0.03Orlando,FL 1.06 1.09 0.03Middlesex-Somerset-Hunterdon, NJ 0.97 1.00 0.03Indianapolis, IN 1.04 1.06 0.02Cleveland,OH 1.04 1.06 0.02Ft Worth-Arlington, TX 1.00 1.01 0.01Hartford, CT 1.14 1.15 0.01Rochester, NY 1.10 1.10 0.00Columbus,OH 1.15 1.15 0.00San Antonio, TX 1.05 1.04 -0.01Cincinnati,OH-KY-IN 1.08 1.07 -0.01Newark, NJ 1.25 1.24 -0.01San Francisco, CA 1.21 1.18 -0.03

119TABLE 7.4(continued)
LOCATION COEFFICIENT CHANGE, 1969-79 FOR BUSINESSORIENTED SERVICES BY METROPOLITAN SIZE GROUPS
Charlotte-Gastonia-Rock Hill, NC-SC 1.72 1.49 -0.23
Small Metropolitan Areas, less than 1 mil. populationHarrisburg-Lebanon-Carlisle, PA 1.17 1.34 0.17Dayton-Springfield,OH 0.96 1.05 0.09Augusta, GA-SC 1.30 1.39 0.09Manchester, NH 1.00 1.07 0.07Scranton-Wilkes-Barre, PA 1.04 1.08 0.04Appleton-Oshkosh-Neenah, WI 1.10 1.14 0.04Memphis, TN-AR-MS 1.00 1.03 0.03Albany-Schenectady-Troy, NY 1.21 1.24 0.03Oklahoma City, OK 1.02 1.05 0.03Des Moines, IA 1.00 1.03 0.03Toledo,OH 1.05 1.07 0.02Syracuse, NY 1.06 1.08 0.02Lansing-East Lansing, MI 1.13 1.14 0.01Wilmington, DE-NJ-MD 1.10 1.10 0.00Omaha, NE-IA 1.07 1.06 -0.01Birmingham, AL 1.09 1.08 -0.01Chattanooga, TN-GA 1.15 1.13 -0.02Tulsa, OK 1.07 1.04 -0.03Burlington, VT 1.07 1.04 -0.03Austin, TX 1.11 1.08 -0.03Peoria,IL 1.30 1.25 -0.05Nashville, TN 1.21 1.15 -0.06Louisville, KY-IN 1.14 1.08 -0.06Beaumont-Port Arthur, TX 1.10 1.03 -0.07Wheeling, WV-0H 0.75 0.67 -0.08Hickory-Morganton, NC 1.19 1.10 -0.09Knoxville, TN 1.31 1.22 -0.09Evansville,IN-KY 1.18 1.09 -0.09Lexington-Fayette, KY 1.28 1.19 -0.09Providence, RI 1.19 1.09 -0.10Allentown-Bethlehem-Easton, PA-NJ 1.30 1.19 -0.11Richmond-Petersburg, VA 0.96 0.82 -0.14Greensboro-Winston-Salem-High Point, 1.31 1.17 -0.14NCDavenport-Rock Island-Moline, IA-IL 1.42 1.25 -0.17Macon-Warner Robins, GA 1.04 0.87 -0.17
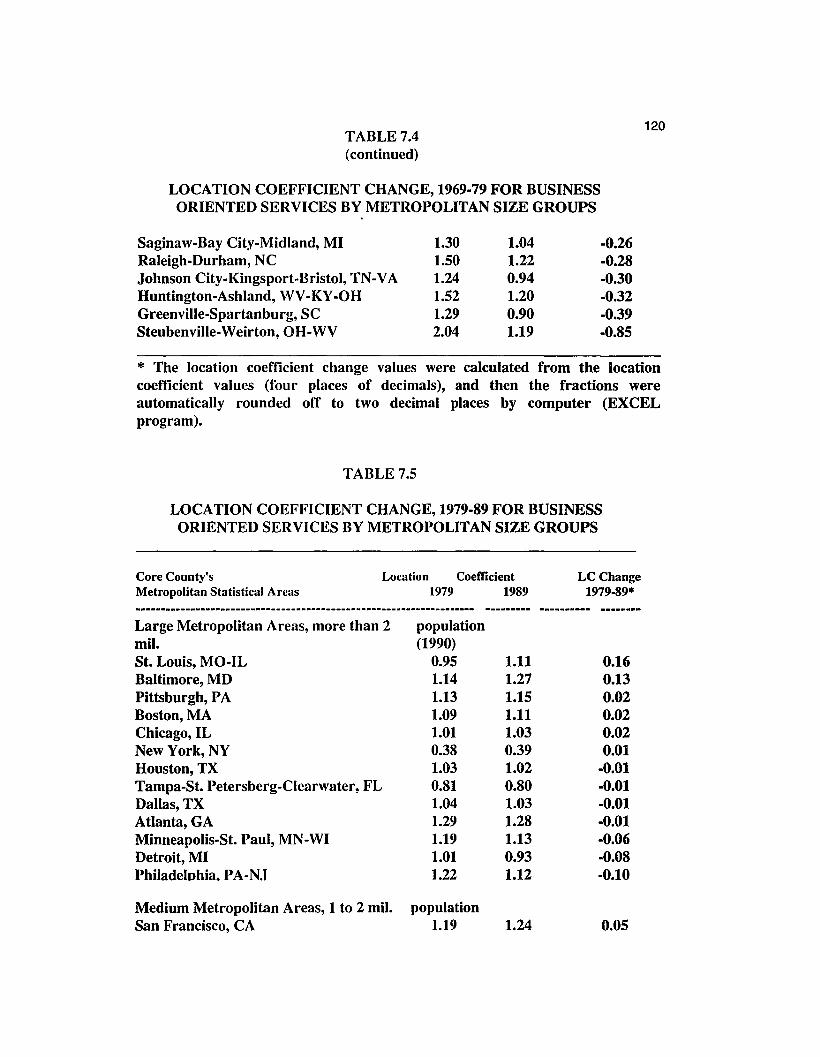
TABLE 7.4(continued)
LOCATION COEFFICIENT CHANGE, 1969-79 FOR BUSINESSORIENTED SERVICES BY METROPOLITAN SIZE GROUPS
120
Saginaw-Bay City-Midland, MIRaleigh-Durham, NCJohnson City-Kingsport-Bristol, TN-VAHuntington-Ashland, WV-KY-0HGreenville-Spartanburg, SCSteubenville-Weirton,OH-WV
1.301.501.241.521.292.04
1.041.220.941.200.901.19
-0.26-0.28-0.30-0.32-0.39-0.85
* The location coefficient change values were calculated from the locationcoefficient values (four places of decimals), and then the fractions wereautomatically rounded off to two decimal places by computer (EXCELprogram).
TABLE 7.5
LOCATION COEFFICIENT CHANGE, 1979-89 FOR BUSINESSORIENTED SERVICES BY METROPOLITAN SIZE GROUPS
Core County's Location Coefficient LCChangeMetropolitan Statistical Arcas 1979 1989 1979-89*..--_....--........--_._-------_...------_...------_....-----_...._. -._.._--- ----_.._-- ........Large Metropolitan Areas, more than 2 populationmil. (1990)St. Louis, MO-IL 0.95 1.11 0.16Baltimore, MD 1.14 1.27 0.13Pittsburgh, PA 1.13 1.15 0.02Boston, MA 1.09 1.11 0.02Chicago,IL 1.01 1.03 0.02New York, NY 0.38 0.39 0.01Houston, TX 1.03 1.02 -0.01Tampa-St. Petersberg-Clearwater, FL 0.81 0.80 -0.01Dallas, TX 1.04 1.03 -0.01Atlanta, GA 1.29 1.28 -0.01Minneapolis-St. Paul, MN-WI 1.19 1.13 -0.06Detroit, MI 1.01 0.93 -0.08PhiiadelDhia. PA-N.J 1.22 1.12 -0.10
Medium Metropolitan Areas, 1 to 2 mil. populationSan Francisco, CA 1.19 1.24 0.05
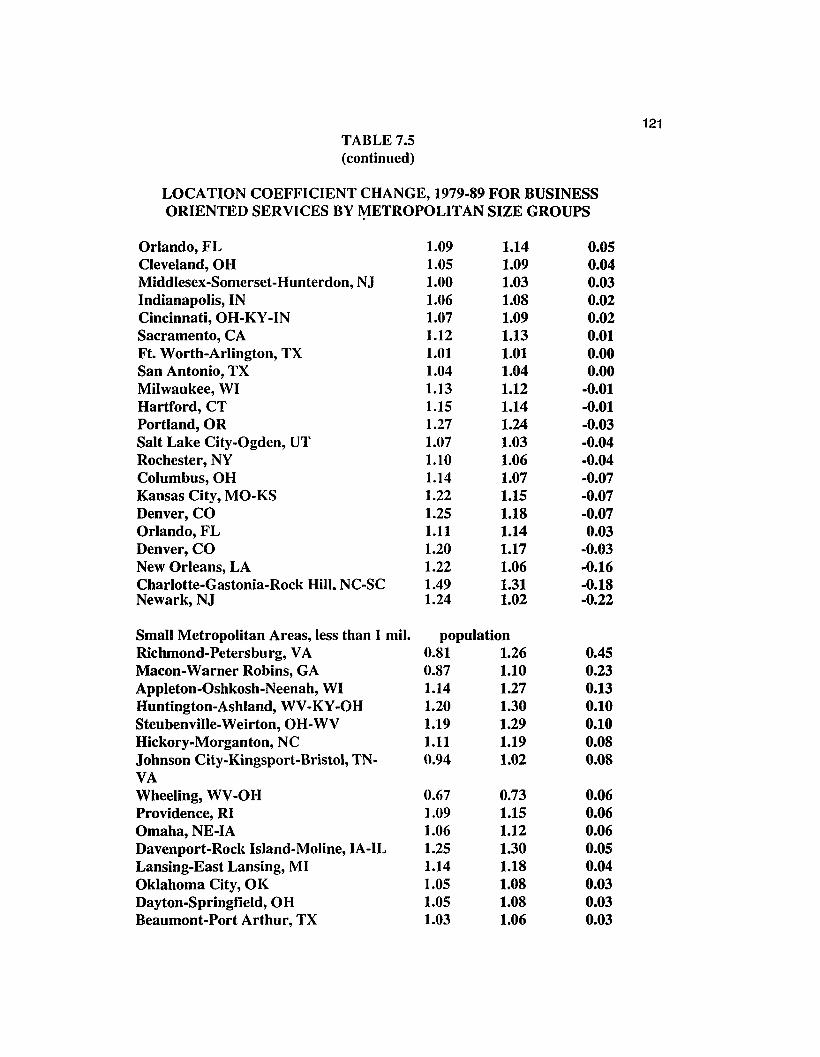
121TABLE 7.5(continued)
LOCATION COEFFICIENT CHANGE, 1979-89 FOR BUSINESSORIENTED SERVICES BY tylETROPOLITAN SIZE GROUPS
Orlando, FL 1.09 1.14 0.05Cleveland,OH 1.05 1.09 0.04Middlesex-Somerset-Hunterdon, NJ 1.00 1.03 0.03Indianapolis, IN 1.06 1.08 0.02Cincinnati, OH-KY-IN 1.07 1.09 0.02Sacramento, CA 1.12 1.13 0.01Ft. Worth-Arlington, TX 1.01 1.01 0.00San Antonio, TX 1.04 1.04 0.00Milwaukee, WI 1.13 1.12 -0.01Hartford, CT 1.15 1.14 -0.01Portland, OR 1.27 1.24 -0.03Salt Lake City-Ogden, UT 1.07 1.03 -0.04Rochester, NY 1.10 1.06 -0.04Columbus,OH 1.14 1.07 -0.07Kansas City, MO-KS 1.22 1.15 -0.07Denver, CO 1.25 1.18 -0.07Orlando, FL 1.11 1.14 0.03Denver, CO 1.20 1.17 -0.03New Orleans, LA 1.22 1.06 -0.16Charlotte-Gastonia-Rock Hill. NC-SC 1.49 1.31 -0.18Newark, NJ 1.24 1.02 -0.22
Small Metropolitan Areas, less than 1 mil. populationRichmond-Petersburg, VA 0.81 1.26 0.45Macon-Warner Robins, GA 0.87 1.10 0.23Appleton-Oshkosh-Neenah, WI 1.14 1.27 0.13Huntington-Ashland, WV-KY-OH 1.20 1.30 0.10Steubenville-Weirton, 0 H-WV 1.19 1.29 0.10Hickory-Morganton, NC 1.11 1.19 0.08Johnson City-Kingsport-Bristol, TN- 0.94 1.02 0.08VAWheeling, WV-OH 0.67 0.73 0.06Providence, RI 1.09 1.15 0.06Omaha, NE-IA 1.06 1.12 0.06Davenport-Rock Island-Moline, IA-IL 1.25 1.30 0.05Lansing-East Lansing, MI 1.14 1.18 0.04Oklahoma City, OK 1.05 1.08 0.03Dayton-Springfield,OH 1.05 1.08 0.03Beaumont-Port Arthur, TX 1.03 1.06 0.03
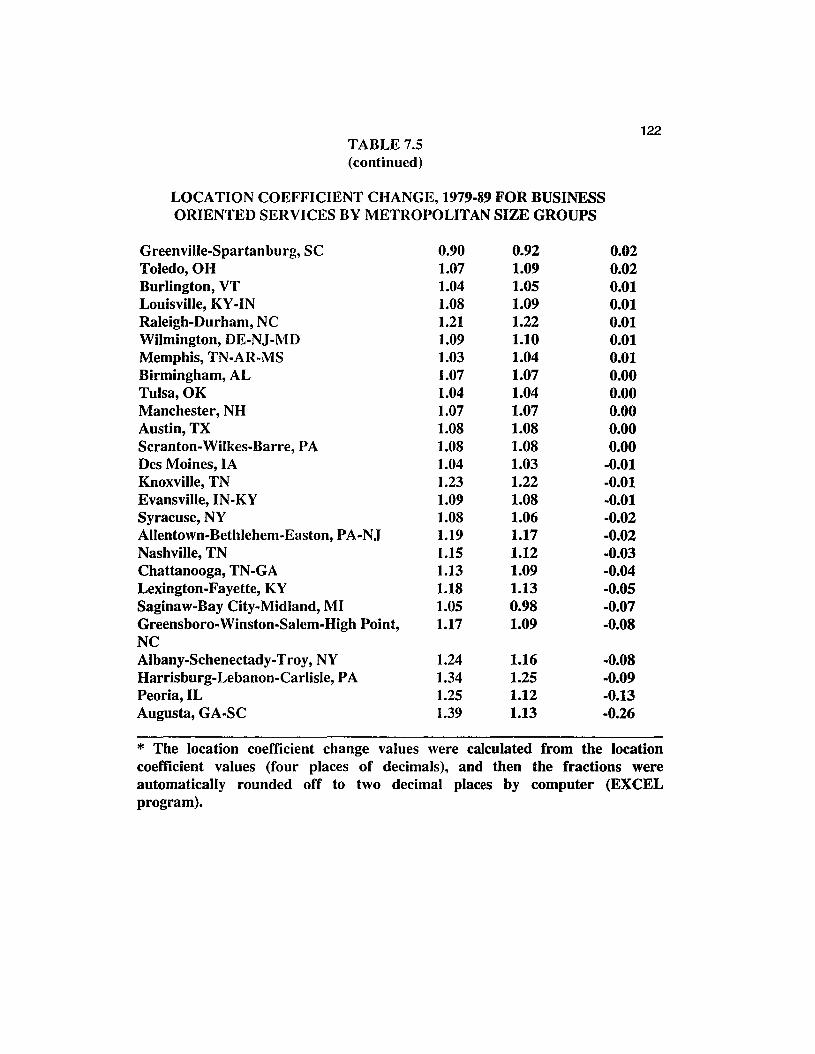
122TABLE 7.5(continued)
LOCATION COEFFICIENT CHANGE, 1979-89 FOR BUSINESSORIENTED SERVICES BY METROPOLITAN SIZE GROUPS
Greenville-Spartanburg, SCToledo,OHBurlington, VTLouisville, KY-INRaleigh-Durham, NCWilmington, DE-NJ-MDMemphis, TN-AR-MSBirmingham, ALTulsa, OKManchester, NHAustin, TXScranton-Wilkes-Barre, PADes Moines, IAKnoxville, TNEvansville,IN-KYSyracuse, NYAllentown-Bethlehem-Easton, PA-NJNashville, TNChattanooga, TN-GALexington-Fayette, KYSaginaw-Bay City-Midland, MIGreensboro-Winston-Salem-High Point,NCAlbany-Schenectady-Troy, NYHarrisburg-Lebanon-Carlisle, PAPeoria,ILAugusta, GA-SC
0.901.071.041.081.211.091.031.071.041.071.081.081.041.231.091.081.191.151.131.181.051.17
1.241.341.251.39
0.921.091.051.091.221.101.041.071.041.071.081.081.031.221.081.061.171.121.091.130.981.09
1.161.251.121.13
0.020.020.010.010.010.010.010.000.000.000.000.00
-0.01-0.01-0.01-0.02-0.02-0.03-0.04-0.05-0.07-0.08
-0.08-0.09-0.13-0.26
* The location coefficient change values were calculated from the locationcoefficient values (four places of decimals), and then the fractions wereautomatically rounded off to two decimal places by computer (EXCELprogram).
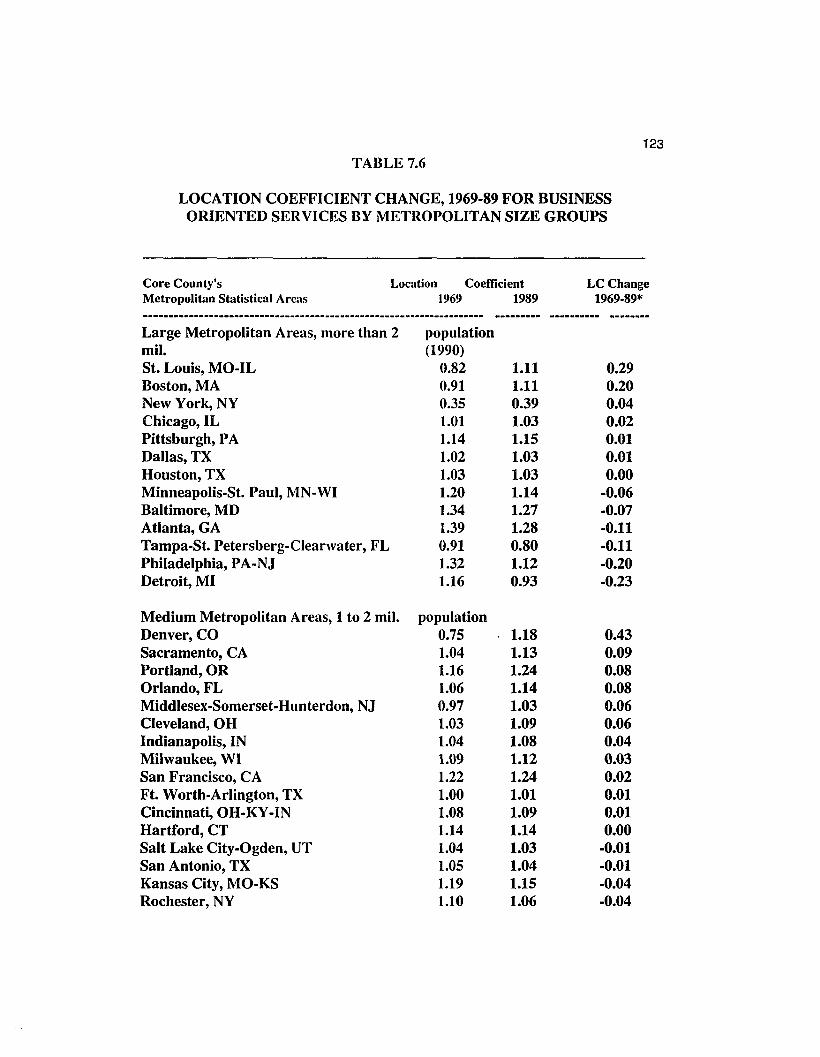
TABLE 7.6
LOCATION COEFFICIENT CHANGE, 1969-89 FOR BUSINESSORIENTED SERVICES BY METROPOLITAN SIZE GROUPS
123
Core County's Location Coefficient LCChangeMetropolitan Statistical Areas 1969 1989 1969-89*._------_._.._.__...-...._-_._------._...._-------_...----......._.- ..--_._-- .._...._-- ......--Large Metropolitan Areas, more than 2 populationmil. (1990)St. Louis, MO-IL 0.82 1.11 0.29Boston,MA 0.91 1.11 0.20New York, NY 0.35 0.39 0.04Chicago,IL 1.01 1.03 0.02Pittsburgh, PA 1.14 1.15 0.01Dallas, TX 1.02 1.03 0.01Houston, TX 1.03 1.03 0.00Minneapolis-St. Paul, MN-WI 1.20 1.14 -0.06Baltimore, MD 1.34 1.27 -0.07Atlanta, GA 1.39 1.28 -0.11Tampa-St. Petersberg-Clearwater, FL 0.91 0.80 -0.11Philadelphia, PA-NJ 1.32 1.12 -0.20Detroit, MI 1.16 0.93 -0.23
Medium Metropolitan Areas, 1 to 2 mil. populationDenver, CO 0.75 1.18 0.43Sacramento, CA 1.04 1.13 0.09Portland, OR 1.16 1.24 0.08Orlando, FL 1.06 1.14 0.08Middlesex-Somerset-Hunterdon, NJ 0.97 1.03 0.06Cleveland, 0 H 1.03 1.09 0.06Indianapolis, IN 1.04 1.08 0.04Milwaukee, WI 1.09 1.12 0.03San Francisco, CA 1.22 1.24 0.02Ft. Worth-Arlington, TX 1.00 1.01 0.01Cincinnati,OH-KY-IN 1.08 1.09 0.01Hartford, CT 1.14 1.14 0.00Salt Lake City-Ogden, UT 1.04 1.03 -0.01San Antonio, TX 1.05 1.04 -0.01Kansas City, MO-KS 1.19 1.15 -0.04Rochester, NY 1.10 1.06 -0.04

124TABLE 7.6(continued)
LOCATION COEFFICIENT.CHANGE, 1969-89 FOR BUSINESSORIENTED SERVICES BY METROPOLITAN SIZE GROUPS
Columbus, 09 1.15 1.08 -0.07New Orleans, LA 1.13 1.06 -0.07Newark,NJ 1.25 1.01 -0.24Charlotte-Gastonia-Rock Hill, NC-SC 1.72 1.31 -0.41
Small Metropolitan Areas, less than 1 mil. populationRichmond-Petersburg, VA 0.95 1.26 0.31Appleton-Oshkosh-Neenah, WI 1.10 1.26 0.16Dayton-Springfield,OH 0.96 1.09 0.13Harrisburg-Lebanon-Carlisle, PA 1.16 1.24 0.08Manchester, NH 1.00 1.07 0.07Macon-Warner Robins, GA 1.04 1.10 0.06Oklahoma City, OK 1.03 1.09 0.06Lansing-East Lansing, MI 1.13 1.18 0.05Omaha, NE-IA 1.06 1.11 0.05Memphis, TN-AR-MS 1.00 1.04 0.04Scranton-Wilkes-Barre, PA 1.04 1.08 0.04Toledo,OH 1.05 1.09 0.04Des Moines, IA 1.01 1.03 0.02Wilmington, DE-N.J-MD 1.10 1.11 0.01Syracuse, NY 1.06 1.06 0.00Hickory-Morganton, NC 1.20 1.19 -0.01Birmingham, AL 1.09 1.08 -0.01Burlington, VT 1.07 1.05 -0.02Wheeling, WV-OH 0.75 0.73 -0.02Tulsa, OK 1.07 1.05 -0.02Austin, TX 1.11 1.08 -0.03Beaumont-Port Arthur, TX 1.10 1.06 -0.04Providence, RI 1.19 1.15 -0.04Louisville, KY-IN 1.14 1.09 -0.05Albany-Schenectady-Troy, NY 1.21 1.15 -0.06Chattanooga, TN-GA 1.15 1.09 -0.06Nashville, TN 1.21 1.13 -0.08Knoxville, TN 1.31 1.22 -0.09Evansville, IN-KY 1.18 1.08 -0.10Davenport-Rock Island-Moline, IA-IL 1.42 1.30 -0.12Allentown-Bethlehem-Easton, PA-NJ 1.31 1.17 -0.14

125TABLE 7.6(continued)
LOCATION COEFFICIENT CHANGE, 1969-89 FOR BUSINESSORIENTED SERVICES BY. METROPOLITAN SIZE GROUPS
Lexington-Fayette, KY 1.28 1.14 -0.14Augusta, GA-SC 1.30 1.12 -0.18Peoria,IL 1.30 1.12 -0.18Johnson City-Kingsport-Bristol, TN-VA 1.24 1.02 -0.22Huntington-Ashland, WV-KY-OH 1.52 1.30 -0.22Greensboro-Winston-Salem-High Point, 1.32 1.09 -0.23NCRaleigh-Durham, NC 1.50 1.23 -0.27Saginaw-Bay City-Midland, MI 1.30 0.98 -0.32Greenville-Spartanbu rg, SC 1.30 0.93 -0.37Steubenvilie-Weirton,OH-WV 2.04 1.29 -0.75
* The location coefficient change values were calculated from the locationcoefficient values (four places of decimals), and then the fractions wereautomatically rounded off to two decimal places by computer (EXCELprogram).

APPENDIXB
GAUSS ECONOMETRIC PROGRAMS FORMULTIPLE REGRESSION ANALYSES

127use Isq;output file=b:\di2d1 reset;n=73;load w[n,10]=b:\dib1.asc;load x[n,10]=b:\dic1.asc;load y[n,12]=b:\did1.ascrload y1[n,9]=b:\die1.asc;load z[n,9]=b:\dif1.asc;print "Model of Decentralization (1969-79) of c-o Service";format 9,7;@ set data @cone79=w[2:n,4];@ employment of c-o service, 1979 @mpop90=w[2:n,5];@ metropolitan population, 1990 @te79=w[2:n,7]; @ total employment, 1979 @mce79=w[2:n,9];@ metro emploYment of c-o services, '79 @te69=w[2:n,10]; @ total emploYment, 1969 @mte79=x[2:n,7]; @ metropolitan total employment in 1979 @noe=y[2:n,2]; @ Northeast Region @mdw=y[2:n,3]; @ Midwest Region @w=y[2:n,4]; @ West Region @s=y[2:n,5]; @ South Region @mblk80=y[2:n,6]; @ metropolitan black population in 1980 @cone69=y[2:n,7];@ employment of c-o services, 1969 @mblk70=y[2:n,ll]; @ metropolitan black population in 1970 @cone59=y[2:n,12];@ emploYment of c-o service, 1959 @pcpc=z[2:n,2];@ percent change of metropolitan population @pinc79=z[2:n,3]; @ per capita income, 1979 @mce69=z[2:n,5];@ metro emploYment of c-o services, '69 @mte69=z[2:n,6]; @ metro total employment in 1969 @mpop70=z[2:n,7]; @ metro population, 1970 @pinc69=z[2:n,8]; @ per capita income, 1969 @mce59=z[2:n,9];@ metro employment of c-o services, '59 @@ calculate location coefficients @lo59=cone59./mce59;lor59=te59./mte59;lcon59=lo59./1or59; @ LC of c-o services, 1959 @lo69=cone69./mce69;lor69=te69./mte69;lcon69=lo69./1or69; @ LC of c-o services, 1969 @lo79=cone79./mce79;lor79=te79./mte79;lcon79=lo79./1or79; @ LC of c-o services, 1979 @mpop80=(mpop90.*100) ./(pcpc+100);Imp80=ln(mpop80) ;Imp70=ln(mpop70) ;Ipcpcon=((lmp80-lmp70) ./lmp70);@ change of metro pop. @pcclc=((lcon79-lcon69) ./lcon69);@ change of LC, 1969-79 @ainc69=pinc69.*1.978;@ expressed in constant 1979 values @inerlc=( (lcon69-lcon59) ./lcon59); @ the existing inertia @pcecon=((cone79-cone69) ./cone69);@ service emp. change @linc79=ln(pinc79) ;linc69=ln(ainc69) ;Ipccinc=((linc79-linc69) ./linc69) ;@per capita inc. change @

1281mb80=ln(mblk80) ;1mb70=ln(mblk70) ;lpcblk=((lmb80-lmb70) ./lmb70);@ change of metro black pop.@@ calculate mean and s.d of location coefficients @y59=meanc(lcon59) ;y69=meanc(lcon69) ;y79=meanc(lcon79) ipcy=meanc(pcclc);yooo=stdc(lcon59) i
yoo=stdc(lcon69);yo=stdc(lcon79) ;pcyy=stdc(pcclc) ;/*print "lcon69 lcon79";print lcon69-lcon79;*/print "mean:"iprint "lcon59 lcon69 lcon79 pCC1C"iprint y59-y69-y79-pcy;print "standard deviation:";print YOOO-YOO-YO-PCYYidep=pcclciindep=lpcpcon-pcecon-lpccinc-lpcblk-inerlc-noe-mdw-wilet ns=dep lpcpcon pcecon lpccinc lpcblk inerlc noe mdw Wi_VCOV=li_rstat=l;{b,e}=estimate(dep,indep,ns) ;@ Normality Test @print "Heteroskedasticity Test (Koenkar-Basset Test)"ione=ones(rows(dep),l) ;s2=meanc(eA2)ie2=e A2;ko=meanc((e2-s2)A2)iprint "kO"iprint ko; @ to calculate ESS/ko @let ns=e2 lpcpcon pcecon lpccinc lpcblk inerlc noe mdw W;{bb,ee}=estimate(e2,indep,ns); @ to calculate ESS @end;
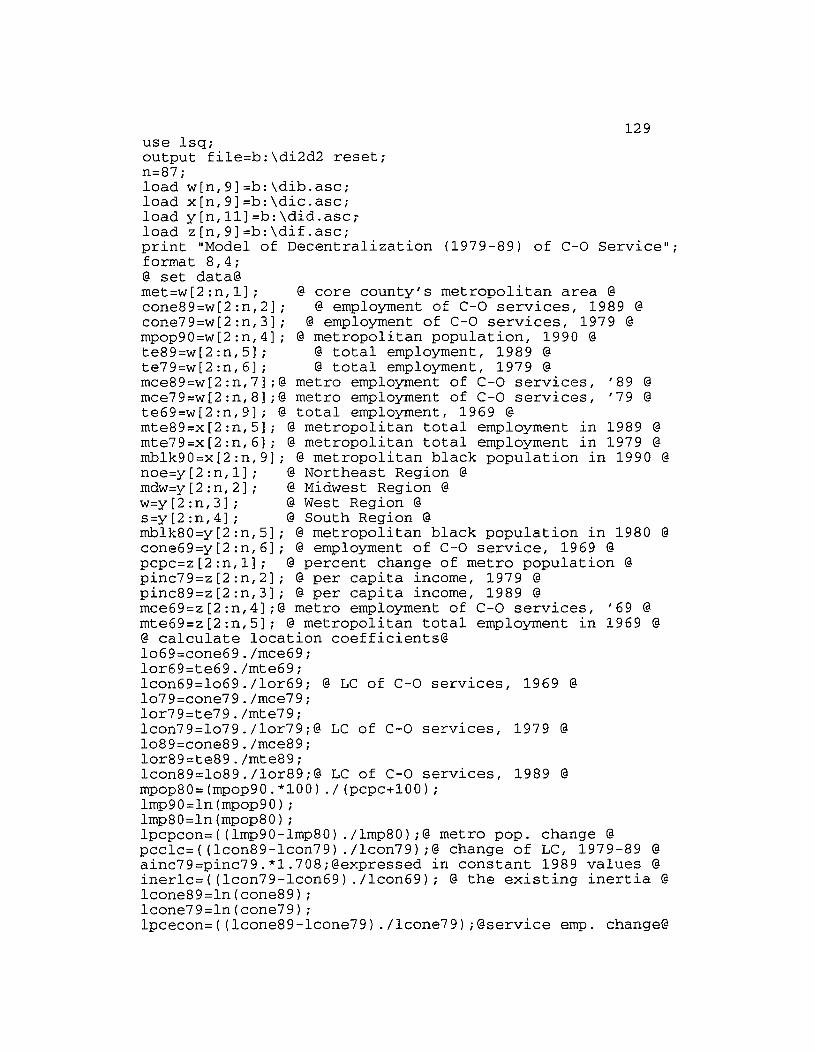
129use lsq:output file=b:\di2d2 reset:n=87;load w[n,9]=b:\dib.asc;load x[n,9]=b:\dic.asc;load y[n,ll]=b:\did.asc;load z[n,9]=b:\dif.asc:print "Model of Decentralization (1979-89) of c-o Service":format 8,4:@ set data@met=w[2:n,1]: @ core county's metropolitan area @cone89=w[2:n,2]; @ employment of c-o services, 1989 @cone79=w[2:n,3]: @ employment of c-o services, 1979 @mpop90=w[2:n,4]: @ metropolitan population, 1990 @te89=w[2:n,5]: @ total employment, 1989 @te79=w[2:n,6]: @ total employment, 1979 @mce89=w[2:n,7];@ metro employment of C-O services, '89 @mce79=w[2:n,8];@ metro employment of C-O services, '79 @te69=w[2:n,9]; @ total employment, 1969 @mte89=x[2:n,5]; @ metropolitan total employment in 1989 @mte79=x[2:n,6]; @ metropolitan total employment in 1979 @mblk90=x[2:n,9]: @ metropolitan black population in 1990 @noe=y[2:n,1]; @ Northeast Region @mdw=y[2:n,2]: @ Midwest Region @w=y[2:n,3]; @ West Region @s=y[2:n,4]: @ South Region @mblk80=y[2:n,5]: @ metropolitan black population in 1980 @cone69=y[2:n,6]: @ employment of c-o service, 1969 @pcpc=z[2:n,1]: @ percent change of metro population @pinc79=z[2:n,2]: @ per capita income, 1979 @pinc89=z[2:n,3]: @ per capita income, 1989 @mce69=z[2:n,4];@ metro emploYment of C-O services, '69 @mte69=z[2:n,5]; @ metropolitan total emploYment in 1969 @@ calculate location coefficients@lo69=cone69./mce69;lor69=te69./rnte69;Icon69=lo69./lor69; @ LC of c-o services, 1969 @lo79=cone79./mce79;lor79=te79./rnte79;lcon79=lo79./lor79;@ LC of c-o services, 1979 @lo89=cone89./mce89;lor89=te89./rnte89;lcon89=lo89./lor89;@ LC of c-o services, 1989 @mpop80=(rnpop90.*100) ./(pcpc+100):lmp90=ln(rnpop90):lrnp80=ln(mpop80) :Ipcpcon=((lmp90-lmp80) ./lmp80):@ metro pop. change @pcclc=((lcon89-lcon79) ./lcon79):@ change of LC, 1979-89 @ainc79=pinc79.*1.708:@expressed in constant 1989 values @inerlc=((lcon79-lcon69) ./lcon69): @ the existing inertia @lcone89=ln(cone89);lcone79=ln(cone79):lpcecon=((lcone89-lcone79) ./lcone79) :@service emp. change@
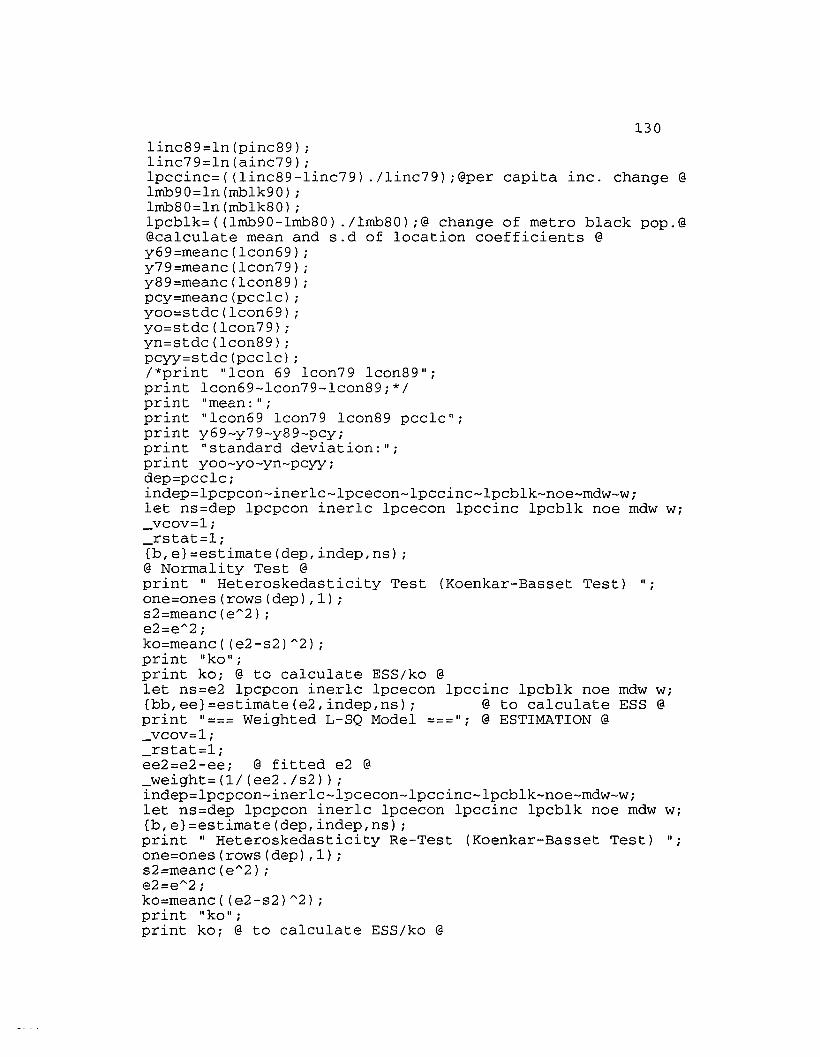
130linc89=ln(pinc89)ilinc79=ln(ainc79)iIpccinc=((linc89-linc79) ./linc79) i@per capita inc. change @Imb90=ln(mblk90)iImb80=ln(mblk80)iIpcblk=((lmb90-lmb80) ./lmb80);@ change of metro black pop.@@calculate mean and s.d of location coefficients @y69=meanc(lcon69)iy79=meanc(lcon79)iy89=meanc(lcon89)ipcy=meanc(pccIC)iyoo=stdc(lcon69)iyo=stdc(lcon79)iyn=stdc(lcon89);pcyy=stdc(pcclc)i/*print "Icon 69 Icon79 Icon89";print Icon69-lcon79-lcon89;*/print "mean:";print "lcon69 Icon79 Icon89 pcclc";print y69-y79-y89-pCYiprint "standard deviation:"iprint yoo-yo-yn-pCYYidep=pcclciindep=lpcpcon-inerlc-Ipcecon-Ipccinc-Ipcblk-noe-mdw-wilet ns=dep lpcpcon inerlc lpcecon lpccinc lpcblk noe mdw Wi_vcov=l;_rstat=l;{b,e}=estimate(dep,indep,ns) i@ Normality Test @print" Heteroskedasticity Test (Koenkar-Basset Test) ";one=ones(rows(dep),l)is2=meanc(e"2) ;e2=e"2iko=meanc((e2-s2)"2) iprint "kO"iprint kOi @ to calculate ESS/ko @let ns=e2 lpcpcon inerlc lpcecon lpccinc lpcblk noe rndw Wi{bb,ee}=estirnate(e2,indep,ns); @ to calculate ESS @print "=== Weighted L-SQ Model ==="i @ ESTIMATION @_VCOV=li_rstat=liee2=e2-eei @ fitted e2 @_weight=(1/(ee2./s2)) i
indep=lpcpcon-inerlc-Ipcecon-Ipccinc-Ipcblk-noe-rndw-wilet ns=dep lpcpcon inerlc lpcecon lpccinc lpcblk noe rndw Wi{b,e}=estirnate(dep,indep,ns) i
print" Heteroskedasticity Re-Test (Koenkar-Basset Test) "ione=ones(rows(dep),l)is2=rneanc(e"2)ie2=e"2iko=rneanc((e2-s2)"2)iprint "ko" iprint kOi @ to calculate ESS/ko @

131
let ns=e2 lpcpcon inerlc lpcecon lpccinc lpcblk noe mdw W;{bb,ee}=estirnate(e2,indep,ns); @ to calculate ESS @end;

132use lsq;output file=b:\di1g4a reset;n=51jload w[n,10]=b:\dib5a.ascjload x[n,10]=b:\dic5a.ascjload y[n,12]=b:\did5a.asc;load y1[n,10]=b:\die5a.ascjload z[n,10]=b:\dif5a.ascjload zl[n,10]=b:\diga.ascjprint "Model I of Decent. (1969-79) of 8-0 Service"jformat 8,6j@ set data@mpop90=w[2:n,5]; @ metropolitan population, 1990 @te79=w[2:n,7]j @ total employment, 1979@te69=w[2:n,10] j @ total employment, 1969 @buse79=x[2:n,3]j@buse79:employment of B-O services, 1979 @mbe79=x[2:n,5]j @ metro employment of B-O services, '79 @mte79=x[2:n,7] j @ metro total employment in 1979 @man79=x[2:n,B] j @ manufacturing employment, 1979 @noe=y[2:n,2] j @noe:Northeast Region @mdw=y[2:n,3]; @mdw:Midwest Region @w=y[2:n,4] j @w:West Region @s=y[2:n,5] j @s:South Region @mblk80=y[2:n,6]j @ metro black population in 1980 @com79=y[2:n,9] j@ emplOYment of communication, 1979 @com69=y[2:n,10]j @ emplOYment of communication, 1969 @mblk70=y[2:n,ll] j @ metro black population in 1970 @mman79=y1[2:n,2] j@ metro employment of manufacturing, '79 @man69=y1[2:n,4]j@ manufacturing employment, 1969 @mman69=y1[2:n,5] j@ metro employment of manufacturing, '69 @buse69=y1[2:n,10] j@ emplOYment of B-O services, 1969 @pcpc=z[2:n,2]j@ percent change of metropolitan population @pinc79=z[2:n,3]j @ per capita income, 1979 @mte69=z[2:n,6];@ metro total employment in 1969 @mpop70=z[2:n,7]j@ metro population, 1970 @pinc69=z[2:n,8]j @ per capita income, 1969 @mbe69=z[2:n,10]j@ metro employment of B-O services, '69 @mhqo=zl[2:n,5] j @ location of 'Fortune 500' headquarters @mhq69=zl[2:n,6]j @ sales (1969) of 'Fortune 500' firms @te64=zl[2:n,7]; @ total employment, 1964 @buse64=zl[2:n,8];@ emplOYment of B-O services, 1964 @mte64=zl[2:n,9]j@ metro total employment in 1964 @mbe64=zl[2:n,10];@ metro emplOYment of 8-0 services, '64 @@ calculate location coefficients@lo64=buse64./mbe64jlor64=te64./mte64jlcb64=lo64./1or64; @ LC of B-O services, 1964 @lo69=buse69./mbe69;lor69=te69./mte69jlcb69=lo69./1or69j@ LC of B-O services, 1969 @lo79=buse79./mbe79;lor79=te79./mte79;lcb79=lo79./1or79; @ LC of B-O services, 1979 @
133pcblc=((lcb79-lcb69) ./lcb69);@ change of LC, 1969-79 @lom69=man69./mman69;lomr69=te69./mte69;Icm69=lom69./lomr69;@ LC of manufacturing, 1969 @lom79=man79./mman79;lomr79=te79./mte79;Icm79=lom79./lomr79;@ LC of manufacturing, 1979 @pclcm=((lcm79-lcm69) ./lcm69);pceb=((buse79-buse69) ./buse69);@ service emp. change @inertia=((lcb69-lcb64) ./lcb64); @the existing inertia @mpop80=(mpop90.*100) ./(pcpc+100);pctcp=((mpop80-mpop70) ./mpop70); @ metro pop. change @ainc69=pinc69.*1.978;@ expressed in constant 1979 values @Ipinc79=ln(pinc79) ;lainc69=ln(ainc69) ;lpcinc=( (lpinc79-1ainc69) ./lainc69); @ income change @1mb80=ln(mblk80) ;Imb70=ln(mblk70) ;lpcblk=( (Imb80-lmb70) ./lmb70) ;@change of metro black pop.@@calculate mean and s.d of location coefficients @y64=meanc(lcb64) ;y69=meancilcb69) ;y79=meanc(lcb79) ;pcy=meanc(pcblc) ;yooo=stdc(lcb64) ;yoo=stdc(lcb69) ;yo=stdc(lcb79) ;pcyy=stdc(pcblc) ;/*print "lcb69 Icb79"iprint Icb69-lcb79i*/print "mean:";print "lcb64 lcb69 Icb79 pcblc";print y64-y69-y79-pcy;print "standard deviation:";print YOOO-YOO-YO-PCYYicorpsls=mhq69idep=pcblc;indep=pceb-inertia-pclcm-pctcp-Ipcinc-corpsls-Ipcblknoe-mdw-w;let ns=dep pceb inertia pclcm pctcp lpcinc corpsls lpcblknoe mdw w;_vcov=1;_rstat=1;{b,e}=estimate(dep,indep,ns);@ Normality Test @print "Heteroskedasticity Test (Breusch-Pagan Test)";one=ones(rows(dep),1);s2=meanc(eA2) ;print "s2";print s2; @ to calculate ESS/2(s2)A2 @e2=e A2;let ns=e2 pceb inertia pclcm pctcp lpcinc corpsls lpcblknoe mdw w;

134{bb,ee}=estimate(e2,indep,ns);print "=== Heteroskedasticity Test (White Test) ===";indep=pceb-inertia-pclcm-pctcp-lpcinc-corpsls-lpcblk-noemdw-w-(pcebA2)-(inertiaA2)-(pclcmA2)-(pctcpA2)-(lpcincA2)_(corpslsA2)-(lpcblkA2)-(pceb.*inertia)-(inertia.*pclcm)(pclcm.*pctcp)-(pctcp.*lpcinc)-(lpcinc.*corpsls)(corpsls.*lpcblk) ;let ns=e2 pceb inertia pclcm pctcp lpcinc corpsls Ipcblknoe mdw w pceb A 2 inertiaA2 pclcmA2 pctcpA2 lpcinc A2corpslsA2 lpcblkA2 pceb.*inertia inertia.*pclcmpclcm.*pctcp pctcp.*lpcinc lpcinc.*corpsls corpsls.*lpcblk;call estimate(e2,indep,ns);end;
135use lsqioutput file=b:\di1g4 resetin=70iload w[n,10]=b:\dib5.asc;load x[n,10]=b:\dic5.asc;load y[n,12]=b:\did5.asaiload y1[n,10]=b:\die5.asciload z[n,10]=b:\dif5.asc;load zl[n,10]=b:\dig.asc;print "Model II of Decentra. (1969-79) of B-O Service";format 8,6i@ set data@mpop90=w[2:n,5]i @ metropolitan population, 1990 @te79=w[2:n,7]i @ total employment, 1979 @te69=w[2:n,10] i @ total employment, 1969 @buse79=x[2:n,3]i @ employment of B-O services, 1979 @mbe79=x[2:n,5]; @ metro employment of B-O services, '79 @mte79=x[2:n,7]; @ metro total employment in 1979 @man79=x[2:n,8]; @ manufacturing employment, 1979 @noe=y[2:n,2]i @noe:Northeast Region @mdw=y[2:n,3]; @mdw:Midwest Region @w=y[2:n,4]; @w:West Region @s=y[2:n,5]i @s:South Region @mblk80=y[2:n,6]i @ metro black population in 1980 @com79=y[2:n,9]; @ employment of communication, 1979 @com69=y[2:n,10]; @ employment of communication, 1969 @mblk70=y[2:n,11] i @ metro black population in 1970 @mman79=y1[2:n,2] i@ metro employment of- manufacturing, '79 @man69=y1[2:n,4];@ manufacturing employment, 1969 @mman69=y1[2:n,5] i@ metro employment of manufacturing, '69 @buse69=y1[2:n,10] i @ employment of B-O services, 1969 @pcpc=z[2:n,2]i @percent change of metropolitan population @pinc79=z[2:n,3]; @per capita income, 1979 @mte69=z[2:n,6] i @ metro total employment in 1969 @mpop70=z[2:n,7]i @ metro population, 1970 @pinc69=z[2:n,8]; @per capita income, 1969 @mbe69=z[2:n,10]i@ metro employment of B-O services, '69 @mhqo=zl[2:n,5]; @location of 'Fortune 500' headquarters @mhq69=zl[2:n,6]; @sales (1969) of 'Fortune 500' firms @te64=zl[2:n,7]; @te64:total employment, 1964 @buse64=zl[2:n,8] i @ employment of B-O services, 1964 @mte64=zl[2:n,9); @ metro total employment in 1964 @mbe64=zl[2:n,10) i@ metro employment of B-O services, '64 @@ calculate location coefficients@lo64=buse64./mbe64;lor64=te64./mte64ilcb64=lo64./lor64; @ LC of B-O services, 1964 @lo69=buse69./mbe69ilor69=te69./mte69ilcb69=lo69./lor69i @ LC of B-O services, 1969 @lo79=buse79./mbe79;lor79=te79./mte79ilcb79=lo79./lor79i@ LC of B-O services, 1979 @
136
pcblc=( (lcb79-lcb69) ./lcb69)i @ change of LC, 1969-79 @lom69=man69./mman69ilomr69=te69./mte69ilcm69=lom69./lomr69i@ LC of manufacturing, 1969 @lom79=man79./mman79ilomr79=te79./mte79ilcm79=lom79./lomr79i@ LC of manufacturing, 1979 @pclcm=( (lcm79-lcm69) ./lcm69)ipceb=((buse79-buse69) ./buse69)i@ service emp. change @inertia=((lcb69-lcb64) ./lcb64); @ the existing inertia @mpop80=(mpop90.*100) ./(pcpc+100);pctcp=((mpop80-mpop70) ./mpop70);@ change of metro pop. @ainc69=pinc69.*1.978i@ expressed in constant 1979 values @lpinc79=ln(pinc79) ;lainc69=ln(ainc69) ;lpcinc=( (lpinc79-lainc69) ./lainc69);@ income change @1mb80=ln(mblk80) ;1mb70=ln(mblk70) ;lpcblk=( (lmb80-lmb70) ./lmb70) ;@change of metro black pop. @@calculate mean and s.d of location coefficients @y64=meanc(lcb64)iy69=meanc(lcb69) ;y79=meanc(lcb79)ipcy=meanc(pcblc)iyooo=stdc(lcb64) ;yoo=stdc(lcb69) ;yo=stdc(lcb79)ipcyy=stdc(pcblc) ;/*print "lcb69 lcb79";print lcb69-lcb79;*/print "mean:"iprint "lcb64 lcb69 lcb79 pcblc"iprint y64-y69-y79-pcy;print "standard deviation:";print yooo-yoo-yo-pcyy;methq=mhqo;dep=pcblc;indep=pceb-inertia-pclcm-pctcp-lpcinc-methq-lpcblk-noemdw-wilet ns=dep pceb inertia pclcm pctcp lpcinc methq lpcblknoe mdw W;_VCOV=li_rstat=l;{b,e}=estimate(dep,indep,ns) ;@ Normality Test @print" Heteroskedasticity Test (Breusch-Pagan Test) ";one=ones(rows(dep) ,1) ;s2=meanc(eA2) ;print "S2"iprint s2; @ to calculate ESS/2(s2)A2 @e2=e A2;let ns=e2 pceb inertia pclcm pctcp lpcinc methq lpcblknoe mdw Wi

137{bb,ee}=estimate(e2,indep,ns) ;print "=== Heteroskedasticity Test (White Test) ===";indep=pceb-inertia-pclcm-pctcp-lpcinc-methq-lpcblknoe-mdw-w-(pceb A2)-(inertiaA2)-(pclcmA2)-(pctcp A2)(lpcinc A2)-(lpcblkA2)-(pceb.*inertia)-(inertia.*pclcm)(pclcm.*pctcp)-(pctcp.*lpcinc}-(lpcinc.*lpcblk) ;let ns=e2 pceb inertia pclcm pctcp lpcinc methq lpcblknoe mdw w pcebA2 inertiaA2 pclcmA2 pctcpA2 lpcinc A2 lpcblkA2pceb.*inertia inertia.*pclcm pclcm.*pctcp pctcp.*lpcinclpcinc.*lpcblk;call estimate(e2,indep,ns);@ set estimation @print "=== Weighted L-SQ Model ===";_vcov=l;_rstat=l;ee2=e2-ee; @ fitted e2 @_weight=(1/(ee2./s2}) ;indep=pceb-inertia-pclcm-pctcp-lpcinc-methq-lpcblk-noemdw-w;let ns=dep pceb inertia pclcm pctcp lpcinc methq lpcblk noemdw w;{b,e}=estimate(dep,indep,ns);print" Heteroskedasticity Re-Test (Breusch-Pagan Test) ";one=ones(rows(dep},l};s2=meanc(e A2) ;print "s2";print s2; @ to calculate ESS/2(s2}A2 @e2=eA2;let ns=e2 pceb inertia pclcm pctcp lpcinc methq lpcblknoe mdw w;{bb,ee}=estimate(e2,indep,ns} ;print "=== Heteroskedasticity Re-Test (White Test) ===";indep=pceb-inertia-pclcm-pctcp-lpcinc-methq-lpcblk-noemdw-w-(pcebA2}-(inertiaA2}-(pclcmA2}-(pctcp A2}-(lpcincA2}_(lpcblkA2}-(pceb.*inertia}-(inertia.*pclcm}-(pclcm.*pctcp)(pctcp.*lpcinc}-(lpcinc.*lpcblk) ;let ns=e2 pceb inertia pclcm pctcp lpcinc methq lpcblknoe mdw w pcebA2 inertiaA2 pclcmA2 pctcpA2 lpcinc A2lpcblkA2 pceb.*inertia inertia.*pclcm pclcm.*pctcppctcp.*lpcinc lpcinc.*lpcblk;call estimate(e2,indep,ns};end;

138use lsq;output file=b:\di1g1a resetjn=53;load w[n,10]=b:\dib2a.ascjload x[n,10]=b:\dic2a.ascjload y[n,12]=b:\did2a.ascjload y1[n,10]=b:\die2a.ascjload z[n,10]=b:\dif2a.ascjload zl[n,10]=b:\dig2a.ascjprint "Model I of Decentral. (1979-89) of B-O Service";format 8,6;@ set data@mpop90=w[2:n,5]; @mpop90:metropolitan population, 1990 @te89=w[2:n,6]j @te89:total employment, 1989@te79=w[2:n,7]j @te79:total emploYment, 1979 @te69=w[2:n,10]j @te69:total employment, 1969 @buse89=x[2:n,2];@ emp. of business oriented service, 1989 @buse79=x[2:n,3];@ emp. of business oriented service, 1979 @rnbe89=x[2:n,4];@ employment of B-O service(metro area '89)@rnbe79=x[2:n,5];@ employment of B-O service(metro area '79)@mte89=x[2:n,6]; @ metropolitan total emploYment in 1989 @mte79=x[2:n,7];@ metropolitan total emploYment in 1979 @man79=x[2:n,8];@ manufacturing emploYment, 1979 @man89=x[2:n,9];@ manufacturing emploYment, 1989 @rnblk90=x[2:n,10];@ metropolitan black population in 1990 @noe=y[2:n,2]; @noe:Northeast Region @mdw=y[2:n,3]j @mdw:Midwest Region @w=y[2:n,4]; @w:West Region @s=y[2:n,5]; @s:South Region @rnblk80=y[2:n,6] j@ metro black population in 1980 @com89=y[2:n,8];@ employment of communication, 1989 @com79=y[2:n,9]j@ emploYment of communication, 1979 @rnblk70=y[2:n,11]j@ metropolitan black population in 1970 @mman79=y1[2:n,2] j@ emp. of manufacturing(metro area '79)@mman89=y1[2:n,3];@ emp. of manufacturing(metro area '89)@man69=y1[2:n,4];@ manufacturing emploYment, 1969 @mman69=y1[2:n,5]j@ emp. of manufacturing(metro area '69)@buse69=y1[2:n,10]j@ emp. of B-O service, 1969 @pcpc=z[2:n,2];@percent change of metropolitan population @pinc79=z[2:n,3]; @per capita income, 1979 @pinc89=z[2:n,4]; @per capita income, 1989 @mte69=z[2:n,6];@ metro total emploYment in 1969 @mpop70=z[2:n,7];@ metro population, 1970 @pinc69=z[2:n,8] j @per capita income, 1969 @rnbe69=z[2:n,10] j@ emp. of B-O service(metro area '69)@rnhq=zl[2:n,2]; @location of 'Fortune 500' headquarters @rnhq79=zl[2:n,3] j @sales (1979) of 'Fortune 500' firms @rnhq69=zl[2:n,6]; @sales (1969) of 'Fortune 500' firms @te64=zl[2:n,7]; @ total emplcyment, 1964 @buse64=zl[2:n,8]; @ employment of B-O service, 1964 @mte64=zl[2:n,9];@ metro total emploYment in 1964 @rnbe64=zl[2:n,10]j@ emp. of B-O service(metro area '64)@@ calculate location coefficients@
139lo64=buse64./mbe64;lor64=te64./mte64;lcb64=lo64./1or64; @ LC of B-O services, 1964 @lo69=buse69./mbe69;lor69=te69./mte69;lcb69=lo69./1or69; @ LC of B-O services, 1969 @lo79=buse79./mbe79;lor79=te79./mte79;lcb79=lo79./1or79; @ LC of B-O services, 1979 @lo89=buse89./mbe89;lor89=te89./mte89;lcb89=lo89./1or89; @ LC of B-O services, 1989 @pcblc=((lcb89-1cb79) ./lcb79); @ LC change, 1979-89 @lom69=man69./mman69;lomr69=te69./mte69;lcm69=lom69./1omr69; @ LC of manufacturing, 1969 @lom79=man79./mman79;lomr79=te79./mte79;lcm79=lom79./1omr79; @ LC of manufacturing, 1979 @lom89=man89./mman89;lomr89=te89./mte89;lcm89=lom89./1omr89; @ LC of manufacturing, 1989 @pclcm=((lcm89-1cm79) ./lcm79);pceb=((buse89-buse79) ./buse79);inertia=((lcb79-1cb69) ./lcb69); @the existing inertia @pccom=( (com89-com79) ./com79);@communications emp. change @mpop80=(mpop90.*100) ./(pcpc+100);lmpop90=ln(mpop90);lmpop80=ln(mpop80);lmpopc=( (lmpop90-lmpop80) ./lmpop80);@metro pop. change @ainc79=pinc79.*1.708;@ expressed in constant 1989 values @lpinc89=ln(pinc89) ;lainc79=ln(ainc79);lpcinc=( (lpinc89-lainc79) ./lainc79);@ income change @metblkc=((mblk90-mblk80) ./mblk80);@change of black pop. @@ calculate mean and s.d of location coefficients @y69=meanc(lcb69) ;y79=rneanc(lcb79);y89=rneanc(lcb89) ;pcy=rneanc(pcblc) ;yoo=stdc(lcb69) ;yo=stdc(lcb79) ;yn=stdc(lcb89) ;pcyy=stdc(pcblc);print "lcb69 lcb79 lcb89 pcblc";print y69-y79-y89-pcy;print "standard deviation:";print yoo-yo-yn-pcyy;corpsls=mhq79;dep=pcblc;indep=pceb-inertia-pclcrn-pccom-lrnpopc-lpcinc-corpslsmetblkc-noe-mdw-w;let ns=dep pceb inertia pclcrn pccorn lmpopc lpcinc corpsls

140metblkc noe mdw Wi_VCOV=li_rstat=li{b,e}=estimate(dep,indep,ns)iprint" Heteroskedasticity Test (Koenkar-Basset Test) "ione=ones(rows(dep),l) i
s2=meanc(e"2)ie2=e"2iko=meanc((e2-s2)"2) i
print "ko" iprint kOi @ to calculate ESS/ko @let ns=e2 pceb inertia pclcm pccom lmpopc lpcinc corpslsmetblkc noe mdw Wi{bb,ee}=estimate(e2,indep,ns) i @ to calculate ESS @endi

141use lsq;output file=b:\di1g1 reset;n=75;load w[n,10]=b:\dib2.asc;load x[n,10]=b:\dic2.asc;load y[n,12]=b:\did2.as9;load y1[n,10]=b:\die2.asc;load z[n,10]=b:\dif2.asc;load zl[n,10]=b:\dig2.asc;print "Model II of Decentr. (1979-89) of B-O Service";format 8,6;@ set data@mpop90=w[2:n,5]; @ metropolitan population, 1990 @te89=w[2:n,6]; @ total employment, 1989@te79=w[2:n,7]; @ total emploYment, 1979 @te69=w[2:n,10]; @ total employment, 1969 @buse89=x[2:n,2];@ employment of B-O service, 1989 @buse79=x[2:n,3]; @ employment of B-O service, 1979 @mbe89=x[2:n,4];@ employment of B-O service(metro area '89)@mbe79=x[2:n,5];@ employment of B-O service(metro area '79)@mte89=x[2:n,6]; @ metropolitan total emploYment in 1989 @mte79=x[2:n,7]; @ metropolitan total employment in 1979 @man79=x[2:n,8]; @ manufacturing emploYment, 1979 @man89=x[2:n,9]; @ manufacturing emploYment, 1989 @mblk90=x[2:n,10]; @ metro black population in 1990 @noe=y[2:n,2]; @ Northeast Region @mdw=y[2:n,3]; @ Midwest Region @w=y[2:n,4]; @ West Region @s=y[2:n,5]; @ South Region @mblk80=y[2:n,6]; @ metro black population in 1980 @com89=y[2:n,8]; @ employment of communication, 1989 @com79=y[2:n,9]; @ employment of communication, 1979 @mman79=y1[2:n,2] ;@emp. of manufacturing(metro area '79)@mman89=y1[2:n,3] ;@emp. of manufacturing(metro area '89)@buse69=y1[2:n,10];@emp. of business oriented service, 1969@pcpc=z[2:n,2];@percent change of metropolitan population @pinc79=z[2:n,3]; @per capita income, 1979 @pinc89=z[2:n,4]; @per capita income, 1989 @mte69=z[2:n,6]; @ metro total employment in 1969 @mbe69=z[2:n,10];@emploYment of B-O service(metro area '69)@mhq=zl[2:n,2]; @location of 'Fortune 500' headquarters @@ calculate location coefficients@lo69=buse69./mbe69ilor69=te69./mte69;lcb69=lo69./lor69;@ LC of business oriented service, 1969 @lo79=buse79./mbe79;lor79=te79./mte79;lcb79=lo79./lor79;@ LC of business oriented service, 1979 @lo89=buse89./mbe89;lor89=te89./mte89;lcb89=lo89./lor89;@ LC of business oriented service, 1989 @pcblc=((lcb89-lcb79l ./lcb79); @change of LC, 1979-89 @lom79=man79./mman79i

142lomr79=te79./mte79;lcm79=lom79./lomr79i @ LC of manufacturing, 1979 @lom89=man89./mman89ilomr89=te89./mte89ilcm89=lom89./lomr89i @ LC of manufacturing, 1989 @pclcm=((lcm89-lcm79) ./lcm79);pceb=((buse89-buse79) ./buse79);inertia=((lcb79-lcb69) ./lcb69); @the existing inertia @pccom=((com89-com79) ./com79);@ communications emp. change @mpop80=(mpop90.*100) ./(pcpc+100);lmpop90=ln(mpop90)ilmpop80=ln (mpop80) ;lmpopc=((lmpop90-lmpop80} ./lmpop80);@ metro pop. change @ainc79=pinc79.*1.708i@ expressed in constant 1989 values @lpinc89=ln(pinc89);lainc79=ln(ainc79);lpcinc=((lpinc89-lainc79) ./lainc79);@ income change @metblkc=((mblk90-mblk80) ./mblk80);@ change of black pop. @@ calculate mean and s.d of location coefficients @y69=meanc(lcb69) ;y79=meanc(lcb79);y89=meanc(lcb89) ;pcy=meanc(pcblc);yoo=stdc(lcb69}iyo=stdc(lcb79) ;yn=stdc (lcb89) ;pcyy=stdc(pcblc};/*print "lcb79 lcb89";print lcb79-lcb89-lmpopc;*/print "mean:";print "lcb69 lcb79 lcb89 pcblc";print y69-y79-y89-pcy;print "standard deviation:";print yoo-yo-yn-pcyy;methq=rnhq;dep=pcblc;indep=pceb-inertia-pclcm~pccom-lmpopc-lpcinc-methq
metblkc-noe-mdw-w;let ns=dep pceb inertia pclcm pccom lmpopc lpcinc methqmetblkc noe mdw w;_vcov=l;_rstat=l;{b,e}=estimate(dep,indep,ns);print" Heteroskedasticity Test (Koenkar-Basset Test) ";one=ones(rows(dep),l) ;s2=meanc(e"2) ;e2=e"2;ko=meanc((e2-s2)"2) ;print "ko";print ko; @ to calculate ESS/ko @let ns=e2 pceb inertia pclcm pccom lmpopc Ipcinc methqmetblkc noe mdw w;{bb,ee}=estimate(e2,indep,ns); @ to calculate ESS @

end;143

144
use Isq;output file=b:\di2d3 reset;n=73;load w[n,10]=b:\dib1.asc;load x[n,10]=b:\dic1.asc;load y[n,12]=b:\did1.as~i
load y1[n,9]=b:\die1.asc;load z[n,9]=b:\dif1.asc;print "Model of Decentr. (1969-89) of c-o Service";format 8,4;@ set data@cone89=w[2:n,3]; @ employment of C-O service, 1989 @cone79=w[2:n,4]i@ employment of c-o service, 1979 @mpop90=w[2:n,5]; @ metropolitan population, 1990 @te89=w[2:n,6]; @ total employment, 1989 @te79=w[2:n,7]; @ total employment, 1979 @mce89=w[2:n,8];@ employment of C-O service(metro area '89)@mce79=w[2:n,9];@ employment of C-O service(metro area '79)@te69=w[2:n,10]; @ total employment, 1969 @mte89=x[2:n,6];@ metropolitan total employment in 1989 @mte79=x[2:n,7];@ metropolitan total employment in 1979 @mblk90=x[2:n,10];@ metropolitan black population in 1990 @noe=y[2:n,2]; @ Northeast Region @mdw=y[2:n,3]; @ Midwest Region @w=y[2:n,4]; @ West Region @s=y[2:n,5]; @ South Region @mblk80=y[2:n,6]; @ metro black population in 1980 @cone69=y[2:n,7];@ employment of c-o service, 1969 @mblk70=y[2:n,11];@ metro black population in 1970 @cone59=y[2:n,12];@ employment of c-o service, 1959 @te59=y1[2:n,7]i @ total employment, 1959 @mte59=y1[2:n,8]; @ metro total employment in 1959 @pcpc=z[2:n,2];@ percent change (1980-1990) of metro pop. @pinc79=z[2:n,3]; @ per capita income, 1979 @pinc89=z[2:n,4]; @ per capita income, 1989 @mce69=z[2:n,5];@ employment of C-O service(metro area '69)@mte69=z[2:n,6]; @metropolitan total employment in 1969 @mpop70=z[2:n,7]; @ metropolitan population, 1970 @pinc69=z[2:n,8]; @per capita income, 1969 @mce59=z[2:n,9]i@ employment of C-O service(metro area '59)@@ calculate location coefficients@lo59=cone59./mce59ilor59=te59./mte59;lcon59=lo59./1or59;@ LC of consumer oriented service, 1959@lo69=cone69./mce69;lor69=te69./mte69;lcon69=lo69./1or69;@ LC of consumer oriented service, 1969@lo79=cone79./mce79;lor79=te79./mte79;lcon79=lo79./1or79;@ LC of consumer oriented service, 1979@lo89=cone89./mce89;lor89=te89./mte89;lcon89=lo89./1or89i@ LC of consumer oriented service, 1989@

145lmp90=ln(mpop90);lmp70=ln(mpop70);lpcpcon=((lmp90-lmp70) ./lmp70);@ change of metro pop. @pcclc=((lcon89-lcon69) ./lcon69); @change of Le, 1969-89 @ainc69=pinc69.*3.379;@ expressed in constant 1989 values @inerlc=((lcon79-lcon59) ./lcon59); @the existing inertia @pcecon=((cone89-cone69) :/cone69); @ service emp. change @linc89=ln(pinc89) ;linc69=ln(ainc69);lpccinc=((linc89-linc69) ./linc69); @ income change @pcblk=((rnblk90-rnblk70) ./rnblk70);@ change of black pop. @@calculate mean and s.d of location coefficients @y59=meanc(lcon59) ;y69=meanc(lcon69) ;y79=meanc(lcon79) ;y89=meanc(lcon89) ;pcy=meanc(pcclc);yooo=stdc(lcon59) ;yoo=stdc(lcon69};yo=stdc(lcon79);yn=stdc(lcon89) j
pcyy=stdc(pcclc) ;print "mean:";print "lcon59 Icon69 Icon79 Icon89 pcclc";print y59-y69-y79-y89-pcy;print "standard deviation:";print yooo-yoo-yo-yn-pcyy;dep=pcclc;indep=lpcpcon-inerlc-pcecon-Ipccinc-pcblk-noe-mdw-w;let ns=dep lpcpcon inerlc pcecon lpccinc pcblk noe mdw w;_vcov=l;_rstat=l;{b,e}=estimate(dep,indep,ns);print "Heteroskedasticity Test (Breusch-Pagan Test)";one=ones(rows(dep),l) ;s2=meanc(e"'2);print "s2";print s2; @ to calculate ESS/2(s2)"'2 @e2=e"'2jlet ns=e2 lpcpcon inerlc pcecon Ipccinc pcblk noe mdw w;{bb,ee}=estimate(e2,indep,ns);print" Heteroskedasticity Test (White Test) ";indep=lpcpcon-inerlc-pcecon-Ipccinc-pcblk-noe-mdw-w(lpcpcon"'2)-(inerlc"'2)-(pcecon"'2)-(lpccinc"'2)-(pcblk"'2)(lpcpcon.*inerlc)-(inerlc.*pcecon)-(pcecon.*lpccinc)(lpccinc.*pcblk);let ns=e2 lpcpcon inerlc pcecon Ipccinc pcblk noe mdw wlpcpcon"'2 inerlc"'2 pcecon"'2 Ipccinc"'2 pcblk"'2lpcpcon.*inerlc inerlc.*pcecon pcecon.*lpccinclpccinc.*pcblk;call estimate(e2,indep,ns);print "=== Weighted L-SQ Model ==="; @ ESTIMATION @

_vcov=l; 146_rstat=l;ee2=e2-ee; @ fitted e2 @_weight=(1/(ee2./s2)) ;indep=lpcpcon-inerlc-pcecon-lpccinc-pcblk-noe-rndw-w;let ns=dep lpcpcon inerlc pcecon lpccinc pcblk noe rndw w;{b,e}=estirnate(dep,indep,ns);print" Heteroskedasticity Re-Test (Breusch-Pagan Test) ";one=ones(rows(dep),l) ;s2=rneanc(e"2) ;print "s2";print s2; @ to calculate ESS/2(s2)"2 @e2=e"2;let ns=e2 Ipcpcon inerlc pcecon Ipccinc pcblk noe rndw w;{bb,ee}=estirnate(e2,indep,ns) ;print "=== Heteroskedasticity Re-Test (White Test) ===";indep=lpcpcon-inerlc-pcecon-lpccinc-pcblk-noe-rndw-w(lpcpcon"2)-(inerlc"2)-(pcecon"2)-(lpccinc"2)-(pcblk"2)(lpcpcon.*inerlc)-(inerlc.*pcecon)-(pcecon.*lpccinc)(lpccinc.*pcblk) ;let ns=e2 lpcpcon inerlc pcecon Ipccinc pcblk noe rndw wIpcpcon"2 inerlc"2 pcecon"2 Ipccinc"2 pcblk"2lpcpcon.*inerlc inerlc.*pcecon pcecon.*lpccincIpccinc.*pcblk;call estirnate(e2,indep,ns);end;
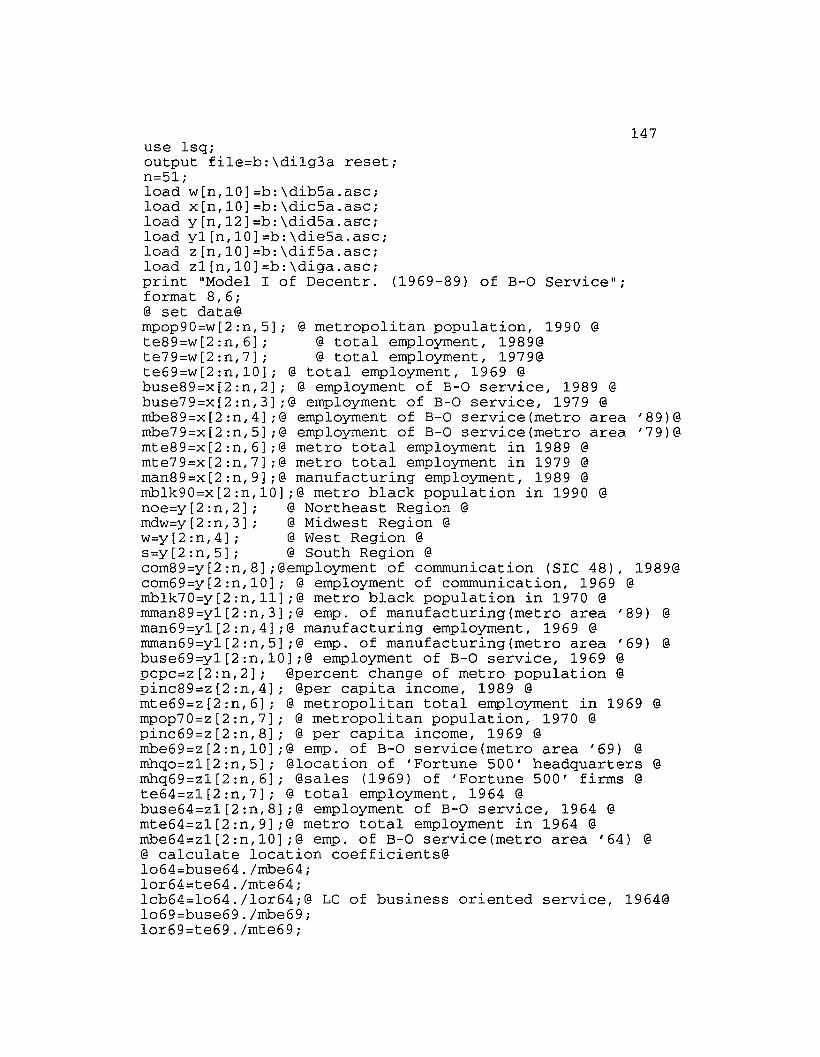
147use lsq;output file=b:\di1g3a reset;n=51;load w[n,10]=b:\dib5a.asc;load x[n,10]=b:\dic5a.asc;load y[n,12]=b:\did5a.asc;load y1[n,10]=b:\die5a.asc;load z[n,10]=b:\dif5a.asc;load zl[n,10]=b:\diga.asc;print "Model I of Decentr. (1969-89) of B-O Service";format 8,6;@ set data@mpop90=w[2:n,5]; @ metropolitan population, 1990 @te89=w[2:n,6]; @ total employment, 1989@te79=w[2:n,7]; @ total employment, 1979@te69=w[2:n,10]; @ total employment, 1969 @buse89=x[2:n,2]; @ employment of B-O service, 1989 @buse79=x[2:n,3];@ employment of B-O service, 1979 @mbe89=x[2:n,4];@ employment of B-O service(metro area '89)@mbe79=x[2:n,5];@ employment of B-O service(metro area '79)@mte89=x[2:n,6];@ metro total employment in 1989 @mte79=x[2:n,7];@ metro total employment in 1979 @man89=x[2:n,9];@ manufacturing employment, 1989 @mblk90=x[2:n,10];@ metro black population in 1990 @noe=y[2:n,2]; @ Northeast Region @mdw=y[2:n,3]; @ Midwest Region @w=y[2:n,4]; @ West Region @s=y[2:n,5]; @ South Region @com89=y[2:n,8];@employment of communication (SIC 48), 1989@com69=y[2:n,10]; @ employment of communication, 1969 @mblk70=y[2:n,ll]i@ metro black population in 1970 @mman89=y1[2:n,3];@ emp. of manufacturing(metro area '89) @man69=y1[2:n,4];@ manufacturing employment, 1969 @mman69=y1[2:n,5];@ emp. of manufacturing(metro area '69) @buse69=y1[2:n,10];@ employment of B-O service, 1969 @pcpc=z[2:n,2]; @percent change of metro population @pinc89=z[2:n,4]; @per capita income, 1989 @mte69=z[2:n,6]; @ metropolitan total employment in 1969 @mpop70=z[2:n,7]; @ metropolitan population, 1970 @pinc69=z[2:n,8]; @ per capita income, 1969 @mbe69=z[2:n,10];@ emp. of B-O service(metro area '69) @mhqo=zl[2:n,5]; @location of 'Fortune 500' headquarters @mhq69=zl[2:n,6]; @sales (1969) of 'Fortune 500' firms @te64=zl[2:n,7]; @ total employment, 1964 @buse64=zl[2:n,8]i@ employment of B-O service, 1964 @mte64=zl[2:n,9];@ metro total employment in 1964 @mbe64=zl[2:n,10];@ emp. of B-O service(metro area '64) @@ calculate location coefficients@lo64=buse64./mbe64;lor64=te64./mte64;lcb64=lo64./lor64;@ LC of business oriented service, 1964@lo69=buse69./mbe69;lor69=te69./mte69;
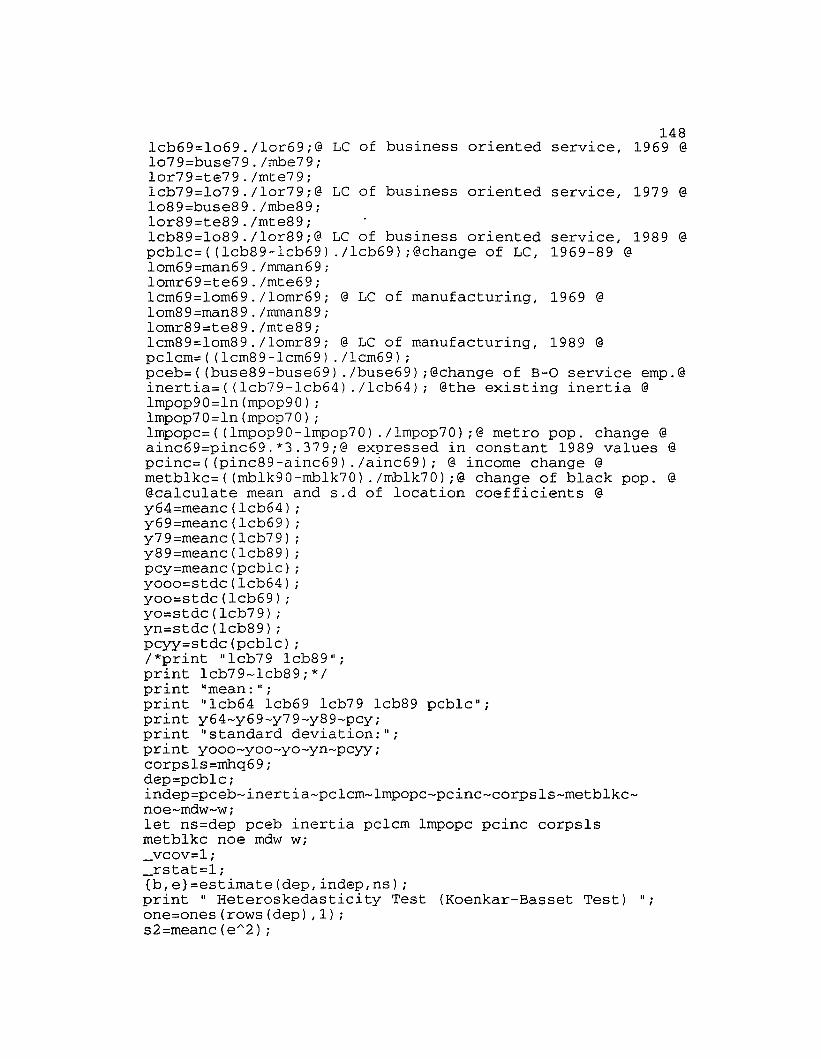
148lcb69=lo69./lor69;@ LC of business oriented service, 1969 @lo79=buse79./mbe79;lor79=te79./mte79;lcb79=lo79./lor79;@ LC of business oriented service, 1979 @lo89=buse89./mbe89;lor89=te89./mte89;lcb89=lo89./lor89;@ LC of business oriented service, 1989 @pcblc=((lcb89-lcb69) ./lcb69);@change of LC, 1969-89 @lom69=man69./rnrnan69ilomr69=te69./mte69;lcm69=lom69./lomr69; @ LC of manufacturing, 1969 @lom89=man89./rnrnan89;lomr89=te89./mte89;lcm89=lom89./lomr89; @ LC of manufacturing, 1989 @pclcm=((lcm89-lcm69) ./lcm69);pceb=((buse89-buse69) ./buse69) ;@change of B-O service emp.@inertia=((lcb79-lcb64) ./lcb64); @the existing inertia @lmpop90=ln(mpop90) ;lmpop70=ln(mpop70);lmpopc=((lmpop90-lmpop70) ./lmpop70);@ metro pop. change @ainc69=pinc69.*3.379;@ expressed in constant 1989 values @pcinc=((pinc89-ainc69) ./ainc69); @ income change @metblkc=((rnblk90-mblk70) ./rnblk70);@ change of black pop. @@calculate mean and s.d of location coefficients @y64=meanc(lcb64) ;y69=meanc(lcb69) ;y79=meanc(lcb79) ;y89=meanc(lcb89) ;pcy=meanc(pcblc) ;yooo=stdc(lcb64) ;yoo=stdc(lcb69);yo=stdc(lcb79) ;yn=stdc(lcb89) ;pcyy=stdc(pcblc) ;/*print "lcb79 lcb89";print lcb79-lcb89;*/print "mean:";print "lcb64 lcb69 lcb79 lcb89 pcblc";print y64-y69-y79-y89-pcy;print "standard deviation:";print yooo-yoo-yo-yn-pcyy;corpsls=rnhq69;dep=pcblc;indep=pceb-inertia-pclcm-lmpopc-pcinc-corpsls-metblkcnoe-mdw-w;let ns=dep pceb inertia pclcm lmpopc pcinc corpslsmetblkc noe mdw w;_vcov=l;_rstat=l;{b,e}=estimate(dep,indep,ns) ;print" Heteroskedasticity Test (Koenkar-Basset Test) ";one=ones(rows(dep) ,1) ;s2=meanc(e A 2) ;
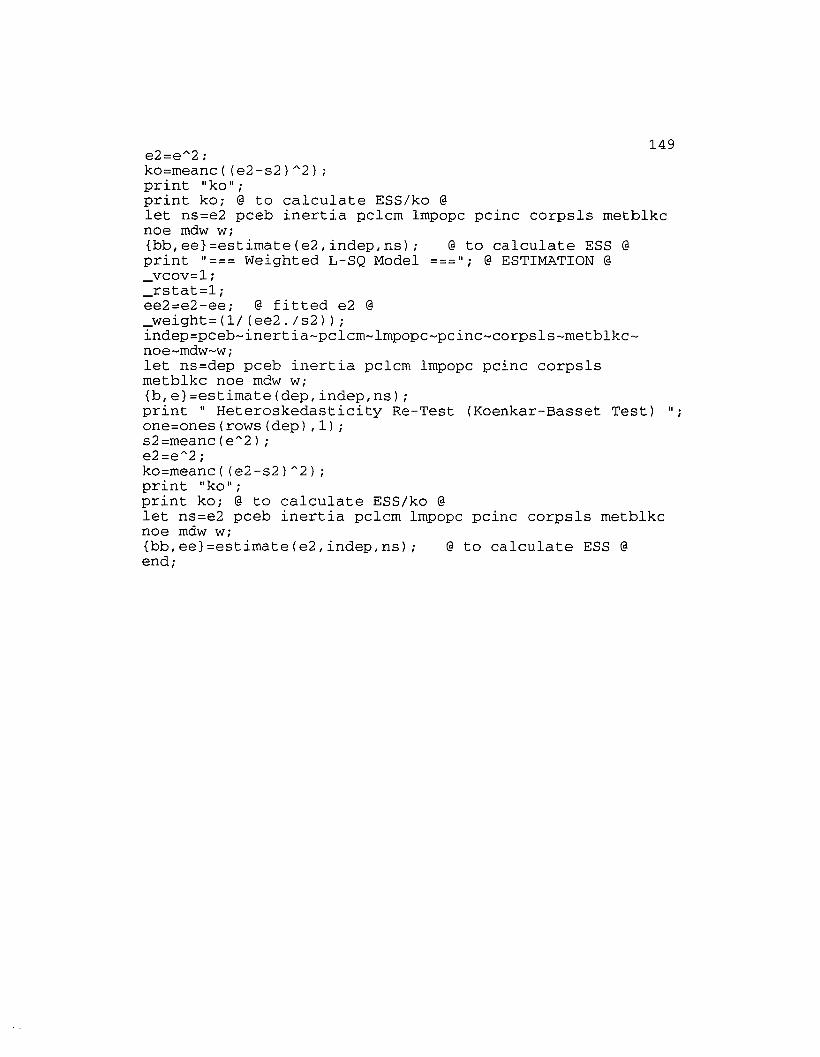
149e2=e"2iko=meanc((e2-s2)"2) ;print "ko";print ko; @ to calculate ESS/ko @let ns=e2 pceb inertia pclcm lmpopc pcinc corpsls metblkcnoe mdw W;{bb,ee}=estimate(e2,indep,ns); @ to calculate ESS @print "=== Weighted L-SQ Model ==="; @ ESTIMATION @_vcov=l;_rstat=l;ee2=e2-ee; @ fitted e2 @_weight=(1/(ee2./s2)) ;indep=pceb-inertia-pclcm-lmpopc-pcinc-corpsls-metblkcnoe-mdw-w;let ns=dep pceb inertia pclcm lmpopc pcinc corpslsmetblkc noe mdw W;{b,e}=estimate(dep,indep,ns);print " Heteroskedasticity Re-Test (Koenkar-Basset Test)one=ones(rows(dep),l) ;s2=meanc(e"2) ;e2=e"2 ;ko=meanc((e2-s2)A2);print "ko";print ko; @ to calculate ESS/ko @let ns=e2 pceb inertia pclcm lmpopc pcinc corpsls metblkcnoe mdw W;{bb,ee}=estimate(e2,indep,ns); @ to calculate ESS @end;
" .,
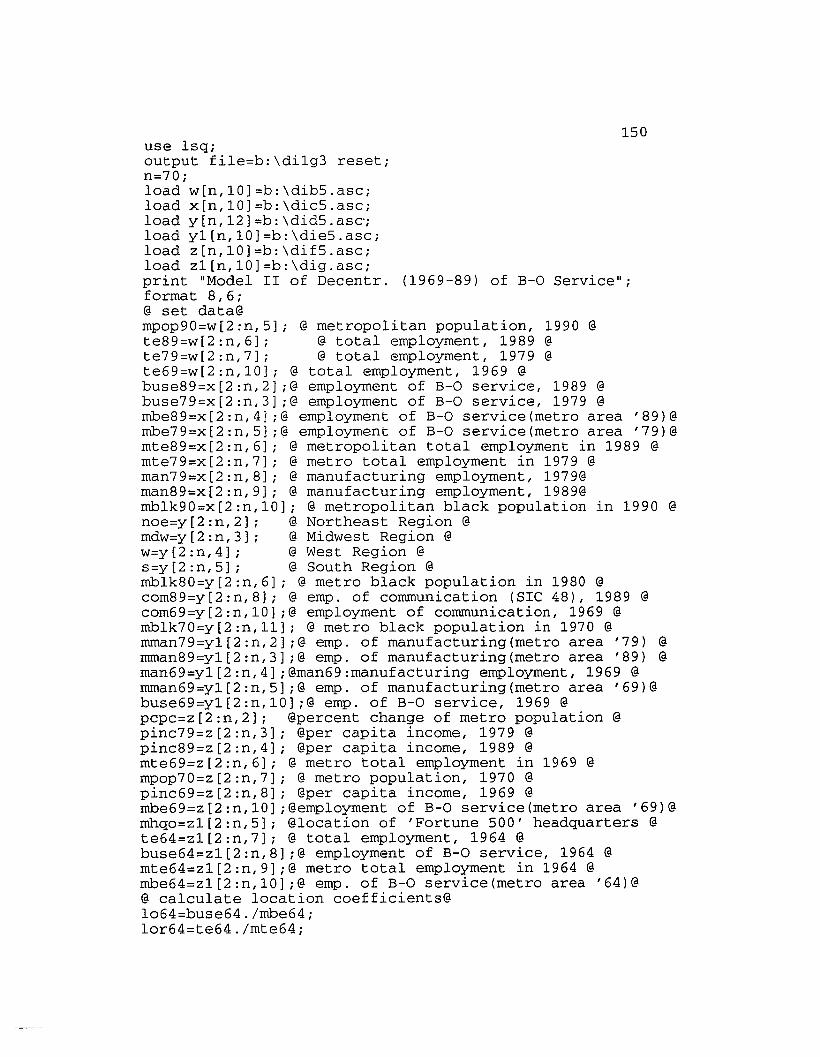
150use lsq;output file=b:\di1g3 reset;n=70;load w[n,10]=b:\dib5.asc;load x[n,10]=b:\dic5.asc;load y[n,12]=b:\did5.asc;load y1[n,10]=b:\die5.asc;load z[n,10]=b:\dif5.asciload zl[n,10]=b:\dig.asciprint "Model II of Decentr. (1969-89) of B-O Service"iformat 8,6i@ set data@mpop90=w[2:n,5]i @ metropolitan population, 1990 @te89=w[2:n,6]; @ total employment, 1989 @te79=w[2:n,7]; @ total employment, 1979 @te69=w[2:n,10]; @ total employment, 1969 @buse89=x[2:n,2];@ employment of B-O service, 1989 @buse79=x[2:n,3] i@ employment of B-O service, 1979 @mbe89=x[2:n,4];@ employment of B-O service(metro area '89)@mbe79=x[2:n,5] i@ employment of B-O service(metro area '79)@mte89=x[2:n,6]; @ metropolitan total employment in 1989 @mte79=x[2:n,7]; @ metro total employment in 1979 @man79=x[2:n,8]i @ manufacturing employment, 1979@man89=x[2:n,9]i @ manufacturing employment, 1989@mblk90=x[2:n,10]; @ metropolitan black population in 1990 @noe=y[2:n,2]i @ Northeast Region @mdw=y[2:n,3]; @ Midwest Region @w=y[2:n,4] i @ West Region @s=y[2:n,5] i @ South Region @mblk80=y[2:n,6]; @ metro black population in 1980 @com89=y[2:n,8]i @ emp. of communication (SIC 48), 1989 @com69=y[2:n,10] i@ employment of communication, 1969 @mblk70=y[2:n,11]; @ metro black population in 1970 @mman79=y1[2:n,2];@ emp. of manufacturing(metro area '79) @mman89=y1[2:n,3];@ emp. of manufacturing(metro area '89) @man69=y1[2:n,4] i@man69:manufacturing employment, 1969 @mman69=y1[2:n,5];@ emp. of manufacturing(metro area '69)@buse69=y1[2:n,10];@ emp. of B-O service, 1969 @pcpc=z[2:n,2]i @percent change of metro population @pinc79=z[2:n,3] i @per capita income, 1979 @pinc89=z[2:n,4] i @per capita income, 1989 @mte69=z[2:n,6]i @ metro total employment in 1969 @mpop70=z[2:n,7]; @ metro population, 1970 @pinc69=z[2:n,8] i @per capita income, 1969 @mbe69=z[2:n,10] i@employment of B-O service(metro area '69)@mhqo=zl[2:n,5] i @location of 'Fortune 500' headquarters @te64=zl[2:n,7]i @ total employment, 1964 @buse64=zl[2:n,8];@ employment of B-O service, 1964 @mte64=zl[2:n,9Ji@ metro total employment in 1964 @mbe64=zl[2:n,10] i@ emp. of B-O service(metro area '64)@@ calculate location coefficients@lo64=buse64./mbe64;lor64=te64./mte64;

151lcb64=lo64./lor64;@ LC of business oriented service, 1964@lo69=buse69./mbe69;lor69=te69./mte69;lcb69=lo69./lor69;@ LC of business oriented service, 1969@lo79=buse79./mbe79;lor79=te79./mte79;lcb79=lo79./lor79;@ LC of business oriented service, 1979@lo89=buse89./mbe89;lor89=te89./mte89;lcb89=lo89./lor89;@ LC of business oriented service, 1989@pcblc=((lcb89-lcb69) ./lcb69);@change of LC, 1969-89@lom69=man69./mman69;lomr69=te69./mte69;lcm69=lom69./lomr69;@ LC of manufacturing, 1969 @lom79=man79./mman79;lomr79=te79./mte79;lcm79=lom79./lomr79;@ LC of manufacturing, 1979 @lom89=man89./mman89;lomr89=te89./mte89;lcm89=lom89./lomr89;@ LC of manufacturing, 1989 @pclcm=((lcm89-lcm69) ./lcm69);pceb=((buse89-buse69) ./buse69) ;@change of B-O service emp.@inertia=((lcb79-lcb64) ./lcb64); @the existing inertia @lmpop90=ln(mpop90);lmpop70=ln(mpop70) ;lmpopc=((lmpop90-lmpop70) ./lmpop70);@ metro pop. change @ainc69=pinc69.*3.379;@ expressed in constant 1989 values @pcinc=((pinc89-ainc69) ./ainc69);@ income change @metblkc=((mblk90-mblk70) ./mblk70);@ change of black pop. @@calculate mean and s.d of location coefficients @y64=meanc(lcb64);y69=meanc(lcb69);y79=meanc(lcb79);y89=meanc(lcb89);pcy=meanc(pcblc);yooo=stdc(lcb64);yoo=stdc(lcb69) ;yo=stdc(lcb79) ;yn=stdc(lcb89) ;pcyy=stdc(pcblc);print "mean:";print "lcb64 lcb69 lcb79 lcb89 pcblc";print y64-y69-y79-y89-pcy;print "standard deviation:";print yooo-yoo-yo-yn-pcyy;methq=mhqoidep=pcblc;indep=pceb-inertia-pclcm-lmpopc-pcinc-methq-metblkcnoe-mdw-wilet ns=dep pceb inertia pclcm lmpopc pcinc methq metblkcnoe mdw Wi_VCOV=li_rstat=l;
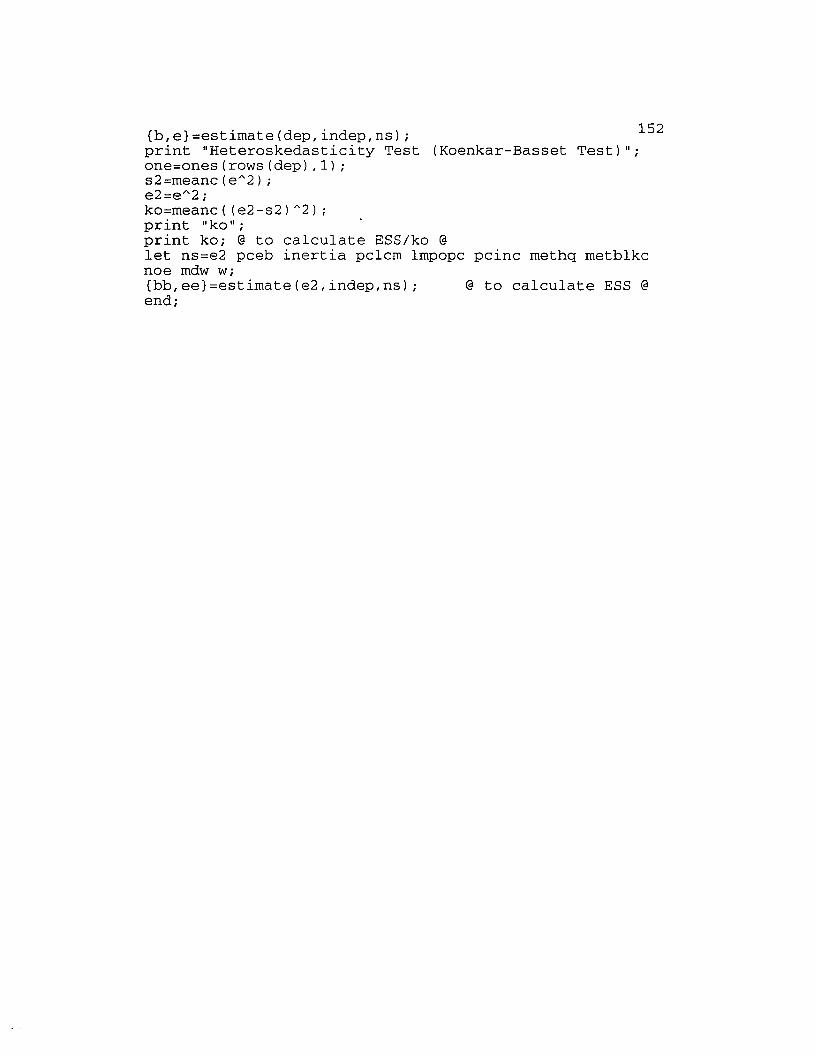
152
@ to calculate ESS @
{b,e}=estimate(dep,indep,ns);print "Heteroskedasticity Test (Koenkar-Basset Test)";one=ones(rows(dep),l) ;s2=meanc(e A 2) ;e2=e A 2;ko=meanc((e2-s2)A2) ;print "ko";print ko; @ to calculate ESS/ko @let ns=e2 pceb inertia pclcm lmpopc pcinc methq metblkcnoe mdw W;{bb,ee}=estimate(e2,indep,ns) ;end;

APPENDIXC
DATA FOR REGRESSION MODELS
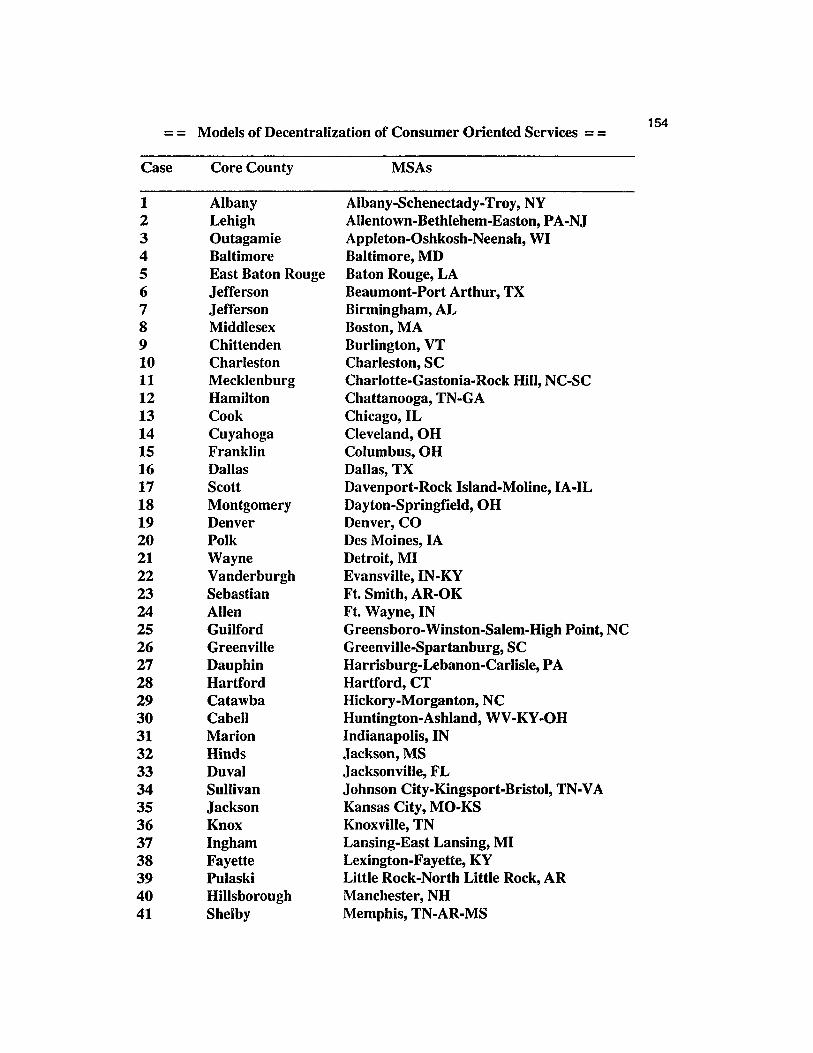
Models of Decentralization of Consumer Oriented Services = =154
Case
1234567891011121314151617181920212223242526272829303132333435363738394041
Core County
AlbanyLehighOutagamieBaltimoreEast Baton RougeJeffersonJeffersonMiddlesexChittendenCharlestonMecklenburgHamiltonCookCuyahogaFranklinDallasScottMontgomeryDenverPolkWayneVanderburghSebastianAllenGuilfordGreenvilleDauphinHartfordCatawbaCabellMarionHindsDuvalSullivanJacksonKnoxInghamFayettePulaskiHillsboroughShelby
MSAs
Albany-Schenectady-Troy, NYAllentown-Bethlehem-Easton, PA-NJAppleton-Oshkosh-Neenah, WIBaltimore, MDBaton Rouge, LABeaumont-Port Arthur, TXBirmingham, ALBoston, MABurlington, VTCharleston, SCCharlotte-Gastonia-Rock Hill, NC-SCChattanooga, TN-GAChicago,ILCleveland,OHColumbus, OHDallas, TXDavenport-Rock Island-Moline, IA-ILDayton-Springfield,OHDenver, CODes Moines, IADetroit, MIEvansville,IN-KYFt. Smith, AR-OKFt. Wayne, INGreensboro-Winston-Salem-High Point, NCGreenville-Spartanburg, SCHarrisburg-Lebanon-Carlisle, PAHartford, CTHickory-Morganton, NCHuntington-Ashland, WV-KY-OHIndianapolis, INJackson, MSJacksonville, FLJohnson City-Kingsport-Bristol, TN-VAKansas City, MO-KSKnoxville, TNLansing-East Lansing, MILexington-Fayette, KYLittle Rock-North Little Rock, ARManchester, NHMemphis, TN-AR-MS

155
Case Core County MSAs
(continued)
42 Middlesex Middlesex-Somerset-Hunterdon, NJ43 Milwaukee Milwaukee, WI44 Hennepin Minneapolis-St. Paul, MN-WI45 Montgomery Montgomery, AL46 Davidson Nashville, TN47 Orleans New Orleans, LA48 Essex Newark, NJ49 Oklahoma Oklahoma City, OK50 Douglas Omaha, NE-IA51 Orange Orlando, FL52 Peoria Peoria,IL53 Philadelphia Philadelphia, PA-NJ54 Allegheny Pittsburgh, PA55 Multnomah Portland, OR56 Providence Providence, RI57 Wake Raleigh-Durham, NC58 Monroe Rochester, NY59 Sacramento Sacramento, CA60 Saginaw Saginaw-Bay City-Midland, MI61 Stearns St. Cloud, MN62 St. Louis St. Louis, MO-IL63 Salt Lake Salt Lake City-Ogden, UT64 San Francisco San Francisco, CA65 Luzerne Scranton-Wilkes-Barre, PA66 Jefferson Steubenville-Weirton,OH-WV67 Onondaga Syracuse, NY68 Pinellas Tampa-St. Petersberg-Clearwater, FL69 Lucas Toledo,OH70 Tulsa Tulsa, OK71 Belmont Wheeling, WV-OH72 New Castle Wilmington, DE-NJ-MD

156
Models of Decentralization of Consumer Oriented Services
case leon 59 Icon69 Icon79 Icon89 mpop70 mpop90 pcpc----------------------------------------------------------------------1 1.158 1.104 1. 026 0.8992 8.10ge+05 8.743e+05 4.6002 1. 208 1.224 1.1.11 1. 023 5.941e+05 6.867e+05 8.1003 1. 097 1. 069 1.065 1. 068 2.76ge+05 3.151e+05 8.2004 1. 049 0.924 0.732 0.6783 2.08ge+06 2.382e+06 8.3005 0.9797 0.9941 1. 016 0.9999 3.756e+05 5.283e+05 6.9006 0.9978 1. 045 0.9821 0.9867 3.45ge+05 3.612e+05 -3.200'7 0.9948 0.9886 1.002 0.9827 7.941e+05 9.078e+05 2.7008 0.9791 0.9850 0.9478 0.8652 4.791e+06 2.871e+06 2.3009 0.9517 0.9684 0.9881 0.9798 1.340e+OS 1.771e+05 14.0010 1.033 1. 036 1. 049 1. 025 3.361e+05 5.06ge+05 17.8011 1.221 1. 214 1.080 0.9719 8.403e ... 05 1.162e+06 19.6012 1.034 1. 023 1. 020 1. 018 3.494e+05 4.332e+05 1. 60013 0.9896 0.9822 0.9806 0.9802 6.096e ... 06 6.070e+06 0.20014 0.9861 0.9829 0.9645 0.9500 2.064e·06 1.831e+06 -3.60015 1.005 1. 017 1.035 1. 016 1. 14'?e ... 06 1.377e+06 10.7016 0.9730 0.9744 0.9688 0.9443 1.S56e+06 2.553e+06 30.4017 1.156 1.003 1. 030 1. 006 3.626e+05 3.50ge+05 -8.80018 0.9610 0.9571 0.9899 0.9697 9.727e+05 9.513e+05 1. 00019 0.9950 0.8888 0.8215 0.5100 1.104e+06 1.623e+06 13.6020 0.9702 0.9741 0.9836 0.9867 3.396e+05 3.92ge+05 6.90021 0.9798 0.9339 0.9060 0.9546 4.550e+06 4.382e+06 -2.40022 0.9482 1. 021 1. 021 1. 046 2.545e+05 2.790e+05 1. 00023 0.9801 0.9226 0.9412 0.9540 1.283e+05 1.75ge+05 8.00024 0.9835 1. 008 1. 028 1. 004 3.347e+05 3.638e+05 2.70025 1. 091 1.103 1.126 1. 074 7.422e+05 9.421e+05 10.6026 1. 074 1.109 0.9664 0.9498 4.732e+05 6.40ge+05 12.4027 0.9646 0.9201 0.8958 0.8765 5.103e+05 5.880e+05 5.70028 1.111 0.9611 0.9389 0.9355 1.40ge+06 1.553e+06 7.30029 1. 024 1. 082 1. 075 1. 059 1.707e+05 2.217e+05 9.40030 1. 017 1. 038 1.048 1.141 3.068e+05 3.125e+05 -7.10031 0.9686 0.9387 0.9427 0.9391 1.1l0e+06 1.250e+06 7.10032 1. 021 1. 015 1.028 0.9641 2.886e+05 3.954e+05 9.20033 1. 005 1. 006 0.9716 0.9257 6.123e+05 9.067e+05 25.5034 0.8653 0.8709 0.9488 0.9866 3.72ge+05 4.360e+05 0.600.)~ 0.9683 0.9290 0.9405 0.9634 1.371e+06 1.566e+06 9.30036 1.156 1. 068 1. 021 1. 045 4.765e+05 6.048e+05 6.90037 0.::1505 0.9493 0.9324 0.8979 3.784e+05 4.327e+05 3.10038 1.009 1. 039 1. 072 1. 029 2.667e+05 3.484e+05 9.70039 1.009 1.009 1. 015 0.9961 3.811e+05 5.131e+05 8.10040 0.8651 0.8932 0.9142 0.9075 4.438e+05 7.01ge+05 14.3041 0.9840 0.9838 0.9892 0.9949 8.340e+05 9.817e+05 7.500<42 0.9846 0.9590 0.9951 1. 019 8.51ge+05 1.020e+06 15.1042 0.9902 0.9852 0.9981 0.9910 1.404e+06 1.432e+06 2.500..J4 i.044 1. 059 0.9637 0.9210 1.982e·06 2.464e+06 15.3045 1. 016 0.9985 0.9966 0.9836 2.25Se·OS 2.925e+05 7.30046 0.9632 0.9918 1. 008 0.9170 6.'?S"le+05 9.850e+05 15.80(l7 1. 027 0.940) 0.8636 0.8353 1. ':'??e+06 1.23ge+06 -1.40048 1.021 0.9826 1. (,11 0.9832 1.1:3-1'2+!")c 1.824e+06 -2.90049 0.9166 0.9485 0.9259 0.9127 7.l-:-3e+05 ?S88e+05 11. 40
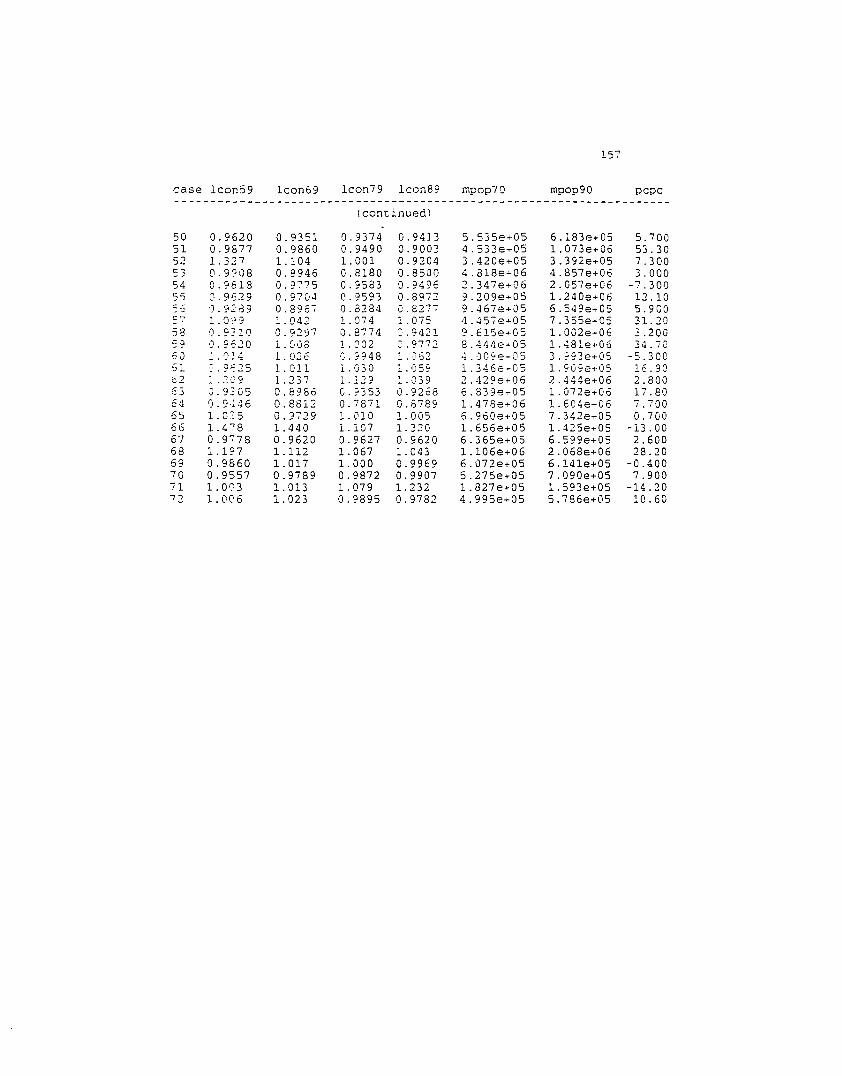
157
case lconS9 lcon69 lcon79 lcon8? rnpop70 rnpop90 pcpc---------------------------------------------------------------------
(continued)
50 0.9620 0.9351 0.9374 0.9413 5.53512+05 6.183e+05 5.70051 0.9577 0.9860 0.9490 0.9003 4.533e+05 1.073e+06 53.3052 1.327 1.104 1. 001 o.9204 3.420e+05 3.392e+05 7.30053 0.9908 0.8946 0.8180 0.8500 4.818e~06 4.857e+06 3.00054 O.~81S 0.9775 0.9583 0.9496 2.347e+06 2.057e+06 -7 .30055 (\ . %29 0.9704 0.9593 0.8972 9.20ge~05 1.240e+06 12.10S~ 'J • 9: r3 9 0.8967 0.8284 0.827"7 9.467e+05 6.54ge+05 5.900:;7 1.0?9 1.042 1.074 1.075 4.457e~05 7.355e+C5 31. 20- " O.9~10 0.9297 0.8774 C.9421 9.615e+OS 1.002e+06 3.200::>c5'? '),9'520 1.[108 1.081 C.97 7 2 8.~44e·05 1.';81e+06 34.7060 ('0.1.' 1.026 G.?948 1 . .J62 ,1. oJO'?e·05 3.:-::3e+05 -5.300.;. . -' .... ~61 ':'.9~25 1. all 1.030 1.059 1.346e~05 1.%:?e·05 16.9062 1.:09 1. 237 1 ~ ") ':l 1. 039 2.42ge+06 2.444e+06 2.800,l.._ ......
63 0.9305 0.8986 C.?353 0.9268 6.83ge~05 1.072e+06 17.8064 0.9~46 0.8812 0.781l 0.5789 1.478e+06 1.604e+06 7.70065 1.035 0.:1729 1.,)10 1.005 6.960e+05 7.342e+05 0.70066 1. 4 '8 1. 440 1.107 1. 320 1.656e+05 1.425e+05 -13.0067 0.9778 0.9620 0.9627 0.9620 6.365e+05 6.59ge+05 2.60068 1.197 1.112 1. 067 1. 043 1.106e+06 2.068e+06 28.2069 0.9860 1. 017 1. 000 0.9969 6.072e+05 6.141e+05 -0.40070 0.9557 0.9789 0.9872 0.9907 5.275e+05 7.090e+05 7.90071 1. 003 1.013 1.079 1. 232 1.827e+05 1.593e+05 -14.2072 1. 006 1. 023 0.9895 0.9782 4.995e+05 5.786e+05 10.60
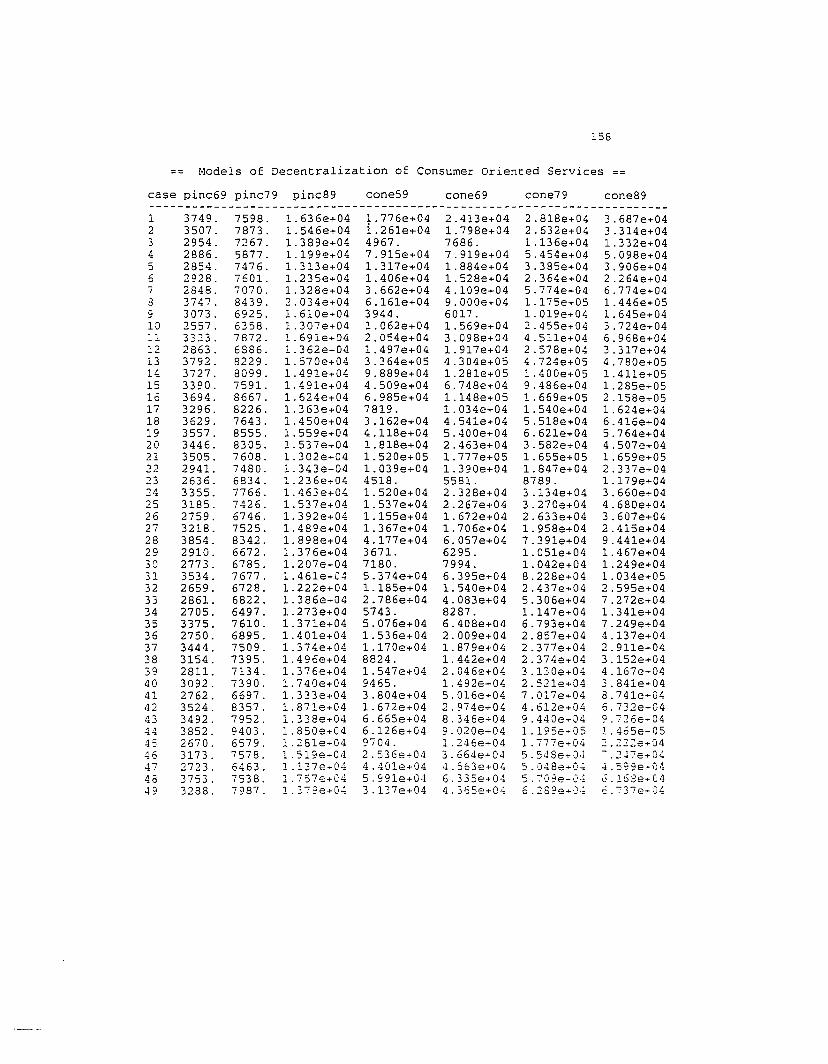
158
Models of Decentralization of Consumer Oriented Services --case pinc69 pinc79 pinc89 cone59 cone69 cone79 cone89------------------------------------------------------------------------1 3749. 7598. 1.636e+04 1.776e+04 2.413e+04 2.818e+04 3.687e+042 3507. 7873. 1.546e+04 i.261e+04 1.798e+04 2.632e+04 3.314e+043 2954. 7267. 1.38ge+04 4967. 7686. 1.136e+04 1.332e+044 2886. 5877. 1.19ge+04 7 . 915e+04 7.91ge+04 5.454e+04 5.098e+045 2854. 7476. 1.313e+04 1. 317e+04 1.884e+04 3.385e+04 3.906e+046 2928. 7601. 1.235e+04 1.406e+04 1.528e+04 2.364e+04 2.264e+047 2848. 7070. 1.328e+04 3.662e+04 4.10ge+04 5.774e+04 6.774e+043 3747. 8439. 2.034e+04 6.161e+04 9.000e+04 1.175e+05 1.446e+059 3073. 6925. 1.610e+04 3944. 6017. 1.01ge+04 1.645e+0410 2557. 6358. 1.307e+04 1.062e+04 1.56ge+04 2.455e+04 3.724e+0411 3323. 7872 . 1.691e+04 2.054e+04 3.098e+04 4.511e+04 6.968e+0412 2863. 6886. 1.362e+04 1.497e+04 1.917e+04 2.578e+04 3.317e+0413 3792. 8229. 1.570e+04 3.364e+05 4.304e+05 4.724e+05 4.780e+0514 3727. 8099. 1.491e+04 9.88ge+04 1.281e+05 1.400e+05 1.411e+0515 3390. 7591. 1. 491e+04 4.50ge+04 6.748e+04 9.486e+04 1.285e+0516 3694. 8667. 1.624e+04 6.985e+04 1.148e+05 1.66ge+05 2.158e+0517 3296. 8226. 1.363e+04 7819. 1.034e+04 1.540e+04 1.624e+0418 3629. 7643. 1.450e+04 3.162e+04 4.541e+04 5.518e+04 6.416e+0419 3557. 8555. 1.55ge+04 4 . 118e+04 5.400e+04 6.621e+04 5.764e+0420 3446. 8305. 1.537e+04 1.818e+04 2.463e+04 3.582e+04 4.507e+0421 3505. 7608. 1.302e+04 1.520e+05 1.777e+05 1.655e+05 1.65ge+0522 2941. 7480. 1.343e+04 1.03ge+04 1.390e+04 1.847e+04 2.337e+04'l~ 2636. 6834. 1.236e... 04 4518. 5581. 8789. 1.17ge+04-,)
24 3355. 7766. 1.463e+04 1.520e+04 2.328e+04 3.134e+04 3.660e+0425 3185. 7426. 1.537e+04 1.537e+04 2.267e+04 3.270e+04 4.680e+0426 2759. 6746. 1.392e+04 1.155e+04 1.672e+04 2.633e+04 3.607e+0427 3218. 7525. 1.48ge+04 1.367e+04 1.706e+04 1.958e+04 2.415e+0428 3854. 8342. 1.898e+04 4.177e+04 6.057e+04 7.391e+04 9.441e+0429 2910. 6672 . 1.376e+04 3671. 6295. 1.051e+04 1.467e+0430 2773. 6785. 1. 207e+04 7180. 7994. 1.042e+04 1.24ge+0431 3534. 7677. 1.461e+C~ 5.374e+04 6.395e+04 8.228e+04 1.034e+0532 2659. 6728. 1.222e+04 1.185e+04 1.540e+04 2.437e+04 2.595e+0433 2861. 6822. 1.386e+04 2.786e+04 4.083e+04 5.306e+04 7.272e:+0434 2705. 6497. 1.273e+04 5743. 8287. 1.147e+04 1.341e+0435 3375. 7610. 1.371e+04 5.076e+04 6.408e+04 6.793e+04 7.24ge+0436 2750. 6895. 1.401e+04 1.536e+04 2.00ge+04 2.857e+04 4.137e+0437 3444. 7509. 1.374e+04 1.170e+04 1.87ge+04 2.377e+04 2.911e+0438 3154. 7395. 1. 496e+04 8824. 1.442e+04 2.374e+04 3.152e+0439 2811. 7134. 1.376e+04 1.547e+04 2.046e+04 3.130e+04 4.167e+0440 3092. 7390. 1.740e+04 9465. 1.492e+04 2.521e+04 3.841e+0441 2762. 6697. 1.333e+04 3.804e+04 5.016e+04 7.017e+04 3.741e+0442 3524. 8357. 1.871e+04 1.672e+04 2.974e+04 4.612e+04 6.732e+0443 3492. 7952. 1.338e+04 6.665e+04 8.346e+04 9.440eT04 9.726e+04~4 3852. 9403. 1.850e+04 6.126e+04 9.020e+04 1.195e+05 1.465e+0545 2670. 6579. 1.281e+04 9704. 1.246e+04 1.777e+04 .2.222e+0446 3173. 7578. 1.51ge+04 2.536e+04 3.664e+04 5.5,JSe+J.:i - .2.J7e+0447 2723. 6463. 1.D7eT04 4.401e+04 4.563e+04 5.048e+O~ ,i.S9ge ... 0448 3753. 7538. 1.757e+04 5.991e+04 6.335e+04 5.70ge-OO:; 6.168e ... C449 3288. 7987. 1.37ge+O~ 3 .137e+04 4.365e+O'; 6.28?e+·J·; C. ""737e ...·;J4
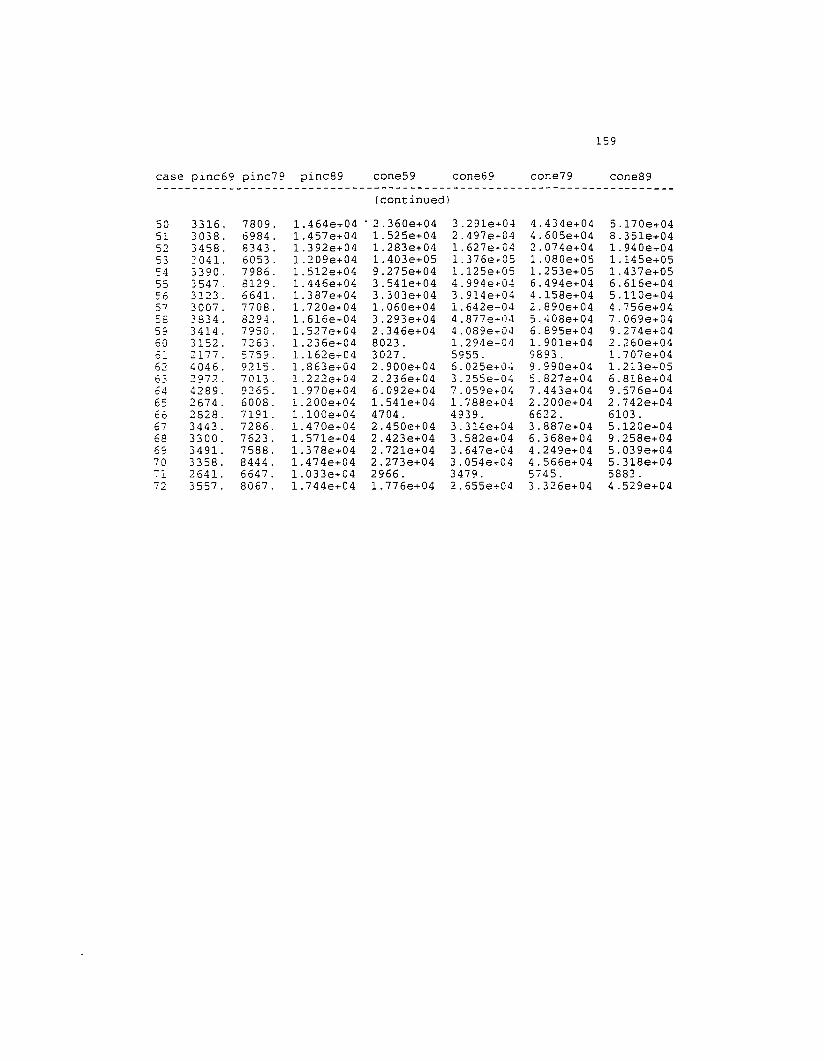
159
case pinc69 pinc79 pinc89 cone59 cone69 cone79 cone89------------------------------------------------------------------------
(continued)
50 3316. 7809. 1.464e+04 . 2. 360e+04 3.291e+04 4.434e+04 5.170e+0451 3038. 6984. 1.457e+04 1.525e+04 2.497e+04 4.605e+04 8.351e+0452 3458. 8343. 1.392e+04 1.283e+04 1.627e... 04 2.074e+04 1.940e+0453 2·041. 6053. 1.20ge+04 1.403e+05 1.376e+05 1.080e+05 1.145e+05'=4 3390. 7986. 1. 512e+04 9.275e+04 1.125e+05 1.253e+05 1.437e+05"'- 3547. 8129. 1.446e+04 3.541e+04 4.994e+04 6.494e+04 6.616e+04..>:J
"'~j, .,., 6641. 1.387e+04 3.303e+04 3.914e+04 4.158e+04 5.110e+04_·0 .J ... ~..J.
57 3007. 7708. 1.720e+04 1.060e+04 1.642e-04 2.890e+04 4.756e+0458 3834. 8294. 1.616e+04 3.293e+04 4.877e- I)4 5.408e+04 7.06ge ... 0459 3414. 7950. 1.527e+04 2.346e+04 4.08ge+04 6.895e+04 9.274e+0460 3152. 7263. 1.236e+04 8023. 1. 294e+04 1.901e+04 2.260e+04~, 2177. 5759. 1.162e+04 3027. 5955. 9893. 1.707e+0462 4046. 9215. 1.863e+04 2.900e+04 6.025e+O'1 9.990e+04 1.213e+0563 2972. 7013 . 1.222e+04 2.236e+04 3.255e ... 04 5.827e+04 6.818e+0464 4289. 9265. 1.970e+04 6.092e+04 7.05ge+04 7.443e+04 9.576e+0465 2674. 6008. 1.200e+04 1.541e+04 1.788e+04 2.200e+04 2.742e+0466 2828. 7191. 1.100e+04 4704. 4939. 6622. 6103.67 3443. 7286. 1.470e+04 2.450e+04 3.314e+04 3.887e+04 5.120e+0468 3300. 7623. 1.571e+04 2.423e+04 3.582e+04 6.368e+04 9.258e+0469 3491. 7588. 1.378e+04 2.721e+04 3.647e+04 4.24ge+04 5.03ge+0470 3358. 8444. 1. 474e+04 2.273e+04 3.054e+04 4.566e+04 5.318e+04-:"1 2641. 6647. 1.033e+04 2966. 3479. 5745. 5883.72 3557. 8067. 1.744e+04 1.776e+04 2.655e+04 3.326e+04 4.52ge+04
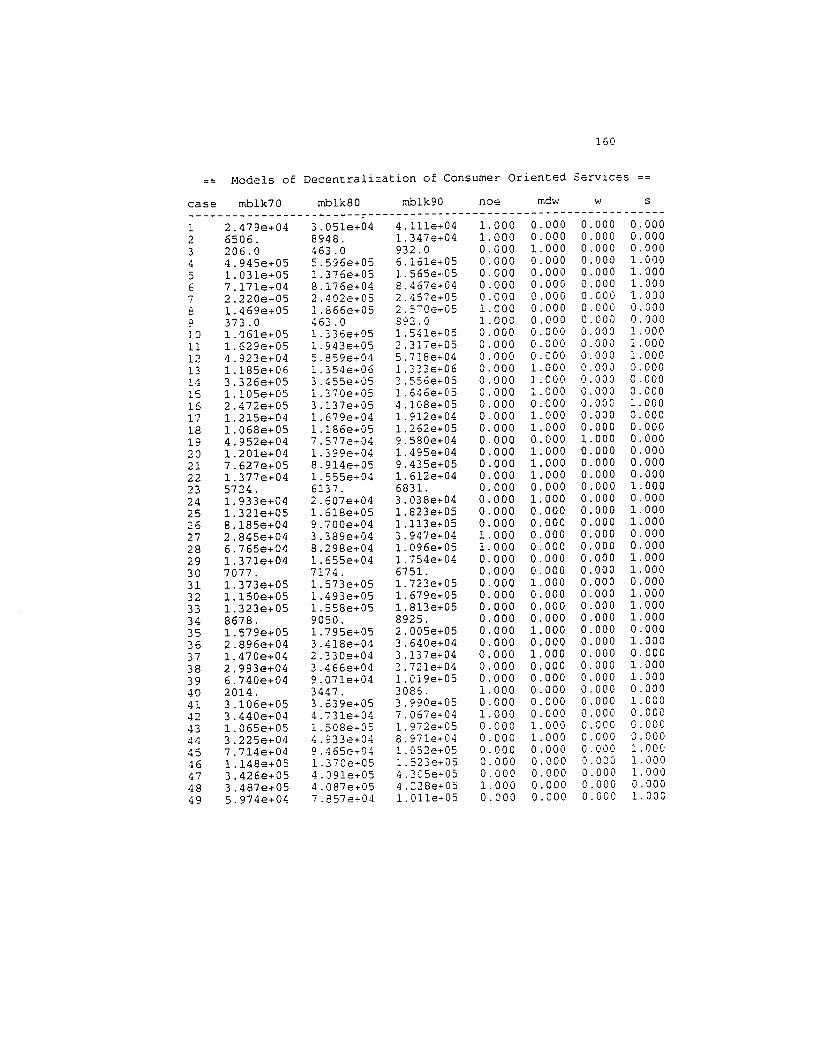
160
Models of Decentralization of Consumer Oriented Se::vices
case mblk70 mblk80 mblk90 noe mdw w s-------------------------------------------------------------------1 2.47ge+04 3.051e+04 4.111e+04 1. 000 0.000 0.000 0.000
2 6506. 8948. 1.347e+04 1. 000 0.000 0.000 0.000
3 206.0 463.0 932.0 0.000 1. 000 0.000 0.0004 4.945e+05 5.596e+05 6.161e+05 0.000 0.000 0.000 1.000
5 1.031e+05 1. 376e+05 1.565e.. 05 0.000 0.000 0.000 1.000
6 7.171e+04 8.176e+04 8.467e+04 0.000 O.OOC 0.000 1.0007 2.220e+05 2.402e+05 2.457e+05 0.000 0.000 0.000 1. 000
8 1.46ge+05 1.866e+05 2.5~Oe+05 1. 000 0.000 0.000 0.000
Sl 373.0 463.0 892.0 1. 000 0.000 0.000 0.000
10 1.061e+05 1.336e+05 1.541e+05 0.000 0.000 0.000 1.000
11 1.62ge+05 1.943e+05 2.317e+05 0.000 0.000 0.000 1. 000
12 4.923e+04 5.85ge+04 5.718e+04 0.000 0.000 0.000 1.00013 1.185e+06 1.354e+06 1.333e+06 0.000 1. 000 0.000 0.00014 3.326e+05 3.~55e+C5 3.556e+05 0.000 1. 000 0.000 0.00015 1.105e+05 1.370e+05 1.646e+05 0.000 1.000 0.000 0.00016 2.472e+05 3.137e+05 4.108e+05 0.000 0.000 0.000 1. 00017 1. 215e+04 1.67ge+04 1 . 912e+04 0.000 1.000 0.000 0.00018 1.068e+05 1.186e+05 1.262e+05 0.000 1.000 0.000 0.000
19 4.952e+04 7.577e+04 9.580e+04 0.000 0.000 1. 000 0.000
20 1.201e+04 1.39ge+04 1.495e+04 0.000 1.000 0.000 0.000
21 7.627e+05 8.914e+05 9.435e+05 0.000 1. 000 0.000 0.000
22 1.377e+04 1.555e+04 1.612e+04 0.000 1. 000 0.000 0.000
23 5724. 6137. 6831. 0.000 0.000 0.000 1.000
24 1.933e+04 2.607e+04 3.038e+04 0.000 1.000 0.000 0.000
25 1.321e+05 1.618e+05 1.823e+05 0.000 0.000 0.000 1. 000
26 8.185e+04 9.700e+04 1.113e+05 0.000 0.000 0.000 1. 000
27 2.845e+04 3.38ge+04 3.947e+04 1. 000 0.000 0.000 0.000
28 6.765e+04 8.298e+04 1.096e+05 1. 000 0.000 0.000 0.000
29 1.371e+04 1.655e+04 1./54e+04 0.000 0.000 0.000 1.000
30 7077. 7174. 6751. 0.000 0.000 0.000 1.000
31 1. 373e+05 1.573e+05 1.723e+05 0.000 1. 000 0.000 0.000
32 1.150e+05 1.493e+05 1.67ge+05 0.000 0.000 0.000 1. 000
33 1.323e+05 1.558e+05 1.813e+05 0.000 0.000 0.000 1.000
34 8678. 9050. 8925. 0.000 0.000 0.000 1. 000
35 1.57ge+05 1.795e+05 2.005e+05 0.000 1. 000 0.000 0.000
36 2.896e+04 3.41Be+04 3.640e+04 0.000 0.000 0.000 1.000
37 1.470e+04 2.330e+04 3.137e+04 0.000 1. 000 0.000 0.000
38 2.993e+04 3.466e+04 3.721e+04 0.000 0.000 0.000 1.000
39 6.740e+04 9.071e+04 1.C1ge+05 0.000 0.000 0.000 1.000
40 2014. 3447. 3086. 1. 000 0.000 0.000 0.000
41 3.106e+05 3.63ge+05 3.990e+05 0.000 0.000 0.000 1.000
42 3.440e+04 4.731e+04 7.067e+04 1. 000 0.000 0.000 0.000
43 1.065e+05 1.508e+05 1.972e+05 0.000 1. 000 0.000 0.000
44 3.225e+04 4.933e+04 B. 971e+04 0.000 1. 000 0.000 0.000
~5 7.714e+04 9.465e+04 1. C'52e+05 0.000 0.000 0.000 1.000
46 1.14Be+05 1.370e·05 1.523e+05 0.000 0.000 0.000 1.000
47 3.426e+05 4.J91e+05 4.305e+05 0.000 0.000 0.000 1.000
48 3.487e+05 4.087e+05 4.:28e+05 1.000 0.000 0.000 0.000
49 5.974e+04 7.857e·04 1. 011e+05 0.000 0.000 0.000 1.00C
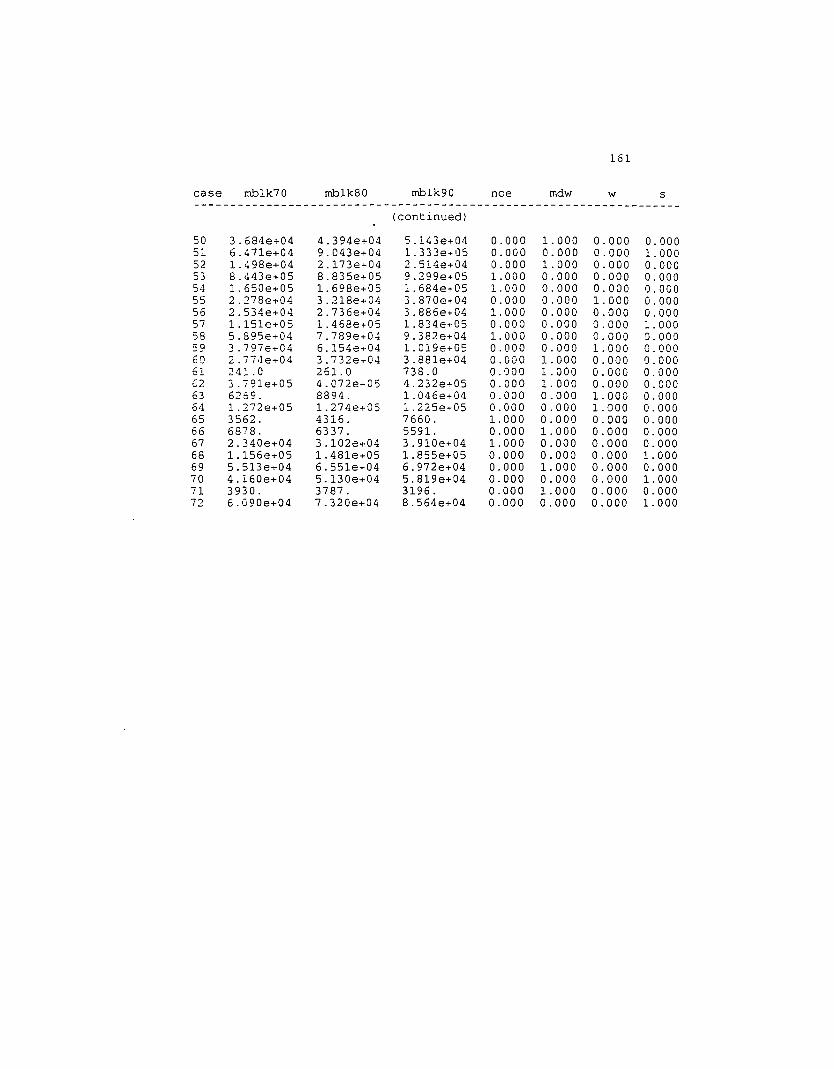
161
case mb1k70 mb1k80 mb1k90 noe mdw w s-------------------------------------------------------------------
(continued)
50 3.684e+04 4.394e+04 5.143e+04 0.000 1.000 0.000 0.00051 6.471e+04 9.043e+04 1.333e... 05 0.000 0.000 0.000 1. 00052 1.498e+04 2.173e+04 2.514e+04 0.000 1.000 0.000 0.00053 8.443e+05 8.835e+05 9.29ge+05 1. 000 0.000 0.000 0.00054 1.650e+05 1.698e+05 1.684e+05 1. 000 0.000 0.000 0.00055 2.278e+04 3.:218e+04 3.870e+04 0.000 0.000 1.000 0.00056 2.534e+04 2.736e ... 04 3.886e+04 1. 000 0.000 0.000 0.00057 1.151e+05 1.468e+05 1.834e+05 0.000 0.000 0.000 1.00058 5.895e+04 7.78ge+0~ 9.382e+04 1. 000 0.000 0.000 0.00059 3.797e+04 6.154e+04 1.01ge+05 0.000 0.000 1. 000 0.00060 2.774e+04 3.732e+04 3.881e+04 0.000 1. 000 0.000 0.00061 241.0 261. a 738.0 0.000 1.000 0.000 0.00062 3.791e+05 4. one-OS 4.232e+05 0.000 1.000 0.000 0.00063 6269. 8894. 1.046e+04 0.000 0.000 1. 000 0.00064 1.272e+05 1. 274e+05 1.225e+05 0.000 0.000 1.000 0.00065 3562. 4316. 7660. 1. 000 0.000 0.000 0,00066 6878. 6337, 5591, 0,000 1. 000 0.000 0.00067 2,340e+04 3.102e+04 3.910e+04 1. 000 0,000 0.000 0.00068 1.156e+05 1.481e+05 1.855e+05 0.000 0.000 0.000 1. 00069 5.513e+04 6.551e+04 6,972e+04 0,000 1,000 0.000 0.00070 4.160e+04 5.130e+04 5.81ge+04 0.000 0.000 0.000 1. 00071 3930, 3787, 3196, 0.000 1. 000 0.000 0.00072 6.090e+04 7.320e+04 8,564e+04 0,000 0,000 0.000 1. 000
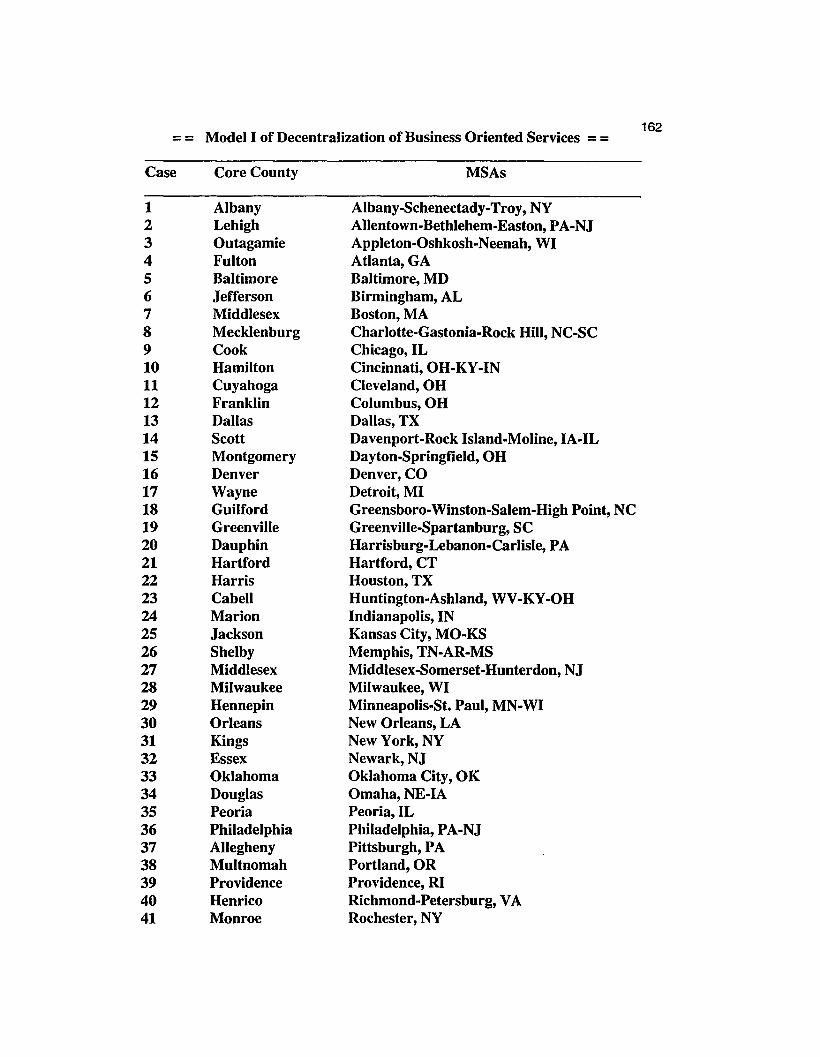
Model I of Decentralization of Business Oriented Services == 162
Case
1234567891011121314151617181920212223242526272829303132333435363738394041
Core County
AlbanyLehighOutagamieFultonBaltimoreJeffersonMiddlesexMecklenburgCookHamiltonCuyahogaFranklinDallasScottMontgomeryDenverWayneGuilfordGreenvilleDauphinHartfordHarrisCabellMarionJacksonShelbyMiddlesexMilwaukeeHennepinOrleansKingsEssexOklahomaDouglasPeoriaPhiladelphiaAlleghenyMultnomahProvidenceHenricoMonroe
MSAs
Albany-Schenectady-Troy, NYAllentown-Bethlehem-Easton, PA-NJAppleton-Oshkosh-Neenah, WIAtlanta, GABaltimore, MDBirmingham, ALBoston,MACharlotte-Gastonia-Rock Hill, NC-SCChicago,ILCincinnati, OH-KY-INCleveland,OHColumbus, OHDallas, TXDavenport-Rock Island-Moline, IA-ILDayton-Springfield, OHDenver, CODetroit, MIGreensboro-Winston-Salem-High Point, NCGreenville-Spartanburg, SCHarrisburg-Lebanon-Carlisle, PAHartford, CTHouston, TXHuntington-Ashland, WV-KY-OHIndianapolis, INKansas City, MO-KSMemphis, TN-AR-MSMiddlesex-Somerset-Hunterdon, NJMilwaukee, WIMinneapolis-St. Paul, MN-WINew Orleans, LANewYork,NYNewark,NJOklahoma City, OKOmaha, NE-IAPeoria,ILPhiladelphia, PA-NJPittsburgh, PAPortland, ORProvidence, RIRichmond-Petersburg, VARochester, NY
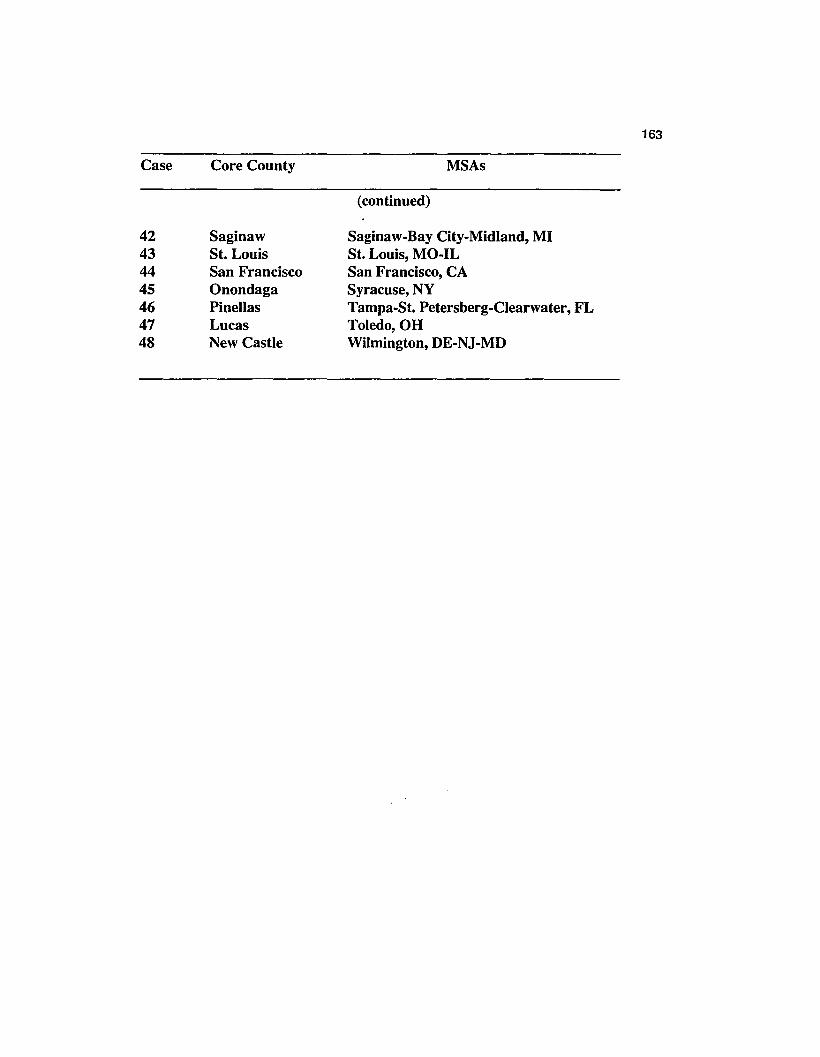
Case
42434445464748
Core County
SaginawSt. LouisSan FranciscoOnondagaPinellasLucasNew Castle
MSAs
(continued)
Saginaw-Bay City-Midland, MISt. Louis, MO-ILSan Francisco, CASyracuse, NYTampa-St. Petersberg-Clearwater, FLToledo, 08Wilmington, DE-NJ-MD
163
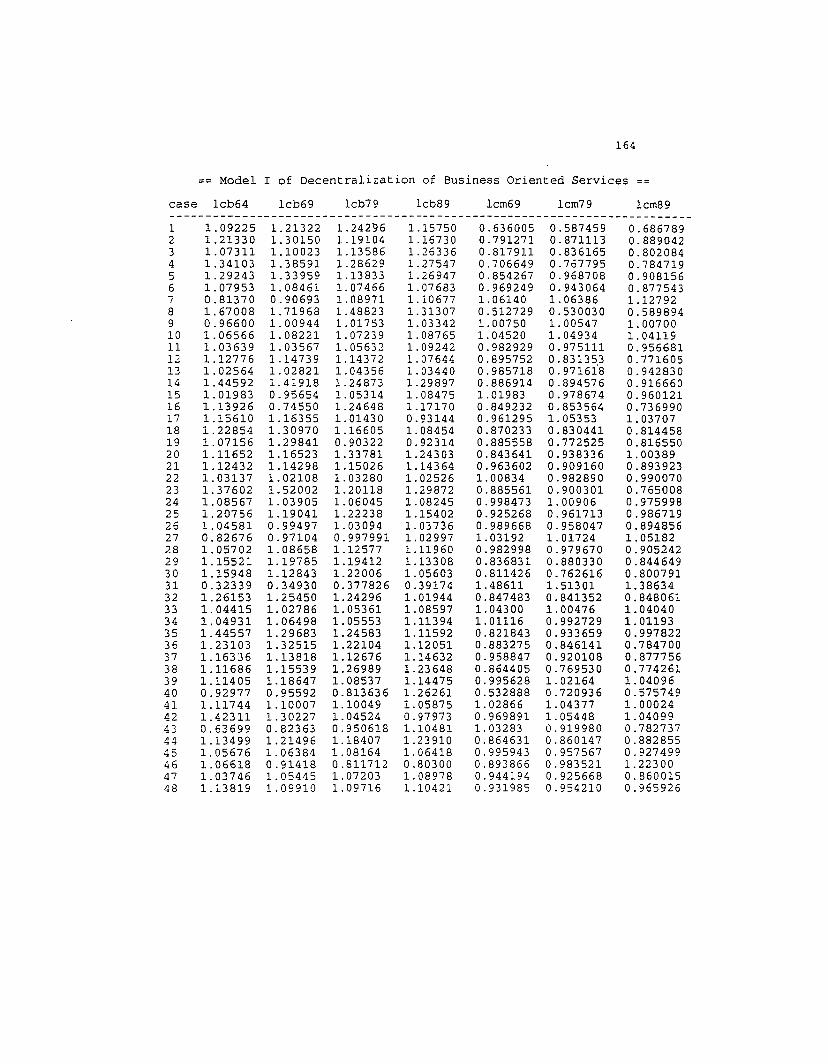
164
== Model I of Decentralization of Business Oriented Services
case lcb64 lcb69 lcb79 lcb89 lcm69 lcm79 lcm89-------------------------------------------------------------------------1 1.09225 1. 21322 1.242"96 1.15750 0.636005 0.587459 0.6867892 1.21330 1.30150 1.19104 1.16730 0.791271 0.871113 0.8890423 1. 07311 1.10023 1.13586 1.26336 0.817911 0.836165 0.8020844 1.34103 1.38591 1.28629 1. 27547 0.706649 0.767795 0.7847195 1.29243 1. 33959 1.13833 1. 26947 0.854267 0.968708 0.9081566 1. 07953 1.08461 1. 07466 1.07683 0.969249 0.943064 0.8775437 0.81370 0.90693 1. 08971 1.10677 1.06140 1.06386 1.127928 1. 67008 1.71968 1.48823 1.31307 0.512729 0.530030 0.5898949 0.96600 1. 00944 1. 01753 1. 03342 1. 00750 1.00547 1. 0070010 1.06566 1. 08221 1.07239 1.08765 1.04520 1. 04934 1.0411911 1.03639 1. 03567 1.05632 1. 09242 0.982929 0.975111 0.95668112 1.12776 1.14739 1.14372 1.07644 0.895752 0.831353 0.77160513 1.02564 1. 02821 1. 04356 1.03440 0.985718 0.971618 0.94283014 1. 44592 1. 41918 1.24873 1.29897 0.886914 0.894576 0.91666015 1.01983 0.95654 1. 05314 1. 08475 1.01983 0.978674 0.96012116 1.13926 0.74550 1.24648 1.17170 0.849232 0.853564 0.73699017 1.15610 1.16355 1.01430 0.93144 0.961295 1.05353 1.0370718 1. 22854 1. 30970 1.16605 1. 08454 0.870233 0.830441 0.81445819 1. 07156 1.29841 0.90322 0.92314 0.885558 0.772525 0.81655020 1.11652 1.16523 1.33781 1.24303 0.843641 0.938336 1.0038921 1.12432 1.14298 1.15026 1.14364 0.963602 0.909160 0.89392322 1. 03137 1.02108 1.03280 1. 02526 1. 00834 0.982890 0.99007023 1. 37602 1. 52002 1.20118 1.29872 0.885561 0.900301 0.76500824 1. 08567 1. 03905 1.06045 1. 08245 0.998473 1. 00906 0.97599825 1.20756 1.19041 1.22238 1.15402 0.925268 0.961713 0.98671926 1. 04581 0.99497 1. 03094 1. 03736 0.989668 0.958047 0.89485627 0.82676 0.97104 0.997991 1. 02997 1.03192 1. 01724 1.0518228 1.05702 1.08658 1.12577 1.11960 0.982998 0.979670 0.90524229 1.15521 1.19785 1.19412 1.13308 0.836831 0.880330 0.84464930 1.15948 1.12843 1.22006 1.05603 0.811426 0.762616 0.80079131 0.32339 0.34930 0.377826 0.39174 1.48611 1.51301 1. 3863432 1. 26153 1. 25450 1.24296 1.01944 0.847483 0.841352 0.84806133 1. 04415 1. 02786 1.05361 1.08597 1.04300 1. 00476 1.0404034 1.04931 1. 06498 1. 05553 1.11394 1. 01116 0.992729 1.0119335 1.44557 1. 29683 1.24583 1.11592 0.821843 0.933659 0.99782236 1. 23103 1.32515 1.22104 1.12051 0.883275 0.846141 0.78470037 1.16336 1.13818 1.12676 1.14632 0.958847 0.920108 0.87775638 1.11686 1.15539 1.26989 1.23648 0.864405 0.769530 0.77426139 1.11405 1.18647 1. 08537 1.14475 0.995628 1. 02164 1. 0409640 0.92977 0.95592 0.813636 1.26261 0.532888 0.720936 0.57574941 1.11744 1.10007 1.10049 1.05875 1.02866 1.04377 1.0002442 1.42311 1. 30227 1. 04524 0.97973 0.969891 1.05448 1. 0409943 0.63699 0.82363 0.950618 1.10481 1. 03283 0.919980 0.78273744 1.13499 1.21496 1.18407 1.23910 0.864631 0.860147 0.88285545 1.05676 1. 06384 1.08164 1. 06418 0.995943 0.957567 0.92749946 1. 06618 0.91418 0.811712 0.80300 0.893866 0.983521 1. 2230047 1.03746 1. 05445 1. 07203 1.08978 0.944194 0.925668 0.86001548 1.13819 1.09910 1. 09716 1.10421 0.931985 0.954210 0.965926

165
== Model I of Decentralization of Business Oriented Services
case mpop70 mpop90 pcpc pinc69 pinc79 pinc89 mblk70------------------------------------------------------------------------1 810929. 874304. 4.6 3749. 7598.00 16363.0 24794.02 594124. 686688. 8.1 3507. 7873.00 15458.0 6506.003 276891. 315121. 8.2 2954. 7267.00 13893.0 206.0004 1.68650e+06 2.83351e+06 32.5 3459. 7621.00 18452.0 371329.5 2.0890ge+06 2.38217e+06 8.3 2886. 5877.00 11994.0 494498.6 794083. 907810. 2.7 2848. 7070.00 13277.0 221972.7 4.79098e+06 2.87067e+06 2.3 3747. 8439.00 20343.0 146935.8 840347. 1.1620ge+06 19.6 3323. 7872.00 16910,0 162943.9 6.09581e+06 6.06997e+06 0.2 3792. 8229.00 15697.0 1.185e+0610 1.38485e+06 1.45265e+06 3.7 3395. 7871. 00 15354.0 152333.11 2.0641ge+06 1.83112e+06 -3.6 3727. 8099.00 14912.0 332614.12 1.14943e+06 1.37742e+06 10.7 3390. 7591.00 14907.0 110544.13 1.55595e+06 2.55336e+06 30.4 3694. 8667.00 16243.0 247181.14 362638. 350861. -8.8 3296. 8226.00 13625.0 12147.015 972662. 951270. 1.0 3629. 7643.00 14495.0 106823.16 1.10405e+06 1.62298e+06 13.6 3557. 8555.00 15590.0 49524.017 4.54987e+06 4.38230e+06 -2.4 3505. 7608.00 13016.0 762655.18 742159. 942091. 10.6 3185. 7426.00 15373.0 132080.19 473226. 640861. 12.4 2759. 6746.00 13918.0 81848.020 510291. 587986. 5.7 3218. 7525.00 14890.0 28450.021 1.40943e+06 1.55273e+06 7.3 3854. 8342.00 18983.0 67648.022 1.89100e+06 3.30194e+06 20.7 3402. 9062.00 15202.0 379751.23 306785. 312529. -7.1 2773. 6785.00 12068.0 7077.0024 1.10988e+06 1.24982e+06 7.1 3534. 7677.00 14614.0 137335.25 1.37074e+06 1.56628e+06 9.3 3375. 7610.00 13712.0 157898.26 834006. 981747. 7.5 2762. 6697.00 13330.0 310608.27 851903. 1.01984e+06 15.1 3524. 8357.00 18714.0 34399.028 1.4036ge+06 1.43215e+06 2.5 3492. 7952.00 13383.0 106532.29 1.98172e+06 2.46412e+06 15.3 3852. 9403.00 18496.0 32248.030 1.09917e+06 1.23882e+06 -1.4 2723. 6463.00 11372.0 342585.31 9.07557e+06 8.54685e+06 3.3 3072 . 5753.00 12388.0 1.767e+0632 1.93408e+06 1.82432e+06 -2.9 3753. 7538.00 17574.0 348653.33 717825. 958839. 11. 4 3288. 7987.00 13794.0 59742.034 553452. 618262. 5.7 3316. 7809.00 14644.0 36838.035 341979. 339172 . -7.3 3458. 8343.00 13924.0 14977.036 4.81791e+06 4.85688e+06 3.0 304l. 6053.00 12091.0 844300.37 2.3474ge+06 2.05671e+06 -7.3 3390. 7986.00 15115.0 164957.38 920888. 1.23984e+06 12.1 3547. 8129.00 14462.0 22777.039 946725. 654854. 5.9 3123. 6641. 00 13871. 0 25338.040 676351. 865640. 13.7 3713. 8562.00 18019.0 185551.41 961516. 1.00241e+06 3.2 3834. 8294.00 16162.0 58949.042 400851. 399320. -5.3 3152. 7263.00 12355.0 27739.043 2.42866e+06 2.44410e+06 2.8 4046. 9215.00 18625.0 379100.44 1.47795e+06 1.60368e+06 7.7 4289. 9265.00 19695.0 127205.45 636507. 659864. 2.6 3443. 7286.00 14703.0 23398.046 1.10555e... 06 2.06796e+06 28.2 3300. 7623.00 15712.0 115595.47 607163. 614128. -0.4 3491. 7588.00 13778.0 55130.048 499493. 578587. 10.6 3557. 8067.00 17442.0 60896.0

166
= Model I of Decentralization of Business Oriented Services
case rnblk80 mblk90 buse64 noe mdw w s-----------------------------------------------------------------1 30505.0 41112 ..0 4493.00 1. 00 0.00 0.00 0.002 894,8.00 13466.0 1782.00 1. 00 0.00 0.00 0.00
3 463.000 932.000 529.000 0.00 1. 00 0.00 0.00
4 525507. 736153. 15990.0 0.00 0.00 0.00 1. 00
5 559596. 616065. 16604.0 0.00 0.00 0.00 1. 00
6 240204. 245726. 5461.00 0.00 0.00 0.00 1. 007 186592 . 256969. 12285.0 1. 00 0.00 0.00 0.00
8 194296. 231654. 5212.00 0.00 0.00 0.00 1. 00
9 1.354e+06 1.333e+06 94231.0 0.00 1. 00 0.00 0.00
10 173333. 190473. 11257.0 0.00 1.00 0.00 0.00
11 3~5536. 355619. 24129.0 0.00 1. 00 0.00 0.0012 136956. 164602. 8440.00 0.00 1. 00 0.00 0.00
13 313696. 410766. 17398.0 0.00 0.00 0.00 1. 0014 16789.0 19115.0 1546.00 0.00 1. 00 0.00 0.00
15 11B568. 126238. 5509.00 0.00 1.00 0.00 0.0016 75774.0 95796.0 9925.00 0.00 0.00 1. 00 0.0017 891399. 943479. 34598.0 0.00 1. 00 0.00 0.00
18 161778 . 182284. 2393.00 0.00 0.00 0.00 1. 00
19 97004.0 111334. 1414.00 0.00 0.00 0.00 1. 00
20 33886.0 39472.0 1990.00 1. 00 0.00 0.00 0.00
21 82975.0 109636. 9433.00 1. 00 0.00 0.00 0.00
22 513797. 611243. 18656.0 0.00 0.00 0.00 1. 00
23 7174.00 6751. 00 796.000 0.00 0.00 0.00 1. 00
24 157338. 172326. 7819.00 0.00 1. 00 0.00 0.00
25 179477. 200508. 12757.0 0.00 1. 00 0.00 0.00
26 363943. 399011. 7010.00 0.00 0.00 0.00 1. 00
27 47305.0 70670.0 2948.00 1. 00 0.00 0.00 0.00
28 150838. 197183. 13010.0 0.00 1. 00 0.00 0.00
29 49327.0 89710.0 14974.0 0.00 1. 00 0.00 0.00
30 409078. 430470. 9264.00 0.00 0.00 0.00 1. 00
31 1.910ge+06 2.2500e+06 13599.0 1. 00 0.00 0.00 0.00
32 408713. 422802. 19286.0 1. 00 0.00 0.00 0.00
33 78573.0 101082. 5381.00 0.00 0.00 0.00 1. 00
34 43935.0 51426.0 4615.00 0.00 1. 00 0.00 0.00
35 21728.0 25142.0 1884.00 0.00 1. 00 0.00 0.00
36 883477. 929907. 33023.0 1. 00 0.00 0.00 0.00
37 169772. 168382. 19284.0 1. 00 0.00 0.00 0.00
38 32::'84.0 38695.0 6987.00 0.00 0.00 1. 00 0.00
39 27361.0 38861. 0 6631. 00 1. 00 0.00 0.00 0.00
40 221474. 252340. 441. 000 0.00 0.00 0.00 1. 00
41 77891.0 93819.0 8870.00 1. 00 0.00 0.00 0.00
42 37321.0 38810.0 1135.00 0.00 1. 00 0.00 0.00
43 407213 . 423182. 3879.00 0.00 1. 00 0.00 0.00
44 127391. 122494. 33088.0 0.00 0.00 1. 00 0.00
45 31016.0 39095.0 5589.00 1. 00 0.00 0.00 0.00
46 148058. 185503. 3493.00 0.00 O.OJ 0.00 1. 00
47 65505.0 69717.0 4312.00 0.00 1. 00 0.00 0.00
48 73203.0 85641. 0 4701.00 0.00 0.00 0.00 1. 00
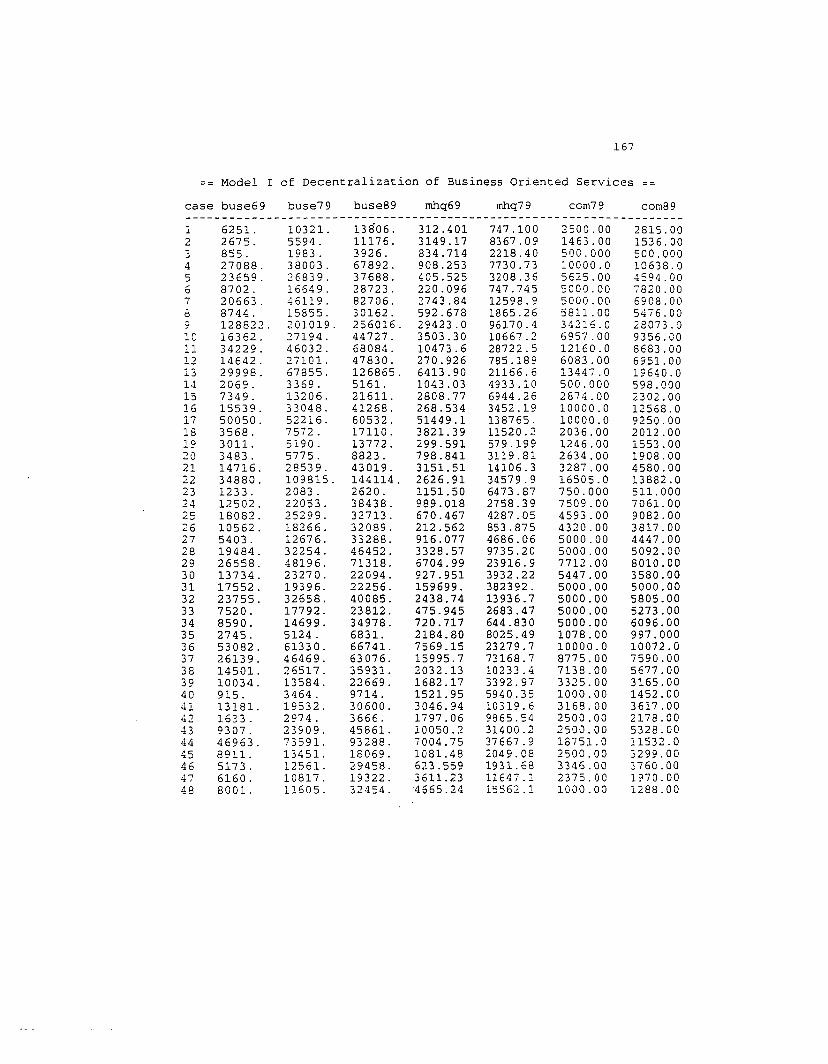
167
-- Model I of Decentralization of Business Oriented Services
case buse69 buse79 buse89 mhq69 mhq79 com79 com89---------------------------------------------------------------------1 6251. 10321. 13806. 312.401 747.100 2500.00 2815.002 2675. 5594. 11176. 3149.17 8367.09 1463.00 1536.003 855. 1983. 3926. 834.714 2218.40 500.000 500.0004 27088. 38003. 67892. 908.253 7730.73 10000.0 10638.05 23659. 26839. 37688. 405.525 3208.36 5625.00 4594.006 8702. 16649. 28723. 220.096 747.745 5000.00 7820.007 20663. 46119. 82706. 2743.84 12598.9 5000.00 6908.008 8744. 15855. 30162. 592.678 1865.26 5811 .00 5476.00
" 128822. 201019. 256016. 29423.0 96170.4 342~6.0 28073.010 16362. 27194. 44727. 3503.30 10667.2 6957.00 9356.0011 34229. 46032. 68084. 10473.6 28722.5 12160.0 8683.0012 14642. 27101. 47830. 270.926 785.189 6083.00 6351. 0013 29998. 67855. 126865. 6413.90 21166.6 13447.0 19640.014 2069. 3369. 5161. 1043.03 4933.10 500.000 598.00015 7349. 13206. 21611. 2808.77 6944.26 2874.00 2302.0016 15539. 33048. 41268. 268.534 3452.19 10000.0 12568.017 50050. 52216. 60532. 51449.1 138765. 10000.0 9250.0018 3568. 7572. 17110. 3821. 39 11520.2 2036.00 2012.0019 3011. 5190. 13772 . 299.591 579.199 1246.00 1553.0020 3483. 5775. 8823. 798.841 3119.81 2634.00 1908.0021 14716. 28539. 43019 . 3151. 51 14106.3 3287.00 4580.0022 34880. 109815. 144114. 2626.91 34579.9 16505.0 13882.023 1233. 2083. 2620. 1151.50 6473.87 750.000 511. 00024 12502. 22053. 38438. 989.018 2758.39 7509.00 7061. 0025 18082. 25299. 32713. 670.467 4287.05 4593.00 9082.0026 10562. 18266. 32089. 212.562 853.875 4320.00 3817.0027 5403. 12676. 33288. 916.077 4686.06 5000.00 4447.0028 19484. 32254. 46452. 3328.57 9735.20 5000.00 5092.0029 26558. 48196. 71318. 6704.99 23916.9 7712.00 8010.0030 13734. 23270. 22094. 927.951 3932.22 5447.00 3580.0031 17552. 19396. 22256. 159699. 382392. 5000.00 5000.0032 23755. 32658. 40085. 2438.74 13936.7 5000.00 5805.0033 7520. 17792. 23812. 475.945 2683.47 5000.00 5273.0034 8590. 14699. 34978. 720.717 644.830 5000.00 6096.0035 2745. 5124. 6831. 2184.80 8025.49 1078.00 997.00036 53082. 61330. 66741. 7569.15 23279.7 10000.0 10072.037 26139. 46469. 63076. 15995.7 73168.7 8775.00 7590.0038 14501. 26517. 35931. 2032.13 10233.4 7138.00 5677.0039 10034. 13584. 22669. 1682.17 3392.97 3325.00 3165.0040 915. 3464. 9714. 1521. 95 5940.35 1000.00 1452.0041 13181. 19532. 30600. 3046.94 10319.6 3168.00 3617.0042 1633. 2974. 3666. 1797.06 9865.54 2500.00 2178.0043 9307. 23909. 45861. 10050.2 31400.2 2500.00 5328.0044 46963. 73591. 93288. 7004.75 37667.9 18751. 0 11532.045 8911. 13451. 18069. 1081.48 2049.08 2500.00 3299.0046 5173. 12561. 29458. 623.559 1931. 68 3346.00 3760.0047 6160. 10817. 19322. 3611. 23 11647.1 2375.00 1970.0048 8001. 11605. 32454. 4565.24 15562.1 1000.00 1288.00

Model II of Decentralization of Business Oriented Services = = 168
Case
1234567891011121314151617181920212223242526272829303132333435363738394041
Core County
AlbanyLehighOutagamieFultonRichmondTravisBaltimoreJeffersonJeffersonMiddlesexMecklenburgHamiltonCookHamiltonCuyahogaFranklinDallasScottMontgomeryDenverPolkWayneVanderburghTarrantGuilfordGreenvilleDauphinHartfordHarrisCabellMarionSullivanJacksonKnoxInghamJeffersonHillsboroughShelbyMiddlesexMilwaukeeHennepin
MSAs
Albany-Schenectady-Troy, NYAllentown-Bethlehem-Easton, PA-NJAppleton-Oshkosh-Neenah, WIAtlanta, GAAugusta, GA-SCAustin, TXBaltimore, MDBeaumont-Port Arthur, TXBirmingham, ALBoston, MACharlotte-Gastonia-Rock Hill, NC-SCChattanooga, TN-GAChicago,ILCincinnati, OH-KY-INCleveland,OHColumbus,OHDallas, TXDavenport-Rock Island-Moline, IA-ILDayton-Springfield, ORDenver, CODes Moines, IADetroit, MIEvansville, IN-KYFt. Worth-Arlington, TXGreensboro-Winston-Salem-High Point, NCGreenville-Spartanburg, SCHarrisburg-Lebanon-Carlisle, PAHartford, CTHouston, TXHuntington-Ashland, WV-KY-OHIndianapolis, INJohnson City-Kingsport-Bristol, TN-VAKansas City, MO-KSKnoxville, TNLansing-East Lansing, MILouisville, KY-INManchester, NHMemphis, TN-AR-MSMiddlesex-Somerset-Hunterdon, NJMilwaukee, WIMinneapolis-St. Paul, MN-WI
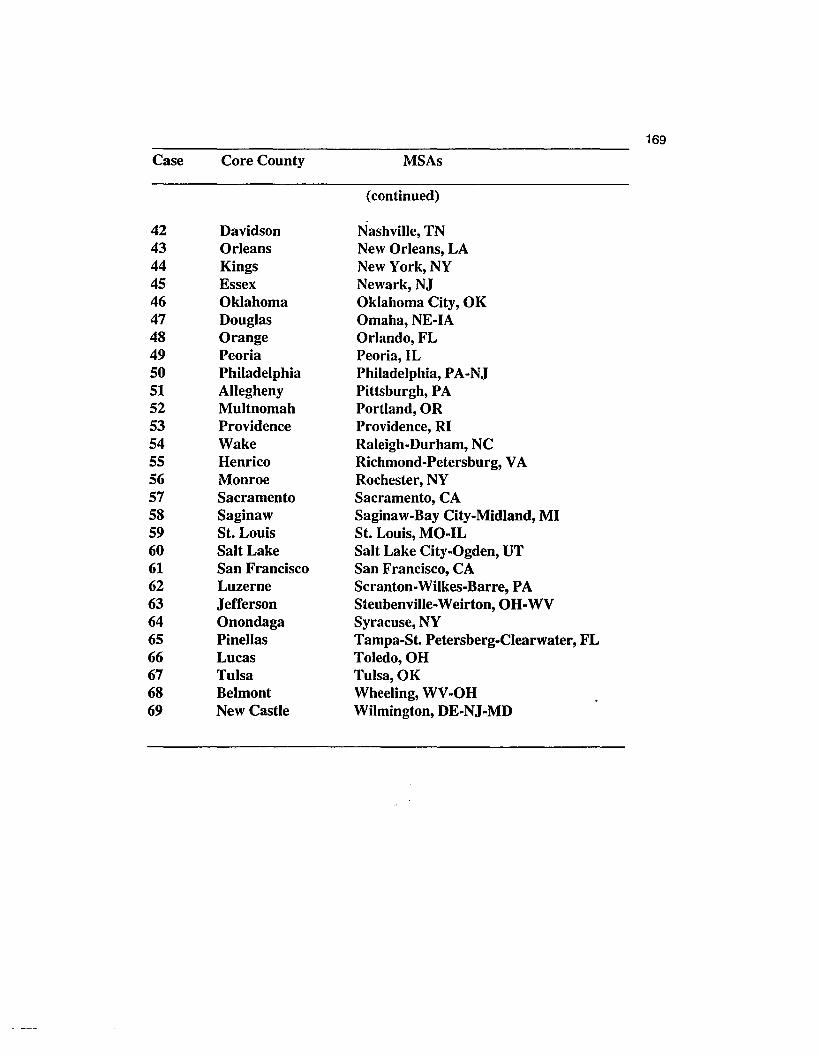
169
Case Core County MSAs
(continued)
42 Davidson Nashville, TN43 Orleans New Orleans, LA44 Kings New York, NY45 Essex Newark, NJ46 Oklahoma Oklahoma City, OK47 Douglas Omaha, NE-IA48 Orange Orlando, FL49 Peoria Peoria,IL50 Philadelphia Philadelphia, PA-NJ51 Allegheny Pittsburgh, PA52 Multnomah Portland, OR53 Providence Providence, RI54 Wake Raleigh-Durham, NC55 Henrico Richmond-Petersburg, VA56 Monroe Rochester, NY57 Sacramento Sacramento, CA58 Saginaw Saginaw-Bay City-Midland, MI59 St. Louis St. Louis, MO-IL60 Salt Lake Salt Lake City-Ogden, UT61 San Francisco San Francisco, CA62 Luzerne Scranton-Wilkes-Barre, PA63 Jefferson Steubenville-Weirton,OH-WV64 Onondaga Syracuse, NY65 Pinellas Tampa-St. Petersberg-Clearwater, FL66 Lucas Toledo,OH67 Tulsa Tulsa, OK68 Belmont Wheeling, WV-OH69 New Castle Wilmington, DE-NJ-MD

170
= Model II of Decentralization of Business Oriented Services =case lcb64 lcb69 lcb79 lcb89 lcm69 lcm79 lcm89 mpop70-------------------------------~-----------------------------------------
1 1.0923 1. 2132 1.2430 1.1575 0.63601 0.58746 0.68679 810929.2 1.2133 1.3015 1.1910 1.1673 0.79127 0.87111 0.88904 594124.3 1.0731 1.1002 1.1359 1.2634 0.81791 0.83617 0.80208 276891.4 1.3410 1.3859 1. 2863 1.2755 0.70665 0.76780 0.78472 1.68650e+065 1.5006 1. 3034 1. 3892 1.1274 0.69993 0.67113 0.62490 291063.6 1.0886 1.1096 1. 0818 1.0807 1. 00032 0.99523 0.96546 360463.7 1.2924 1.3396 1.1383 1.2695 0.85427 0.96871 0.90816 2.0890ge+068 1.1138 1.0945 1.0279 1.0573 0.86882 0.94308 0.84524 345939.9 1.0795 1.0846 1. 0747 1.0768 0.96925 0.94306 0.87754 794083.10 0.8137 0.9069 1.0897 1.1068 1.06140 1.06386 1.1279 4.79098e+0611 1.6701 1.7197 1.4882 1.3131 0.51273 0.53003 0.58989 840347.12 1.1010 1.1497 1.1337 1.0924 0.95611 0.90417 0.86808 349439.13 0.9660 1.0094 1.0175 1. 0334 1.00750 1.00550 1.00700 6.09581e+0614 1.0657 1.0822 1.0724 1.0877 1. 04520 1.04934 1.04119 1. 38485e+0615 1. 0364 1.0357 1.0563 1. 0924 0.98293 0.97511 0.95668 2.0641ge+0616 1.1278 1.1474 1.1437 1.0764 0.89575 0.83135 0.77161 1.14943e+0617 1.0256 1.0282 1.0436 1. 0344 0.98572 0.97162 0.94283 1.55595e+0618 1. 4459 1.4192 1. 2487 1. 2990 0.88691 0.89458 0.91666 362638.19 1.0198 0.9565 1. 0531 1.0848 1. 01983 0.97867 0.96012 972662.20 1.1393 0.7455 1.2465 1.1717 0.84923 0.85356 0.73699 1.10405e+0621 1.0118 1.0071 1.0321 1.0267 1. 00047 1.00238 1. 00430 339618.22 1.1561 1.1636 1.0143 0.9314 0.96130 1. 05353 1. 03707 4.54987e+0623 1.1890 1.1811 1. 0897 1.0767 0.96563 0.99406 0.91650 254515.24 1.0263 1.0055 1. 0125 1.0139 1. 01251 1.00331 1.01426 795974.25 1. 2285 1.3097 1.1661 1.0845 0.87023 0.83044 0.81446 742159.26 1.0716 1. 2984 0.9032 0.9231 0.88556 0.77253 0.81655 473226.27 1.1165 1.1652 1.3378 1.2430 0.84364 0.93834 1. 00389 510291.28 1.1243 1.1430 1.1503 1.1436 0.96360 0.90916 0.89392 1.40943e+0629 1. 0314 1. 0211 1.0328 1.0253 1.00834 0.98289 0.99007 1.89100e+0630 1. 3760 1. 5200 1. 2012 1. 2987 0.88556 0.90030 0.76501 306785.31 1. 0857 1.0391 1. 0605 1.0825 0.99847 1.00906 0.97600 1.10988e+0632 1.1502 1.2376 0.9419 1. 0177 1. 06358 0.97553 0.95953 372876.33 1. 2076 1.1904 1. 2224 1.1540 0.92527 0.96171 0.98670 1.37074e+0634 1.3269 1.3087 1.2205 1.2152 0.82302 0.82648 0.73102 476538.35 1.1178 1.1254 1.1388 1.1791 1. 02021 1. 06100 1. 07678 378423.36 1. 0780 1.1392 1. 0796 1. 0889 0.91683 0.99555 0.94314 906752.37 1.0481 1.0044 1.0714 1.0715 1.10550 1. 09689 1.17511 443817.38 1. 0458 0.9950 1. 0309 1. 0374 0.98967 0.95805 0.89486 834006.39 0.8268 0.9710 0.9980 1. 0300 1.03192 1. 01724 1.05182 851903.40 1. 0570 1.0866 1.1258 1.1196 0.98300 0.97967 0.90524 1.4036ge+0641 1.1552 1.1979 1.1941 1.1331 0.83683 0.88033 0.84465 1.98172e+0642 1.2113 1. 2060 1.1500 1.1232 0.89379 0.78852 0.72371 699144.43 1.1595 1.1284 1.2201 1.0560 0.81143 0.76262 0.80079 1.09917e+0644 0.3234 0.3493 0.3778 0.3917 1.48611 1.51301 1.38634 9.07557e+0645 1.2615 1.2545 1. 2430 1.0194 0.84748 0.84135 0.84806 1.93408e+0646 1.0442 1. 0279 1. 0536 1.0860 1. 04300 1.00476 1. 04040 717825.47 1.0493 1. 0650 1.0555 1.1139 1. 01116 0.99273 l.01193 553452.48 1.0492 1. 0632 1.0924 1.1421 0.98830 0.96813 0.97906 453270.49 1.4456 1.2968 1.2458 1.1159 0.82184 0.93366 0.99782 341979.

171
case lcb64 lcb69 1cb79 1cb89 1cm69 1cm79 1cm89 mpop70--------------------------------------------------------------------------
(continued)
50 1.2310 1.3252 1. 2210 1.1~05 0.88328 0.84614 0.78470 4.81791e+0651 1.1634 1.1382 1.1268 1.1463 0.95885 0.92011 0.87776 2.3474ge+0652 1.1169 1.1554 1. 2699 1. 2365 0.86441 0.76953 0.77426 920888.53 1.1141 1.1865 1. 0854 1.1448 0.99563 1.02164 1. 04096 946725.54 1.1624 1. 4952 1. 2152 1.2229 0.98217 0.88457 0.75805 445661.55 0.9298 0.9559 0.8136 1. 2626 0.53289 0.72094 0.57575 676351.56 1.1174 1.1001 1.1005 1.0588 1.02866 1.04377 1.00024 961516.57 1. 0372 1.0432 1.1242 1.1324 0.98530 0.92187 0.90658 844425.58 1. 4231 1.3023 1.0452 0.9797 0.96989 1. 05448 1.04099 400851.59 0.6370 0.8236 0.9506 1.1048 1. 03283 0.91998 0.78274 2.42866e+0660 1.0440 1.0343 1.0660 1. 0291 0.99611 0.99875 0.93681 683913 .61 1.1350 1. 2150 1.1841 1. 2391 0.86463 0.86015 0.88286 1.47795e+0662 0.9465 1.0372 1. 0791 1.0748 1.00941 1.02047 0.94176 696026.63 1.9439 2.0406 1.1935 1. 2904 0.70452 0.45808 0.81947 165627.64 1. 0568 1.0638 1. 0816 1.0642 0.99594 0.95757 0.92750 636507.65 1. 0662 0.9142 0.8117 0.8030 0.89387 0.98352 1.22300 1.10555e+0666 1.0375 1.0545 1.0720 1.0898 0.94419 0.92567 0.86002 607163.67 1.1266 1.0692 1.0429 1.0445 1.02208 0.99975 0.92342 527533.68 0.8812 0.7506 0.6703 0.7308 1. 02708 0.95753 1.04701 182712.69 1.1382 1.0991 1. 0972 1.1042 0.93199 0.95421 0.96593 499493.

172
Model II of Decentralization of Business Oriented Services
case mpop90 pcpc pinc69 pinc79 pinc89 buse64 buse69 buse79---------------------------------------------------------------------1 874304. 4.6 3749. 7598. 16363. 4493. 6251.00 10321.02 686688. 8.1 3507. 7873. 15458. 1782. 2675.00 5594.003 315121. 8.2 2954. 7267. 13893. 529. 855.000 1983.004 2.83351e+06 32.5 3459. 7621. 18452. 15990. 27088.0 38003.05 396809. 14.7 2576. 5873. 11799. 997. 1570.00 2591.006 781572. 45.6 3014. 7540. 15123. 2477. 4651. 00 :1178.07 2.38217e+06 8.3 2886. 5877. 11994. 16604. 23659.0 26839.08 361226. -3.2 2928. 7601. 12348. 1646. 2660.00 4569.009 907810. 2.7 2848. 7070. 13277. 5461. 8702.00 16649.010 2.87067e+06 2.3 3747. 8439. 20343. 12285. 20663.0 46119.011 1.1620ge+06 19.6 3323. 7872 . 16910. 5212. 8744.00 15855.012 433210. 1.6 2863. 6886. 13619. 2242. 3648.00 7636.0013 6.06997e+06 0.2 3792. 8229. 15697. 94231. 128822. 201019.14 1.45265e+06 3.7 3395. 7871. 15354. 11257. 16362.0 27194.015 1.83112e+06 -3.6 3727. 8099. 14912. 24129. 34229.0 46032.016 1.37742e+06 10.7 3390. 7591. 14907. 8440. 14642.0 27101. 017 2.55336e+06 30.4 3694. 8667. 16243. 17398. 29998.0 67855.018 350861. -8.8 3296. 8226. 13625. 1546. 2069.00 3369.0019 951270. 1.0 3629. 7643. 14495. 5509. 7349.00 13206.020 1.62298e+06 13 .6 3557. 8555. 15590. 9925. 15539.0 33048.021 392928. 6.90 3446. 8305. 15365. 3500. 4660.00 10383.022 4.38230e+06 -2.4 3505. 7608. 13016. 34598. 50050.0 52216.023 278990. 1.0 2941. 7480. 13434. 1447. 1853.00 3656.0024 1.33205e+06 36.9 3336. 7965. 1517 8. 5469. 7941.00 16622.025 942091. 10.6 3185. 7426. 15373. 2393. 3568.00 7572.0026 640861. 12.4 2759. 6746. 13918. 1414. 3011. 00 5190.0027 587986. 5.70 3218. 7525. 14890. 1990. 3483.00 5775.0028 1.55273e+06 7.30 3854. 8342. 18983. 9433. 14716.0 28539.029 3.30194e+06 20.7 3402. 9062. 15202. 18656. 34880.0 109815.30 312529. -7.1 2773. 6785. 12068. 796. 1233.00 2083.0031 1.24982e+06 7.1 3534. 7677 . 14614. 7819. 12502.0 22053.032 436047. 0.6 2705. 6497. 12725. 513. 843.000 1336.0033 1.56628e+06 9.3 3375. 7610. 13712. 12757. 18082.0 25299.034 604816. 6.9 2750. 6895. 14007. 1676. 2657.00 6718.0035 432674. 3.1 3444. 7509. 13740. 1642. 3144.00 5557.0036 952662. -0.4 3200. 7324. 14067. 6367. 10367.0 19662.037 701923. 14.3 3092. 7390. 17404. 1868. 2332.0C 5479.0038 981747. 7.5 2762. 6697. 13330. 7010. 10562.0 18266.039 1.01984e+06 15.1 3524. 8357. 18714. 2948. 5403.00 :2676.040 1.43215e+06 2.5 3492. 7952. 13383. 13010. 19484.0 32254.041 2.46412e+06 15.3 3852. 9403. 18496. 14974. 26558.D ";8196.042 985026. 15.8 3173. 7578. 15195. 4338. 7629.0': :5556.043 1.23882e+06 -1. 4 2723. 6463. 11372. 9264. 13734 ..:. :3270.044 8.54685e+06 3.30 3072. 5753. 12388. 1359? . 17552.') :~396.0
45 1.82432e+06 -2.9 3753. 7538. 17574. 19286. 23755.C ::~658.0
46 958839. 11.4 3288. 7987. 13794. 5381. 7520.0C :7792.047 618262. 5.7 3316. 7809. 14644. 4615. 55?().OC :4699.048 1.072"75e+06 53.3 3038. 6984. 14570. 2946. 45"76. 'JO :3509.049 339172.
.., ,3458. 8343 . 13924. 1884. 27,,5.00 5124.00- I • j

173
case mpop90 pcpc pinc69 pinc79 pinc89 buse64 buse69 buse79---------------------------------------------------------------------
(continued)
50 4.85688e+06 3.0 3041. 6053. 12091. 33023. 53082.0 61330.051 2.05671e+06 -7.3 3'390. 7986. 15115. 19284. 26139.0 46469.052 1.23984e+06 12.1 3547. 8129. 14462. 8987. 14501.0 26517.053 654854. 5.9 3123. 6641. 13871. 6631. 10034.0 13584.054 735480. 31. 2 3007. 7708. 17195. 1694. 3350.00 9370.0055 865640. 13.7 3713. 8562. 18019 . 441. 915.000 3464.00::'':' 1.00241e+06 3.2 3834. 8294. 16162. 8870. 13181. 0 19532.057 1.48110e+06 34.7 3414. 7950. 15265. 4437. 6442.00 15713.0:8 399320. -5.3 3152. 7263. 12355. 1135. 1633.00 2974.0053 2.44410e+06 2.8 4046. 9215. 18625. 3879. 9307.00 23909.060 1.07223e+06 17.8 2972 . 7013 . 12222. 5649. 7547.00 15097.061 1.60368e+06 7.7 4289. 9265. 19695. 33088. 46963.0 73591.0.-') 734175. 0.7 2674. 6008. 12002. 1739 . 2451.00 4331. 00c__.~ 142523. -13. 2828. 7191. 11001. 406. 479.000 862.000.- , 659864. 2.6 3443. 7286. 14703. 5589. 8911.00 13451.0Ch
-:5 2.06796e+06 28.2 3300. 7623. 15712. 3493. 5173.00 12561.066 614128. -0.4 3491. 7588. 13778. 4312. 6160.00 10817 . 067 708954. 7.9 3358. 8444. 14742. 4378. 7055.00 15177.068 159301. -14.2 2641. 6647. 10329. 239. 265.000 432.00069 578587. 10.6 3557. 8067. 17442. 4701. 8001.00 11605.0
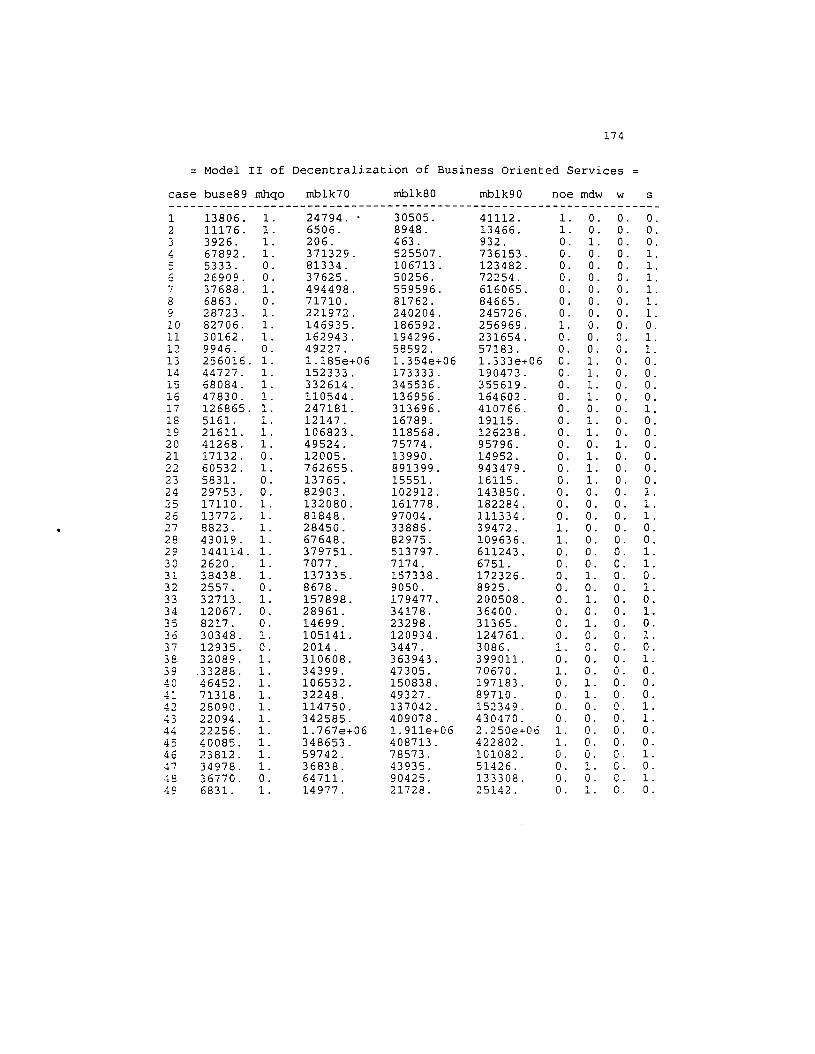
174
Model II of Decentralization of Business Oriented Services
case buse89 mhqo mblk70 mblk80 mblk90 noe mdw w s--------------------------------------------------------------------1 13806. I. 24794. 30505. 41112. I. O. O. O.2 11176. I. 6506. 8948. 13466. l. O. O. O.3 3926. I. 206. 463. 932. O. l. O. O.4 67892. I. 371329. 525507. 736153. O. O. O. l.S 5333. O. 81334. 106713. 123482. O. O. O. l.6 26909. O. 37625. 50256. 72254. O. O. O. l.7 37688. I. 494498. 559596 . 616065. O. O. O. l.8 6863. O. 71710. 81762. 84665. O. O. O. l.9 28723. I. 221972. 240204. 245726. O. O. O. l.ID 82706. l. 146935. 186592. 256969. l. O. O. O.11 30162. l. 162943. 194296. 231654. O. O. O. l.12 9946. O. 49227. 58592. 57183. O. O. O. l.13 256016. I. 1.185e+06 1.354e+06 1.333e+06 O. l. O. O.14 44727. l. 152333. 173333. 190473. O. l. O. O.15 68084. l. 332614. 345536. 355619 . O. l. O. O.16 47830. l. 110544. 136956. 164602. O. l. O. O.17 126865. I. 247181. 313696. 410766. O. O. O. I.18 5161. I. 12147. 16789. 19115. O. I. O. O.19 21611. I. 106823. 118568. 126238. O. I. O. O.20 41268. I. 49524. 75774. 95796. O. O. I. O.21 17132. O. 12005. 13990. 14952. O. l. O. O.22 60532. l. 762655. 891399. 943479. O. I. O. O.23 5831. O. 13765. 1555l. 16115. O. l. O. O.24 29753. O. 82903. 102912. 143850. O. O. O. I.25 17110. l. 132080. 161778. 182284. O. O. O. l.26 13772. I. 81848. 97004. 111334. O. O. O. I.27 8823. I. 28450. 33886. 39472 . l. O. O. O.28 43019 . I. 67648. 82975. 109636. l. O. O. O.29 144114. I. 379751. 513797. 611243. O. O. O. I.30 2620. l. 7077 . 7174. 6751. O. O. O. l.31 38438. I. 137335. 157338. 172326. O. l. O. O.32 2557. O. 8678. 9050. 8925. O. O. O. I.33 32713. l. 157898. 179477. 200508. O. l. O. O.34 12067. O. 28961. 34178. 36400. O. O. O. l.35 8217. O. 14699. 23298. 313 65. O. l. O. O.36 30348. l. 105141. 120934. 124761. O. O. O. I.37 12935. O. 2014. 3447. 3086. l. O. O. O.38 32089. I. 310608. 363943. 399011. O. O. O. I.39 .33288. l. 34399. 47305. 70670. l. O. O. O.40 46452. I. 106532. 150838. 197183. O. l. O. O.41 71318. l. 32248. 49327. 89710. O. l. O. O., ~ 28090. I. 114750. 137042. 152349. O. O. O. l.-::.;
43 22094. I. 342585. 409078. 430470. O. O. O. 1.44 22256. I. 1.767e+06 1.911e+06 2.250e+06 l. O. O. O.45 40085. l. 348653. 408713 . 422802. l. O. O. O.46 23812. l. 59742. 78573. 101082. O. O. O. I..p 34978 . l. 36838. 43935. 51426. O. l. G. O.48 36770. O. 64711. 90425. 133308. O. O. C. l.49 6831. l. 14977. 21728. 25142. O. 1. O. O.

175
case buse89 mhqo mblk70 rnblk80 mblk90 noe mdw w s--------------------------------------------------------------------
(continued)
50 66741. 1. 844300. 883477. 929907. l. O. o. O.51 63076. 1. 164957. 169772 . 168382. l. O. O. O.52 35931. 1. 22777. 32184. 38695. O. O. l. O.53 22669. 1. 25338. 27361. 38861. 1. O. O. O.54 22744. O. 115143. 146777. 183447. O. O. O. 1.55 9714. 1. 185551. 221474. 252340. O. O. O. 1.56 30600. 1. 58949. 77891. 93819. 1. O. O. O.57 33222. O. 37971. 61539. 101940. O. O. 1. O.58 3666. l. 27739. 37321. 38810. O. l. O. O.59 45861. 1. 379100. 407213 . 423182. O. l. O. O.60 29591. O. 6269. 8894. 10464. O. O. l. O.61 93288. 1. 127205. 127391. 122494. O. O. l. O.62 6730. O. 3562. 4316. 7660. 1. O. O. O.63 915. O. 6878. 6337. 5591. O. l. O. O.64 18069. 1. 23398. 31016. 39095. l. O. O. O.65 29458. 1. 115595. 148058. 185503. O. O. O. 1.66 19322. 1. 55130. 65505. 69717. O. l. O. O.67 19650. O. 41602. 51300. 58186. O. o. O. 1.68 701. O. 3930. 3787. 3196. O. l. O. O.69 32454. l. 60896. 73203. 85641. O. O. O. 1.

APPENDIXD
GAUSS ECONOMETRIC OUTPUT

SymbolEcon.Program Text
DEFINITION OF VARIABLES IN SERVICEDECENTRALIZATION ESTIMATION
Description
177
Dependent VariablesPCCLC LCC
PCBLC LCB
Change in the location coefficient of consumer orientedservices in a core county in the LCC models
Change in the location coefficient of business orientedservices in a core county in the LCB models
Structural Change VariablesPCPCON POPUC Change in metropolitan population in the LCC models
PCTCP POPUC
MPOPC POPUC
Change in metropolitan population in the LCB (196979) models
Change in metropolitan population in the LCB (197989, 1969-89) models
PCECON COSEMPC Change in consumer oriented se~vice employment in theLCC models
PCEB BUSEMPC Change in business oriented service employment in theLCB models
Relocation Cost VariablesINERLC INERTIA Inertia of the existing decentralization of consumer
oriented service in the LCC models
INERTIA INERTIA Inertia of the existing decentralization of businessoriented service in the LCB models
PCCOM COMEMPC Change in employment of communications (SIC 4800)in the LCB models
Manufacturing Decentralization VariablePCLCM MANUFC Change in the location coefficient of manufacturing
(SIC 2000-3999) in the LCB models

Corporate Influence Variables 178
METHQ HQUARTER Dummy variable equals one if core county'smetropolitan area has 'Fortune' 500corporate headquarter in the LCB models
CORPSLS CPSALES
Service Demand VariablesPCCINC PERINCC
Sales (in million dollars) for 'Fortune' 500industrial corporations in core county'smetropolitan area in the LCB models
Change in real per capita income in the LCCmodels
PCINC PERINCC Change in real per capita income in the LCBmodels
Racial Composition VariablesPCBLK BLACKC Change in metropolitan black population in the
LCC and LCB (1969-79) models
METBLKC BLACKC Change in metropolitan black population in theLCB (1979·89, 1969-89) models
Reeional Location VariablesNOE NORTHEAST Regional dummy
MDW
W
MIDWEST
WEST
Regional dummy
Regional dummy
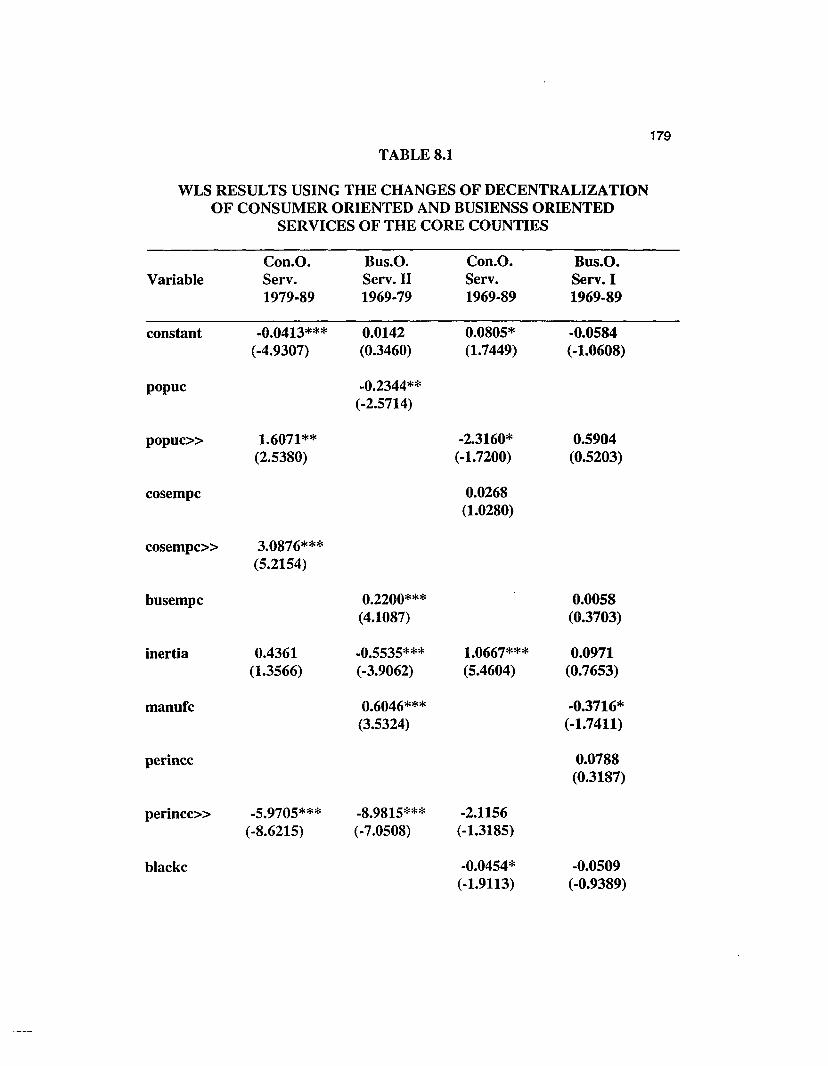
179
TABLE 8.1
WLS RESULTS USING THE CHANGES OF DECENTRALIZATIONOF CONSUMER ORIENTED AND BUSIENSS ORIENTED
SERVICES OF THE CORE COUNTIES
Con.O. Bus.O. Con.O. Bus.O.Variable Servo Servo II Servo Serv.I
1979-89 1969-79 1969-89 1969-89
constant -0.0413*** 0.0142 0.0805* -0.0584(-4.9307) (0.3460) (1.7449) (-1.0608)
popuc -0.2344**(-2.5714)
popuc» 1.6071** -2.3160* 0.5904(2.5380) (-1.7200) (0.5203)
cosempc 0.0268(1.0280)
cosempc» 3.0876***(5.2154)
busempc 0.2200*** 0.0058(4.1087) (0.3703)
inertia 0.4361 -0.5535*** 1.0667*** 0.0971(1.3566) (-3.9062) (5.4604) (0.7653)
manufc 0.6046*** -0.3716*(3.5324) (-1.7411)
perincc 0.0788(0.3187)
perincc» -5.9705*** -8.9815*** -2.1156(-8.6215) (-7.0508) (-1.3185)
blackc -0.0454* -0.0509(-1.9113) (-0.9389)
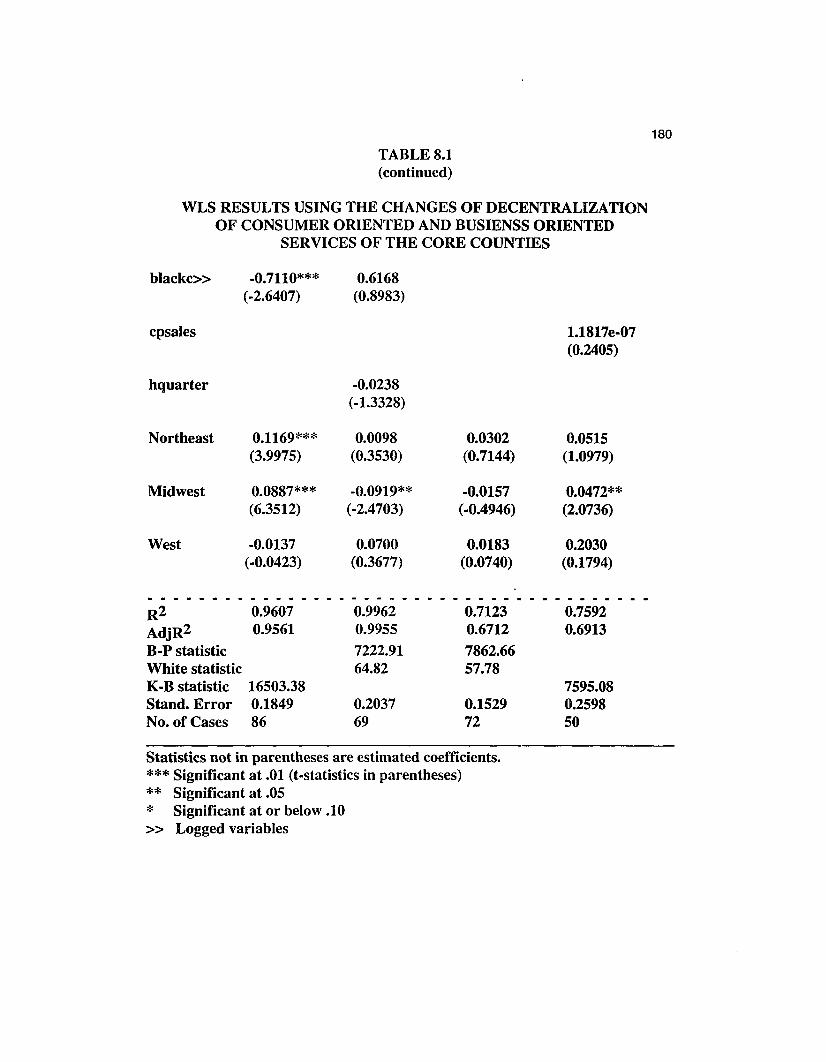
180
TABLE 8.1(continued)
WLS RESULTS USING THE CHANGES OF DECENTRALIZATIONOF CONSUMER ORIENTED AND BUSIENSS ORIENTED
SERVICES OF THE CORE COUNTIES
blackc» -0.7110*** 0.6168(-2.6407) (0.8983)
cpsales 1.1817e-07(0.2405)
hquarter -0.0238(-1.3328)
Northeast 0.1169*** 0.0098 0.0302 0.0515(3.9975) (0.3530) (0.7144) (1.0979)
Midwest 0.0887*** -0.0919** -0.0157 0.0472**(6.3512) (-2.4703) (-0.4946) (2.0736)
West -0.0137 0.0700 0.0183 0.2030(-0.0423) (0.3677) (0.0740) (0.1794)
R2 0.9607 0.9962 0.7123AdjR2 0.9561 0.9955 0.6712
B-P statistic 7222.91 7862.66White statistic 64.82 57.78K-B statistic 16503.38Stand. Error 0.1849 0.2037 0.1529No. of Cases 86 69 72
Statistics not in parentheses are estimated coefficients.*** Significant at .01 (t-statistics in parentheses)** Significant at .05* Significant at or below .10» Logged variables
0.75920.6913
7595.080.259850

181
Model of Decencralizacion (1969-79) of Consumer Oriented Services=================================================================* Location Coefficient:mean:lcon59 lcon69 lcon79 peele1.021011 1.004657 0.9828011 -0.01957881standard deviation:0.09905550 0.09045941 0.07592998 0.05561930LSQiGAUSS Version 3.1: Applied Daca Associates. (1994/04/10101:03:07)
Ordinary Least Sq~ares Estimation
Dependenc Variable = DEPEstimation Range = 1 72Number of Observations = 72Mean of Dependenc Variable = -0.019579Star-dard Error of Dependent Variable = 0.0=5619
R-Square = 0.18206 R-Square Adjusted = 0.078190Star-dard Error of che Estimate = 0.053401Log-Likelihood = 113.60
Sum of Squares SS DF MSS F Prob>FExplained 0.039987 8 0.0049983 1.7528 0.10367Residual 0.17965 63 0.0028516Total 0.21964 71 0.0030935
Variable Estimated Standard t-Ratio ProbName Coefficient Error 63 DF >ItlLPCPCON 0.98618 0.92721 1. 0636 0.29157PCECON 0.050174 0.042978 1.1674 0.24744LPCCINC 0.14952 1.1981 0.12480 0.90108LPCBLK 0.025080 0.34750 0.072172 0.94269INERLC 0.23276 0.15154 1. 5360 0.12955NOE 0.028483 0.023416 1.2164 0.22838MmoJ' 0.020572 0.018223 1.1289 0.26322w -0.0050886 0.027290 -0.18647 0.85268CONSTAJ.\JT -0.057928 0.025246 -2.2945 0.025105
0.0229640.000379111.6871E-050.000401780.00069260
INERLC
0.12080.003777
-0.002420-0.002001-0.0019380.000296
LPCBLK
1.4355-0.005762
0.012520.01061
0.0031150.006962-0.02111
LPCCINC
0.0018471-0.026160
-0.0024422-0.0025969
-0.00015945-3.075E-05-5.413E-05-1.344E-06
PCECON
Variance-Covariance Matrix of CoefficientsLPCPCON 0.85971PCECON -0.017081LPCCINC 0.029293LPCBLK -0.068042INERLC 0.023093NOE 0.010249MDW 0.0077269W 0.00037648CONSTl·j·jT -0.0035326
LPC?CON
NOEMDWWCONST.J:.l·1T
0.00054830.O,j025600.0':'01.92.5
-0.0003'718
0.00033210.0001424 0.000745
-0.0002325 -0.000205MD\-j \'J
0.000637t::ONST;'l.JT
Correlation ~atrix of Coefficients
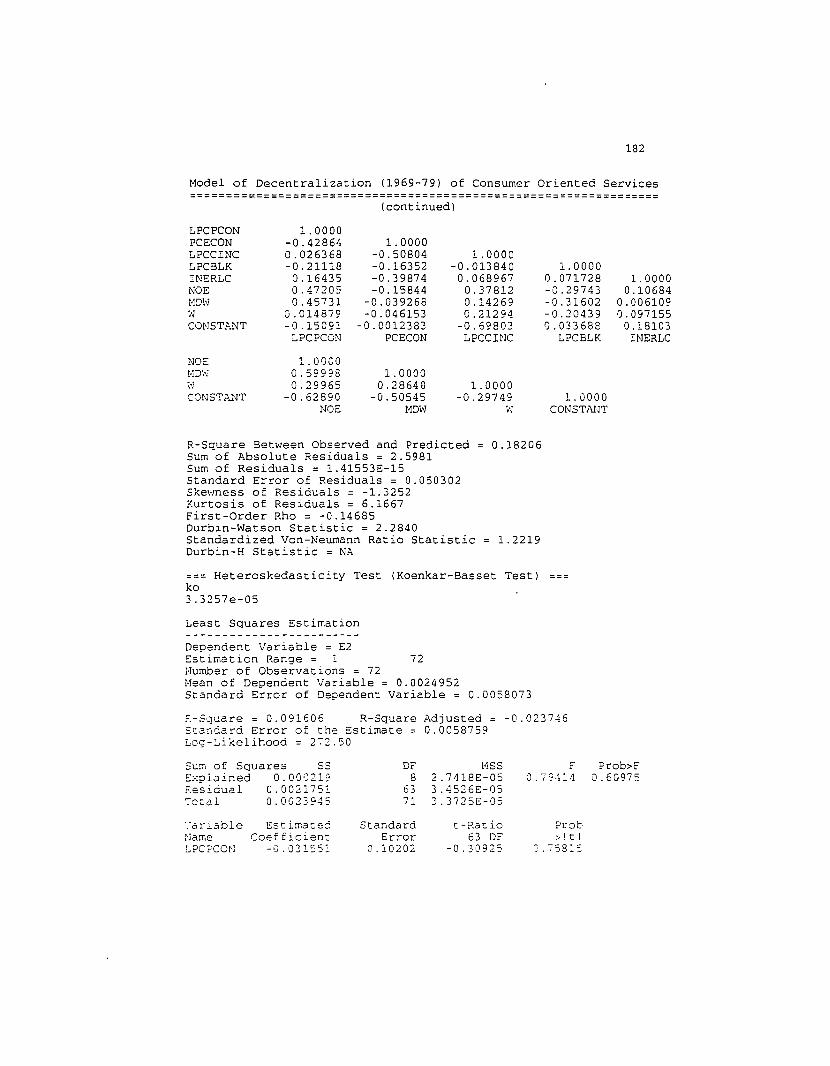
182
Model of Decentralization (1969-79) of Consumer Oriented Services=================================================================
(continued)
LPCPCON 1. 0000PCECON -0.42864 1.0000LPCCINC 0.026368 -0.50804 1.0000LPCBLK -0.21118 -0.16352 -0.013840INERLC 0.16435 -0.39874 0.068967NOE 0.47205 -0.15844 0.37812HDi-i 0.45731 -0.039268 0.14269'II 0.014879 -0.046153 0.21294CONSTANT -0.15091 -0.0012383 -0.69803
L?CPCON PCECON LPCCINC
NOE 1. OOCO!-lD',·; 0.59998 1.0000~v 0.29965 0.28640 1.0000CONST.:>.NT -0.62890 -0.50545 -0.29749
NOE MDW vi
1.00000.071728-0.29743-0.31602-0.204390.033688
LPCBLK
1.0000CONSTANT
1.00000.10684
0.0061090.097155
0.18103INERLC
R-Square Between Observed and Predicted 0.18206Sum of Absolute Residuals = 2.5981Sum of Residuals = 1.41553E-15Standard E~ror of Residuals = 0.050302Skewness of Residuals = -1.3252Kurtosis of Residuals = 6.1667First-Order Rho = -0.14685Durbin-Watson Statistic = 2.2840Standardized Von-Neumann Ratio Statistic 1.2219Durbin-H Statistic = NA
=== Heteroskedasticity Test (Koenkar-Basset Test)ko3.3257e-05
Least Squares Estimation
Dependent Variable = E2Estimation Range = , 72Number of Observations = 72Mean of Dependent Variable = 0.0024952Standard Error of Dependent Variable = 0.0058073
~-Square = 0.091606 R-Square Adjusted = -0.023746Standard Error of the Estimate 0.0058759Log-~ikelihood 272.50
Sum of Squares S OF l-1SS C Prob>FExplained 0.00,n1 8 2.7418E-05 0.79414 0.60975F.esidual 0.002175 63 3.4526E-05Total 0.002394 71 3.3725E-05
'':ariable Estima c. Standard t-p.at:io ProbName CoefE ici n Error 63 DF >itlL?CPCON -0.031 5 0.10202 -0.30925 O.758}S

183
Model of Decentralization (1969-79) of Consumer Oriented Services=================================================================
(continued)
PCECON 0.00056127 0.0047290 0.11869 0.90590LPCCINC 0.12207 0.13183 0.92593 0.35802LPCBLK -0.069732 0.038237 -1.8237 0.072945INERLC -0.011210 0.016674 -0.67230 0.50385NOE 0.00057081 0.0025766 0.22154 0.82539MD\tJ 0.0018707 0.0020051 0.93299 0.35439~'J 1. 7178~-05 0.0030028 0.0057206 0.99545CONST."l'lT 0.0';0812:5 0.0027779 0.29239 0.770?5
Variance-Covaria~ce l1atrix of CoefficientsLPCPCON 1J.C'1,)~:
PCECON -0. CC'CJ2065 2.236E-05LPCCINC 0.000354: -0.000317 0.01738LPC3LK -0.0008232 -2.957E-05 -6.977E-05 0.001462INERLe 0.0002796 -3.144E-05 0.000152 4.573E-05 0.0002780NOE 0.0001241 -1.931E-06 0.000128 -2.930E-05 4.590E-06HD\<J 9.355E-05 -3.724E-07 3.772E-05 -2.423E-05 2.043E-07vJ 4.558E-06 -6.554E-07 8.430E-05 -2.347E-05 4.865E-06CONSTP-.NT -4.277E-G5 -1.627E-08 -0.0002556 3.578E-06 8.386E-06
LPCPCON PCECON LPCCINC LPCBLK INERLC
NOE 6.639E-06MOly 3.10E-06 4.021E-06W 2.3182-06 1.724E-06 9.·017E-06CONSTJ-.NT -4.5012-06 -2.815E-06 -2.482E-06 7.717E-06
NOE MOW W CONSTANT
Correlation r1atrix of CoefficientsLPCPCON 1.0000PCECON -0.42564 1.0000LPCCINC 0.026368 -0.50804 1. 0000LPCBLK -0.21118 -0.16352 -0.013840 1.0000INERLC 0.16435 -0.39874 0.068967 0.071728 1. 0000NOE 0.47205 -0.15844 0.37812 -0.29743 0.10684MOW 0.45731 -0.039268 0.14269 -0.31602 0.0061094ioJ 0.014879 -0.046153 0.21294 -0.20439 0.097155CONSTANT -0.15091 -0.001238 -0.69803 0.033688 0.18103
LPCPCON PCECON LPCCINC LPCBLK INERLC
NOE 1.00001m",' 0.59998 1.0000~~J 0.29965 0.28640 1.0000CONST.::,NT -0.62890 -0.50545 -0.29749 1. 0000
NGE l-ImoJ TtJ CONSTi\NT
R-Square Between Gbserved and PredictedSum of Absolute ?esid~als = 0.22386Sum of Residuals = -2.333202-16Standard Error of ?esiduals = G.005534?Skewness of Residu 1s = 4.1913Kurtosis of Pesidu ls = 25.681First-Order ~hc = .062599
0.091606

184
Hodel of Decentralization (1969-79) of Consumer Oriented Services=================================================================
(continued)
Durbin-Watson Statistic = 1.8737St~ndardized Von-Neumann Ratio StatisticDurbir:-H Statistic = NA
-0.54350
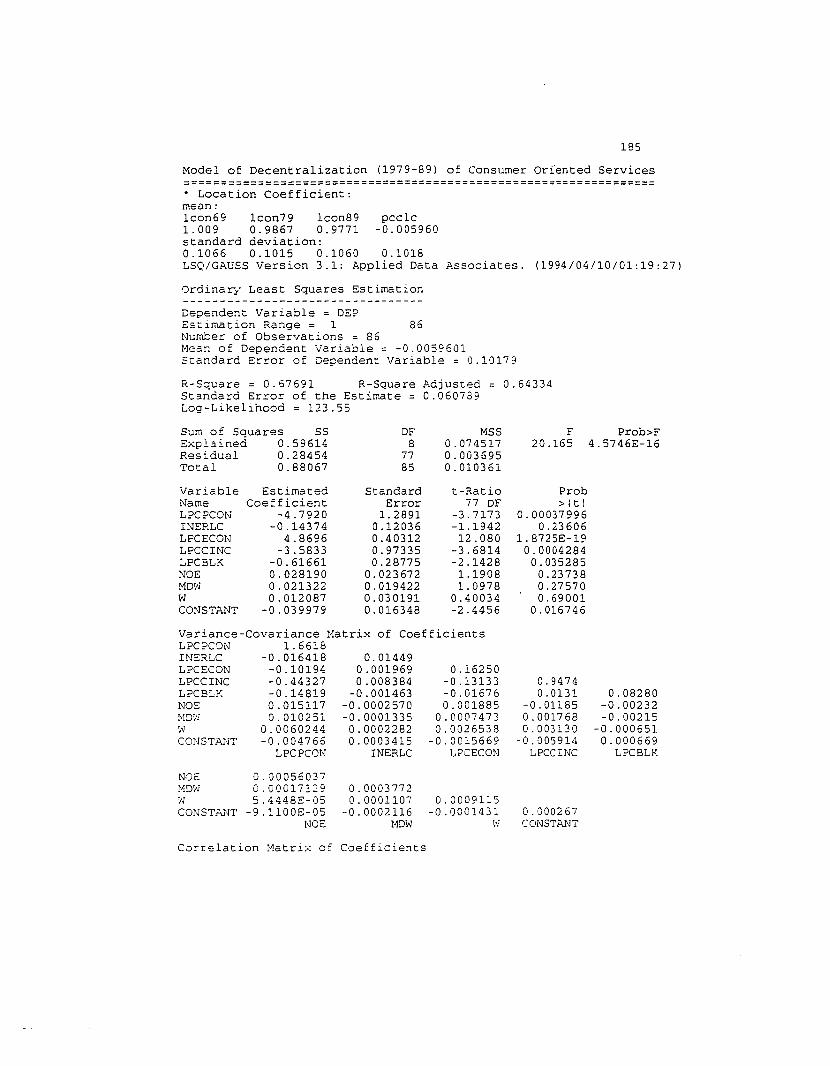
185
Model of Decentralization (1979-89) of Consumer Oriented Services=================================================================* Location Coefficient:mean:Icon69 Icon79 Icon89 peele1.009 0.9867 0.9771 -0.005960standard deviation:0.1066 0.1015 0.1060 0.1018LSQ/GAUSS Version 3.1: Applied Data Associates. (1994/04/10101:19:27)
Ordinar.l Least Squares Estimation
Dependent Variable = DEPEstimation Range = 1 86Number of Observations = 86Mean of Dependent Variable = -0.0059601Standard Error of Dependent Variable = 0.10179
R-Square = 0.67691 R-Square Adjusted = 0.64334Standard Error of the Estimate = 0.060739Log-Likelihood = 123.55
Sum of Sauares SSExplained 0.59614Residual 0.28454Total 0.88067
DF8
7785
MSS0.0745170.0036950.010361
F Prob>F20.165 4.5746E-16
VariableNameLPCPCONINEP.LCLPCECONLPCCINCLPCBLKNOEMDlvWCONSTANT
EstimatedCoefficient
-4.7920-0.14374
4.8696-3.5833
-0.616610.0281900.0213220.012087
-0.039979
StandardError
1.28910.120360.403120.973350.28775
0.0236720.0194220.0301910.016348
t-Ratio77 DF
-3.7173-1.194212.080
-3.6814-2.14281.19081. 0978
0.40034-2.4456
Prob>Itl
0.000379960.23606
1.8725E-190.0004284
0.0352850.237380.275700.69001
0.016746
0.08280-0.00232-0.00215
-0.0006510.000669
LPCBLK
0.94740.0131
-0.011850.0017680.003130
-0.005914LPCCINC
0.16250-0.13133-0.016760.001885
0.00074730.0026538
-0.0015669L?CECON
0.014490.0019690.008384
-0.001463-0.0002570-0.00013350.00022820.0003415
INERLC
Variance-Covariance Matrix of CoefficientsLPCPCON 1.6618INERLC -0.016418LPCECON -0.10194LPCCINC -0.44327LPCBLK -0.14819NOE 0.015117MDW 0.010251W 0.0060244CONST?~T -0.004766
LPCPCON
NOEMDW';1
CONSTANT
O. ')00560370.000172295.4448E-05
-9.1l00E-05NOE
0.00037720.0001107
-0.0002116HDW
0.0009115-0.0001431
i"l}
0.0)00267CONSTJI.NT
Correlation Matrix of Coefficients
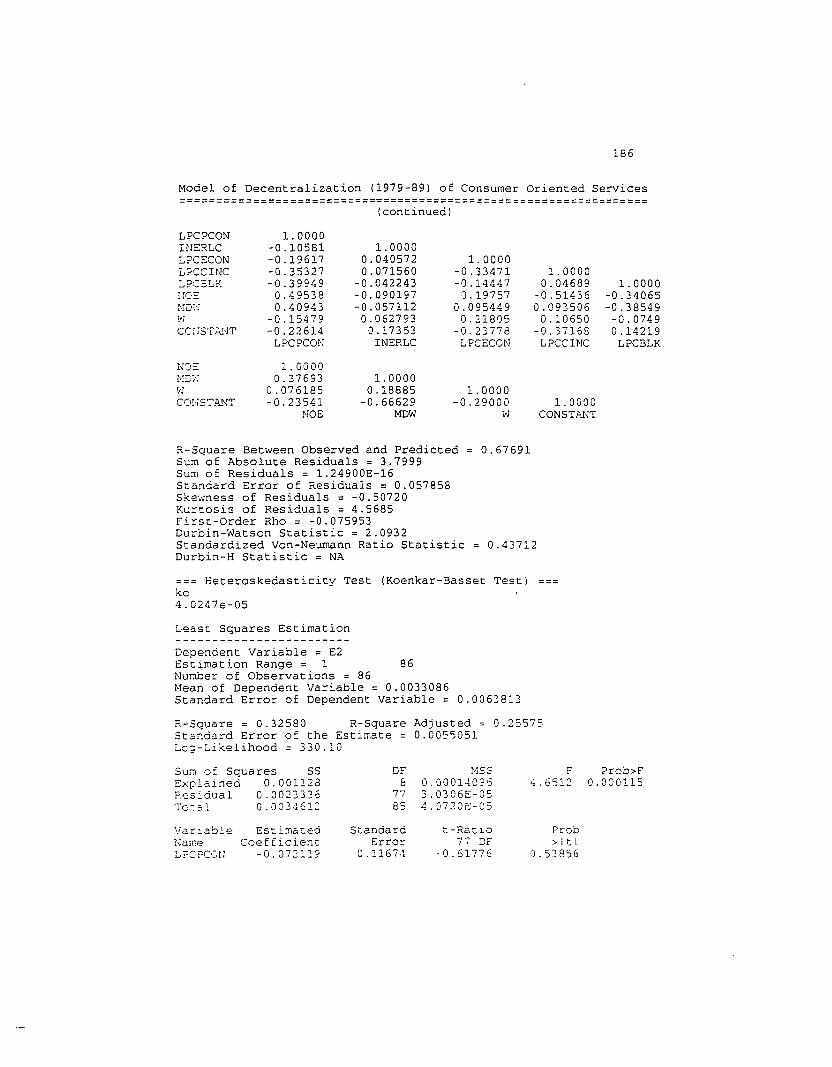
186
Model of Decentralization (1979-89) of Consumer Oriented Services=================================================================
(continued)
LPCPCON 1. 0000INERLC -0.10581 1.0000L?CSCON -0.19617 0.040572 1. 0000LPCCINC -0.35327 0.071560 -0.33471 1.0000L?CELK -0.39949 -0.042243 -0.14447 0.04689 1.0000nc·=: 0.49538 -0.090197 0.19757 -0.51436 -0.34065r"lI:':': 0.40943 -0.057112 0.095449 0.093506 -0.38549f;J -0.15479 0.062793 0.21805 0.10650 -0.0749CCjST.;NT -0.22614 0.17353 -0.23778 -0.3716S 0.14219
LPCPCON INERLC LI?CECON LPCCINC LPCBLK
Nf'=- 1.GOOOi"!I)·/: 0.37693 1.0000vi 0.076185 0.18885 1.0000C(J!j5T.~.NT -0.23541 -0.66629 -0.29000 1.0GOO
NOE MDW W CONSTl>.NT
R-Sauare Between Observed and Predicted 0.67691S~~-of Absolute Residuals = 3.7999Sum of Residuals = 1.24900E-16Standard Error of Residuals = 0.057858Skewness of Residuals = -0.50720K~~cosis of Residuals = 4.5685First-Order Rho = -0.075953Durbin-Watson Statistic = 2.0932Standardized Von-Neumann Ratio Statistic 0.43712Durbin-H Statistic = NA
=== Heteroskedasticity Test (Koenkar-Basset Test)kc4.0247e-05
Least Squares Estimation
Dependent Variable = E2Estimation Range = 1 86Number of Observations = 86Mean of Dependent Variable = 0.0033086Standard Error of Dependent Variable = 0.0063813
R-Sauare = 0.32580 R-Square Adjusted = 0.25575Sta~dard Error of the Estimate 0.0055051Leg-Likelihood = 330.10
Sum of Squares SS DF MSS F ?rob>FSxplalned 0.001128 8 .000140?6 4.6512 0.000115P.esidual 0.0023336 77 .0306E-05To,-sl 0.0034612 85 .07202-05
Variable Estimated Standard t-Ra::i.::J Pl:"QbName CoeEEicier;r: El:"ror ~~ DF >Itl
"LFCPCGI: -0.072119 0.1167·1 -0.61776 0.53856
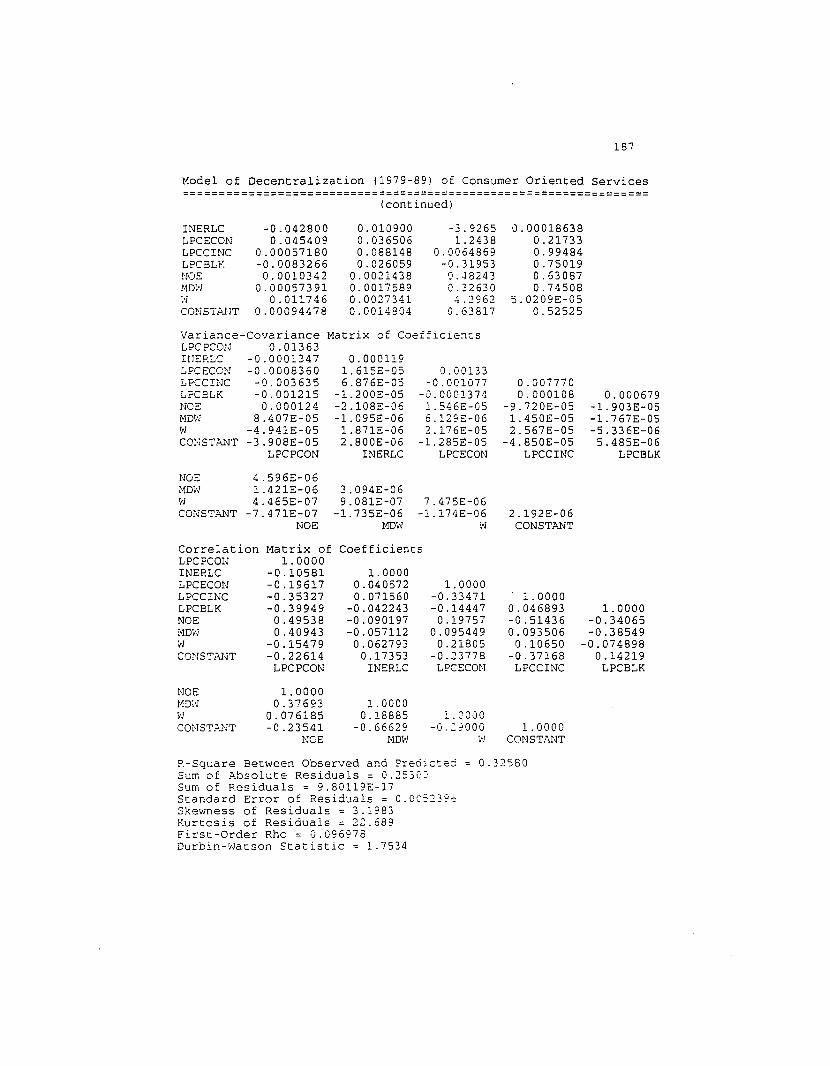
187
Model of Decentralization (1979-89) of Consumer Oriented Services=================================================================
(continued)
INERLCLPCECONLPCCINCLPCBU:NOS110:'1','1CONSTalT
-0.0428000.045409
0.00057180-0.00832660.0010342
0.000573910.011746
0.00094478
0.0109000.0365060.0881480.026059
0.00214380.00175890.00273410.0014804
-3.92651. 2438
0.0064869-0.31953
'J.-182430.326304.2962
0.63817
0.000186380.217330.994840.750190.630870.74508
5.0209E-050.52525
Matrix of CoefficientsVariance-CovarianceLPC?CC>?1 0.01363WERLC - 0 . 0001347LPCECON -0.0008360LPCCINC -0.003635LPC3LK -0.001215NOE 0.000124MDW 8.407E-05W -4.941E-05CO~ST~~T -3.908E-05
LPCPCON
NOE 4.596E-06IIDW 1.421E-06W 4.465E-07CONSTANT -7.471E-07
NOE
0.0001191.6152-056.876E-05
-1.2002-05-2.1082-06-1. 095E-061. 871E-062.800E-06
INERLC
3.094E-069.081E-07
-1.735E-06I.1lJW
0.00133-0.001077
-0.00013741.546E-056.1298-062.176E-05
-1. 285E-05LPCECON
7.475E-06-1.174E-06
w
0.0077700.000108
-9.720E-051.450E-052.567E-05
-4.850E-05LPCCINC
2.192E-06CONSTANT
0.000679-1.903E-05-1.767E-05-5.336E-065.485E-06
LPCBLK
CorrelationLPCPCONINERLCLPCECONLPCCINCLPCBLKNOE!'1DvJviCONSTANT
NOEl·m:·J
CONST."'.l"JT
Matrix of1. 0000
-0.10581-0.19617-0.35327-0.399490.495380.40943
-0.15479-0.22614
LPCPCON
1. 00000.37693
0.076185-0.23541
NOE
Coefficients
1. 00000.0405720.071560
-0.042243-0.090197-0.0571120.062793
0.17353INERLC
1.00000.18885
-0.66629!'lDW
1.0000-0.33471-0.144470.19757
0.0954490.21805
-0.23778LPCECON
1.0000-O.:::?OOO
:'1
. 1.00000.046893-0.514360.093506
0.10650-0.37168
LPCCINC
1.0000CONST.n.NT
1. 0000-0.34065-0.38549
-0.0748980.14219
LPCBLK
P-Sq~are Between Observed and Predicted = 0.32580Sum of Absolute Residuals = 0.2530JSum of Residuals = 9.80119E-17Standard Error of Residuals = 0.OC523~~
Skewness of Residuals = 3.1983Kurtosis of Residuals = 22.689First-Order Rho = 0.096978Durbin-Watson Statistic = 1.7534

188
Model of Decentralization (1979-89) of Consumer Oriented Services=================================================================
(continued)
Standardized Von-Neumann Ratio StatisticDurbin-H Statistic = NA
=== Weighted L-SQ Model
Weighted Least Squares Estimation
-1.1571
Deoendent Variable = DEPEstimation Range = 1 86~lumber of Observatic:",s = 86Mean of Dependent Variable = -0.070083Sta"dard Error of Dependent Variable = 0.88730
WARNING: No Constanc Term. @ Since the whole model was weighted,there is no constanc term; the original constant became l/weight. @
R-Square, AOV may net be reliable! @ In the Weighted LeastSquares, the R-Square Between Observed and Predicted is interpretedinstead of the adjusced R-Square. @
R-Square = 0.96065 R-Square Adjusted = 0.95605Standard Error of the Estimate = 0.18493Log-Likelihood = 27.873
Sum of Squares SS OF MSS F Prob>FExplained 64.287 9 7.1430 208.86 2.6041E-50Residual 2.6334 77 0.034200Total 66.921 86 0.77815
Variable Estimated Standard t-Ratio ProbName Coefficient Error 77 OF >ItiLPCPCON 1. 6071 0.63320 2.5380 0.013169INERLC 0.43610 0.32145 1. 3566 0.17886LPCECON 3.0876 0.59201 5.2154 1.5013E-06LPCCINC -5.9705 0.69251 -8.6215 6.3892E-13LPCBLK -0.71096 0.26923 -2.6407 0.010013NOE 0.11691 0.029247 3.9975 0.00014564MDliJ 0.088730 0.013971 6.3512 1.3670E-08~-J -0.013683 0.32360 -0.042283 0.96638~'JEIGHT -0.041278 o. 008371 7 -4.9307 4.6046E-06
Matrix of CoefficientsVariance-CovarianceLPC?CON 0.4009INERLC 0.1084LPCECON -0.2702LPCCINC 0.1407LPCBLK -0.03876!~E 0.003342MOW 0.002623W 0.002591~EIGET -0.003129
LPCPCON
0.1033-0.11600.067960.03853
-0.001919-0.0015010.002033
-').001962INERLC
0.3505-0.2909
-0.036470.002473
-0.002414-0.001170.001981
LPCECON
0.47960.01142
-0.005750.00471
0.000256-0.00175
LPCCH1C
0.07248-0.00285-0.000"'20.000353
-0.000635L?CBLr-:

189
Model of Decentralization (1979-89) of Consumer Oriented Services=================================================================
(continued)
NOEMDl'iWvlEIGHT
0.0008552.801E-05
-15.851E-061.995E-05
NOE
0,000195-2.885E-05-1.852E-05
MDioJ
0.1047-5.463E-05 7.009E-05
W WEIGHT
Cor:::-elation !-1atrix of CoefficientsLPcpcon 1.0000HE?LC 0.53234 1.0000LPC:::CON -0.72083 -0.60963 1.0000LPCCINC 0.32077 0.30531 -0.70962LPCBLK -0.22734 0.44518 -0.22883NOE 0.18046 -0.20406 0,14285MDvJ 0.29646 -0.33431 -0.29181W 0.01264 0.01955 -0.006105WEIGHT -0.59031 -0.72904 0.39978
LPCPCON INERLC LPCECON
NOS 1.0000MD\tJ 0.068553 1.0000W -0.00072389 -0.0063805 1.0000WEIGriT 0.081471 -0.15831 -0.020164
NOE MDW vJ
1.00000.061245-0.285360.48680
0.001142-0.30181
LPCCINC
1. 0000\'JEIGHT
1.0000-0.36173-0.191800.004046-0.28192
LPCBLK
R-Square Between Observed and Predicted 0.96065Sum of Absolute Residuals = 8.4745Sum of Residuals = -1.18655E-12Standard Error of Residuals = 0.17601Skewness of Residuals = 2.7176Kurtosis of Residuals = 21.500First-Order Rho = 0.010625Durbin-Watson Statistic = 1.9736Standardized Von-Neumann Ratio Statistic -0.12404Durbin-H Statistic = NA
=== Heteroskedasticity Re-Test (Koenkar-Basset Test)ko0.019699
Least Squares Estimation
Dependent Variable = E2Estimation Range = 1 86Nurr~er of Observations = 86Mean of Dependent Variable = -0.36886Standard Error of Dependent Variable 4.2645
;','.".?NING: Ho Constant "Term.R-Square, AOV may not be reliable!
R-Square = 0.21031 R-Square AdjustedStandard Error of the Estimate = 3.9817
0.11801

190
Model of Decentralization (1979-89) of Consumer Oriented Services=================================================================
(continued)
Log-Likelihood = -236.10
Sum of Squares 5S OF MSS F Prob>FExplained 325.10 9 36.123 2.2785 0.02535Residual 1220.7 77 15.854Total 1545.8 86 17.975
'Jariable Estimated Standard t-Ratio ProbName Coefficient Error 77 OF >ItlLPCPCON 0.045721 13.633 0.0033537 0.99733INERLC 8.9997 6.9210 1.3004 0.19736LPCECON 11.347 12.746 0.89020 0.37613LPCCINC 14.148 14.910 0.94892 0.34563LPCBLK -2.7940 5.7966 -0.48201 0.63117NOE -0.32429 0.62970 -0.51499 0.60803FIDW -0.073357 0.30079 -0.24388 0.80797W 0.38885 6.9671 0.055812 0.95564WEIGHT -0.42975 0.18025 -2.3843 0.019575
Variance-Covariance Matrix of CoefficientsLPCPCON 185.86INERLC 50.229 47.900LPCECON -125.26 -53.780 162.46LPCCINC 65.201 31.505 -134.86 222.31LPCBLK -17.965 17 . 860 -16.907 5.2932 33.600NOE 1. 5492 -0.88933 1.1466 -2.6792 -1.3204MOW 1.2157 -0.69596 -1.1188 2.1832 -0.33442W 1. 2009 0.94250 -0.54213 0.11865 0.16342WEIGHT -1.4506 -0.90946 0.91848 -0.81111 -0.29455
LPCPCON INERLC LPCECON LPCCINC LPCBLK
NOE 0.39653MOW 0.012985 0.090477W -0.0031759 -0.013372 48.541WEIGHT 0.0092471 -0.0085832 -0.025322 0.032489
NOE MDW W WEIGHTCorrelation Matrix of CoefficientsLPCPCON 1. 0000INERLC 0.53234 1.0000r..,PCECON -0.72083 -0.60963 1.0000LPCCINC 0.32077 0.30531 -0.70962 1. 0000LPCBLK -0.22734 0.44518 -0.22883 0.061245 1. 0000NOE 0.18046 -0.20406 0.14285 -0.28536 -0.36173"mw 0.29646 -0.33431 -0.29181 0.48680 -0.19180\'1 0.01264 0.01955 -0.006105 0.001142 0.004046\·.'EIGHT -0.59031 -0.72904 0.39978 -0.30181 -0.28192
LPCPCON INERLC LPCECON LPCCINC LPCBLK
(iOE 1.0000I1DW 0.068553 1. 0000~/J -0.00072389 -0.0063805 1.0000\'1EIGHT 0.081471 -0.15831 -0.020164 1.0000
NOE MDttl W i'1EIGHT

191
Model of Decentralization (1979-89) of Consumer Oriented Services=================================================================
(continued)
R-Square Between Observed and Predicted 0.21031Sum of Absolute Residuals = 104.77Sum of Residuals = 5.78121E-12Standard Error of Residuals = 3.7897Skewness of Residuals = -6.1065Kurtosis of Residuals = 51.621First-Order Rho = -0.025775Durbin-Watson Statistic = 2.0514Standardized Von-Neumann Ratio Statistic 0.24092Durbin-H Statistic = NA

192
Model I of Decentralization (1969-79) of Business Oriented Services===================================================================* Location Coefficientmean:lcb64 lcb69 lcb79 pcblc1.11247 1.12755 1.10503 -0.00582096standard deviation:0.202637 0.205427 0.160992 0.135899LSQ/GAUSS Version 3.1: Applied Data Associates. (1994/04/10/02:10:19)
Ordinary Least Squares Estimation
Dependent Variable = DEPEstimation Range = 1 50Number of Observations = 50Mean of Dependent Variable = -0.0058210Standard Error of Dependent Variable = 0.13590
R-Square = 0.55136 R-Square Adjusted = 0.43633Standard Error of the Estimate = 0.10203Log-Likelihood = 49.389
Sum of Squares SSExplained 0.49896Residual 0.40600Total 0.90496
DF103949
MSS0.0498960.0104100.018469
F Prob>F4.7930 0.00017225
variableNamePCEBINERTLZ>..PCLCMPCTCPLPCINCCORPSLSLPCBLKNOEMDWWCONSTANT
EstimatedCoefficient
0.10566-0.77886-0.58354-0.22825-0.46589
8.6360E-070.25955
0.0736940.038582
0.22083-0.10827
StandardError
0.0395100.197060.208420.151082.9045
6.9912E-070.77066
0.0546080.0447620.0705170.059053
t-Ratio39 DF
2.6741-3.9523-2.7998-1. 5107
-0.160401. 2353
0.336781. 3495
0.861933.1316
-1.8335
Prob>Itl
0.0108880.00031572
0.00791230.138920.873390.224120.738090.184960.39400
0.00329080.074367
Matrix of CoefficientsVariance-CovariancePCEB 0.0015611INERTIA -0.0019966PCLCM -0.0028125PCTep -0.0013843LPCINC -0.045821CORPSLS 2.514E-09LPCBLK -0.0024130NOE -0.0002442MDW 3.4292E-05W -0.00023028CONST~~T -0.0003221
PCEB
0.0388340.0143350.0104970.048161
-1.243E-080.00411210.00120610.00168630.0045268
-0.0018067INERTIA
0.0434410.0056403
0.14400-9.902E-09
-0.0174390.00231630.0013855o. 00413 67
-0.0018408PCLC11
0.022826-0.034891
-7.632E-09-0.0165990.00430820.00338410.0014203
-0.0020356PCTe?
8.43635.899E-07
-0.592740.0578510.0186970.040631-0.11056
LPCINC
CORPSLSLPCBLKNOE
4.888E-137.041E-09
-1.242E-090.59392
-0.012742 0.002982
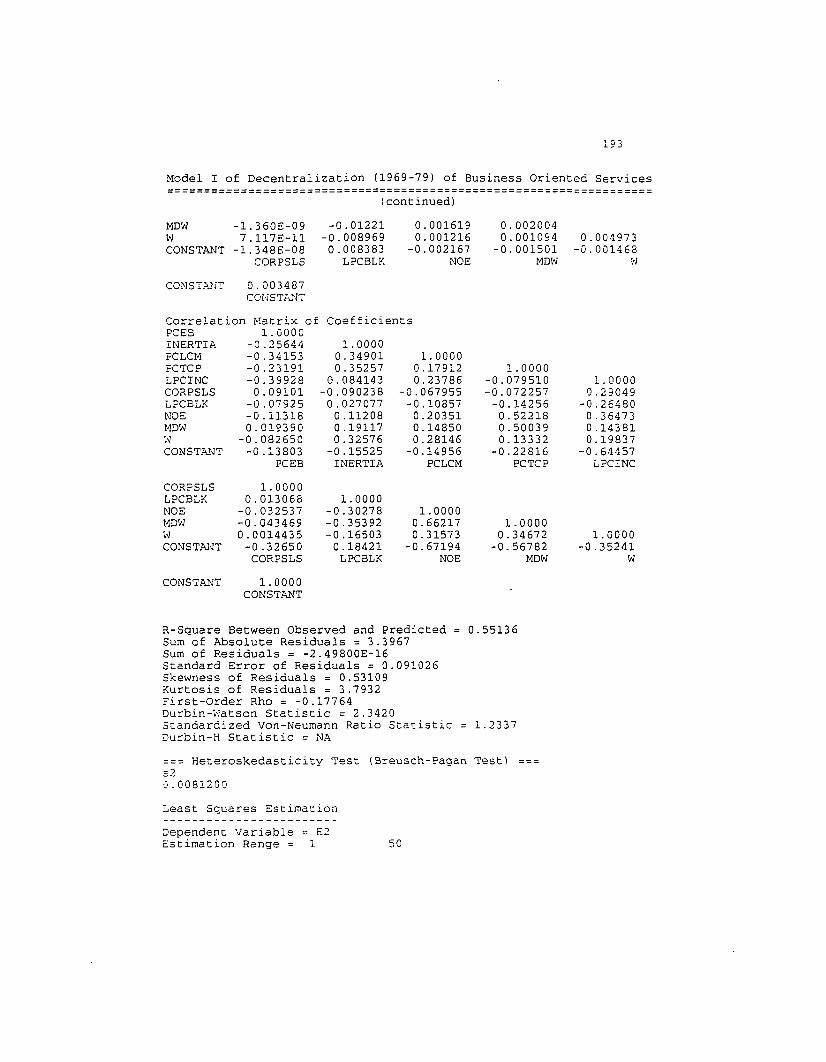
193
Model I of Decentralization (1969-79) of Business Oriented Services===================================================================
(continued)
MDW -1.360E-09 -0.01221 0.001619 0.002004W 7.117E-11 -0.008969 0.001216 0.001094 0.004973CONSTANT -1.348E-08 0.008383 -0.002167 -0.001501 -0.001468
CORPSLS LPCBLK NOE MDW 11
CONST.".rJT 0.003487CONSThNT
Correlation Matrix of CoefficientsPCEB 1.0000INERTI? -0.25644 1.0000PCLCH -0.34153 0.34901 1. 0000FCTCP -0.23191 0.35257 0.17912 1.0000LPCINC -0.39928 0.084143 0.23786 -0.079510 1.0000CORPSLS 0.09101 -0.090238 -0.067955 -0.072257 0.29049L?CBLK -0.07925 0.027077 -0.10857 -0.14256 -0.26480NOE -0.11318 0.11208 0.20351 0.52218 0.36473HDW 0.019390 0.19117 0.14850 0.50039 0.14381,"i -0.082650 0.32576 0.28146 0.13332 0.19837CONSTA..T\lT -0.13803 -0.15525 -0.14956 -0.22816 -0.64457
PCEB INERTIA PCLCM PCTCP LPCINC
COR!?SLS 1.0000LPCBLK 0.013068 1.0000NOE -0.032537 -0.30278 1.0000MDVI -0.043469 -0.35392 0.66217 1.0000i"i 0.0014435 -0.16503 0.31573 0.34672 1. 0000CONSTANT -0.32650 0.18421 -0.67194 -0.56782 -0.35241
CORPSLS LPCBLK NOE MDW W
CONST?.NT 1. 0000CONSTANT
R-Square Between Observed and Predicted 0.55136Sum of Absolute Residuals = 3.3967Sum of Residuals = -2.49800E-16Standard Error of Residuals = 0.091026Skewness of Residuals = 0.53109Kurtosis of Residuals = 3.7932First-Order Rho = -0.17764Durbin-Watson Statistic = 2.3420Standardized Von-Neumann Ratio Statistic 1.2337Durbin-H Statistic = NA
=== Heteroskedasticity Test (Breusch-Pagan Test)s2':'.0081200
Least Squares Estimation
~ependent Variable = E2Estimation Range = 1 50
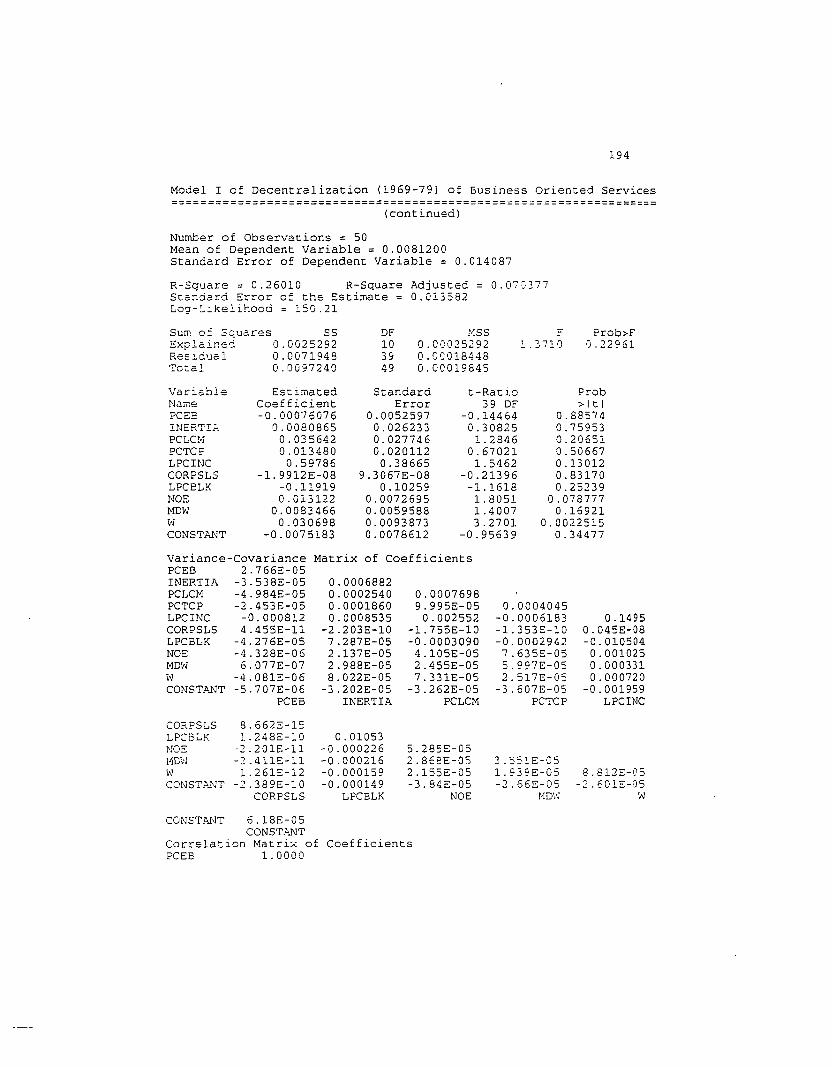
194
Model I of Decentralization (1969-79) of Business Oriented Services===================================================================
(continued)
Number of Observations = 50Mean of Dependent Variable = 0.0081200Standard Error of Dependent Variable = 0.014087
R-Square = 0.26010 R-Square Adjusted = 0.070277Standard Error of the Estimate = 0.013582Log-L~kelihood = 150.21
Sum of Squares SSExplained 0.0025292Residual 0.0071948To~al 0.0097240
DF103949
t-1SS0.000252920.000184480.00019845
2..3710Prob>F
0.22961
Variable Estimated Standard t-Ratio FrobName Coefficient Error 39 Of >ItlPCES -0.00076076 0.0052597 -0.14464 0.88574INERTI':. 0.0080865 0.026233 0.30825 0.75953PCLC!·; 0.035642 0.027746 1.2846 0.20651PCTCP 0.013480 0.020112 0.67021 0.50667LPCINC 0.59786 0.38665 1.5462 0.13012CORPSLS -1. 9912E-08 9.3067E-08 -0.21396 0.83170LPCBLK -0.11919 0.10259 -1.1618 0.25239NOE 0.013122 0.0072695 1. 8051 0.078777MDI'l 0.0083466 0.0059588 1. 4007 0.16921~v 0.030698 0.0093873 3.2701 0.0022515CONSTANT -0.0075183 0.0078612 -0.95639 0.34477
Variance-Covariance Matrix of CoefficientsPCES 2.766E-05INERTLl>. -3.538E-05 0.0006882PCLCM -4.984E-05 0.0002540 0.0007698PCTCP -2.453E-05 0.0001860 9.995E-05 0.0004045LPCINC -0.000812 0.0008535 0.002552 -0.0006183 0.1495CORPSLS 4.455E-11 -2.203E-10 -1.755E-10 -1.353E-10 0.045E-08LPCBLK -4.276E-05 7.287E-05 -0.0003090 -0.0002942 -0.010504NOE -4.328E-06 2.137E-05 4.105E-05 7.635E-05 0.001025MOW 6.077E-07 2.988E-05 2.455E-05 5.997E-05 0.000331W -4.081E-06 8.022E-05 7.331E-05 2.517E-05 0.000720CONSTJ>..NT -5.707E-06 -3.202E-05 -3.262E-05 -3.607E-05 -0.001959
PCEB INERTIA PCLCM PCTCP LPCINC
CORPSLS 8.662E-15LPCELK 1.248E-10 0.01053NOE -2.201E-11 -0.000226 5.285E-05HDVJ -2.411E-11 -0.000216 2.868E-05 3.5 1E-05W 1.261E-12 -0.000159 2.155E-05 1.9 9E-05 8.812E-05CONSTl>.NT -2.389E-10 -0.000149 -3.84E-05 -2. 6E-05 -2.601E-05
CORPSLS LPCELK NOE ND\'i 'vCONST.~j\IT 6.18E-05
CONST!\NTCorrelation Matrix of CoefficientsPCEE 1.0000

195
Model I of Decentralization (1969-79) of Business Oriented Services===================================================================
(continued)
INERTIF-. -0.25644 1.0000PCLCM -0.34153 0.34901 1.0000PC';'CI' -0.23191 0.35257 0.17912 1.0000LPC:~iC -0.39928 0.084143 0.23786 -0.079510 1.0000COE?SLS 0.091012 -0.090238 -0.067955 -0.072257 0.29049L::~:SL?~ -0.079246 0.027077 -0.10857 -0.14256 -0.26480tiC=: -0.11318 0.11208 0.20351 0.52218 0.36473?~:,:\~ 0.019390 0.19117 OJ .14850 0.50039 0.14381.\ -0.082650 0.32576 0.28146 0.13332 0.19837cc: :ST.~.n'T· -0.13803 -0.15525 -0.14956 -0.22816 -0.64457
PCEB INERTI.;; PCLC11 PCTCI' LPCINC
CC?~?3LS 1.0000L?C::::";': 0.013068 1. 0000NOE: -0.032537 -0.30278 1.0000NmJ -0.043469 -0.35392 0.66217 1. 0000O·J 0.0014435 -0.16503 0.31573 0.34672 1.0000CO~IST.:'_l\jT -0.32650 0.18421 -0.67194 -0.56782 -0.35241
CORPSLS LPCBLK NOE MDW W
COLJSTF-.NT 1. 0000CONSTF-.NT
R-Square Between Observed and Predicted 0.26010Sum of Absolute Residuals = 0.39776Sum of Residuals = 4.81386E-16Standard E:rror of Residuals = 0.012117Skewness of Residuals = 1.8687Kurtosis of Residuals = 6.4767First-Order Rho = 0.23436Durbin-I'Jatson Statistic = 1.5304Standardized Von-Neumann Ratio Statistic -1.6942Durbin-H Statistic = NA
=== Heteroskedasticity Test (White Test)
Least Squares Estimation
Dependent Variable = E2Estlmation Range = 1 50Number of Observations = 50Me~n of ~ependent variable = 0.0081200Standard E:rror of Dependent Variable = 0.014087
R-Square = 0.64285 R-Square Adjusted = 0.32690Standard =:rror of the Estimate 0.011557Leg-Likel:hood = 168.42
5u~ 8f 5q~ares 55Explained 0.0062511Residual 0.0034730Tetal 0.0097240
DF232649
:·1550.000271730.000133580.OOOl?845
2.0347Prob>F
0.040945

196
Model I of Decentralization (1969-79) of Business Oriented Services===================================================================
(continued)
Variable Estimated Standard t-Ratio ProbName Coefficient Error 26 DF >ItlPCES 0.014505 0.024245 0.59628 0.55483INERTIP. -0.13896 0.097547 -1.4245 0.16619PC!..CI1 0.080621 0.067012 1.2031 0.23978PCTCP -0.018774 0.095363 -0.1%87 0.84546LPCINC 0.84389 1.4826 0.56919 0.57411CORPSLS 6.6031E-07 1.6203E-06 0.40753 0.68695L?CBLK -0.17729 0.48065 -0.36886 0.71522NOE 0.014209 0.0086655 1.6397 0.11312l-1m-i 0.0087078 0.0070778 1.2303 0.22960w 0.017266 0.0097460 1.7716 0.088189PCE3~2 -0.016350 0.013406 -1.2196 0.23356INERTIA~ 0.35229 0.11949 2.9484 0.0066689PCL01~2 0.46494 0.40055 1.1607 0.25629PCTCP~2 0.063919 0.078839 0.81075 0.42487LPCINC~2 -19.024 48.966 -0.38852 0.70080CORPSLS~ -1.633E-12 1.2504E-11 -0.13061 0.89709LPCBLK~2 1.3485 2.6207 0.51456 0.61121PCEB.*IN 0.15322 0.092730 1.6523 0.11051INERTIA. 0.13906 0.46419 0.29958 0.76688PCLCI-1. *P -0.078859 0.46910 -0.16811 0.86780PCTCP. *L 3.5247 5.4498 0.64675 0.52346LPCINC ... 3.4902E-07 8.5039E-05 0.004104 0.99676CORPSLS.-6.6082E-05 6.7118E-05 -0.98456 0.33391CONST.LJ·jT -0.012726 0.012105 -1.0512 0.30282
Variance-Covariance Matrix of CoefficientsPCEB 0.0005878INERTIl>. -0.0003284 0.009516PCLCM -1.551E-06 5.548E-06 0.004491PCTCP -0.0008449 -0.0001438 0.003521 0:009094LPCINC -0.01739 0.0319 -0.01861 -0.03244 2.198CORPSLS 5.791E-09 -2.977E-08 1.700E-08 1.227E-08 -4.612E-08LPCBLK 0.0006683 0.01009 -0.007621 -0.01984 -0.01458NOE -4.003E-05 -0.0001641 0.0001568 0.000407 0.001980MDW -2.951E-06 -2.451E-05 0.0001063 0.000293 -0.0009325w -2.785E-07 -0.0001412 1. 212E-05 3.306E-05 -0.0008013PCEB~2 -0.0002992 0.0004138 0.0001618 0.000631 0.008064INERTIl>.~ 3.012E-05 0.001697 -0.0002933 0.000704 -0.01109PCLCM~2 0.006258 -0.01471 -0.01233 -0.0189 -0.1483?CTCP"2 -8.008E-05 -0.002851 0.001610 0.00489 -0.03907L?':INC~2 0.3733 -1.1428 0.6892 1. 982 -67.495CORPSLS~ -3.015E-14 2.951E-13 -1.131E-13 -1.751E-13 -1.082£-14L?CBLK~2 -0.002012 -0.06583 0.0356 0.0889 0.2000PCEB.*IN 0.0004800 -0.008611 -0.0002144 -0.00061 -0.03327n;ERTI.Zl.. 0.003861 -0.006273 -0.01073 -0.00813 -0.1357pC.. Cl,r . * P 0.002386 0.0005283 -0.02604 -0.0348 0.09673PCTC? *L 0.05246 -0.03791 -0.1329 -0.502 2 . ,~3 0LPCINC .• 7.075E-08 2.145E-06 -7.374E-07 -1.821E-06 -1.519E-05CORPSLS. -2.128E-07 -8.492E-07 -6.933E-07 8.986E-07 1.109E-05CONST.Zl.NT -0.000128 -0.0001487 6.910E-05 0.00034 -0.006150
peEB INERTIi\ PCLCH PCTCP LPCINC

197
Model I of Decentralization (1969-79) of Business Oriented Services===================================================================
(continued)
CORPSLSLPCBLKNOEMD\-J~-J
PCEB A 2INERTIAPCL01 A 2PCTC?~'2
LPCINC2CORPSLSLPCBLK A 2PCEB. *ININERTV·..PCLCM. *PPCTCP. *LLPCINC. *CORPSLS.CONSTANT
PCEB A2INERTIl>.APCLCM A2PCTCP A 2LPCINC A2CORPSLS A
LPCBLK A2PCES. *ININERTIl>..PCLCM. *PPCTCP. *LLPCINC. *CORPSLS.CONSTl>.NT
CORPSLS~
LPCBLK A2PCES. *ININERTIA.PCL01. *PPCTCP. *LLPCINC. *CORPSLS.C-::)NSTANT
reTCP. *LLPCINC .•CCRPSLS.CONSTl'.NT
2.625E-122.082E-07
-1.183E-11-2.448E-10-2.599E-09-3.547E-09-8.781E-098.369E-082.594E-081.017E-05
-1.923E-17-1.078E-063.110E-088.480E-08
-1.025E-07-5.065E-07-1.127E-10-3.715E-ll-9.055E-09
CORPSLS
0.0001797-8.776E-05
-0.004599-2.250E-05
-0.16671.916E-14
0.00142-0.00054-0.00303
-0.002364-0.04077
-1.922E-081.232E-077.089E-05
PCES A2
1.564E-221.773E-12
-2.682E-13-3.874E-13
8.441E-138.312E-121.009E-153.110E-175.826E-14
CORPSLS A
29.7018.999E-05
-S.086E-05-0.02347PCTCP. "L
0.2310-0.002614-0.001437
-0.00132-0.0006481
-0.0030030.01895
-0.01242-2.355
-2.583E-13-1.219
-0.0053020.028820.07164
0.91796.850E-06
-2.272E-05-0.001314
LPCBLK
0.014280.004777
0.00095470.2723
4.915E-140.01911
-0.00086280.02967
-0.002739-0.01993
3.454E-072.383E-072.397E-05
INERTIAA
6.86810.042274-0.10979-0.34038
-3.6821-3.037E-05
0.00011110.006423LPCBLK A 2
7.232E-09-1.222E-093.079E-07
LPCINC ...
7.509E-054.269E-052.649E-051.889E-05
-1.099E-05-0.0002268
0.00027970.009564
-1.264E-140.01364
0.0001181-0.0002614
-0.001547-0.01657
-1.811E-071.900E-07
-1.821E-05NOE
0.16040.003404
3.217-5.199E-13
-0.022420.01767
0.10240.08804
1. 226-3.716E-07-1.576E-06-0.001846
PCLCW2
0.0085990.01319
0.0033480.09164
-1.729E-062.232E-074.268E-05
PCEB.*IN
4.505E-091.915E-07
CORPSLS.
5.010E-051.862E-05
-3.511E-070.00012630.00021590.0002932
0.06241-1.905E-15
0.0071685.452E-050.0007934-0.001120-0.01148
-5.437E-083.657E-08
-1.620E-05MDW
0.0062161. 7898
-2.355E-130.06593
0.0027970.00793
-p.01859-0.2480
-1.730E-062.0328-077.301E-05
PCTCP A2
0.21550.05959
0.66764.9958-07
-4.652E-06-0.001347
IN8RTI.lI. .
0.0001465CONSTjI.NT
9.499E-05-3.703E-06-0.0004541
9.339E-055.624E-05
0.056981.119E-14
0.0064230.0001673
-0.00056220.0004769
-0.00049231.661E-081. 567E-074.0768-07
W
2397.7-9.165E-11
5.09321.05463.1866
-5.0309-122.36
-0.000288-3.201E-05
0.1841LPCINC A 2
0.22011. 870
7.136E-061.688E-060.0009877
PCLCM. *p

198
Model I of Decentralization (1969-79) of Business Oriented Services===================================================================
(continued)
Correlation Matrix of CoefficientsPCEB 1.0000INERTIA -0.13886 1.0000PCLCH -0.0009544 0.0008488 1. 0000PCTC? -0.36544 -0.015461 0.55092 1. 0000LPCINC -0.48375 0.22056 -0.18728 -0.22941 1. 0000CORPSLS 0.14742 -0.18833 0.15654 0.079426 -0.019198LPCBLK 0.057351 0.21529 -0.23660 -0.43284 -0.020461NOE -0.19052 -0.19410 0.26995 0.49281 0.15413MDW -0.017196 -0.035505 0.22412 0.43445 -0.088861\oJ -0.0011787 -0.14854 0.018554 0.035575 -0.055455PCEB~2 -0.92044 0.31642 0.18011 0.49329 0.40573INERTIA~ 0.010396 0.14561 -0.036627 0.061763 -0.062627PCLCH~2 0.64440 -0.37646 -0.45929 -0.49352 -0.24968PCTCP~2 -0.041893 -0.37067 0.30479 0.65089 -0.33427LPCINC~2 0.31447 -0.23926 0.21004 0.42433 -0.92971CORPSLS~ -0.099435 0.24192 -0.13500 -0.14684 -0.000584LPCBLK~2 -0.031663 -0.25752 0.20383 0.35567 0.051473PCEB. *IN 0.21352 -0.95195 -0.034497 -0.068925 -0.24199INERTIA. 0.34303 -0.13853 -0.34499 -0.18366 -0.19716PCLCH. *P 0.20983 0.011545 -0.82830 -0.77807 0.13909PCTCP. *L 0.39706 -0.071308 -0.50069 -0.96602 0.25125LPCINC. * 0.034313 0.25862 -0.12940 -0.22452 -0.12047CORPSLS. -0.13076 -0.12970 -0.15413 0.14039 0.11146CONSTl'.NT -0.43461 -0.12596 0.085176 0.29451 -0.34269
PCEB INERTIA PC LCl-1 PCTCP LPCINC
CORPSLS 1.0000LPCBLK 0.26739 1. 0000NOE -0.0008428 -0.62764 1. 0000MDW -0.021344 -0.42254 0.69611 1. 0000W -0.16460 -0.28169 0.31370 0.26998 1. 0000PCEB~2 -0.16330 -0.10058 0.16263 -0.003700 -0.02834INERTIA~ -0.045357 -0.052294 -0.010614 0.14937 -0.38998PCLCH~2 0.12894 0.098427 -0.065353 0.076162 0.023922PCTCP~2 0.20305 -0.32767 0.40943 0.52547 0.073197LPCINC~2 0.12820 -0.10006 0.022540 0.18007 0.11940CORPSLS~ -0.94927 -0.042982 -0.11666 -0.021528 0.091792LPCB['K~2 -0.25375 -0.96748 0.60068 0.38641 0.25145PCEB. *IN 0.20697 -0.11895 0.14696 0.083065 0.18508INERTIA. 0.11275 0.12915 -0.064993 0.24149 -0.12426PCLCH. *P -0.13486 0.31774 -0.38064 -0.33732 0.10431PCTCP. *L -0.057355 0.35043 -0.35083 -0.29758 -0.00927LPCINC.* -0.81824 0.16759 -0.24575 -0.090330 0.02004CORFSLS. -0.34163 -0.70425 0.32661 0.076977 0.23955CONSTANT -0.46164 -0.22575 -,) .17356 -0.18903 0.003455
CORPSLS LPCBLK NOE ND~-J \./
PCEB A 2 1.0000INERTIA' <'.054789 1. 0000PCLCH"2 -D.8564l 0.099812 1.0000PCTCP~2 -0.021238 0.10135 0.10781 1.0000LPCINC A 2 -0.25397 0.046548 0.16401 0.46363 1.0000
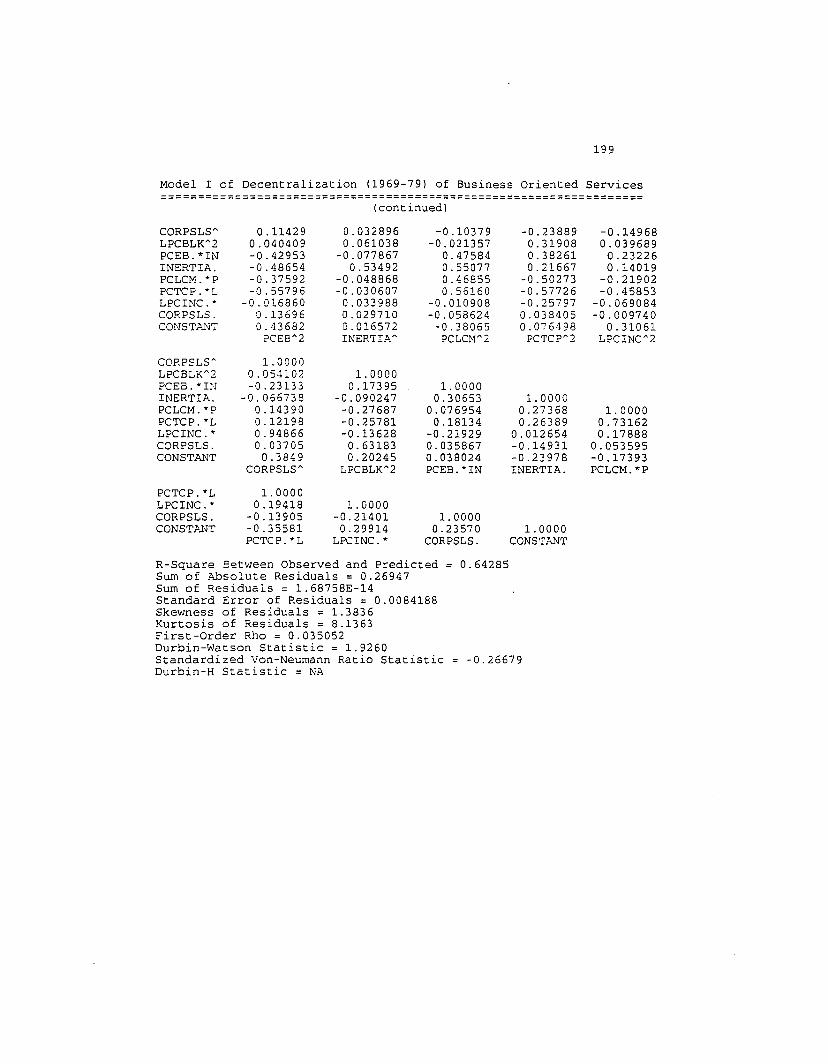
199
Model I of Decentralization (1969-79) of Business Oriented Services===================================================================
(continued)
CORPSLS~
LPCBLK~2
PCES.*ININERTIA.PCLCM. *PPCTCP. *LLPCINC. *CORFSLS.CONSTl>J-JT
CORPSLS~
LPCSLK~2
PCES.*ININERTIA.PCLCM. "pPCTCP. *LLPCINC.*CORPSLS.CONSTANT
PCTCP. *LLPCINC.*CORPSLS.CONS Tl>l-JT
0.114290.040409-0.42953-0.48654-0.37592-0.55796
-0.0168600.136960.43682?CEE~2
1.00000.054102-0.23133
-0.0667380.143900.121980.948660.03705
0.3849CORPSLS~
1.00000.19418
-0.13905-0.35581PCTCP. *L
0.0328960.061038
-0.0778670.53492
-0.048868-0.0306070.0339880.0297100.016572INERTr.r..~
1. 00000.17395
-0.090247-0.27687-0.25781-0.13628
0.631830.20245
LPCBLK~2
1. GOOO-0.214010.29914
LPCINC. *
-0.10379-0.021357
0.475840.550770.468550.56160
-0.010908-0.058624
-0.38065PCLCW2
1.00000.30653
0.0769540.18134
-0.219290.0358670.038024PCES. *IN
1. 00000.23570
CORPSLS.
-0.238890.319080.382610.21667
-0.50273-0.57726-0.257970.0384050.076498PCTCP~2
1. 00000.273680.26389
0.012654-0.14931-0.23978INERTIA.
1.0000CONSTANT
-0.149680.039689
0.232260.14019
-0.21902-0.45853
-0.069084-0.009740
0.31061LFCINC~2
1.00000.731620.17888
0.053595-0.17393PCLCM. *p
R-Square 3etween Observed and Predicted 0.64285Sum of Absolute Residuals = 0.26947Sum of Residuals = 1.68758E-14Standard Error of Residuals = 0.0084188Skewness of Residuals = 1.3836Kurtosis of Residuals = 8.1363First-Order Rho = 0.035052Durbin-Wacson Statistic = 1.9260Standardized Von-Neumann Ratio Statistic -0.26679Durbin-H Statistic = NA

200
Model II of Decentralization (1969-79) of Business Oriented Services====================================================================* Location Coefficientmean:lcb64 lcb69 lcb79 pcbic1.12302 1.13678 1.09963 -0.0167568standard deviation:0.210743 0.221277 0.154727 0.132721LSQ/GAUSS Version 3.1: Applied Data Associates. (1994/04/10/00:01:12)
Ordinary Lease Squares Estimation
Dependent Variable = DEPEstimation Range = 1 69Number of Observations = 69Mean of Deoendent Variable = -0.016757Standard Error of Dependent Variable = 0.13272
R-Square = 0.43305 R-Square Adjusted = 0.33530Standard Error of the Eseimate 0.10821Log-Likelihood = 61.521
5.84180.02244-0.29100.04?38
0.0154fj.I)3.14
-O.:C<~O
0.017750.02497
0.001211-0.029730.0032970.0028590.000693-0.00278
PCTCP
0.032650.003673
0.1221-G.0008848
-0.026760.0016050.0013340.002549
-0.0006982PCLGI
DF MSS F Prob>F10 0.051871 4.4302 0.00012358 0.01170968 0.017615
Standard t-Ratio ProbError 58 DF >Itl
0.037630 2.3038 0.0248370.17056 -3.8086 0.00033970.18068 -0.93139 0.355510.13323 -0.75203 0.455072.4170 -1.4431 0.15437
0.034234 1.0838 0.282940.73635 1.3145 0.19385
0.049240 1. 3257 0.190150.040157 0.17296 0.863280.057518 2.8894 0.00541970.065801 -1. 3444 0.18406
of Coefficients
0.029090.0099240.0065250.069999
6.662E-05-0.0024720.0005765
0.001350.002354
-0.001300INERTIl-.
550.518710.67910
1.1978
EstimatedCoefficient
0.086692-0.64958-0.16829-0.10019-3.4880
0.0371020.96794
0.0652750.0069457
0.16619-0.088463
Sum of SquaresExplainedResidualTotal
VariableNamePCEBINERTIAPCLCMPCTCPLPCINCMETHQLPCBLKNOEMOWWCONSTANT
variance-Covariance MatrixPCEB 0.001416INERTIA -0.001973PCLCM -0.001839PCTCP -0.001728LPCINC -0.03719METHQ 1.209E-05LPCELK -0.002808NOE -0.0001937MDW -2.039E-05W -0.0001415CONST.:'l.NT -0.000285
PCES
METHQLPCELKNOE
0.00117-0.00215
).000240.54221
-0.012865 0.002425
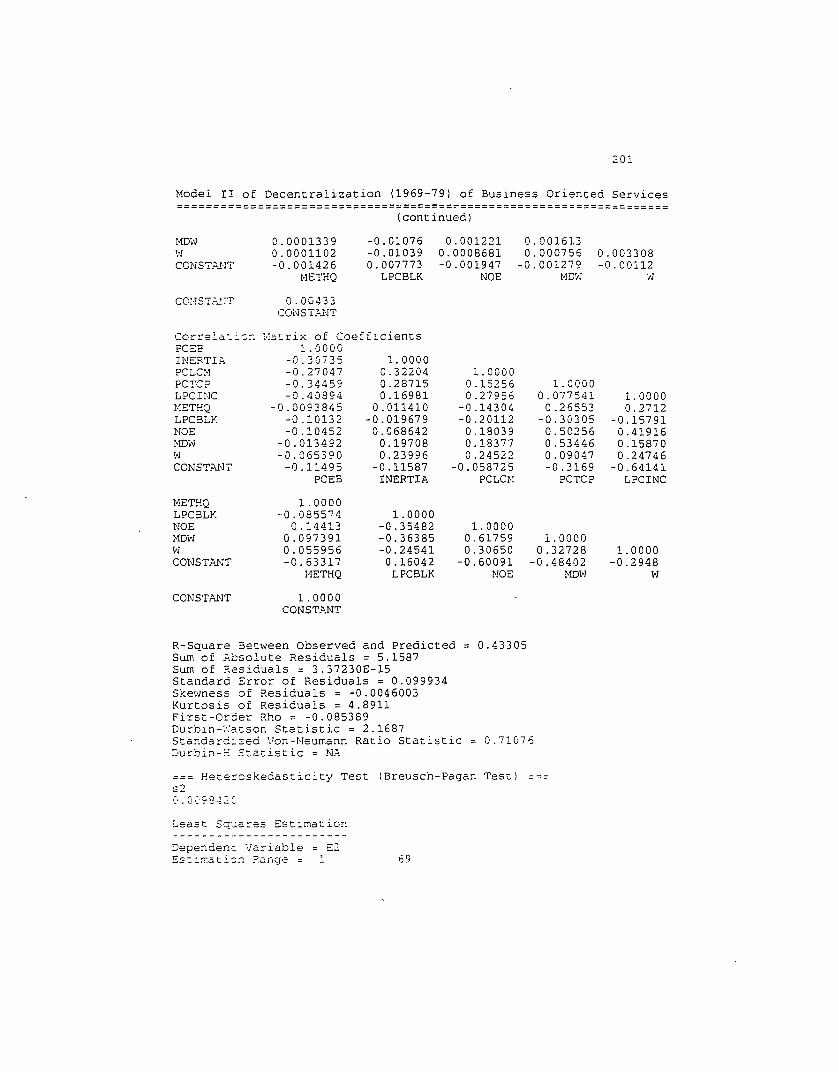
201
Model II of Decentralization (1969-79) of Business Oriented Services======================================~=============================
(continued)
MOW 0.0001339 -0.01076 0.001221 0.001613~.! 0.0001102 -0.01039 0.0008681 0.000756 0.003308CONST.~J·lT -0.001426 o. 007773 -0.001947 -0.001279 -0.00112
l'-lETHQ LPCBLK NOE t-10',1 .,.1
COI·jST.:'.!jT 0.00433CONST.:'.NT
Corl.~ela: ':"G:-. !·!3.t.rix of CoefficientsPCEB 1.0000INERTT;-. -0.30735 1. 0000PCLc-l -0.27047 0.32204 1. 0000PCTer-> -0.34459 0.28715 0.15256 1.0000LPCIiJC -0.40894 0.16981 0.27956 0.077541 1.0000t-lETEQ -0.0093845 0.011410 -0.14304 0.26553 0.2712LPCBLK -0.10132 -0.019679 -0.20112 -0.30305 -0.15791NOE -0.10452 0.068642 0.18039 0.50256 0.41916HDW -0.013492 0.19708 0.18377 0.53446 0.15870W -O.0653?0 0.23996 0.24522 0.09047 0.24746CONSTAN'! -0.11495 -0.11587 -0.058725 -0.3169 -0.64141
PCEB INERTIA peLCH PCTCP LPCINC
METEQ 1.0000LPCBLK -0.085574 1. 0000NOE 0.14413 -0.35482 1.0000MOW 0.097391 -0.36385 0.61759 1. 0000i-J 0.055956 -0.24541 0.30650 0.32728 1. 0000CONSTJI.NT -0.63317 0.16042 -0.60091 -0.48402 -0.2948
JolETHQ LPCBLK NOE MD\-1 W
CONSTJI.NT 1.0000CONSTANT
R-Square Between Observed and Predicted 0.43305Sum of Acso1ute Residuals = 5.1587Sum of Residuals = 3.37230E-15Standard Error of Residuals = 0.099934Skewness of Residuals = -0.0046003Kurtosis of Residuals = 4.8911First-Order Rho = -0.085389Ourbin-~atson Statistic = 2.1687Standarc::'zed Von-Neumann Ratio Statistic 0.71076Durbin-~ Statistic = NA
=== Eetercskedasticity Test (Breusch-Pagan Test)~~
.:.. 0 l~' 9 2 ~ 2 ~
Least Sq~a~es Esti~ation
Dependent Varlable = E2Es:i~ati~~ ?ange = ~ 69

202
Model" II of Decentralization (1969-79) of Business Oriented Services====================================================================
(continued)
Number of Observations = 69Mean of Dependent Variable = 0.0098420Standard Error of Dependent Variable = 0.019917
R-Square = 0.23636 R-Square Adjusted = 0.10470Star.dard Error of the Estimate 0.018846Log-Likelihood = 182.12
Sum of Squares S5 DF ;·1S5 F Prob>FExplained 0.0063759 10 0.00063759 1.7952 0.081821Residual 0.020600 58 0.000355::'7Total 0.026976 68 0.00039670
Variable Estimated Standard t-Ratio ProbName Coefficient Error 58 DF >ItlPCEB 0.017300 0.0065539 2.6397 0.01064INERTIA -0.042375 0.029705 -1. 4265 0.15908PCLCM -0.044993 0.031469 -1. 4297 0.15815PCTCP -0.024426 0.023204 -1. 0527 0.29686LPCINC 0.21333 0.42096 0.50678 0.61423METHQ o. 0051186 0.0059624 0.85849 0.39416LPCBLK -0.20572 0.12825 -1. 6041 0.11412NOE 0.0061393 0.0085759 o.71588 0.47694MDW 0.0089083 0.0069941 1.2737 0.20785W 0.019642 0.010018 1.9607 0.054719CONSTANT -0.011454 0.011460 -0.99940 0.32175
0.17720.000681
-0.0085250.0015130.0004670.001044
-0.003094LPCINC
0'.00053840.00075743.674E-05
-0.00090180.00010008.674E-052.103E-05
-8.428E-05pCTCp
0.0009900.0001110.003703
-2.684E-05-0.00081174.868E-054.045E-057.731E-05
-2.118E-05pCLCM
0.00088240.00030100.0001979
0.0021232.021E-06
-7.497E-051.749E-054.095E-057.141E-05
-3.945E-05INERTIA
Variance-Covariance Matrix of CoefficientsPCEB 4.295E-05INERTIA -5.984E-05PCLCM -5.578E-05PCTCP -5.240E-05LPCINC -0.001128METHQ -3.667E-07LPCBLK -8.516E-05NOE -5.875E-06MOW -6.185E-07W -4.293E-06CONSTANT -8.634E-06
pCEB
METHQ 3.555E-05LpCBLK -6.544E-05 0.01645NOE 7.3698E-06 -0.0003903 7.35 ::;-0MD\'J 4.061E-06 -0.0003264 3.70 :=:-0 4.892E-05W 3.342E-06 -0.0003153 2.63 ::;-0 2.293E-05 0.000100conSTANT -4.327E-05 0.0002358 -5.90 :::-0 -3.58E-05 -3.385E-05
!'-1ETHQ LpCBLK l~~) NO''; W
CONSTANT oJ. 00013134COHST.ll.NT
Correlation Matrix of CoefficientspCES 1.0000
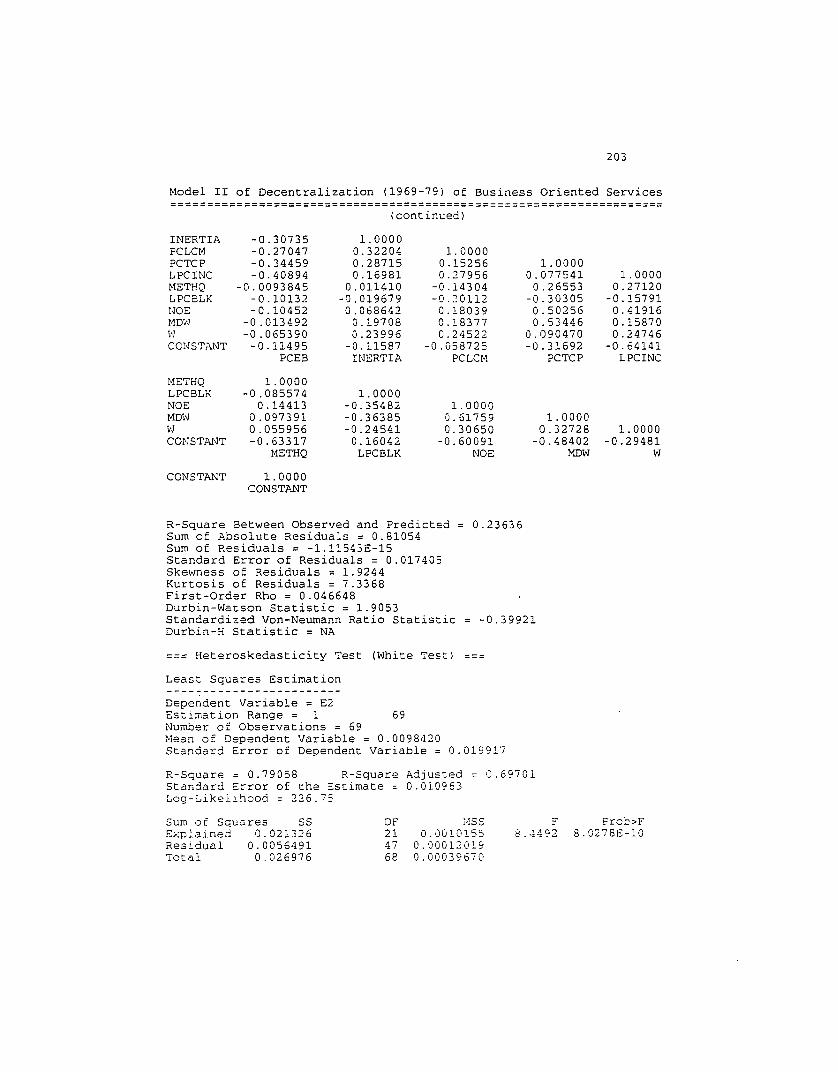
203
Model II of Decentralization (1969-79) of Business Oriented Services====================================================================
(continued)
INERTIA -0.30735 1. 0000PCLCM -0.27047 0.32204 1. 0000PCTCP -0.34459 0.28715 0.15256 1.0000LPCINC -0.40894 0.16981 0.27956 0.077541 1.0000METHQ -0.0093845 0.011410 -0.14304 0.26553 0.27120LPCBLK -0.10132 -0.019679 -0.20112 -0.30305 -0.15791NOE -0.10452 0.068642 0.18039 0.50256 0.41916MD'tJ -0.013492 0.19708 0.18377 0.53446 0.15870i·1 -0.065390 0.23996 0.24522 0.090470 0.24746CONSTANT -0.11495 -0.11587 -0.058725 -0.31692 -0.64141
PCEB INERTIA PCLCH PCTCP LPCINC
METHQ 1.0000LPCBLK -0.085574 1. 0000NOE 0.14413 -0.35482 1.0000MDW 0.097391 -0.36385 0.61759 1.0000vJ 0.055956 -0.24541 0.30650 0.32728 1.0000CONST.r>.NT -0.63317 0.16042 -0.60091 -0.48402 -0.29481
METHQ LPCBLK NOE MDW W
CONSTANT 1. 0000CONSTANT
R-Square Between Observed and Predicted 0.23636Sum of Absolute Residuals = 0.81054Sum of Residuals = -1.11543E-15Standard Error of Residuals = 0.017405Skewness of Residuals = 1.9244Kurtosis of Residuals = 7.3368First-Order Rho = 0.046648Durbin-Watson Statistic = 1.9053Standardized Von-Neumann Ratio Statistic -0.39921Durbin-H Statistic = NA
=== Heteroskedasticity Test (White Test)
Least Squares Escimation
Dependent Variable = E2Estimation Range = 1 69Number of Observations = 69Mean of Dependent Variable = 0.0098420Standard Error of Dependent Variable = 0.019917
R-Square = 0.79058 R-Square Adjusted = 0.69701Standard Error of the Estimate = 0.010963Log-Likel:hood = 226.75
Sum of Squares SSExplained 0.021326Residual 0.0056491Tot~l 0.026976
DF HSS21 0.001015547 0.0001201968 0.00039670
F Prot>F8.~492 8.0278E-10

204
Model II of Decentralization (1969-79) of Business Oriented Services====================================================================
(continued)
Variable Estimated Standard t-Eatio ProbName Coefficient Error 47 DF >ItlPCEB 0.023276 0.016477 1.4126 0.16436INEHTV. 0.012126 0.057693 0.21018 0.83443PCLGl -0.029864 0.039657 -0.75306 0.45517PCTCP -0.044925 0.041232 -1. C896 0.28146LPCINC 0.59397 0.82426 ':'. -2062 0.47472t·1ETHQ 0.00089695 0.0040028 .~. :2408 0.82367LPCELK -0.23798 0.41962 -·J.:·6713 0.57332NOB 0.0049370 0.0057739 C'.25507 0.39685!-1Dv] 0.0058918 0.0045444 1.2965 0.20114~.~. 0.0092320 0.0065464 1.4103 0.16505PCEB~2 -0.011370 0.0070880 -:'.6041 0.115391NERTV.~ 0.54468 0.099347 5.4826 1.618E-06PCLCl'ol~2 0.62530 0.12700 4.9235 1.089E-05PCTCP~2 0.037441 0.037762 0.99151 0.32651LPCINC~2 -23.114 25.010 -0.92420 0.36010LPCBLK~2 1.1283 2.0443 0.55196 0.58359PCES. *11'1 -0.040203 0.049102 -0.31877 0.41705INERTIA. -0.042229 0.33606 -0.12566 0.90054PCLCM. ~P 0.41355 0.24763 1. 6701 0.10156PCTCP. *L 2.0447 2.3645 0.86476 0.39156LPCINC.~ 2.3384 22.372 0.10452 0.91720CONST;'l~T -0.012165 0.0096625 -1.2590 0.21424
Variance-Covariance Matrix of CoefficientsPCES 0.0002715INERTV. -6.528E-05 0.003328PCLCM 0.0003574 -0.0002702 0.OGi573PCTCP 6.575E-06 4.394E-05 0.0003028 0.001700LPCINC -0.006478 0.006977 -0.006353 -'0.01416 0.67940I1ETHQ 9.365E-06 -4.625E-05 2.178E-05 3.327E-05 -0.000491LPCBLK -0.00153 0.002539 -0.001957 -0.006003 0.059421NOE 1.436E-06 -4.533E-05 7.318E-05 7.584E-05 0.0008508MD\'J 1.091E-05 3.327E-05 5.682E-05 4.304E-05 -9.313E-06I'J -2.863E-06 -5.047E-05 3.875E-05 1.879E-06 0.000229PCEB~2 -0.0001104 6.675E-05 -0.00e'161 6.430E-06 0.0025103I NERTI.<; A 7.725E-05 0.002428 _oJ.0001237 0.0001654 0.0003026PCLCM~2 0.001178 -0.001282 0.002161 -6.09lE-05 -0.027085PCTCP~2 4.946E-05 -0.0002612 0.000::528 0.0006825 -0.0093569LPCINC~2 0.11058 -0.1180 0.2:177 0.5277 -17.790LPCSLr:.~2 0.007291 -0.01411 0.0';:44 -0.003866 0.34603peES. *11'1 7.7S1E-05 -0.002606 0.000:766 -3.330E-05 -0.0066691INERTIA. 0.0007983 0.003408 -0.00:895 0.0004525 -0.036211PCLG1. "p -0.001488 0.000917 -0.':·:741 -0.003794 0.042376PCTCP. ~L 0.002994 -0.009758 -0.00~197 -0.08868 0 86728LPCI:.JC .• 0.005567 -0.02491 -lj.: 1 :·05 0.2403 - .3250::CNS':"J..NT -oS .le,cE-OS -6.895E-05 - G ..: :;] 14 ::.966£-05 -0. G1931
PCES INERTV. ::.::.,c:·~ peTCF PCINCt·1ETHQ 1.60n-05LPCS:":: J.OOO2720 0.17608[·rOE 3.044E-G6 -0.000742 3.33';::-j';:·1[:i>1 1.:??8E-06 -0.0002638 1.S3c::-05 2.065£-05

205
Model II of Decentralization (1969-79) of Business Oriented Services====================================================================
(continued)
\'1PCEB A 2INERTIA A
PCLCM A 2PCTCp A 2LPCC::NC A 2L?CBLK"2PCEB,TINI:'JERTIA.PCLCM. *pPCTCP. *LLPCINC. *CONSTANT
PCEB A 2INERTIA A
PCLCM A 2PCTCP A 2LPCINC A 2LPCBLK A 2PCEB.TININERTIA.PCLCH. *pPCTCP. *LLPCINC.TCONSTANT
LPCBLK A 2PCEB. *ININERTIA.PCLCM. *pPCTCP. *LLPCINC.*CONSTANT
LPCINC. *CONSTANT
3.841E-06-4.883E-06-3.453E-056.683E-053.888E-05
0.031660.001396
4.879E-050.0001384
-0.0001804-0.0009056
-0.02175-2.120E-05
METHQ
5.024E-05-5.845E-05-0.0006341-4.528E-05
-0.03932-0.002975
-8.434E-05-0.0005180
0.0005890-0.002534-0.00631
2.507E-05PCEB A 2
4.1790.008866
-0.1219-0.1751. 0883
-29.402-0.007568
LPCBLK A 2
500.520.11291
LPCINC.*
3.865E-060.0006915
0.001071-0.01375
-0.00189981.3134
0.08973-0.001835
-0.00659950.01587
0.2556-7.646
-0.001421LFCBLK
0.00986990.00210510.0002354-0.068462-0.010268
-0.00158950.019639
-0.0005841-0.0025570
0.032004-7.573E-05
INERTIA A
0.0024110.00098830.0004705
0.013060.02789
3.003E-05PCEB.*IN
9.336E-05CONSTi'-.NT
1.187E-05-1.518E-06-5.981E-056.542E-051.131E-05
-0.011620.003725
2.962E-05-0.0002520-0.0004252-0.001208
0.00237-1.992E-05
NOE
0.016130.001084
0.1477-4.764E-06
0.0015090.01214
-0.012630.04207
0.5683-0.0002519
PCLCM A 2
0.112940.0116260.030048
1. 0293-0.0003056
INERTIA.
8.164E-06-4.972E-065.933E-05
8.6599E-053.1699E-05
0.0064090.002305
-1.167E-050.0002512
-0.0003271-0.0001264
-0.008565-1.909E-05
MOW
0.0014260.3693
0.0029080.000338
0.00163-0.002542-0.044140.04945
-1.972E-05PCTCP A 2
0.0613190.164360.60853
0.0006035PCLCM. *p
4.286E-057.693E-07
-0.0002062-9.111E-057.625E-06
0.014660.003459
6.167E-05-0.00032187.7459E-05
0.0007775-0.02532
-1. 256E-05W
625.49-2.76610.124260.48047-1.4113-33.218-50.2060.00424
LPCINC A 2
5.5907-16.068
-0.004845PCTCP. *L
Correlation Matrix ofPCEB 1.0000INERTIA -0.068673PCLCM 0.54694PCTe? 0.0096773LPCINC -0.47698METHQ 0.14199LPCBLK -0.22122!10E 0.015093MDW 0.14572W -0.026543
Coefficients
1.0000-0.118100.018471
0.14672-0.20029'). ~·J4B9
-0.136070.12689
-0.13363
~.O
).13- ij . 190.13
- 0.110.31
0.14
o56
7oC8
1. 0000-0.416680.20159
-0.346930.318570.22972
0.006961
1.0000-0.146720.171800.17877
-0.0024860.042438

206
Model II of Decentralization (1969-79) of Business Oriented Services====================================================================
(continued)
PCEB~2
INERTIA~
PCLCM~2
PCTCP~2
LPCINC~2
LPCBLK A 2PCEB. * ININERTIA.PCLCM. "PPCTCP. *LLPCINC. *CONS7.:'.NT
METHQLPCBLKNOEMOWWPCEB~2
INERTIA A
PCLCM~2
PCTCP~2
LPCINC A 2LPCBLK A 2PCEB. *11'1INERTIA.PCLCM. *PPCTCP. *LLPCINC. *CONSTANT
PCEB~2
INERTIA~
PCLCM~2
PCTCP~2
LPCINC A 2LPCBLK~2
PCEB. *11'1INERTI!'..PCL01. *PPCTCP. *LLPCINC ...CONSTAN'I'
LPCBLK~2
PCEB. *11'1INERTIA.PCLCM. *PPCTCP. *LLPCINC.*
-0.945310.047194
0.562680.079488
0.268340.21645
0.0958010.14417
-0.364790.0768430.015102-0.38354
PCES
1.00000.161950.131690.164810.14659
-0.17211-0.086836
0.131470.257210.316220.170540.248240.10291
-0.18201-0.095688
-0.24290-0.54816
METHQ
1.0000-0.083009
-0.70445-0.16917-0.22181-0.20535-0.24232-0.217470.33559
-0.15120-0.039792
0.36606PCEB~2
1.00 00.0883 7-0.177 0-0.345 -;0.225 6
-0.642 9
0.163230.42352
-0.17496-0.11988
-0.081798-0.11963-0.919830.17575
0.064187-0.071530-0.019298-0.12368
INERTIA
1.0000-0.30613-0.13832
0.00140710.23251
0.025701-0.25805-0.11990
0.125150.10461
-0.089035-0.046799
0.152740.25765
-0.81445-0.35046
LPCBLK
1.00000.16684
0.062739-0.027554-0.050558-0.32584
0.58822-0.023743-0.0108850.014399
-0.078892INERTIA~
1.00000.0598910.038692
0.112500.025392
-0.57272-0.031409
0.429090.235570.223600.52345
0.090715-0.21724-0.75452
-0.044761--).24301-0.36521
PCLCH
1.00000.585430.31398
-0.037091-0.104270.0892150.051882
-0.0804400.315570.10449
-0.12988-0.29744
-0.0884580.018344-0.35700
NOE
1. 00000.22608
0.046506-1.8350E-05
0.242030.28435
-0.401740.140100.20002
-0.20527PCLCW2
1.00000.13971
0.0378150.13690
0.0220020.040384
-0.0116320.438370.51176
-0.045868-0.0166960.032658-0.37160-0.909580.26053
0.074434PCTCP
1. 00000.27442
-0.154360.131410.150050.18472
0.0563910.24815
-0.0522750.16450
-0.29063-0.011765-0.. 084246-0.43472
MDvl
1. 00000.39107
0.0376680.182270.12844
-0.27185-0.494100.058538
-0.054038PCTCp A 2
1.00000.280710.10984
0.429680.003695-0.25874-0.30062-0.862990.20536
-0.16478-0.130730.207610.44501
-0.23454-0.24248
LPCINC
1.00000.016580-0.31706-0.109580.0308440.089549
0.258480.19185
-0.146280.0477830.050228-0.17288-0.19853
W
1. 0000-0.054102
0.101190.057166-0.22789-0.56173
-0.0897300.,]17546L?C:INC~2
1.0000-D.30374

207
Model II of Decentralization (1969-79) ot Business Oriented Services====================================================================
(continued)
CONSTANT -0.38313 0.063303 -0.094124 0.25224 -0.21204LPCBLK~2 PCEB.*IN INERTIA. PCLCM. *p PCTCP. *L
LPCINC. " 1.0000CONST~.NT 0.52233 1.0000
LPCINC. " CONSTl'.NT
~-Scuare Between Observed and Predicted 0.7905BSum 'of Absolute Residuals = 0.42636Sum of Residuals = -1.06729E-14Standard Error of Residuals = 0.0091146Skewness of Residuals = 1.1671Kurtosis of Residuals = 6.8638First-Order Rho = 0.15522Durbin-Watson Statistic = 1.6691Standardized Von-Neumann Ratio Statistic -1.3945Durbin-H Statistic = NA
=== Weighted L-SQ Model
Weighted Least Squares Estimation
Dependent Variable = DEPEstimation Range = 1 69Number of Observations = 69Mean of Dependent Variable = -0.36599Standard Error of Dependent Variable = 3.0521
WARNING: No Constant Term. @ Since the whole model was weighted,there is no constant term; the original constant became l/weight. @
R-Square, AOV may not be reliable! @ In the Weighted LeastSquares, the R-Square Between Observed and Predicted is interpretedinstead of the adjusted R-Square. @
R-Square = 0.99620 R-Square Adjusted = 0.99548Standard Error of the Estimate = 0.20371Log-Likelihood = 17.868
Sum of Squares SSExolained 631.03Residual 2.4069Total 633.43
OF115869
MSS57.366
0.0414989.1802
F Prob>F1382.4 6.9669E-66
'JariableNamePCEBINERTI!'.FeLCHpeTCPLPCINCMETHQLPCBLK
EstimatedCoefficient
0.22004-0.553450.60457
-0.23438-8.9815
-0.0237600.61677
StandardError
0.0535550.141680.17115
0.0911511. 2738
0.0178270.68658
t-Ratio58 OF
4.1087-3.90623.5324
-2.5714-7.0508-1.33280.89832
Prob>Itl
0.000126550.)00247370.00031521
0.0127152.4:)85E-09
J.18':'810.37273

208
Model II of Decentralization (1969-79) of Business Oriented Services====================================================================
(continued)
NOEMOW;v',vEIGHT
0.0097711-0.091899
0.0699610.014234
0.0276830.037201
0.190250.041144
0.35297-2.47030.367740.34595
0.725390.016462
0.714410.73063
Variance-Covariance Matrix of CoefficientspeES 0.002868HJERTIA -0.004502 0.02008PCLCl-l -0.005800 0.02241 0.02929PCTCP -0.004498 0.006641 0.01006 0.008308LPCINC 0.01309 -0.1333 -0.1329 -0.01088 1.6226t1ETHQ 0.0005237 -0.00176 -0. oj'Jl338 -0.00056 0.01525LPCSLK -0.02567 0.07564 0.08341 0.03047 -0.48536NOE 0.0003958 -0.00288 -0.002772 -0.0002285 0.031511ml 0.00116 -0.00408 -0.004793 -0.001533 0.03367W -6.504E-05 -0.000357 0.0002106 0.000265 0.01032WEIGHT -0.001404 0.004427 0.004479 0.001802 -0.04377
PCEB INERTLZI. PCLOl PCTCP LPCINC
METHQ 0.0003178LPCBLK -0.007999 0.47139NOE 0.0003485 -0.013474 0.0007663MDVI 0.0003946 -0.020196 0.0007559 0.001384'v 8.054E-05 -0.0033534 0.0002284 0.0001941 0.036194WEIGHT -0.0006343 0.019874 -0.0009057 -0.001193 -0.000243
METHQ LPCBLK NOE MDW W
WEIGHT 0.0016929IvEIGHT
Correlation Matrix ofPCEB 1.0000INERTIA -0.59335PCLCM -0.63278PCTCP -0.92139LPCINC 0.19192METHQ 0.54851LPCBLK -0.69801NOE 0.26699MDW 0.58208W -0.0063834~EIGHT -0.63734
PCEB
Coefficients
1. 00000.924160.51418
-0.73830-0.696660.77753
-0.73418-0.77468
-0.0132460.75948INEETIA
1. 00000.64463
-0.60960-0.438440.70985
-0.58498-0.75284
-0.00646740.63601
PCLCM
1.0000-0.093742
-0.344650.48681
-0.090567-0.452110.015279
0.48056PCTCP
1.00000.67164
-0.554970.89328o.71058
0.042568-0.83517
LPCINC
HETHQ 1. 0000LPCBLK -0.65355 1.0000NOE 0.70608 -0.70893 1 '::00MD~~1 0.59499 -0.79070 O. 3?9 1.0000~ ••T 0.023746 -0.025674 .J . 0 --, 0.027431 1.0000.) ,-WEIGHT -0.86472 0.70353 -0. 520 -0.77947 -0.031031
METHQ LPCBLK :';OE MDW Iv
'IiEIGHT 1. 0000WEIGHT

209
Model II of Decentralization (1969-79) of Business Oriented Services====================================================================
(continued)
R-Square Between Observed and Predicted 0.99620Sum of Absolute Residuals = 8.7594Su~ of Residuals = 6.02740E-13Standard Error oE Residuals = 0.18814Skewness of Residuals = 0.071900Kurtosis of Residuals = 4.3345First-Order Rho = 0.12677Durbin-Watson Statistic = 1.7243Standardized Von-Neumann Ratio Statistic -1.1621Durbin-H Statistic = NA
=== Heteroskedasticity Re-Test (Breusch-Pagan Test)s20.034882
Least Squares Estimation
Dependent Variable = E2Estimation Range = 1 69Number of Observations = 69Mean of Dependent Variable = 0.12283Standard Error of Dependent Variable
WARNING: No Constant Term.R-Square. AOV may not be reliable!
0.61030
R-Square = 0.69396 R-Square AdjustedStandard Error of the Estimate 0.36557Log-Likelihood = -22.481
0.63592
Sum of Squares SSExplained 17.577Residual 7.7512Total 25.328
OF115869
MSS1.5979
0.133640.36707
F11.956
Prob>F2.7544E-ll
VariableNamePCEBINERTIAPCLCl1PCTepLPCINCMETHQLPCBLKNOEl-IDWWWEIGHT
EstimatedCoefficient
-0.044421-0.17779-0.42904
-0.024708-6.2044
-0.095631-0.105810.037394
-0.075883-0.082358
0.27221
StandardError
0.0961080.254260.307140.16358
2.28600.031992
1.23210.0496780.066760
0.341410.073836
t-Ratio58 DF
-0.46220-0.69923
-1. 3969-0.15105
-2.7141-2.9893
-0.0858800.75272-1.1366
-0.241233.6867
Prob>Itl
0.645670.487200.167770.88046
0.00873600.0040970
0.931860.454660.26036C'.81023
o.0 ':. ,j 5 0 1 ? 9
Variance-Co~ariance Matrix of CoefficientspeEB 0.009237INERTIA -0.0145 0.064650

210
Model II of Decentralization (1969-79) of Business Oriented Services====================================================================
(continued)
PCLCH -0.01868 0.072171 0.094333PCTCP -0.01449 0.021386 0.032386 0.02676LPCINC 0.04216 -0.42913 -0.42800 -0.03505 5.2256l-lETHQ 0.001687 -0.0056668 -0.0043080 -0.001804 0.04912LPCBLK -0.08266 0.24358 0.26863 0.09811 -1. 5631NOE 0.001275 -0.0092737 -0.0089256 -0.000736 0.101441-10:\' 0.003735 -0.013150 -0.015437 -0.004937 0.10844W -0.0002095 -0.0011498 -0.00067817 0.000853 0.03322viEIGHT -0.004523 0.014258 0.014423 0.005804 -0.14097
PCEB INERTIA PCLCM PCTCP L?CINC
l-lETHQ 0.001024LPCBLK -0.02576 1. 5181NOE (>.001122 -0.043393 0.002468HOI'; 0.001271 -0.065040 0.002434 0.004457vI 0.0002594 -0.010800 0.0007356 0.000625 0.11656vlEIGHT -0.002043 0.064003 -0.002917 -0.003842 -0.00078
METHQ LPCBLK NOE MDW W
WEIGHT 0.005452vJEIGHT
Correlation Matrix of CoefficientsPCEB 1. 0000INERTIA -0.59335 1. 0000PCLCM -0.63278 0.92416 1.0000PCTCP -0.92139 0.51418 0.64463 1.0000LPCINC 0.19192 -0.73830 -0.60960 -0.093742 1.0000HETHQ 0.54851 -0.69666 -0.43844 -0.34465 0.67164LPCBLK -0.69801 0.77753 0.70985 0.48681 -0.55497NOE 0.26699 -0.73418 -0.58498 -0.090567 0.89328MDW 0.58208 -0.77468 -0.75284 -0.45211 0.71058W -0.006383 -0.01325 -0.006467 0.01528 0.04257WEIGHT -0.63734 0.75948 0.63601 0.48056 -0.83517
PCEB INERTIA PCLCH PCTCP LPCINC
METHQ 1.0000LPCBLK -0.65355 1.0000NOE 0.70608 -0.70893 1.0000NDW 0.59499 -0.79070 0.73399 1.0000W 0.023746 -0.025674 0.043373 0.027431 :.0000\\TEIGHT -0.86472 0.70353 -0.79520 -0.77947 -0.03103
NETHQ LPCBLK NOE MDW W
I-JEIGHT 1.0000l'iEIGHT
R-Square Between Observed and PredictedSum of Absolute Residuals = 11.909Sum of Reslduals = -2.37421E-13Standard Error of Residuals = 0.33762Skewness of Residuals = -1.8463
0.69396
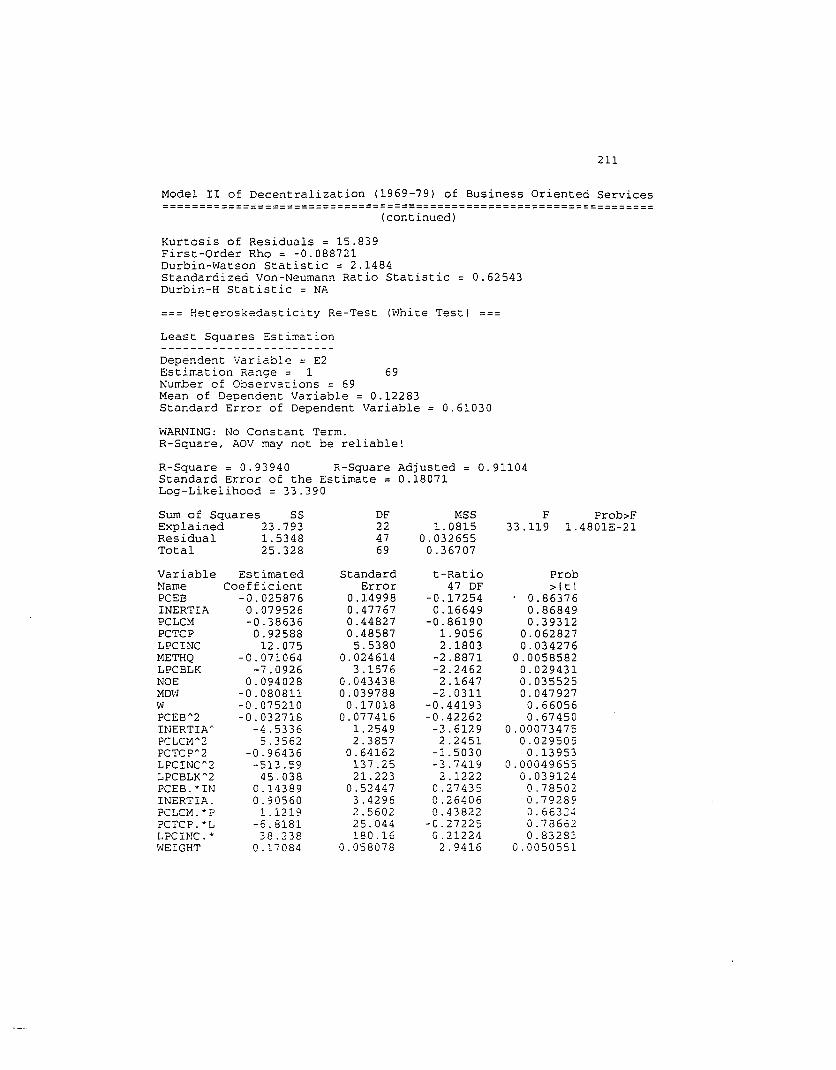
211
Model II of Decentralization (1969-79) of Business Oriented Services====================================================================
(continued)
Kurtosis of Residuals = 15.839First-Order Rho = -0.088721Durbin-Watson Statistic = 2.1484Standardized Von-Neumann Ratio Statistic = 0.62543Durbin-H Statistic = NA
=== Heteroskedasticity Re-Test (White Test) ===Least Squares Estimation
Dependent Variable = E2Estimation Range = 1 69Number of Observations = 69Mean of Dependent Variable = 0.12283Standard Error of Dependent Variable
WARNING: No Constant Term.R-Square, AOV may not be reliable!
0.61030
R-Square = 0.93940 R-Square AdjustedStandard Error of the Estimate = 0.18071Log-Likelihood = 33.390
0.91104
Sum of Squares SS OF MSS F Prob>FExplained 23.793 22 1.0815 33.119 1.4801E-21Residual 1.5348 47 0.032655Total 25.328 69 0.36707
Variable Estimated Standard t-Ratio ProbName Coefficient Error 47 OF >ItlPCEB -0.025876 0.14998 -0.17254 0.86376INERTIA 0.079526 0.47767 0.16649 0.86849PCLCM -0.38636 0.44827 -0.86190 0.39312PCTCP 0.92588 0.48587 1. 9056 0.062827LPCINC 12.075 5.5380 2.1803 0.034276METHQ -0.071064 0.024614 -2.8871 0.0058582LPCBLK -7.0926 3.1576 -2.2462 0.029431NOE 0.094028 0.043438 2.1647 0.035525MD\'J -0.080811 0.039788 -2.0311 0.047927W -0.075210 0.17018 -0.44193 0.66056PCEB A 2 -0.032718 0.077416 -0.42262 0.67450INERTIA~ -4.5336 1.2549 -3.6129 0.00073475PCLCM A 2 5.3562 2.3857 2.2451 0.029505PCTCp A 2 -0.96436 0.64162 -1.5030 0.13953LPCINC2 -513. S9 137.25 -3.7419 0.00049655LPCBLK A 2 45.038 21.223 2.1222 0.039124PCEB.*IN 0.14389 0.52447 0.27435 0.78502INERTIA. 0.90560 3.4296 0.26406 0.7928?PCLOL *P 1.1219 2.5602 0.43822 0.663: ..PCTCP. *L -6.8181 25.044 -0.27225 0.78662LPCINC.* 38.238 180.16 0.21224 0.8328~
WEIGHT 0.17084 0.058078 2.9416 0.0050551

212
Model II of Decentralization (1969-79) of Business Oriented Services====================================================================
(continued)
Variance-Covariance Matrix of CoefficientsPCESINERTI.".PCL01PCTC?L?CINCr-1ETEQLPC3LKNOEI'1D~'J
I'!PCEE~2
INERTI;'.'PCLCM~2
PCTC?~2
LPCINC~2
LPCBLK A 2PCEB. "ININERTIlI..PCLCM. "PPCTCP. "LLPCINC ...WEIGHT
METHQLPCBLKNOEMDI'IWPCEB A 2INERTIA A
PCLCM A 2PCTCp A 2LPCINC A 2LPCBLK~2
PCEB. "ININERTIA.PCLCM. "PPCTCP. +LLPCINC .•;"iEIGHT
PCEB~2
INERTI:'I.~
PCLCM~2
PCTCp h 2LP'::INC 2LFCBLK"2PCE3.·ININERTI:'I..PCLCM .• P
0.02249-0.034980.036060.01541-0.4249
-0.0001941-0.3455
0.0022740.00267
-0.0003395-0.01021-0.088330.031440.016431. 6599
0.845490.02002
-0.27621-0.22079-0.72105
7.6288-0.000156
PCEB
0.00060590.0237
0.00043240.00034950.00011719.184E-05
0.001685-0.009593
0.0014011. 4561
0.0564390.001185
0.03410-0.005116
-0.0781-1.5865
-0.001007l'lETHQ
0.0059930.04995
-0.04258-0.01773
-2.7639-0.2170
-0.018780.09559
0.0842
0.22817-0.061625-0.055644
0.73668-0.000737
0.60813-0.015045
-0.0079777-0.005558
0.0187170.25397
-0.094528-0.019545
-9.5584-4.4316
-0.206470.935760.374081. 09805.1491
0.00124INERTIA
9.9705-0.025626-0.0568010.014461
0.160361. 5608
0.19680-0.14882-5.1780-4.0220
-0.489385.75872.897927.381
-365.53-0.071419
LPCBLK
1.5747-1.0071
-0.12938-54.9714.9397
-0.356291. 34021.1485
0.200950.050'777-0.6 7 097
-0.00272.21-0.65212
0.0064825-0.00100110.0011091-0.014139-0.068599-0.40305
-0.037830-5.89455.6746
0.0081368-1. 0125
-0.875700.030517
-9.97690.0042049
PCLCM
0.0018870.00096110.0007948-0.000959-0.005444-0.02701
-0.001947-0.1924
0.64840.008795-0.07398-0.038540.13295-3.5652
-0.001378;:OE
5. 160.3 26
6. 72-18 340.::' 83
2. 881. 55
0.23607-1.8880
0.0016875-0.67292
0.00155970.0030658
-0.0040533-0.015007-0.22033
-0.0969620.1131347.990
-0.468180.13287
-0.011975-0.32322-10.32430.319
0.010979PCTCP
0.0015830.0002459-0.001091-0.006790
-0.02099-2.927E-06
0.59260.08688
0.004844-0.03138
-0.009535-0.1102
1.0827-0.00087
l-lD\v
0.4116742.958
-1.3754O. 'J815310.38302
-0.1'7516
30.6700.012777
9.35490.036911
-0.0191810.073681
0.259413.9334
-2.2804-0.98065-546.4030.634
-1.48291. 35145.762490.302
-583.97-0.19068
LPCINC
0.028960.0002036
0.005596-0.01439
-0.003393-1.1650.3295
0.002452-0.031710.002739
0.2959-2.7506
-0.00074W
1883- 61.2
4.8967.'21. EE
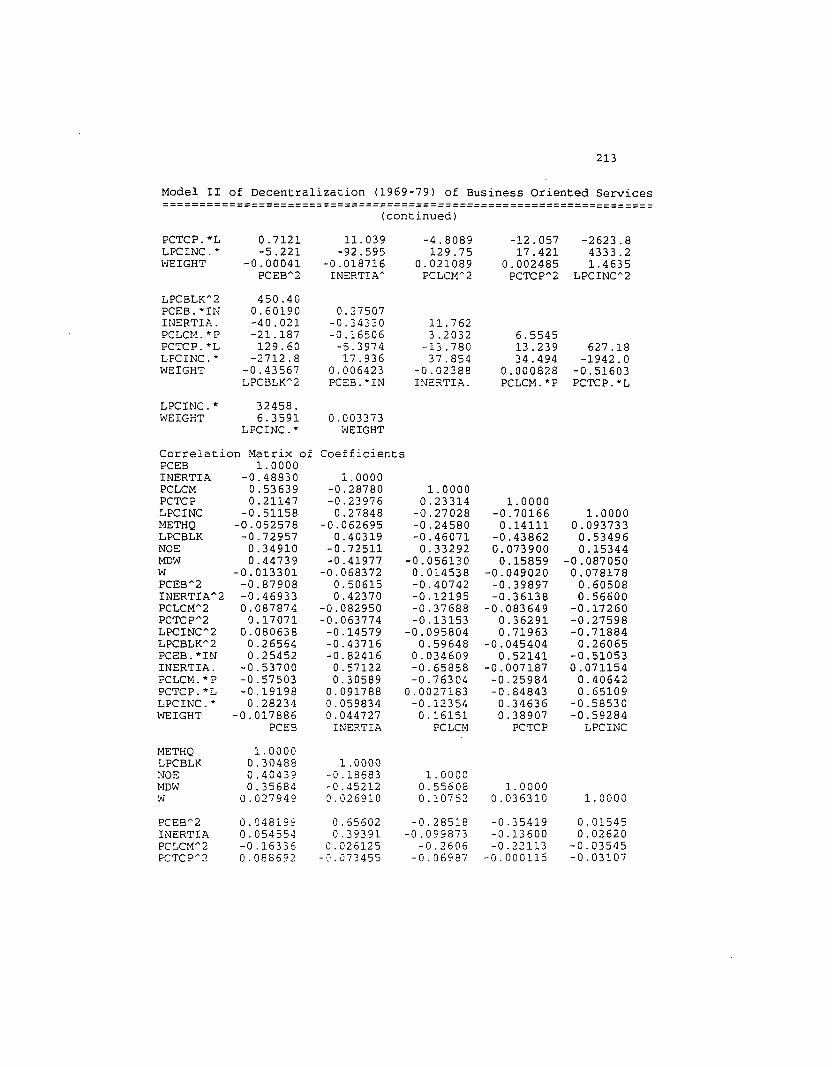
213
Model II of Decentralization (1969-79l of Business Oriented Services====================================================================
(continued)
PCTCP. "LLPCINC."WEIGHT
LPCBLK A 2PCEB. "ININERTIA.PCLCl". "PPC~CP. "LLPCINC."WEIGHT
LPCINC."WEIGHT
0.7121-5.221
-0.00041PCEB"2
450.400.60190-40.021-21.187129.60
-2712.8-0.43567LPCBLK A 2
32458.6.3591
LPCINC."
11.039-92 .595
-0.018716INERTIA A
0.27507-0.34330-0.16506
-5.397417.936
0.006423PCEB. "IN
0.003373WEIGHT
-4.8089129.75
0.021089PCLCM"2
11.7623.2032
-13.78037.854
-0.02388INERTIA.
-12.05717.421
0.002485PCTCP"2
6.554513.23934.494
0.000828PCLCM. "P
-2623.84333.21. 4635
LPCINC"2
627.18-1942.0
-0.51603PCTCP. "L
CoefficientsCorrelation Matrix ofPCEB 1.0000INERTIA -0.48830PCLCM 0.53639PCTCP 0.21147LPCINC -0.51158METHQ -0.052578LPCBLK -0.72957NOE 0.34910MOW 0.44739W -0.013301PCEB A 2 -0.87908INERTIA"2 -0.46933PCLCM A 2 0.087874PCTCP"2 0 .17071LPCINC A 2 0.080638LPCBLK"2 0.26564PCEB."IN 0.25452INERTIA. -0.53700PCLCM."P -0.57503PCTCP."L -0.19198LPCINC." 0.28234WEIGHT -0.017886
PCES
1.0000-0.28780-0.239760.27848
-0.0626950.40319
-0.72511-0.41977
-0.0683720.506150.42370
-0.082950-0.063774-0.14579-0.43716-0.82416o.571220.30589
0.0917880.0598340.044727
INERTIA
1. 00000.23314
-0.27028-0.24580-0.460710.33292
-0.0561300.014538-0.40742-0.12195-0.37688-0.13153
-0.0958040.59648
0.034609-0.65858-0.76304
0.0027183-0.123540.16151
PCLCM
1. 0000-0.70166
0.14111-0.438620.073900
0.15859-0.049020
-0.39897-0.36138
-0.0836490.362910.71963
-0.0454040.52141
-0.007187-0.25984-0.848430.346360.38907
PCTCP
1.00000.093733
0.534960.15344
-0.0870500.078178
0.605080.56600
-0.17260-0.27598-0.71884
0.26065-0.510530.071154
0.406420.65109
-0.58530-0.59284
LPCINC
METHQLPCBLKNOEl-IDW'1'1
PCEB"2INERTIAPCLCM"2PCTCP"2
1. 00000.304880.404390.35684
0.027949
0.04819~
0.054554-0.163360.088692
1.0000-0.18683-0.452120.026910
0.656020.39391
0.026125- ': . 073455
1.00000.556080.10752
-0.28518-0.099873
-0.2606-0.06987
1. 00000.036310
-0.35419-0.13600-0.22113
-0.000115
1.0000
0.015450.02620
-0.03545-0.03107

214
Model II of Decentralization (1969-79) of Business Oriented Services====================================================================
(continued)
LPCINC~2 0.43100 -0.011948 -0.032264 0.10852 -0.04989LPCBLK~2 0.10804 -0.060018 0.70337 0.10288 0.09122PCEB. *IN 0.091782 -0.29551 0.38607 0.23214 0.02747INERTI.".. 0.40400 0.53177 -0.49657 -0.22993 -0.05432PCLCM. *p -0.081178 0.35847 -0.34654 -0.093606 0.006287PCTCP. *L -0.12670 0.34625 0.12221 -0.11059 0.06943LFCINC. * -0.35777 -0.64255 -0.45557 0.15104 -0.08971,'iEIGHT -0.70416 -0.38944 -0.54619 -0.37576 -0.07il.Cl9
IolETHQ LPCBLK NO::: MDW ~v
PCEB~2 1.0000INERTIA~ 0.51418 1. 0000PCLOI~2 -0.23056 -0.33639 1.0000PCTCP~2 -0.35689 -0.16070 0.26018 1.0000LPCINC2 -0.26011 -0.31916 0.018345 0.48781 1.0000LPCBLK~2 -0.13209 0.18548 -0.36014 -0.10101 -0.22700PCEB. *IN -0.46253 -0.54135 0.25720 0.24228 0.48471INERTI!'.. 0.36004 0.31142 0.26996 0.17406 0.35529PCLCH. *p 0.42531 0.35750 0.29724 -0.10663 -0.26087PCTCP. *L 0.36728 0.35127 -0.080487 -0.75036 -0.76331LPCINC.* -0.37435 -0.40958 0.30188 0.15071 0.17524viEIGHT -0.09122 -0.25680 0.15220 0.06668 0.18360
PCEB~2 INERTI!'.~ PCLCW2 PCTCP~2 LPCINC A 2
LPCBLK~2 1.0000PCEB. *IN 0.05408 1.0000INERTIA. -0.54985 -0.19086 1. 0000PCLCM. *p -0.38994 -0.12293 0.36481 1. 0000PCTCP. *L 0.24383 -0.41093 -0.16045 0.20649 1.0000LPCINC.* -0.70952 0.18983 0.061265 0.074786 -0.43041WEIGHT -0.35347 0.21087 -0.11989 ~ .0055695 -0.35478
LPCBLK~2 PCEB. *IN INERTIA. i?CLCM. *p PCTCP. *L
LPCINC.* 1.0000WEIGHT 0.60775 1.0000
LPCINC.* viEIGHT
R-Square Between Observed and Predicted 0.93940Sum of Absolute Residuals = 7.7161Sum of Residuals = 1.66712E-12Standard Error of Residuals = 0.15023Skewness of Residuals = -0.30970Kurtosis of Residuals = 3.4337First-Order Rho = 0.076583Durbin-Watson Statistic = 1.8212Standardized Von-Neumann Ratio Statistic -0.75333Durbin-H Statistic = NA
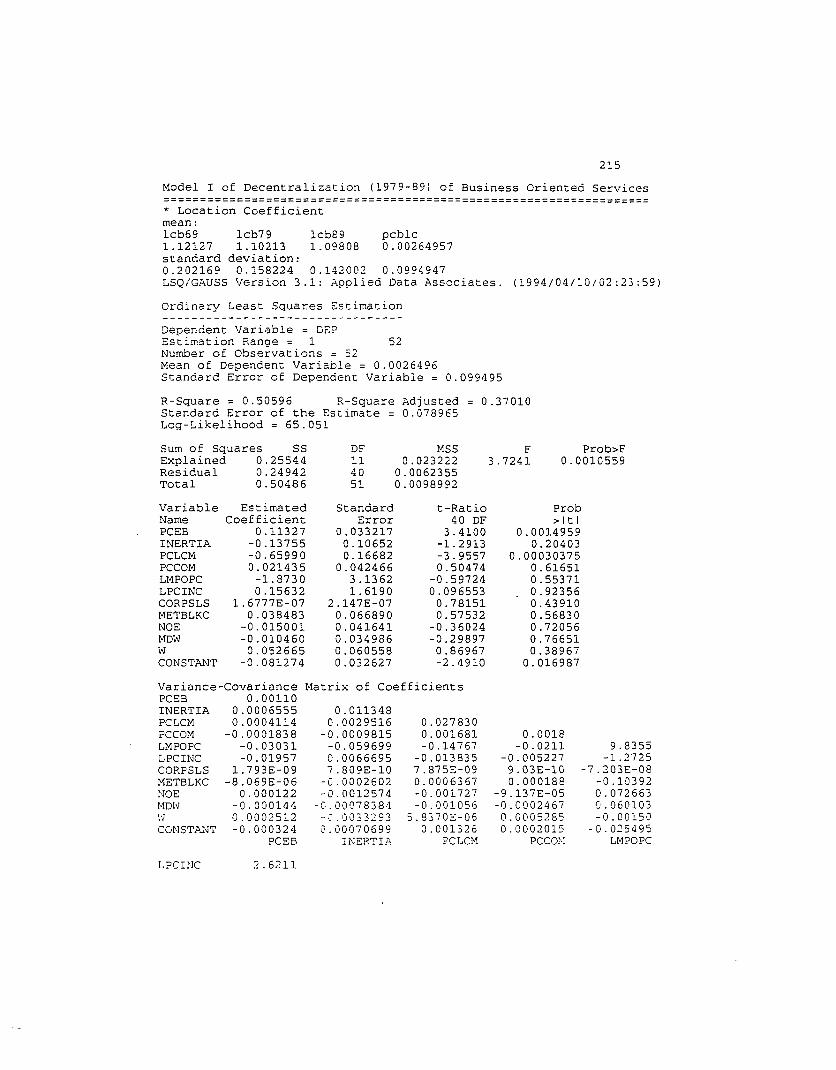
215
Model I of Decentralization (1979-89) of Business Oriented Services===================================================================* Location Coefficientmean:lcb69 lcb79 lcb89 pcblc1.12127 1.10213 1.09808 0.00264957standard deviation:0.202169 0.158224 0.142002 0.0994947LSQ/GAUSS Version 3.1: Applied Data Associates. (1994/04/10/02:23:59)
Ordinary Least Squares Estimation
Dependent Variable = DE?Estimation Range = 1 52Number of Observations = 52Mean of Dependent Variable = 0.0026496Standard Error of Dependent Variable = 0.099495
R-Square = 0.50596 R-Square Adjusted = 0.37010Standard Error of the Estimate 0.078965Log-Likelihood = 65.051
Sum of Squares SS DF MSS F Prob>FExplained 0.25544 11 0.023222 3.7241 0.0010559Residual 0.24942 40 0.0062355Total 0.50486 51 0.0098992
Variable Estimated Standard t-Ratio ProbName Coefficient Error 40 OF >ItlPCEB 0.11327 0.033217 3.4100 0.0014959INERTIA -0.13755 0.10652 -1. 2913 0.20403PCLCM -0.65990 0.16682 -3.9557 0.00030375PCCOM 0.021435 0.042466 0.50474 0.61651Ll1POPC -1.8730 3.13 62 -0.59724 0.55371LPCINC 0.15632 1. 6190 0.096553 0.92356CORPSLS 1.6777E-07 2.147E-07 0.78151 0.43910METBLKC 0.038483 0.066890 0.57532 0.56830NOE -0.015001 0.041641 -0.36024 0.72056MDW -0.010460 0.034986 -0.29897 0.76651W 0.052665 0.060558 0.86967 0.38967CONSTANT -0.081274 0.032627 -2.4910 0.016987
Variance-Covariance l1atrix of CoefficientsPCEBINERTIAPCLCl1PCCONLl1POPCLPCINCCORPSLSl1ETBLKCNOEMmJ\yCONSTJl.NT
LPCEJC
0.001100.00065550.0004114
-0.0001838-0.03031-0.01957
1.793E-09-8.069E-06
0.000122-0.0001440.0002512-0.000324
PCEB
2.6211
0.0113480.0029516
-0.0009815-0.0596990.00666957.809E-10
-0.0002602-0.0012574
-C'.00078384- .:' . () 0 3 3 ::: 9 30.00070699
INERTIF-.
0.0278300.001681-0.14767
-0.0138357.875E-090.0006367-0.001727-0.001056
5.8370E-060.001326
PCLCN
0.0018-0.0211
-0.0052279.03E-100.000188
-9.137E-05-0.00024670.00052650.000201::
PCCOl-l
9.8355-1.2725
-7.203E-08-0.103920.0726630.060103-0.00150
-0.025495LMPOPC

216
Model I of Decentralization (1979-89) of Business Oriented Services===================================================================
(continued)
CORPSLS -4.21E-08 4.6086E-14METBLKC 0.01327 1.5857E-09 0.004474NOE -0.03267 -1.4850E-09 -0.001029 0.00173MDW 0.004664 -1.1632E-09 -0.0008396 0.000771 0.00122vJ -0.005523 4.1423E-10 0.0001199 0.0006999 0.000511CONSTJl.NT -0.01258 -7.6043E-10 -4.760E-05 -0.000497 -0.000700
LPCINC CORPSLS METBLKC NOE l1D1oJ
W 0.003667CONSTl'.NT -0.000726 0.001065
~.J CONST.".NT
Correlation Matrix of CoefficientsPCEB 1.0000INERTIJl. 0.18525 1. 0000PCLCM 0.074243 0.16609 1. 0000PCCOM -0.13029 -0.21697 0.23734 1.0000LMPOPC -0.29099 -0.17870 -0.28225 -0.15859 1.0000LPCINC -0.36395 0.038673 -0.051227 -0.076022 -0.25062CORPSLS 0.25147 0.034148 0.21990 0.099051 -0.10698METBLKC -0.003631 -0.036515 0.057056 0.066174 -0.49538NOE 0.088213 -0.28347 -0.24866 -0.051671 0.55641MOW -0.12391 -0.21032 -0.18087 -0.16606 0.54778W 0.12487 -0.51610 0.0005778 0.20552 -0.007915CONSTANT -0.29905 0.20342 0.24361 0.14540 -0.24916
PCEB INERTIA PCLCM PCCOM LMPOPC
LPCINC 1.0000CORPSLS -0.12112 1.0000METBLKC 0.12250 o.11042 1.0000NOE -0.48466 -0.16611 -0.36959 i. 0000MDW 0.082349 -0.15487 -0.35877 0.52952 1. 0000W -0.056336 0.031863 0.029592 0.27756 0.24113CONSTANT -0.23810 -0.10857 -0.021813 -0.36587 -0.61329
LPCINC CORPSLS METBLKC NOE MOW
W 1.0000CONSTANT -0.36759 1.0000
W CONSTANTR-Square Between Observed and Predicted 0.50596Sum of Absolute Residuals = 2.6605Sum of Residuals = -1.09635E-15Standard Error of Residuals = 0.069933Skewness of Residuals = 0.84870Kurtosis of Residuals = 5.8289First-Order Rho = -0.037553Durbin-Watson Statistic = 1.9875Standardized Von-Neumann Ratio Statistic = -0.045866Durbin-H Statistic = NA
=== Heteroskedasticity Test (Koenkar-Basset Test) ===ko0.00011641

217
Model I of Decentralization (1979-89) of Business Oriented Services===================================================================
(continued)
Least Squares Estimation
Dependent Variable = E2Estimation Range = 1 52Nurrber 0:: Observations = 52Mean of Dependent Variable = 0.0047966Standard Error of Dependenc Variable = 0.010895
R-Square = 0.34914 R-Square Adjusted = 0.17015Standard Error of the ~stimate 0.0099245Log-Likelihood = 172.90
Sum of Sauares SS DF MSS F Prob>FExolainect 0.0021135 11 G.00019213 1.9507 0.061186Residual 0.0039399 40 9.8496E-05Total 0.0060533 51 0.00011869
Variable Estimated Standard t-Ratio ProbName Coefficient Error 40 DF >ItlPCEB 0.0090778 0.0041748 2.1744 0.035646INERTIA -0.017021 0.013388 -1. 2713 0.21096PCLCM -0.045054 o.020967 -2.1488 0.037754PCCOM 0.0029106 0.0053373 0.54533 0.58855LMPOPC -0.21945 0.39416 -0.55675 0.58080LPCINC 0.12629 0.20348 0.62064 0.53835CORPSLS 6.0116E-10 2.6981E-08 0.022281 0.98233METBLKC 9.4776E-05 0.0084069 0.011274 0.99106NOE -0.0037674 0.0052335 -0.71985 0.47580MOW -0.0050420 0.0043971 -1.1467 0.25834W 0.0035713 0.0076110 0.46922 0.64146CONSTANT -0.00031218 0.0041006 -0.076132 0.93969
Variance-Covariance I-latrix of CoefficientsPCEB 1.743E-05INERTI;', 1.0358-05 0.000179PCLCM 6.499E-06 4.662E-05 0.00044PCCOM -2.903E-06 -1.550E-05 2.656E-05 2.849E-05LHPOPC -0.000479 -0.000943 -0.0023 -0.000334 0.1554LPCINC -0.000309 0.000105 -0.000219 -8.256E-05 -0.02010CORPSLS 2.833E-ll 1. 234E-ll 1.244E-10 1.426E-11 -1.138E-09METBLKC -1.275E-07 -4.110E-06 1.006E-05 2.969E-06 -0.001642NOE 1.927E-06 -1.986E-05 -2.729E-05 -1.443E-06 0.00115MDW -2.275E-06 -1.238E-05 -1.668E-05 -3.897E-06 0.0009494W 3.968E-06 -5.259E-05 9.220E-08 8.349E-06 -2.375E-05CONSTANT -5.119E-06 1.117E-05 2.094E-05 3.18E-06 -0.0004027
PCEB INERTIA PCLG1 PCCOM LMPOPC
LPCINC o. 0414CORPSLS -6.649E-10 .280E-161-1ETBLKC 0.00021 .505E-11 7.068E-05NOE -0.000516 - .346E-11 -1.626E-05 2.739E-05MDW 7.368E-05 - .837E-11 -1.326E-05 1.219E-05 1.934E-05vi -8.725E-05 .543E-12 1.893E-06 1.106E-05 8.07E-06

218
Model I of Decentralization (1979-89) of Business Oriented Services===================================================================
(continued)
CONSTA.l\JT -0.000199 -1.201E-11 -7.519E-07 -7.852E-06 -1.106E-05LPCINC CORPSLS METBLKC NOE MDW
W 5.793E-05CONSTl,NT -1.147E-05 1.682E-05
vi COHSTlI.NT
Correlation Hatrix of CoefficientsPCEB 1. 0000INERTIA 0.18525 1. 0000PCLCM 0.074243 0.16609 1.0000PCCOM -0.13029 -0.21697 0.23734 1.0000LMPOPC -0.29099 -0.17870 -0.28225 -0.15859 1. 0000LPCINC -0.36395 0.038673 -0.051227 -0.076022 -0.25062CORPSLS 0.25147 0.034148 0.21990 0.099051 -0.10698METBLKC -0.0036314 -0.036515 0.057056 0.066174 -0.49538NOE 0.088213 -0.28347 -0.24866 -0.051671 0.55641MOW -0.12391 -0.21032 -0.18087 -0.16606 0.54778W 0.12487 -0.51610 0.000578 0.20552 -0.007915CONSTANT -0.29905 0.20342 0.24361 0.14540 -0.24916
PCEB INERTIA PCLCM PCCOM LMPOPC
LPCINC 1. 0000CORPSLS -0.12112 1.0000METBLKC 0.12250 0.11042 1.0000NOE -0.48466 -0.16611 -0.36959 1. 0000MOW 0.082349 -0.15487 -0.35877 0.52952 1.0000W -0.056336 0.031863 0.029592 0.27756 0.24113CONSTANT -0.23810 -0.10857 -0.021813 -0.36587 -0.61329
LPCINC CORPSLS METBLKC NOE MOW
W 1. 0000CONSTANT -0.36759 1.0000
W CONSTJl.NT
R-Square Between Observed and Predicted 0.34914Sum of Absolute Residuals = 0.29851Sum of Residuals = -6.15827E-17Standard Error of Residuals = 0.0087893Skewness of Residuals = 2.5805Kurtosis of Residuals = 14.056First-Order Rho = -0.056258Durbin-Watson Statistic = 2.0523Standardized Von-Neumann Ratio Statistic 0.19229Durbin-H Statistic = NA

219
Model II of Decentralization (1979-89) of Business Oriented Services====================================================================* Location Coefficientmean:lcb69 lcb79 lcb89 pcblc1.13599 1.09607 1.09730 0.00761951standard deviation:0.214985 0.152466 0.132304 0.0939900LSQ/GAUSS version 3.1: Applied Data Associates. (1994/04/10/00:34:09)
Ordinary Least Squares Estimation
Dependent Variable = DEPEstimation Range = 1 74Number of Observations = 74Mean of Dependent variable = 0.0076195Standard Error of Dependent Variable = 0.093990
R-Square = 0.28145 R-Square Adjusted = 0.15397Standard Error of the Estimate 0.086452Log-Likelihood = 82.709
4.8765-0.907010.00145
-0.062600.046380.03279
-0.00195-0.00929
Ll1POPC
0.001528-0.01173-0.00454
7.585E-05-1.306E-05-7.013E-06-0.0002176
0.0001289.411E-05
PCCOf.l
0.009740.00076
-0.027870.01538
8.814E-050.000275
-0.000942-0.000665-0.0006020.000281
PCLCM
DF MSS F Prob>F11 0.016501 2.2077 0.02504362 0.007473973 0.0088341
Standard t-Ratio ProbError 62 DF >Itl
0.030851 2.9732 0.00419350.10418 -1. 6101 0.11246
0.098691 -0.79678 0.428620.039089 1.8042 0.076063
2.2083 -2.1469 0.0357231.5122 -0.064301 0.94894
0.024348 0.54190 0.589830.058925 0.34662 0.730050.039062 -0.99896 0.321700.031794 -0.52696 0.600100.048362 0.79064 0.432170.033438 -1.3203 0.19158
of Coefficients
0.010850.00358
-0.000555-0.04950.00323
-0.000425-0.000312-0.00108
-0.000671-0.002200.000981
INERTIA
SS0.181510.463380.64489
EstimatedCoefficient
0.091725-0.16774
-0.0786340.070523
-4.7409-0.097237
0.0131940.020425
-0.039021-0.016754
0.038237-0.044149
Sum of SquaresExplainedResidualTotal
variance-Covariance MatrixPCEB 0.000952INERTIA 0.000665PCLCM 8.758E-05PCCOM -0.00013LMPOPC -0.0191LPCINC -0.0169METHQ 0.000144METBLKC -0.000234NOE 0.000134MDW -7.906E-05W 8.513E-05CONSTANT -0.0004
PCEB
variableNamePCEBINERTIAPCLCMPCCOMLMPOPCLPCINCMETHQI1ETBLKCNOEMDWWCONSTANT
LPCINC 2.2868
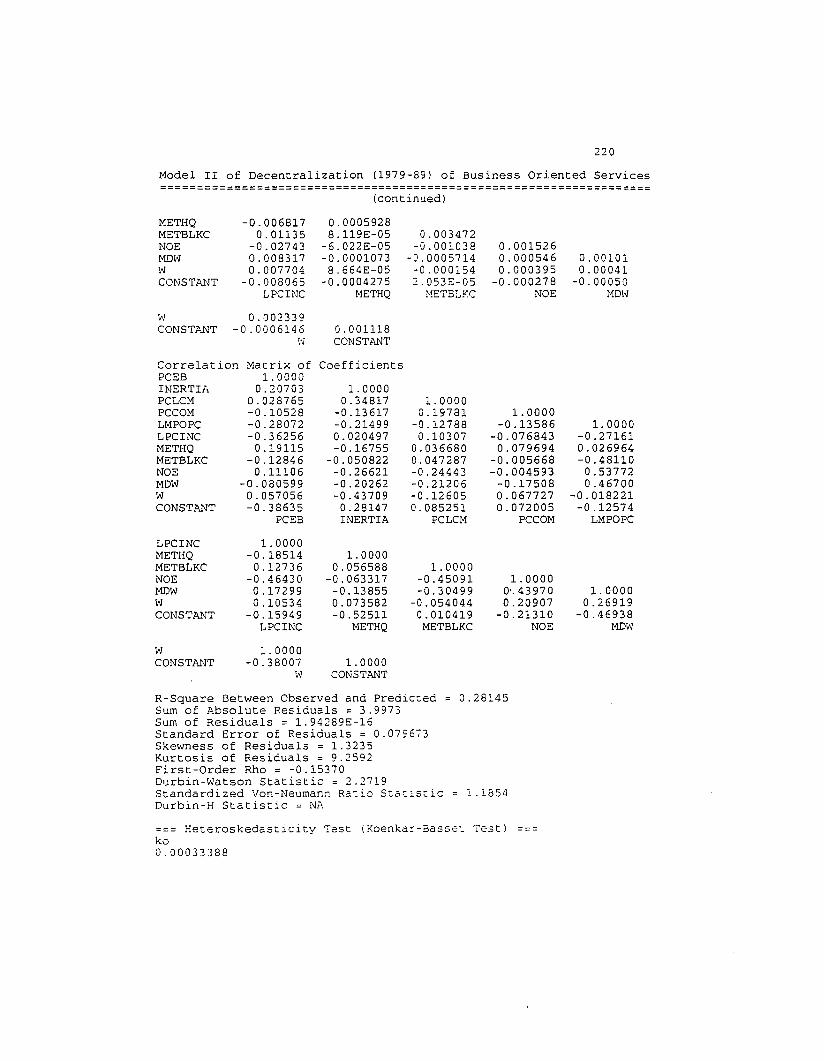
220
Model II of Decentralization (1979-89) of Business Oriented Services====================================================================
(continued)
METHQMETBLKCNOEMDWWCONSTJl.NT
-0.0068170.01135
-0.027430.0083170.007704
-0.008065LPCINC
0.00059288.119E-05
-6.022E-05-0.00010738.664E-05
-0.0004275~jETHQ
0.003472-0.001038
-0.0005714-0.0001542.053E-05
Y!ETBLKC
0.0015260.0005460.000395
-0.000278NOE
0.001010.00041
-0.00050MOl"
W 0.002339CONSTJl.NT -0.0006146
\'10.001118CONSTANT
CorrelationPCEBINERTIAPCLCMPCCOMLMPOPCLPCINCMETHQMETBLKCNOEMOWWCONSTANT
Matrix of1.0000
0.207030.028765-0.10528-0.28072-0.36256
0.19115-0.12846
0.11106-0.0805990.057056-0.38635
PCEB
Coefficients
1.00000.34817
-0.13617-0.214990.020497-0.16755
-0.050822-0.26621-0.20262-0.43709
0.28147INERTIA
1. 00000.19781
-0.127880.10307
0.0366800.047287-0.24443-0.21206-0.126050.085251
PCLCM
1. 0000-0.13586
-0.0768430.079694
-0.005668-0.004593
-0.175080.0677270.072005
PCCOM
1. 0000-0.271610.026964-0.481100.537720.46700
-0.018221-0.12574
LMPOPC
LPCINCMETHQMETBLKCNOEMOWWCONSTANT
WCONSTANT
1.0000-0.185140.12736
-0.464300.172990.10534
-0.15949LPCINC
1.0000-0.38007
W
1.00000.056588
-0.063317-0.138550.073582-0.52511
METHQ
1.0000CONSTANT
1.0000-0.45091-0.30499
-0.0540440.010419
METBLKC
1. 00000'.439700.20907
-0.21310NOE
1. 00000.26919
-0.46938MOW
R-Square Between Observed and Predicced 0.28145Sum of Absolute Residuals = 3.9973Sum of Residuals = 1.94289E-16Standard Error of Residuals = 0.079673Skewness of Residuals = 1.3235Kurtosis of Residuals = 9.2592First-Order Rho = -0.15370Durbin-Watson Statistic = 2.2719Standardized Von-Neuman~ Ratio Sta:iscic = 1.1854Durbin-H Statistic = NA
=== Heteroskedasticity ~est (Koenka~-Basse: Test)ko0.00033388
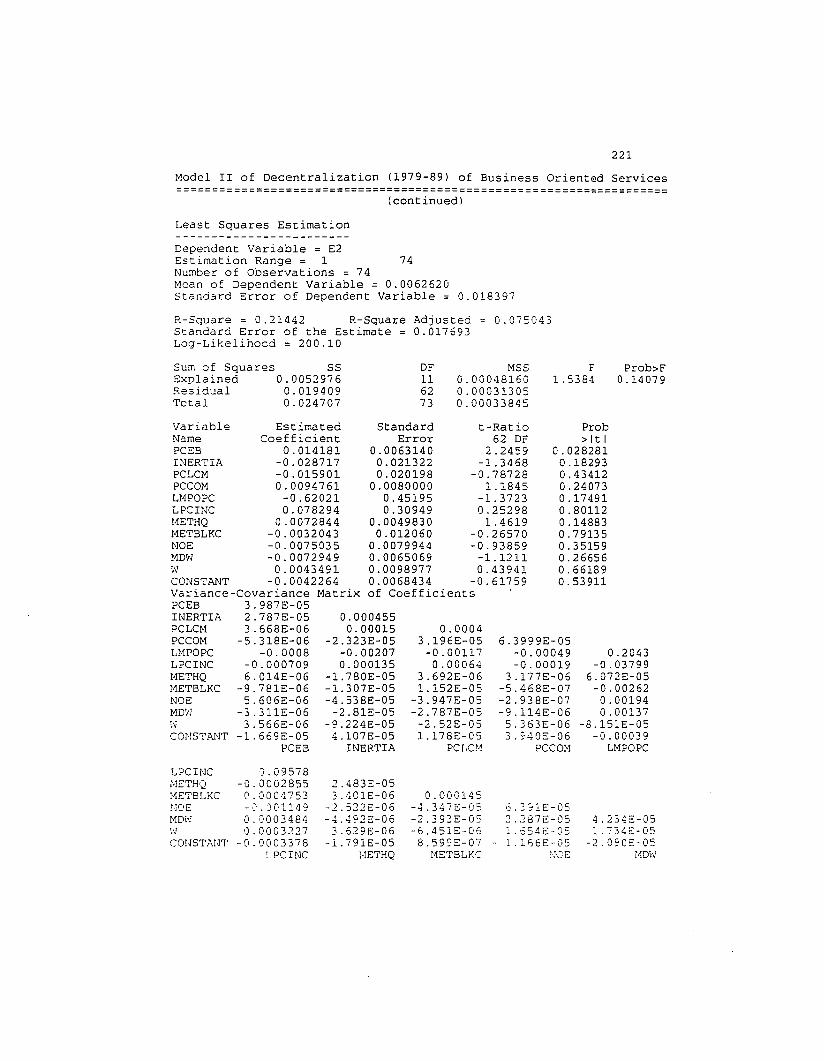
221
Model II of Decentralization (1979-89) of Business Oriented Services====================================================================
(continued)
Least Squares Estimation
Dependent Variable = E2Estimation Range = 1 74Number of Observations = 74Mean of Dependent Variable = 0.0062620Standard Error of Dependent Variable = 0.018397
R-Square = 0.21442 R-Square Adjusted = 0.075043Standard Error of the Estimate 0.017693Log-Likelihood = 200.10
DF MSS F Prob>F11 0.00048160 1.5384 0.1407962 0.0003130573 0.00033845
Standard t-Ratio ProbError 62 OF >Itl
0.0063140 2.2459 0.0282810.021322 -1. 3468 0.182930.020198 -0.78728 0.43412
0.0080000 1.1845 0.240730.45195 -1. 3723 0.174910.30949 0.25298 o.80112
0.0049830 1.4619 0.148830.012060 -0.26570 0.79135
0.0079944 -0.93859 0.351590.0065069 -1.1211 0.266560.0098977 0.43941 0.661890.0068434 -0.61759 0.53911of Coefficients
Sum of Souares SSSxp1ained 0.0052976Residual 0.019409Total 0.024707
0.0004550.00015
-2.323E-05-0.002070.000135
-1.780E-05-1.307E-05-4.538E-05
-2.81E-05-9.224E-05
4.107E-05INERTIA
Variable EstimatedName CoefficientPCEB 0.014181INERTIA -0.028717PCLCM -0.015901PCCOM 0.0094761LMPOPC -0.62021LPCINC 0.078294METHQ 0.0072844METBLKC -0.0032043NOE -0.0075035MOW -0.0072949w 0.0043491CONSTANT -0.0042264Variance-Covariance MatrixPCEB 3.987E-05INERTIA 2.787E-05PCLCM 3.668E-06PCCOM -5.318E-06LMPOPC -0.0008LPCINC -0.000709METHQ 6.014E-06METBLKC -9.781E-06NOE 5.606E-06l'lm'j -3. 311E-06w 3.566E-06CO~lST.'\NT -1.669E-05
PCES
0.00043.196E-05
-0.001170.00064
3.692E-061.152E-05
-3.947E-05-2.787E-05-2.52E-051.178E-05
PCLGI
6.3999E-05-0.00049-0.00019
3.177E-06-5.468E-07-2.938E-07-9.114E-065.363E-063.-:-40:::-06
peCOl-!
0.2043-0.03799
6.072E-05-0.002620.001940.00137
-8.151E-05-0.00039
LMPOPC
LPCINC J.09578i-IETHQ -0.0002855 .483E-05l-1ETBLKC 0.0004753 .~OlE-06 0.000145!·!OE -':' .)OE49 .522E-06 -4.347E-05 - E-05[1Di\' O. ')003484 - . .J92E-06 -2.393E-05 8 E-05 4. 34E-05'd 0.0003227 .629E-06 -6.451E-06 5 - r;c 1. 34E-05r:. - I..-1 ..J
CONST.';HT -0.0003378 - .791E-05 8.599E-07 - 6 E-05 -2. 90E-05LPCINC HETHQ HETBLKC :'JCE 11Dh'
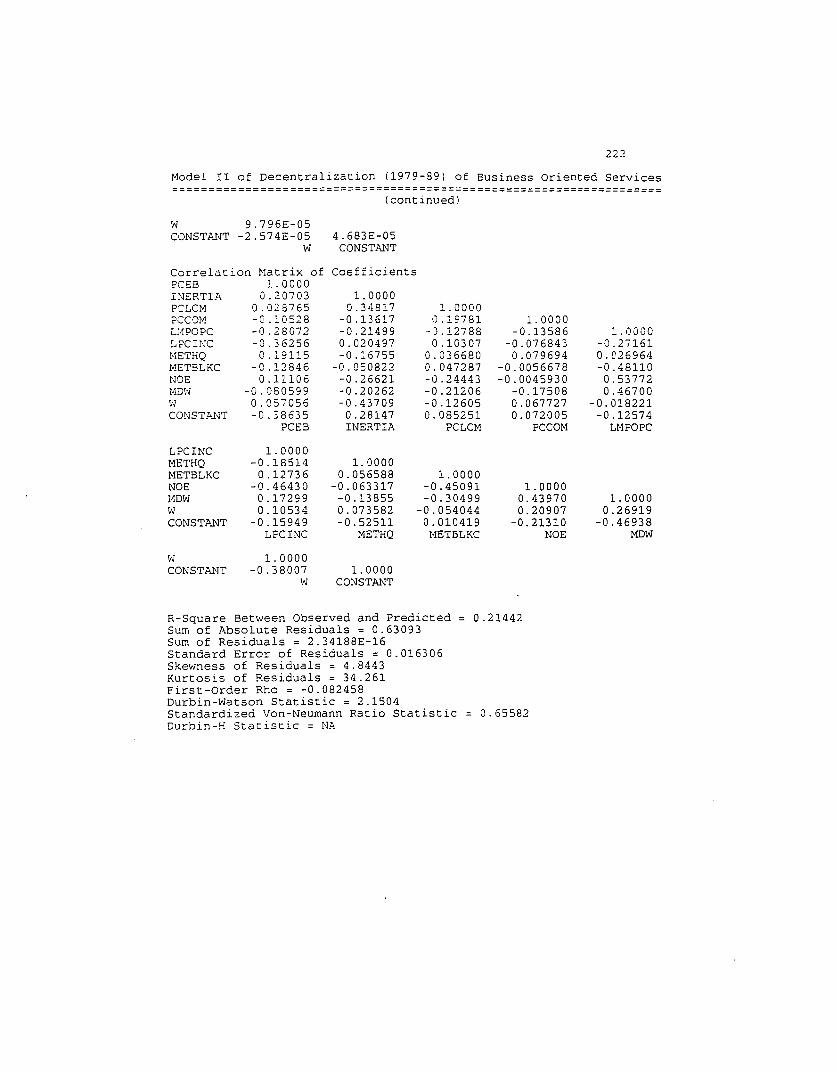
222
Model II of Decentralization (1979-89) of Business Oriented Services====================================================================
(continued)
W 9.796E-05CONSTft~T -2.574E-05
W4.683E-05
CONSTANT
Correlation Matrix ofpeEB 1.0000INERTIA 0.20703?CLCM 0.028765?CC0M -0.10528i:.;1?OPC - 0 . ;;: 8 072L?CINC -0.36256METHQ 0.19115METBLKC -0.12846NOE 0.11106MDW -0.080599W 0.057056CONST?~T -0.38635
PCEB
Coefficients
1.00000.34817
-0.13617-0.214990.020497-0.16755
-0.050822-0.26621-0.20262-0.437090.28147INERTIA
1.0000!) .19781
-0.127880.10307
0.0366800.047287-0.24443-0.21206-0.126050.085251
PCLCM
1.0000-0.13586
-0.0768430.079694
-0.0056678-0.0045930
-0.175080.0677270.072005
PCCOM
1.,)000-0.271610.0269611-0.481100.537720.46700
-0.018221-0.12574
LMPOPC
L?CINC 1.0000METHQ -0.18514 1. 0000METBLKC 0.12736 0.056588 1.0000NOE -0.46430 -0.063317 -0.45091 1.00001-1DW 0.17299 -0.13855 -0.30499 0.43970 1. 0000ioJ 0.10534 0.073582 -0.054044 0.20907 0.26919CONSTI'~T -0.15949 -0.52511 0.010419 -0.21310 -0.46938
LPCINC METHQ METBLKC NOE MDT..oJ
W 1.0000CONSTI'.NT -0.38007 1.0000
W CONSTANT
R-Square Between Observed and Predicted 0.21442Sum of Absolute Residuals = 0.63093Sum of Residuals = 2.34188E-16Standard Error of Residuals = 0.016306Skewness of Residuals = 4.8443Kurtosis of Residuals = 34.261First-Order Rho = -0.082458Durbin-Watson Statistic = 2.1504Standardized Von-Neumann Ratio Statistic 0.65582Durbin-H Statistic = NA
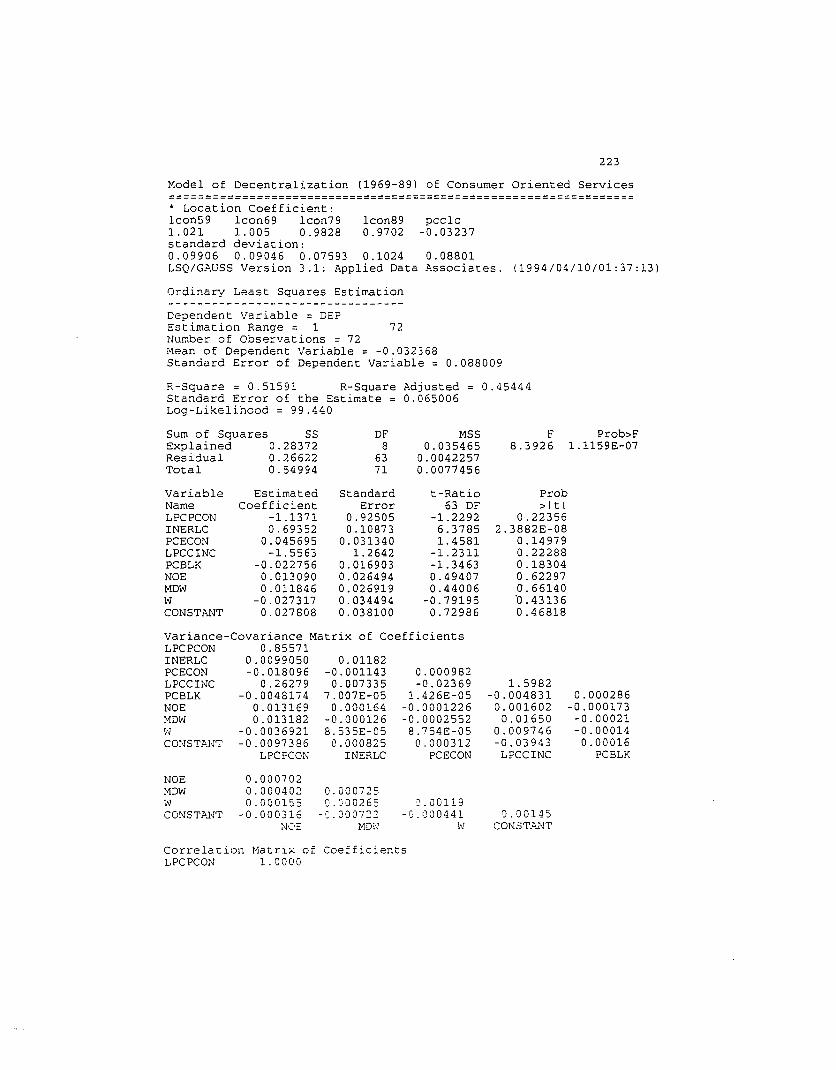
223
Model of Decentralization (1969-89) of Consumer Orien~ed Services=============~===================================================
* Location Coefficient:lcon59 Icon69 Icon79 Icon89 peele1.021 1.005 0.9828 0.9702 -0.03237standard deviation:0.09906 0.09046 0.07593 0.1024 0.08801LSQ/GAUSS Version 3.1: Applied Data Associates. {1994/04/10/01:37:13)
Ordinari Least Squares Estimation
Dependent Variable = DEPEstimation Range = 1 72Number of Observations = 72Mean of Dependent Variable = -0.032368Standard Error of Dependent Variable = 0.088009
R-Square = 0.51591 R-Square Adjusted = 0.45444Standard Error of the Estimate = 0.065006Log-Likelihood = 99.440
Sum of Squares SS DF MSS F Prob>FExplained 0.28372 8 0.035465 8.3926 1.1159E-07Residual 0.26622 63 0.0042257Total 0.54994 71 0.0077456
Variable Estimated Standard t-Ratio ProbName Coefficient Error 63 DF >ItiLPCPCON -1.1371 0.92505 -1.2292 0.22356INERLC 0.69352 0.10873 6.3785 2.3882E-08PCECON 0.045695 0.031340 1. 4581 0.14979LPCCINC -1.5563 1.2642 -1.2311 0.22288PCBLK -0.022756 0.016903 -1.3463 0.18304NOE 0.013090 0.026494 0.49407 0.62297MOW 0.011846 0.026919 0.44006 0.66140W -0.027317 0.034494 -0.79195 '0.43136CONSTANT 0.027808 0.038100 0.72986 0.46818
0.000286-0.000173
-0.00021-0.00014
0.00016PCBLK
1.5982-0.004831
0.0016020.01650
0.009746-0.03943
LPCCINC
0.000982-0.02369
1.426E-05-0.0001226-0.00025528.754E-05
0.000312PCECON
0.01182-0.001143
0.0073357.007E-05
0.000164-0.0001268.535E-05
0.000825INERLC
variance-Covariance Matrix of CoefficientsLPCPCON 0.85571INERLC 0.0099050PCECON -0.018096LPCCINC 0.26279PCBLK -0.0048174NOE 0.013169MDW 0.013182W -0.0036921CONST~~T -0.0097386
LPCPCON
NOEMDWWCONSTJlJ'IT
0.0007020.0004020.000155
-0.000316NOE
0.0007250.C·00265
-oj • .JOO?:;:MD~':
':'.00119-'j.000441
W0.00145
CONST.::IJ·JT
Correla~ion Matrix of Coeffic:entsLPCPCON 1.0000
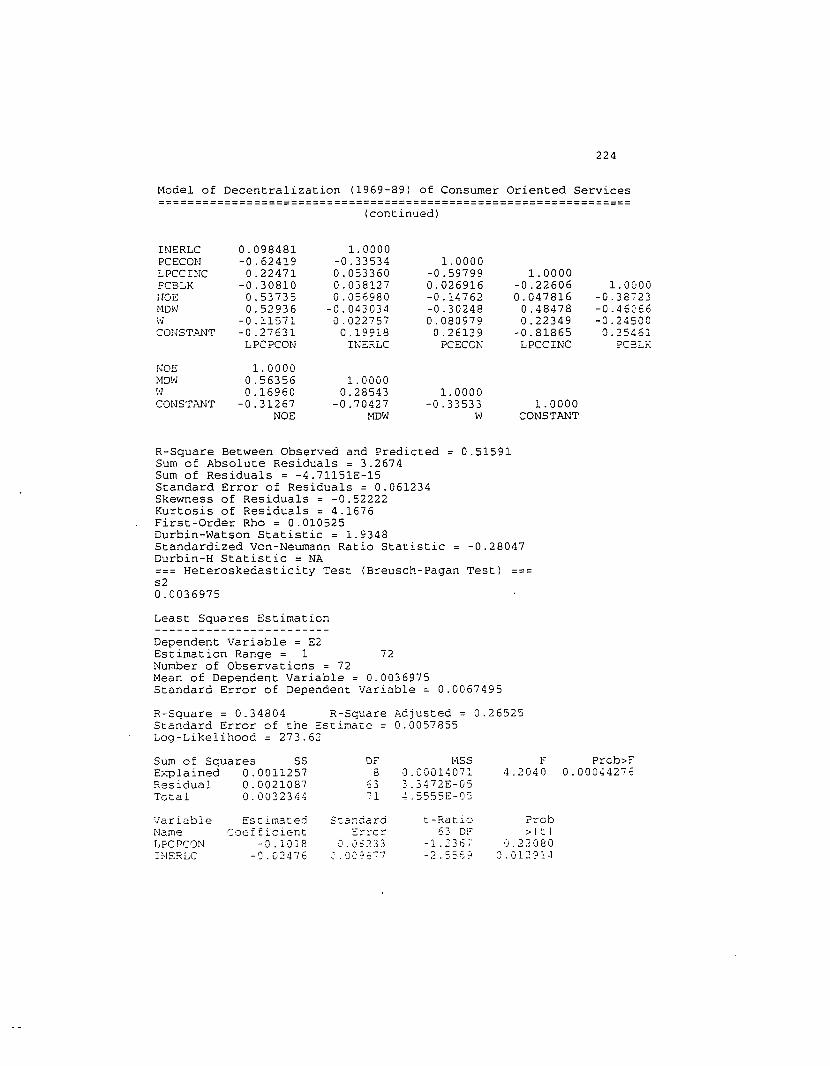
224
Model of Decentralization {1969-89l of Consumer Oriented Services=================================================================
(continued)
INERLC 0.098481 1.0000PCECON -0.62419 -0.33534 1. 0000LPCCINC 0.22471 0.053360 -0.59799 1.0000FC3LK -0.30810 0.038127 0.026916 -0.22606 1. 0000IJ0E 0.53735 0.056980 -0.14762 0.047816 -0.38723MDW 0.52936 -0.043034 -0.30248 0.48478 -0.46C'66~-J -0.11571 0.022757 0.080979 0.22349 -0.24500CONSTANT -0.27631 0.19?l8 0.26139 -0.81865 0.25461
LPCPCON INi::RLC PCECON LPCCINC PC3LK
r~OE 1.0000HDW 0.56356 1. 0000i'l 0.16960 0.28543 1.0000CONST;.NT -0.31267 -0.70427 -0.33533 1. 0000
NOE MDW W CONSTANT
R-Square Between Observed and Predicted 0.51591Sum of Absolute Residuals = 3.2674Sum of Residuals = -4.71151E-15Standard Error of Residuals = 0.061234Skewness of Residuals = -0.52222Kurtosis of Residuals = 4.1676First-Order Rho = 0.010525Durbin-Watson Statistic = 1.9348Standardized Von-Neumann Ratio Statistic -0.28047Durbin-H Statistic = NA=== Heteroskedasticity Test (Breusch-Pagan Test)s20.0036975
Least Squares Estimation
Dependent Variable = E2Estimation Range = 1 72Number of Observations = 72Mean of Dependent Variable = 0.0036975Standard Error of Dependent Variable = 0.0067495
R-5quare = 0.34804 R-Square Adjusted = 0.26525Standard Error of the Estimate 0.0057855Log-Likelihood = 273.62
Sum of Squares 55Explained 0.0011257Residual 0.0021087Total 0.0032344
OFB
63:1
t'15S001407l472E-05555E-0':
F Prob>:'4.2040 0.000442~~
·.JariableNameLPCPCONH1ERLC
EstimatedCoefficient
-0.1018-'J. (,2476
Star.:dard
'J.OS233C:. 'JC~0:3:7
t-Ratio63 DF
-1..2367-2. 5S8~~
FrobI t I
,j.2 0800.01. 91.4
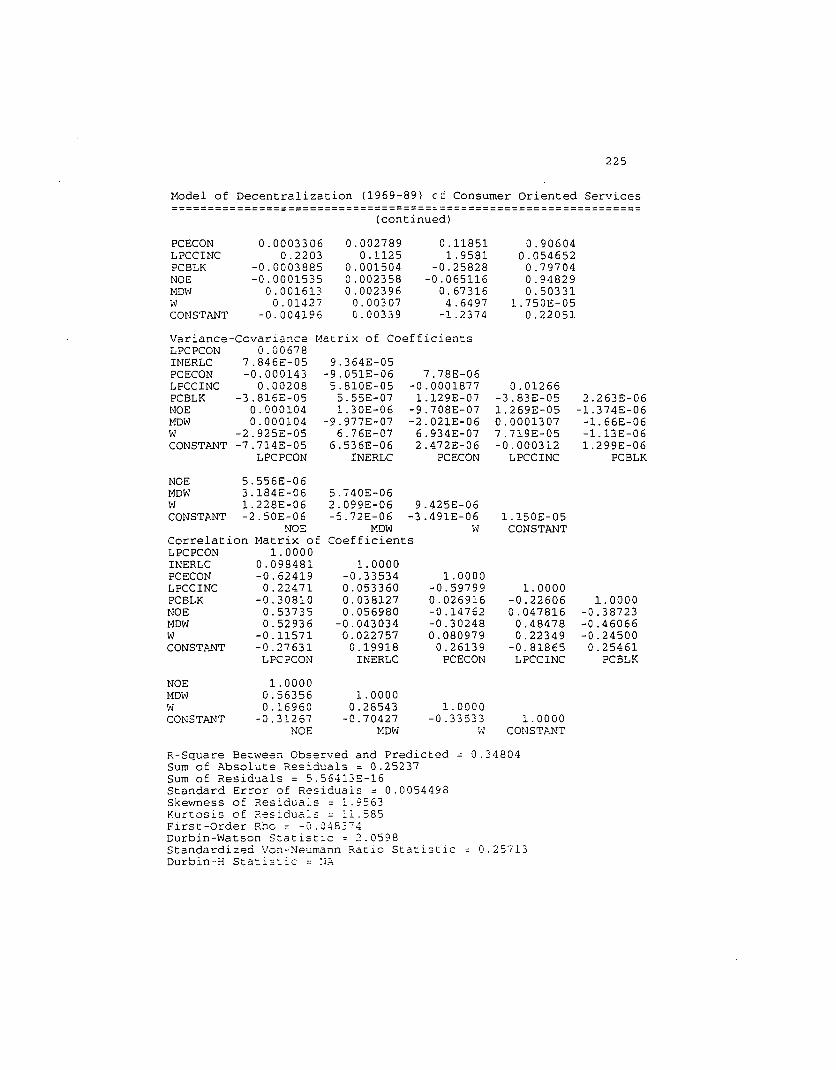
225
Model of Decentralization (1969-89) cf Consumer Oriented Services====================================~============================
(continued)
PCECON 0.0003306 0.002789 o.11851 0.90604LPCCINC 0.2203 0.1125 1.9581 0.054652PCBLK -0.0003885 0.001504 -0.25828 0.79704NOE -0.0001535 0.002358 -0.065116 0.94829MDloJ 0.001613 0.002396 0.67316 0.50331W 0.01427 0.00307 4.6497 1.750E-05CONSTANT -0.004196 0.00339 -1.2374 0.22051
Variance-Covariance Matrix of CoefficientsLPCPCON 0.00678INERLC 7.846E-05 9.364E-05PCECON -0.000143 -9.051E-06 7.78E-06LPCCINC 0.00208 5.810E-05 -0.0001877 0.01266PCBLK -3.816E-05 5.55E-07 1.129E-07 -3.83E-05 2.263E-06NOE 0.000104 1. 30E-06 -9.708E-07 1.269E-05 -1.374E-06MDW 0.000104 -9.977E-07 -2.021E-06 0.0001307 -1.66E-06W -2.925E-05 6.76E-07 6.934E-07 7.719E-05 -1.13E-06CONSTJ>..NT -7.714E-05 6.536E-06 2.472E-06 -0.000312 1.299E-06
LPCPCON INERLC PCECON LPCCINC PCBLK
NOE 5.556E-06MDW 3.184E-06 5.740E-06W 1.228E-06 2.099E-06 9.425E-06CONSTANT -2.50E-06 -5.72E-06 -3.491E-06 1.150E-05
NOE MDW W CONSTANTCorrelation Matrix of CoefficientsLPCPCON 1. 0000INERLC 0.098481 1.0000PCECON -0.62419 -0.33534 1. 0000LPCCINC 0.22471 0.053360 -0.59799 1. 0000PCBLK -0.30810 0.038127 o.026916 -0.22606 1. 0000NOE 0.53735 0.056980 -0.14762 0.047816 -0.38723MDW 0.52936 -0.043034 -0.30248 0.48478 -0.46066W -0.11571 0.022757 0.080979 0.22349 -0.24500CONSTANT -0.27631 0.19918 0.26139 -0.81865 0.25461
LPCPCON INERLC PCECON LPCCINC PCBLK
NOE 1.0000MDW 0.56356 1.0000W 0.16960 0.28543 1. 0000CONSTANT -0.31267 -0.70427 -0.33533 1. 0000
NOE f1DW rlJ CONSTANT
R-Square Between Observed and Predicted = 0.34804Sum of Absolute Residuals = 0.25237Sum of Residuals = 5.56413E-16Standard Error of Residuals = 0.0054498Skewness of Residua~s = 1.9~63
Kurtosis of Residuals = 11.585First-Order Rhc = -0.J483 7 4Durbin-Watson S~atistic = 2.0598Standardized Von-Neumann Ratio Statistic 0.25713Durbin-H Statis:ic = NA

226
Model of Decentralization (1969-89) of Consumer Oriented Services=================================================================
(continued)
=== Heteroskedasticity Test (White Test) ===
Least Squares Estimation
Dependent Variable = E2Estimation Range = 1 72Number of Observations = .~
Mean of Dependent Variable = 0.0036975Standard Error of Dependent Variable = 0.0067495
R-Square = 0.53598 R-Square Adjusted = 0.38990Standard Error of the Est:Date = 0.0052719Log-Likelihood = 285.86
Sum of Squares SSExplained 0.0017336Residual 0.0015008Total 0.0032344
DF175471
MSS0.000101982.7793E-054.5555E-05
F Prob>F3.6691 0.00013504
4.025E-05-3.024E-062.130E-07
-4.294E-07-0.0014033.985£-054.25lE-06
-0.00659-1.118E-·::6
Prob>Itl
0.009950.370430.965440.207250.769120.366250.27812
3.320E-060.285910.706450.127090.237910.21435
7.498E-050.168760.190080.668970.21130
0.29890.00074
7.874E-050.0004
0.0003760.4776
7.882E-06-0.00079
-5.918-3.:23E-05
O.0'7~59
?588E-07
7.967E-05-0.00313
-1.075E-055.718E-07
-1.779E-07-5.95110-06
-·J.00558-0.00027168.385E-06
a.00109-0.OC;Jl194
0.0003634.S~E-06
6.486E-06-1.379E-051.:-?E-05-:. :0736
,: ':'03671.6 0;:;-05
- . '.)257-I.:: IE-06
Variable Estimated Standard t-RatioName Coefficient Error 54 DFLPCPCON -0.28816 0.10785 -2.6718INERLC -0.029806 0.033000 -0.90320PCECON 0.00038851 0.0089257 0.043527LPCCINC 0.69781 0.54667 1.2765PCBLK -0.0018716 0.0063444 -0.29501NOE 0.0022945 0.0025182 0.91118MOW 0.0027026 0.0024668 1.0956W 0.015357 0.0029619 5.1848LPCPCON ft 2 2.9209 2.7101 1.0778INERLC ft 2 - 0.046324 0.12235 -0.37863PCECON ft 2 -0.0074503 0.0048080 -1.5496LPCCINC2 -13.978 11. 712 -1.1935PCBLK ft 2 0.0014415 0.0011472 1.2565LPCPCON.* -3.3791 0.78807 -4.2878INERLC.* 0.044833 0.032141 1.3949PCECON.* 0.50987 0.38422 1.3270LPCCINC.* -0.081645 0.18991 -0.42992CONSTANT -0.0099865 0.0078944 -1.2650Variance-Covariance Matrix of CoefficientsLPCPCON 0.01163INERLC 0.000117PCECON 0.0002576LPCCINC -0.02437PCBLK -0.000254NOE 9.358E-05MDW 6.544E-05W -5.160E-05LPCPCON ft 2 -0.0999INERLC ft 2 0.00055PCECON ft 2 0.00014LPCCINC ft 2 0.6058PCBLK ft 2 1.136E-05
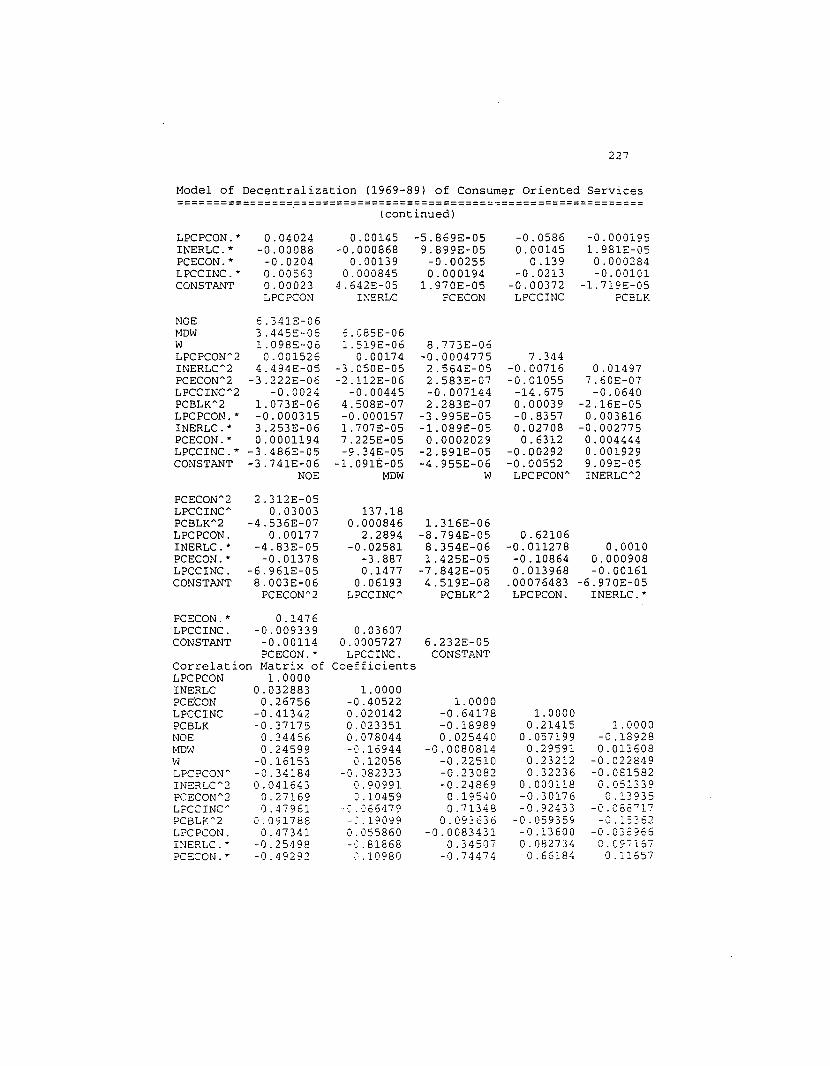
227
Model of Decentralization (1969-89) of Consumer Oriented Services=== ====== == == ===.== == ==== = === === ====== ======:.: -=== ===:: =:: =:: = ==:::::: =:: = =
(continued)
LPCPCON. *INERLC.*PCECON. *LPCCINC.*CONSTANT
NOEMm-lWLPCPCON A 2INERLC"2PCECON"2LPCCINC"2PCBLK"2LPCPCON. *INERLC.*PCECON. *LPCCINC. *CONSTANT
PCECON"2LPCCINC"PCBLK"2LPCPCON.INERLC.*PCECON.*LPCCINC.CONSTANT
0.04024-0.00088
-0.02040.005630.00023LPC?CON
6.341E-063.445£-061.098E-06
0.0015264.494E-05
-3.222E-06-0.0024
1.0i3E-06-0.0003153.253E-060.0001194
-3.486E-05-3.741E-06
NOE
2.312E-050.03003
-4.536E-070.00177
-4.83E-05-0.01378
-6.961E-058.003E-06
PCECOW2
0.00145-0.000868
0.001390.000845
4.642E-05I:JERLC
6.085E-061.519E-06
0.00174-3.050E-05-2.112E-06
-0.004454.508E-07-0.0001571.707E-057.225E-05-9.34E-05
-1.09lE-05MOW
137.180.000846
2.2894-0.02581
-3.8870.1477
0.06193LPCCINC"
-5.869E-059.899E-05
-0.002550.000194
1.9iOE-05PCECON
8.773E-05-0.00047752.564E-052.583E-07-0.0071442.283E-07
-3.995E-05-1.089E-050.0002029
-2.891E-05-4.955E-06
W
1.316E-06-8.794E-058.354E-061. 425E-05
-7.842E-054.519E-08
PCBLK"2
-0.05860.00145
0.139-0.0213
-0.00372LPCCINC
7.344-0.00716-0.01055
-14.6750.00039-0.83570.02708
0.6312-0.00292-0.00552
LPCPCON"
0.62106-0.011278
-0.108640.013968
.00076483LPCPCON.
-0.0001951.981E-05
0.000284-0.00101
-1.719E-05?CELK
0.014977.60E-07
-0.0640-2.16E-050.003816
-0.0027750.0044440.0019299.09E-05INERLC"2
0.00100.000908-0.00161
-6.970E-05INERLC.*
PCECON. *LPCCINC.CONSTANT
0.1476-0.009339-0.00114PCECON. *
Correlation Matrix ofLPCPCON 1.0000INERLC 0.032883PCECON 0.26756LPCCINC -0.41342PCBLK -0.37175NOE 0.34456MOW 0.24599W -0.16153LPCPCON" -0.34184INERLC"2 0.041643PCECON"2 0.27169LPCCINC A 0.47961PCBLK"2 0.091788LPCPCON. 0.47341INERLC.* -0.25498PCECON.* -0.49292
0.036070.0005727
LPCCINC.Coefficients
1.0000-0.405220.0201420.0233510.078044-0.169440.12058
-0. 'J82333C'.909910.10459
-C. ,::66479-: .19099Co. 'J55860-,~. 81868
,~, .10980
6.232E-05CONSTl'.NT
1. 0000-0.64178-0.189890.025440
-0.0080814-0.22510-0.23082-0.24869
0.195400.71348
0.09::636-0.0083431
0.34507-0.74474
1. 00000.21415
0.0571990.295910.232120.32236
0.000118-0.30176-0.92433
-0.059359-0.136000.082734
0.66184
1 0000-0. 89280.0 3608
-0.0 2849-0.0 15820.0 :'339
O. 3935-0.0 B'717
- \). _ 62-0.0 _ 660.0 57
O. 1 57

228
Model of Decentralization (1969-89) of Consumer Oriented Services=================================================================
(continued)
LPCCINC. 0.27490 0.13478 0.11469 -0.20482 -0.84183CONSTl'.NT 0.26977 0.17819 0.27957 -0.86298 -0.34318
LPCPCON INERLC PCECON LPCCINC PCBLK
NOE 1.0000l-1DW 0.55454 1.0000W 0.14719 0.20796 1. 0000LPCPCON~ 0.22367 0.26044 -0.059482 1.0000INERLC~2 0.14585 -0.10105 0.070739 -0.021596 1.0000PCECOW2 -0.26610 -,) .17808 0.018137 -0.80956 0.001292LPCCINC~ -0.081712 -0.15390 -0.20592 -0.46234 -0.044659PCBLK~2 0.37145 0.15929 0.067178 0.12543 -0.15392LPCPCON. -0.15857 -0.080608 -0.017113 -0.39131 0.039578INERLC.* 0.040196 0.21530 -0.11434 0.31093 -0.70568PCECON. * 0.12339 C.076228 0.17828 0.60620 0.094526LPCCINC. -0.072888 -,) .19946 -0.051403 -0.00567 0.08302CONSTANT -0.18816 -0.56001 -0.21192 -0.25794 0.094087
NOE MDW W LPCPCON~ INERLC~2
PCECOW2 1.0000LPCCINC~ 0.53324 1. 0000PCBLK~2 -0.082234 0.062958 1. 0000LPCPCON. 0.46585 0.24804 -0.097264 1. 0000INERLC.* -0.31275 -0.068568 0.22657 -0.44526 1.0000PCECON. * -0.74569 -0.86384 0.032336 -0.35880 0.073487LPCCINC. -0.076236 0.066400 -0.35994 0.093330 -0.26357CONSTANT 0.21085 0.66984 0.0049893 0.12294 -0.27468
PCECON A 2 LPCCINC A PCBLK A 2 LPCPCON. INERLC. *
0.63269
PCECON. *LPCCINC.CONSTANT
1.0000-0.12798 1.0000-0.37596 0.38202 1.0000
PCECON.* LPCCINC. CONSTANTR-Square Between Observed and Predicted = 0.53598Sum of Absolute Residuals = 0.23682Sum of Residuals = 9.91394E-16Standard Error of Resid~als = 0.0045977Skewness of Residuals = 1.1006Kurtosis of Residuals = 6.4799First-Order Rho = -0.090~00
Durbin-Watson Statistic = 2.1471Standardized Von-Neumar.~ ~atio StatisticDurbin-H Statistic = NA
=== Weighted L-SQ Mciel
Weighted Least Squares ~stimation
72
':'e = 0.0057792ent Variable = 0.26856
Dependent Variable = DE?Estimation Range = 1Number of ObservationsMean of Dependent VariaStandard Error of Deper.

229
Model of Decentralization (1969-89) of Consumer Oriented Services=================================================================
(continued)
WARNING: No Constant Term. @ Since the whole model was weighted,there is no constant term; the original constant became l/weight. @
R-Square, AOV may not be reliable! @ In the Weighted LeastSauares, the R-Sauare Between Observed and Predicted is interpretedinstead of the adjus:ed R-Square. @
R-Square = 0.71233 R-Square Adjusted = 0.67124Standard Error of the Sstimate = 0.15291Log-Likelihood = 37.8~,1
Sum of Squares SE DF MSS F Prob>FExplained 3.6475 9 0.40531 17.334 5.5092E-14Residual 1.4731 63 0.023383Total 5.1209 72 0.071124
Variable Estimated Standard t-Ratio ProbName Coefficient Error 63 DF >ItlLPCPCON -2.3160 1.3465 -1.7200 0.090333INERLC 1.0667 0.19534 5.4604 8.5717E-07PCECON 0.026773 0.026045 1. 0280 0.30789LPCCINC -2.1156 1. 6046 -1.3185 0.19211PCBLK -0.045447 0.023778 -1.9113 0.060520NOE 0.030215 0.042296 0.71437 0.47763MDW -0.015689 0.031720 -0.49462 0.62259W 0.018295 0.24733 0.073970 0.94127WEIGHT 0.080530 0.046151 1. 7449 0.085874
Variance-Covariance l1atrix of CoefficientsLPCPCON 1.813INERLC 0.1157 0.0382PCECON -0.02204 -0.00104 0.000678LPCCINC -0.5878 -0.110 -0.00939 2.5746PCBLK -0.02165 0.000269 0.000231 0.00665 0.000565NOE 0.03658 0.0039 -0.000352 -0.011245 -0.00043MDW 0.02367 0.00086 -0.000324 0.025186 -0.00035W -0.00266 0.00027 -9.358E-06 0.016280 -4.882E-05WEIGHT 0.00323 0.00043 0.000135 -0.064698 -0.0001755
LPCPCON INERLC PCECON LPCCINC PCBLK
NOE 0.00179MDloJ 0.000639 0.001006ltJ 0.000112 0.0003147 0.06117WEIGHT -0.000159 -0.001054 -0.000534 0.00213
NOE MDloJ "I toJEIGHT
of CoefficientsCorrelation l1atriLPCPCON 1.000INERLC O.43?~
PCECON -0.6284LPCCINC -0.2720PCBLK -0.6761['JOE 0.6422
:.0000-0.20484-].35165':.057942
,).47193
1. 0000-0.223470.37370
-0.31919
1.00000.17434
-0.165701.0000
-0.42853
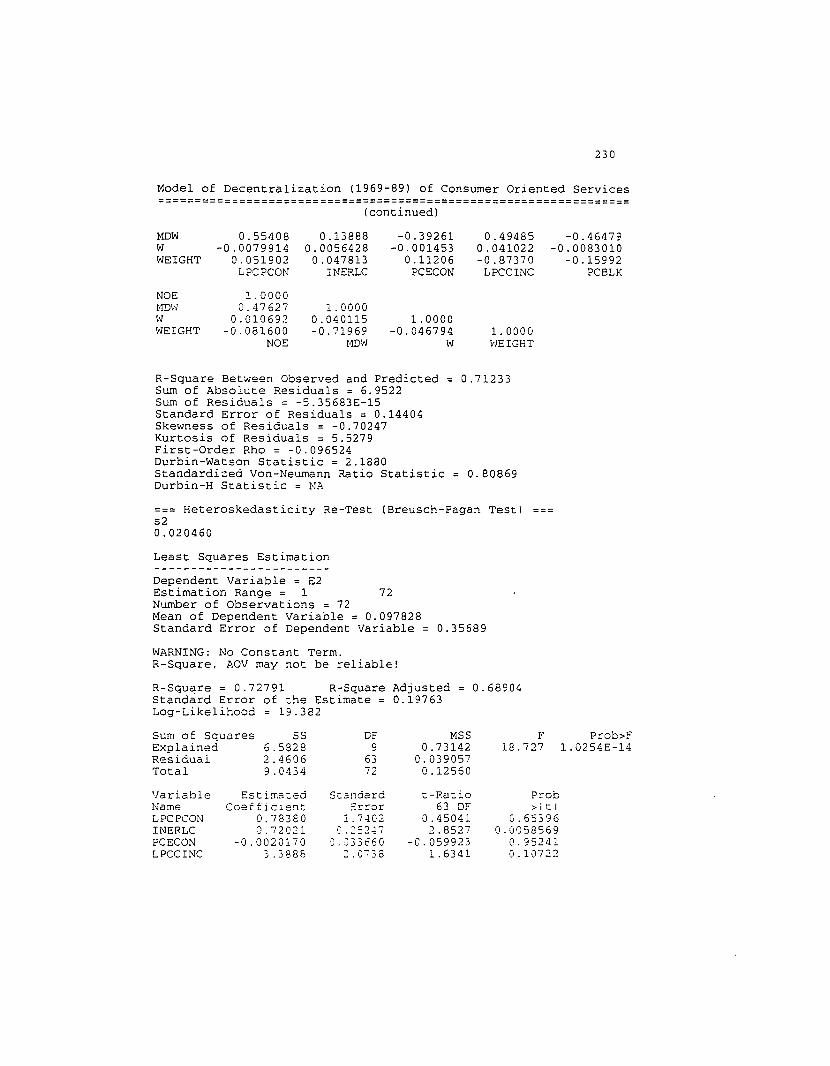
230
Model of Decentralization (1969-89) of Consumer Oriented Services=================================================================
(continued)
MOWWWEIGHT
NOE~rni·l
i'JWEIGHT
0.55408-0.0079914
0.051902LPCPCON
1.00000.47627
0.010692-0.081600
NO!::
0.138880.0056428
0.047813INERLC
1.00000.040115-0.71969
HDiJ
-0.39261-0.001453
0.11206PCECON
1.0000-0.046794
W
0.494850.041022-0.87370
LPCCINC
1. 0000\rJEIGHT
-0.46479-0.0083010
-0.15992PCBLK
R-Square Between Observed and Predicted 0.71233Sum of Absolute Residuals = 6.9522Sum of Residuals = -5.35683E-15Standard Error of Residuals = 0.14404Skewness of Residuals = -0.70247Kurtosis of Residuals = 5.5279First-Order Rho = -0.096524Durbin-Watson Statistic = 2.1880Standardized Von-Neumann Ratio Statistic 0.80869Durbin-H Statistic = NA
=== Heteroskedasticity Re-Test (Breusch-Pagan Test)s20.020460
Least Squares Estimation
Dependent Variable = E2Estimation Range = 1 72Number of Observations = 72Mean of Dependent Variable = 0.097828Standard Error of Dependent Variable 0.35689
WARNING: No Constant Term.R-Square, AOV may not be reliable!
R-Square = 0.72791 R-Square AdjustedStandard Error of the Estimate 0.19763Log-Likelihood 19.382
0.68904
Sum of Squares SS OF MSS F Prob>FExplained 6.5828 9 0.73142 18.727 1.0254E-14Residual 2.4606 63 0.039057Total 9.0434 72 0.12560
Variable Estimated Standard t-Racio PrODName Coefficient Srror 63 DF >11:1LPCPCON 0.78380 1.7-i02 0.45041 G.65396INERLC 0.72021 0.::5~';1 2.8527 0.0058569PCECON -0.0020170 ;J. ,J33660 -C.059923 0.95241LPCCINC :'.3888 :.0,38 1.6341 0.10722

231
Model of Decentralization (1969-89) of Consumer Oriented Services=================================================================
(continued)
PCBLK -0.086007 0.030731 -2.7987 0.0068013NOE 0.029059 0.054664 0.53158 0.59689MOW 0.067182 0.040995 1.6388 0.10624W 0.034955 0.31965 0.10936 0.91327WEIGHT -0.044989 0.059646 -0.75426 0.45350
Variance-Covariance Matrix of CoefficientsLPCPCON 3.0283INERLC 0.19329 0.06374PC ECON -0.036814 -0.00174 0.00113LPCCINC -0.98177 -0.184 -0.0156 4.3004PCBLK -0.036162 0.00045 0.00039 0.0111 0.0009NOE 0.061097 0.00651 -0.000587 -0.01878 -0.00072MOW 0.039528 0.001437 -0.00054 0.04207 -0.000586W -0.00445 0.000455 -1.563E-05 0.02719 -8.15E-05WEIGHT 0.00539 0.000720 0.000225 -0.1081 -0.00029
LPCPCON INERLC PCECON LPCCINC PCBLK
NOE 0.00299MDW 0.001067 0.00168W 0.000187 0.0005257 0.10217WEIGHT -0.000266 -0.00176 -0.00089 0.003558
NOE MDW ~v WEIGHT
Correlation Matrix of CoefficientsLPCPCON 1.0000INERLC 0.43996 1.0000PCECON -0.62848 -0.20484 1. 0000LPCCINC -0.27205 -0.35165 -0.22347 1.0000PCBLK -0.67618 0.057942 0.37370 0.17434 1.0000NOE 0.64226 0.47193 -0.31919 -0.16570 -0.42853MOW 0.55408 0.13888 -0.39261 0.49485 -0.46479W -0.00799 0.00564 -0.00145 0.0410 0.00830WEIGHT 0.051902 0.047813 0.11206 -0.87370 -0.15992
LPCPCON INERLC PCECON LPCCINC PCBLK
NOE 1.0000MOW 0.47627 1. 0000W 0.010692 0.040115 1.0000vJEIGHT -0.081600 -0.71969 -0.04679 1.0000
NOE MDW ~~J WEIGHT
R-Square Between Observed and Predicted = 0.72791Sum of Absolute Resid~als = 8.3541Sum of Residuals = -4.12864E-15Standard Error of Residuals = 0.18616Skewness of Residuals = 2.2234Kurtosis of Residuals = 11.160Flrst-Order Rho = 0.19967Durbin-Watson Statistic = 1.5984Standardized Von-Neumann Ratio Statistic -1.7279Durbin-H Statistic = ~A
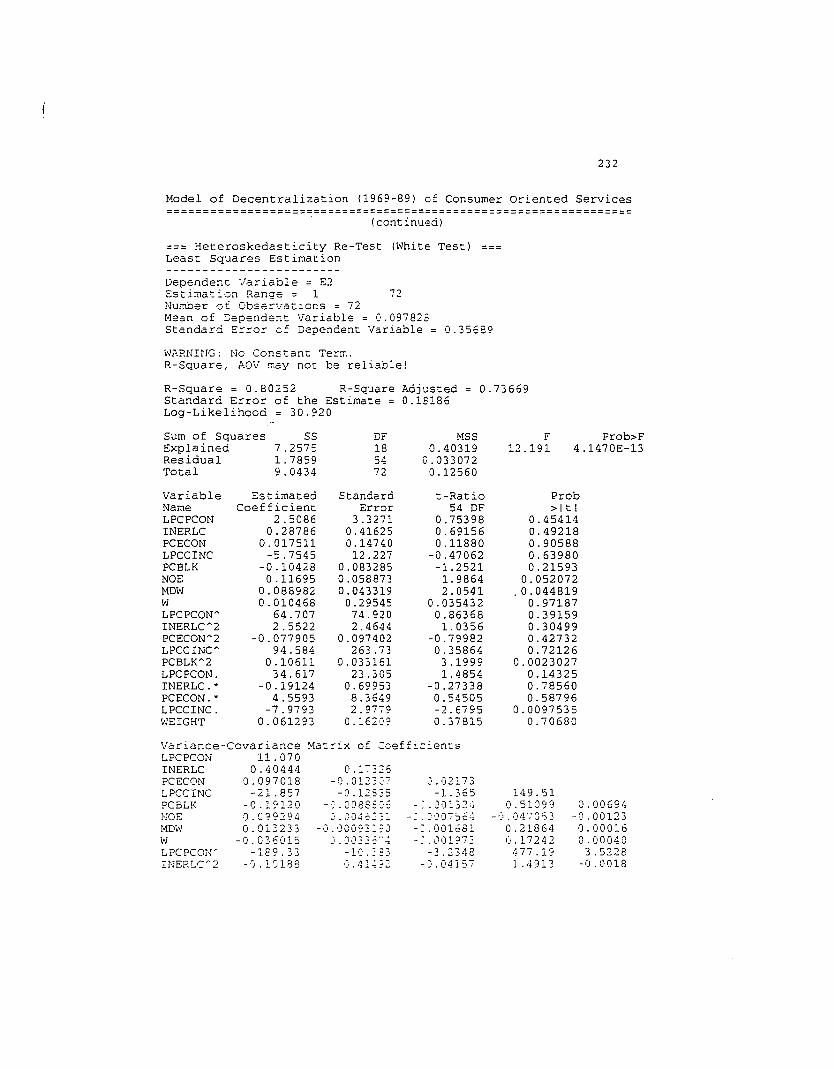
232
Model of Decentralization (1969-89) of Consumer Oriented Services================~================================================
(co:ltinued)
=== Heteroskedasticity Re-Test (White Test) ===Least Squares Estimation
Dependenc Variable = E2Estimation Range = 1 72Number of Obser··;ations = 72Mean of Dependent Variable = 0.097823Standard Error cf Dependent Variable 0.35689
W,'l.RNHJG: No Constant Term.R-Square, AOV may not be reliable!
R-Square = 0.80252 R-Square AdjustedStandard Error of the Estimate = 0.15186Log-Likelihood = 30.920
0.73669
Sum of Squares 5S OF HSS F Prob>FExplained 7.2575 18 0.40319 12.191 4.1470E-13Residual 1. 7859 54 0.033072Total 9.0434 72 0.12560
Variable Estimated Standard t-Ratio ProbName Coefficient Error 54 DF >ItlLPCPCON 2.5086 3.3271 0.75398 0.45414INERLC 0.28786 0.41625 0.69156 0.49218PCECON 0.017511 0.14740 0.11880 0.90588LPCCINC -5.7545 12.227 -0.47062 0.63980PCBLK -0.10428 0.083285 -1.2521 0.21593NOE o.11695 0.058873 1.9864 0.052072MDW 0.088982 0.043319 2.0541 .0.044819W 0.010468 0.29545 0.035432 0.97187LPCPCON A 64.707 74.920 0.86368 0.39159INERLC A 2 2.5522 2.4644 1. 0356 0.30499PCECON A 2 -0.077905 0.097402 -0.79982 0.42732LPCCINC A 94.584 263.73 0.35864 0.72126PCBLK A 2 0.10611 0.033161 3.1999 0.0023027LPCPCON. 34.617 23.305 1.4854 0.14325INERLC.~ -0.19124 0.69953 -0.27338 0.78560PCECON . .- 4.5593 8.3649 0.54505 0.58796LPCCINC. -7.9793 2.9779 -2.6795 0.0097535WEIGHT 0.061293 0.162C'9 0.37815 0.70680
Variance-Covariance Matrix of ':oeffi:::'entsLPCPCON 11.070INERLC 0.40444 o ,-----';":'PCECON 0.097018 -0.012::: :.02 73LPCCINC -21.857 - 0 .12.5:: -1. 65 149.51PCBLK -0 .19120 -':'.0088.3:' - · .o,n ~4 0.51099 0.00694NOE 0.C?9~94 0.0046::: .
· :. ':07 <34 - ,) . 04'70'33 -0.00123-.MDW 0.013233 _1:1. 'JOO93:? -:.001 81 0.21864 0.00016W -0.036015 ].DO::~6- - · .001 7:- 0.17242 0.00040LPCPCON" -189.33 -1 () . ~ 3 - 3.2 42 .'177.19 3.5228INERLC2 "J .10188 iJ.4:'~? -:1.04 Si 1. 4913 -0 .0018

233
Model of Decentralization (1969-89) of Consumer Oriented Services=================================================================
(continued)
PCECON~2
LPCCINCPCBLK~2
LPCPCON.INERLC.*PCECON. *LPCCINC.WEIGHT
NOEHDI-J\'JLPCPCOWINERLC~2
PCECON~2
LPCCINC~
PCBLK~2
LPCPCON.INERLC.*PCECON. *LPCCINC.WEIGHT
PCECON~2
LPCCINC~
PCBLK~2
LPCPCON.INERLC.*PCECON. *LPCCINC.WEIGHT
PCECOI-J. *LPCCINC.WEIGHT
0.15194381. 85
0.035767-7.3405
-0.30853-10.6852.0612
0.30543LPCPCON
0.003470.00118
4.640E-05-0.283
-0.0020-0.00068-0.404490.000863-0.02048
-0.0001380.0536
-0.05120.000326
NOE
0.0094916.980
-0.0005280.1541
-0.00185-0.70890.1223
0.007574PCECON"2
69.972-8.8740
-0.74594PCECON. *
-0.00060691-15.557
-0.00163970.20583
-0.183650.599910.44568
0.0086376INERLC
0.0018770.0005737
0.80400.003513
-0.001181-3.922
0.0001990.02433
0.0031570.09935-0.0369
-0.003947MDW
69553-0.36717
1266.3-12.246-1930.2226.0433.742
LPCCINC~
8.86810.19952
LPCCINC.
0.00729733.51
-0.000611. 0749
-0.009544-1.034
0.076960.01273
PCECON
0.0872890.35237
-0.010215-0.000806
-3.5919-9.833E-05
0.13135-0.0078433
0.11865-0.0163
-0.00220W
o. 00110.10489
-0.001260.05085
-0.050560.000824PCBLK~2
0.026273WEIGHT
-0.61369-3024.8
-0.027009-72.4661.884072.199
-12.086-1. 8418LPCCINC
5613.05.9852
-5.6168-9785.40.05389138.6714.053352.71
-103.66-6.9902LPCPCON"
543.12-10.451-31. 564
9.12940.93189
LPCPCON.
-0.00284-7.5458
-0.00103-0.59470.02420.1779
-0.1304-0.00891
PCELK
6.0732-0.066703
-134.07-0.016262
11.380-0.71415
5.73711.6710
-0.011696INERLC"2
0.48934-0.19277-0.61848
-0.035264INERLC.*
Correlation MatrixLPCPCON 1.0000INERLC 0.29203PCECON 0.19783LPCCINC -0.53725PCBLK -0.68999NOE 0.50692MDW 0.091813W -0.036639LPCPCON~ -0.75956INERLC A -0.01243PCECON~ 0.46885LPCCINC C' .43518
of Coefficients
1. 0000-0.20059
-0.025218-0.25616
0.18865-0.051682
0.027:)82-0.33294
0.40448-0.014969
-0.14171
1. 0000-0.75734-0.10785
-0.087163-0.26324
-0.045308-0.29292-0.114430.508260.86212
1. 00000.50178
-0.0653630.41278
0.0477270.52090
0.049490-0.51528-0.93800
1.0000-0.251700.0445700.016331
0.56458-0.00888-0.35048-0.34354

234
Model of Decentralization (1969-89) of Consumer Oriented Services=================================================================
(continued)
PCBLK A 2LPCPCON.INERLC.*PCECON. *LPCCINC.WEIGHT
NOEMDWWLPCPCONINERLC A 2PCECON~2
LPCCINC A
PCBLK~2
LPCPCON.INERLC.*PCECON. *LPCCINC.WEIGHT
PCECON A 2LPCCINC A
PCBLK~2
LPCPCON.INERLC.*PCECON. *LPCCINC.WEIGHT
PCECON. *LPCCINC.WEIGHT
0.32418-0.094669
-0.13256-0.383920.208040.56636LPCPCON
1.000D0.46276
0.0026678-0.064157-0.01387
-0.1179-0.02605
0.4419-0.01493
-0.0033430.10884
-0.292100.034203
NOE
1.00000.66101
-0.163480.067868
-0.027139-0.87000
0.421590.47971
PCECON A 2
1.0000-0.35624-0.55016PCECON. ~
-0.118790.021219-0.630700.172290.359550.12802
INERLC
1. 00000.044824
0.247740.032907-0.27998-0.343310.13865
0.0240960.104190.27416
'-0.28638-0.56207
MDW
1. 0000-0.041984
0.20602-0.066380
-0.874970.287810.78932
LPCCINC~
1.00000.41334LPCCINC.
-0.124790.31292
-0.092565-0.83881
0.175330.53290
PCECON
1.00000.015919
-0.014030-0.028010-0.046098-0.010037
0.019077-0.0379500.048011
-0.018544-0.046011
W
1.00000.13572
-0.0544680.18331
-0.512020.15326PCBLK~2
1.0000WEIGHT
-0.066611-0.254300.220270.70588
-0.33193-0.92928
LPCCINC
1.00000.032417-0.76970-0.495250.0216910.079420
0.268140.56280
-0.46460-0.57562
LPCPCON A
1.0000-0.64105-0.16191
0.131550.24669LPCPCON.
-0.37164-0.30640
0.415300.2:534
-0.52568-0.65011
?C3LK
1. 0000-0.27788-0.20628-0.198990.19814
-0.414260.278310.22769
-0.02928INERLC A 2
1. 0000-0.032943
-0.29690-0.31100
INERLC.*
R-Square Between Observed and Predicted = 0.80252Sum of Absolute Residuals = 7.0707Sum of Residuals = -5.76480E-12Standard Error of Residuals = 0.15860Skewness of Residuals = 1.8709Kurtosis of Residuals = 11.041First-Order Rho = 0.20047Durbin-Watson Statistic = 1.5983Standardized Von-Neumann Ratio Statistic -1.7285Durbin-H Statistic = NA
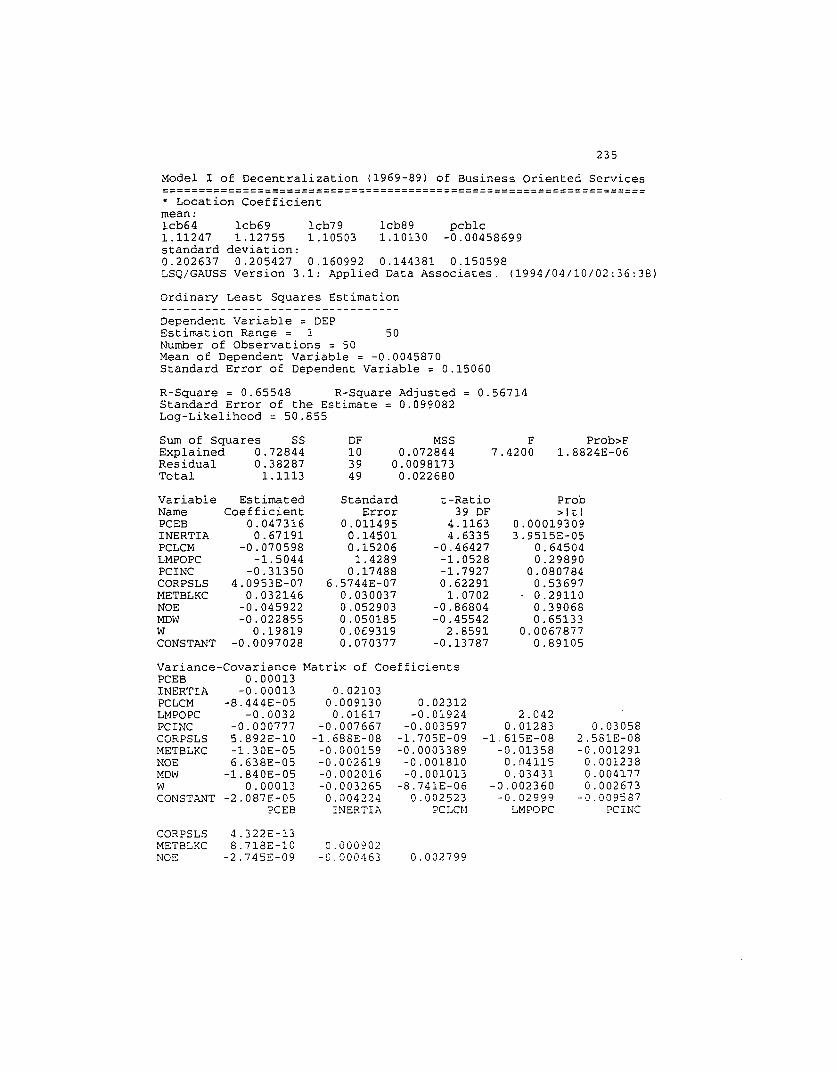
235
Model I of Decentralization (1969-89) of Business Oriented Services===================================================================* Location Coefficientmean:lcb64 lcb69 lcb79 lcb89 pcblc1.11247 1.12755 1.10503 1.10130 -0.00458699standard deviation:0.202637 0.205427 0.160992 0.144381 0.150598LSQ/GAUSS Version 3.1: Applied Data Associates. (1994/04/10/02:36:38)
Ordinary Least Squares Estimation
Dependent Variable = DEPEstimation Range = 1 50Number of Observations = 50Mean of Dependent Variable = -0.0045870Standard Error of Dependent Variable = 0.15060
R-Square = 0.65548 R-Square Adjusted = 0.56714Standard Error of the Estimate 0.099082Log-Likelihood = 50.855
Sum of Squares SS DF MSS F Prob>FExplained 0.72844 10 0.072844 7.4200 1.8824E-06Residual 0.38287 39 0.0098173Total 1.1113 49 0.022680
Variable Estimated Standard t-Ratio ProbName Coefficient Error 39 DF >ItlPCEB 0.047316 0.011495 4.1163 0.00019309INERTIA 0.67191 0.14501 4.6335 3.9515E-05PCLCM -0.070598 0.15206 -0.46427 0.64504LMPOPC -1.5044 1.4289 -1.0528 0.29890PCINC -0.31350 0.17488 -1. 7927 0.080784CORPSLS 4.0953E-07 6.5744E-07 0.62291 0.53697METBLKC 0.032146 0.030037 1.0702 0.29110NOE -0.045922 0.052903 -0.86804 0.39068MOW -0.022855 0.050185 -0.45542 0.65133W 0.19819 0.0£9319 2.8591 0.0067877CONSTANT -0.0097028 0.070377 -0.13787 0.89105
Matrix of CoefficientsVariance-CovariancePCEB 0.00013INERTIA -0.00013PCLCM -8.444E-05LMPOPC -0.0032PCINC -0.000777CORPSLS 5.892E-10METBLKC -1.30E-05NOS 6.638E-05MDW -1.840E-05W 0.00013CONSTANT -2.087E-05
peEB
0.021030.009130
0.01617-0.007667
-1.688E-08-0.000159-0.002619-0.002016-0.0032650.004224
INERTIA
0.02312-0.01924
-0.003597-1.705E-09-0.0003389-0.001810-0.001013
-8.741E-060.002523
PCLCH
2.0420.01283
-1.615E-08-0.01358
0.041150.03431
-0.002360-0.02999
LMPOPC
0.030582.581E-08-0.0012910.0012380.0041770.002673
-0.009587peINe
CORPSLSMETBLKCNOE
4.322E-138.718E-10
-2.745E-090.000902
-G.000463 0.002799
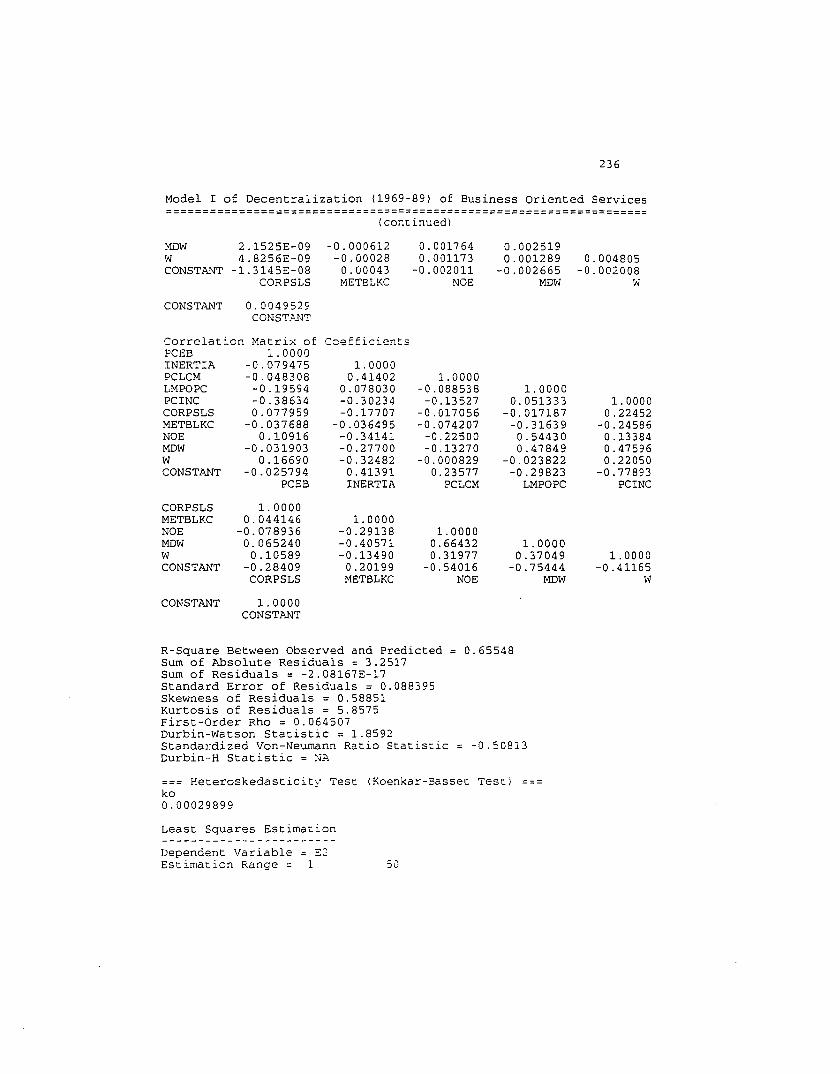
236
Model I of Decentralization (1969-89) of Business Oriented Services===================================================================
(continued)
MOW 2.1525E-09 -0.000612 0.001764 0.002519W 4.8256E-09 -0.00028 0.001173 0.001289 0.004805CONSTANT -1.3145E-08 0.00043 -0.002011 -0.002665 -0.002008
CORPSLS HETBLKC NOE MDW W
CONSTANT 0.0049529CONST.l\.NT
Correlation Matrix of C::oefficientsPCEB 1.0000INERTIA -0.079475 1.0000PCLCM -0.048308 0.41402 1.0000LMPOPC -0.19594 0.078030 -0.088538 1. 0000PCINC -0.38634 -0.30234 -0.13527 0.051333 1.0000CORPSLS 0.077959 -0.17707 -0.017056 -0.017187 0.22452METBLKC -0.037688 -0.036495 -0.074207 -0.31639 -0.24586NOE 0.10916 -0.34141 -0.22500 0.54430 0.13384MDW -0.031903 -0.27700 -0.13270 0.47849 0.47596W 0.16690 -0.32482 -0.000829 -0.023822 0.22050CONSTANT -0.025794 0.41391 0.23577 -0.29823 -0.77893
PCEB INERTIA PCLCM LMPOPC PCINC
CORPSLS 1. 0000METBLKC 0.044146 1.0000NOE -0.078936 -0.29138 1.0000MDW 0.065240 -0.40571 0.66432 1.0000W 0.10589 -0.13490 0.31977 0.37049 1. 0000CONSTANT -0.28409 0.20199 -0.54016 -0.75444 -0.41165
CORPSLS METBLKC NOE MDW \1
CONSTANT 1. 0000CONSTANT
R-Square Between Observed and Predicted 0.65548Sum of Absolute Residuals = 3.2517Sum of Residuals = -2.08167E-17Standard Error of Residuals = 0.088395Skewness of Residuals = 0.58851Kurtosis of Residuals = 5.8575First-Order Rho = 0.064507Durbin-Watson Statistic = 1.8592Standardized Von-Neumann Ratio Statistic = -0.50813Durbin-H Statistic = NA
=== Heteroskedasticity Test (Koenkar-5asset Test) ===ko0.00029899
Least Squares Estimation
Dependent Variable = S:Estimation Range 1 50
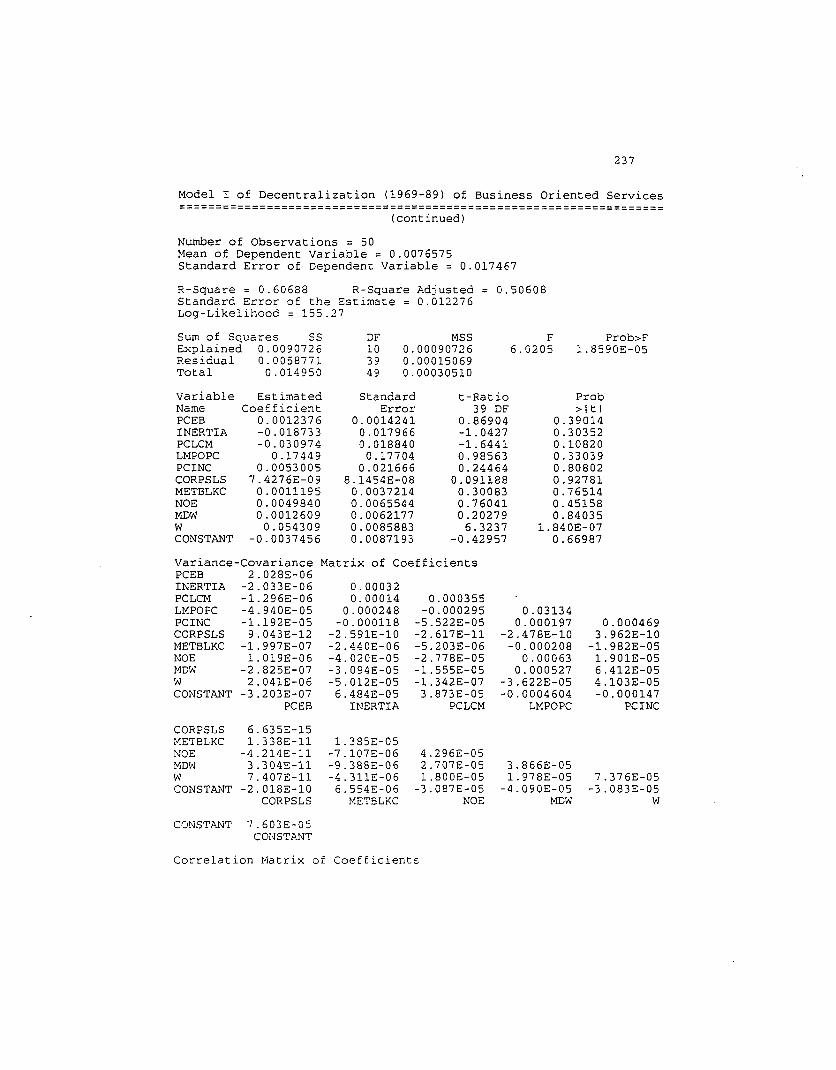
237
Model I of Decentralization (1969-89) of Business Oriented Services===================================================================
(continued)
Number of Observations = 50Mean of Dependent Variable = 0.0076575Standard Error of Dependent Variable = 0.017467
R-Square = 0.60688 R-Square Adjusted = 0.50608Standard Error of the Estimate 0.012276Log-Likelihood = 155.27
Sum of Squares SSExplained 0.0090726Residual 0.0058771Total 0.014950
DF103949
MSS0.000907260.000150690.00030510
F6.0205
Prob>F1.8590E-05
variableNamePCEBINERTIAPCLCMLMPOPCPCINCCORPSLSMETBLKCNOEMDWWCONSTANT
EstimatedCoefficient
0.0012376-0.018733-0.030974
0.174490.0053005
7.4276E-090.00111950.00498400.0012609
0.054309-0.0037456
StandardError
0.00142410.0179660.018840
0.177040.021666
8.1454E-080.00372140.00655440.00621770.00858830.0087193
t-Ratio39 DF
0.86904-1. 0427-1.64410.985630.24464
0.0911880.300830.760410.20279
6.3237-0.42957
Prob>Itl
0.390140.303520.108200.330390.808020.927810.765140.451580.84035
1.840E-070.66987
variance-Covariance Matrix of CoefficientsPCEB 2.028E-06INERTIA -2.033E-06 0.00032PCLCM -1. 296E-06 0.00014 0.000355LMPOPC -4.940E-05 0.000248 -0.000295 0.03134PCINC -1.192E-05 -0.000118 -5.522E-05 0.000197 0.000469CORPSLS 9.043E-12 -2.591E-10 -2.617E-11 -2.478E-10 3.962E-10METBLKC -1.997E-07 -2.440E-06 -5.203E-06 -0.000208 -1.982E-05NOE 1.019E-06 -4.020E-05 -2.778E-05 0.00063 1.901E-05MDW -2.825E-07 -3.094E-05 -1.555E-05 0.000527 6.412E-05W 2.041E-06 -5.012E-05 -1.342E-07 -3.622E-05 4.103E-05CONSTANT -3.203E-07 6.484E-05 3.873E-05 -0.0004604 -0.000147
PCEB INERTIA PCLCM LMPOPC PCINC
CORPSLS 6.635E-15METBLKC 1.338E-11 1.385E-05NOE -4.214E-11 -7.107E-06 4.296E-05MDW 3.304E-11 -9.388E-06 2.707E-05 3.866E-05W 7.407E-11 -4.311E-06 1.800E-05 1.978E-05 7.376E-05CONSTANT -2.018E-10 6.554E-06 -3.087E-05 -4.090E-05 -3.083E-05
CORPSLS METELKC NOE MDW W
CONSTANT 7.603E-05CONSTl>.NT
Correlation Matrix of Coefficients

238
Model I of Decentralization (1969-89) of Business Oriented Services===================================================================
(continued)
PCES 1.0000INERTIA -0.079475 1. 0000PCLG1 -0.048308 0.41402 1.0000Lt1POPC -0.19594 0.078030 -0.088538 1. 0000peINe -0.38634 -0.30234 -0.13527 0.051333 1.0000COP.PSLS 0.077959 -0.17707 -0.017056 -0.017187 0.22452t1ETBLKC -0.037688 -0.036495 -0.074207 -0.31639 -0.24586NOE 0.10916 -0.34141 -0.22500 0.54430 0.13384Mm·! -0.031903 -0.27700 -0.13270 0.47849 0.47596~'J 0.16690 -0.32482 -0.0008292 -0.023822 0.22050CONSTANT -0.02579 0.41391 0.23577 -0.29823 -0.77893
PCEB INERTI!\. PCLCM LMPOPC PCINC
CORPSLS 1.0000METSLKC 0.044146 1.0000NOE -0.078936 -0.29138 1.0000MD'-J 0.Oci5240 -0.40571 0.66432 1. 0000W 0.10589 -0.13490 0.31977 0.37049 1.0000CONSTANT -0.28409 0.20199 -0.54016 -0.75444 -0.41165
CORPSLS METBLKC NOE MDW W
CONSTl'.NT 1.0000CONSTANT
R-Square Between Observed and Predicted 0.60688Sum of Absolute Residuals = 0.30916Sum of Residuals = -1.42421E-15Standard Error of Residuals = 0.010952Skewness of Residuals = 1.2544Kurtosis of Residuals = 12.784First-Order Rho = 0.27369Durbin-Watson Statistic = 1.4512Standardized Von-Neumann Ratio Statistic -1.9800Durbin-H Statistic = NA
=== Weighted L-SQ Model
Weighted Least Squares Estimation
Dependent Variable = DEPEstimation Range = 1 50Number of Observations = 50Mean of Dependent Variable = -0.041675Standard Error of Dependent Variable = 0.47237
,-JARNING: No Constant Term. @ Since the whole model was weighted,there is no constant term; the original constant became 1j~eight. @
R-Square, AOV may not be reliable! @ In the Weighted LeastSquares, the F.-Square Between Observed and Predicted is interpretedinstead of the adjusted R-Square. @
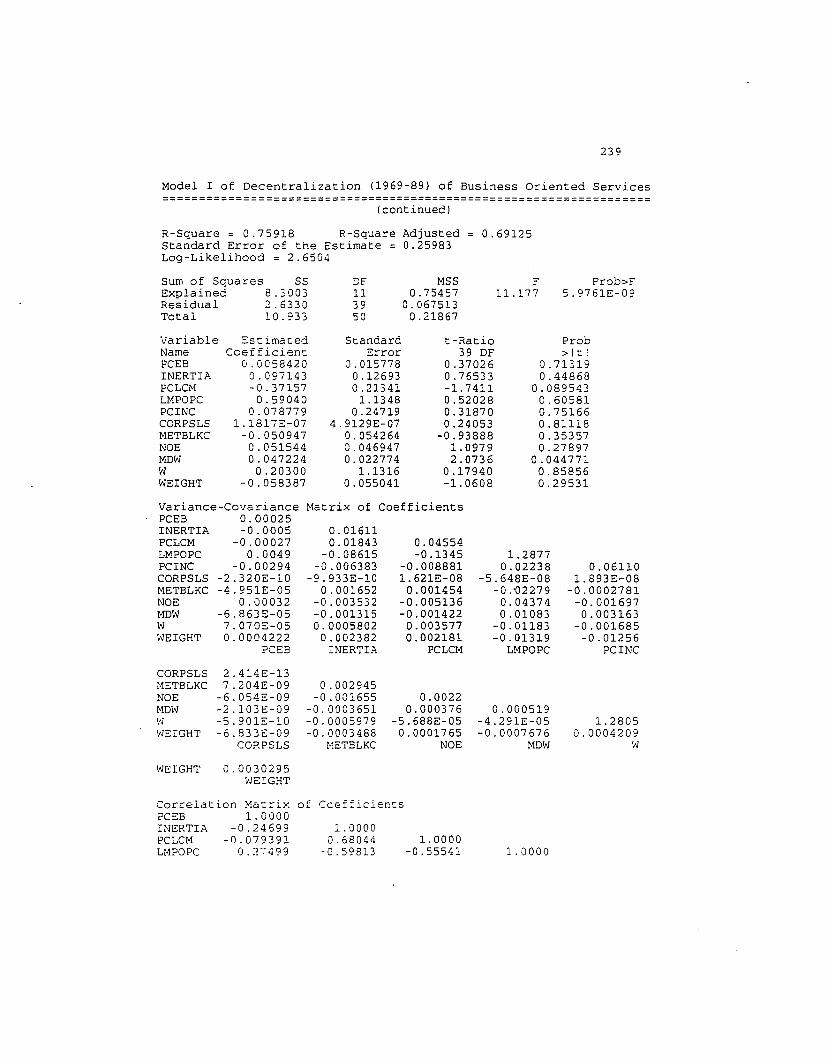
239
Model I of Decentralization (1969-89) of Business Oriented Services===================================================================
(continued)
R-Square = 0.75918 R-Square Adjusted = 0.69125Standard Error of the Est~mate 0.25983Log-Likelihood = 2.6504
Sum of Squares S5 DF MSS F Prob>FExplained 8.3003 11 0.75457 11.177 5.9761E-09Residual 2.6330 39 0.067513Total 10.?33 50 0.21867
Variable Escimated Standard t-Ratio ProbName Coefficient Error 39 OF >IclPCEB 0.0058420 0.015778 0.37026 0.71319INERTI? 0.097143 0.12693 0.76533 0.44868PCLCH -0.37157 0.21341 -1.7411 0.089543LMPOPC 0.59040 1.1348 0.52028 0.60581PCINC 0.078779 0.24719 0.31870 0.75166CORPSLS 1.1817E-07 4.9129E-07 0.24053 0.81118METBLKC -0.050947 0.054264 -0.93888 0.35357NOE 0.051544 0.046947 1.0979 0.27897MOW 0.047224 0.022774 2.0736 0.044771W 0.20300 1.1316 0.17940 0.85856WEIGHT -0.058387 0.055041 -1. 0608 0.29531
Variance-Covariance Matrix of CoefficientsPCEB 0.00025INERTIA -0.0005 0.01611PCLCM -0.00027 0.01843 0.04554LMPOPC 0.0049 -0.08615 -0.1345 1.2877PCINC -0.00294 -0.006383 -0.008881 0.02238 0.06110CORPSLS -2.320E-10 -9.933E-10 1.621E-08 -5.648E-08 1.893E-08METBLKC -4.951E-05 0.001652 0.001454 -0.'02279 -0.0002781NOE 0.00032 -0.003532 -0.005136 0.04374 -0.001697MOW -6.863E-05 -0.001315 -0.001422 0.01083 0.003163W 7.070E-05 0.0005802 0.003577 -0.01183 -0.001685i'JEIGHT 0.0004222 0.002382 0.002181 -0.01319 -0.01256
PCES INERTI.; PCLCM LMPOPC PCINC
CORPSLS 2.414E-13IJlETBLKC 7.204E-09 0.002945NOE -6.0548-09 -0.001655 0.0022MDiv -2.103E-09 -0.0003651 0.000376 0.000519W -5.901E-10 -0.0005979 -5.688E-05 -4.291E-05 1. 2805WEIGHT -6.833E-09 -0.0003488 0.0001765 -0.0007676 0.0004209
CORPSLS !-!ETBLKC NOE MOW Iv
WEIGHT 0.0030295itJEIGHT
Correlation MacrixPCEB 1.0000INERTIA -0.24699PCLCM -0.079391LMPOPC 0.27499
of Ccef:icients
1. 00000.68044 1.0000
-0.59813 -0.55541 1.0000

240
Model I of Decentralization (1969-89) of Business Oriented Services===================================================================
(continued)
PCINC -0.75346 -0.20345 -0.16835 0.079776 1.0000CORPSLS -0.029933 -0.015928 0.15457 -0.10130 0.15588!'IETBLKC -0.057828 0.23982 0.12555 -0.37007 -0.020729NOE 0.42908 -0.59270 -0.51263 0.82094 -0.14621!1DW -0.19098 -0.45474 -0.29263 0.41893 0.56180W 0.0039595 0.0040397 0.014810 -0.0092093 -0.0060230~'JEIGHT 0.48612 0.34099 0.18571 -0.21114 -0.92313
PCEB INERTIA ?CLOI Lt1POPC PCINC
CORPSLS 1.0000METBLKC 0.27021 1.0000NOE -0.26249 --0.64960 1.0000MDW -0.18793 -0.29544 0.35172 1. 0000ioJ -0.0010614 -0.0097370 -0.0010706 -0.001665 1.0000vJEIGHT -0.25270 -0.11678 0.068314 -0.61233 0.0067584
CORPSLS METBLKC NOE MDW W
ioJEIGHT 1. 0000WEIGHT
R-Square Between Observed and Predicted 0.75918Sum of Absolute Residuals = 7.9462Sum of Residuals = -7.71744E-14Standard Error of Residuals = 0.23181Skewness of Residuals = 0.80972Kurtosis of Residuals = 4.1677First-Order Rho = -0.064330Durbin-Watson Statistic = 2.1133Standardized Von-Neumann Ratio Statistic 0.40873Durbin-H Statistic = NA
=== Heteroskedasticity Re-Test (Koenkar-Basset Test)ko0.0092610
Least Squares Estimaticn
Dependent Variable = E2Estimation Range = 1 50Number of Observations = 50!'lean of Dependent Variable = 0.11107Standard Error of Dependent Variable
WARNING: No Constant Te~m.
R-Square. AOV may not ce reliable~
1.2957
R-5quare = 0.85503 ~-Square AdjustedStandard Error of the ~=:imate 0.55299Log-Likelihood = -35.115
0.81414
Sum of Squares 5SExplained 70.338
DF11
t15S6.3944
F20.910
Prob>F4.9699E-13
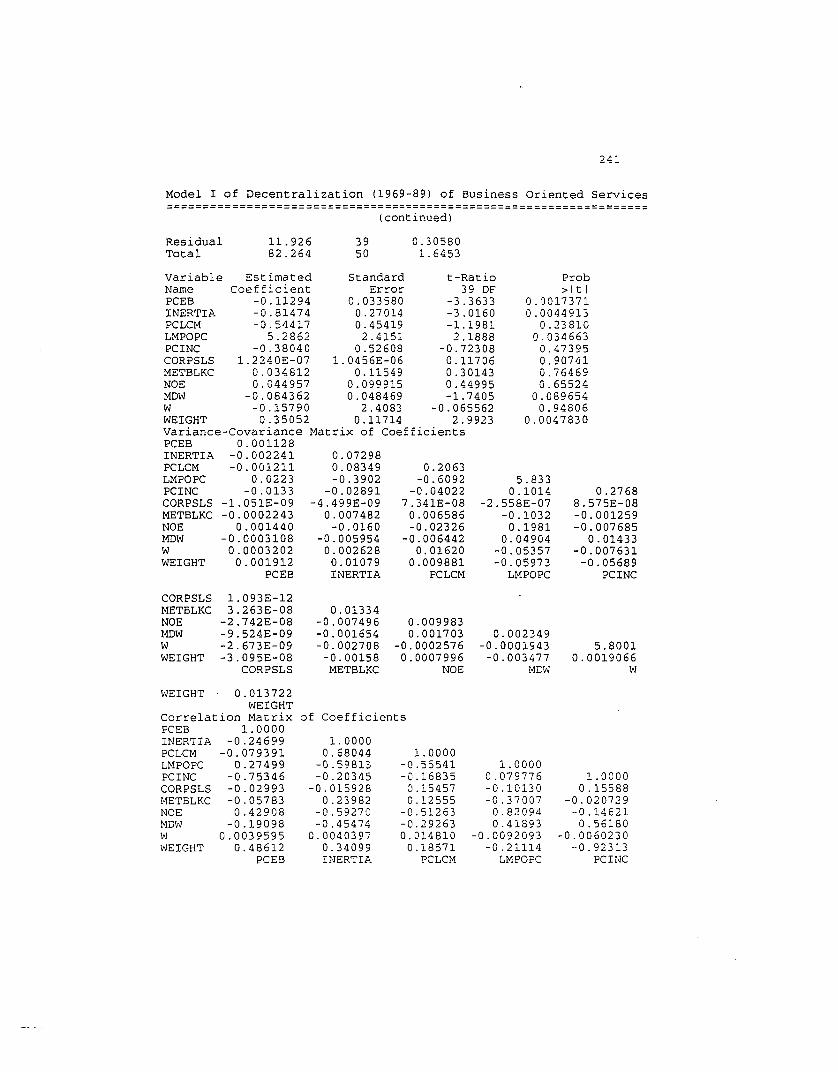
241
Model I of Decentralization (1969-89) of Business Oriented Services===================================================================
(continued)
ResidualTotal
11.92682.264
3950
0.305801.6453
Prob>Itl
0.00173710.0044913
0.238100.034663
0.473950.907410.764690.65524
0.0896540.94806
0.0047830
0.072980.08349 0.2063-0.3902 -0.6092 5.833
-0.02891 -0.04022 0.1014 0.2768-4.499E-09 7.341E-08 -2.558E-07 8.575E-08
0.007482 0.006586 -0.1032 -0.001259-0.0160 -0.02326 0.1981 -0.007685
-0.005954 -0.006442 0.04904 0.014330.002628 0.01620 -0.05357 -0.0076310.01079 0.009881 -0.05973 -0.05689INERTIA PCLCM LMPOPC PCINC
0.01334-0.007496 0.009983-0.001654 0.001703 0.002349-0.002708 -0.0002576 -0.0001943 5.8001
-0.00158 0.0007996 -0.003477 0.0019066METBLKC NOE MOW W
1. 093E-123.263E-08
-2.742E-08-9.524E-09-2.673E-09-3.095E-08
CORPSLS
Variable Estimated Standard t-RatioName Coefficient Error 39 OFPCEB -0.11294 0.033580 -3.3633INERTIA -0.81474 0.27014 -3.0160PCLCM -0.54417 0.45419 -1.1981LMPOPC 5.2862 2.4151 2.1888PCINC -0.38040 0.52608 -0.72308CORPSLS 1.2240E-07 1.0456E-06 0.11706METBLKC 0.034812 0.11549 0.30143NOE 0.044957 0.099915 0.44995MDW -0.084362 0.048469 -1.7405W -0.15790 2.4083 -0.065562WEIGHT 0.35052 0.11714 2.9923Variance-Covariance Matrix of CoefficientsPCEB 0.001128INERTIA -0.002241PCLCM -0.001211LMPOPC 0.0223PCINC -0.0133CORPSLS -1.051E-09METBLKC -0.0002243NOE 0.001440MOW -0.0003108W 0.0003202WEIGHT 0.001912
PCEB
CORPSLSMETBLKCNOEMOWWWEIGHT
of Coefficients
WEIGHT 0.013722WEIGHT
Correlation MatrixPCEB 1.0000INERTIA -0.24699PCLCM -0.079391LMPOPC 0.27499PCINC -0.75346CORPSLS -0.02993METBLKC -0.05783NOE 0.42908MOW -0.19098W 0.0039595WEIGHT 0.48612
PCEB
1.00000.68044
-0.59813-0.20345
-0.0159280.23982
-0.59270-0.45474
0.00403970.34099INERTI"".
1.0000-0.55541-0.168350.154570.12555
-0.51263-0.292630.014810
0.18571PCLCM
1.00000.079776-0.10130-0.370070.820940.41893
-0.0092093-0.21114
LMPOPC
1.00000.15588
-0.020729-0.14621
0.56180-0.0060230
-0.92313PCINC

242
Model I of Decentralization (1969-89) of Business Oriented Services===================================================================
(cont inued)
CORPSLSMETBLKCNOEHOWItlWEIGHT
WEIGHT
1.00000.27021
-0.26249-0.18793-0.00106-0.25270
CORPSLS
1.0000WE:LGHT
1. 0000-0.64960-0.29544
-0.009737-0.11678
METBLKC
1.00000.35172
-0.001070.068314
NOE
1.0000-0.001665-0.61233
HOW
1. 00000.0067584
W
R-Square Between Observed and Predicted 0.85503Sum of Absolute Residuals = 14.746Sum of Residuals = 1.99868E-13Standard Error of Residuals = 0.49335Skewness of Residuals = 1.4035Kurtosis of Residuals = 8.5725First-Order Rho = -0.11802Durbin-Watson Statistic = 2.2332Standardized Von-Neumann Ratio Statistic 0.84116Durbin-H Statistic = NA
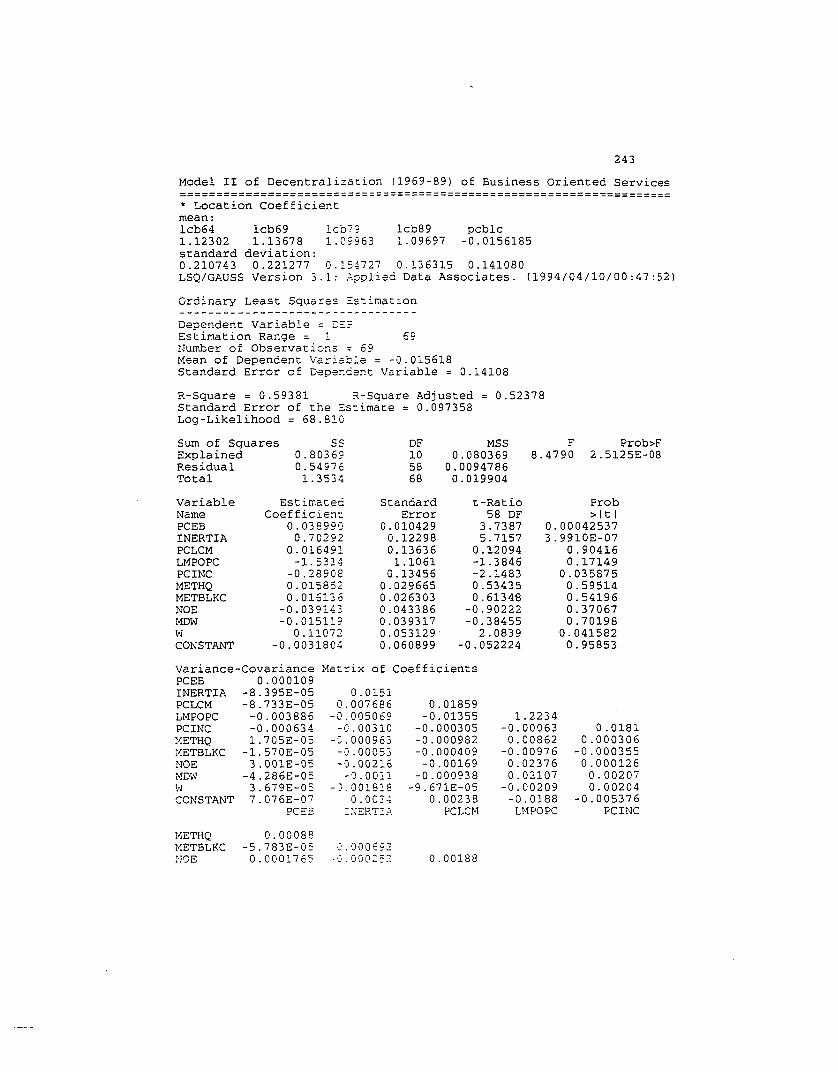
243
Model II of Decentralization (1969-89) of Business Oriented Services===================================================~======~=========
* Location Coefficientmean:lcb64 lcb69 lcb!? lcb89 pcblc1.12302 1.13678 1.09963 1.09697 -0.0156185standard deviation:0.210743 0.221277 0.154727 0.136315 0.141080LSQ/GAUSS Version 3.1: Applied Data Associates. (1994/04/10100:47:52)
O~dinary Least Squares ~stimation
Dependent Variable = ~~?
Estimation Range = _ 69Number of Observatior.s = 69Mean of Dependent Varia=le = -0.015618Standard Error of Dependent Variable = 0.14108
R-Square = 0.59381 R-Square Adjusted = 0.52378Standard Error of the Estimate = 0.097358Log-Likelihood = 68.810
Sum of Squares S5 DF MSS F Prob>FExplained 0.80369 10 0.080369 8.4790 2.5125E-08Residual 0.54976 58 0.0094786Total 1. 353~ 68 0.019904
variable Estimated Standard t-Ratio ProbName Coefficient Error 58 DF >ItlPCEB 0.038990 0.010429 3.7387 0.00042537INERTIA 0.70292 0.12298 5.7157 3.9910E-07PCLCM 0.016491 0.13636 0.12094 0.90416LMPOPC -1. 5314 1.1061 -1.3846 0.17149PCINC -0.28908 0.13456 -2.1483 0.035875METHQ 0.015852 0.029665 0.53435 0.59514METBLKC 0.016136 0.026303 0.613413 0.54196NOE -0.039143 0.043386 -0.90222 0.37067HDW -0.015119 0.039317 -0.38455 0.70198W 0.11072 0.053129' 2.0839 0.041582CONSTANT -0.0031804 0.060899 -0.052224 0.95853
Matrix of CoefficientsVariance-CovariancePCEB 0.000109INERTIA -8.395E-05PCLCM -8.733E-05LMPOPC -0.003886PCINC -0.000634METHQ 1.705E-05METBLKC -1.570E-05NOE 3.001E-05MOW -4.286E-05W 3.679E-05CONSTANT 7.076E-07
PCEE
0.01510.007686
-0.005069-0.00310
-c.000963-0.00053-0.002:'6
-O.OOll-:.001818
0.003';::JERT:.~.
0.01859-0.01355
-0.000305-0.000982-0.000409
-0.00169-0.000938
-9.671E-050.00238
PCLCM
1.2234-0.000630.00862
-0.009760.023760.02107
-0.00209-0.0188
LMPOPC
0.01810.000306
-0.0003550.000126
0.002070.00204
-0.005376PCINC
METHQ 0.00088METBLKC -5.783E-05 0.000692NCE 0.0001765 --:'.000::::: 0.00188
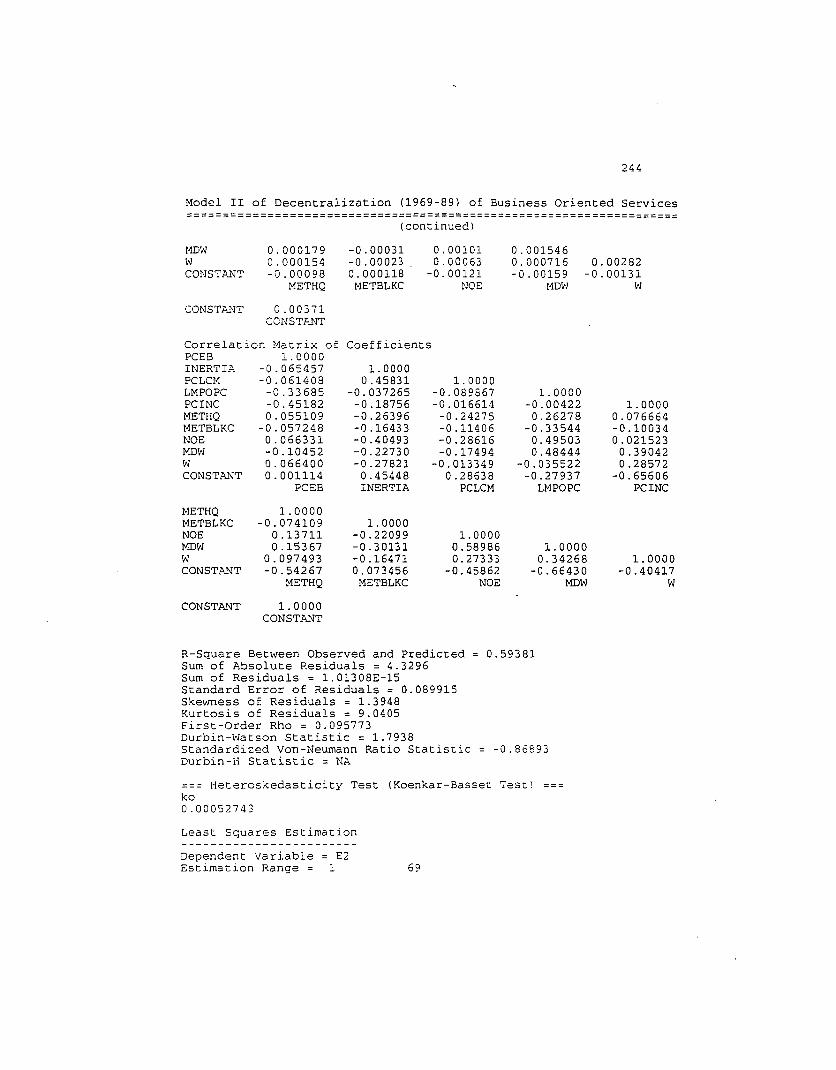
244
Model II of Decentralization (1969-89) of Business Oriented Services====================================================================
(continued)
MOW 0.000179 -0.00031 0.00101 0.001546W 0.000154 -0.00023 0.00063 0.000716 0.00282CONST~.NT -0.00098 0.000118 -0.00121 -0.00159 -0.00131
METHQ METBLKC NOE MDltl W
CONS Tp_t>JT 0.00371CONSTl·.NT
Correlation Matrix of CoefficientsPCEB 1.0000INERTP. -0.065457 1.0000PCLCl1 -0.061408 0.45831 1.0000LMPOPC -0.33685 -0.037265 -0.089867 1.0000PCINC -0.45182 -0.18756 -0.016614 -0.00422 1.0000METHQ 0.055109 -0.26396 -0.24275 0.26278 0.076664METBLKC -0.057248 -0.16433 -0.11406 -0.33544 -0.10034NOE 0.066331 -0.40493 -0.28616 0.49503 0.021523MOW -0.10452 -0.22730 -0.17494 0.48444 0.39042W 0.066400 -0.27821 -0.013349 -0.035522 0.28572CONSTANT 0.001114 0.45448 0.28638 -0.27937 -0.65606
PCEB INERTIA PCLCM LMPOPC PCINC
l-1ETHQMETBLKCNOEMOWWCONSTANT
CONSTANT
1. 0000-0.074109
0.137110.15367
0.097493-0.54267
METHQ
1.0000CONST.r..NT
1.0000-0.22099-0.30131-0.164710.073456
METBLKC
1.00000.589860.27333
-0.45862NOE
1. 00000.34268
-0.66430MDW
1.0000-0.40417
W
R-Square Between Observed and Predicted 0.59381Sum of Absolute Residuals = 4.3296Sum of Residuals = 1.01308E-15Standard Error of Residuals = 0.089915Skewness of Residuals = 1.3948Kurtosis of Residuals = 9.0405First-Order Rho = 0.095773Durbin-Watson Statistic = 1.7938Standardized Von-Neumann Ratio Statistic = -0.86893Durbin-H Statistic = NA
=== Heteroskedasticity Test (Koenkar-Bassec 7esc\ ===ko0.00052743
Least Squares Estimation
Dependent Variable = E2Estimation Range 1 69
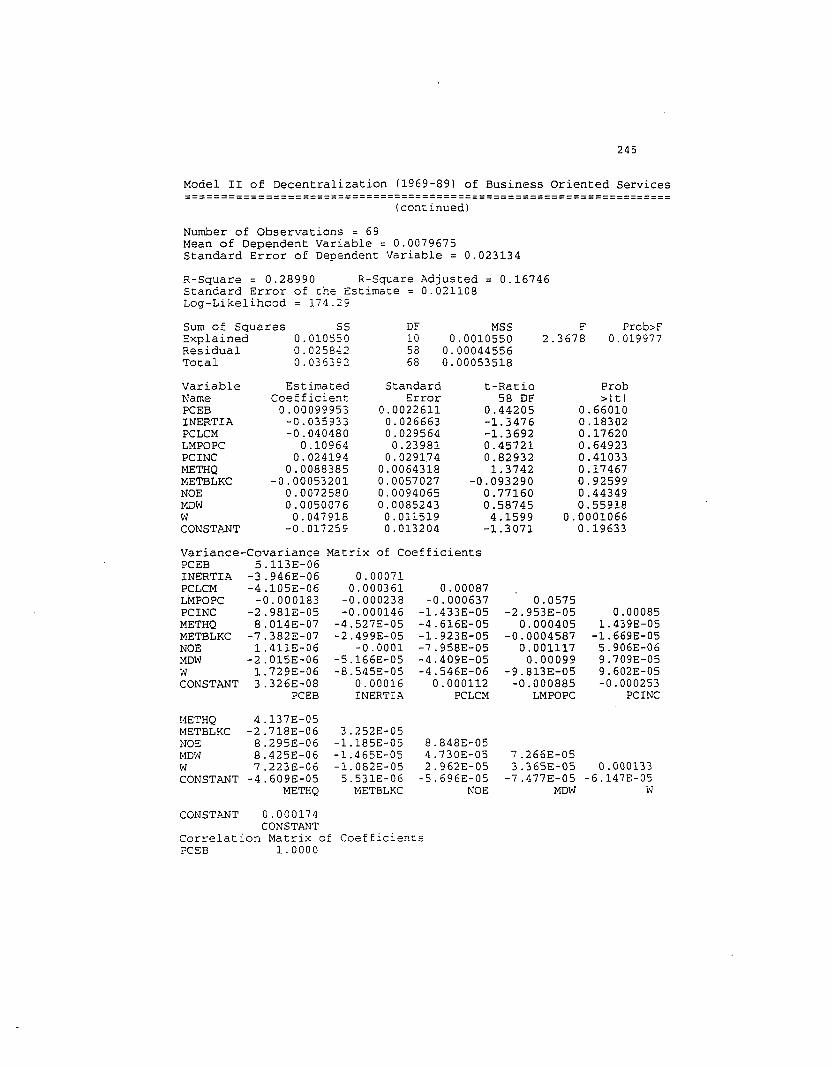
245
Model II of Decentralization (1969-89) of Business Oriented Services====================================================================
(continued)
Number of Observations = 69Mean of Dependent Variable = 0.0079675Standard Error of Dependent variable = 0.023134
R-Square = 0.28990 R-Square Adjusted = 0.16746Standard Error of the estimate = 0.021108Log-Likelihood = 174.29
Sum of Squares 55 DF MSS F Prob>F'2xplained 0.010550 10 0.0010550 2.3678 0.019977Residual 0.025842 58 0.00044556Total 0.036392 68 0.00053518
Variable Estimated Standard t-Racio ProbName Coefficient Error 58 DF >ItlPCES 0.00099953 0.0022611 0.44205 0.66010INERTIA -0.035933 0.026663 -1. 3476 0.18302PCLCM -0.040480 0.029564 -1. 3692 0.17620LMPOPC 0.10964 0.23981 0.45721 0.64923PCINC 0.024194 0.0291.74 0.82932 0.41033METHQ 0.0088385 0.0064318 1. 3742 0.17467METSLKC -0.00053201 0.0057027 -0.093290 0.92599NOE 0.0072580 0.0094065 0.77160 0.44349MOW 0.0050076 0.0085243 0.58745 0.55918W 0.047918 0.011519 4.1599 0.0001066CONSTl'.NT -0.017259 0.013204 -1. 3071 0.19633
variance-Covariance Matrix of CoefficientsPCES 5.113E-06INERTIA -3.946E-06 0.00071PCLCM -4.105E-06 0.000361 0.00087LMPOPC -0.000183 -0.000238 -0.000637 0.0575PCINC -2.981E-05 -0.000146 -1.433E-05 -2.953E-05 0.00085METHQ 8.014E-07 -4.527E-05 -4.616E-05 0.000405 1.439E-05METSLKC -7.382E-07 -2.499E-05 -1.923E-05 -0.0004587 -1.669E-05NOE 1.411E-06 -0.0001 -7.958E-05 0.001117 5.906E-06MDW -2.015E-06 -5.166E-05 -4.409E-05 0.00099 9.709E-05W 1.729E-06 -8.545E-05 -4.546E-06 -9.813E-05 9.602E-05CONSTANT 3.326E-08 0.00016 0.000112 -0.000885 -0.000253
PCEB INERTIA PCLCM LMPOPC PCINC
METHQ 4.137E-05HETBLKC -2.718E-06 3.252E-05NOE 8.295E-06 -1.185E-05 8.848E-05HOW 8.425E-06 -1.465E-05 4.730E-05 7.266E-05W 7.223E-06 -1. 082E-05 2.962E-05 3.365E-05 0.000133CONSTi'.NT -4.609E-05 5.531E-06 -5.696E-05 -7.477E-05 -6.147E-05
METHQ METBLKC NOE MDW vi
CONSTl'.NT 0.000174CONSTANT
Correlation Matrix of Coeffic~ents
PCEB 1.0000
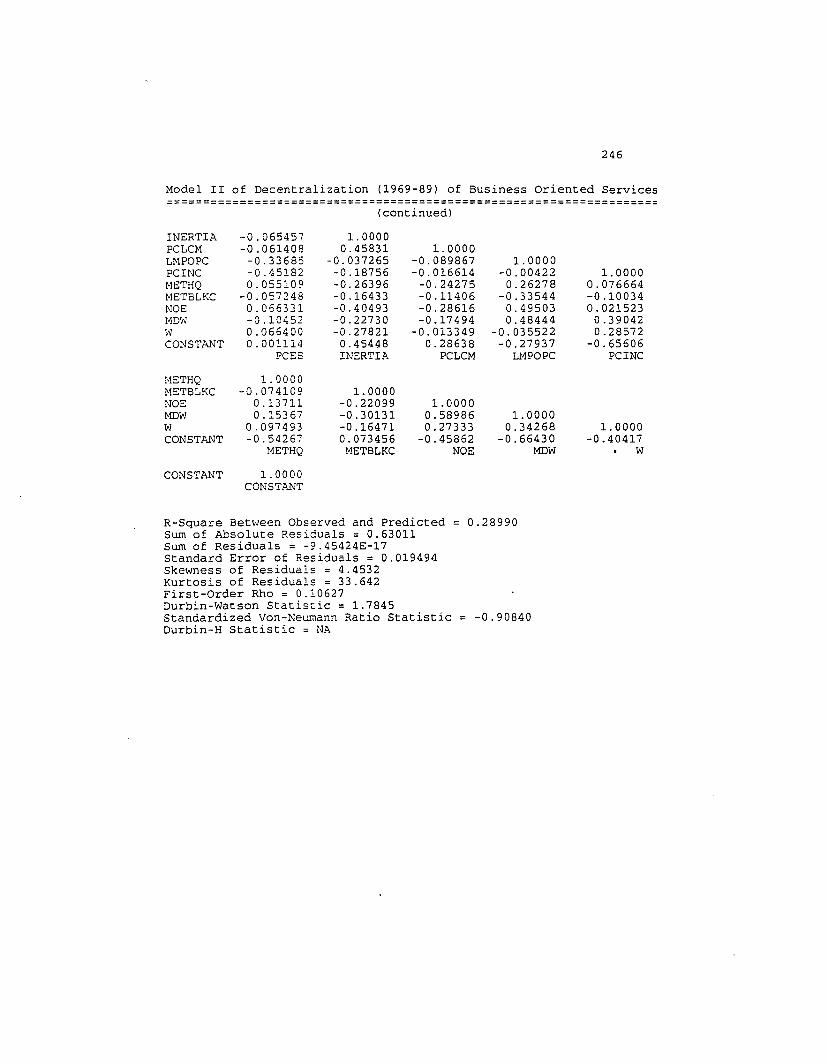
246
Model II of Decentralization (1969-89) of Business Oriented Services====================================================================
(continued)
INERTIA -0.065457 1.0000PCLCM -0.061408 0.45831 1. 0000LHPOPC -0.33685 -0.037265 -0.089867 1.0000PCINC -0.45182 -0.18756 -0.016614 -0.00422 1.0000HETHQ 0.05510!? -0.26396 -0.24275 0.26278 0.076664METBLKC -0.057248 -0.16433 -0.11406 -0.33544 -0.10034NOE 0.066331 -0.40493 -0.28616 0.49503 0.021523HDW -0.10452 -0.22730 -0.17494 0.48444 0.39042\'1 0.066400 -0.27821 -0.013349 -0.035522 0.28572CONSTANT 0.001114 0.45448 0.28638 -0.27937 -0.65606
PCES INERTIA PCLCM LMPOPC PCINC
METHQ 1.0000METBLKC -0.074109 1.0000NOE 0.13711 -0.22099 1.0000MOW 0.15367 -0.30131 0.58986 1. 0000W 0.097493 -0.16471 0.27333 0.34268 1.0000CONSTANT -0.54267 0.073456 -0.45862 -0.66430 -0.40417
METHQ METBLKC NOE MOW W
CONSTANT 1.0000CONSTl>.NT
R-Square Between Observed and Predicted 0.28990Sum of Absolute Residuals = 0.63011Sum of Residuals = -9.45424E-17Standard Error of Residuals = 0.019494Skewness of Residuals = 4.4532Kurtosis of Residuals = 33.642First-Order Rho = 0.10627Durbin-Watson Statistic = 1.7845Standardized Von-Neumann Ratio Statistic -0.90840Durbin-H Statistic = NA