December Quarter 2017 Results - alibabagroup.com · Cloud computing 3,599 4% 104% ... Notes: Unless...
18
December Quarter 2017 Results February 1, 2018
Transcript of December Quarter 2017 Results - alibabagroup.com · Cloud computing 3,599 4% 104% ... Notes: Unless...

December Quarter 2017 Results
February 1, 2018

Disclaimer
2
This presentation contains forward-looking statements. These statements are made under the “safe harbor” provisions of the U.S. Private Securities Litigation Reform Act of 1995. These forward-looking statements can be identified by terminology such as “will,” “expects,” “anticipates,” “future,” “intends,” “plans,” “believes,” “estimates,” “potential,” “continue,” “ongoing,” “targets,” “guidance” and similar statements. Among other things, statements that are not historical facts, including statements about Alibaba’s strategies and business plans, Alibaba’s beliefs and expectations regarding the growth of its businesses and its revenue, the business outlook and quotations from management in this presentation, as well as Alibaba’s strategic and operational plans, are or contain forward-looking statements. Alibaba may also make forward-looking statements in its periodic reports to the U.S. Securities and Exchange Commission (the “SEC”), in press releases and other written materials and in oral statements made by its officers, directors or employees to third parties. Forward-looking statements involve inherent risks and uncertainties. A number of factors could cause actual results to differ materially from those contained in any forward-looking statement, including but not limited to the following: Alibaba’s goals and strategies; Alibaba’s future business development; Alibaba’s ability to maintain the trusted status of its ecosystem, reputation and brand; risks associated with increased investments in Alibaba’s business and new business initiatives; risks associated with strategic acquisitions and investments; Alibaba’s ability to retain or increase engagement of consumers, merchants and other participants in its ecosystem and enable new offerings; Alibaba’s ability to maintain or grow its revenue or business; risks associated with limitation or restriction of services provided by Alipay; changes in laws, regulations and regulatory environment that affect Alibaba’s business operations; privacy and regulatory concerns; competition; security breaches; the continued growth of the e-commerce market in China and globally; risks associated with the performance of our business partners, including but not limited to Ant Financial, and fluctuations in general economic and business conditions in China and globally and assumptions underlying or related to any of the foregoing. Further information regarding these and other risks is included in Alibaba’s filings with the SEC. All information provided in this presentation is as of the date of this presentation and are based on assumptions that we believe to be reasonable as of this date, and Alibaba does not undertake any obligation to update any forward-looking statement, except as required under applicable law.
This presentation contains certain financial measures that are not recognized under generally accepted accounting principles in the United States (“GAAP”), including adjusted EBITDA (including adjusted EBITDA margin), adjusted EBITA (including adjusted EBITA margin), non-GAAP net income, non-GAAP diluted EPS and free cash flow. For a reconciliation of these non-GAAP financial measures to the most directly comparable GAAP measures, see GAAP to adjusted Non-GAAP measures Reconciliation.
3
580 MM Mobile MAUs (1)
Notes: Unless otherwise indicated, all figures above are for the three months ended December 31, 2017.(1) For the month ended Dec 31, 2017; in a given month, the number of unique mobile devices that were used to visit or access certain of our mobile applications at
least once during that month.(2) Formerly annual active buyers; for the 12-month period ended Dec 31, 2017; the number of annual active consumers on our China retail marketplaces.(3) All translations of RMB into US$ were made at RMB6.5063 to US$1.00, the exchange rate on Dec 29, 2017 as set forth in the H.10 statistical release of the
Federal Reserve Board.
December Quarter 2017 Financial Highlights
56% YoY Total Revenue Growth
515 MM Annual Active Consumers (2)
104% YoYCloud Computing Revenue Growth 57% YoY
Core CommerceRevenue Growth
53% Core Commerce Segment Adjusted
EBITA Margin
Revenue Cloud
Profitability and
Cash FlowConsumers
US$7.1 Bn(3)
Non-GAAP Free Cash Flow
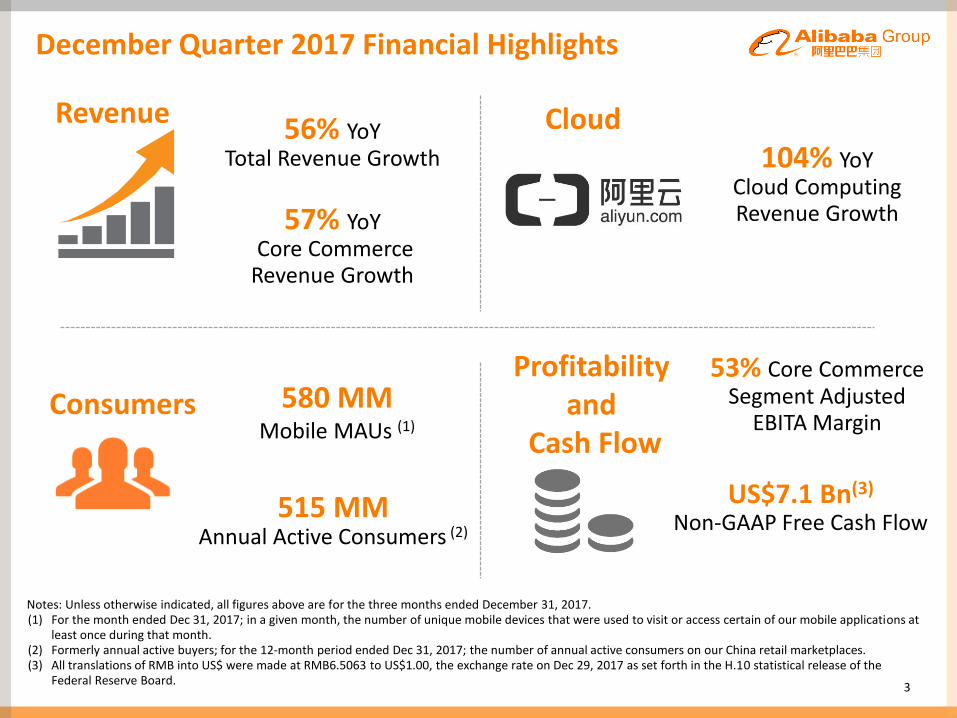
Total Revenue Breakdown
Quarterly Revenue
• Total revenue YoY growth of 56% was mainly driven by the robust revenue growth of our China commerce retail business, international commerce retail business and Alibaba Cloud, as well as the consolidation of Cainiao Network.
4
Three months ended December 31, 2017
RMB MM% of
RevenueYoY%
Core commerce:
China commerce retail 60,105 72% 47%
China commerce wholesale 1,926 2% 27%
International commerce retail 4,733 6% 93%
International commerce wholesale 1,666 2% 7%
Cainiao logistics services(1) 3,907 5% N/A
Others 907 1% 257%
Total core commerce 73,244 88% 57%
Cloud computing 3,599 4% 104%
Digital media and entertainment 5,413 7% 33%
Innovation initiatives and others 772 1% (9%)
Total 83,028 100% 56%
Note: We started to consolidate Cainiao Network in mid-October 2017 after obtaining control over Cainiao Network.(1) After elimination of inter-company transactions.

2.1 2.3 3.1
Dec 31, 2016 Sep 30, 2017 Dec 31, 2017
5
Quarterly Cost Trends
Cost of Revenue (Excluding SBC) Product Development Expenses (Excluding SBC)
2.8 3.4 4.4
Dec 31, 2016 Sep 30, 2017 Dec 31, 2017
Sales & Marketing Expenses (Excluding SBC)
4.1 5.8
8.1
Dec 31, 2016 Sep 30, 2017 Dec 31, 2017
General & Administrative Expenses (Excluding SBC)
(RMB Bn) (RMB Bn)
(RMB Bn) (RMB Bn)
18.5 20.6
33.8
Dec 31, 2016 Sep 30, 2017 Dec 31, 2017
38% 40%
Note: For the three months ended on the respective dates.
35%% of Revenue
6%5%% of Revenue
5%
10%8%% of
Revenue10% 4%4%
% of Revenue
4%
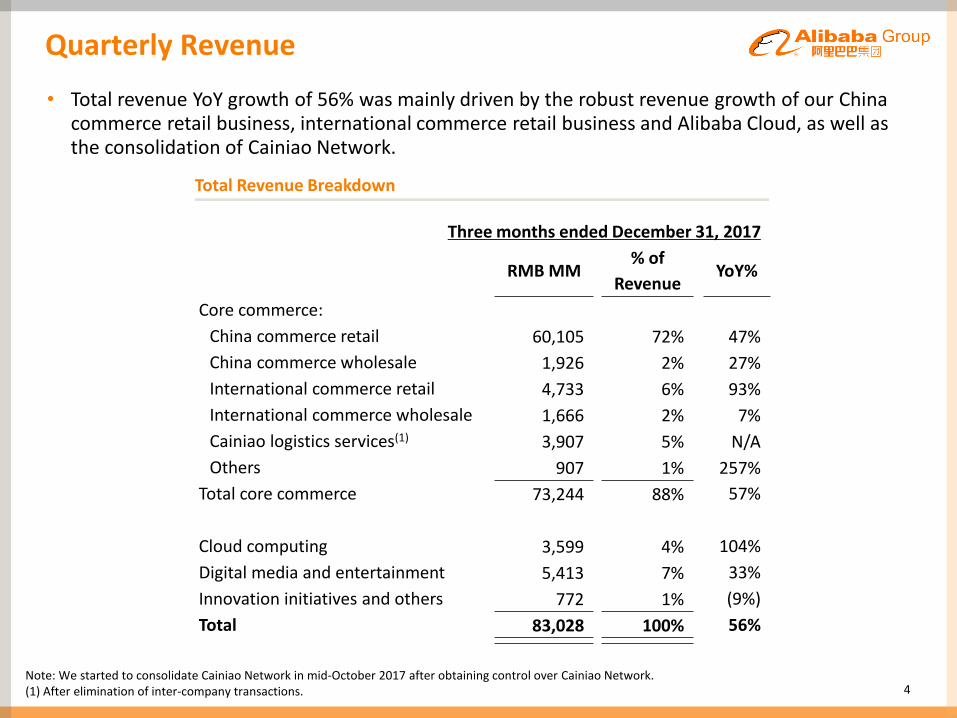
Other Income (Loss), Net
6
• Other loss, net in the quarter ended December 31, 2017 was RMB348 million (US$54 million), compared to other income, net of RMB3,015 million in the same quarter of 2016.
• The loss was primarily due to higher foreign exchange loss and a decrease in royalty fees and software technology service fees generated from Ant Financial under our profit sharing arrangement. Our profit share from Ant Financial declined because of Ant Financial’saggressive user growth plan during the quarter which increased expenses in return for substantial additions in new users for Alipay Wallet.
Note:All translations of RMB into US$ were made at RMB6.5063 to US$1.00, the exchange rate on Dec 29, 2017 as set forth in the H.10 statistical release of the Federal Reserve Board.
Other Income (Loss), Net
(RMB Bn)
3.0
1.7
(0.3)
Dec 31, 2016 Sep 30, 2017 Dec 31, 2017
3% 0%6%% of Revenue

9.02
10.61
Dec 31, 2016 Dec 31, 2017
Non-GAAP Diluted EPS
Non-GAAP Net Income and Non-GAAP Diluted EPS
7
Non-GAAP Net Income(1)
(RMB Bn)
Notes: Unless otherwise indicated, all figures in the above charts are for the three months ended on the respective dates.(1) Non-GAAP net income represents net income before share-based compensation expense, amortization, impairment of goodwill and investments, gain on
deemed disposals/disposals/revaluation of investments, amortization of excess value receivable arising from the restructuring of commercial arrangements with Ant Financial, immediate recognition of unamortized professional fees and upfront fees upon termination of bank borrowings and others, as adjusted for the tax effects on non-GAAP adjustments.
(2) Non-GAAP diluted EPS represents non-GAAP net income attributable to ordinary shareholders divided by the weighted average number of shares outstanding during the periods on a diluted basis, including accounting for the effects of the assumed conversion of convertible preference shares.
(3) All translations of RMB into US$ were made at RMB6.5063 to US$1.00, the exchange rate on Dec 29, 2017 as set forth in the H.10 statistical release of the Federal Reserve Board.
22.5
27.0
Dec 31, 2016 Dec 31, 2017
Non-GAAP Net Income
Non-GAAP Diluted EPS(2)
(RMB)
18%20%
US$1.63(3)
Free Cash Flow and Cash
8
Cash, Cash Equivalents and Short-term Investments
(RMB Bn)
Non-GAAP Free Cash Flow (1)
(RMB Bn)
Notes: Unless otherwise indicated, all figures in the above charts are for the three months ended on the respective dates.(1) Non-GAAP free cash flow represents net cash provided by operating activities as presented in Alibaba Group’s consolidated cash flow statement less
purchases of property and equipment and intangible assets (excluding acquisition of land use rights and construction in progress) and others.(2) All translations of RMB into US$ were made at RMB6.5063 to US$1.00, the exchange rate on Dec 29, 2017 as set forth in the H.10 statistical release of the
Federal Reserve Board.
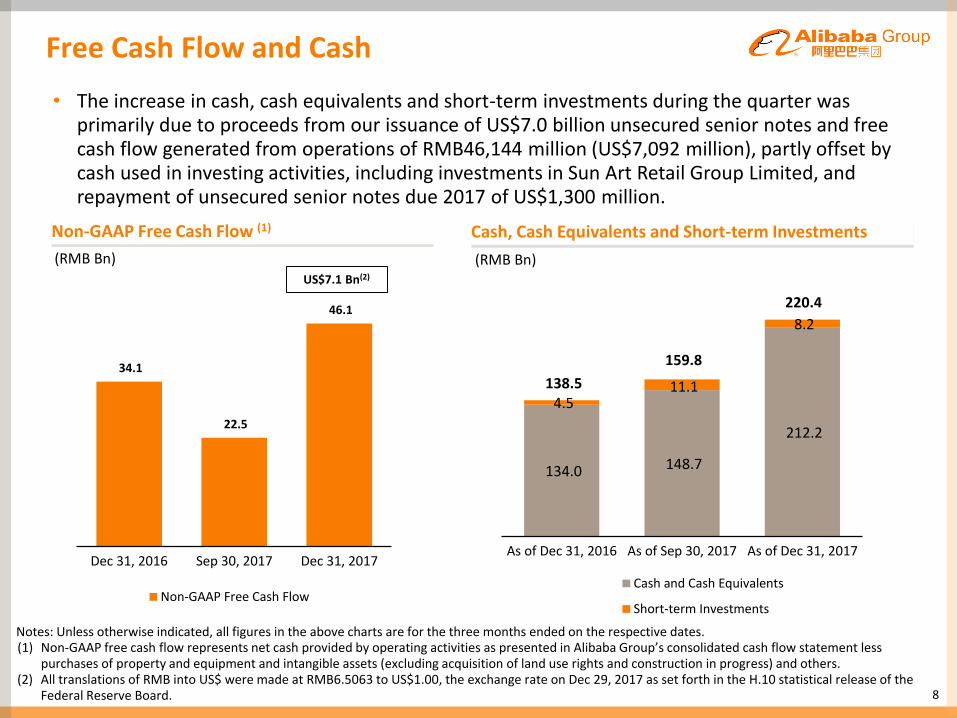
138.5
159.8
220.4
134.0 148.7
212.2
4.5 11.1
8.2
As of Dec 31, 2016 As of Sep 30, 2017 As of Dec 31, 2017
Cash and Cash Equivalents
Short-term Investments
34.1
22.5
46.1
Dec 31, 2016 Sep 30, 2017 Dec 31, 2017
Non-GAAP Free Cash Flow
US$7.1 Bn(2)
• The increase in cash, cash equivalents and short-term investments during the quarter was primarily due to proceeds from our issuance of US$7.0 billion unsecured senior notes and free cash flow generated from operations of RMB46,144 million (US$7,092 million), partly offset by cash used in investing activities, including investments in Sun Art Retail Group Limited, and repayment of unsecured senior notes due 2017 of US$1,300 million.
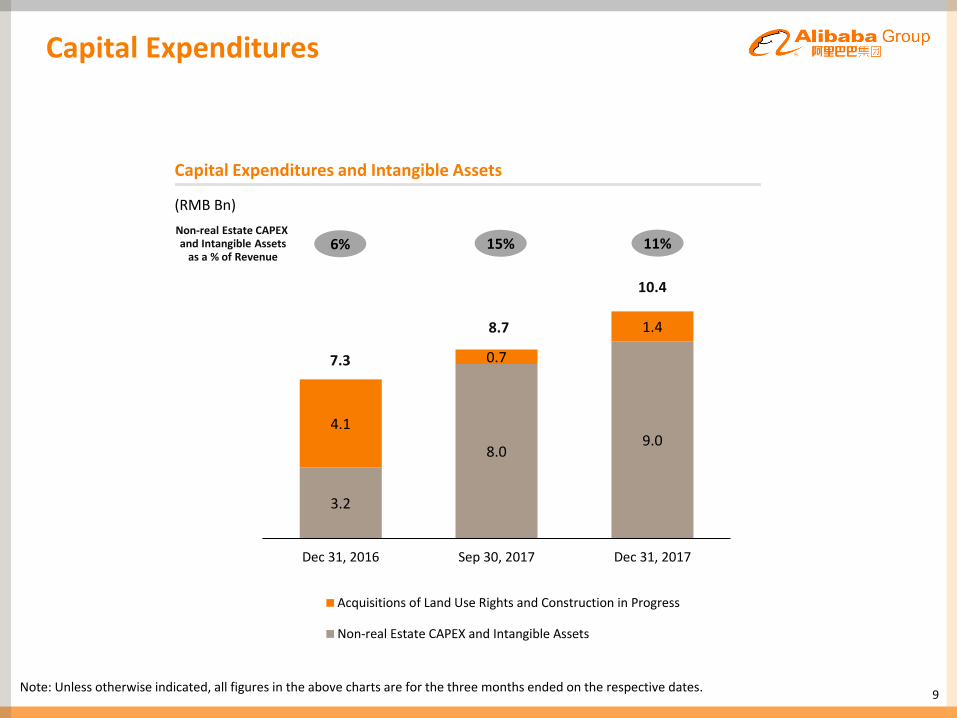
3.2
8.09.0
4.1
0.7
1.4
Dec 31, 2016 Sep 30, 2017 Dec 31, 2017
Acquisitions of Land Use Rights and Construction in Progress
Non-real Estate CAPEX and Intangible Assets
Capital Expenditures
9
Capital Expenditures and Intangible Assets
(RMB Bn)
Note: Unless otherwise indicated, all figures in the above charts are for the three months ended on the respective dates.
11%6%Non-real Estate CAPEX and Intangible Assets
as a % of Revenue15%
10.4
7.3
8.7
Core Commerce Segment
Segment Revenue
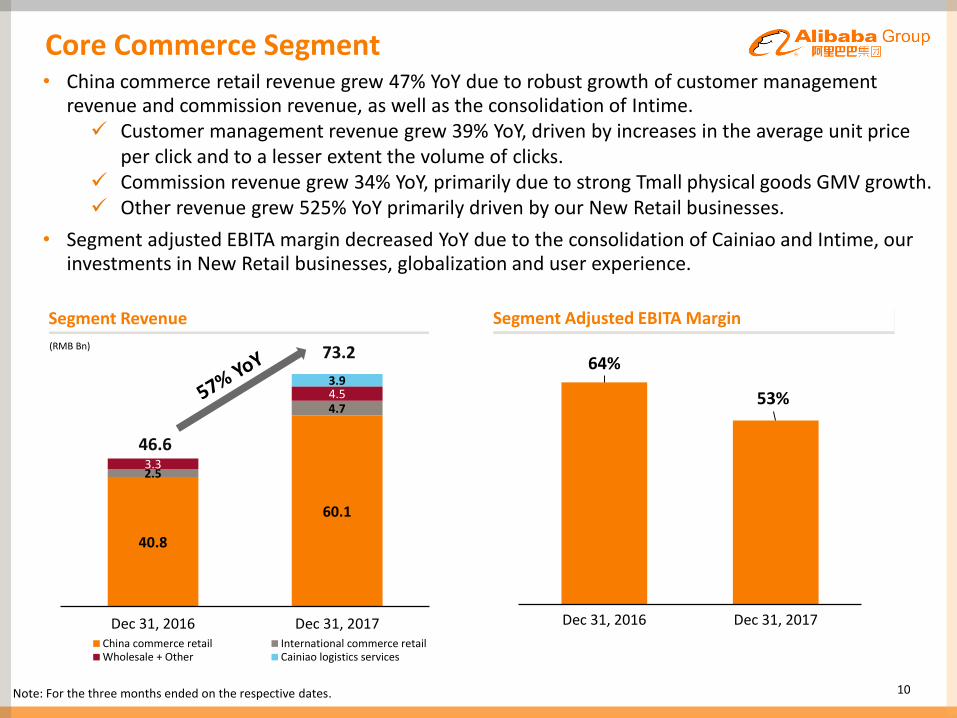
40.8
60.1
2.5
4.7
3.3
4.53.9
Dec 31, 2016 Dec 31, 2017China commerce retail International commerce retailWholesale + Other Cainiao logistics services
64%
53%
Dec 31, 2016 Dec 31, 2017
(RMB Bn)
10
Segment Adjusted EBITA Margin
73.2
46.6
Note: For the three months ended on the respective dates.
• China commerce retail revenue grew 47% YoY due to robust growth of customer management revenue and commission revenue, as well as the consolidation of Intime. Customer management revenue grew 39% YoY, driven by increases in the average unit price
per click and to a lesser extent the volume of clicks. Commission revenue grew 34% YoY, primarily due to strong Tmall physical goods GMV growth. Other revenue grew 525% YoY primarily driven by our New Retail businesses.
• Segment adjusted EBITA margin decreased YoY due to the consolidation of Cainiao and Intime, our investments in New Retail businesses, globalization and user experience.
Cloud Computing Segment
Segment Revenue
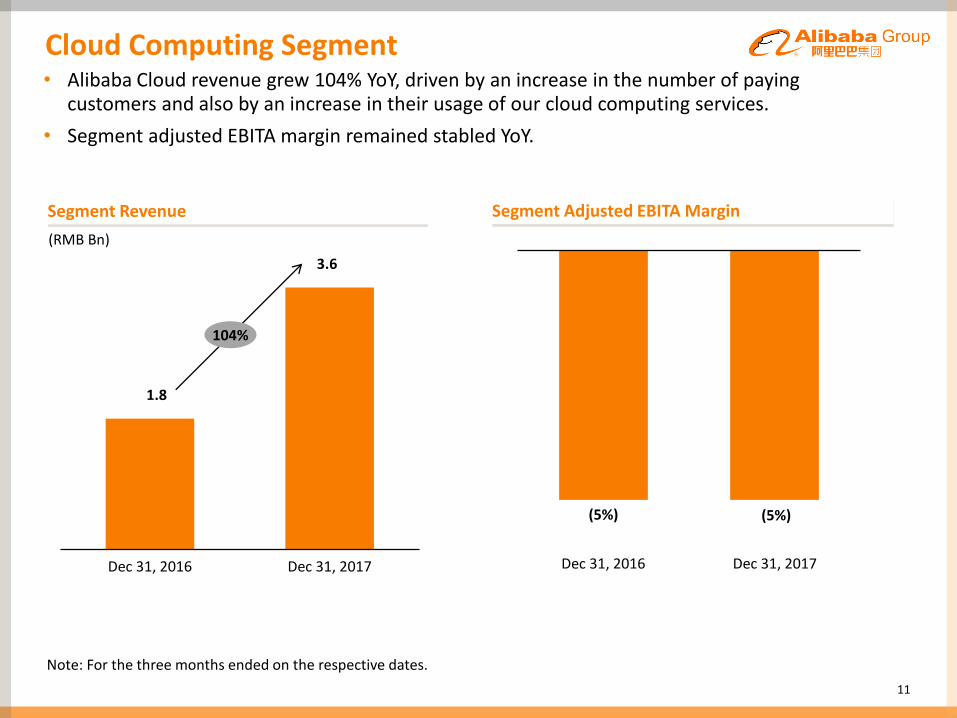
1.8
3.6
Dec 31, 2016 Dec 31, 2017
(5%) (5%)
Dec 31, 2016 Dec 31, 2017
(RMB Bn)
11
Segment Adjusted EBITA Margin
Note: For the three months ended on the respective dates.
• Alibaba Cloud revenue grew 104% YoY, driven by an increase in the number of paying customers and also by an increase in their usage of our cloud computing services.
• Segment adjusted EBITA margin remained stabled YoY.
104%
Digital Media & Entertainment Segment
Segment Revenue
4.1
5.4
Dec 31, 2016 Dec 31, 2017
(60%)
(41%)
Dec 31, 2016 Dec 31, 2017
(RMB Bn)
12
Segment Adjusted EBITA Margin
Note: For the three months ended on the respective dates.
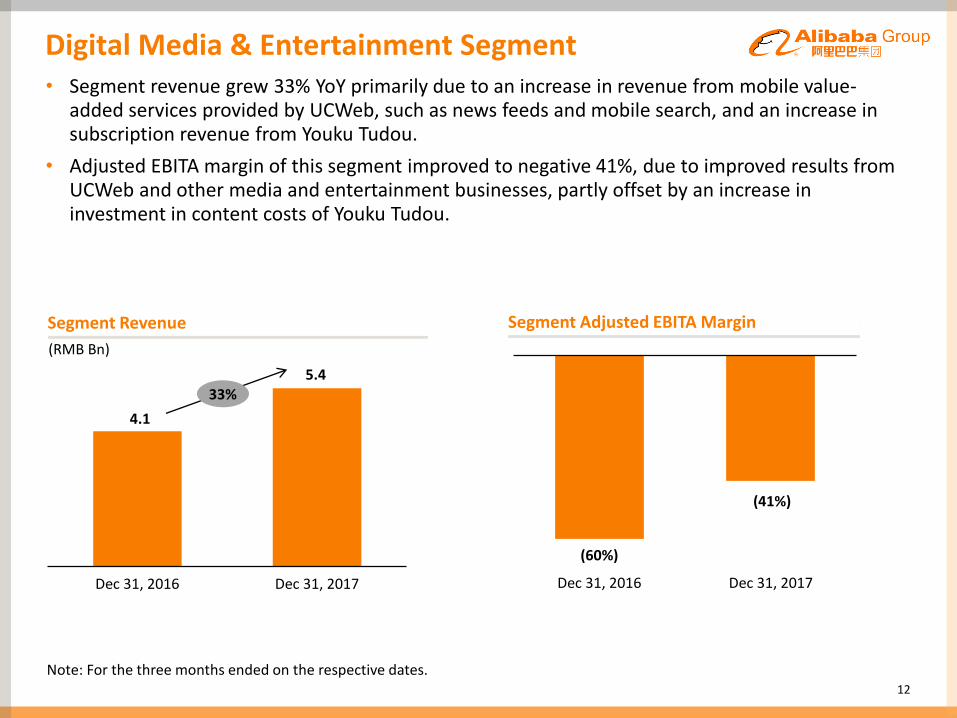
• Segment revenue grew 33% YoY primarily due to an increase in revenue from mobile value-added services provided by UCWeb, such as news feeds and mobile search, and an increase in subscription revenue from Youku Tudou.
• Adjusted EBITA margin of this segment improved to negative 41%, due to improved results from UCWeb and other media and entertainment businesses, partly offset by an increase in investment in content costs of Youku Tudou.
33%

Innovation Initiatives & Others Segment
Segment Revenue
0.85 0.77
Dec 31, 2016 Dec 31, 2017
(93%)
(130%)
Dec 31, 2016 Dec 31, 2017
(RMB Bn)
13
Segment Adjusted EBITA Margin
• The innovation initiatives and others segment includes businesses such as AutoNavi, YunOS, and DingTalk.
• These businesses represent our strategic investments into future growth and are in the initial investment phase.
(9%)
Notes: (1) For the three months ended on the respective dates.(2) Starting June quarter 2017, we reclassified revenue from our fresh food stores Hema, previously reported under this segment, as revenue from China
commerce retail because Hema has moved beyond the incubation stage.
14
Share of Results of Equity Investees
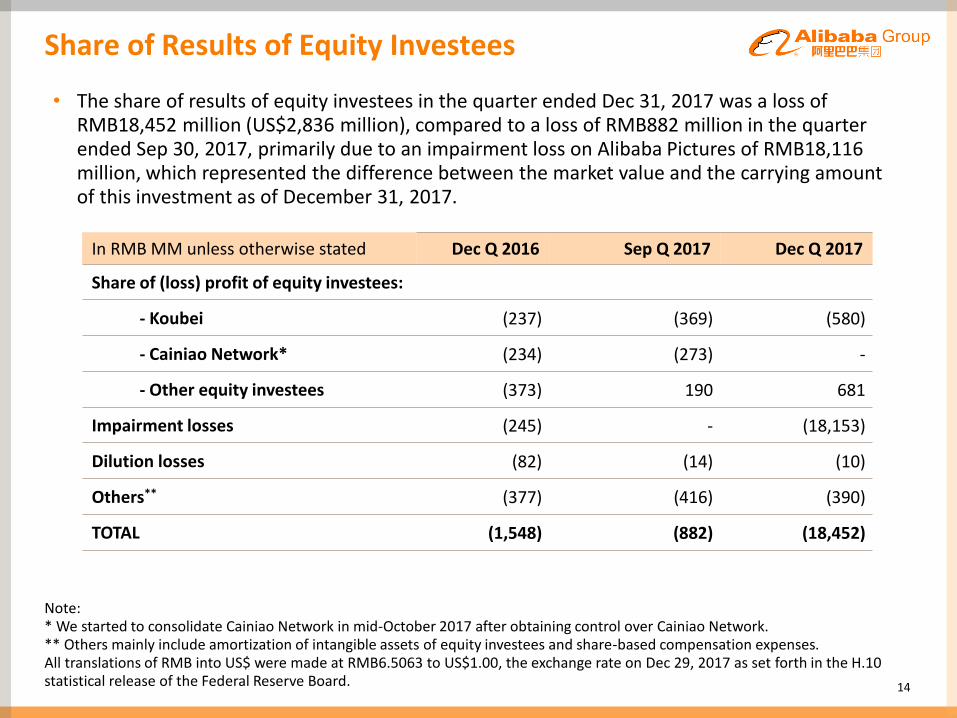
In RMB MM unless otherwise stated Dec Q 2016 Sep Q 2017 Dec Q 2017
Share of (loss) profit of equity investees:
- Koubei (237) (369) (580)
- Cainiao Network* (234) (273) -
- Other equity investees (373) 190 681
Impairment losses (245) - (18,153)
Dilution losses (82) (14) (10)
Others** (377) (416) (390)
TOTAL (1,548) (882) (18,452)
Note:* We started to consolidate Cainiao Network in mid-October 2017 after obtaining control over Cainiao Network.** Others mainly include amortization of intangible assets of equity investees and share-based compensation expenses.All translations of RMB into US$ were made at RMB6.5063 to US$1.00, the exchange rate on Dec 29, 2017 as set forth in the H.10 statistical release of the Federal Reserve Board.
• The share of results of equity investees in the quarter ended Dec 31, 2017 was a loss of RMB18,452 million (US$2,836 million), compared to a loss of RMB882 million in the quarter ended Sep 30, 2017, primarily due to an impairment loss on Alibaba Pictures of RMB18,116 million, which represented the difference between the market value and the carrying amount of this investment as of December 31, 2017.

December Quarter Segment Reporting
15
Core Commerce Cloud Computing
Digital Media & Entertainment
Innovation Initiatives& Others
Un-allocated(2)
Consolidated
Dec 17 Revenue (MM)
RMB 73,244USD 11,257
57% YoY
RMB 3,599USD 553
104% YoY
RMB 5,413USD 83233% YoY
RMB 772USD 119(9%) YoY
-RMB 83,028USD 12,761
56% YoY
Dec 17 Adjusted EBITA (MM)
RMB 38,530
USD 5,922
RMB (181)USD (28)
RMB (2,213)
USD (340)
RMB (1,006)
USD (155)
RMB (1,468)
USD (225)
RMB 33,662
USD 5,174
Dec 17 AdjustedEBITA Margin (%)
53% (5%) (41%) (130%) 41%
Dec 16 Adjusted EBITAMargin (%)
64% (5%) (60%) (93%) 48%
International Commerce Wholesale
China Commerce Wholesale
International Commerce Retail
Notes:(1) Segmental information is presented after elimination of inter-company transactions.(2) Unallocated expenses are primarily related to corporate administrative costs and other miscellaneous items that are not allocated to individual segments. (3) All translations of RMB into US$ were made at RMB6.5063 to US$1.00, the exchange rate on Dec 29, 2017 as set forth in the H.10 statistical release of the Federal Reserve Board.
Tudou
China Commerce Retail
HEMA
Cainiao Logistics Services
Fiscal YTD Segment Reporting
16
Core Commerce Cloud Computing
Digital Media &Entertainment
Innovation Initiatives& Others
Un-allocated(2)
Consolidated
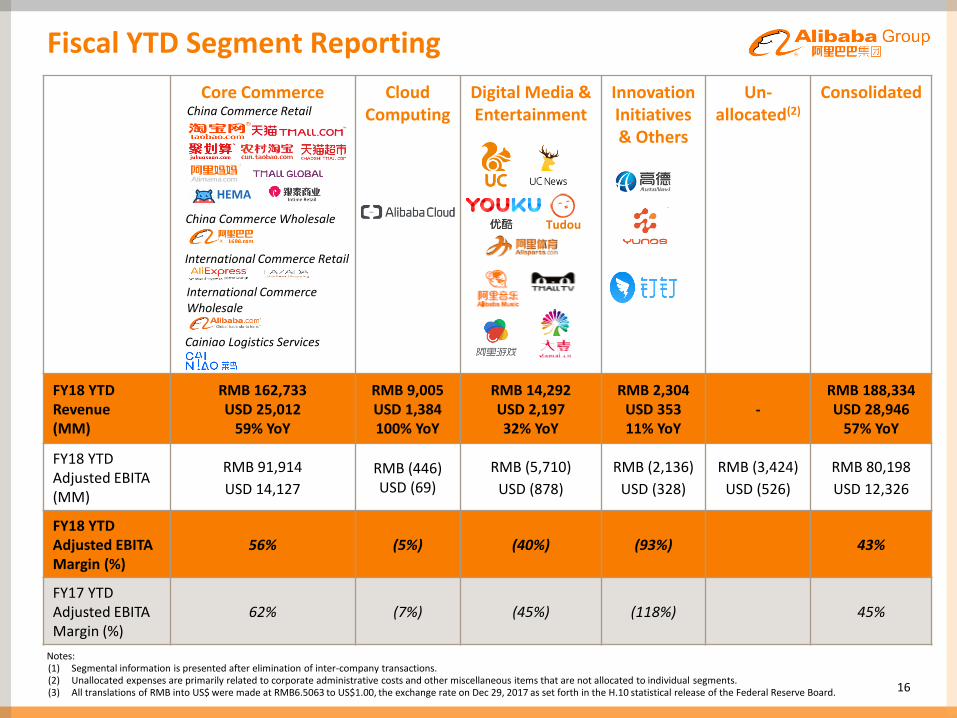
FY18 YTDRevenue (MM)
RMB 162,733USD 25,012
59% YoY
RMB 9,005USD 1,384100% YoY
RMB 14,292USD 2,19732% YoY
RMB 2,304USD 35311% YoY
-RMB 188,334USD 28,946
57% YoY
FY18 YTDAdjusted EBITA (MM)
RMB 91,914
USD 14,127
RMB (446)USD (69)
RMB (5,710)
USD (878)
RMB (2,136)
USD (328)
RMB (3,424)
USD (526)
RMB 80,198
USD 12,326
FY18 YTDAdjusted EBITA Margin (%)
56% (5%) (40%) (93%) 43%
FY17 YTDAdjusted EBITA Margin (%)
62% (7%) (45%) (118%) 45%
Notes:(1) Segmental information is presented after elimination of inter-company transactions.(2) Unallocated expenses are primarily related to corporate administrative costs and other miscellaneous items that are not allocated to individual segments. (3) All translations of RMB into US$ were made at RMB6.5063 to US$1.00, the exchange rate on Dec 29, 2017 as set forth in the H.10 statistical release of the Federal Reserve Board.
Tudou
International Commerce Wholesale
China Commerce Wholesale
International Commerce Retail
China Commerce Retail
HEMA
Cainiao Logistics Services
GAAP to Adjusted/Non-GAAP Measures Reconciliation
17
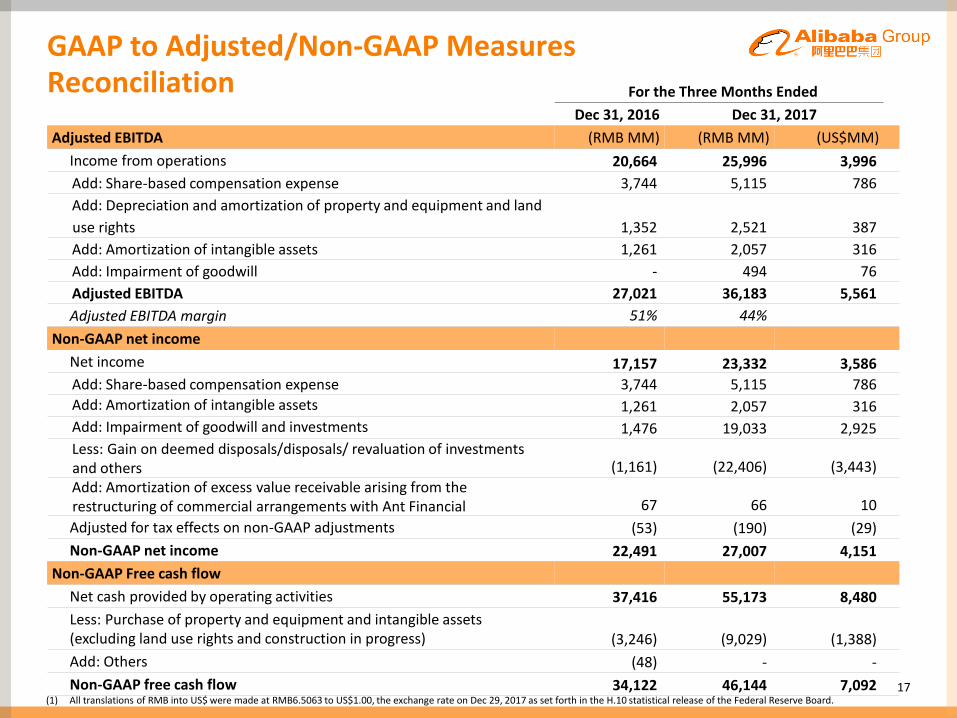
For the Three Months Ended
Dec 31, 2016 Dec 31, 2017
Adjusted EBITDA (RMB MM) (RMB MM) (US$MM)
Income from operations 20,664 25,996 3,996
Add: Share-based compensation expense 3,744 5,115 786
Add: Depreciation and amortization of property and equipment and land
use rights 1,352 2,521 387
Add: Amortization of intangible assets 1,261 2,057 316
Add: Impairment of goodwill - 494 76
Adjusted EBITDA 27,021 36,183 5,561
Adjusted EBITDA margin 51% 44%
Non-GAAP net income
Net income 17,157 23,332 3,586
Add: Share-based compensation expense 3,744 5,115 786
Add: Amortization of intangible assets 1,261 2,057 316
Add: Impairment of goodwill and investments 1,476 19,033 2,925
Less: Gain on deemed disposals/disposals/ revaluation of investments and others (1,161) (22,406) (3,443)
Add: Amortization of excess value receivable arising from the restructuring of commercial arrangements with Ant Financial 67 66 10
Adjusted for tax effects on non-GAAP adjustments (53) (190) (29)
Non-GAAP net income 22,491 27,007 4,151
Non-GAAP Free cash flow
Net cash provided by operating activities 37,416 55,173 8,480
Less: Purchase of property and equipment and intangible assets (excluding land use rights and construction in progress) (3,246) (9,029) (1,388)
Add: Others (48) - -
Non-GAAP free cash flow 34,122 46,144 7,092(1) All translations of RMB into US$ were made at RMB6.5063 to US$1.00, the exchange rate on Dec 29, 2017 as set forth in the H.10 statistical release of the Federal Reserve Board.