December 31, 2017 T. RowE PRICE PRFDX Equity … #6 PRFDX PAFDX RRFDX REIPX Equity Income Fund...
64
PRFDX PAFDX RRFDX REIPX Equity Income Fund Equity Income Fund– Advisor Class Equity Income Fund– R Class Equity Income Fund– I Class ANNUAL REPORT December 31, 2017 T. ROWE PRICE The fund invests in value-oriented stocks.
Transcript of December 31, 2017 T. RowE PRICE PRFDX Equity … #6 PRFDX PAFDX RRFDX REIPX Equity Income Fund...

Proof #6
PRFDX
PAFDX
RRFDX
REIPX
Equity Income Fund
Equity Income Fund– Advisor Class
Equity Income Fund– R Class
Equity Income Fund– I Class
aNNualREPORT
December 31, 2017
T. RowE PRICE
The fund invests in value-oriented stocks.

Proof #6
REPORTS ON THE WEB
Sign up for our Email Program, and you can begin to receive updated fund reports and prospectuses online rather than through the mail. Log in to your account at troweprice.com for more information.
HIGHLIGHTS
• U.S.stockssurgedin2017asstrongercorporateearningsandsteadyeconomicgrowthpushedthemajorbenchmarkstorecordlevels.
• TheEquityIncomeFundreturned16.18%fortheyearandlaggedtheS&P500Indexbutoutperformeditsstyle-specificbenchmark,theRussell1000ValueIndex.
• Everysectorcontributedtoabsolutereturns.ComparedwiththeS&P500Index,consumerstaplesaddedthemosttorelativeperformance,whileinformationtechnologywasthebiggestdetractorduetoourunderweighttoIT,thebest-performingsector.ComparedwiththeRussell1000ValueIndex,industrialsandbusinessservicescontributedthemosttorelativereturns,whileutilitieswasthesoledetractor.
• Stockvaluationslookstretchedandotherassetpricesappearincreasinglyexpensivefollowingthepastyear’srally.Weanticipateabumpierridein2018asgeopoliticalrisksandhigherabsolutevaluationsarebalancedbyfavorableeconomicdataandcorporateearnings.
T. Rowe Price Equity Income Fund
TheviewsandopinionsinthisreportwerecurrentasofDecember31,2017.They are not guarantees of performance or investment results andshouldnotbe takenas investmentadvice. Investmentdecisionsreflectavarietyof factors,and themanagers reserve the right tochange theirviews about individual stocks, sectors, and the markets at any time.As a result, the views expressed should not be relied upon as a fore-castof the fund’s future investment intent.Thereport iscertifiedunderthe Sarbanes-Oxley Act, which requiresmutual funds and other publiccompanies to affirm that, to the best of their knowledge, the informa-tionintheirfinancialreportsisfairlyandaccuratelystatedinallmaterialrespects.

Proof #6
T. Rowe Price Equity Income Fund
Manager’s Letter
1
Fellow Shareholders
A recovery in corporate profits, steady economic growth overseas, and optimism
about the Trump administration’s plans for tax reform drove U.S. stocks higher in
2017. The S&P 500 Index and other major benchmarks surged to record levels into
December as earnings rebounded after more than a year of declining profits and the
U.S. economy showed signs of growing strength. The improving economic backdrop
worldwide allayed concerns about rising U.S. interest rates and geopolitical tensions
in a few countries. In this supportive environment, the Equity Income Fund posted a
double-digit return for the year.
The Equity Income Fund returned 10.05% and 16.18% for the six and 12 months ended December 31, 2017, respectively, trailing the S&P 500 Index, which returned 11.42% and 21.83%. (Returns for the Advisor, R, and I Class shares reflect different fee structures.) The fund outperformed the Russell 1000 Value Index, its style-specific benchmark, which returned 8.61%
and 13.66% over the corresponding periods. The fund outperformed its peer group, the Lipper Equity Income Funds Index, over the six-month period but lagged it for the full year.
The Equity Income Fund’s underperformance against the S&P 500 Index reflects the unusually large disparity in returns for growth and value stocks in 2017, when growth stocks returned more than twice as much as value stocks in the large-cap universe, according to
TotalReturnPeriodsEnded12/31/17 6Months 12Months
EquityIncomeFund 10.05% 16.18%
EquityIncomeFund–AdvisorClass 9.85 15.84
EquityIncomeFund–RClass 9.74 15.52
EquityIncomeFund–IClass 10.11 16.31
S&P500Index 11.42 21.83
Russell1000ValueIndex 8.61 13.66
LipperEquityIncomeFundsIndex 9.55 16.43
Performance Comparison

Proof #6
2
Russell indexes. The strong outperformance of growth stocks hurt the Equity Income Fund’s relative performance against the S&P 500 Index, which encompasses both growth and value stocks. Because we invest in undervalued companies with long-term appreciation prospects, it is unsurprising that the fund lagged the S&P 500 Index in a year when growth stocks widely outpaced value.
Effective March 1, 2018, the performance benchmark of the Equity Income Fund will change to the Russell 1000 Value Index from the current S&P 500 Index. We believe that the Russell 1000 Value Index is a more appropriate style-specific benchmark that better aligns with our value-focused investment style. Moreover, the Russell 1000 Value Index better captures our investment universe and provides a more accurate performance comparison when one investment style dominates another over a prolonged period. The benchmark change will not affect day-to-day management of the Equity Income Fund or its investment style, which remains unchanged since the fund’s 1985 inception.
Every sector contributed to the fund’s absolute returns for the year. Compared with the S&P 500 Index, consumer staples followed by real estate stocks contributed the most to relative performance, while information technology was the biggest detractor due to our underweight to IT, the best-performing sector in the S&P 500 Index. Measured against the Russell 1000 Value Index, industrials and business services and IT stocks, respectively, contributed the most to relative returns, while utilities were the sole detractor.
MaRkET ENvIRONMENT
The major U.S. stock market indexes repeatedly rose to record levels in the year’s second half as earnings beat expectations and investors anticipated that corporate tax cuts would boost profits even further. Signs of a global growth pickup grew more plentiful over 2017, pointing to “the broadest synchronized upswing the world economy has experienced in the last decade,” as the International Monetary Fund stated in July. The S&P 500 Index ended 2017 near a record high, joining other global stock benchmarks that finished at all-time or multiyear highs. The strong performance in the U.S. and other major markets occurred even as the Federal Reserve continued to tighten its accommodative monetary policy in place since the 2008 financial crisis. The Fed raised short-term interest rates three times over the year and signaled three more increases in 2018.

Proof #6
3
Large-cap shares outperformed their smaller peers. Growth stocks widely outpaced value stocks across all market capitalizations, according to various Russell indexes. In both the S&P 500 and Russell 1000 Value Indexes, nine out of 11 sectors advanced and two fell. IT stocks performed the best in both benchmarks, driven by outsized gains in a handful of high-growth technology and Internet stocks. Materials, consumer discretionary, financials, and health care were the next-best performers. On the other hand, telecommunication services stocks retreated as wireless companies contended with slowing growth and stiffer price competition. Energy stocks also declined as low oil prices weighed on the sector in the year’s first half. However, cooperation among the world’s major oil producers to curb output drove oil prices higher and helped energy stocks pare their losses by year-end.
PORTfOLIO REvIEW
The Equity Income Fund seeks to buy well-established, large-cap companies that typically have a strong record of paying dividends and appear to be undervalued by the market. The fund’s holdings tend to be solid, higher-quality companies going through a period of underperformance, reflecting our dual focus on valuation and dividend yield. We rely on the insights of T. Rowe Price’s large team of equity analysts and use an active, research-driven investment approach to select individual stocks based on their unique merits, rather than picking stocks based on broader market or economic trends. As of December 31, 2017, the dividend yield of the Equity Income Fund was 2.55% versus 1.88% for the S&P 500. All but two companies in the fund paid a dividend over the past 12 months.
Stock selection was strongest in the consumer staples sector, which produced several of the fund’s top contributors. Tyson Foods helped returns as the meat company reaped the rewards of its longstanding plan to focus on branded and prepared foods, which helped it report surprisingly strong earnings in 2017. We also benefited from our position in Wal-Mart as the retailer stepped up efforts to improve its e-commerce business. We owned Wal-Mart for its huge network of brick-and-mortar stores, which we reasoned gives it an edge over other big-box retailers and other e-commerce players as same- and next-day delivery becomes more widespread, and we are pleased to see its online initiatives start to pay off. Our consumer staples exposure rose

Proof #6
4
over the past six months as we took advantage of attractive valuations in a few companies. We initiated a position in Kimberly-Clark and added to Philip Morris International on weakness after the cigarette maker delivered underwhelming earnings. (Please refer to the portfolio of investments for a complete list of holdings and the amount each represents in the portfolio.)
The industrials and business services sector added value, largely owing to our position in Boeing, the fund’s top contributor to returns.
Boeing shares climbed to a record high in 2017 as the aerospace company reaped the benefits of productivity gains, cost cuts, and rising global air traffic growth. We continue to like Boeing but regard
the company’s reward-to-risk ratio as slightly less favorable following the recent months’ rally and have reduced our position accordingly. Defense industry electronics maker Harris was another significant contributor. Harris shares rose amid expectations for increased U.S. defense spending and lower corporate taxes resulting from the recent tax overhaul. We believe Harris has strong growth
PercentofNetAssets 6/30/17 12/31/17
Financials 25.8% 26.3%
HealthCare 11.2 11.6
IndustrialsandBusinessServices 11.8 10.3
Energy 9.4 9.6
InformationTechnology 8.1 8.3
ConsumerStaples 6.3 7.8
ConsumerDiscretionary 8.1 7.6
Utilities 6.8 5.5
Materials 4.9 5.4
TelecommunicationServices 2.9 3.0
RealEstate 2.1 2.1
OtherandReserves 2.6 2.5
Total 100.0% 100.0%
Historicalweightingsreflectcurrentindustry/sectorclassifications.
Sector Diversification
Equity Income S&P500Asof12/31/17 Fund Index
Price/BookRatio 2.3X 4.4X
Price/EarningsRatio(Basedonnext12months’estimatedearnings)* 16.1X 19.8X
HistoricalBeta(Basedonmonthlyreturnsforfiveyears) 1.0 1.0
*Sourcefordata:IBES.Statisticsarebasedonthecompaniesinthefund’sportfolioandarenotaprojectionoffuturefundperformance.
Financial Profile

Proof #6
5
tailwinds for the next several years as the U.S. military upgrades its communication systems and the company sells more products overseas. On the other hand, our position in industrial conglomerate GE weighed on returns. GE shares sank to a multiyear low by year-end as the company struggled to overhaul its sprawling operations and investors expressed skepticism about a turnaround plan unveiled by its new chief executive. For more than a year, we have gradually trimmed our GE position as we waited for evidence that would help us determine whether management would be able to fix some of the company’s businesses. GE ranked among our biggest sales for the year.
Information technology stocks contributed to absolute returns. Despite our lack of exposure to several high-flying tech names, we added value through our holdings in Microsoft, which is strongly benefiting from its ongoing push into cloud-based computing services, and in semiconductor manufacturing equipment maker Applied Materials.
OuTLOOk
U.S. stocks benefited in 2017 from better-than-expected earnings, synchronized global growth, tame inflation, and a more benign regulatory environment. Most of the risks that investors feared at the outset of the year—such as a shift toward U.S. protectionism, a misstep in monetary policy by the Fed, or a geopolitical crisis—failed to materialize. The U.S. economy is in solid shape, and the underpinnings for stronger corporate profits growth are intact. The recent passage of the corporate tax reform bill should be a strong tailwind for the market over the next year. However, stock valuations look stretched and other asset prices appear increasingly expensive following the past year’s rally. Widespread optimism about the U.S. economy and stock market has led to a sense of confidence among many investors who assume that the supportive conditions of the past year will persist into 2018. We believe that much of the good news is already priced into financial markets and worry that investor confidence will turn into complacency.
We would not be surprised to see the stock market grind higher in the coming months, aided by the recent tax overhaul. However, our outlook is tempered by several risks to global growth. An unexpected slowdown in China, whose economy outpaced expectations in 2017, would have negative repercussions for global financial markets. Tensions on the Korean peninsula or in the Middle East could flare up

Proof #6
6
again, with potentially adverse consequences for oil prices arising from a Mideast conflict. On the economic front, stronger U.S. growth could increase inflation pressures, leading the Fed to raise interest rates at an unexpectedly fast pace that could curb stock price gains.
We anticipate a bumpier ride in 2018 as geopolitical risks and higher absolute valuation levels are balanced by positive economic data and corporate earnings. Thanks to T. Rowe Price’s strengths in fundamental research and the collective insights of our equity analysts, we are well equipped to navigate what will likely be a more volatile environment and continue to identify higher-quality, undervalued companies for your fund. We are confident that our disciplined investment approach, thoughtful stock selection, and attention to valuation will allow us to continue delivering solid shareholder returns over the long term.
Thank you for investing with T. Rowe Price.
Respectfully submitted,
John D. Linehan President of the fund and chairman of its Investment Advisory Committee
Heather McPherson Associate portfolio manager
January 10, 2018
The committee chairman has day-to-day responsibility for managing the fund and works with committee members in developing and executing the fund’s investment program.

Proof #6
7
T. Rowe Price Equity Income Fund
Risks of Investing in the Fund
Valueinvestorsseektoinvestincompanieswhosestockpricesarelowinrelationtotheirrealworthorfutureprospects.Byidentifyingcompanieswhosestocksarecurrentlyoutoffavorormisunderstood,valueinvestorshopetorealizesignificantappreciationasotherinvestorsrecognizethestock’sintrinsicvalueandthepricerisesaccordingly.Thevalueapproachcarriestheriskthatthemarketwillnotrecognizeasecurity’sintrinsicvalueforalongtimeorthatastockjudgedtobeundervaluedmayactuallybeappropriatelypriced.
Glossary
Dividend yield:Theannualdividendofastockdividedbythestock’sprice.
Earnings growth rate – current fiscal year:Measurestheannualizedpercentchangeinearningspersharefromthepriorfiscalyeartothecurrentfiscalyear.
Lipper indexes:Fundbenchmarksthatconsistofasmallnumber(10to30)ofthelargestmutualfundsinaparticularcategoryastrackedbyLipperInc.
Price-to-earnings (P/E) ratio – current fiscal year:Avaluationmeasurecalculatedbydividingthepriceofastockbyitsreportedearningspersharefromthelatestfiscalyear.Theratioisameasureofhowmuchinvestorsarewillingtopayforthecompany’searnings.ThehighertheP/E,themoreinvestorsarepayingforthecompany’scurrentearnings.
Price-to-earnings (P/E) ratio – next fiscal year:Avaluationmeasurecalculatedbydividingthepriceofastockbyitsestimatedearningsforthenextfiscalyear.Theratioisameasureofhowmuchinvestorsarewillingtopayforthecompany’sfutureearnings.ThehighertheP/E,themoreinvestorsarepayingforthecompany’sexpectedearningsgrowthinthenextfiscalyear.
Price-to-earnings (P/E) ratio – 12 months forward:Avaluationmeasurecalculatedbydividingthepriceofastockbytheanalysts’forecastofthenext12months’expectedearnings.Theratioisameasureofhowmuchinvestorsarewillingtopayforthecompany’sfutureearnings.ThehighertheP/E,themoreinvestorsarepayingforthecompany’searningsgrowthinthenext12months.
Projected earnings growth rate (IBES):Acompany’sexpectedearningspersharegrowthrateforagiventimeperiodbasedontheforecastfromtheInstitutionalBrokers’EstimateSystem,whichiscommonlyreferredtoasIBES.
Russell 1000 value Index:Anindexthattrackstheperformanceoflarge-capstockswithlowerprice-to-bookratiosandlowerforecastedgrowthvalues.
S&P 500 Index:Anunmanagedindexthattracksthestocksof500primarilylarge-capU.S.companies.
RussellInvestmentGroupisthesourceandownerofthetrademarks,servicemarks,andcopyrightsrelatedtotheRussellindexes.Russell®isatrademarkofRussellInvestmentGroup.

Proof #6
8
T. Rowe Price Equity Income Fund
TWENTY-fIvE LaRGEST HOLDINGS
Percentof NetAssets 12/31/17
JPMorganChase 3.9%WellsFargo 2.8ExxonMobil 2.6MorganStanley 2.2Microsoft 2.1
VerizonCommunications 2.0Johnson&Johnson 1.9Total 1.9DowDuPont 1.9Qualcomm 1.8
Anthem 1.8StateStreet 1.7Twenty-FirstCenturyFox 1.7Harris 1.7SouthernCompany 1.6
Boeing 1.6Citigroup 1.5JohnsonControlsInternational 1.5CiscoSystems 1.5Becton,Dickinson&Company 1.5
Loews 1.4U.S.Bancorp 1.4Pfizer 1.4TysonFoods 1.4FifthThirdBancorp 1.3
Total 46.1%
Note:Theinformationshowndoesnotreflectanyexchange-tradedfunds(ETFs),cashreserves,orcollateralforsecuritieslendingthatmaybeheldintheportfolio.
Portfolio Highlights

Proof #6
9
T. Rowe Price Equity Income Fund
MaJOR PORTfOLIO CHaNGESListedindescendingorderofsize.
SixMonthsEnded12/31/17
Largest Purchases Largest Sales
Kimberly-Clark*SouthernCompanyGlaxoSmithKlineBrighthouseFinancial*AmericanInternationalGroup*TransCanada*ChubbWellsFargoPhilipMorrisInternationalCVSHealth*
BoeingRoyalDutchShell**IllinoisToolWorksAmericanExpress**AmeripriseFinancialXCELEnergy**AppliedMaterialsCarnival**GEExelon
12MonthsEnded12/31/17
Largest Purchases Largest Sales
SouthernCompanyKimberly-Clark*AmericanInternationalGroup*TysonFoods*U.S.BancorpWellsFargoChubbTransCanada*Becton,Dickinson&CompanyGileadSciences
BoeingRoyalDutchShell**AmericanExpress**BankofAmericaAES**GEXCELEnergy**Carnival**AmeripriseFinancialMarsh&McLennan
*Positionadded. **Positioneliminated.
Portfolio Highlights
Proof #6
T. Rowe Price Equity Income Fund
Performance and Expenses
10
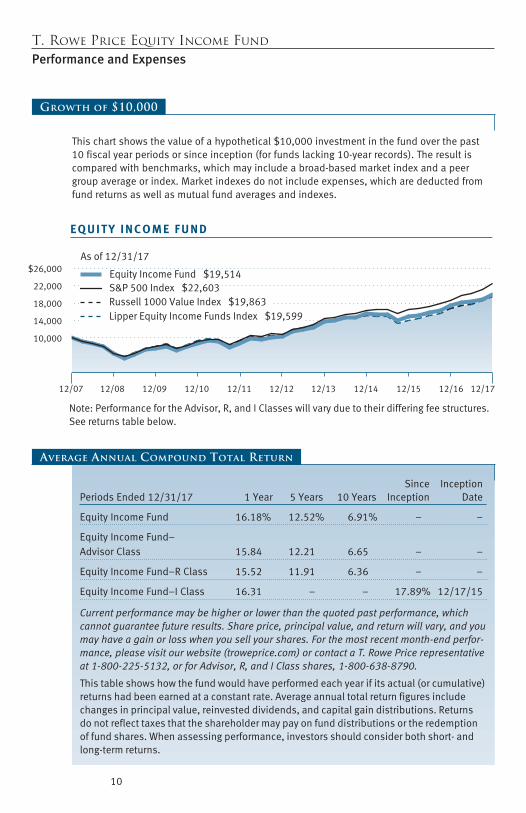
Equity Income Fund $19,514
As of 12/31/17
12/07 12/08 12/09 12/10 12/11 12/12 12/13 12/14 12/15 12/16 12/17
E Q U I T Y I N C O M E F U N D
Lipper Equity Income Funds Index $19,599
S&P 500 Index $22,603
Note: Performance for the Advisor, R, and I Classes will vary due to their differing fee structures. See returns table below.
10,000
14,000
18,000
22,000
$26,000
Russell 1000 Value Index $19,863
Growth of $10,000
Thischartshowsthevalueofahypothetical$10,000investmentinthefundoverthepast10fiscalyearperiodsorsinceinception(forfundslacking10-yearrecords).Theresultiscomparedwithbenchmarks,whichmayincludeabroad-basedmarketindexandapeergroupaverageorindex.Marketindexesdonotincludeexpenses,whicharedeductedfromfundreturnsaswellasmutualfundaveragesandindexes.
Since InceptionPeriodsEnded12/31/17 1Year 5Years 10Years Inception Date
EquityIncomeFund 16.18% 12.52% 6.91% – –
EquityIncomeFund–AdvisorClass 15.84 12.21 6.65 – –
EquityIncomeFund–RClass 15.52 11.91 6.36 – –
EquityIncomeFund–IClass 16.31 – – 17.89% 12/17/15
Current performance may be higher or lower than the quoted past performance, which cannot guarantee future results. Share price, principal value, and return will vary, and you may have a gain or loss when you sell your shares. For the most recent month-end perfor-mance, please visit our website (troweprice.com) or contact a T. Rowe Price representative at 1-800-225-5132, or for Advisor, R, and I Class shares, 1-800-638-8790.
Thistableshowshowthefundwouldhaveperformedeachyearifitsactual(orcumulative)returnshadbeenearnedataconstantrate.Averageannualtotalreturnfiguresincludechangesinprincipalvalue,reinvesteddividends,andcapitalgaindistributions.Returnsdonotreflecttaxesthattheshareholdermaypayonfunddistributionsortheredemptionoffundshares.Whenassessingperformance,investorsshouldconsiderbothshort-andlong-termreturns.
Average Annual Compound Total Return

Proof #6
11
T. Rowe Price Equity Income Fund
Fund Expense Example
Asamutualfundshareholder,youmayincurtwotypesofcosts:(1)transactioncosts,suchasredemptionfeesorsalesloads,and(2)ongoingcosts,includingmanagementfees,distributionandservice(12b-1)fees,andotherfundexpenses.Thefollowingexampleisintendedtohelpyouunderstandyourongoingcosts(indollars)ofinvestinginthefundandtocomparethesecostswiththeongoingcostsofinvestinginothermutualfunds.Theexampleisbasedonaninvestmentof$1,000investedatthebeginningofthemostrecentsix-monthperiodandheldfortheentireperiod.
Pleasenotethatthefundhasfourshareclasses:Theoriginalshareclass(InvestorClass)chargesnodistributionandservice(12b-1)fee,AdvisorClasssharesareofferedonlythroughunaffiliatedbrokersandotherfinancialintermediariesandchargea0.25%12b-1fee,RClasssharesareavailabletoretirementplansservicedbyintermediariesandchargea0.50%12b-1fee,andIClasssharesareavailabletoinstitutionallyorientedclientsandimposeno12b-1oradministrativefeepayment.Eachshareclassispresentedseparatelyinthetable.
actual ExpensesThefirstlineofthefollowingtable(Actual)providesinformationaboutactualaccountvaluesandexpensesbasedonthefund’sactualreturns.Youmayusetheinformationonthisline,togetherwithyouraccountbalance,toestimatetheexpensesthatyoupaidovertheperiod.Simplydivideyouraccountvalueby$1,000(forexample,an$8,600accountvaluedividedby$1,000=8.6),thenmultiplytheresultbythenumberonthefirstlineundertheheading“ExpensesPaidDuringPeriod”toestimatetheexpensesyoupaidonyouraccountduringthisperiod.
Hypothetical Example for Comparison PurposesTheinformationonthesecondlineofthetable(Hypothetical)isbasedonhypotheticalaccountvaluesandexpensesderivedfromthefund’sactualexpenseratioandanassumed5%peryearrateofreturnbeforeexpenses(notthefund’sactualreturn).Youmaycomparetheongoingcostsofinvestinginthefundwithotherfundsbycontrastingthis5%hypotheticalexampleandthe5%hypotheticalexamplesthatappearintheshareholderreportsoftheotherfunds.Thehypotheticalaccountvaluesandexpensesmaynotbeusedtoestimatetheactualendingaccountbalanceorexpensesyoupaidfortheperiod.
EquityIncomeFund 0.66%
EquityIncomeFund–AdvisorClass 0.94
EquityIncomeFund–RClass 1.21
EquityIncomeFund–IClass 0.54
Theexpenseratioshownisasofthefund’sfiscalyearended12/31/16.Thisnumbermayvaryfromtheexpenseratioshownelsewhereinthisreportbecauseitisbasedonadifferenttimeperiodand,ifapplicable,includesacquiredfundfeesandexpensesbutdoesnotincludefeeorexpensewaivers.
Expense Ratio

Proof #6
12
T. Rowe Price Equity Income Fund
Fund Expense Example (continued)
Note:T.RowePricechargesanannualaccountservicefeeof$20,generallyforaccountswithlessthan$10,000.ThefeeiswaivedforanyinvestorwhoseT.RowePricemutualfundaccountstotal$50,000ormore;accountselectingtoreceiveelectronicdeliveryofaccountstatements,transactionconfirmations,prospectuses,andshareholderreports;oraccountsofaninvestorwhoisaT.RowePricePersonalServicesorEnhancedPersonalServicesclient(enrollmentintheseprogramsgenerallyrequiresT.RowePriceassetsofatleast$250,000).Thisfeeisnotincludedintheaccompanyingtable.Ifyouaresubjecttothefee,keepitinmindwhenyouareestimatingtheongoingexpensesofinvestinginthefundandwhencomparingtheexpensesofthisfundwithotherfunds.
Youshouldalsobeawarethattheexpensesshowninthetablehighlightonlyyourongoingcostsanddonotreflectanytransactioncosts,suchasredemptionfeesorsalesloads.Therefore,thesecondlineofthetableisusefulincomparingongoingcostsonlyandwillnothelpyoudeterminetherelativetotalcostsofowningdifferentfunds.Totheextentafundchargestransactioncosts,however,thetotalcostofowningthatfundishigher.
ExpensesPaid Beginning Ending DuringPeriod* AccountValue AccountValue 7/1/17to 7/1/17 12/31/17 12/31/17
Investor ClassActual $1,000.00 $1,100.50 $3.49
Hypothetical(assumes5%returnbeforeexpenses) 1,000.00 1,021.88 3.36
advisor ClassActual 1,000.00 1,098.50 5.02
Hypothetical(assumes5%returnbeforeexpenses) 1,000.00 1,020.42 4.84
R ClassActual 1,000.00 1,097.40 6.40
Hypothetical(assumes5%returnbeforeexpenses) 1,000.00 1,019.11 6.16
Equity Income Fund

Proof #6
13
T. Rowe Price Equity Income Fund
ExpensesPaid Beginning Ending DuringPeriod* AccountValue AccountValue 7/1/17to 7/1/17 12/31/17 12/31/17
I ClassActual $1,000.00 $1,101.10 $2.97
Hypothetical(assumes5%returnbeforeexpenses) 1,000.00 1,022.38 2.85
*Expensesareequaltothefund’sannualizedexpenseratioforthe6-monthperiod,multipliedbytheaverageaccountvalueovertheperiod,multipliedbythenumberofdaysinthemostrecentfiscalhalfyear(184),anddividedbythedaysintheyear(365)toreflectthehalf-yearperiod.TheannualizedexpenseratiooftheInvestorClasswas0.66%,theAdvisorClasswas0.95%,theRClasswas1.21%,andtheIClasswas0.56%.
Equity Income Fund (continued)
Fund Expense Example (continued)
Proof #6
14
T. Rowe Price Equity Income Fund
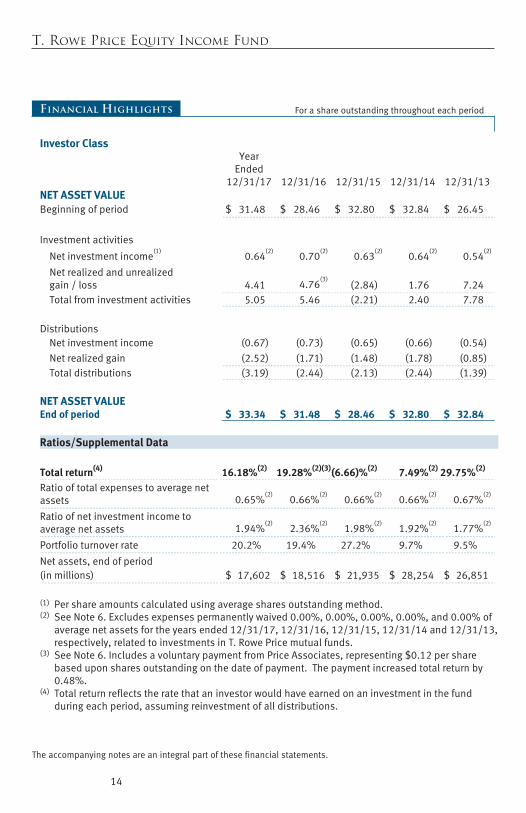
Financial Highlights For a share outstanding throughout each period
The accompanying notes are an integral part of these financial statements.
Investor Class
Year Ended
12/31/17
12/31/16
12/31/15
12/31/14
12/31/13
NET ASSET VALUE
Beginning of period
$ 31.48
$ 28.46
$ 32.80
$ 32.84
$ 26.45
Investment activities
Net investment income(1)
0.64(2)
0.70(2)
0.63(2)
0.64(2)
0.54(2)
Net realized and unrealized gain / loss
4.41
4.76
(3) (2.84)
1.76
7.24
Total from investment activities
5.05
5.46
(2.21)
2.40
7.78
Distributions
Net investment income
(0.67)
(0.73)
(0.65)
(0.66)
(0.54)
Net realized gain
(2.52)
(1.71)
(1.48)
(1.78)
(0.85)
Total distributions
(3.19)
(2.44)
(2.13)
(2.44)
(1.39)
NET ASSET VALUE
End of period $ 33.34 $ 31.48 $ 28.46 $ 32.80 $ 32.84
Ratios/Supplemental Data Total return(4) 16.18%(2) 19.28%(2)(3)(6.66)%(2) 7.49%(2) 29.75%(2)
Ratio of total expenses to average net assets
0.65%
(2) 0.66%
(2) 0.66%
(2) 0.66%
(2) 0.67%
(2)
Ratio of net investment income to average net assets
1.94%
(2) 2.36%
(2) 1.98%
(2) 1.92%
(2) 1.77%
(2)
Portfolio turnover rate
20.2%
19.4%
27.2%
9.7%
9.5%
Net assets, end of period
(in millions)
$ 17,602
$ 18,516
$ 21,935
$ 28,254
$ 26,851
(1) Per share amounts calculated using average shares outstanding method. (2) See Note 6. Excludes expenses permanently waived 0.00%, 0.00%, 0.00%, 0.00%, and 0.00% of
average net assets for the years ended 12/31/17, 12/31/16, 12/31/15, 12/31/14 and 12/31/13, respectively, related to investments in T. Rowe Price mutual funds.
(3) See Note 6. Includes a voluntary payment from Price Associates, representing $0.12 per share based upon shares outstanding on the date of payment. The payment increased total return by 0.48%.
(4) Total return reflects the rate that an investor would have earned on an investment in the fund during each period, assuming reinvestment of all distributions.

Proof #6
15
T. Rowe Price Equity Income Fund
Financial Highlights For a share outstanding throughout each period
The accompanying notes are an integral part of these financial statements.
Advisor Class
Year Ended
12/31/17
12/31/16
12/31/15
12/31/14
12/31/13
NET ASSET VALUE
Beginning of period
$ 31.40
$ 28.40
$ 32.74
$ 32.77
$ 26.39
Investment activities
Net investment income(1)
0.54(2)
0.62(2)
0.53(2)
0.56(2)
0.45(2)
Net realized and unrealized gain / loss
4.40
4.74
(3) (2.82)
1.74
7.24
Total from investment activities
4.94
5.36
(2.29)
2.30
7.69
Distributions
Net investment income
(0.56)
(0.65)
(0.57)
(0.55)
(0.46)
Net realized gain
(2.52)
(1.71)
(1.48)
(1.78)
(0.85)
Total distributions
(3.08)
(2.36)
(2.05)
(2.33)
(1.31)
NET ASSET VALUE
End of period $ 33.26 $ 31.40 $ 28.40 $ 32.74 $ 32.77
Ratios/Supplemental Data Total return(4) 15.84%(2) 18.94%(2)(3)(6.92)%(2) 7.18%(2) 29.44%(2)
Ratio of total expenses to average net assets
0.94%
(2) 0.94%
(2) 0.93%
(2) 0.93%
(2) 0.94%
(2)
Ratio of net investment income to average net assets
1.64%
(2) 2.08%
(2) 1.68%
(2) 1.66%
(2) 1.49%
(2)
Portfolio turnover rate
20.2%
19.4%
27.2%
9.7%
9.5%
Net assets, end of period
(in millions)
$ 422
$ 521
$ 686
$ 1,392
$ 2,561
(1) Per share amounts calculated using average shares outstanding method. (2) See Note 6. Excludes expenses permanently waived 0.00%, 0.00%, 0.00%, 0.00%, and 0.00% of
average net assets for the years ended 12/31/17, 12/31/16, 12/31/15, 12/31/14 and 12/31/13, respectively, related to investments in T. Rowe Price mutual funds.
(3) See Note 6. Includes a voluntary payment from Price Associates, representing $0.12 per share based upon shares outstanding on the date of payment. The payment increased total return by 0.48%.
(4) Total return reflects the rate that an investor would have earned on an investment in the fund during each period, assuming reinvestment of all distributions.

Proof #6
16
T. Rowe Price Equity Income Fund
Financial Highlights For a share outstanding throughout each period
The accompanying notes are an integral part of these financial statements.
R Class
Year Ended
12/31/17
12/31/16
12/31/15
12/31/14
12/31/13
NET ASSET VALUE
Beginning of period
$ 31.35
$ 28.35
$ 32.67
$ 32.72
$ 26.36
Investment activities
Net investment income(1)
0.44(2)
0.53(2)
0.45(2)
0.46(2)
0.37(2)
Net realized and unrealized gain / loss
4.40
4.74
(3) (2.82)
1.75
7.22
Total from investment activities
4.84
5.27
(2.37)
2.21
7.59
Distributions
Net investment income
(0.47)
(0.56)
(0.47)
(0.48)
(0.38)
Net realized gain
(2.52)
(1.71)
(1.48)
(1.78)
(0.85)
Total distributions
(2.99)
(2.27)
(1.95)
(2.26)
(1.23)
NET ASSET VALUE
End of period $ 33.20 $ 31.35 $ 28.35 $ 32.67 $ 32.72
Ratios/Supplemental Data Total return(4) 15.52%(2) 18.63%(2)(3)(7.18)%(2) 6.91%(2) 29.07%(2)
Ratio of total expenses to average net assets
1.22%
(2) 1.20%
(2) 1.19%
(2) 1.19%
(2) 1.20%
(2)
Ratio of net investment income to average net assets
1.35%
(2) 1.80%
(2) 1.44%
(2) 1.39%
(2) 1.23%
(2)
Portfolio turnover rate
20.2%
19.4%
27.2%
9.7%
9.5%
Net assets, end of period
(in thousands)
$ 99,972
$ 134,460
$ 203,518
$ 353,908
$ 351,544
(1) Per share amounts calculated using average shares outstanding method. (2) See Note 6. Excludes expenses permanently waived 0.00%, 0.00%, 0.00%, 0.00%, and 0.00% of
average net assets for the years ended 12/31/17, 12/31/16, 12/31/15, 12/31/14 and 12/31/13, respectively, related to investments in T. Rowe Price mutual funds.
(3) See Note 6. Includes a voluntary payment from Price Associates, representing $0.12 per share based upon shares outstanding on the date of payment. The payment increased total return by 0.48%.
(4) Total return reflects the rate that an investor would have earned on an investment in the fund during each period, assuming reinvestment of all distributions.

Proof #6
17
T. Rowe Price Equity Income Fund
Financial Highlights For a share outstanding throughout each period
I Class
Year Ended
12/31/17
12/31/16
12/17/15(1)
Through
12/31/15
NET ASSET VALUE
Beginning of period
$ 31.48
$ 28.47
$ 28.27
Investment activities
Net investment income(2)
0.69(3)
0.88(3)
–(3)(4)(5)
Net realized and unrealized gain / loss
4.40
4.61(6)
0.20
Total from investment activities
5.09
5.49
0.20
Distributions
Net investment income
(0.70)
(0.77)
–
Net realized gain
(2.52)
(1.71)
–
Total distributions
(3.22)
(2.48)
–
NET ASSET VALUE
End of period $ 33.35 $ 31.48 $ 28.47
Ratios/Supplemental Data Total return(7) 16.31%(3) 19.40%(3)(6) 0.71%(3)(4)
Ratio of total expenses to average net assets
0.55%(3)
0.54%(3)
0.58%(3)(4)(8)
Ratio of net investment income to average net assets
2.06%(3)
2.89%(3)
1.15%(3)(4)(8)

Proof #6
18
T. Rowe Price Equity Income Fund
Financial Highlights For a share outstanding throughout each period
The accompanying notes are an integral part of these financial statements.
Year Ended
12/31/17
12/31/16
12/17/15(1)
Through
12/31/15
Ratios/Supplemental Data (continued) Portfolio turnover rate
20.2%
19.4%
27.2%
Net assets, end of period
(in millions)
$ 4,235
$ 3,521
$ 6
(1) Inception date (2) Per share amounts calculated using average shares outstanding method. (3) See Note 6. Excludes expenses permanently waived 0.00%, 0.00% and 0.00% of average net
assets for the years ended 12/31/17, 12/31/16 and for the period ended 12/31/15, respectively, related to investments in T. Rowe Price mutual funds.
(4) See Note 6. Excludes expenses in excess of a 0.05% contractual operating expense limitation in effect through 4/30/18.
(5) Amounts round to less than $0.01 per share. (6) See Note 6. Includes a voluntary payment from Price Associates, representing $0.12 per share
based upon shares outstanding on the date of payment. The payment increased total return by 0.45%.
(7) Total return reflects the rate that an investor would have earned on an investment in the fund during each period, assuming reinvestment of all distributions.
(8) Annualized

Proof #6
T. Rowe Price Equity Income Fund December 31, 2017
Portfolio of Investments ‡ Shares/Par $ Value
(Cost and value in $000s)
19
COMMON STOCKS 95.8%
CONSUMER DISCRETIONARY 7.6%
Auto Components 0.6%
Adient 1,840,000 144,808
144,808
Automobiles 0.3%
Ford Motor 4,500,000 56,205
56,205
Hotels, Restaurants & Leisure 1.0%
Las Vegas Sands 3,080,000 214,029
214,029
Leisure Products 0.5%
Mattel 7,175,000 110,352
110,352
Media 4.1%
Comcast, Class A 6,590,000 263,929
News Corp, Class A 11,800,000 191,278
Twenty-First Century Fox 11,190,000 381,803
Walt Disney 660,000 70,957
907,967
Multiline Retail 0.9%
Kohl's 3,170,000 171,909
Macy's 1,310,000 32,999
204,908
Specialty Retail 0.2%
L Brands 920,000 55,402
55,402
Total Consumer Discretionary 1,693,671

Proof #6
T. Rowe Price Equity Income Fund
Shares/Par $ Value
(Cost and value in $000s)
20
CONSUMER STAPLES 7.8%
Beverages 1.3%
Diageo (GBP) 1,480,000 54,249
PepsiCo 1,900,000 227,848
282,097
Food & Staples Retailing 1.5%
CVS Health 960,000 69,600
Wal-Mart 2,735,000 270,081
339,681
Food Products 2.6%
Archer-Daniels-Midland 4,560,000 182,765
Kellogg 1,370,000 93,133
Tyson Foods, Class A 3,750,000 304,012
579,910
Household Products 1.1%
Kimberly-Clark 2,090,000 252,179
252,179
Personal Products 0.4%
Coty, Class A 4,700,000 93,483
93,483
Tobacco 0.9%
Philip Morris International 1,908,900 201,675
201,675
Total Consumer Staples 1,749,025
ENERGY 9.6%
Oil, Gas & Consumable Fuels 9.6%
Apache 4,410,000 186,190
Canadian Natural Resources 620,000 22,146
Chevron 2,070,000 259,143

Proof #6
T. Rowe Price Equity Income Fund
Shares/Par $ Value
(Cost and value in $000s)
21
EQT 470,000 26,752
ExxonMobil 6,975,000 583,389
Hess 4,710,000 223,584
Occidental Petroleum 3,660,000 269,596
Total (EUR) 7,810,000 431,112
Total, Rights, 1/3/18 (EUR)(1) 7,850,000 —
TransCanada 3,100,000 150,784
Total Energy 2,152,696
FINANCIALS 26.3%
Banks 12.9%
Bank of America 1,460,000 43,099
Citigroup 4,575,000 340,426
Fifth Third Bancorp 9,800,000 297,332
JPMorgan Chase 8,090,000 865,145
KeyCorp 8,950,000 180,521
PNC Financial Services Group 1,520,000 219,321
U.S. Bancorp 5,820,000 311,836
Wells Fargo 10,450,000 634,001
2,891,681
Capital Markets 6.6%
Ameriprise Financial 1,200,000 203,364
Bank of New York Mellon 3,470,000 186,894
Franklin Resources 1,290,000 55,896
Morgan Stanley 9,300,000 487,971
Northern Trust 1,525,000 152,332
State Street 3,935,000 384,096
1,470,553
Insurance 6.8%
American International Group 4,350,000 259,173
Brighthouse Financial (1) 2,770,000 162,433
Chubb 1,585,000 231,616
Loews 6,460,000 323,194

Proof #6
T. Rowe Price Equity Income Fund
Shares/Par $ Value
(Cost and value in $000s)
22
Marsh & McLennan 1,445,000 117,608
MetLife 5,350,000 270,496
Willis Towers Watson 479,503 72,256
XL Group 2,580,000 90,713
1,527,489
Total Financials 5,889,723
HEALTH CARE 10.9%
Biotechnology 1.1%
Gilead Sciences 3,360,000 240,710
240,710
Health Care Equipment & Supplies 1.9%
Becton, Dickinson & Company 790,000 169,108
Medtronic 3,200,000 258,400
427,508
Health Care Providers & Services 1.8%
Anthem 1,800,000 405,018
405,018
Pharmaceuticals 6.1%
Bristol-Myers Squibb 3,040,000 186,291
GlaxoSmithKline (GBP) 7,300,000 129,277
GlaxoSmithKline, ADR 2,490,000 88,320
Johnson & Johnson 3,100,000 433,132
Merck 3,770,000 212,138
Pfizer 8,520,000 308,595
1,357,753
Total Health Care 2,430,989
INDUSTRIALS & BUSINESS SERVICES 10.2%
Aerospace & Defense 3.4%
Boeing 1,205,000 355,366

Proof #6
T. Rowe Price Equity Income Fund
Shares/Par $ Value
(Cost and value in $000s)
23
Harris 2,645,000 374,664
United Technologies 226,900 28,946
758,976
Air Freight & Logistics 1.2%
UPS, Class B 2,250,000 268,087
268,087
Airlines 0.8%
Delta Air Lines 1,680,000 94,080
Southwest Airlines 1,450,000 94,903
188,983
Building Products 1.5%
Johnson Controls International 8,830,000 336,511
336,511
Commercial Services & Supplies 0.2%
Stericycle (1) 750,000 50,993
50,993
Electrical Equipment 0.9%
Emerson Electric 3,050,000 212,554
212,554
Industrial Conglomerates 0.5%
GE 6,150,000 107,318
107,318
Machinery 1.7%
Flowserve 2,650,000 111,645
Illinois Tool Works 810,000 135,148
Pentair 1,740,000 122,879
369,672
Total Industrials & Business Services 2,293,094

Proof #6
T. Rowe Price Equity Income Fund
Shares/Par $ Value
(Cost and value in $000s)
24
INFORMATION TECHNOLOGY 8.3%
Communications Equipment 1.5%
Cisco Systems 8,500,000 325,550
325,550
Electronic Equipment, Instruments & Components 0.4%
TE Connectivity 1,010,000 95,990
95,990
Semiconductors & Semiconductor Equipment 3.5%
Analog Devices 670,000 59,650
Applied Materials 3,380,000 172,786
Qualcomm 6,375,000 408,127
Texas Instruments 1,365,000 142,561
783,124
Software 2.3%
CA 1,150,000 38,272
Microsoft 5,510,000 471,325
509,597
Technology Hardware, Storage & Peripherals 0.6%
Apple 230,000 38,923
Hewlett-Packard Enterprise 3,500,000 50,260
Western Digital 720,000 57,262
146,445
Total Information Technology 1,860,706
MATERIALS 5.4%
Chemicals 3.1%
Akzo Nobel (EUR) 470,000 41,240
CF Industries 5,730,000 243,754
DowDuPont 5,820,000 414,501
699,495

Proof #6
T. Rowe Price Equity Income Fund
Shares/Par $ Value
(Cost and value in $000s)
25
Construction Materials 0.7%
Vulcan Materials 1,265,000 162,388
162,388
Containers & Packaging 1.0%
International Paper 3,720,000 215,537
215,537
Metals & Mining 0.6%
Nucor 2,200,000 139,876
139,876
Total Materials 1,217,296
REAL ESTATE 2.1%
Equity Real Estate Investment Trusts 2.1%
Equity Residential, REIT 2,030,000 129,453
Rayonier, REIT 5,890,000 186,301
Weyerhaeuser, REIT 4,110,000 144,918
Total Real Estate 460,672
TELECOMMUNICATION SERVICES 3.0%
Diversified Telecommunication Services 2.8%
CenturyLink 3,725,000 62,133
Telefonica (EUR) 11,650,000 113,445
Verizon Communications 8,630,000 456,786
632,364
Wireless Telecommunication Services 0.2%
Vodafone (GBP) 9,650,000 30,503
30,503
Total Telecommunication Services 662,867

Proof #6
T. Rowe Price Equity Income Fund
Shares/Par $ Value
(Cost and value in $000s)
26
UTILITIES 4.5%
Electric Utilities 3.5%
Edison International 2,570,000 162,527
Exelon 2,120,000 83,549
PG&E 2,806,697 125,825
Southern Company 7,490,000 360,194
Westar Energy 1,080,000 57,024
789,119
Multi-Utilities 1.0%
NiSource 8,430,000 216,398
216,398
Total Utilities 1,005,517
Total Miscellaneous Common Stocks 0.1% (2) 17,407
Total Common Stocks (Cost $14,455,061) 21,433,663
CONVERTIBLE PREFERRED STOCKS 1.6%
HEALTH CARE 0.7%
Health Care Equipment & Supplies 0.7%
Becton, Dickinson & Company, Class A, 6.125%, 5/1/20 2,702,575 155,806
Total Health Care 155,806
UTILITIES 0.9%
Electric Utilities 0.7%
NextEra Energy, 6.123%, 8/2/19 2,836,650 161,577
161,577

Proof #6
T. Rowe Price Equity Income Fund
Shares/Par $ Value
(Cost and value in $000s)
27
Multi Utilities 0.2%
DTE Energy, 6.50%, 10/1/19 685,550 37,361
37,361
Total Utilities 198,938
Total Convertible Preferred Stocks (Cost $308,421) 354,744
CORPORATE BONDS 0.5%
Mattel, 6.75%, 12/31/25 (3) 66,910,000 67,747
Western Digital, 10.50%, 4/1/24 31,950,000 37,022
Total Corporate Bonds (Cost $98,755) 104,769
BOND MUTUAL FUNDS 0.3%
T. Rowe Price Institutional Floating Rate Fund, 3.80% (4)(5) 6,468,844 64,818
Total Bond Mutual Funds (Cost $63,108) 64,818
SHORT-TERM INVESTMENTS 1.7%
Money Market Funds 1.7%
T. Rowe Price Government Reserve Fund, 1.24% (4)(6) 384,704,346 384,704
Total Short-Term Investments (Cost $384,704) 384,704
Total Investments in Securities
99.9% of Net Assets (Cost $15,310,049) $ 22,342,698
‡ Shares/Par are denominated in U.S. dollars unless otherwise noted. (1) Non-income producing (2)
The identity of certain securities has been concealed to protect the fund while it completes a purchase or selling program for the securities.
(3)
Security was purchased pursuant to Rule 144A under the Securities Act of 1933 and may be resold in transactions exempt from registration only to qualified institutional buyers -- total value of such securities at period-end amounts to $67,747 and represents 0.3% of net assets.
(4) Affiliated Company (5) SEC 30-day yield (6) Seven-day yield

Proof #6
T. Rowe Price Equity Income Fund
28
ADR American Depositary Receipts EUR Euro GBP British Pound REIT
A domestic Real Estate Investment Trust whose distributions pass-through with original tax character to the shareholder

Proof #6
T. Rowe Price Equity Income Fund
29
The accompanying notes are an integral part of these financial statements.
Affiliated Companies
($000s)
The fund may invest in certain securities that are considered affiliated companies. As defined by the 1940 Act, an affiliated company is one in which the fund owns 5% or more of the outstanding voting securities, or a company that is under common ownership or control. The following securities were considered affiliated companies for all or some portion of the year ended December 31, 2017. Net realized gain (loss), investment income, change in net unrealized gain/loss, and purchase and sales cost reflect all activity for the period then ended.
Affiliate
Net Realized Gain(Loss)
Change in NetUnrealizedGain/Loss
InvestmentIncome
T. Rowe Price Institutional Floating Rate Fund $ — $ (380) $ 2,757 T. Rowe Price Government Reserve Fund — — 3,781 Totals $ —# $ (380) $ 6,538+ Supplementary Investment Schedule Affiliate
Value12/31/16
PurchaseCost
SalesCost
Value12/31/17
T. Rowe Price Institutional Floating Rate Fund $ 62,465 $ 2,733 $ — $ 64,818 T. Rowe Price Government Reserve Fund 495,652 ¤ ¤ 384,704 $ 449,522^
# Capital gain/loss distributions from mutual funds represented $0 of the net realized gain (loss).
+ Investment income comprised $6,538 of dividend income and $0 of interest income. ¤ Purchase and sale information not shown for cash management funds. ^ The cost basis of investments in affiliated companies was $447,812.

Proof #6
30
T. Rowe Price Equity Income Fund December 31, 2017
($000s, except shares and per share amounts)
Statement of Assets and Liabilities
Assets
Investments in securities, at value (cost $15,310,049) $ 22,342,698
Dividends and interest receivable 41,567
Receivable for shares sold 30,884
Receivable for investment securities sold 26,842
Other assets 1,307
Total assets 22,443,298
Liabilities
Payable for shares redeemed 30,989
Payable to Price Associates (Note 6) 30,812
Investment management fees payable 9,983
Payable for investment securities purchased 9,263
Due to affiliates 1,212
Payable to directors 17
Other liabilities 2,660
Total liabilities 84,936
NET ASSETS $ 22,358,362 Net Assets Consist of:
Accumulated undistributed net realized gain $ 364,113
Net unrealized gain 7,002,000
Paid-in capital applicable to 670,662,272 shares of $0.0001 par value capital stock outstanding; 2,000,000,000 shares authorized 14,992,249
NET ASSETS $ 22,358,362

Proof #6
31
T. Rowe Price Equity Income Fund December 31, 2017
The accompanying notes are an integral part of these financial statements.
Statement of Assets and Liabilities
NET ASSET VALUE PER SHARE
Investor Class ($17,602,305,147 / 527,991,820 shares outstanding) $ 33.34
Advisor Class ($421,504,745 / 12,671,641 shares outstanding) $ 33.26
R Class ($99,971,883 / 3,011,125 shares outstanding) $ 33.20
I Class ($4,234,580,447 / 126,987,686 shares outstanding) $ 33.35

Proof #6
T. Rowe Price Equity Income Fund
($000s)
Statement of Operations
32
Year Ended
12/31/17Investment Income (Loss)
Income Dividend $ 577,846 Interest 1,848 Other 2
Total income 579,696
Expenses Investment management 117,552 Shareholder servicing
Investor Class 19,938 Advisor Class 722 R Class 195 I Class 22 20,877
Rule 12b-1 fees Advisor Class 1,175 R Class 568 1,743
Prospectus and shareholder reports Investor Class 293 Advisor Class 11 R Class 2 I Class 378 684
Custody and accounting 645 Registration 401 Legal and audit 151 Directors 72 Proxy and annual meeting 2,040 Miscellaneous 42 Waived / paid by Price Associates (349)
Total expenses 143,858
Net investment income 435,838

Proof #6
T. Rowe Price Equity Income Fund
($000s)
Statement of Operations
33
The accompanying notes are an integral part of these financial statements.
Realized and Unrealized Gain / Loss
Net realized gain (loss) Securities 2,570,981 Futures 4,244 Foreign currency transactions 100
Net realized gain 2,575,325
Change in net unrealized gain / loss
Securities 353,480 Payable to Price Associates (Note 6) (30,812) Other assets and liabilities denominated in foreign currencies 207
Change in net unrealized gain / loss 322,875
Net realized and unrealized gain / loss 2,898,200
INCREASE IN NET ASSETS FROM OPERATIONS $ 3,334,038

Proof #6
T. Rowe Price Equity Income Fund
($000s)
34
Statement of Changes in Net Assets
Year Ended
12/31/17 12/31/16Increase (Decrease) in Net Assets
Operations Net investment income $ 435,838 $ 523,931 Net realized gain 2,575,325 1,246,357 Change in net unrealized gain / loss 322,875 2,055,307 Increase in net assets from operations 3,334,038 3,825,595
Distributions to shareholders
Net investment income Investor Class (351,812) (435,481) Advisor Class (7,554) (11,473) R Class (1,492) (2,584) I Class (80,705) (68,754)
Net realized gain Investor Class (1,245,150) (957,764) Advisor Class (30,047) (28,210) R Class (7,064) (7,246) I Class (297,129) (181,061)
Decrease in net assets from distributions (2,020,953) (1,692,573)
Capital share transactions*
Shares sold Investor Class 1,093,046 1,487,940 Advisor Class 57,532 96,766 R Class 15,805 23,621 I Class 1,018,067 3,744,307
Distributions reinvested Investor Class 1,519,616 1,328,942 Advisor Class 37,149 39,229 R Class 8,556 9,830 I Class 368,740 246,156
Shares redeemed Investor Class (4,589,821) (8,155,729) Advisor Class (225,816) (352,668) R Class (66,336) (115,926) I Class (883,784) (623,653)
Decrease in net assets from capital share transactions (1,647,246) (2,271,185)

Proof #6
T. Rowe Price Equity Income Fund
($000s)
35
The accompanying notes are an integral part of these financial statements.
Statement of Changes in Net Assets
Year Ended
12/31/17 12/31/16 Net Assets
Decrease during period (334,161) (138,163) Beginning of period 22,692,523 22,830,686
End of period $ 22,358,362 $ 22,692,523
Undistributed net investment income – 5,639
*Share information
Shares sold Investor Class 33,062 50,120 Advisor Class 1,746 3,242 R Class 483 797 I Class 30,766 124,094
Distributions reinvested Investor Class 45,610 42,209 Advisor Class 1,117 1,247 R Class 258 312 I Class 11,060 7,773
Shares redeemed Investor Class (138,945) (274,717) Advisor Class (6,773) (12,046) R Class (2,019) (3,998) I Class (26,701) (20,229)
Decrease in shares outstanding (50,336) (81,196)

Proof #6
36
T. Rowe Price Equity Income Fund December 31, 2017
Notes to Financial Statements
T. Rowe Price Equity Income Fund (the fund) is registered under the Investment Company Act of 1940 (the 1940 Act) as a diversified, open-end management investment company. The fund, organized as a Maryland corporation, is the successor to the T. Rowe Price Equity Income Fund pursuant to an agreement and plan of reorganization for a change in domicile, effective October 30, 2017. The reorganization and redomiciliation had no effect on the fund’s investment objective and strategies or on the fund’s net assets. The fund seeks a high level of dividend income and long-term capital growth primarily through investments in stocks. The fund has four classes of shares: the Equity Income Fund (Investor Class), the Equity Income Fund–Advisor Class (Advisor Class), the Equity Income Fund–R Class (R Class), and the Equity Income Fund–I Class (I Class). Advisor Class shares are sold only through unaffiliated brokers and other unaffiliated financial intermediaries, and R Class shares are available to retirement plans serviced by intermediaries. I Class shares generally are available only to investors meeting a $1,000,000 minimum investment or certain other criteria. The Advisor Class and R Class each operate under separate Board-approved Rule 12b-1 plans, pursuant to which each class compensates financial intermediaries for distribution, shareholder servicing, and/or certain administrative services; the Investor and I Classes do not pay Rule 12b-1 fees. Each class has exclusive voting rights on matters related solely to that class; separate voting rights on matters that relate to all classes; and, in all other respects, the same rights and obligations as the other classes.
NOTE 1 - SIGNIfICaNT aCCOuNTING POLICIES
Basis of Preparation The fund is an investment company and follows accounting and reporting guidance in the Financial Accounting Standards Board (FASB) Accounting Standards Codification Topic 946 (ASC 946). The accompanying financial statements were prepared in accordance with accounting principles generally accepted in the United States of America (GAAP), including, but not limited to, ASC 946. GAAP requires the use of estimates made by management. Management believes that estimates and valuations are appropriate; however, actual results may differ from those estimates, and the valuations reflected in the accompanying financial statements may differ from the value ultimately realized upon sale or maturity.

Proof #6
37
T. Rowe Price Equity Income Fund
Investment Transactions, Investment Income, and Distributions Investment transactions are accounted for on the trade date basis. Income and expenses are recorded on the accrual basis. Realized gains and losses are reported on the identified cost basis. Premiums and discounts on debt securities are amortized for financial reporting purposes. Dividends received from mutual fund investments are reflected as dividend income; capital gain distributions are reflected as realized gain/loss. Dividend income and capital gain distributions are recorded on the ex-dividend date. Income tax-related interest and penalties, if incurred, are recorded as income tax expense. Distributions from REITs are initially recorded as dividend income and, to the extent such represent a return of capital or capital gain for tax purposes, are reclassified when such information becomes available. Income distributions are declared and paid by each class quarterly. Distributions to shareholders are recorded on the ex-dividend date. A capital gain distribution may also be declared and paid by the fund annually.
Currency Translation Assets, including investments, and liabilities denominated in foreign currencies are translated into U.S. dollar values each day at the prevailing exchange rate, using the mean of the bid and asked prices of such currencies against U.S. dollars as quoted by a major bank. Purchases and sales of securities, income, and expenses are translated into U.S. dollars at the prevailing exchange rate on the respective date of such transaction. The portion of the results of operations attributable to changes in foreign exchange rates on investments is not bifurcated from the portion attributable to changes in market prices. The effect of changes in foreign currency exchange rates on realized and unrealized security gains and losses is reflected as a component of security gains and losses.
Class accounting Shareholder servicing, prospectus, and shareholder report expenses incurred by each class are charged directly to the class to which they relate. Expenses common to all classes, investment income, and realized and unrealized gains and losses are allocated to the classes based upon the relative daily net assets of each class. To the extent any expenses are waived or reimbursed in accordance with an expense limitation (see Note 6), the waiver or reimbursement is charged to the applicable class or allocated across the classes in the same manner as the related expense. The Advisor Class and R Class each pay Rule 12b-1 fees, in an amount not exceeding 0.25% and 0.50%, respectively, of the class’s average daily net assets.

Proof #6
38
T. Rowe Price Equity Income Fund
Rebates Subject to best execution, the fund may direct certain security trades to brokers who have agreed to rebate a portion of the related brokerage commission to the fund in cash. Commission rebates are reflected as realized gain on securities in the accompanying financial statements and totaled $144,000 for the year ended December 31, 2017.
In-kind Redemptions In accordance with guidelines described in the fund’s prospectus, and when considered to be in the best interest of all shareholders, the fund may distribute portfolio securities rather than cash as payment for a redemption of fund shares (in-kind redemption). Gains and losses realized on in-kind redemptions are not recognized for tax purposes and are reclassified from undistributed realized gain (loss) to paid-in capital. During the year ended December 31, 2017, the fund realized $542,179,000 of net gain on $1,206,417,000 of in-kind redemptions.
New accounting Guidance In March 2017, the FASB issued amended guidance to shorten the amortization period for certain callable debt securities, held at a premium. The guidance is effective for fiscal years and interim periods beginning after December 15, 2018. Adoption will have no effect on the fund’s net assets or results of operations.
On August 1, 2017, the fund implemented amendments to Regulation S-X, issued by the Securities and Exchange Commission, which require standardized, enhanced disclosures, particularly related to derivatives, in investment company financial statements. Adoption had no effect on the fund’s net assets or results of operations.
Indemnification In the normal course of business, the fund may provide indemnification in connection with its officers and directors, service providers, and/or private company investments. The fund’s maximum exposure under these arrangements is unknown; however, the risk of material loss is currently considered to be remote.
NOTE 2 - vaLuaTION
The fund’s financial instruments are valued and each class’s net asset value (NAV) per share is computed at the close of the New York Stock Exchange (NYSE), normally 4 p.m. ET, each day the NYSE is open for business. However, the NAV per share may be calculated at a time other than the normal close of the NYSE if trading on the NYSE is restricted, if the NYSE closes earlier, or as may be permitted by the SEC.

Proof #6
39
T. Rowe Price Equity Income Fund
fair value The fund’s financial instruments are reported at fair value, which GAAP defines as the price that would be received to sell an asset or paid to transfer a liability in an orderly transaction between market participants at the measurement date. The T. Rowe Price Valuation Committee (the Valuation Committee) is an internal committee that has been delegated certain responsibilities by the fund’s Board of Directors (the Board) to ensure that financial instruments are appropriately priced at fair value in accordance with GAAP and the 1940 Act. Subject to oversight by the Board, the Valuation Committee develops and oversees pricing-related policies and procedures and approves all fair value determinations. Specifically, the Valuation Committee establishes procedures to value securities; determines pricing techniques, sources, and persons eligible to effect fair value pricing actions; oversees the selection, services, and performance of pricing vendors; oversees valuation-related business continuity practices; and provides guidance on internal controls and valuation-related matters. The Valuation Committee reports to the Board and has representation from legal, portfolio management and trading, operations, risk management, and the fund’s treasurer.
Various valuation techniques and inputs are used to determine the fair value of financial instruments. GAAP establishes the following fair value hierarchy that categorizes the inputs used to measure fair value:
Level 1 – quoted prices (unadjusted) in active markets for identical financial instruments that the fund can access at the reporting date
Level 2 – inputs other than Level 1 quoted prices that are observable, either directly or indirectly (including, but not limited to, quoted prices for similar financial instruments in active markets, quoted prices for identical or similar financial instruments in inactive markets, interest rates and yield curves, implied volatilities, and credit spreads)
Level 3 – unobservable inputs
Observable inputs are developed using market data, such as publicly available information about actual events or transactions, and reflect the assumptions that market participants would use to price the financial instrument. Unobservable inputs are those for which market data are not available and are developed using the best information available about the assumptions that market participants would use to price the financial instrument. GAAP requires valuation techniques to maximize the use of relevant observable inputs and minimize the use of unobservable inputs. When multiple inputs are used to derive fair value, the financial instrument is assigned to the level within the fair value hierarchy based
Proof #6
40
T. Rowe Price Equity Income Fund
on the lowest-level input that is significant to the fair value of the financial instrument. Input levels are not necessarily an indication of the risk or liquidity associated with financial instruments at that level but rather the degree of judgment used in determining those values.
valuation Techniques Equity securities listed or regularly traded on a securities exchange or in the over-the-counter (OTC) market are valued at the last quoted sale price or, for certain markets, the official closing price at the time the valuations are made. OTC Bulletin Board securities are valued at the mean of the closing bid and asked prices. A security that is listed or traded on more than one exchange is valued at the quotation on the exchange determined to be the primary market for such security. Listed securities not traded on a particular day are valued at the mean of the closing bid and asked prices for domestic securities and the last quoted sale or closing price for international securities.
For valuation purposes, the last quoted prices of non-U.S. equity securities may be adjusted to reflect the fair value of such securities at the close of the NYSE. If the fund determines that developments between the close of a foreign market and the close of the NYSE will affect the value of some or all of its portfolio securities, the fund will adjust the previous quoted prices to reflect what it believes to be the fair value of the securities as of the close of the NYSE. In deciding whether it is necessary to adjust quoted prices to reflect fair value, the fund reviews a variety of factors, including developments in foreign markets, the performance of U.S. securities markets, and the performance of instruments trading in U.S. markets that represent foreign securities and baskets of foreign securities. The fund may also fair value securities in other situations, such as when a particular foreign market is closed but the fund is open. The fund uses outside pricing services to provide it with quoted prices and information to evaluate or adjust those prices. The fund cannot predict how often it will use quoted prices and how often it will determine it necessary to adjust those prices to reflect fair value. As a means of evaluating its security valuation process, the fund routinely compares quoted prices, the next day’s opening prices in the same markets, and adjusted prices.
Actively traded equity securities listed on a domestic exchange generally are categorized in Level 1 of the fair value hierarchy. Non-U.S. equity securities generally are categorized in Level 2 of the fair value hierarchy despite the availability of quoted prices because, as described above, the fund evaluates and determines whether those quoted prices reflect fair value at the close of the NYSE or require adjustment. OTC Bulletin Board securities, certain preferred securities, and equity securities traded in inactive markets generally are categorized in Level 2 of the fair value hierarchy.

Proof #6
41
T. Rowe Price Equity Income Fund
Debt securities generally are traded in the OTC market. Securities with remaining maturities of one year or more at the time of acquisition are valued at prices furnished by dealers who make markets in such securities or by an independent pricing service, which considers the yield or price of bonds of comparable quality, coupon, maturity, and type, as well as prices quoted by dealers who make markets in such securities. Generally, debt securities are categorized in Level 2 of the fair value hierarchy.
Investments in mutual funds are valued at the mutual fund’s closing NAV per share on the day of valuation and are categorized in Level 1 of the fair value hierarchy. Assets and liabilities other than financial instruments, including short-term receivables and payables, are carried at cost, or estimated realizable value, if less, which approximates fair value.
Thinly traded financial instruments and those for which the above valuation procedures are inappropriate or are deemed not to reflect fair value are stated at fair value as determined in good faith by the Valuation Committee. The objective of any fair value pricing determination is to arrive at a price that could reasonably be expected from a current sale. Financial instruments fair valued by the Valuation Committee are primarily private placements, restricted securities, warrants, rights, and other securities that are not publicly traded.
Subject to oversight by the Board, the Valuation Committee regularly makes good faith judgments to establish and adjust the fair valuations of certain securities as events occur and circumstances warrant. For instance, in determining the fair value of an equity investment with limited market activity, such as a private placement or a thinly traded public company stock, the Valuation Committee considers a variety of factors, which may include, but are not limited to, the issuer’s business prospects, its financial standing and performance, recent investment transactions in the issuer, new rounds of financing, negotiated transactions of significant size between other investors in the company, relevant market valuations of peer companies, strategic events affecting the company, market liquidity for the issuer, and general economic conditions and events. In consultation with the investment and pricing teams, the Valuation Committee will determine an appropriate valuation technique based on available information, which may include both observable and unobservable inputs. The Valuation Committee typically will afford greatest weight to actual prices in arm’s length transactions, to the extent they represent orderly transactions between market participants, transaction information can be reliably obtained, and prices are deemed representative of fair value. However, the Valuation Committee may also consider other valuation methods

Proof #6
42
T. Rowe Price Equity Income Fund
such as market-based valuation multiples; a discount or premium from market value of a similar, freely traded security of the same issuer; or some combination. Fair value determinations are reviewed on a regular basis and updated as information becomes available, including actual purchase and sale transactions of the issue. Because any fair value determination involves a significant amount of judgment, there is a degree of subjectivity inherent in such pricing decisions, and fair value prices determined by the Valuation Committee could differ from those of other market participants. Depending on the relative significance of unobservable inputs, including the valuation technique(s) used, fair valued securities may be categorized in Level 2 or 3 of the fair value hierarchy.
valuation Inputs The following table summarizes the fund’s financial instruments, based on the inputs used to determine their fair values on December 31, 2017:
($000s) Level 1 Level 2 Level 3 Total value
Quoted Prices
Significant Observable
Inputs
Significant unobservable
Inputs
InvestmentsinSecurities,except: $ 449,522 $ — $ — $ 449,522
CommonStocks 20,633,837 799,826 — 21,433,663
ConvertiblePreferredStocks — 354,744 — 354,744
CorporateBonds — 104,769 — 104,769
Total $ 21,083,359 $ 1,259,339 $ — $ 22,342,698
There were no material transfers between Levels 1 and 2 during the year ended December 31, 2017.
NOTE 3 - DERIvaTIvE INSTRuMENTS
During the year ended December 31, 2017, the fund invested in derivative instruments. As defined by GAAP, a derivative is a financial instrument whose value is derived from an underlying security price, foreign exchange rate, interest rate, index of prices or rates, or other variable; it requires little or no initial investment and permits or requires net settlement. The fund

Proof #6
43
T. Rowe Price Equity Income Fund
invests in derivatives only if the expected risks and rewards are consistent with its investment objectives, policies, and overall risk profile, as described in its prospectus and Statement of Additional Information. The fund may use derivatives for a variety of purposes, such as seeking to hedge against declines in principal value, increase yield, invest in an asset with greater efficiency and at a lower cost than is possible through direct investment, or to adjust credit exposure. The risks associated with the use of derivatives are different from, and potentially much greater than, the risks associated with investing directly in the instruments on which the derivatives are based. The fund at all times maintains sufficient cash reserves, liquid assets, or other SEC-permitted asset types to cover its settlement obligations under open derivative contracts.
The fund values its derivatives at fair value and recognizes changes in fair value currently in its results of operations. Accordingly, the fund does not follow hedge accounting, even for derivatives employed as economic hedges. Generally, the fund accounts for its derivatives on a gross basis. It does not offset the fair value of derivative liabilities against the fair value of derivative assets on its financial statements, nor does it offset the fair value of derivative instruments against the right to reclaim or obligation to return collateral. As of December 31, 2017, the fund held no derivative instruments.
Additionally, during the year ended December 31, 2017, the fund recognized $4,244,000 of gain on equity derivatives, included in realized gain(loss) on Futures on the accompanying Statement of Operations.
futures Contracts The fund is subject to equity price risk in the normal course of pursuing its investment objectives and uses futures contracts to help manage such risk. The fund may enter into futures contracts to manage exposure to interest rates, security prices, foreign currencies, and credit quality; as an efficient means of adjusting exposure to all or part of a target market; to enhance income; as a cash management tool; or to adjust credit exposure. A futures contract provides for the future sale by one party and purchase by another of a specified amount of a specific underlying financial instrument at an agreed-upon price, date, time, and place. The fund currently invests only in exchange-traded futures, which generally are standardized as to maturity date, underlying financial instrument, and other contract terms. Payments are made or received by the fund each day to settle daily fluctuations in the value of the contract (variation margin), which reflect changes in the value of the underlying financial instrument. Variation margin is recorded as unrealized gain or loss until the contract is closed. The value of a futures contract included

Proof #6
44
T. Rowe Price Equity Income Fund
in net assets is the amount of unsettled variation margin; net variation margin receivable is reflected as an asset and net variation margin payable is reflected as a liability on the accompanying Statement of Assets and Liabilities. Risks related to the use of futures contracts include possible illiquidity of the futures markets, contract prices that can be highly volatile and imperfectly correlated to movements in hedged security values, and potential losses in excess of the fund’s initial investment. During the year ended December 31, 2017, the volume of the fund’s activity in futures, based on underlying notional amounts, was generally less than 1% of net assets.
NOTE 4 - OTHER INvESTMENT TRaNSaCTIONS
Consistent with its investment objective, the fund engages in the following practices to manage exposure to certain risks and/or to enhance performance. The investment objective, policies, program, and risk factors of the fund are described more fully in the fund’s prospectus and Statement of Additional Information.
Restricted Securities The fund may invest in securities that are subject to legal or contractual restrictions on resale. Prompt sale of such securities at an acceptable price may be difficult and may involve substantial delays and additional costs.
Other Purchases and sales of portfolio securities other than short-term securities aggregated $4,415,244,000 and $7,587,495,000, respectively, for the year ended December 31, 2017.
NOTE 5 - fEDERaL INCOME TaXES
No provision for federal income taxes is required since the fund intends to continue to qualify as a regulated investment company under Subchapter M of the Internal Revenue Code and distribute to shareholders all of its taxable income and gains. Distributions determined in accordance with federal income tax regulations may differ in amount or character from net investment income and realized gains for financial reporting purposes. Financial reporting records are adjusted for permanent book/tax differences to reflect tax character but are not adjusted for temporary differences.

Proof #6
45
T. Rowe Price Equity Income Fund
The fund files U.S. federal, state, and local tax returns as required. The fund’s tax returns are subject to examination by the relevant tax authorities until expiration of the applicable statute of limitations, which is generally three years after the filing of the tax return but which can be extended to six years in certain circumstances. Tax returns for open years have incorporated no uncertain tax positions that require a provision for income taxes.
Reclassifications to paid-in capital relate primarily to redemptions in kind and a tax practice that treats a portion of the proceeds from each redemption of capital shares as a distribution of taxable net investment income or realized capital gain. Reclassifications between income and gain relate primarily to per-share rounding of distributions. For the year ended December 31, 2017, the following reclassifications were recorded to reflect tax character (there was no impact on results of operations or net assets):
Undistributednetinvestmentincome $ 86
Undistributednetrealizedgain (794,991)
Paid-incapital 794,905
($000s)
Distributions during the years ended December 31, 2017 and December 31, 2016, were characterized for tax purposes as follows:
($000s)
December 312017 2016
Ordinaryincome $ 497,969 $ 559,495
Long-termcapitalgain 1,522,984 1,133,078
Totaldistributions $ 2,020,953 $ 1,692,573

Proof #6
46
T. Rowe Price Equity Income Fund
At December 31, 2017, the tax-basis cost of investments, including derivatives, and components of net assets were as follows:
Costofinvestments $ 15,326,200
Unrealizedappreciation $ 7,413,759
Unrealizeddepreciation (427,910)
Netunrealizedappreciation(depreciation) 6,985,849
Undistributedordinaryincome 23,638
Undistributedlong-termcapitalgain 356,678
Late-yearordinarylossdeferrals (52)
Paid-incapital 14,992,249
Netassets $ 22,358,362
($000s)
The difference between book-basis and tax-basis net unrealized appreciation (depreciation) is attributable to the deferral of losses from wash sales for tax purposes. In accordance with federal tax laws applicable to investment companies, net specified losses realized between November 1 and December 31 are not recognized for tax purposes until the subsequent year (late-year ordinary loss deferrals); however, such losses are recognized for financial reporting purposes in the year realized.
NOTE 6 - RELaTED PaRTY TRaNSaCTIONS
The fund is managed by T. Rowe Price Associates, Inc. (Price Associates), a wholly owned subsidiary of T. Rowe Price Group, Inc. (Price Group). The investment management agreement between the fund and Price Associates provides for an annual investment management fee, which is computed daily and paid monthly. The fee consists of an individual fund fee and a group fee. The individual fund fee is equal to 0.25% of the fund’s average daily net assets up to $15 billion and 0.2125% of the fund’s average daily net assets in excess of $15 billion. The group fee rate is calculated based on the combined net assets of certain mutual funds sponsored by Price Associates (the group) applied to a graduated fee schedule, with rates ranging from 0.48% for the first $1 billion of assets to 0.265% for assets in excess of $650 billion. The fund’s group fee is determined by applying the group fee rate to the fund’s average daily net assets. At December 31, 2017, the effective annual group fee rate was 0.29%.

Proof #6
47
T. Rowe Price Equity Income Fund
The I Class is subject to an operating expense limitation (I Class limit) pursuant to which Price Associates is contractually required to pay all operating expenses of the I Class, excluding management fees, interest, expenses related to borrowings, taxes, brokerage, and other non-recurring expenses permitted by the investment management agreement, to the extent such operating expenses, on an annualized basis, exceed 0.05% of average net assets. This agreement will continue until April 30, 2018, and may be renewed, revised, or revoked only with approval of the fund’s Board. The I Class is required to repay Price Associates for expenses previously paid to the extent the class’s net assets grow or expenses decline sufficiently to allow repayment without causing the class’s operating expenses (after the repayment is taken into account) to exceed both: (1) the expense limitation in place at the time such amounts were paid; and (2) the class’s current expense limitation. However, no repayment will be made more than three years after the date of a payment or waiver. For the year ended December 31, 2017, the I Class operated below its expense limitation.
In addition, the fund has entered into service agreements with Price Associates and two wholly owned subsidiaries of Price Associates (collectively, Price). Price Associates provides certain accounting and administrative services to the fund. T. Rowe Price Services, Inc. provides shareholder and administrative services in its capacity as the fund’s transfer and dividend-disbursing agent. T. Rowe Price Retirement Plan Services, Inc. provides subaccounting and recordkeeping services for certain retirement accounts invested in the Investor Class, R Class and I Class. For the year ended December 31, 2017, expenses incurred pursuant to these service agreements were $86,000 for Price Associates; $5,036,000 for T. Rowe Price Services, Inc.; and $3,250,000 for T. Rowe Price Retirement Plan Services, Inc. The total amount payable at period-end pursuant to these service agreements is reflected as Due to Affiliates in the accompanying financial statements.
Additionally, the fund is one of several mutual funds in which certain college savings plans managed by Price Associates may invest. As approved by the fund’s Board of Directors, shareholder servicing costs associated with each college savings plan are borne by the fund in proportion to the average daily value of its shares owned by the college savings plan. For the year ended December 31, 2017, the fund was charged $539,000 for shareholder servicing costs related to the college savings plans, of which $348,000 was for services provided by Price. The amount payable at period-end pursuant to

Proof #6
48
T. Rowe Price Equity Income Fund
this agreement is reflected as Due to Affiliates in the accompanying financial statements. At December 31, 2017, approximately 2% of the outstanding shares of the Investor Class were held by college savings plans.
The fund is also one of several mutual funds sponsored by Price Associates (underlying Price funds) in which the T. Rowe Price Spectrum Funds (Spectrum Funds) may invest. The Spectrum Funds do not invest in the underlying Price funds for the purpose of exercising management or control. Pursuant to special servicing agreements, expenses associated with the operation of the Spectrum Funds are borne by each underlying Price fund to the extent of estimated savings to it and in proportion to the average daily value of its shares owned by the Spectrum Funds. Expenses allocated under these special servicing agreements are reflected as shareholder servicing expense in the accompanying financial statements. For the year ended December 31, 2017, the fund was allocated $1,375,000 of Spectrum Funds’ expenses. Of these amounts, $913,000 related to services provided by Price. At period-end, the amount payable to Price pursuant to these special servicing agreements are reflected as Due to Affiliates in the accompanying financial statements. At December 31, 2017, approximately 7% of the outstanding shares of the Investor Class were held by the Spectrum Funds.
The fund may invest its cash reserves in certain open-end management investment companies managed by Price Associates and considered affiliates of the fund: the T. Rowe Price Government Reserve Fund or the T. Rowe Price Treasury Reserve Fund, organized as money market funds, or the T. Rowe Price Short-Term Fund, a short-term bond fund (collectively, the Price Reserve Funds). The Price Reserve Funds are offered as short-term investment options to mutual funds, trusts, and other accounts managed by Price Associates or its affiliates and are not available for direct purchase by members of the public. Cash collateral from securities lending is invested in the T. Rowe Price Short-Term Fund. The Price Reserve Funds pay no investment management fees.
The fund may also invest in certain other T. Rowe Price funds (Price Funds) as a means of gaining efficient and cost-effective exposure to certain markets. The fund does not invest for the purpose of exercising management or control; however, investments by the fund may represent a significant portion of an underlying Price Fund’s net assets. Each underlying Price Fund is an open-end management investment company managed by Price Associates and is considered an affiliate of the fund. To ensure that the fund does not

Proof #6
49
T. Rowe Price Equity Income Fund
incur duplicate management fees (paid by the underlying Price Fund(s) and the fund), Price Associates has agreed to permanently waive a portion of its management fee charged to the fund in an amount sufficient to fully offset that portion of management fees paid by each underlying Price Fund related to the fund’s investment therein. Annual management fee rates and amounts waived related to investments in the underlying Price Fund(s) for the year ended December 31, 2017, are as follows:
($000s) Effective Management
fee RateManagement
fee Waived
T.RowePriceInstitutionalFloatingRateFund 0.55% $ 349
The fund may participate in securities purchase and sale transactions with other funds or accounts advised by Price Associates (cross trades), in accordance with procedures adopted by the fund’s Board and Securities and Exchange Commission rules, which require, among other things, that such purchase and sale cross trades be effected at the independent current market price of the security. During the year ended December 31, 2017, the aggregate value of purchases and sales cross trades with other funds or accounts advised by Price Associates was less than 1% of the fund’s net assets as of December 31, 2017.
On June 6, 2016, Price Associates offered, and the fund’s Board of Directors accepted, a voluntary payment to compensate the fund for a loss of value on its investment in Dell as a result of the fund’s ineligibility to pursue an appraisal action in Delaware court of Chancery due to a proxy voting error in 2013. The amount paid by Price Associates remains subject to further increase or decrease in the event of a court-determined change in the fair valuation of Dell shares on appeal, or payment received by the fund from any other source to compensate for the loss of value on its Dell shares. On December 14, 2017, the Delaware Supreme Court reversed the Court of Chancery’s enhanced valuation of Dell shares (appraisal value) and remanded the case to the Court of Chancery for further proceedings. While the ultimate outcome of the proceedings is uncertain, based on the language in the Delaware Supreme Court’s opinion, Price Associates believes it probable that the fair valuation of Dell shares will ultimately be reduced below the appraisal value. Accordingly, the fund has recorded a liability reflecting a contingent repayment to Price Associates (repayment) based on an estimated reduction of the fair valuation

Proof #6
50
T. Rowe Price Equity Income Fund
of Dell shares. The impact of recording this liability on the fund’s results from operation is reflected separately under change in net unrealized gain/loss in the accompanying financial statements. The fund’s liability may be increased by an amount up to the full amount initially paid by Price Associates $86,642,000, or decreased as additional information becomes available in the future; however no repayment will be made unless or until there is a final, non-appealable judgment in the appraisal action, or payment is received by the fund from any other source to compensate for the loss of value on its Dell shares.
NOTE 7 - LITIGaTION
The fund is a named defendant or in a class of defendants in a lawsuit that the Unsecured Creditors Committee (the Committee) of the Tribune Company has filed in Delaware bankruptcy court. The Committee is seeking to recover all payments made to beneficial owners of common stock in connection with a leveraged buyout (LBO) of Tribune, including those made in connection with a 2007 tender offer in which the fund participated. A motion to dismiss was filed in this case and the district court granted the motion on January 9, 2017. The fund was named, also, as a defendant or included in a class of defendants in parallel litigation, which was dismissed by district court and affirmed on appeal by the Second Circuit Court of Appeals. This second action asserted state law constructive fraudulent transfer claims in an attempt to recover stock redemption payments made to shareholders at the time of the LBO. The plaintiffs in this second action filed a petition for a writ of certiorari with the U.S. Supreme Court. The U.S. Supreme Court removed the petition from its December 9, 2016 calendar and the matter has not yet been rescheduled. The complaints allege no misconduct by the fund, and management has vigorously defended the lawsuits. The value of the proceeds received by the fund is $312,460,000 (1.40% of net assets), and the fund will incur legal expenses. Management is currently assessing the case and has not yet determined the effect, if any, on the fund’s net assets and results of operations.

Proof #6
51
T. Rowe Price Equity Income Fund
Report of Independent Registered Public Accounting Firm
To the Board of Directors and Shareholders of T. Rowe Price Equity Income fund, Inc.
Opinion on the Financial Statements
We have audited the accompanying statement of assets and liabilities, including the portfolio of investments, of T. Rowe Price Equity Income Fund, Inc. (the “Fund”) as of December 31, 2017, the related statement of operations for the year ended December 31, 2017, the statement of changes in net assets for each of the two years in the period ended December 31, 2017, including the related notes, and the financial highlights for each of the periods indicated therein (collectively referred to as the “financial statements”). In our opinion, the financial statements present fairly, in all material respects, the financial position of the Fund as of December 31, 2017, the results of its operations for the year then ended, the changes in its net assets for each of the two years in the period ended December 31, 2017 and the financial highlights for each of the periods indicated therein, in conformity with accounting principles generally accepted in the United States of America.
Basis for Opinion
These financial statements are the responsibility of the Fund’s management. Our responsibility is to express an opinion on the Fund’s financial statements based on our audits. We are a public accounting firm registered with the Public Company Accounting Oversight Board (United States) (“PCAOB”) and are required to be independent with respect to the Fund in accordance with the U.S. federal securities laws and the applicable rules and regulations of the Securities and Exchange Commission and the PCAOB.
We conducted our audits of these financial statements in accordance with the standards of the PCAOB. Those standards require that we plan and perform the audit to obtain reasonable assurance about whether the financial statements are free of material misstatement, whether due to error or fraud.

Proof #6
52
T. Rowe Price Equity Income Fund
Report of Independent Registered Public Accounting Firm (continued)
Our audits included performing procedures to assess the risks of material misstatement of the financial statements, whether due to error or fraud, and performing procedures that respond to those risks. Such procedures included examining, on a test basis, evidence regarding the amounts and disclosures in the financial statements. Our audits also included evaluating the accounting principles used and significant estimates made by management, as well as evaluating the overall presentation of the financial statements. Our procedures included confirmation of securities owned as of December 31, 2017 by correspondence with the custodians, transfer agent and brokers; when replies were not received from brokers, we performed other auditing procedures. We believe that our audits provide a reasonable basis for our opinion.
PricewaterhouseCoopers LLPBaltimore, MarylandFebruary 15, 2018
We have served as the auditor of one or more investment companies in the T. Rowe Price group of investment companies since 1973.

Proof #6
53
T. Rowe Price Equity Income Fund
Tax Information (Unaudited) for the Tax Year Ended 12/31/17
WeareprovidingthisinformationasrequiredbytheInternalRevenueCode.Theamountsshownmaydifferfromthoseelsewhereinthisreportbecauseofdifferencesbetweentaxandfinancialreportingrequirements.
Thefund’sdistributionstoshareholdersincluded:
• $98,291,000fromshort-termcapitalgains
• $1,742,021,000fromlong-termcapitalgains,ofwhich$1,740,408,000wassubjecttoalong-termcapitalgainstaxrateofnotgreaterthan20%,and$1,613,000toalong-termcapitalgainstaxrateofnotgreaterthan25%.
Fortaxablenon-corporateshareholders,$527,646,000ofthefund’sincomerepresentsqualifieddividendincomesubjecttoalong-termcapitalgainstaxrateofnotgreaterthan20%.
Forcorporateshareholders,$493,848,000ofthefund’sincomequalifiesforthedividends-receiveddeduction.
AdescriptionofthepoliciesandproceduresusedbyT.RowePricefundsandportfoliostodeterminehowtovoteproxiesrelatingtoportfoliosecuritiesisavailableineachfund’sStatementofAdditionalInformation.Youmayrequestthisdocumentbycalling1-800-225-5132orbyaccessingtheSEC’swebsite,sec.gov.
Thedescriptionofourproxyvotingpoliciesandproceduresisalsoavailableonourcorporatewebsite.Toaccessit,pleasevisitthefollowingWebpage:
https://www3.troweprice.com/usis/corporate/en/utility/policies.html
Scrolldowntothesectionnearthebottomofthepagethatsays,“ProxyVotingPolicies.”ClickontheProxyVotingPolicieslinkintheshadedbox.
Eachfund’smostrecentannualproxyvotingrecordisavailableonourwebsiteandthroughtheSEC’swebsite.ToaccessitthroughT.RowePrice,visitthewebsitelocationshownabove,andscrolldowntothesectionnearthebottomofthepagethatsays,“ProxyVotingRecords.”ClickontheProxyVotingRecordslinkintheshadedbox.
Information on Proxy Voting Policies, Procedures, and Records
ThefundfilesacompletescheduleofportfolioholdingswiththeSecuritiesandExchangeCommissionforthefirstandthirdquartersofeachfiscalyearonFormN-Q.Thefund’sFormN-QisavailableelectronicallyontheSEC’swebsite(sec.gov);hardcopiesmaybereviewedandcopiedattheSEC’sPublicReferenceRoom,100FSt.N.E.,Washington,DC20549.FormoreinformationonthePublicReferenceRoom,call1-800-SEC-0330.
How to Obtain Quarterly Portfolio Holdings

Proof #6
54
T. Rowe Price Equity Income Fund
About the Fund’s Directors and Officers
YourfundisoverseenbyaBoardofDirectors(Board)thatmeetsregularlytoreviewawidevarietyofmattersaffectingorpotentiallyaffectingthefund,includingperformance,investmentprograms,compliancematters,advisoryfeesandexpenses,serviceproviders,andbusinessandregulatoryaffairs.TheBoardelectsthefund’sofficers,whoarelistedinthefinaltable.Atleast75%oftheBoard’smembersareindependentofT.RowePriceAssociates,Inc.(T.RowePrice),anditsaffiliates;“inside”or“interested”directorsareemployeesorofficersofT.RowePrice.Thebusinessaddressofeachdirectorandofficeris100EastPrattStreet,Baltimore,Maryland21202.TheStatementofAdditionalInformationincludesadditionalinformationaboutthefunddirectorsandisavailablewithoutchargebycallingaT.RowePricerepresentativeat1-800-638-5660.
Independent Directors
Name(Year of Birth)Year Elected*[Number of T. Rowe PricePortfolios Overseen]
Principal Occupation(s) and Directorships of Public Companies and Other Investment Companies During the Past five Years
BruceW.Duncan(1951)2013[191]
ChiefExecutiveOfficerandDirector(2009toDecember2016),ChairmanoftheBoard(January2016topresent),andPresident(2009toSeptember2016),FirstIndustrialRealtyTrust,anownerandoperatorofindustrialproperties;ChairmanoftheBoard(2005toSeptember2016)andDirector(1999toSeptember2016),StarwoodHotels&Resorts,ahotelandleisurecompany;Director,BostonProperties(May2016topresent);Director,MarriottInternational,Inc.(September2016topresent)
RobertJ.Gerrard,Jr.(1952)2012[191]
AdvisoryBoardMember,PipelineCrisis/WinningStrategies,acollaborativeworkingtoimproveopportunitiesforyoungAfricanAmericans(1997topresent)
PaulF.McBride(1956)2013[191]
AdvisoryBoardMember,VizziaTechnologies(2015topresent)
*Eachindependentdirectorservesuntilretirement,resignation,orelectionofasuccessor.

Proof #6
55
T. Rowe Price Equity Income Fund
Independent Directors (continued)
Name(Year of Birth)Year Elected*[Number of T. Rowe PricePortfolios Overseen]
Principal Occupation(s) and Directorships of Public Companies and Other Investment Companies During the Past five Years
CeciliaE.Rouse,Ph.D.(1963)2012[191]
Dean,WoodrowWilsonSchool(2012topresent);ProfessorandResearcher,PrincetonUniversity(1992topresent);MemberofNationalAcademyofEducation(2010topresent);Director,MDRC,anonprofiteducationandsocialpolicyresearchorganization(2011topresent);ResearchAssociateofLaborStudiesProgram(2011to2015)andBoardMember(2015topresent),NationalBureauofEconomicResearch(2011topresent);ChairofCommitteeontheStatusofMinorityGroupsintheEconomicProfession(2012topresent);VicePresident(2015topresent),AmericanEconomicAssociation
JohnG.Schreiber(1946)2001[191]
Owner/President,CentaurCapitalPartners,Inc.,arealestateinvestmentcompany(1991topresent);Cofounder,Partner,andCochairmanoftheInvestmentCommittee,BlackstoneRealEstateAdvisors,L.P.(1992to2015);Director,GeneralGrowthProperties,Inc.(2010to2013);Director,BlackstoneMortgageTrust,arealestatefinancecompany(2012to2016);DirectorandChairmanoftheBoard,BrixmorPropertyGroup,Inc.(2013topresent);Director,HiltonWorldwide(2013topresent);Director,HudsonPacificProperties(2014to2016)
MarkR.Tercek(1957)2009[191]
PresidentandChiefExecutiveOfficer,TheNatureConservancy(2008topresent)
*Eachindependentdirectorservesuntilretirement,resignation,orelectionofasuccessor.

Proof #6
56
T. Rowe Price Equity Income Fund
Inside Directors
Name(Year of Birth)Year Elected*[Number of T. Rowe Price Portfolios Overseen]
Principal Occupation(s) and Directorships of Public Companies and Other Investment Companies During the Past five Years
EdwardC.Bernard(1956)2006[191]
DirectorandVicePresident,T.RowePrice;ViceChairmanoftheBoard,Director,andVicePresident,T.RowePriceGroup,Inc.;ChairmanoftheBoard,Director,andVicePresident,T.RowePriceInvestmentServices,Inc.,andT.RowePriceServices,Inc.;ChairmanoftheBoardandDirector,T.RowePriceRetirementPlanServices,Inc.;ChairmanoftheBoard,ChiefExecutiveOfficer,Director,andPresident,T.RowePriceInternationalandT.RowePriceTrustCompany;ChairmanoftheBoard,allfunds
RobertW.Sharps,CFA,CPA**(1971)2017[135]
VicePresident,T.RowePrice,T.RowePriceGroup,Inc.,andT.RowePriceTrustCompany
*Eachinsidedirectorservesuntilretirement,resignation,orelectionofasuccessor.**EffectiveApril1,2017,BrianC.RogerswasreplacedbyRobertW.Sharpsasaninsidedirectorof
certainPriceFunds.
Officers
Name (Year of Birth)Position Held With Equity Income fund Principal Occupation(s)
JasonR.Adams(1979)VicePresident
VicePresidentT.RowePriceandT.RowePriceGroup,Inc.;formerly,ResearchAnalyst,CaxtonAssociates(to2015)
VinitAgrawal(1987)VicePresident
VicePresident,T.RowePriceandT.RowePriceGroup,Inc.
DarrellN.Braman(1963)VicePresidentandSecretary
VicePresident,PriceHongKong,PriceSingapore,T.RowePrice,T.RowePriceGroup,Inc.,T.RowePriceInternational,T.RowePriceInvestmentServices,Inc.,andT.RowePriceServices,Inc.
MarkS.Finn,CFA,CPA(1963)VicePresident
VicePresident,T.RowePrice,T.RowePriceGroup,Inc.,andT.RowePriceTrustCompany
Unlessotherwisenoted,officershavebeenemployeesofT.RowePriceorT.RowePriceInternationalforatleast5years.

Proof #6
57
T. Rowe Price Equity Income Fund
Officers (continued)
Name (Year of Birth)Position Held With Equity Income fund Principal Occupation(s)
JohnR.Gilner(1961)ChiefComplianceOfficer
ChiefComplianceOfficerandVicePresident,T.RowePrice;VicePresident,T.RowePriceGroup,Inc.,andT.RowePriceInvestmentServices,Inc.
RyanS.Hedrick,CFA(1980)VicePresident
VicePresident,T.RowePriceandT.RowePriceGroupInc.;formerly,Analyst,DavidsonKempnerCapitalManagement(to2013)
ShinwooKim(1977)VicePresident
VicePresident,T.RowePriceandT.RowePriceGroup,Inc.
PaulJ.Krug,CPA(1964)VicePresident
VicePresident,T.RowePrice,T.RowePriceGroup,Inc.,andT.RowePriceTrustCompany
JohnD.Linehan,CFA(1965)President
VicePresident,T.RowePrice,T.RowePriceGroup,Inc.,andT.RowePriceTrustCompany
DanielMartino,CFA(1974)VicePresident
VicePresident,T.RowePriceandT.RowePriceGroup,Inc.
GeorgeA.Marzano(1980)VicePresident
VicePresident,T.RowePriceandT.RowePriceGroup,Inc.
CatherineD.Mathews(1963)TreasurerandVicePresident
VicePresident,T.RowePrice,T.RowePriceGroup,Inc.,andT.RowePriceTrustCompany
HeatherK.McPherson,CPA(1967)VicePresident
VicePresident,T.RowePriceandT.RowePriceGroup,Inc.
DavidOestreicher(1967)VicePresident
Director,VicePresident,andSecretary,T.RowePriceInvestmentServices,Inc.,T.RowePriceRetirementPlanServices,Inc.,T.RowePriceServices,Inc.,andT.RowePriceTrustCompany;ChiefLegalOfficer,VicePresident,andSecretary,T.RowePriceGroup,Inc.;VicePresidentandSecretary,T.RowePriceandT.RowePriceInternational;VicePresident,PriceHongKongandPriceSingapore
KyleRasbach(1980)VicePresident
VicePresident,T.RowePriceandT.RowePriceGroup,Inc.;formerly,VicePresident,CowenandCompany(to2013)
Unlessotherwisenoted,officershavebeenemployeesofT.RowePriceorT.RowePriceInternationalforatleast5years.

Proof #6
58
T. Rowe Price Equity Income Fund
Officers (continued)
Name (Year of Birth)Position Held With Equity Income fund Principal Occupation(s)
JohnW.Ratzesberger(1975)VicePresident
VicePresident,T.RowePrice,T.RowePriceGroup,Inc.,andT.RowePriceTrustCompany;formerly,NorthAmericanHeadofListedDerivativesOperation,MorganStanley(to2013)
ShannonH.Rauser(1987)AssistantSecretary
Employee,T.RowePrice
MelanieA.Rizzo(1982)VicePresident
VicePresident,T.RowePrice
MatthewJ.Snowling,CFA(1971)VicePresident
VicePresident,T.RowePriceandT.RowePriceGroup,Inc.
MeganWarren(1968)VicePresident
VicePresident,T.RowePrice,T.RowePriceGroup,Inc.,T.RowePriceRetirementPlanServices,Inc.,T.RowePriceServices,Inc.,andT.RowePriceTrustCompany;formerly,ExecutiveDirector,JPMorganChase(to2017)
Unlessotherwisenoted,officershavebeenemployeesofT.RowePriceorT.RowePriceInternationalforatleast5years.

Proof #6
This page intentionally left blank.

Proof #6
This page intentionally left blank.

Proof #6
This page intentionally left blank.

Proof #6
F71-050 2/18
STOCk fuNDSDomestic Blue Chip GrowthCapital Appreciation‡
Capital OpportunityDiversified Mid-Cap GrowthDividend GrowthEquity IncomeEquity Index 500Extended Equity Market IndexFinancial ServicesGrowth & IncomeGrowth StockHealth Sciences‡
Media & TelecommunicationsMid-Cap Growth‡
Mid-Cap Value‡
New America GrowthNew EraNew Horizons‡
QM U.S. Small & Mid-Cap Core EquityQM U.S. Small-Cap Growth EquityQM U.S. Value EquityReal EstateScience & TechnologySmall-Cap Stock‡
Small-Cap ValueTax-Efficient Equity Total Equity Market IndexU.S. Large-Cap CoreValue
aSSET aLLOCaTION fuNDSBalanced Global AllocationPersonal Strategy BalancedPersonal Strategy GrowthPersonal Strategy IncomeReal AssetsSpectrum GrowthSpectrum IncomeSpectrum InternationalTarget Date Fundsˆ
BOND fuNDSDomestic TaxableCorporate IncomeCredit OpportunitiesFloating RateGNMA High Yield‡
Inflation Protected BondLimited Duration Inflation
Focused BondNew IncomeShort-Term BondTotal ReturnUltra Short-Term BondU.S. Bond Enhanced IndexU.S. High YieldU.S. Treasury IntermediateU.S. Treasury Long-Term
Domestic Tax-freeCalifornia Tax-Free BondGeorgia Tax-Free BondIntermediate Tax-Free High YieldMaryland Short-Term Tax-Free BondMaryland Tax-Free BondNew Jersey Tax-Free BondNew York Tax-Free BondSummit Municipal IncomeSummit Municipal IntermediateTax-Free High YieldTax-Free IncomeTax-Free Short-IntermediateVirginia Tax-Free Bond
MONEY MaRkET fuNDSTaxableCash Reserves1
Government Money2
U.S. Treasury Money2
MONEY MaRkET fuNDS (cont.)Tax-freeCalifornia Tax-Free Money1
Maryland Tax-Free Money1
New York Tax-Free Money1
Summit Municipal Money Market1
Tax-Exempt Money1
INTERNaTIONaL/GLOBaL fuNDSStockAfrica & Middle EastAsia OpportunitiesEmerging EuropeEmerging Markets StockEmerging Markets Value StockEuropean Stock Global ConsumerGlobal Growth StockGlobal IndustrialsGlobal Real EstateGlobal StockGlobal Technology‡
International Concentrated EquityInternational DiscoveryInternational Equity IndexInternational StockInternational Value EquityJapanLatin AmericaNew AsiaOverseas StockQM Global Equity
BondDynamic Global BondEmerging Markets BondEmerging Markets Corporate BondEmerging Markets Local Currency BondGlobal High Income BondGlobal Multi-Sector BondInternational BondInternational Bond (USD Hedged)
T.RowePriceInvestmentServices,Inc.100EastPrattStreetBaltimore,MD21202
Thispagecontainssupplementaryinformationthatisnotpartoftheshareholderreport.
T. Rowe Price Mutual Funds
201802-366086
Call 1-800-225-5132 to request a prospectus or summary prospectus; each includes investment objectives, risks, fees, expenses, and other information that you should read and consider carefully before investing. ‡Subjecttocertainexceptions,thefundiscurrentlyclosedtonewinvestorsandnewaccounts.
ˆTheTargetDateFundsareinclusiveoftheRetirementFunds,theTargetFunds,andtheRetirementBalancedFund.
1 Retail Funds: You could lose money by investing in the Fund. Although the Fund seeks to preserve the value of your investment at $1.00 per share, it cannot guarantee it will do so. Beginning October 14, 2016, the Fund may impose a fee upon the sale of your shares or may temporarily suspend your ability to sell shares if the Fund’s liquidity falls below required minimums because of market conditions or other factors. An investment in the Fund is not insured or guaranteed by the Federal Deposit Insurance Corporation or any other government agency. The Fund’s sponsor has no legal obligation to provide financial support to the Fund, and you should not expect that the sponsor will provide financial support to the Fund at any time.
2 Government Funds: You could lose money by investing in the Fund. Although the Fund seeks to preserve the value of your investment at $1.00 per share, it cannot guarantee it will do so. An investment in the Fund is not insured or guaranteed by the Federal Deposit Insurance Corporation or any other government agency. The Fund’s sponsor has no legal obligation to provide financial support to the Fund, and you should not expect that the sponsor will provide financial support to the Fund at any time.