December 2020 Investment Management Committee Book
84
December 2020 Investment Management Teacher Retirement System of Texas 1000 Red River Street Austin, Texas 78701-2698
Transcript of December 2020 Investment Management Committee Book
December 2020
Investment Management
Teacher Retirement System of Texas 1000 Red River Street Austin, Texas 78701-2698


NOTE: The Board of Trustees (Board) of the Teacher Retirement System of Texas will not consider or act upon any item before the Investment Management Committee (Committee) at this meeting of the Committee. This meeting is not a regular meeting of the Board. However, because the full Committee constitutes a quorum of the Board, the meeting of the Committee is also being posted as a meeting of the Board out of an abundance of caution.
TEACHER RETIREMENT SYSTEM OF TEXAS MEETING BOARD OF TRUSTEES
AND INVESTMENT MANAGEMENT COMMITTEE
(Committee Chair David Corpus; Members: Jarvis V. Hollingsworth, Christopher Moss,
Nanette Sissney, Robert H. Walls)
By Videoconference
THE DECEMBER 9, 2020, MEETING OF THE TRS INVESTMENT MANAGEMENT COMMITTEE AND BOARD OF TRUSTEES MEETING WILL BE CONDUCTED BY VIDEOCONFERENCE IN ACCORDANCE WITH THE GOVERNOR’S AUTHORIZATION CONCERNING SUSPENSION OF CERTAIN OPEN MEETING LAW REQUIREMENTS IN RESPONSE TO THE COVID-19 (CORONAVIRUS) DISASTER. A quorum of members of the Committee will participate in the meeting and will be audible to the public. Members of the public may access the meeting by clicking https://zoom.us/j/984-348-8378 Meeting ID: 984-348-8378, password: 3231211. The open portions of the December 9, 2020, meeting are being broadcast over the Internet. Access to the Internet broadcast and agenda materials of the meeting is provided at www.trs.texas.gov. A recording of the meeting will be available at www.trs.texas.gov.
AGENDA December 9, 2020 – 9:30 a.m.
1. Call roll of Committee members.
2. Consider the approval of the proposed minutes of the September 2020 committee meeting – David Corpus, Chair.
3. CIO Update including Fleet Strategy; Talent Management; Accomplishments; Notices and Key Dates; Upcoming Events – Jase Auby.
4. Discuss the Third Quarter 2020 Performance Review – Steve Voss and Mike McCormick, Aon Hewitt.
5. Annual Update of Risk and Portfolio Management – James Nield.
6. Annual Update on the Trading Group – Bernie Bozzelli.
7. Review of the Absolute Return Portfolio – Ashley Baum.

1
Minutes of the Investment Management Committee September 16, 2020 The Investment Management Committee of the Board of Trustees of the Teacher Retirement System of Texas met on Wednesday September 16, 2020, by videoconference in accordance with the Governor’s authorization concerning suspension of certain Open Meeting law requirements in response to the COVID-19 (Coronavirus) disaster.
Committee members who participated by videoconference: Mr. David Corpus, Chair Mr. Jarvis Hollingsworth Mr. Christopher Moss Mrs. Nanette Sissney Mr. Robert H. Walls, Jr. Other TRS Board Members who participated by videoconference: Mr. Mike Ball Mr. John Elliott Mr. James D. Nance Others present: Brian Guthrie, TRS Andrew Roth, TRS Heather Traeger, TRS Jase Auby, TRS Katy Hoffman, TRS James Nield, TRS Stephen Kin, TRS Katherine Farrell, TRS Suzanne Dugan, Cohen Milstein Dr. Keith Brown, Board Advisor Steve Voss, Aon Hewitt Mike McCormick, Aon Hewitt. Investment Management Committee Chairman, Mr. David Corpus, called the meeting to order at 10:40 a.m. 1. Call roll of Committee members.
Ms. Farrell called the roll. A quorum was present.
2. Consider the approval of the proposed minutes of the July 2020, Investment
Management Committee meeting – Chair David Corpus. On a motion by Mr. Moss, seconded by Mr. Hollingsworth, the committee voted to approve the proposed minutes for the July 2020 Investment Management Committee meeting as presented.

2
3. CIO Update including Fleet Strategy; Talent Management; Accomplishments; Notices and Key Dates and Upcoming Events and Market Update– Jase Auby.
Mr. Jase Auby provided an overview of IMD’s operations. He stated that IMD continues to operate well through the COVID crisis. The IMD remains at Phase 2 of the return-to-office process with about 15 personnel on-site at 816 at any time. He reported IMD’s participation with the Texas Retirement Teacher’s Association (TRTA) regional meetings and the upcoming GCM Emerging Markets Conference and the SPN Summits. He stated the recruiting for the Fleet is proceeding at a measured but slower pace even through COVID. He said the internship summer program that was modified line the intern with a specific program and greater emphasis on mentoring. He announced Sylvia Bell joined the Toiga Foundation’s Board. Mr. Auby reported on the quarterly metrics for the Trust. He stated the Trust was substantially in the same position as last quarter, with total Trust alpha still running negative at minus 38 basis points. He said that while they are never happy with negative alpha, that from time to time it will be experienced. He said alpha was the story of two portfolios, with private markets till continuing to deliver positive performance that is offset by ongoing negative performance in the public markets. Mr. Auby provided his market update. He stated that every day, our society, our economy and the market seems to be dominated by the COVID crisis and the economic response that that crisis around the world. He reported the markets in the US experienced a V-shaped drawdown. He said the S&P 500 previous high was reached on February 29, the market drew down by 32 percent, the fastest drawdown in history but have now fully recovered. He stated the Trust value had also recovered to its previous high. He stated addition to growth in the markets, inflation is projected to remain low. Mr. Auby discussed the impact and possible scenarios due to the upcoming elections on the market. He then reviewed public equity markets. Mr. Auby concluded with a discussion on interest rates which he indicated IMD has been reviewing in light of the COVID crisis. He said interest rates affect the entire portfolio but most directly impact government bonds. He noted as part of the strategic asset allocation review last year, the Board increased the government bond allocation from 11 percent to 16 percent. He reported since the new policy went into effect, September 30, 2019, bonds are up by 17 percent, government bonds being the best performing asset class in the Trust. He said the bond portfolio delivered superior performance at the time when the Trust needed it most, during the depths of the COVID crisis.
4. Discuss the Second Quarter 2020 Performance Review – Steve Voss and Mike McCormick, Aon Hewitt.
Mr. Steve Voss provided an overview of the Trust’s performance. He said there are three themes that tie into perspectives for the second quarter to the longer year periods. One theme he noted is the bonds, which have been the single most important component of TRS asset allocation over the past year, roughly 15 percent of the total Trust. The second he said is the narrowness of the performance within the equity markets. He said the modest value overweight relative to growth has hurt the total Fund on a relative basis. The third, he said was negative returns associated with
3
private investments. He distinguished the private investments as having a one quarter reporting lag, so the valuation information was from the end of the first quarter. Mr. Mike McCormick stated the first quarter saw significant declines in the markets due to the pandemic circumstances and now have seen much of that recover sense the end of the first quarter. He said given this change in market status, despite the second wave of coronavirus outbreaks, the second quarter of 2020 saw meaningful equity returns. He said the real return portfolio was somewhat neutral for the trailing one-year period, down about 20 basis points, and the risk parity appreciating for the most recent quarter up 9.8 percent and the credit spreads come in and equity returns normalize during the period. Mr. McCormick reviewed the compliance of the assets of the portfolio and how they are in line with the investment policy targets. He said across the line the assets are within the targets for both the intermediate as well as the long-term policy. He noted there was a bit of an overweight to the stable value as of the end of the period and a bit of an underweight to the real assets. Mr. McCormick concluded by reviewing the risk return results of the Trust. He reported TRS is achieving a strong risk-adjusted rate of return relative to peers.
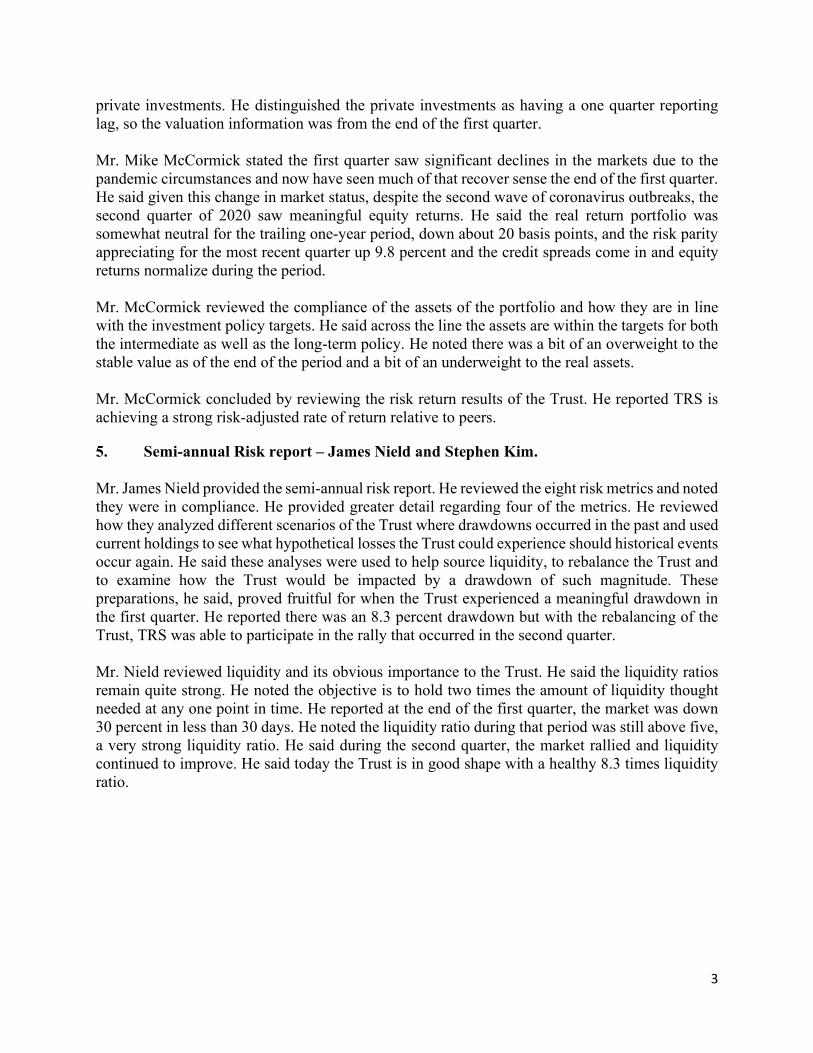
5. Semi-annual Risk report – James Nield and Stephen Kim. Mr. James Nield provided the semi-annual risk report. He reviewed the eight risk metrics and noted they were in compliance. He provided greater detail regarding four of the metrics. He reviewed how they analyzed different scenarios of the Trust where drawdowns occurred in the past and used current holdings to see what hypothetical losses the Trust could experience should historical events occur again. He said these analyses were used to help source liquidity, to rebalance the Trust and to examine how the Trust would be impacted by a drawdown of such magnitude. These preparations, he said, proved fruitful for when the Trust experienced a meaningful drawdown in the first quarter. He reported there was an 8.3 percent drawdown but with the rebalancing of the Trust, TRS was able to participate in the rally that occurred in the second quarter. Mr. Nield reviewed liquidity and its obvious importance to the Trust. He said the liquidity ratios remain quite strong. He noted the objective is to hold two times the amount of liquidity thought needed at any one point in time. He reported at the end of the first quarter, the market was down 30 percent in less than 30 days. He noted the liquidity ratio during that period was still above five, a very strong liquidity ratio. He said during the second quarter, the market rallied and liquidity continued to improve. He said today the Trust is in good shape with a healthy 8.3 times liquidity ratio.

4
There being no more business before the Investment Management Committee, the committee adjourned at 11:51 a.m.
Approved by the Investment Management Committee of the Board of Trustees of the Teacher Retirement System of Texas on December 9, 2020.
_____________________________ _________________
Katherine H. Farrell Date

Jase Auby, Chief Investment Officer
CIO Update
December 2020
2
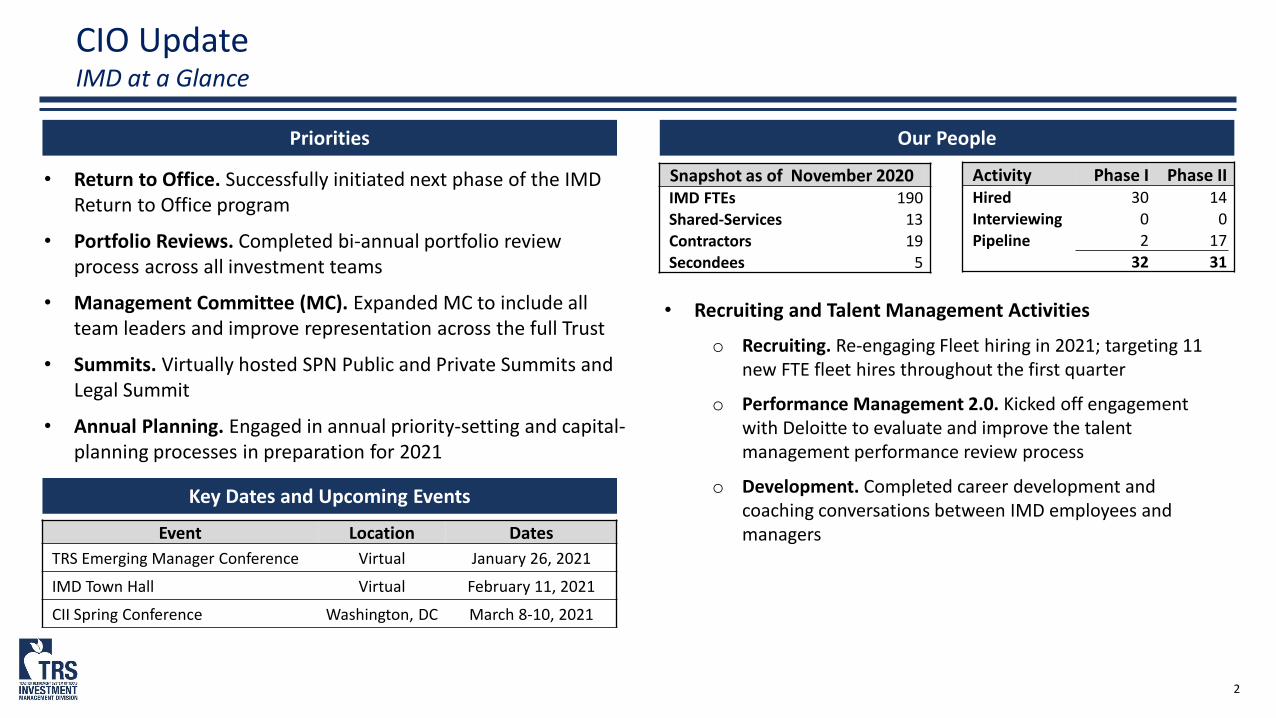
CIO UpdateIMD at a Glance
Priorities Our People
Snapshot as of November 2020IMD FTEs 190Shared-Services 13Contractors 19Secondees 5
Activity Phase I Phase IIHired 30 14Interviewing 0 0Pipeline 2 17
32 31
Key Dates and Upcoming Events
Event Location DatesTRS Emerging Manager Conference Virtual January 26, 2021
IMD Town Hall Virtual February 11, 2021
CII Spring Conference Washington, DC March 8-10, 2021
• Return to Office. Successfully initiated next phase of the IMD Return to Office program
• Portfolio Reviews. Completed bi-annual portfolio review process across all investment teams
• Management Committee (MC). Expanded MC to include all team leaders and improve representation across the full Trust
• Summits. Virtually hosted SPN Public and Private Summits and Legal Summit
• Annual Planning. Engaged in annual priority-setting and capital-planning processes in preparation for 2021
• Recruiting and Talent Management Activities
o Recruiting. Re-engaging Fleet hiring in 2021; targeting 11 new FTE fleet hires throughout the first quarter
o Performance Management 2.0. Kicked off engagement with Deloitte to evaluate and improve the talent management performance review process
o Development. Completed career development and coaching conversations between IMD employees and managers

3
CIO UpdateIntroducing our new Management Committee
Chairman

4
CIO UpdateMetrics Reporting – As of September 30, 2020
Source: State Street Bank, TRS IMD 1 Calculation adjusted to represent approved PIs in relation to approved portfolio (PI and Fund investments) rather than budgeted capital plan. Q1-Q2 CY2020 figures revised2 CY2019 annual fee savings presented net of inception to date marginal direct and overhead costs attributed to employees hired as part of the Building the Fleet initiative
Metric Objective Target Q4 2019 Q1 2020 Q2 2020 Q3 2020
Total Trust Excess Return Return in excess of the benchmark return for the Total Trust (3 Year Rolling) +100 bp +36 bp -9 bp -38 bp -44 bp
Private Markets Excess Return
Return in excess of the benchmark return for Private Markets investments (3 Year Rolling) +155 bp +215 bp +173 bp +97 bp +53 bp
Active Public Markets Excess Return
Return in excess of the benchmark return for Active Public Markets investments (3 Year Rolling) +100 bp -74 bp -126 bp -104 bp -84 bp
Principal Investments Percentage of principal investments in approved portfolio (cumulative year-to-date)1
2019: 35%2020: 38% 2019: 41% YTD: 49% YTD: 36% YTD: 38%
Public Equity Allocation Percent of internal public equity allocation 45% 47% 50% 46% 49%
Estimated Net Fee Savings External manager annual net fee savings2
2018: $53M2019: $64M2020: $80M
2018: $46M2019: $65M
2020: To be reported April 2021
Investment advice and consulting services provided by Aon Investments USA Inc., an Aon Company
Nothing in this document should be construed as legal or investment advice. Please consult with your independent professional for any such advice. To protect the confidential and proprietary information included in this material, it may not be disclosed or provided to any third parties without the approval of Aon.
Teacher Retirement System of TexasPerformance Review: Third Quarter 2020

Proprietary & Confidential Investment advice and consulting services provided by Aon Investments USA Inc., an Aon Company. 2
Summary
8.6%
0.7%
-0.5%
5.0%7.7%
13.4%
-1.4%
3.1%
-5.0%
0.0%
5.0%
10.0%
15.0%
Global Equity Policy Benchmark Stable Value Policy Benchmark Real Return Policy Benchmark Risk Parity Benchmark
Third Quarter One-Year
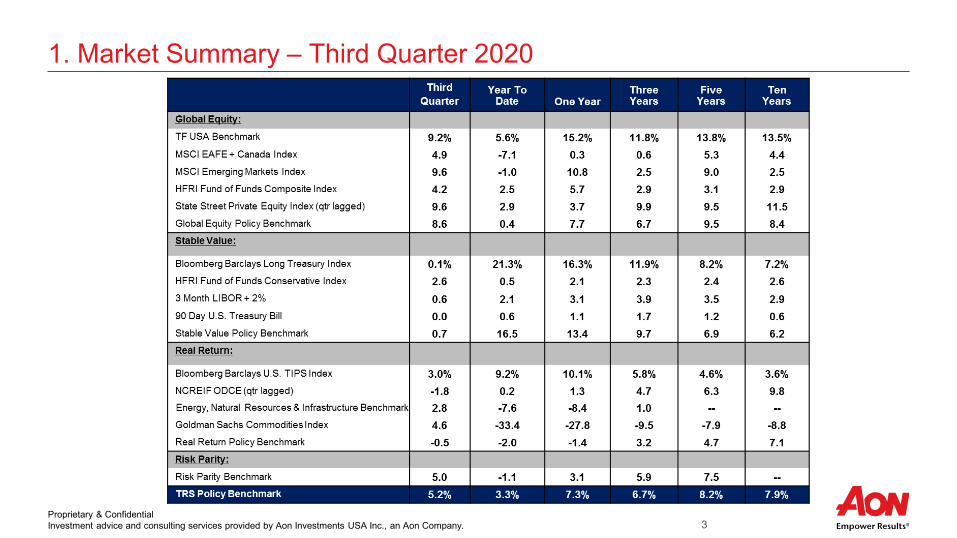
• Global equities continued their rebound over the third quarter as they broke through their pre-pandemic all time highs in early September. This performance was supported by optimism over progress in Covid-19 vaccine trials and supportive monetary and fiscal policies with global equities returning 8.6% for the quarter.
• The U.S. nominal yield curve slightly steepened over the quarter, but overall yields were broadly unchanged. The Fed projected that it would keep interest rates near zero until at least 2023, resulting in the relatively flat returns shown for the Stable Value component
TRS returned 5.4% for the quarter which was 0.2 percentage points above its benchmark− Outperformance at the asset class level for Stable Value and Real Return were the primary drivers for relative results.
For the trailing twelve months, TRS returned 5.6% versus the benchmark return of 7.3%− Active management in Total USA, along with Stable Value and Risk Parity performance were the primary detractors from relative
results
Proprietary & Confidential Investment advice and consulting services provided by Aon Investments USA Inc., an Aon Company. 3
1. Market Summary – Third Quarter 2020

Proprietary & Confidential Investment advice and consulting services provided by Aon Investments USA Inc., an Aon Company. 4
2. Market Value Change

Proprietary & Confidential Investment advice and consulting services provided by Aon Investments USA Inc., an Aon Company. 5
3. Asset Allocation DetailMarket Value $ in millions)
as of 09/30/2020 InterimPolicyTarget
Relative toInterimPolicy Target
Long TermPolicy Target
Long TermPolicy
Ranges($) (%)Investment Exposure -- 105.2% 104.0% +1% 104.0% 99-115%Total U.S.A. $28,701 17.6% 19.0% -1.3% 18.0 13-23%Non-U.S. Developed $22,161 13.6% 13.3% +0.3% 13.0 8-18%Emerging Markets $14,245 8.8% 9.0% -0.2% 9.0 4-14%Private Equity $23,784 14.6% 14.0% +0.6% 14.0 9-19%Global Equity $88,891 54.6% 55.3% -0.7% 54.0 47-61%Government Bonds $23,971 14.7% 16.3% -1.6% 16.0 0-21%Stable Value Hedge Funds $8,258 5.1% 5.0% +0.1% 5.0 0-10%Absolute Return (including OAR) $5,946 3.7% 0.0% +3.7% 0.0 0-20%Stable Value $38,174 23.5% 21.3% +2.1% 21.0 14-28%Real Estate $22,246 13.7% 14.2% -0.5% 15.0 10-20%Energy, Natural Resource and Inf. $8,286 5.1% 5.1% 0.0% 6.0 1-11%Commodities $385 0.2% 0.0% +0.2% 0.0 0-5%Real Return $30,917 19.0% 19.3% -0.3% 21.0 14-28%Risk Parity $13,129 8.1% 8.0% +0.1% 8.0 0-13%Risk Parity $13,129 8.1% 8.0% +0.1% 8.0 0-13%Cash $2,084 1.3% 2.0% -0.7% 2.0 0-7%Asset Allocation Leverage -$10,539 -6.5% -6.0% -0.5% -6.0 --Net Asset Allocation -$8,455 -5.2% -4.0% -1.2% -4.0 --Total Fund $162,656 100.0% --- 100.0% --
Note: Asset allocation information shown above is based upon MOPAR reporting. The excess returns shown above may not be a perfect difference between the actual and benchmark returns due entirely to rounding.

Proprietary & Confidential Investment advice and consulting services provided by Aon Investments USA Inc., an Aon Company. 6
4. Total TRS Performance Ending 09/30/2020

Proprietary & Confidential Investment advice and consulting services provided by Aon Investments USA Inc., an Aon Company. 7
5. Total Fund Attribution – One Quarter Ending 09/30/2020

Proprietary & Confidential Investment advice and consulting services provided by Aon Investments USA Inc., an Aon Company. 8
5. Total Fund Attribution – One Year Ending 09/30/2020

Proprietary & Confidential Investment advice and consulting services provided by Aon Investments USA Inc., an Aon Company. 9
6. Risk Profile: Total Fund Risk-Return vs. Peers
Note: Public Plan peer group composed of 16 public funds with total assets in excess of $10B as of 09/30/2020 respectively for the periods above. An exhibit outlining the asset allocation of the peer portfolios is provided in the appendix of this report.

Proprietary & Confidential Investment advice and consulting services provided by Aon Investments USA Inc., an Aon Company. 10
6. Risk Profile: Trailing 3-Year and 5-Year Risk Metrics Peer Comparison

Proprietary & Confidential Investment advice and consulting services provided by Aon Investments USA Inc., an Aon Company. 11
7. Global Equity: Performance Summary Ending 09/30/2020
Note: The excess returns shown in this presentation may differ from State Street statements due entirely to rounding. These differences are generally within a few basis points and are not material.
Third Quarter
Year to Date
OneYear
ThreeYears
Total Global Equity 8.3% -0.4% 6.2% 5.7%Global Equity Benchmark 8.6 0.4 7.7 6.7Difference -0.4 -0.7 -1.6 -0.9Total U.S. Equity 8.4 0.2 7.6 8.0Total U.S. Equity Benchmark 9.2 5.6 15.2 11.8Difference -0.8 -5.3 -7.5 -3.7Non-U.S. Equity 8.0 -2.3 6.5 2.3Non-U.S. Benchmark 6.8 -4.5 4.6 1.5Difference +1.2 +2.2 +1.9 +0.8Non-U.S. Developed 6.6 -4.1 3.2 1.5MSCI EAFE + Canada 4.9 -7.1 0.3 0.6Difference +1.7 +3.0 +3.0 +0.8
Emerging Markets 10.0 0.2 11.4 3.4MSCI Emerging Markets 9.6 -1.0 10.8 2.5
Difference +0.4 +1.3 +0.6 +0.9
Five Years
Ten Years
8.8% 8.3%9.5 8.4
-0.8 -0.1
11.0 11.513.8 13.5
-2.8 -2.0
7.1 4.36.9 3.8
+0.2 +0.6
5.3 5.35.3 4.4
-0.1 +0.9
9.8 3.2
9.0 2.5
+0.8 +0.7
Proprietary & Confidential Investment advice and consulting services provided by Aon Investments USA Inc., an Aon Company. 12
7. Global Equity: Performance Summary Ending 09/30/2020 (cont’d)Third
QuarterYear To
DateOne Year
Three Years
Five Years
Ten Years
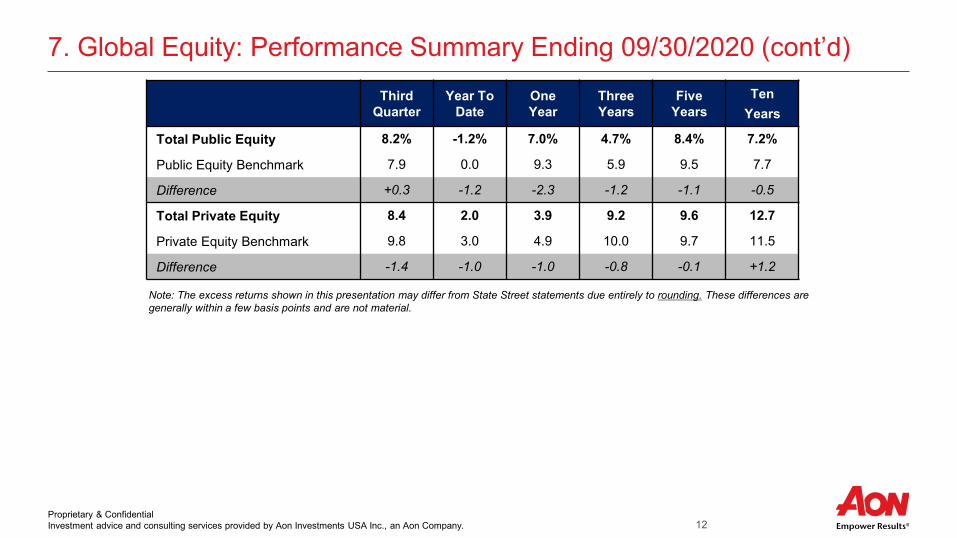
Total Public Equity 8.2% -1.2% 7.0% 4.7% 8.4% 7.2%
Public Equity Benchmark 7.9 0.0 9.3 5.9 9.5 7.7
Difference +0.3 -1.2 -2.3 -1.2 -1.1 -0.5
Total Private Equity 8.4 2.0 3.9 9.2 9.6 12.7
Private Equity Benchmark 9.8 3.0 4.9 10.0 9.7 11.5
Difference -1.4 -1.0 -1.0 -0.8 -0.1 +1.2
Note: The excess returns shown in this presentation may differ from State Street statements due entirely to rounding. These differences are generally within a few basis points and are not material.

Proprietary & Confidential Investment advice and consulting services provided by Aon Investments USA Inc., an Aon Company. 13
8. Stable Value: Performance Summary Ending 09/30/2020Third
QuarterYear
To DateOne Year
Three Years
Total Stable Value 1.5% 14.2% 11.7% 9.1%Total Stable Value Benchmark 0.7 16.5 13.4 9.7
Difference +0.8 -2.3 -1.7 -0.6
Total Government Bonds 0.1 21.4 16.3 12.4
Treasury Benchmark 0.1 21.3 16.3 11.9
Difference 0.0 +0.1 -0.1 +0.5
Stable Value Hedge Funds 2.0 2.4 3.9 3.7
Hedge Funds Benchmark 2.6 0.5 2.1 2.3
Difference -0.6 +1.9 +1.8 +1.4
Other Absolute Return 6.2 0.0 2.9 5.7
Other Absolute Return Benchmark 0.6 2.1 3.1 3.9
Difference +5.6 -2.0 -0.1 +1.8Note: The excess returns shown in this presentation may differ from State Street statements due entirely to rounding. These differences are generally within a few basis points and are not material.
Five Years
Ten Years
7.3% 7.0%6.9 6.2
+0.4 +0.8
8.7 7.8
8.2 7.2
+0.5 +0.6
4.3 3.92.4 2.9
+2.0 +0.9
6.1 9.3
3.5 2.9
+2.6 +6.4

Proprietary & Confidential Investment advice and consulting services provided by Aon Investments USA Inc., an Aon Company. 14
9. Real Return: Performance Summary Ending 09/30/2020Third
QuarterYear To
DateOne Year
Three Years
Five Years
Ten years
Total Real Return 0.6% -3.2% -1.7% 4.6% 6.4% 7.8%Real Return Benchmark -0.5 -2.0 -1.4 3.2 4.7 7.1
Difference +1.2 -1.2 -0.3 +1.4 +1.7 +0.7
Real Estate -0.1 -0.2 1.9 6.9 8.8 11.3
Real Estate Benchmark -1.8 0.2 1.3 4.7 6.3 9.8
Difference +1.7 -0.4 +0.6 +2.2 +2.5 +1.5Energy, Natural Resource and Infrastructure
2.4 -10.8 -10.9 0.9 -- --
Energy and Natural Res. Benchmark 2.8 -7.6 -8.4 1.0 -- --
Difference -0.4 -3.2 -2.5 -0.1 -- --
Note: The excess returns shown in this presentation may differ from State Street statements due entirely to rounding. These differences are generally within a few basis points and are not material.

Proprietary & Confidential Investment advice and consulting services provided by Aon Investments USA Inc., an Aon Company. 15
10. Risk Parity: Performance Summary Ending 09/30/2020Third
QuarterYear To
DateOne Year
Three Years
Five Years
Ten years
Total Risk Parity 4.4% -7.6% -3.6% 3.9% 6.8% --
Risk Parity Benchmark 5.0 -1.1 3.1 5.9 7.5 --
Difference -0.6 -6.6 -6.7 -2.0 -0.7 --
Note: The excess returns shown in this presentation may differ from State Street statements due entirely to rounding. These differences are generally within a few basis points and are not material.
Proprietary & Confidential Investment advice and consulting services provided by Aon Investments USA Inc., an Aon Company. 16
11.Cash Equivalents: Performance Summary Ending 09/30/2020Third
QuarterYear To
DateOne Year
Three Years
Five Years
Ten Years
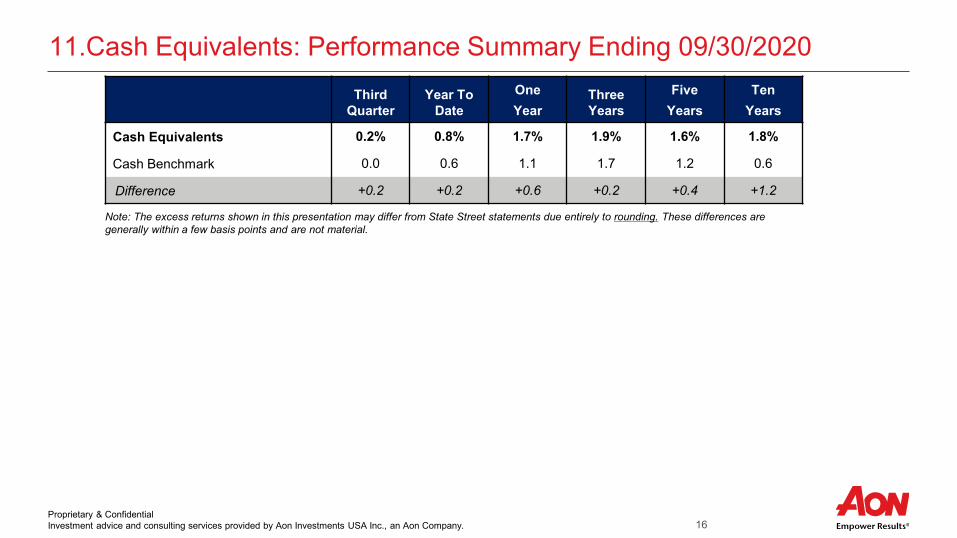
Cash Equivalents 0.2% 0.8% 1.7% 1.9% 1.6% 1.8%
Cash Benchmark 0.0 0.6 1.1 1.7 1.2 0.6
Difference +0.2 +0.2 +0.6 +0.2 +0.4 +1.2
Note: The excess returns shown in this presentation may differ from State Street statements due entirely to rounding. These differences are generally within a few basis points and are not material.
Proprietary & Confidential Investment advice and consulting services provided by Aon Investments USA Inc., an Aon Company. 17
Appendix – Supplemental Reporting

Proprietary & Confidential Investment advice and consulting services provided by Aon Investments USA Inc., an Aon Company. 18
TRS Commitment Levels vs. Peers (>$10 Billion) as of 09/30/2020
Note: The Public Plan peer universe had 16 observations for the third quarter 2020. TRS allocations may not sum to 100.0% which is entirely due to the impact of rounding
The chart below depicts the asset allocation of peer public funds with assets greater than $10 billion.
− The ends of each line represent the 95th and 5th percentile of exposures, the middle light blue and grey lines represent the 25th and 75th percentile of exposures, the purple square represents the median, and the green dot represents TRS exposure.

Proprietary & Confidential Investment advice and consulting services provided by Aon Investments USA Inc., an Aon Company. 19
Historical Excess Performance Ending 09/30/2020
Quarterly and Cumulative Excess Performance Total Fund vs. Total Fund Benchmark

Proprietary & Confidential Investment advice and consulting services provided by Aon Investments USA Inc., an Aon Company. 20
TRS Asset Growth
0
20
40
60
80
100
120
140
160
180
Mar
ket V
alue
(Billi
ons)
Total Fund Historical Growth (September 1997 - September 2020)
$162.7

Proprietary & Confidential Investment advice and consulting services provided by Aon Investments USA Inc., an Aon Company. 21
External Manager Program: Public Equity Performance as of 09/30/2020
Allocation ($ in
billions)
ThirdQuarter
Year To Date
OneYear
EP Total Global Equity $26.3 8.8% 1.3% 10.4%EP Global Equity Benchmark -- 7.5 1.5 9.8Difference -- +1.3 -0.3 +0.6EP U.S.A. $10.0 9.2 2.2 9.3EP U.S.A. Benchmark -- 9.2 5.6 15.2Difference -- 0.0 -3.4 -5.9EP Non-U.S. Developed $5.1 8.5 3.0 14.4MSCI EAFE + Canada Policy Index -- 4.9 -7.1 0.3Difference -- +3.6 +10.1 +14.1EP Emerging Markets $5.2 10.8 1.2 13.3MSCI Emerging Markets Policy Index -- 9.6 -1.0 10.8Difference -- +1.2 +2.2 +2.5EP World Equity $6.0 6.8 -1.0 7.2EP World Equity Benchmark -- 8.2 1.7 10.9Difference -- -1.4 -2.6 -3.6
Note: The excess returns shown in this presentation may differ from State Street statements due entirely to rounding. These differences are generally within a few basis points and are not material.
Three Years
5.6%5.5
+0.19.011.8-2.74.30.6
+3.63.82.5
+1.36.27.5-1.2
Proprietary & Confidential Investment advice and consulting services provided by Aon Investments USA Inc., an Aon Company. 22
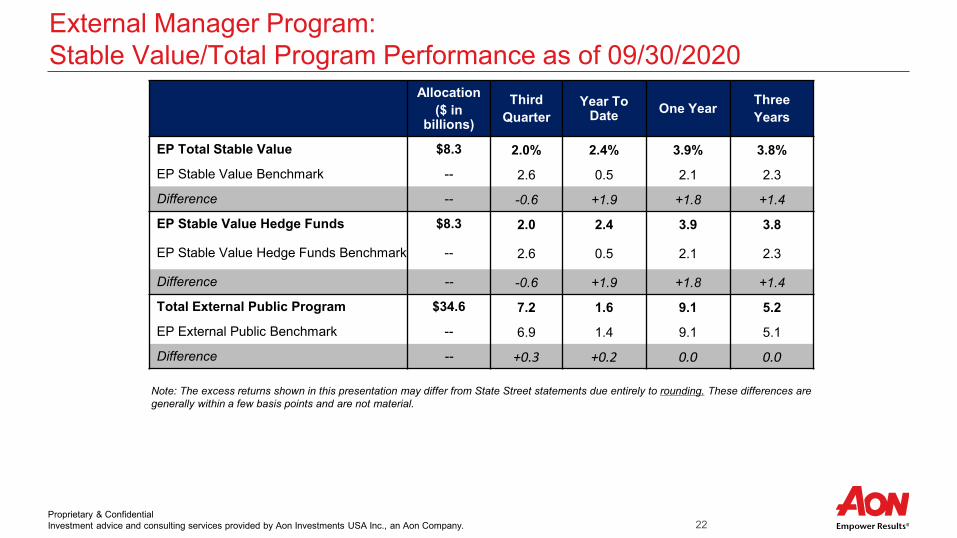
External Manager Program: Stable Value/Total Program Performance as of 09/30/2020
Allocation ($ in
billions)
ThirdQuarter
Year To Date One Year Three
Years
EP Total Stable Value $8.3 2.0% 2.4% 3.9% 3.8%
EP Stable Value Benchmark -- 2.6 0.5 2.1 2.3
Difference -- -0.6 +1.9 +1.8 +1.4
EP Stable Value Hedge Funds $8.3 2.0 2.4 3.9 3.8
EP Stable Value Hedge Funds Benchmark -- 2.6 0.5 2.1 2.3
Difference -- -0.6 +1.9 +1.8 +1.4
Total External Public Program $34.6 7.2 1.6 9.1 5.2
EP External Public Benchmark -- 6.9 1.4 9.1 5.1
Difference -- +0.3 +0.2 0.0 0.0
Note: The excess returns shown in this presentation may differ from State Street statements due entirely to rounding. These differences are generally within a few basis points and are not material.

Proprietary & Confidential Investment advice and consulting services provided by Aon Investments USA Inc., an Aon Company. 23
Public Strategic Partnership Program (SPN): Performance Summary as of 09/30/2020
The Public SPNs in aggregate outperformed the benchmark during the third quarter but underperformed over the trailing one-year period and over the trailing three-year period.
Allocation ($ in
billions)
ThirdQuarter
Year To Date
OneYear
Three Years
Five Years
Public Strategic Partnership $7.2 6.6% 6.2% 12.2% 7.9% 9.7%Public SPN Benchmark -- 5.7% 6.9% 12.5% 8.2% 9.7%Difference -- +0.9 -0.7 -0.3 -0.3 0.0
Blackrock $2.3 5.8% 6.4% 12.6% 9.0% --J.P. Morgan $2.3 7.7% 7.7% 13.6% 7.4% --Neuberger Berman $0.5 6.1% 7.1% 12.6% 7.9% --Morgan Stanley $2.1 6.7% 3.6% 10.1% 7.3% --
Note: The excess returns shown in this presentation may differ from State Street statements due entirely to rounding. These differences are generally within a few basis points and are not material.

Proprietary & Confidential Investment advice and consulting services provided by Aon Investments USA Inc., an Aon Company. 24
Total Fund Performance Benchmark – 19.0% MSCI U.S.A. IMI, 13.3% MSCI EAFE plus Canada Index, 9.0% MSCI Emerging Markets Index, 14.0% State Street Private Equity Index (1 quarter lagged), 16.3% Blmb. Barc. Long Term Treasury Index, 5.0% HFRI FoF Conservative Index, 2.0% Citigroup 3 Mo. T-Bill Index, 14.2% NCREIF ODCE Index (1 quarter lagged), 5.1% Energy and Natural Resources Benchmark, 8.0% Risk Parity Benchmark, and -6.0% Asset Allocation Leverage Benchmark.
Global Equity Benchmark – 34.3% MSCI U.S.A. IMI, 24.1% MSCI EAFE plus Canada Index, 16.3% MSCI Emerging Markets Index, and 25.3% State Street Private Equity Index (1 quarter lagged)– TF U.S. Equity Benchmark - MSCI U.S.A. Investable Markets Index (IMI)– Emerging Markets Equity Benchmark – MSCI Emerging Markets Index– Non-US Developed Equity Benchmark– MSCI EAFE + Canada Index– Private Equity Benchmark - State Street Private Equity Index (1 quarter lagged)
Benchmarks
Note: Returns and market values (based on account level) reported are provided by State Street. Net additions/withdrawals are reported on a gross (adjusted for expenses) total fund level as provided by State Street. All rates of return for time periods greater than one year are annualized. The excess returns shown in this presentation may differ from State Street statements due entirely to rounding. These differences are generally within a few basis points and are not material.

Proprietary & Confidential Investment advice and consulting services provided by Aon Investments USA Inc., an Aon Company. 25
Benchmarks (cont’d) Stable Value Benchmark – 76.6% Blmb. Barc. Long Term Treasury Index and 23.4% HFRI FoF Conservative Index
– US Treasuries Benchmark – Bloomberg Barclays Long Term Treasury Index– Stable Value Hedge Funds – HFRI Fund of Funds (FoF) Conservative Index– Other Absolute Return Benchmark - 3 Mo. LIBOR + 2%– Cash Benchmark - Citigroup 3 Mo. Treasury Bill Index
Real Return Benchmark – 73.4% NCREIF ODCE Index and 26.6% Energy & Natural Resources Benchmark– Real Estate Benchmark – NCREIF ODCE Index (1 quarter lagged) – Energy and Natural Resources Benchmark – 75% Cambridge Associates Natural Resources Index (reweighted) and 25%
quarterly Seasonally-Adjusted Consumer Price Index (1 quarter lagged) – Commodities Benchmark – Goldman Sachs Commodity Index
Note: Returns and market values (based on account level) reported are provided by State Street. Net additions/withdrawals are reported on a gross (adjusted for expenses) total fund level as provided by State Street. All rates of return for time periods greater than one year are annualized. The excess returns shown in this presentation may differ from State Street statements due entirely to rounding. These differences are generally within a few basis points and are not material.
Proprietary & Confidential Investment advice and consulting services provided by Aon Investments USA Inc., an Aon Company. 26
Description of Performance Attribution A measure of the source of the deviation of a fund's performance from that of its policy benchmark. Each bar on the attribution
graph represents the contribution made by the asset class to the total difference in performance. A positive value for a component indicates a positive contribution to the aggregate relative performance. A negative value indicates a detrimental impact. Themagnitude of each component's contribution is a function of (1) the performance of the component relative to its benchmark, and (2) the weight (beginning of period) of the component in the aggregate.
The individual Asset Class effect, also called Selection Effect, is calculated as Actual Weight of Asset Class x (Actual Asset Class Return – Asset Class Benchmark Return)
The bar labeled Allocation Effect illustrates the effect that a Total Fund's asset allocation has on its relative performance. Allocation Effect calculation = (Asset Class Benchmark Return –Total Benchmark Return) x (Actual Weight of Asset Class –Target Policy Weight of Asset Class).
The bar labeled Other is a combination of Cash Flow Effect and Benchmark Effect:– Cash Flow Effect describes the impact of asset movements on the Total Fund results. Cash Flow Effect calculation = (Total
Fund Actual Return – Total Fund Policy Return) – Current Selection Effect – Current Allocation Effect– Benchmark Effect results from the weighted average return of the asset classes' benchmarks being different from the Total
Funds’ policy benchmark return. Benchmark Effect calculation = Total Fund Policy Return – (Asset Class Benchmark Return x Target Policy Weight of Asset Class)
Cumulative EffectCumulative Effect calculation = Current Effect t *(1+Cumulative Total Fund Actual Return t-1) +Cumulative Effect t-1*(1+Total Fund Benchmark Return t)

Proprietary & Confidential Investment advice and consulting services provided by Aon Investments USA Inc., an Aon Company. 27
Disclaimers and Notes
Proprietary & Confidential Investment advice and consulting services provided by Aon Investments USA Inc., an Aon Company. 28
Disclaimers and NotesDisclaimers:
Please review this report and notify Aon Investments USA Inc. (Aon) with any issues or questions you may have with respect toinvestment performance or any other matter set forth herein.
The client portfolio data presented in this report have been obtained from the custodian. Aon has compared this information to the investment managers’ reported returns and believes the information to be accurate. Aon has not conducted additional audits and cannot warrant its accuracy or completeness. This document is not intended to provide, and shall not be relied upon for, accounting and legal or tax advice.
Refer to Hedge Fund Research, Inc. www.hedgefundresearch.com for more information on HFR indices
Notes:
The rates of return contained in this report are shown on an after-fees basis unless otherwise noted. They are geometric and time weighted. Returns for periods longer than one year are annualized.
Universe percentiles are based upon an ordering system in which 1 is the best ranking and 100 is the worst ranking.
Due to rounding throughout the report, percentage totals displayed may not sum up to 100.0%. Additionally, individual fund totals in dollar terms may not sum up to the plan totals.

FootnoteInvestment advice and consulting services provided by Aon Investments USA Inc. 29
Legal Disclosures and Disclaimers
Investment advice and consulting services provided by Aon Investments USA Inc. The information contained herein is given as of the date hereof and does not purport to give information as of any other date. The delivery at any time shall not, under any circumstances, create any implication that there has been a change in the information set forth herein since the date hereof or any obligation to update or provide amendments hereto.
This document is not intended to provide, and shall not be relied upon for, accounting, legal or tax advice. Any accounting, legal, or taxation position described in this presentation is a general statement and shall only be used as a guide. It does not constitute accounting, legal, and tax advice and is based on Aon Investments’ understanding of current laws and interpretation.
Aon Investments disclaims any legal liability to any person or organization for loss or damage caused by or resulting from any reliance placed on that content. Aon Investments reserves all rights to the content of this document. No part of this document may be reproduced, stored, or transmitted by any means without the express written consent of Aon Investments.
Aon Investments USA Inc. is a federally registered investment advisor with the U.S. Securities and Exchange Commission. Aon Investments is also registered with the Commodity Futures Trading Commission as a commodity pool operator and a commodity trading advisor, and is a member of the National Futures Association. The Aon Investments ADV Form Part 2A disclosure statement is available upon written request to:
Aon Investments USA Inc.200 E. Randolph StreetSuite 700Chicago, IL 60601ATTN: Aon Investments Compliance Officer
© Aon plc 2020. All rights reserved.


James Nield, Chief Risk Officer
Annual Update to the Board
Risk and Portfolio Management
December 2020
2
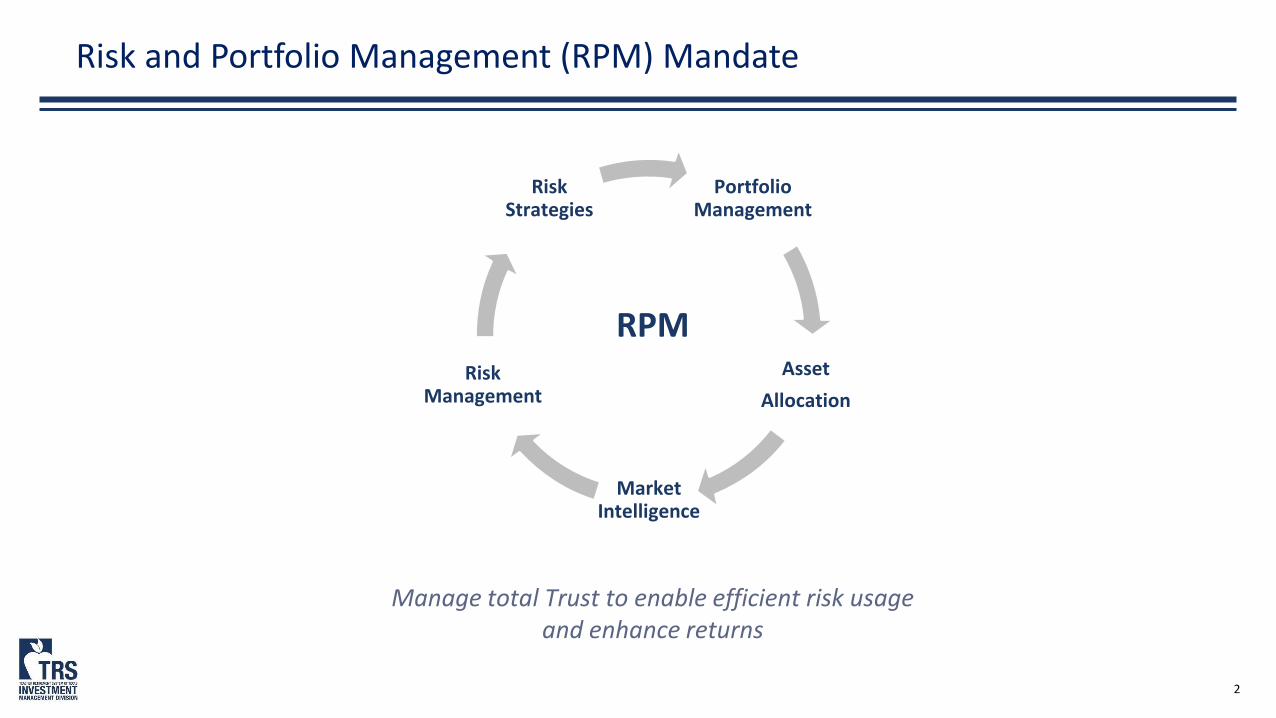
Risk and Portfolio Management (RPM) Mandate
Manage total Trust to enable efficient risk usage and enhance returns
Portfolio Management
Asset
Allocation
Market Intelligence
Risk Management
Risk Strategies
RPM

3
Curt Rogers, CFA, CAIA, FRMDirector, Market IntelligenceMBA, FinanceUT Austin MS, Aerospace Engineering MIT
Group Members
James Nield, CFA, FRMChief Risk OfficerMBA, Finance,New York UniversityBS, Finance,Pennsylvania State University
Mark Telschow, CFADirector, Head of Risk StrategiesBS, Civil Engineering, University of Texas
Mike Simmons, CFA Investment ManagerMPA, Accounting, University of TexasBBA, Finance,Texas A&M University
Steven LambertSenior AssociateMBA, Finance, Northeastern UniversityBS, Business Management,Saint Joseph’s College
Stephen Kim Director, Head of Risk ManagementMBA, Finance, University of TexasBS, Computer Science,Dartmouth College
Paul WaclawskyAnalystBS, Accounting,University of MarylandCFA Level III Candidate
17Advanced
degrees and certifications
12Years of average
investment experience
Teresa Lwin, PhDInvestment ManagerPhD, Finance MBA, Chicago Booth School of Business
Ercole VolonninoInvestment ManagerBS, EconomicsWharton School
Taylor GordonAdministrative Assistant BS, Hospitality AdministrationBoston University
Eric Morris, CFASenior AssociateMBA, UT Austin
Hasim Mardin, FRMInvestment ManagerMS, Economics, UT Austin
Posted PositionAnalyst Interviews ongoing
Emily LuAnalystBS, Statistics and Data Science, University of California, Santa Barbara
Andrew Arts Associate BA, Economics, U of Wisconsin- Madison
4New additions
in 2020

4
Risk Management
Battle Plans
Risk Monthly
Board Report
Risk Certifications
Monthly Report that highlights Trust, macro and portfolio
risks
Risk Signals
Action plans to prepare for
potential risk events
Semi-annual report to the Board on key
metrics
Independent analysis on risk
metrics of external public
investments
Daily monitoring of
signals to identify key
changes
Item circled in grey to be discussed in more detail
5
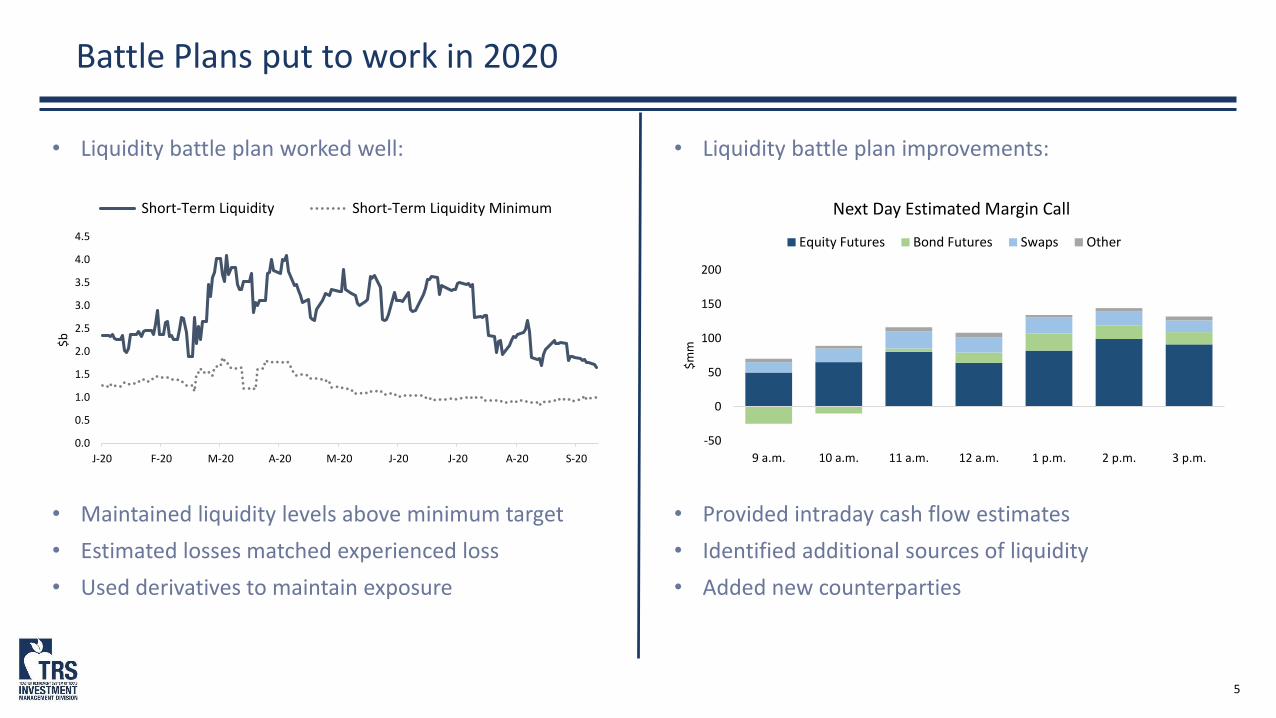
Battle Plans put to work in 2020
• Liquidity battle plan worked well:
• Maintained liquidity levels above minimum target
• Estimated losses matched experienced loss
• Used derivatives to maintain exposure
• Liquidity battle plan improvements:
• Provided intraday cash flow estimates
• Identified additional sources of liquidity
• Added new counterparties
0.0
0.5
1.0
1.5
2.0
2.5
3.0
3.5
4.0
4.5
J-20 F-20 M-20 A-20 M-20 J-20 J-20 A-20 S-20
$b
Short-Term Liquidity Short-Term Liquidity Minimum
-50
0
50
100
150
200
9 a.m. 10 a.m. 11 a.m. 12 a.m. 1 p.m. 2 p.m. 3 p.m.
$m
m
Next Day Estimated Margin Call
Equity Futures Bond Futures Swaps Other

6
RPM Strategies
Risk Parity
Diversified portfolio that uses leverage to target
desired risk
10
30
Provide additional bond
diversification and carry
Global BondFutures
Equity-like returns with less risk by capitalizing on
behavioral biases
Low VolTilts
Adjust Risk Parity weights based on
market conditions
Manage Trust’s bond allocation; provide desired
liquidity
Government
Bonds
Items circled in grey to be discussed in more detail
7
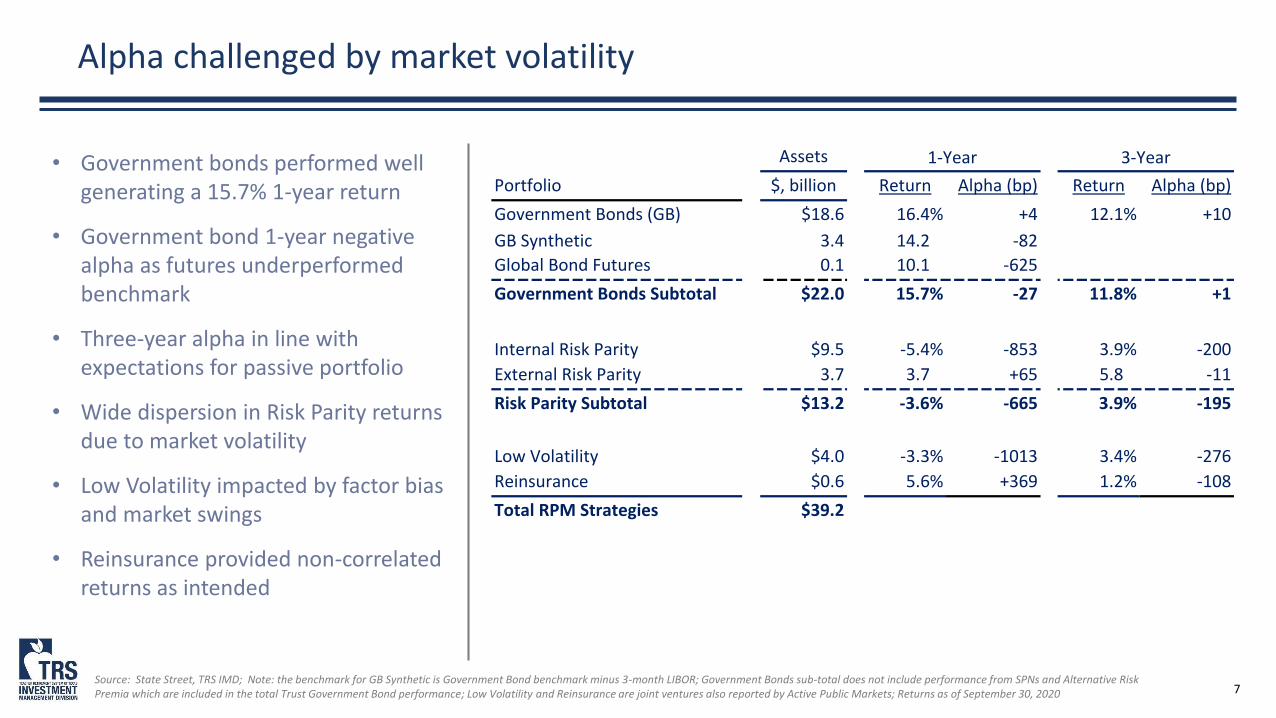
Alpha challenged by market volatility
Source: State Street, TRS IMD; Note: the benchmark for GB Synthetic is Government Bond benchmark minus 3-month LIBOR; Government Bonds sub-total does not include performance from SPNs and Alternative Risk Premia which are included in the total Trust Government Bond performance; Low Volatility and Reinsurance are joint ventures also reported by Active Public Markets; Returns as of September 30, 2020
10
• Government bonds performed well generating a 15.7% 1-year return
• Government bond 1-year negative alpha as futures underperformed benchmark
• Three-year alpha in line with expectations for passive portfolio
• Wide dispersion in Risk Parity returns due to market volatility
• Low Volatility impacted by factor bias and market swings
• Reinsurance provided non-correlated returns as intended
Assets
Portfolio $, billion Return Alpha (bp) Return Alpha (bp)
Government Bonds (GB) $18.6 16.4% +4 12.1% +10
GB Synthetic 3.4 14.2% -82
Global Bond Futures 0.1 10.1% -625
Government Bonds Subtotal $22.0 15.7% -27 11.8% +1
Internal Risk Parity $9.5 -5.4% -853 3.9% -200
External Risk Parity 3.7 3.7% +65 5.8% -11
Risk Parity Subtotal $13.2 -3.6% -665 3.9% -195
Low Volatility $4.0 -3.3% -1013 3.4% -276
Reinsurance $0.6 5.6% +369 1.2% -108
Total RPM Strategies $39.2
1-Year 3-Year

8
• Bonds have continued to be a diversifier through recent turmoil
• As discussed at September Board meeting, we continue to monitor this relationship
Treasuries provided strong returns and other benefits
• In addition to strong returns, government bonds provided capital for rebalancing
• Bonds also used for margin and as collateral for securities lending and repo program
(1.0)
(0.8)
(0.6)
(0.4)
(0.2)
-
0.2
0.4
0.6
S-19 O-19 N-19 D-19 J-20 F-20 M-20 A-20 M-20 J-20 J-20 A-20 S-20
Rolling monthly correlation: Long Treasuries and S&P 500
$(8)
$(6)
$(4)
$(2)
$-
$2
$4
$6
O-19 N-19 D-19 J-20 F-20 M-20 A-20 M-20 J-20 J-20 A-20 S-20
$b
n Rolling monthly flows (from)/into Government Bonds

9
• Manager performance varied widely due to portfolio construction differences
• Internal Risk Parity recent performance disappointing but not outside of expectations
-30%
-20%
-10%
0%
10%
20%
30%
40%
N-15 M-16 N-16 M-17 N-17 M-18 N-18 M-19 N-19 M-20
Rolling 1-Yr Risk Parity Manager Returns Range
• Despite drawdown, Internal Risk Parity (IRP) has performed well since inception
• Internal performance is more than 20% above peer average since inception
Risk Parity struggled but long-term performance on track
-20%
0%
20%
40%
60%
80%
100%
120%
Jun-13 Jun-14 Jun-15 Jun-16 Jun-17 Jun-18 Jun-19 Jun-20
Cumulative Risk Parity Manager Returns
Manager A Manager B Manager C Manager D IRP
30% range
10% range
Source: HFR Risk Parity Index

10
Source Leverage
Implementation Market Intelligence
Rebalance
Identify cost effective means
to source financing
Reduce implementation
costs
Ensure the Trust is positioned as intended on a
daily basis
Ongoing strategic asset allocation
analysis and research
Asset Allocation
Enhance collective knowledge and
identify peer best practices
Portfolio Management, Asset Allocation and Market Intelligence
Items circled in grey to be discussed in more detail

11
• Enhanced forecasting of Trust rebalance needs
• Daily review in conjunction with Operations to ensure rebalance plan evolves with market returns
• Trust financing shifted to repos
• Repo agreements are now the primary financing tool given the lower cost and tighter tracking error
Portfolio Management made several improvements
Hypothetical positioning shown above
-$2bn
$0bn
$2bn
$4bn
$6bn
$8bn
$10bn
$12bn
$14bn
O-19 N-19 D-19 J-20 F-20 M-20 A-20 M-20 J-20 J-20 A-20 S-20
Bond Futures Equity Futures Swaps Repos
$(2.0)
$(1.5)
$(1.0)
$(0.5)
$-
$0.5
$1.0
$1.5
$2.0
9/6 9/8 9/10 9/14 9/16 9/18 9/22 9/24 9/28
$b
n
USA EAFE EM Govt Bonds Risk Parity Cash Net Invest. Exp
Over/(Under) Weight by Asset Class
12
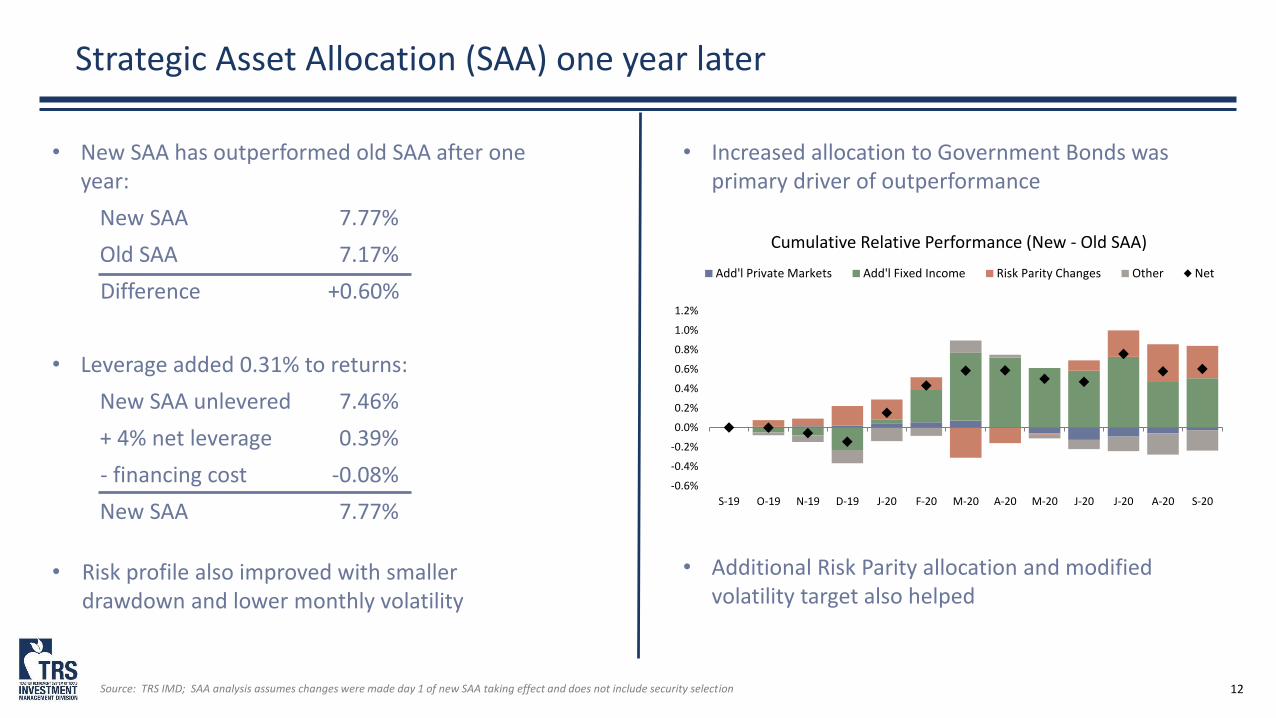
Strategic Asset Allocation (SAA) one year later
• New SAA has outperformed old SAA after one year:
New SAA 7.77%
Old SAA 7.17%
Difference +0.60%
• Leverage added 0.31% to returns:
New SAA unlevered 7.46%
+ 4% net leverage 0.39%
- financing cost -0.08%
New SAA 7.77%
• Risk profile also improved with smaller drawdown and lower monthly volatility
• Increased allocation to Government Bonds was primary driver of outperformance
• Additional Risk Parity allocation and modified volatility target also helped
Source: TRS IMD; SAA analysis assumes changes were made day 1 of new SAA taking effect and does not include security selection
-0.6%
-0.4%
-0.2%
0.0%
0.2%
0.4%
0.6%
0.8%
1.0%
1.2%
S-19 O-19 N-19 D-19 J-20 F-20 M-20 A-20 M-20 J-20 J-20 A-20 S-20
Cumulative Relative Performance (New - Old SAA)
Add'l Private Markets Add'l Fixed Income Risk Parity Changes Other Net
13
In conclusion
1. Battle plans helped throughout market turmoil
2. Government Bond allocation proved beneficial
3. Risk Parity underperformed in recent period
4. Improvements made to rebalance forecasting and Trust financing
5. SAA changes helped in first year


Bernie Bozzelli, Senior Managing Director
Demetrius Pope, Director
Annual Update to the Board:
Trading
December 2020
2
Agenda
I. Mandate
I. Team Profile
II. Whom We Serve
III. Trading Partner Network
IV. Trading Activity
V. Equity Trading Performance
VI. Special Topic
VII. Accomplishments and Priorities

3
Trading Mandate
For year ended September 30, 2020Source: TRS IMD
Implementation
• Total Trust Execution: Global execution across multiple asset classes totaled $414 billion over past 12 months
• Network: Manage a global network of 46 brokerage firms
• Outperformance: Outperformed the median peer equity trading desk by 10.4 basis points over past 12 months, placing us in the 1st quartile. We have performed in-line with the median peer desk or better for 12 straight years.
Index
Management
• Index Portfolio: Manage U.S., EAFE+Canada, and Emerging Markets Passive Equity Portfolios which totaled $2.2 billion as of 9/30/20
• Full Replication: Benchmark indices are fully replicated in the portfolio in real-time to achieve tight tracking error and in-line performance
Market
Intelligence
• Collaboration: Collaborate across the IMD to provide implementation solutions
• Committees: Chair IMD Management Committee, Ambassadors, Diversity Council

4
Trading Group
Demetrius PopeDirectorGlobal Equity - EuropeBBA, Sam Houston14 years TRS20 years experience
Don StanleySenior AssociateGlobal Equity - Asia BBA, UT Austin7 years TRS12 years experience
Sean Letcher, CFAInvestment ManagerUS Equity and Futures BS, Business, Texas A & M8 years TRS13 years experience
Jaime LlanoDirectorFutures and Currency MBA, Finance, St. Edwards 15 years TRS21 years experience
Bernie Bozzelli, CFASenior Managing DirectorMPA, Accounting, UT Austin25 years TRS
Pat BarkerSenior Trading Analyst31 years TRS43 years experience2 time Golden Apple Award winner
Steve PetersonDirectorUS Equity MBA, California Lutheran University12 years TRS25 years experience
Maribel NesudaAdministrative AssistantTeam Support10 years TRS25 years experience
23Years of average
investment experience
2MBAs
2CFAs
1Masters of Accounting
5
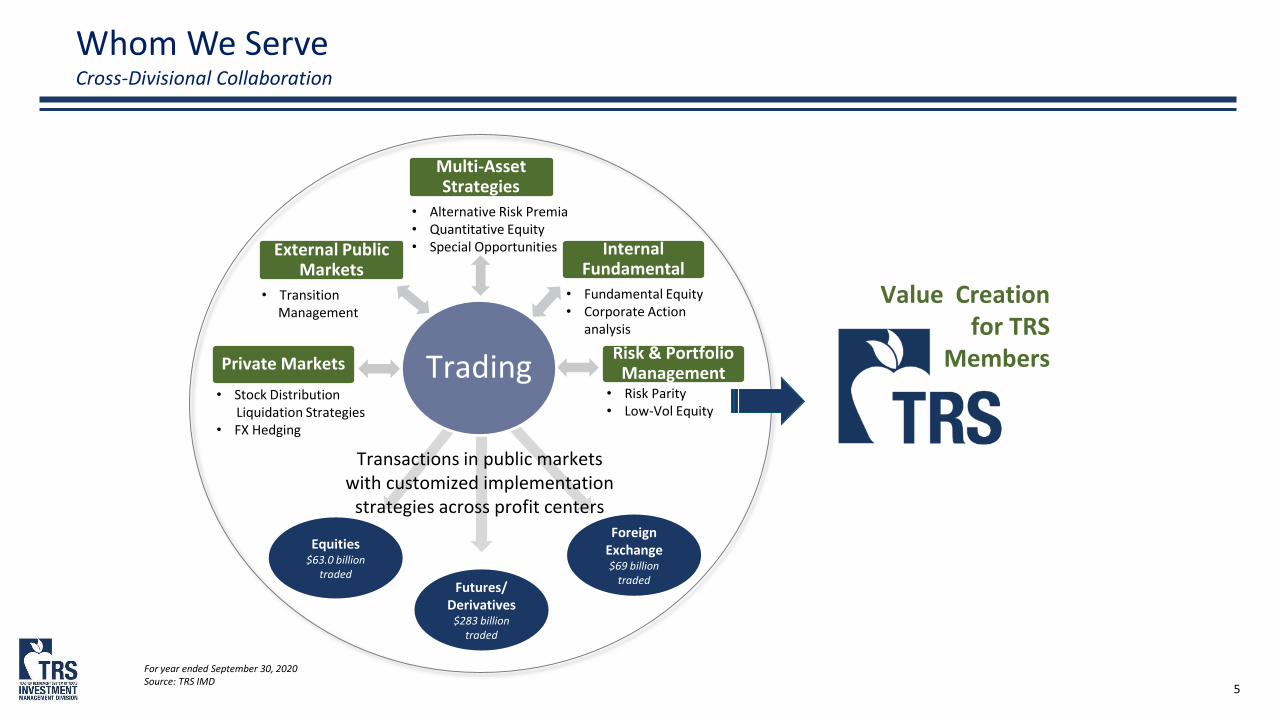
Whom We ServeCross-Divisional Collaboration
• Stock DistributionLiquidation Strategies
• FX Hedging
ForeignExchange$69 billion
traded
Transactions in public markets with customized implementation
strategies across profit centers
Value Creation for TRS
MembersRisk & Portfolio Management
• Risk Parity • Low-Vol Equity
• Alternative Risk Premia• Quantitative Equity• Special Opportunities
• Fundamental Equity• Corporate Action
analysis
• Transition Management
Equities$63.0 billion
tradedFutures/
Derivatives$283 billion
traded
External Public Markets
Multi-Asset Strategies
Internal Fundamental
Private Markets Trading
For year ended September 30, 2020Source: TRS IMD

6
Trading Partner NetworkAs of September 30, 2020
4 Firms• Deliver focused and high capacity global relationships across all asset classes• Highly integrated with TRS trading, risk management, administrative systems, etc.• Leading providers of investment services – TRS is a preferred client, receiving the
highest level of service available
3 Firms• Well established firms with overall world class global services capabilities• World renowned for research and technology• Best-of-breed product process development
31 Firms• Includes firms who have a specialty in finding liquidity for hard-to-trade names or
firms who have a niche in electronic trading• Firms who have a core competency of trading internationally in particular regions
are also included
8 Firms• All newly approved firms doing business with TRS
Premier (40-60%)3-5 Firms
Core (20-30%)5-10 Firms
Execution (20-30%)15-30 Firms
Pilot(1-10%)
5-10Firms

7
Annual Trading Activity
For year ended September 30, 2020Source: TRS IMD
JPMorgan$64.7
Goldman Sachs$45.6
Morgan Stanley$39.3
Citigroup$38.5
UBS$36.8
Credit Suisse$30.4
Barclays$10.7
Quantitative Brokers$45.1
Remaining Execution (27 firms)
$35.7
Societe Generale$29.0
Merrill Lynch/BofA$24.7
BNP$10.2
Pilot$3.3
Total Notional Trade by Broker($, billions)Internal
Fundamental$16.9
Passive$4.5
Quant$95.3
EPU Overlay$22.1
Transition$9.2
Private Markets$13.2
Risk& Portfolio Management
$253.2
Total Notional Traded By Strategy($, billions)

8
Equity Trading Performance
• TRS has performed in-line with the median peer desk or better for 12 straight years
• Trading retained $468 million of TRS alpha over this time
• TRS equity execution is measured against the Virtu peer universe of institutional investors. The median performance of our peer universe is our benchmark.
Source: ITG/Virtu
9
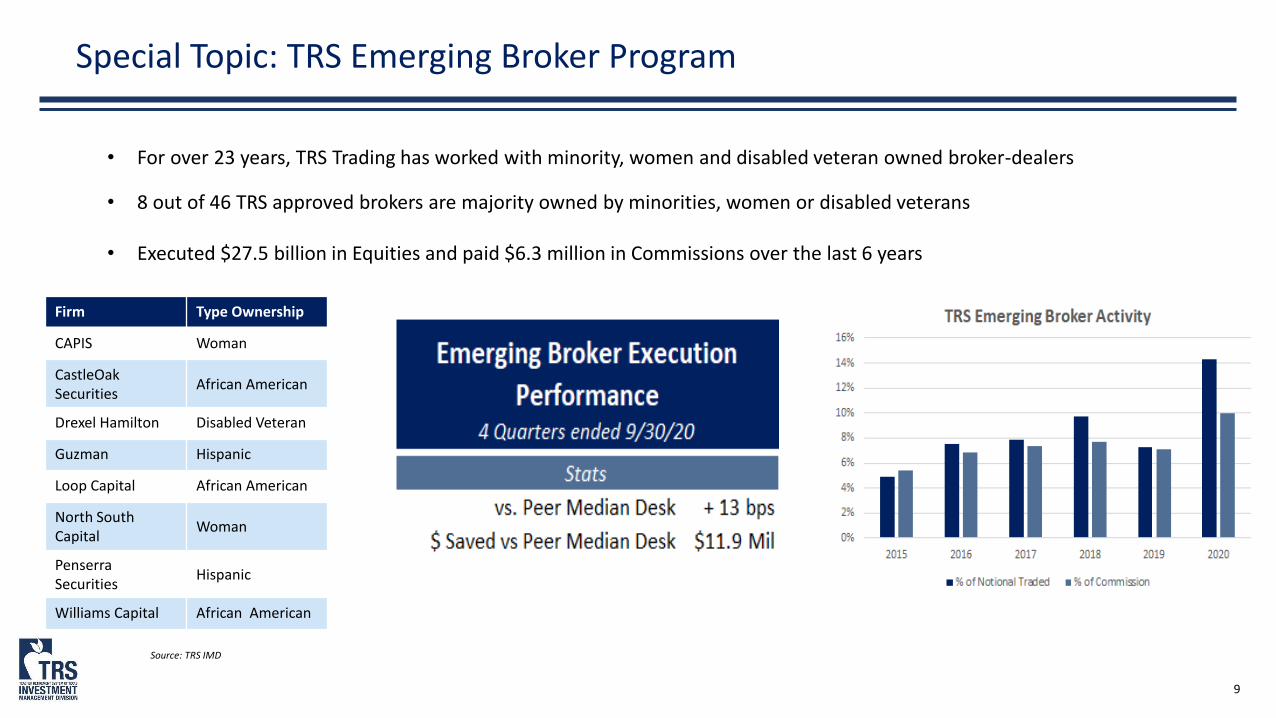
Special Topic: TRS Emerging Broker Program
• For over 23 years, TRS Trading has worked with minority, women and disabled veteran owned broker-dealers
• 8 out of 46 TRS approved brokers are majority owned by minorities, women or disabled veterans
• Executed $27.5 billion in Equities and paid $6.3 million in Commissions over the last 6 years
Source: TRS IMD
Firm Type Ownership
CAPIS Woman
CastleOak Securities
African American
Drexel Hamilton Disabled Veteran
Guzman Hispanic
Loop Capital African American
North South Capital
Woman
Penserra Securities
Hispanic
Williams Capital African American

10
Accomplishments and Priorities
2020 Accomplishments
• Outperformed the median equity trading desk of our peers by 10 bps resulting in $64 million in savings compared to the peer median desk
• Continued to enhance and refine systematic trading strategies for all quantitative flow
• In conjunction with Operations and Public Markets, we successfully managed $21 billion in transitions between TRS external managers and TRS internal strategies
• Effectively managed all the passive equity portfolios
2021 Priorities
• Develop process/procedures to trade Repos directly with other counterparties. TRS will save in brokerage fees by eliminating the need to trade through a third party broker/dealer.
• Work with BestX, our FX Transaction Cost Analysis provider, to develop a systematic process to analyze the quality of off-book FX transactions

APPENDIX
12
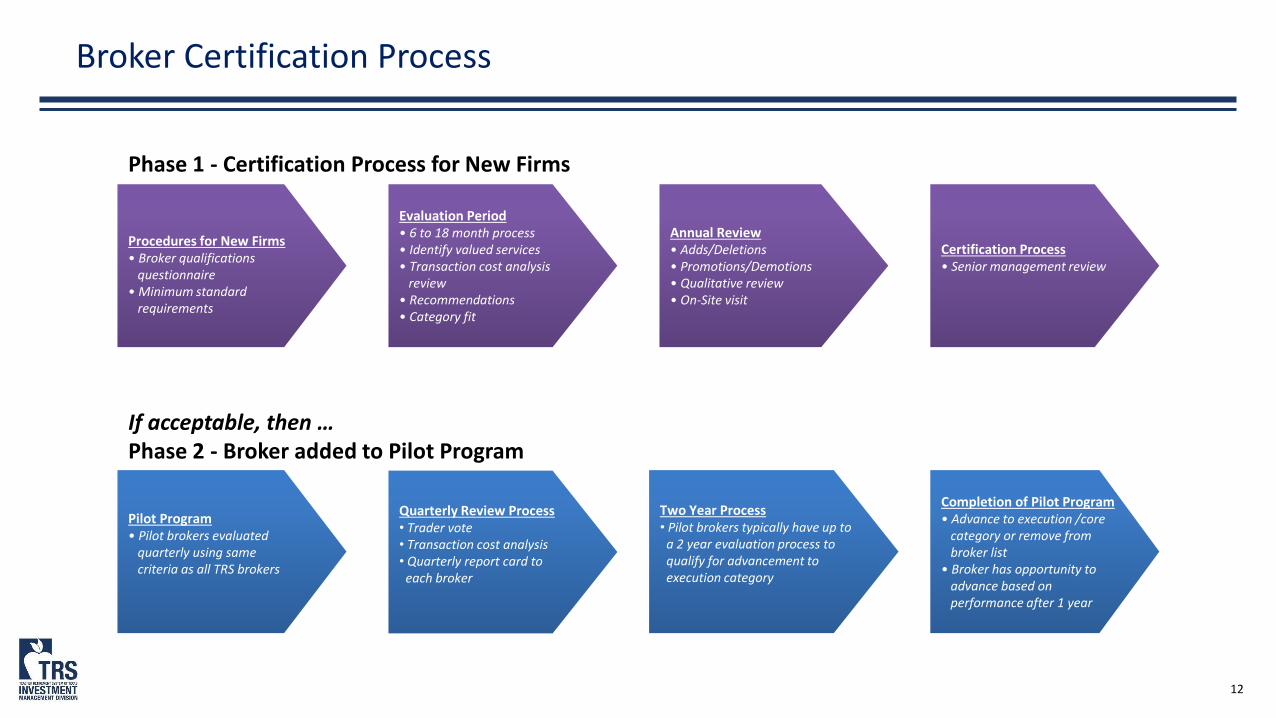
Broker Certification Process
Phase 1 - Certification Process for New Firms
Procedures for New Firms• Broker qualifications
questionnaire• Minimum standard
requirements
Evaluation Period• 6 to 18 month process• Identify valued services• Transaction cost analysis
review• Recommendations• Category fit
Annual Review• Adds/Deletions• Promotions/Demotions• Qualitative review• On-Site visit
Certification Process• Senior management review
If acceptable, then …Phase 2 - Broker added to Pilot Program
Pilot Program• Pilot brokers evaluated
quarterly using same criteria as all TRS brokers
Quarterly Review Process• Trader vote• Transaction cost analysis• Quarterly report card to
each broker
Two Year Process• Pilot brokers typically have up to
a 2 year evaluation process to qualify for advancement toexecution category
Completion of Pilot Program• Advance to execution /core
category or remove from broker list
• Broker has opportunity toadvance based on performance after 1 year

13
This slide was intentionally left blank.

14
This slide was intentionally left blank.
Ashley Baum, Director, Special Opportunities
Absolute Return
December 2020

2
Risk Parity 8%
Source: State Street
AR TARGET % OF TRUST HISTORICAL TRUST ALLOCATION
Absolute Return 0%
Global Equity54%
Real Return21%
Stable Value21%
Risk Parity 8%
Net Asset Allocation Leverage (4%)
Absolute Return is “a broad category that includes all assets that have a high probability of generating a positive absolute return regardless of market conditions over a one- to three-year period”• Policy range of 0-20% with a target of 0% • Actual size depends on the opportunities available
0%
1%
2%
3%
4%
5%
6%
7%
8%
AR % of Trust
Illiquid Credit
Opportunity
Dislocated Credit
Opportunity
Role in the TrustAbsolute Return (AR)
3
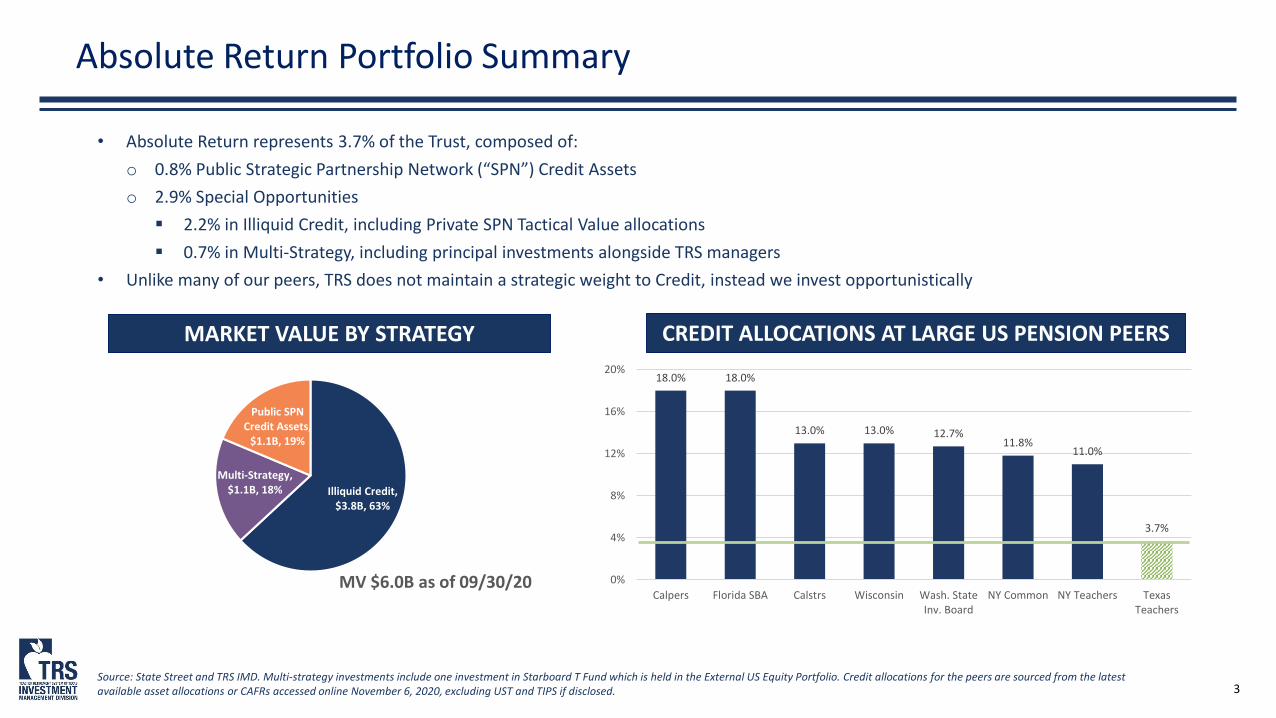
Absolute Return Portfolio Summary
• Absolute Return represents 3.7% of the Trust, composed of:o 0.8% Public Strategic Partnership Network (“SPN”) Credit Assetso 2.9% Special Opportunities 2.2% in Illiquid Credit, including Private SPN Tactical Value allocations 0.7% in Multi-Strategy, including principal investments alongside TRS managers
• Unlike many of our peers, TRS does not maintain a strategic weight to Credit, instead we invest opportunistically
Source: State Street and TRS IMD. Multi-strategy investments include one investment in Starboard T Fund which is held in the External US Equity Portfolio. Credit allocations for the peers are sourced from the latest available asset allocations or CAFRs accessed online November 6, 2020, excluding UST and TIPS if disclosed.
MARKET VALUE BY STRATEGY CREDIT ALLOCATIONS AT LARGE US PENSION PEERS
18.0% 18.0%
13.0% 13.0% 12.7%11.8%
11.0%
3.7%
0%
4%
8%
12%
16%
20%
Calpers Florida SBA Calstrs Wisconsin Wash. StateInv. Board
NY Common NY Teachers TexasTeachers
Illiquid Credit, $3.8B, 63%
Multi-Strategy, $1.1B, 18%
Public SPNCredit Assets,
$1.1B, 19%
MV $6.0B as of 09/30/20

4
Why Deploy In Absolute Return?
Source: J.P. Morgan Long-Term Capital Market Assumptions 2013-2020; 10-year assumptions are published the year prior.
8% Target Return
• Investments expected to return 8% are attractive relative to other public market assets
• Expected returns in liquid public markets have continued to fall since we began this effort in 2013
• The Board approved the SPN Tactical Value allocation in 2015 for the same reason
0%
1%
2%
3%
4%
5%
6%
7%
8%
9%
10%
2013 2014 2015 2016 2017 2018 2019 2020 2013 2014 2015 2016 2017 2018 2019 2020 2013 2014 2015 2016 2017 2018 2019 2020
US Equities High Yield US Treasuries
EXPE
CTED
RET
URN
S (%
)
10 Year Capital Market Assumptions
5
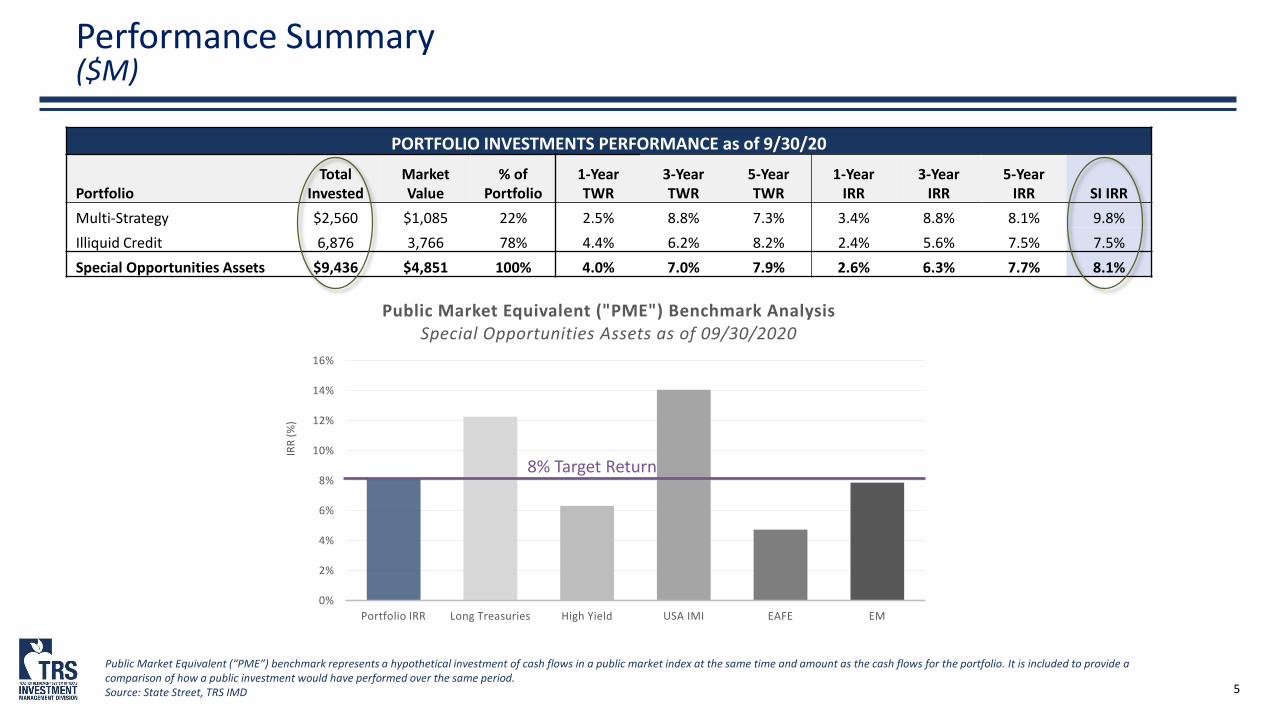
Public Market Equivalent (“PME”) benchmark represents a hypothetical investment of cash flows in a public market index at the same time and amount as the cash flows for the portfolio. It is included to provide a comparison of how a public investment would have performed over the same period. Source: State Street, TRS IMD
PORTFOLIO INVESTMENTS PERFORMANCE as of 9/30/20
PortfolioTotal
InvestedMarket Value
% of Portfolio
1-YearTWR
3-YearTWR
5-YearTWR
1-YearIRR
3-YearIRR
5-YearIRR SI IRR
Multi-Strategy $2,560 $1,085 22% 2.5% 8.8% 7.3% 3.4% 8.8% 8.1% 9.8%Illiquid Credit 6,876 3,766 78% 4.4% 6.2% 8.2% 2.4% 5.6% 7.5% 7.5%Special Opportunities Assets $9,436 $4,851 100% 4.0% 7.0% 7.9% 2.6% 6.3% 7.7% 8.1%
Performance Summary($M)
0%
2%
4%
6%
8%
10%
12%
14%
16%
Portfolio IRR Long Treasuries High Yield USA IMI EAFE EM
IRR
(%)
Public Market Equivalent ("PME") Benchmark AnalysisSpecial Opportunities Assets as of 09/30/2020
8% Target Return

6Source: State Street, TRS IMD
Principal Investments Summary($M)
FUND AND PRINCIPAL INVESTMENTS PERFORMANCE as of 9/30/20
PortfolioTotal
InvestedMarket Value
% of Portfolio SI IRR
Funds $7,462 $4,022 83% 7.5%Principal Investments 1,974 829 17% 10.3%TOTAL $9,436 $4,851 100% 8.1%
• Principal Investments are a key focus area for the team and we have seen good success
• 67% of all realized Principal Investments have returned above 8% IRR
• Loss ratios between 1.4% - 4.0% provide evidence that the team’s goal of selecting investments with asymmetric return profiles is working
8% Target Return
0%
2%
4%
6%
8%
10%
12%
14%
16%
Portfolio IRR Long Treasuries
High Yield USA IMI EAFE EM Portfolio IRR Long Treasuries
High Yield USA IMI EAFE EM
Funds Principal Investments
IRR
(%)
Public Market Equivalent ("PME") Benchmark AnalysisFunds & Principal Investments as of 09/30/2020
7
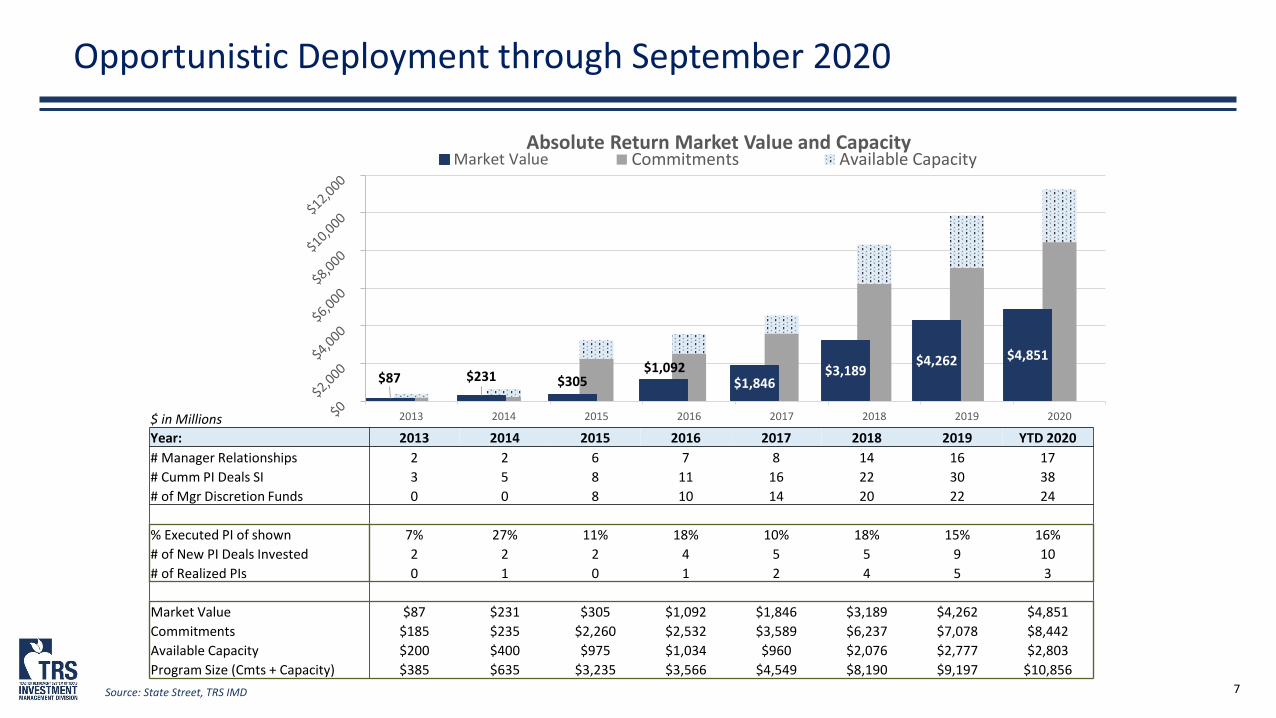
Opportunistic Deployment through September 2020
$ in MillionsYear: 2013 2014 2015 2016 2017 2018 2019 YTD 2020# Manager Relationships 2 2 6 7 8 14 16 17# Cumm PI Deals SI 3 5 8 11 16 22 30 38# of Mgr Discretion Funds 0 0 8 10 14 20 22 24
% Executed PI of shown 7% 27% 11% 18% 10% 18% 15% 16%# of New PI Deals Invested 2 2 2 4 5 5 9 10# of Realized PIs 0 1 0 1 2 4 5 3
Market Value $87 $231 $305 $1,092 $1,846 $3,189 $4,262 $4,851 Commitments $185 $235 $2,260 $2,532 $3,589 $6,237 $7,078 $8,442 Available Capacity $200 $400 $975 $1,034 $960 $2,076 $2,777 $2,803 Program Size (Cmts + Capacity) $385 $635 $3,235 $3,566 $4,549 $8,190 $9,197 $10,856
2013 2014 2015 2016 2017 2018 2019 2020
Absolute Return Market Value and Capacity Commitments Available Capacity
$87 $231 $305$1,092
$1,846$3,189
$4,262 $4,851
Market Value
Source: State Street, TRS IMD

8
COVID-19 and Credit
• Absolute Return experienced markdowns in March and April which have since recovered to pre-COVID levels
• Our emphasis on first liens and less cyclical industries insulated the portfolios from the distress and defaults still impacting credit
• Overall, we deployed $735M into the market dislocation
• SPN Tactical Value took advantage of the crisis to generate returns via its opportunistic liquid sleeves which resulted in strong returns
Distress Concentrated By Industry
Yields Have Almost Fully Recovered Losses
Loan Defaults Have Surpassed All But 2009
10Y Treasuries 0.8
Investment Grade 2.0
High Yield 5.7
0
2
4
6
8
10
12
14
Jan-20 Feb-20 Mar-20 Apr-20 May-20 Jun-20 Jul-20 Aug-20 Sep-20 Oct-20 Nov-20
Yiel
d (%
)
0%
10%
20%
30%
40%
50%
60%
70%
Oil And Gas Leisure Air Transport Average (all sectors)
12/31/2019 4/30/2020 10/30/2020
Source: S&P LCD; Bloomberg. Distress and Loan Defaults shown for the S&P/LTSA Leveraged Loan Index

9
2020 ACCOMPLISHMENTS
• Performanceo Generated an 8.1% since inception IRRo Strong Principal Investment performance of 10.2% since
inception IRR
• Capital Plan Impacto Continued Selectivity—invest in ~15% of what we sourceo Deployed $735M into market dislocation in the months of
March and April
• Team Updateo Integrated Tactical Value portfolio beginning in Aprilo Filled five positions in 2020 (3 full-time, 2 contractors)
• Enhanced Special Opportunities 2.0 Infrastructure to reflect larger and more complex platform
2021 Priorities
• Focus on o Thoughtful Deploymento Principal Investments o Scalable Opportunitieso Manager Outreach
• Tactical Value: Reassess portfolio strategy, deployment and goals in light of market competition and returns achieved
• Build the Fleet: Ramp and train new team members
Summary: Accomplishments and PrioritiesAbsolute Return
APPENDIX

11
OrganizationSpecial Opportunities Team
12Advanced
degrees and certifications
5New additions
in 2020
Ashley Baum, CFA, CPADirectorHead of Special OpportunitiesMPA, AccountingUT Austin
Michael Phillips, CPAInvestment ManagerHead of Credit Special OpportunitiesMA, MusicCambridge
John GrellnerAssociateMBAUT Austin
Dylan CampbellSenior Associate MA, Finance, Claremont McKenna
Nick YanagimachiBlackrock Secondee MA, FinanceUniversity of Monaco
Nichole Burnap, CFA, CPAInvestment ManagerHead of Equity Special Opportunities MS, Finance, AccountingWake Forest University
Liam GarrettSenior Analyst, Contractor MS, FinanceUT Austin
Taylor GordonShared Administrative Assistant, ContractorBS, Hospitality AdministrationBoston University
Mohan BalachandranSenior Managing DirectorHead of MSG, Member of IICPhD, PhysicsBrown University
David DeStefano, CFASenior DirectorInternal FundamentalUS SMID PMMBAUT AustinMembers of the
Special Opportunities
Investment Committee

12
Implementation Options
• In addition to differences in expected return as the level of difficulty increases, TRS must optimize its human capital toward efforts that are scalable and ultimately “move the meter”
• TRS has successfully built a co-investment platform for multi-strategy and credit and is exploring whether and how we may expand our execution capabilities
Complexity
Expected Returns
①
Fund Investments
②
Co-Investments
③
Co-Sponsor
④
PlatformSponsor
⑤
Internal Platform
TRS Today
Fund Investments: allocating money and investment discretionto outside managersCo-Investments: investing alongside managers into one-offmanager-sponsored investments; can opt into participation,decreasing feesCo-Sponsor: sponsoring investments alongside managers inwhich there are no feesPlatform Sponsor: sponsoring an external platform andparticipating in the profitsInternal Platform: replicating an external platform inside TRS
Deployment Trade-Offs
①
②
③
④
⑤

13
This slide was intentionally left blank.

14
This slide was intentionally left blank.