
December 2019 Legislative Council Staff Economic & Revenue ...
49
Economic & Revenue Forecast Presentation to the Joint Budget Committee December 20, 2019 December 2019 Legislative Council Staff
Transcript of December 2019 Legislative Council Staff Economic & Revenue ...

Economic & Revenue Forecast
Presentation to the Joint Budget CommitteeDecember 20, 2019
December 2019 Legislative Council Staff

2
Economic Outlook

3
2.1%
-10%
-8%
-6%
-4%
-2%
0%
2%
4%
6%
8%
I II III IV I II III IV I II III IV I II III IV I II III IV I II III IV I II III IV I II III IV I II III IV I II III IV I II III IV I II III
2008 2009 2010 2011 2012 2013 2014 2015 2016 2017 2018 2019
Gov't Consumption & Investment
Net Exports
Gross Private Investment
Personal Consumption Expenditures
Consumers continue to drive growth in economic activity
Contributions to Real Gross Domestic Product (GDP)
Annualized Change over the Prior Quarter
Source: U.S. Bureau of Economic Analysis. Seasonally adjusted annual rates.
Real GDP

4
Employment growth continues, but will slow further as
the labor market tightens
-6%
-4%
-2%
0%
2%
4%
6%
1999 2001 2003 2005 2007 2009 2011 2013 2015 2017 2019
Source: U.S. Bureau of Labor Statistics. Seasonally adjusted. Colorado nonfarm employment estimates include estimates of
revisions expected by Legislative Council Staff as a part of the annual rebenchmark process.
Colorado
U.S.
Year-over-Year Change in Nonfarm Employment
2.0%1.5%

5
$24
$25
$26
$27
$28
$29
$30
$31
2007 2009 2011 2013 2015 2017 2019
Wages will continue to rise as labor shortages in many
industries persist, constraining business growth and profits
Source: U.S. Bureau of Labor Statistics. Seasonally adjusted. Adjusted for inflation using the CPI-U for all urban areas.
Real Average Hourly Earnings
2019 Dollars
U.S.
Colorado
$28.29
$30.63

6
30
40
50
60
70
2007 2009 2011 2013 2015 2017 2019
Contracting
Expanding
Manufacturing activity remains in contractionary
territory and business activity has slowed
Source: Institute for Supply Management.
Institute for Supply Management Indices
Diffusion Index
Manufacturing
Business Activity

7
80
85
90
95
100
105
110
115
120
125
$0
$50
$100
$150
$200
U.S. ExportsMillions of Dollars
Goods
Services
A strong dollar makes imports cheaper, but exports
more expensive
Source: Federal Reserve Board of Governors & Bureau of Economic Analysis (balance of payments basis). Seasonally adjusted.
Trade Weighted U.S. DollarIndex of the Dollar to Foreign Currencies
Appreciating
Depreciating
Broad Index

8
2.0%
2.3%
-0.6%
2.0%
2.9%
-1.6%
-0.1%
4.2%
1.9%
2.2%
2.4%
Headline
Core
Energy
Food
Housing
Apparel
Transportation
Medical Care
Recreation
Education
Other
-3%
-2%
-1%
0%
1%
2%
3%
4%
5%
6%
7%
2009 2011 2013 2015 2017 2019
Inflationary pressures remain fairly subdued
Source: U.S. Census Bureau. Seasonally adjusted.
CPI-U Inflation, U.S. City AverageYear-over-Year Change in Prices November 2019 over November 2018
HeadlineCore

9
Crude oil prices remain subdued by strong supply,
weaker demand
Source: Energy Information Administration.
Average weekly prices through December 13, 2019.
West Texas Intermediate
Crude Oil PriceDollars per Barrel
$0
$40
$80
$120
$160
Crude Oil ProductionMillions of Barrels per Month
Source: Energy Information Administration. Three-month
moving averages. Data are through August 2019.
2
4
6
8
10
12
14
16
18
140
180
220
260
300
340
380
420Colorado
Right Axis
United States
Left Axis

10
Economic Outlook
U.S. and Colorado economic growth will continue, but at
slower rates
• Labor markets will tighten further, constricting business growth
and profits with higher wages
• Inflationary pressures will remain subdued on slower global
economic demand for goods and slowing housing costs
• Energy, manufacturing, and export industry activity expected to
remain soft into 2020
Recessionary risk for 2020 has eased, but risk remains elevated
for the forecast period.

11
General Fund Budget Outlook

12
$4
$6
$8
$10
$12
$14
Ongoing shifts in taxpayer behavior and slowing economic
growth are expected to drive General Fund revenue growth
Source: Colorado Office of the State Controller and Legislative Council Staff December 2019 forecast.
Gross General Fund RevenueBillions of Dollars
Change Relative to September Expectations
FY 2019-20: –$10.9M
FY 2020-21: +$166.1M
3.0%4.1%
4.1%
14.1%
Year-over-Year
Growth
7.2%
13
$7
$8
$9
$10
$11
$12
$13
$14
$15
$16
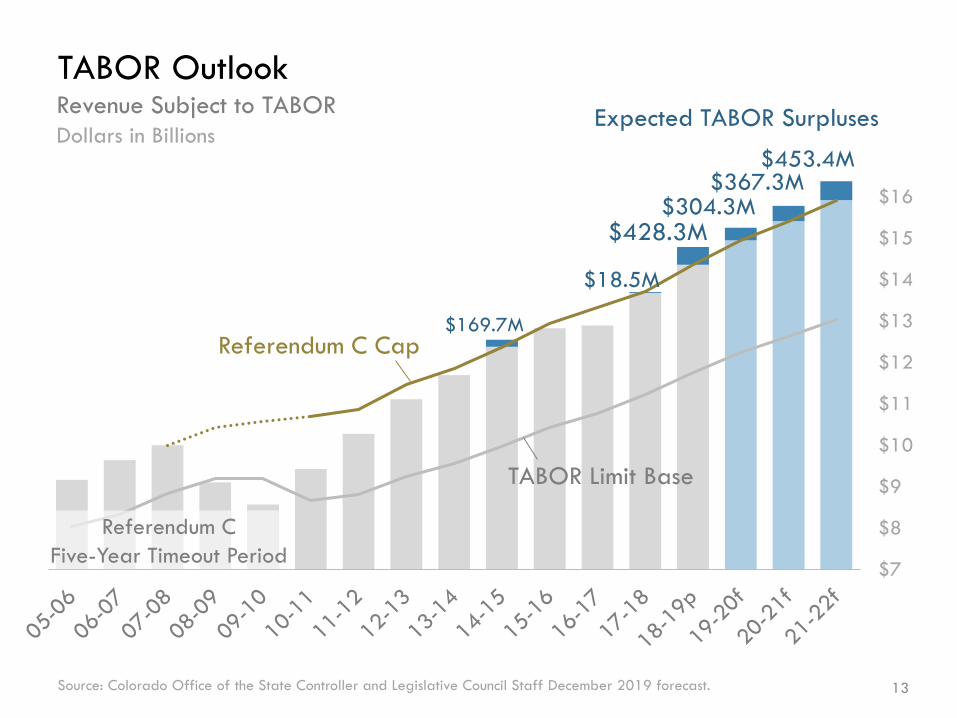
TABOR Outlook
Source: Colorado Office of the State Controller and Legislative Council Staff December 2019 forecast.
Revenue Subject to TABOR
Dollars in Billions
Referendum C
Five-Year Timeout Period
Referendum C Cap
TABOR Limit Base
Expected TABOR Surpluses
$169.7M
$428.3M
$18.5M
$304.3M$367.3M
$453.4M

14
$0
$50
$100
$150
$200
$250
$300
$350
$400
$450
$500
2018-19 2019-20 2020-21 2021-22
Expected TABOR Refunds & General Fund Budget Impacts
TABOR surplus revenue is set aside in the year in which a
surplus occurs to pay refunds in the following budget year
TABOR Surplus & Set Aside:
Refunded in Fiscal Year: 2019-20 2020-21 2021-22 2022-23
Source: Colorado Office of the State Controller and Legislative Council Staff December 2019 forecast.
*This amount includes $0.1 million in underrefunds from the FY 2014-15 surplus.
Dollars in Millions
$428.5M*
Income Tax Rate Reduction
Reimbursements to Local Govts for Property Tax Exemptions
$304.3M
$367.3M
$453.4M
Sales Tax Refund Mechanism

15
$0
$200
$400
$600
$800
$1,000
$1,200
$0
$200
$400
$600
$800
$1,000
$1,200
Changes relative to
September:
+$120.5 million
Last Year FY 2018-19 General Fund ReserveDollars in Millions
Source: Legislative Council Staff forecasts based on current law.
7.25%
Reserve
Requirement
$814.2M
Surplus Above
Required Reserve
11.3% Reserve
$452.4M
December 2019
Forecast
September 2019
Forecast
The change is attributable
to a new assumption for
the FY 2018-19 year-end
balance based on the
Basic Financial Statements.
This amount will be
updated with the release
of the CAFR.
$814.2M
10.2% Reserve
$331.8M

16
$0
$200
$400
$600
$800
$1,000
$1,200
$0
$200
$400
$600
$800
$1,000
$1,200
Changes relative to
September:
+$62.3 million
Source: Legislative Council Staff forecasts based on current law.
8.3% Reserve
$871.1M 7.25%
Reserve
Requirement
$871.3M
Surplus Above
Required Reserve $121.6M
8.8% Reserve
$184.0M
Current Year FY 2019-20 General Fund ReserveDollars in Millions
Higher beginning balance
(carried over from FY 2018-19)
Higher TABOR refund obligation:
Increased cash funds revenue
expectations (+51.5M)
Small adjustments to
appropriations, transfer amounts
December 2019
Forecast
September 2019
Forecast

17
-$100
$0
$100
$200
$300
$400
$500
$600
$700
$800
$900
1
$0
$100
$200
$300
$400
$500
$600
$700
$800
$900
1-$100
$0
$100
$200
$300
$400
$500
$600
$700
$800
$900
1
Next Year FY 2020-21 Budget Outlook ScenariosAmounts above or below the required 7.25% reserve.
Incorporates the revenue forecast, current law transfers, rebates and
expenditures, TABOR refund obligations, and the reserve requirement.
$832.5M
Source: Legislative Council Staff December 2019 forecast.
*2020 population and inflation projections. **Appropriations growth over the past two economic expansions.
Hold FY 2019-20
Appropriations Constant
Grow Appropriations by
Inflation + Population
Growth (3.3%)*
Grow Appropriations by
Historical Expansionary
Growth (6.0%)**
$407.1M
$55.5M

18
Risks to the Forecast
Upside Risks for FY 2019-20
• Ongoing shifts in taxpayer behavior with federal tax law changes
• Taxation of out-of-state (including online) sales tax collections
Available General Fund Collections Data as a Share of Total Fiscal Year Collections*
*Six-year average of actual collections data, FY 2013-14 to FY 2018-19p.
7%
14%23%
31%
38%46%
57%
62%69%
83%
90%
99%
100%
Jul
Aug
Sep
Oct
Nov
Dec
Jan
Feb
Mar
Apr
May
Jun
Period 13
September Forecast
December Forecast
March Forecast
How Much Do We Know About FY 2019-20?
June Forecast
19
Risks to the Forecast
Elevated downside risk for FY 2020-21 and FY 2021-22
• Slower growth as the economic expansion matures
• Leading indicators improved some, but still flashing warning signs
In the current TABOR refund situation…
• The TABOR limit will constrain revenue growth
• Upside surprises mean larger TABOR refunds
• Higher than expected cash fund revenue will increase General Fund
budgetary pressures

20
TABOR Refunds are refunded from General Funds
Cash Funds
General Funds
In a TABOR surplus situation…
General
Funds
TABOR Refunds
General Fund dollars in = General Fund dollars out
Amount
available for
the General
Fund Budget
TABOR Limit

21
General Funds
Cash Funds
TABOR Refunds
TABOR Refunds are refunded from General Funds
Cash Fund dollars in = General Fund dollars out
General
Funds
In a TABOR surplus situation…
Amount
available for
the General
Fund Budget
TABOR Limit

22
$235.7
$142.4 $112.8 $117.4
$361.7
$429.7$417.6 $440.5
$0
$100
$200
$300
$400
$500
$600
Dollars in Millions
Severance Taxes Are Noisy
Gross
Severance Taxes
Net Severance
Tax Revenue
Ad Valorem
Credit
$597.4$572.1 $557.9
$530.4
Source: Legislative Council Staff calculations base on the December 2019 forecast.

23
$264.7
$5.2 $4.0 $126.2
$235.7
$142.4 $112.8 $117.4
$0
$100
$200
$300
$400
$500
$600
Dollars in Millions
Severance Taxes Are Noisy
Source: Office of the State Controller and Legislative Council Staff December 2019 forecast (f).
Net Severance Tax Revenue

24
K-12 Enrollment Forecast

25
K-12 Public School Enrollment Full-Time Equivalent (FTE) Students
Source: Colorado Department of Education and Legislative Council Staff December 2019 forecast.*Percent change from 2018-19, when kindergarten students were counted as 0.5 FTE.
Region Actual
2019-20 Percent
Change*
Metro Denver 494,190 3.2% Northern 91,722 4.8% Colorado Springs 124,019 4.7%
Pueblo 33,370 4.0% Eastern Plains 26,898 4.4% San Luis Valley 7,414 2.8%
Mountain 25,489 2.6% Southwest Mountain
13,589 4.1%
Western 51,909 3.3%
Statewide Total 868,597 3.6%

26
810,000
820,000
830,000
840,000
850,000
860,000
870,000
880,000
Total K-12 Enrollment
Before Full-Day
Kindergarten
After Full-Day
Kindergarten
Total Enrollment if
Kindergarten = 1.0 FTE
Actual Total
Enrollment
Source: Colorado Department of Education and Legislative Council Staff December 2019 forecast (f).*Prior to 2019-20, kindergarten students were counted as 0.5 FTE.
Student FTE

27
Region Actual
2019-20 Percent
Change* Estimated
2020-21 Percent Change
Estimated 2021-22
Percent Change
Average Growth**
Metro Denver 494,190 3.2% 491,985 -0.4% 490,832 -0.2% -0.3% Northern 91,722 4.8% 93,069 1.5% 93,690 0.7% 1.1% Colorado Springs 124,019 4.7% 125,051 0.8% 125,791 0.6% 0.7%
Pueblo 33,370 4.0% 33,139 -0.7% 32,809 -1.0% -0.8% Eastern Plains 26,898 4.4% 27,188 1.1% 27,456 1.0% 1.0% San Luis Valley 7,414 2.8% 7,489 1.0% 7,545 0.7% 0.9%
Mountain 25,489 2.6% 25,368 -0.5% 25,272 -0.4% -0.4% Southwest Mountain
13,589 4.1% 13,615 0.2% 13,680 0.5% 0.3%
Western 51,909 3.3% 52,002 0.2% 52,064 0.1% 0.1%
Statewide Total 868,597 3.6% 868,907 0.0% 869,138 0.0% 0.0%
K-12 Public School Enrollment Full-Time Equivalent (FTE) Students
Source: Colorado Department of Education and Legislative Council Staff December 2019 forecast.*Percent change from 2018-19, when kindergarten students were counted as 0.5 FTE.**Compound average annual growth rate between 2019-20 and 2021-22.

28
Assessed Valuation Forecast

29
$0
$10
$20
$30
$40
$50
$60
$70
$80
$90
200
6
200
7
200
8
200
9
201
0
201
1
201
2
201
3
201
4
201
5
201
6
201
7
201
8
201
9
202
0f
202
1f
202
2f
Nonresidential
Residential
Assessed Values in Colorado
Year
Total
Assessed
Value
Percent
Change
2014 $91.6 3.3%
2015 $105.3 15.0%
2016 $101.4 -3.7%
2017 $111.6 10.1%
2018 $115.9 3.8%
2019 $135.6 17.0%
2020f $140.1 3.4%
2021f $152.2 8.6%
2022f $155.1 1.9%
Dollars in Billions
Source: Colorado Division of Property Taxation and Legislative Council Staff December 2019 forecast (f).
30
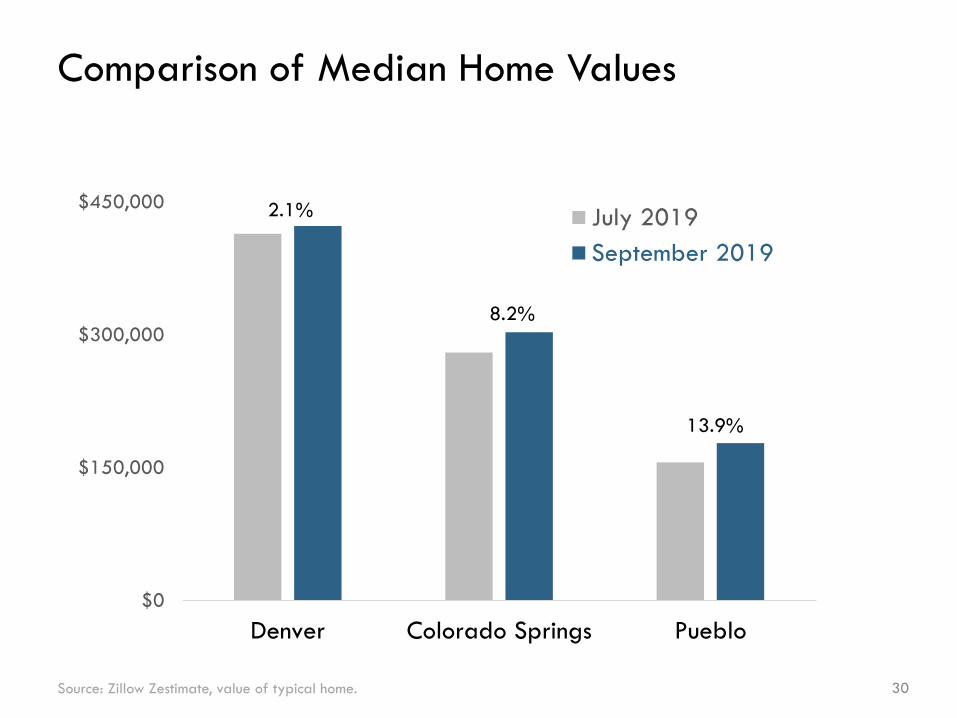
$0
$150,000
$300,000
$450,000
Denver Colorado Springs Pueblo
July 2019
September 2019
8.2%
13.9%
2.1%
Comparison of Median Home Values
Source: Zillow Zestimate, value of typical home.
31
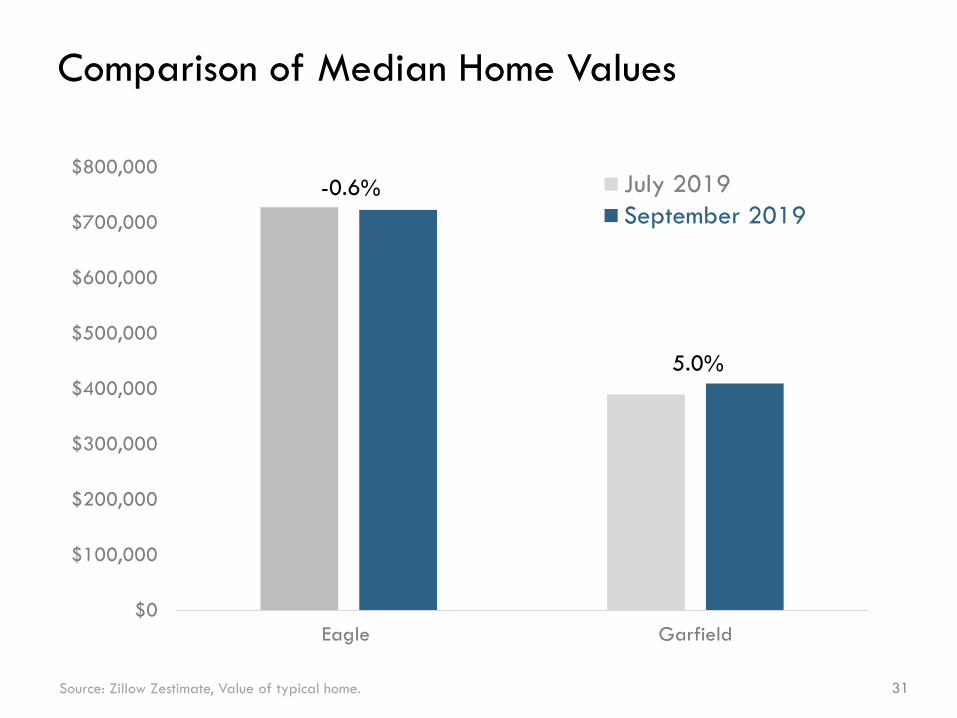
$0
$100,000
$200,000
$300,000
$400,000
$500,000
$600,000
$700,000
$800,000
Eagle Garfield
July 2019
September 2019-0.6%
5.0%
Comparison of Median Home Values
Source: Zillow Zestimate, Value of typical home.
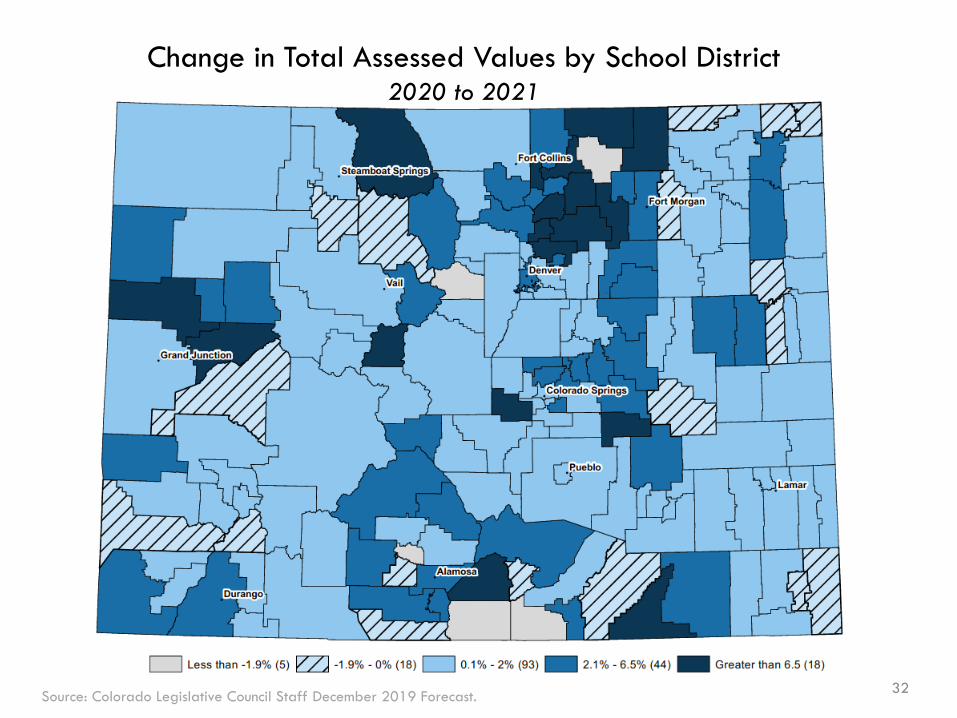
32
Change in Total Assessed Values by School District2020 to 2021
Source: Colorado Legislative Council Staff December 2019 Forecast.
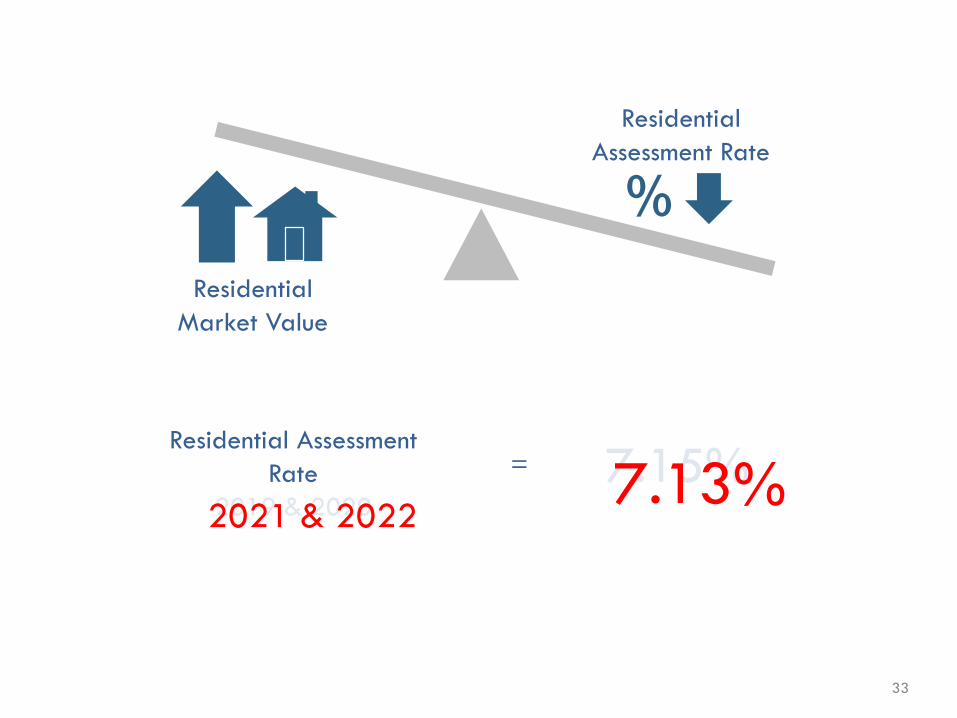
33
Residential
Market Value
Residential
Assessment Rate
%
Residential Assessment
Rate
2019 & 2020
7.15%=
2021 & 20227.13%

34
$0
$20
$40
$60
$80
$100
$120
Jan2014
Jan2015
Jan2016
Jan2017
Jan2018
Jan2019
Jan2020
Historic Price Upper bound 95%
Confidence Interval
$90.52
Lower bound 95%
Confidence Interval
$31.68
Forecast WTI
$59.50
But the forecast is not without risks
Source: U.S. Energy Information Administration, December 2019 Short Term Energy Outlook.
West Texas Intermediate (WTI) Crude Oil Price

35
What does the price of oil mean for the RAR?
Baseline* Scenario 1 Scenario 2
Implied Price of
Oil, Dec 2020$59.50 $50.50 $68.50
RAR 7.13% 7.00% 7.15%
Change in 2021
AV from baseline$0 -$2.7 billion $1.6 billion
-1.7% 1.0%
*Legislative Council Staff December 2019 forecast.
RAR = Residential assessment rate.

36
School Finance Outlook

37
Estimated
23,803 $204.2 $198.3
Funded Total
Utilization Pupil Count Program State Aid
100% 25,896 $220.6 $213.2
95% 24,702 $210.3 $202.9
90% 23,508 $200.0 $192.7
85% 22,367 $190.2 $182.9
Actual
Changes Under House Bill 19-1262
FY 2019-20 Cost of Full-Day Kindergarten ImplementationDollars in Millions

38
$4,620 $4,629 $4,620
$2,966 $2,977 $2,977
$-
$1,000
$2,000
$3,000
$4,000
$5,000
Change in Expectations for FY 2019-20 School Finance FundingDollars in Millions
Source: Legislative Council Staff December 2019 forecast.
Local Share
+$11 million
State Aid
+$9 million
Local
Share
State Aid
Local Share
+$11 million
State Aid
Current Law
Appropriation
$572 million
December 2019 Expectations
The General Assembly's Choices Range From:
Hold at $572 million Increase to $581 millionBS Factor:

39
$4,629 $4,707
$2,977 $3,054
$-
$1,000
$2,000
$3,000
$4,000
$5,000
FY 2019-20 FY 2020-21
Year-over-Year Change in School Finance Funding
FY 2019-20 to FY 2020-21Dollars in Millions
Local Share
State Aid
State Aid*
+$78 million
Local Share
+$77 million
Source: Legislative Council Staff December 2019 forecast.
*Assumes a constant Budget Stabilization Factor.

40
Implications for Balancing General Fund (GF) and
State Education Fund (SEF) Contributions in 2020-21
• $9M required increase in 2019-20; $78M increase in state aid
requirement in 2020-21year-over-year reduces flexibility.
• Increasing 2019-20 SEF spending by $9M implies $15 million
(0.4%) GF increase in 20-21.
• Increasing BS Factor by $9M implies $3 million (0.1%) GF
decrease in 2020-21.

41
Adult Corrections Population Forecast

42
The prison population is down 2.7 percent since February
Source: Department of Corrections, Office of Planning and Analysis. Monthly data.
1,800
1,850
1,900
1,950
2,000
2,050
2,100
16,500
16,700
16,900
17,100
17,300
17,500
17,700
17,900
18,100
18,300
January 2016 January 2017 January 2018 January 2019
Male Left Axis
Female Right Axis

43
Case filings are down, and so are admissions
Source: Office of the State Court Administrator (case filings) and Department of Corrections, Office of Planning and Analysis
(new court commitments). Monthly data; both series shown as six-month moving averages.
300
350
400
450
500
550
600
650
3,000
3,500
4,000
4,500
5,000
5,500
2016 2017 2018 2019
Case Filings Trends
FY 2015-16: +12.8 percent
FY 2016-17: +12.0 percent
FY 2017-18: +5.6 percent
FY 2018-19: +3.0 percent
FY 2019-20: - 4.3 percent (FYTD)
New Court Commitment Trends
FY 2016-17: +11.7 percent
FY 2017-18: +8.3 percent
FY 2018-19: +0.7 percent
FY 2019-20: -10.3 percent (FYTD)
New Court Commitments Right Axis
Monthly Case Filings Left Axis

44
Trend in commitments has reduced inmate expectations
Adult Inmate Population Forecasts as of June 30
Source: Department of Corrections and *Legislative Council Staff December 2019 forecast.
20,135
20,522
20,623
19,619
20,101 20,136
20,136
20,432
20,940
21,483
19,95119,614 19,505 19,564
17,000
18,000
19,000
20,000
21,000
22,000
23,000
24,000
FY 2013 2014 2015 2016 2017 2018 2019 2020* 2021* 2022*
Actual
December 2018 Forecast
December 2019 Forecast

45
Forecast uncertainty remains elevated
Source: Legislative Council Staff December 2019 forecast.
• This forecast always contains (bidirectional) error– Current year forecast error averages about 1.7 percent, or 328 inmates
– Budget year forecast error is about 2.1 percent, or 413 inmates
• Trajectory of new court commitments is most important
determinant of forecast accuracy
• Other risks include:
– Implementation of SB 19-143
– More parole board members and judges
– Supreme Court decision in Allman v. People
– Termination of Denver Community Corrections contracts

46
Parole caseload growth will continue
Adult Parole Caseload Forecasts as of June 30
Source: Department of Corrections and *Legislative Council Staff December 2019 forecast.
8,746
8,116
7,865
8,402 8,286
8,752
9,352
9,297
9,687
10,242
9,757
9,95910,033
7,000
7,500
8,000
8,500
9,000
9,500
10,000
10,500
FY 2013 2014 2015 2016 2017 2018 2019 2020* 2021* 2022*
Actual
December 2018 Forecast
December 2019 Forecast
47
Juvenile Corrections Population Forecast

48
All DYS Populations are FallingAverage Daily Populations through FY 2021-22
Source: CDHS Division of Youth Services and *Legislative Council Staff December 2019 forecast.
851
797
740
693
651 647
578
488452
426
308
291 282 275257 263 254 242 237 234
332
281
246 247220 210 213
184149 141
0
100
200
300
400
500
600
700
800
900
FY 2013 2014 2015 2016 2017 2018 2019 2020* 2021* 2022*
Commitment
Detention
Parole
New court commitments to
DYS decreased 29.1 percent
during FY 2018-19

49
Questions?
Kate WatkinsChief Economist • Legislative Council Staff
[email protected] • (303) 866-3446
www.leg.colorado.gov/lcs