December 2016 - Pattern for Progress
16
BEYOND Gentrification FINDING A BALANCE December 2016
Transcript of December 2016 - Pattern for Progress

BEYOND Gentrification
FINDING A BALANCE
December 2016

Hudson Valley Pattern for Progress | Page 2
EXECUTIVE SUMMARY
Pattern’s vision for its Urban Action Agenda (UAA) embodies a commitment to promoting the revitalization of 25 communities by retaining the core population and attracting young, diverse families to these urban centers. Throughout this process, each community will invariably witness a social and economic transformation within their demographic make-up and built environment. This particular transformation may be the result of market forces, or in some cases, the result of gentrification.
The national discourse of urban revitalization may include aspects of gentrification; therefore, it is important to address the various definitions used to characterize gentrification and differentiate between these terms. This topic is relevant to several focus areas of Patterns UAA based on its connection to housing, economic development, local and regional governance, demographic shifts, infrastructure, education, and regional amenities.
While housing affordability and displacement are the two most often cited problems associated with gentrification, urban areas in the midst of revitalization may find these negative impacts to be at odds with the need for economic development. This report is important because some of the initial indicators of gentrification (a rise in the cost of living, asymmetric growth, increased access to amenities) have already been identified in at least four of Pattern’s UAA communities (Hudson, Newburgh, Beacon, and Kingston). This preliminary report supports economic development to finance much needed services for current residents, while providing a resource for governmental leaders, developers, community organizations, and Hudson Valley residents to mitigate displacement and preserve affordable housing in urban centers using a comprehensive “toolkit” of policy recommendations.
This report serves to increase awareness for, and understanding of, gentrification in the Hudson Valley through an exploration of existing literature, survey based information collected from municipal leaders and community groups, and a comprehensive “toolkit” of policy recommendations to mitigate displacement and encourage affordable housing.
Based on a thorough literature review, Pattern compiled a list of advantages and disadvantages that may result from gentrification, and an overview of various definitions used to describe this process. In order to determine how gentrification could impact Hudson Valley residents, this report provides detailed existing conditions in four Hudson Valley communities to illustrate how these communities have benefited, from recent increased investment, and at the same time how gentrification might impact affordability and housing opportunities. Also provided is survey based information collected from interviews with municipal officials and staff from the Urban Action Agenda communities. Our survey intended to gauge perception of gentrification, early indicators of this process, costs and benefits, and policies to mitigate displacement and encourage affordable housing. Participants were asked:
How do you define gentrification?
Would you say that gentrification is occurring in your community (if so, where, what are the indicators, and where else could this be occurring)? If it is not occurring in your community do you see any other communities in the Hudson Valley where it is occurring?
Are there ways a community can benefit from gentrification?
Are you concerned about any negative impacts of gentrification (such as displacement or rising costs) in your community?
Do you have any policy recommendations that can help promote affordable housing or assist residents who cannot afford the rising cost of housing?
Finally, Pattern outlined several strategies intended to mitigate displacement and promote affordable housing based on suggestions from the NYU Furman Center, University of Chicago Center for Neighborhood and Community Improvement, the Gentrification Learning Community, and the Federal Reserve Bank of San Francisco.

Hudson Valley Pattern for Progress | Page 3
Originally coined in the 1960s, gentrification was first used to describe the in-migration of middle class residents from the suburban periphery into the inner-city district of London. In recent decades, the “back-to-the-city” movement has prompted new development in economically depressed neighborhoods; this new development has resulted in demographic, cultural, and physical changes in low-income areas. Due to these changes, “general interest in gentrification has increased because of a confluence of regional housing dynamics and particular urban policy efforts” aimed at revitalizing and alleviating poverty in urban neighborhoods. 1
While encouraging population and economic growth within Hudson Valley communities is critical to the revitalization of urban areas, it is also important current residents are not excluded from this process. Current research reveals gentrification has both positive and negative impacts on urban centers and their residents. While depressed neighborhoods are brought out of economic stagnation, amenities are created, services are restored, and impoverished neighborhoods may benefit from a higher level of influence from new residents. The physical and cultural environment may be altered and the cost of real estate - both commercial and residential may become out of reach. Developers focus more on the positive attributes of gentrification that lead to urban revitalization and economic development; conversely, existing urban residents focus on the negative attributes of gentrification that lead to rising costs and involuntary displacement. Urban leaders are often caught in the middle. Following are just a few advantages and disadvantages that can result from the occurrence of gentrification in urban centers:
PROS CONS
Population growth; residents with resources Displacement of current residents
Increase in quality and quantity of housing stock Increase in mortgage/rent
Improved credit scores in gentrifying neighborhood Less investment in non-gentrifying areas
Access to increased revenues assists resources for both gentrified and non-gentrifying areas
Cost of services increase
Decrease in crime Crime may decline in gentrifying area , but may lead to an increase of crime in other parts of the urban area
Decrease in poverty Poverty may decline in gentrifying area, but may lead to an increase in other parts of the urban area
Commercial and residential development Decline in businesses that serviced previous population, but may see an increase in new businesses for new residents
More money to invest in neighborhood Higher property taxes
More quality housing stock Market forces raise housing prices
More high-skill jobs and labor Decline in low-skilled labor market
More tax money to invest in critical services and urban investments
Less housing stock for local residents
Increase in amenities for all residents Cost of amenities becomes unaffordable for certain residents

WHAT DOES IT MEAN? The impact of gentrification on economically depressed neighborhoods has been analyzed for several decades; however, scholars have yet to establish a single, universally accepted definition or specific set of criteria for identifying a gentrified neighborhood. Through a review of multiple reports and editorials, the most common characteristics used to describe gentrification are patterns of increased investment, increasing property values and demographic shifts. The areas that experience reinvestment and increased property values are also associated with incoming residents who are typically more affluent and of a higher socio-economic class than existing residents.2 The needs of the residents that may have been displaced do not go away; their needs may be shifted to another community in which they reside.
The word gentrification was coined by British Sociologist, Ruth Glass, in 1964 to describe the change in the working class corridors of London within the borough of Islington. Glass affirmed that alterations to class structure and social character within Islington would eventually lead to the displacement of “all or most of the working class occupiers” upon the arrival of the middle to upper class gentry. Glass derived the word gentrification from the root ‘gentry’ who relocated to the inner-city districts of London due to a “switch from suburban to urban aspirations,” and “the difficulties and rising costs of journeys to work.” 3
Brookings Institution defines gentrification as a “process by which higher income households displace lower income residents of a neighborhood” causing a change in “the essential character and flavor of that neighborhood.” According to this definition, gentrification requires the occurrence of three components: 1) existing residents are displaced 2) changes within the built environment (housing, open space, and walkways, and 3) a majority of incoming residents cause the character of the neighborhood to undergo some kind of social or cultural change. Based on Brookings definition, revitalization and reinvestment are necessary, but not sufficient, conditions that would need to take place for gentrification to occur. 4
According to Neil Smith, former Professor of Anthropology and Geography at the Graduate Center of the City University of New York, gentrification is the process by which “central neighborhoods that have undergone disinvestments and economic decline experience a reversal, reinvestment, and the in-migration of a relatively well-off middle and upper-middle class population.” 5
Similarly, a 1976 study by the Urban Land Institute found that “nearly half of the 260 cities with a population over
50,000 had undergone gentrification,” which they defined as “marked expansion in middle-income housing in the form of rehabilitated single-family dwellings.”6
The debate that has ensued over the last few decades regarding the definition of gentrification reveals the complexity of the topic. One Washington Post article stated that “we think [gentrification] is easy to eyeball, though, [it] is incredibly hard to identify in data” because “academics… don't agree on how to define gentrification [and] won't agree on where it's happening.” Therefore, “the gap between their findings and the media's focus is even wide[r].” More importantly than the definition itself are the analyses conducted using a particular definition. Michael Barton, a sociologist at Louisiana State University, analyzed “gentrified” neighborhoods in New York City over the last 30 years using two definitions proposed in two separate studies and compared them to neighborhoods deemed “gentrified” by the New York Times. Barton found that “descriptive results show that not only was the sheer number of neighborhoods identified by each strategy different, but also that the geographic distribution of sampled neighborhoods varied.” 7
The definition of the word gentrification, depending on qualitative or quantitative indicators, leaves room for debate among scholars, journalists, and disciplines (e.g. sociology, public policy, planning, and urban economics). All of these groups identify gentrification and its components based on area-specific factors related directly to their field of study or on individual perception.
This allows gentrification to take on numerous, context-dependent definitions based on the process and its features. “Housing-centered policy analysts may seek to interpret gentrification in the context of the housing market (Jerzyk, 2009; Freeman, 2002; Wyly & Hammel, 1998) while sociologists note that any definition of gentrification must include its propensity to produce widespread demographic changes in metropolitan areas with racial and socioeconomic implications (Schaffer & Smith, 1979; Vigdor, 2002; Ugenyi, 2011)”. 8
While it is difficult to settle on just one definition of gentrification, it can be assumed that increased investment is invariably part of this process; therefore, the negative impacts that can result from increased investment may lead to rising costs and displacement. Based on this premise, Pattern sought to find out more about how municipal leaders and community organizations perceive gentrification and how they implement policies to remedy potential impacts.
Hudson Valley Pattern for Progress | Page 4

Hudson Valley Pattern for Progress | Page 5
HOW CAN GENTRIFICATION IMPACT THE HUDSON VALLEY?
The outcome of gentrification is inherently linked to the social, physical, and cultural context of the area; therefore, the process of gentrification, and whether or not it is positive or negative, is dependent on a number of factors.
Based on data from the Census Bureau and the American Community Survey (ACS), 56% of UAA communities experienced some degree of population decline between 2010 and 2014. Some of these communities can accommodate future growth while others do not have the additional capacity to accommodate growth. 9
As outlined above, there are numerous examples of the positive and negative impacts that gentrification can have on a community. In the UAA communities that have experienced population decline, and lack any kind of industry, jobs, or basis for tourism, growth and development could have a positive influence on the local economy. These communities would benefit substantially from some degree of gentrification.
However, in their desire to grow, available capacity will play a major role in the outcome. If a community cannot withstand an increase or socio-economic shifts in population without displacing existing residents, any degree of gentrification will be met with concern. Conversely, if a community can accommodate an increase in population based on housing stock capacity, gentrification will gain support for its ability to increase the tax base while allowing current residents to remain within the community. It is critical to mitigate the negative impacts of gentrification so as not to displace existing residents and businesses.
Because gentrification is context dependent, the following cities represent just a few examples of how gentrification can benefit and burden Hudson Valley communities based on amenities, housing stock, affordability, and public policies. The following four cities are examined and highlighted, as each one is at a different stage of community revitalization. It is important to note the ability for a city to provide basic services are often hampered by its' fiscal condition and therefore some residents object to the very effort that helps revitalization. Specifically, the City of Newburgh is under very difficult fiscal conditions, Hudson is struggling, Kingston is holding its own and Beacon is doing fairly well.
Healthy communities need a varied workforce that supplies labor for both ends of the wage scale. Neighborhoods need
a mix of services, retail and entertainment, which do not all carry high paying jobs and as a result, there is the need for
affordable housing. There must be a balancing act to provide quality, affordable housing within the same
neighborhoods that are witnessing reinvestment and demographic changes.

Hudson Valley Pattern for Progress | Page 6
Tiffany Martin, Mayor of the City of Hudson, said the city’s current infrastructure can accommodate population growth, and she hopes the city will experience growth in the near future. According to the ACS, Hudson has seen a 12.7% decline in population since 2000. Hudson has a rental housing rate of 66% and a homeownership rate of 34%. Many housing experts define a healthy community as 70% homeownership and 30% renter. However, as the national trend for homeownership declines, the definition of a healthy neighborhood is also changing to a larger number of renters and smaller percentage of homeowners.
Warren Street has attracted cafes, bookstores, antique shops, bars, hotels and eclectic dining establishments that accommodate a relatively small portion of the city’s residents; as you move away from Warren Street, the setting begins to change dramatically. Empty homes, abandoned commercial space, and vacant lots juxtapose the developed interior- this is a classic case of the tale of two cities. The city has partially transformed itself from a whaler’s town into a destination location, but the disparity between Warren Street and other areas of the city is undeniable. Because Hudson can facilitate growth in terms of existing infrastructure, and residents have access to desirable amenities, the city has the potential to draw in future investors and residents. However, with the high cost of living and an insufficient amount of housing to support all income levels, existing residents are unable to maintain a quality of life and incoming residents may choose to live outside the city to avoid paying high costs.
Hudson is a great example of a city that has benefited, disproportionately, from the effects of new investment. In terms of business oriented development and amenities, the city has a lot to offer; however, it lacks affordable housing options. Developer JMS Collective purchased the former Greenport Elementary school for $400,000 in 2014 with a majority vote by the school district voters 733-75. This former site will now be the location for The Falls, a complex with twenty 1-BR rental units starting at $1,500 a month, which has called attention to the affordable hous-ing deficit in the city. Hudson Housing Authority Director, Jeffrey First, said “there is a big need in the area for housing within a person’s budget. The fair-market rent value for a one-bedroom apartment in the [Hudson and Greenport area] is $743. A two bedroom fair market value is $920. First added that all available public housing (in places such as Bliss Towers) lack vacancies and that the waiting list contains 150 to 200 families, [and] Section 8 housing has a three-year wait." 10
Hudson has the amenities to draw in weekend crowds (what Sharon Zurkin, Professor of Sociology at Brooklyn College, would call the ABCs of gentrification: art galleries, boutiques, and cafes),11 but they lack affordable housing options to insure people of all income levels can afford to live in the city.
Regardless of whether the city has gentrified, is in the beginning stages of gentrification or has no signs of gentrification, measuring affordability is critical for local planning efforts. Housing cost burden data for renters and homeowners represents a reference point for affordability. According to HUD, an affordable home is based upon a total housing payment of no more than 30% of the monthly house-hold income. When a household pays more than 30% it is considered to be unaffordable and at more than 50% it is Severely Cost Burdened. As the median income level declines, the cost burden increases. The chart above provides cost burden data for all income levels and for 50% of the area median income. Local residents earning 50% of the area median income are those typically working in local shops, retail establishments, cafes and other small businesses on "Main Street".
All Income Levels 50% Median Income
Cost Burden % Renters
% Owners
% Renters
% Owners
Affordable: <30% income for housing
50.5% 59.6% 28.8% 5.4%
Unaffordable: 30% to 50% income for housing
28.2% 20.4% 34.1% 32.4%
Severe: >50% income for housing
21.3% 20.0% 37.0% 62.2%
POPULATION:
2000 7,524
2015 6,572 12.7%
MEDIAN GROSS RENT:
2000 $483
2015 $821 70%
MEDIAN HOME VALUE:
2000 $74,900
2015 $173,200 131.2%
EDUCATIONAL ATTAINMENT (BACHELOR’S):
2000 6.1%
2015 12.4% 103.3%
CITY OF HUDSON

H HUDSON VALLEY PATTERN for PROGRESS
SPECIAL PULL OUT
ANNUAL
HOUSING DATA UPDATE
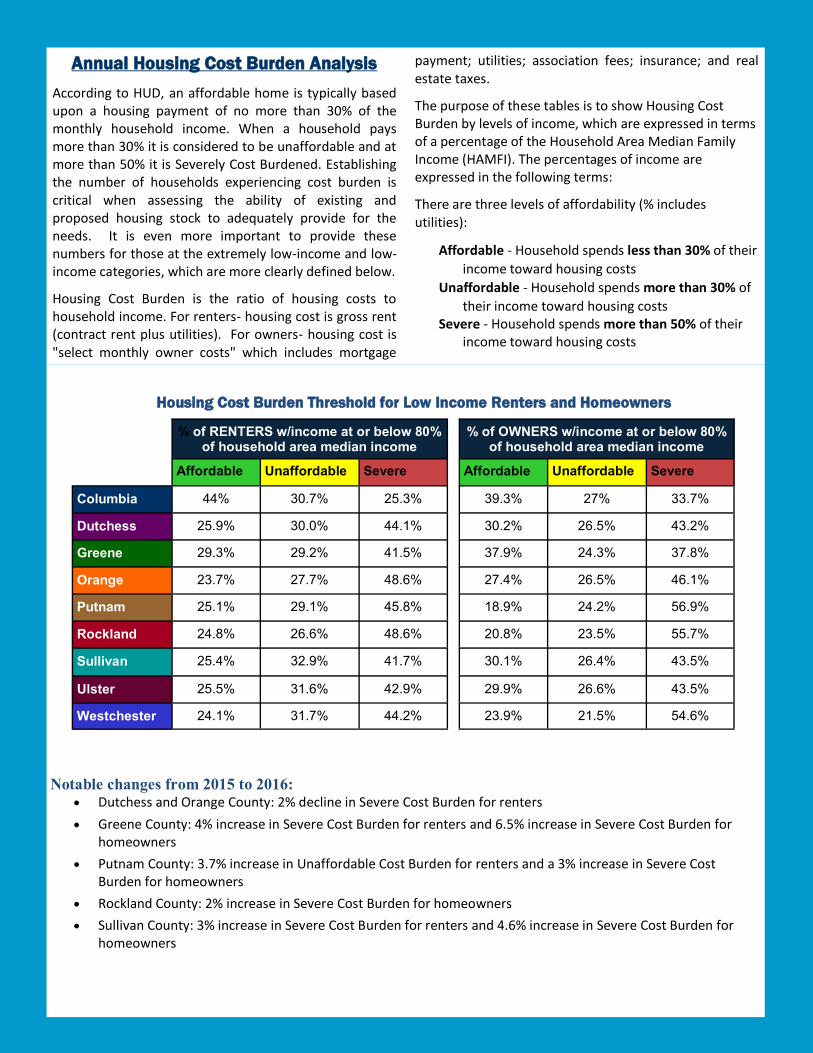
Annual Housing Cost Burden Analysis
According to HUD, an affordable home is typically based upon a housing payment of no more than 30% of the monthly household income. When a household pays more than 30% it is considered to be unaffordable and at more than 50% it is Severely Cost Burdened. Establishing the number of households experiencing cost burden is critical when assessing the ability of existing and proposed housing stock to adequately provide for the needs. It is even more important to provide these numbers for those at the extremely low-income and low-income categories, which are more clearly defined below.
Housing Cost Burden is the ratio of housing costs to household income. For renters- housing cost is gross rent (contract rent plus utilities). For owners- housing cost is "select monthly owner costs" which includes mortgage
payment; utilities; association fees; insurance; and real estate taxes.
The purpose of these tables is to show Housing Cost Burden by levels of income, which are expressed in terms of a percentage of the Household Area Median Family Income (HAMFI). The percentages of income are expressed in the following terms:
There are three levels of affordability (% includes utilities):
Affordable - Household spends less than 30% of their
income toward housing costs
Unaffordable - Household spends more than 30% of
their income toward housing costs Severe - Household spends more than 50% of their
income toward housing costs
% of RENTERS w/income at or below 80% of household area median income
% of OWNERS w/income at or below 80% of household area median income
Affordable Unaffordable Severe Affordable Unaffordable Severe
Columbia 44% 30.7% 25.3% 39.3% 27% 33.7%
Dutchess 25.9% 30.0% 44.1% 30.2% 26.5% 43.2%
Greene 29.3% 29.2% 41.5% 37.9% 24.3% 37.8%
Orange 23.7% 27.7% 48.6% 27.4% 26.5% 46.1%
Putnam 25.1% 29.1% 45.8% 18.9% 24.2% 56.9%
Rockland 24.8% 26.6% 48.6% 20.8% 23.5% 55.7%
Sullivan 25.4% 32.9% 41.7% 30.1% 26.4% 43.5%
Ulster 25.5% 31.6% 42.9% 29.9% 26.6% 43.5%
Westchester 24.1% 31.7% 44.2% 23.9% 21.5% 54.6%
Notable changes from 2015 to 2016: Dutchess and Orange County: 2% decline in Severe Cost Burden for renters
Greene County: 4% increase in Severe Cost Burden for renters and 6.5% increase in Severe Cost Burden for homeowners
Putnam County: 3.7% increase in Unaffordable Cost Burden for renters and a 3% increase in Severe Cost Burden for homeowners
Rockland County: 2% increase in Severe Cost Burden for homeowners
Sullivan County: 3% increase in Severe Cost Burden for renters and 4.6% increase in Severe Cost Burden for homeowners
Housing Cost Burden Threshold for Low Income Renters and Homeowners

Affordability in the Hudson Valley: Further Out of Reach The National Low Income Housing Coalition (NLIHC) released its annual Out of Reach report earlier this year. The report provides valuable information in regard to the affordability of rental housing in every county throughout the United States. Hudson Valley Pattern for Progress continues to track this data and provides the statistics and trends to assist communities, developers, builders and non-profit agencies to plan and construct housing that is affordable in the Hudson Valley region.
The demand for rental units in the Hudson Valley is high. The rental vacancy rate at a vast majority of market rate apartment complexes is under 5% and affordable housing complexes all have waiting lists from 1 year to as long as 3 years. The inventory of quality affordable housing is extremely limited in the Hudson Valley for the aging population, Millennials and families, especially large families. There has been a recent boom in the luxury rental housing market, while the demand for affordable rentals is increasing.
The Out of Reach data for 2016 continues to show tremendous disparity in rental costs vs. ability to pay in the Hudson Valley. The gap between the 2017 Fair Market Rent (FMR) and Affordable Rent at the Mean Renter’s Wage Rate continues to grow. Regardless of declining unemployment rates, renters wage rates are simply not keeping up with the cost of rent
The monthly gap between the Fair Market Rent and the monthly rent affordable at the renter wage rate continues to grow. Dutchess, Ulster and Orange County observed a slight decline in the FMR from 2016 to 2017, therefore the gap decreased by a very small amount. Columbia, Greene, Putnam, Rockland, Sullivan and Westchester all showed an increase in the monthly gap. . The monthly gap in Putnam County is closing in on $1,200 and is over $1,000 in Rockland County.
The need for additional federal and state funds to offset the high cost of housing development in the Hudson Valley has never been more prevalent. Programs such as the Community Development Block Grant (CDBG), HOME, and the USDA Rural Development programs leveraged with the Low Income Housing Tax Credits have become even more critical for this population in the Hudson Valley. Local tax incentives offer additional financing mechanism to offset operating costs of multifamily complexes. Local municipalities may offer Payment In Lieu of Taxes (PILOT), incremental or phased-in taxes tied to cash flow from the rentals and myriad of other programs through the NYS Real Property Tax Laws.
County 2BR FMR FY 2017
Annual Wage to Afford
2BR
Hourly Wage to Afford 2BR
Renter Wage Rate
Rent Affordable at Renter
Wage Rate
Gap in Monthly Rent for
2017
Columbia $950 $36,920 $17.75 $10.19 $530 -$420
Dutchess $1,269 $50,840 $24.44 $12.53 $652 -$617
Greene $931 $35,280 $16.96 $9.68 $504 -$427
Orange $1,269 $50,840 $24.44 $9.65 $502 -$767
Putnam $1,637 $62,840 $30.21 $8.67 $451 -$1,186
Rockland $1,637 $62,840 $30.21 $11.47 $596 -$1,041
Sullivan $952 $35,920 $17.27 $10.02 $521 -$431
Ulster $1,141 $45,840 $22.04 $9.26 $482 -$659
Westchester $1,706 $60,400 $29.04 $17.81 $926 -$780
Further Out of Reach 2016
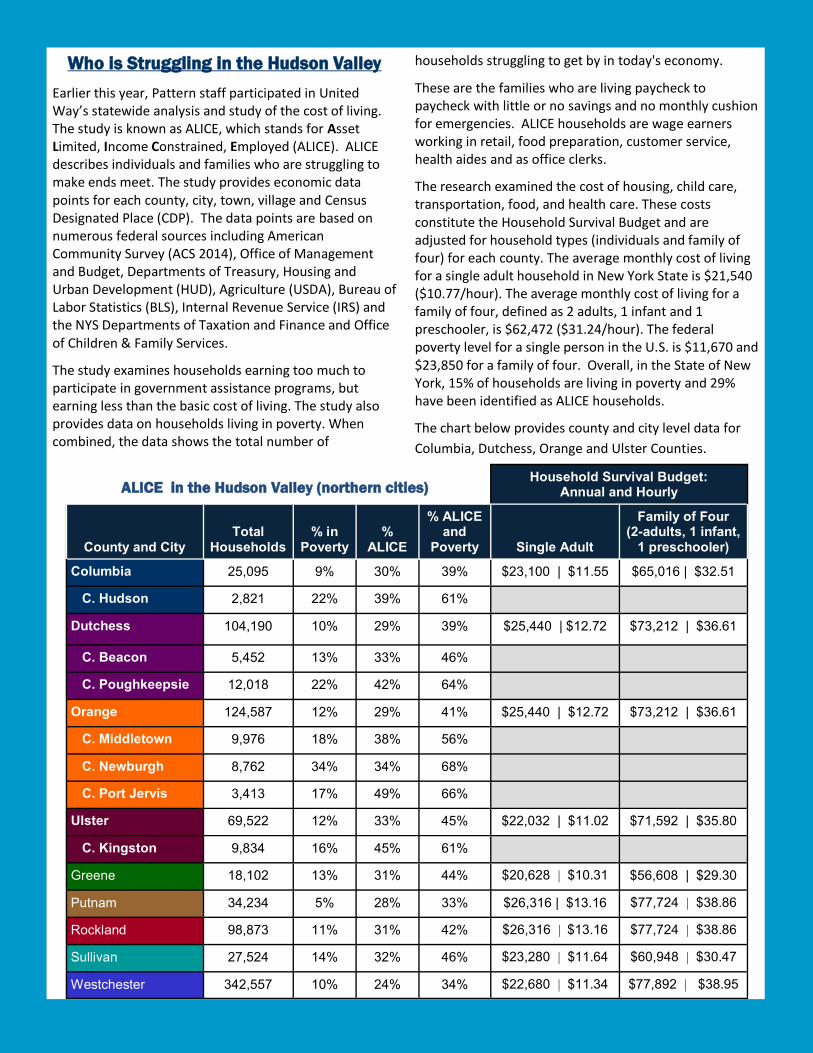
Who is Struggling in the Hudson Valley
Earlier this year, Pattern staff participated in United Way’s statewide analysis and study of the cost of living. The study is known as ALICE, which stands for Asset Limited, Income Constrained, Employed (ALICE). ALICE describes individuals and families who are struggling to make ends meet. The study provides economic data points for each county, city, town, village and Census Designated Place (CDP). The data points are based on numerous federal sources including American Community Survey (ACS 2014), Office of Management and Budget, Departments of Treasury, Housing and Urban Development (HUD), Agriculture (USDA), Bureau of Labor Statistics (BLS), Internal Revenue Service (IRS) and the NYS Departments of Taxation and Finance and Office of Children & Family Services.
The study examines households earning too much to participate in government assistance programs, but earning less than the basic cost of living. The study also provides data on households living in poverty. When combined, the data shows the total number of
households struggling to get by in today's economy.
These are the families who are living paycheck to paycheck with little or no savings and no monthly cushion for emergencies. ALICE households are wage earners working in retail, food preparation, customer service, health aides and as office clerks.
The research examined the cost of housing, child care, transportation, food, and health care. These costs constitute the Household Survival Budget and are adjusted for household types (individuals and family of four) for each county. The average monthly cost of living for a single adult household in New York State is $21,540 ($10.77/hour). The average monthly cost of living for a family of four, defined as 2 adults, 1 infant and 1 preschooler, is $62,472 ($31.24/hour). The federal poverty level for a single person in the U.S. is $11,670 and $23,850 for a family of four. Overall, in the State of New York, 15% of households are living in poverty and 29% have been identified as ALICE households.
The chart below provides county and city level data for
Columbia, Dutchess, Orange and Ulster Counties.
Household Survival Budget: Annual and Hourly
County and City Total
Households % in
Poverty %
ALICE
% ALICE and
Poverty Single Adult
Family of Four (2-adults, 1 infant,
1 preschooler)
Columbia 25,095 9% 30% 39% $23,100 | $11.55 $65,016 | $32.51
C. Hudson 2,821 22% 39% 61%
Dutchess 104,190 10% 29% 39% $25,440 | $12.72 $73,212 | $36.61
C. Beacon 5,452 13% 33% 46%
C. Poughkeepsie 12,018 22% 42% 64%
Orange 124,587 12% 29% 41% $25,440 | $12.72 $73,212 | $36.61
C. Middletown 9,976 18% 38% 56%
C. Newburgh 8,762 34% 34% 68%
C. Port Jervis 3,413 17% 49% 66%
Ulster 69,522 12% 33% 45% $22,032 | $11.02 $71,592 | $35.80
C. Kingston 9,834 16% 45% 61%
Greene 18,102 13% 31% 44% $20,628 | $10.31 $56,608 | $29.30
Putnam 34,234 5% 28% 33% $26,316 | $13.16 $77,724 | $38.86
Rockland 98,873 11% 31% 42% $26,316 | $13.16 $77,724 | $38.86
Sullivan 27,524 14% 32% 46% $23,280 | $11.64 $60,948 | $30.47
Westchester 342,557 10% 24% 34% $22,680 | $11.34 $77,892 | $38.95
ALICE in the Hudson Valley (northern cities)

Despite anecdotal reports to the contrary, population growth in the City of Newburgh has been minimal at best. According to the ACS, 28,259 residents lived in the City of Newburgh in 2000, and grew to only 28,495 by 2015; only a 0.8% increase. During this same time period Newburgh has witnessed a shift in demographics with the Hispanic population increased by 43.6% since 2000. The Hispanic population represents 51.7% of the current population (the highest percentage in all 7 Mid-Hudson Valley cities). In addition to a high percentage of vacant housing units (21%), there are significantly more renters (68%) than homeowners (32%). According to HUD, a combined 61% of renters are in an unaffordable housing situation or severely cost burdened. Based on ACS 2015 data, the median income in the City of Newburgh is $34,358 and a 34% poverty rate; these residents are most at risk of housing displacement due to the inability to afford housing costs (including utilities) based on their income. Residents in the City of Newburgh would benefit from the promotion of “Community Benefits Agreements (CBAs) that include anti-displacement provisions” and encourage support for “tenant organizing… focused on specific campaigns or institutions, with the goal of increasing community control.”12
Any “gentrification” that has occurred in Newburgh was, in part, the result of urban renewal that took place in the early 1980s along the waterfront; various restaurants have revived one of the most valuable assets the city has - proximity to the Hudson River. According to City of Newburgh Planner, Ali Church, the fundamental difference between urban renewal and gentrification is that the former is a governmental actor and the latter is a market
actor. Urban renewal was a term most commonly associated with government sponsored programs in the 1960s. During this time federal funding supported the majority of construction and transportation infrastructure, as well as demonstration projects; these initiatives played a role in the displacement of low-income and minority communities. “Progress” was equated with the replacement of dilapidated housing units and “slum clearance”. For this reason, the use of “urban renewal” to denote revitalization efforts is avoided. Unfortunately, the development along the periphery has not spurred significant development within the interior. As a city with a rich history, historic architecture, a fairly stable population and high vacancy rate, the City of Newburgh is ripe for growth and development and could benefit from the positive effects of investment, for example lower Liberty Street. These positive effects include additional tax revenues generated for municipal services, decrease in crime and poverty, re-investment in distressed neighborhoods and an increase in quality housing stock. However, it is imperative that safeguards are put into place to protect existing residents. Due to the high number of vacant parcels and buildings, this goal should be achievable.
Regardless of whether the city has gentrified, is in the beginning stages of gentrification or has no signs of gentrification, measuring affordability is critical for local planning efforts. Housing cost burden data for renters and homeowners represents a reference point for affordability. According to HUD, an affordable home is based upon a total housing payment of no more than 30% of the monthly household income. When a household pays more than 30% it is considered to be unaffordable and at more than 50% it is Severely Cost Burdened. As the median income level declines, the cost burden increases. The chart above provides cost burden data for all income levels and for 50% of the area median income. Local residents earning 50% of the area median income are those typically working in local shops, retail establishments, cafes and other small businesses on "Main Street".
Hudson Valley Pattern for Progress | Page 7
All Income Levels 50% Median Income
Cost Burden % Renters
% Owners
% Renters
% Owners
Affordable: <30% income for housing
39.0% 57.7% 17.6% 15.5%
Unaffordable: 30% to 50% income for housing
22.0% 23.5% 23.3% 19.7%
Severe: >50% income for housing
39.0% 18.8% 59.1% 64.8%
POPULATION:
2000 28,259
2015 28,495 0.8%
MEDIAN GROSS RENT:
2000 $614
2015 $1,081 76%
MEDIAN HOME VALUE:
2000 $92,500
2015 $165,800 79.2%
EDUCATIONAL ATTAINMENT (BACHELOR’S):
2000 6.5%
2015 7.0% 7.7%
CITY OF NEWBURGH

Hudson Valley Pattern for Progress | Page 8
In contrast to Hudson and Newburgh, the city of Beacon has seen overall population growth in all racial categories, therefore increasing in diversity over the last 15 years. Beacon has a low rental vacancy rate (5.9%) with a nearly even distribution of owner occupied units (53%) and renter-occupied units (47%). Nearly half of all renters are in an unaffordable housing situation or severely cost burdened; similarly, nearly a third of home-owners are in an unaffordable housing situation or severely cost burdened.13
Beacon’s rich history as a military fort and signaling point as well as a manufacturing hub during the Revolutionary War made the economic decline in the 1970s that much more tragic. As a highly desirable and sought after “destination location” often referred to as “No-Bro” (Northern Brooklyn), Beacon has become the ideal location for Millennials looking to experience a cultured art scene, eclectic dining, and local entrepreneurialism without relocating to New York City. As more live-work space is created for future residents, (e.g., the Lofts)14 the city can benefit from increasing its taxpayer base. This city is ideal for residents who want to work in New York City, and commute 75 minute on the express or 90 minutes on the local into Manhattan.
Beacon is a great example of a city that has experienced economic decline, but has witnessed a reversal, reinvestment, and in-migration of a relatively well-off middle and upper-middle class population. With these successes, there was an inevitable “cost”.
The median value of a home, according to the 2000 Census in Beacon was $166,000 (inflation adjusted dollars). The median value of a home in Beacon according to the 2015 ACS was $240,300, which represents an increased value of almost $75,000, or 45%. Further, according to Zillow estimates, the median list price per square foot increased by 32.8% in the City of Beacon between January 2012 and September 2016. During this same time period, the average price of rent in the City of Beacon increased by 26.8%. In just four years, the cost of living in the City of Beacon increased dramatically. While this may be good for incoming residents and new establishments, it is becoming increasingly difficult for current residents to afford to live there.
Regardless of whether the city has gentrified, is in the beginning stages of gentrification or has no signs of gentrification, measuring affordability is critical for local planning efforts. Housing cost burden data for renters and homeowners represents a reference point for affordability. According to HUD, an affordable home is based upon a total housing payment of no more than 30% of the monthly household income. When a household pays more than 30% it is considered to be unaffordable and at more than 50% it is Severely Cost Burdened. As the median income level declines, the cost burden increases. The chart above provides cost burden data for all income levels and for 50% of the area median income. Local residents earning 50% of the area median income are those typically working in local shops, retail establishments, cafes and other small businesses on "Main Street".
All Income Levels 50% Median Income
Cost Burden % Renters
% Owners
% Renters
% Owners
Affordable: <30% income for housing 50.1% 65.0% 29.0% 1.4%
Unaffordable: 30% to 50% income for housing 26.4% 19.2% 30.6% 39.1%
Severe: >50% income for housing 23.5% 15.8% 40.3% 59.4%
POPULATION:
2000 13,808
2015 14,375 4.1%
MEDIAN GROSS RENT:
2000 $658
2015 $1,082 64.4%
MEDIAN HOME VALUE:
2000 $120,800
2015 $240,300 98.9%
EDUCATIONAL ATTAINMENT (BACHELOR’S):
2000 11.4%
2015 17.3% 51.7%
CITY OF BEACON

Over the past year the City of Kingston has made a significant effort to improve the Midtown area. Revitalization efforts have sought to encourage more “business [oriented development], education, arts, [and] technology program[s].” Improvements have been made to Broadway with “a more efficient streetlight program, a college campus, and artists housing at the Lace Mill apartment building” while RUPCO has begun the initial preparations for a mixed-use facility at the former site location for Mid City Lanes Bowling Alley on Cedar Street.15
According to the New York State Department of Labor (NYSDOT) Kingston witnessed a 2.6% increase in total nonfarm jobs between September 2015 and September 2016; during this time period, private sector jobs have increased by four percent. Although the population of Kingston has only increased by 1.1% over a 15 year period, new initiatives focused on affordable housing and economic development coupled with rising employment opportunities may encourage future population growth. While Kingston has a low residential vacancy rate (2.9% - homeowner; 5.1% renter) and a nearly even distribution of owner-occupied (44%) and renter-occupied (56%) units, the cost of housing is not affordable for existing residents. According to HUD, 53.2% of renter are living in unaffordable housing (paying over 30% of their income toward rent), of which 29.3% are severely cost burdened (paying over 50% of their income toward rent).
Because the negative impacts of gentrification disproportionately impact renters as opposed to homeowners, the City of Kingston would benefit
substantially from more affordable housing options for existing and incoming residents; additionally, renters should increase the role neighborhoods play in “determining the use of impact fees to support affordable housing”. 16
According to Guy Kemp, Vice President of Community Development at RUPCO, the City of Kingston is unlike Newburgh in that Kingston never suffered a loss of population that Newburgh did (in from 1970 to 1980 the City of Newburgh experienced an 11% decline in their population); however, Kingston does lack a surplus supply of housing capacity. Guy Kemp also stated "the city is slowly starting to adopt inclusionary zoning into their code to ensure there is some degree of affordability." Guy also emphasized "the loss of diversity (ethnic and cultural) is a lot harder to prevent, and most places are lacking in cultural capacity."
As revitalization is occurring in the City of Kingston, it is vital for the city to continue to work toward providing policy and the framework to develop housing for all levels of income. This may be accomplished through partnerships with local non-profit housing organizations.
Regardless of whether the city has gentrified, is in the beginning stages of gentrification or has no signs of gentrification, measuring affordability is critical for local planning efforts. Housing cost burden data for renters and homeowners represents a reference point for affordability. According to HUD, an affordable home is based upon a total housing payment of no more than 30% of the monthly household income. When a household pays more than 30% it is considered to be unaffordable and at more than 50% it is Severely Cost Burdened. As the median income level declines, the cost burden increases. The chart above provides cost burden data for all income levels and for 50% of the area median income. Local residents earning 50% of the area median income are those typically working in local shops, retail establishments, cafes and other small businesses on "Main Street".
Hudson Valley Pattern for Progress | Page 9
All Income Levels 50% Median Income
Cost Burden % Renters
% Owners
% Renters
% Owners
Affordable: <30% income for housing
45.3% 63.0% 19.9% 21.8%
Unaffordable: 30% to 50% income for housing
24.8% 20.2% 18.4% 15.6%
Severe: >50% income for housing
29.9% 16.8% 61.7% 62.6%
POPULATION:
2000 23,456
2015 23,625 0.7%
MEDIAN GROSS RENT:
2000 $576
2015 $1,005 74.5%
MEDIAN HOME VALUE:
2000 $86,700
2015 $171,500 97.8%
EDUCATIONAL ATTAINMENT (BACHELOR’S):
2000 12.0%
2015 13.0% 8.3%
CITY OF KINGSTON

Hudson Valley Pattern for Progress | Page 10
SURVEYING THE REGION
During the last quarter of 2016, Pattern staff interviewed a combination of elected officials and municipal staff of the Urban Action Agenda communities. We received a 95% response rate and thank everyone that participated. The purpose and goal was to gauge perception of gentrification, early indicators of the process, costs and benefits and potential policies to mitigate displacement while preserving affordable housing.
Specifically, we asked the following questions and beneath are a sample of some of there comments.
1.DEFINE GENTRIFICATION:
Their responses were reflective of our paper. There is no single definition, but the concern over displacement of both businesses and people having a place to live were at the top of the list.
2. IS IT HAPPENING IN YOUR COMMUNITY? OTHER THAN WHAT MIGHT BE HAPPENING IN YOUR COMMUNITY, DO YOU FEEL IT IS HAPPENING ELSEWHERE IN THE HUDSON VALLEY?
While some communities responded, "It was not happening, many felt it was either starting or had the potential to occur". Therefore, officials expressed a concern over what to do about gentrification. While most did not identify a particular community, the one area mentioned more than others was the City of Beacon. This is why Pattern chose to hold its first forum on the topic in Beacon.
3. CAN A COMMUNITY BENEFIT FROM GENTRIFICATION?
All but one community felt there could be an upside to gentrification such as increased tax revenues, rehabilitation of blighted and abandoned properties, an increase in new forms of arts and culture and the potential for creative ideas for the community.
4. ARE YOU CONCERNED WITH ITS POTENTIAL NEGATIVE IMPACTS?
The primary concern was displacement of existing residents and increased costs to those still living there. Additionally, there is the potential of losing cultural identity as existing residents may be forced to relocate.
5. DO YOU HAVE RECOMMENDATIONS TO MITIGATE THEM SUCH AS AFFORDABLE HOUSING?
Phrases and Terms were used such as: "Smart Density", "Increased Density", a percentage of new housing should be "Set- aside" for affordable housing and "inclusionary zoning". However, a number of officials voiced concern over the definition of affordable housing and how it may be accepted within the community.
The communities that are seeing signs of gentrification are all in agreement; policies are needed to mitigate the negative impacts such as displacement. Many communities see new investment as positive momentum; however, there must be a balancing act to preserve and create affordable housing as well as other aspects of the community that may be displaced.
Pattern also began surveying and interviewing community organizations that provide affordable housing and services within the urban centers. Pattern will continue this effort and will be issuing another report in early 2017.
Based on “Gentrification Response: A Survey of Strategies to Maintain Neighborhood Economic Diversity by the” the NYU Furman Center identified several tools that residents and municipalities can utilize to promote affordable housing development and assist residents who cannot afford the rising cost of housing. Because rising rents can pose a threat to subsidized and unsubsidized housing these tools are helpful in their ability to ensure that affordable housing is preserved in gentrifying neighborhoods and that tenants at risk of displacement can remain within their place of residence. It should be noted that these policies will not always be applicable in every situation or guarantee that the policy will lead to a successful outcome or achieve the intended goal.
POLICY RECOMMENDATIONS TO MITIGATE DISPLACEMENT
Community Benefits Agreements (CBAs)
Community Land Trusts
Land Banks
Inclusionary Zoning
Prioritize social service employees (using point system) for housing
Require that a certain percentage of homes go to “least likely to apply” candidates in order to increase diversity
Increase “cultural capacity”
Set limitations (anti flipping policy) while also protecting the developer
Ensure that “outside” money is spent locally through mandates (attached to developers), encourage economic development that invests in people as opposed to infrastructure, provide incentives through schools for students to learn home building, maintenance and repair (Landbank model)

Support more efforts such as the Enterprise Program whereby developers work with first time home-buyers to create a two family home and educate or train them to be landlords; this strategy can have a positive impact on neighborhood stabilization
In areas where rents are on the rise the following strategies, which are sourced from the Furman Center study, can help create and preserve affordable housing units; in addition, these strategies can assist incumbent residents at risk of displacement who need to move because of gentrification:
Utilizing Municipal-Owned Land
Adaptive re-use of municipal owned buildings or government buildings can be used to create affordable housing units and maximize the use of existing structures
A municipality can transfer ownership of land to a community land trust or land bank or offer a long-term lease to a homeowner or developer to ensure that the properties on the land remain affordable. The municipality can provide a clause in the contract that would transfer property rights back to the municipality if the community land trust or bank should dissolve.
Under municipal ownership, the land can be used for below-market housing for a prolonged period of time.
Encourage ground leases which allow the municipality to assume ownership over the property and rent it out on a long-term basis to a developer at a discount. Land remains within municipal control upon the termination of the lease; however, the municipality must act as a landlord, and therefore will need to assume legal and personal responsibility for the property. If the municipality does not want to assume the responsibility of a landlord, the municipality can sell the property to a private developer and include a restrictive declaration in the deed. This declaration establishes a binding agreement between the two parties to ensure that future owners continue to use the land for below-market housing.
A municipality can include a restrictive covenant in the deed of sale to a private developer to limit the potential land uses; all future owners must honor the agreement until the original owner removes this clause from the deed. The municipality can include a provision in the covenant that identifies which parties (city officials or residents) can enforce the affordability clause. e.g., the New York City Housing Authority leased some of its property to secure additional
funding for public housing, in addition to developing affordable housing units; Washington D.C. leased out surplus land to developers in an effort to establish affordable units and community facilities.
Local governments can utilize housing subsidies in gentrifying and high cost neighborhoods to preserve affordable housing. Because the cost of focusing resources in these areas is high, the ability for cities to identify early indicators of gentrification will allow municipalities to secure affordable units at a lower cost early on in the process. Here are additional strategies to create and preserve affordable housing:
State and local entities issue Qualified Allocation Plans (QAP) to determine which priority projects will be funded through the Low Income Housing Tax Credit (LIHTC). QAP can initiate economic development and affordable housing in neighborhoods that were previously low-income, but have recently seen a significant rise in the cost of living.
Offer tax breaks in exchange for the preservation of affordable units to promote affordable housing; units that benefit from a tax break can negotiate the terms of a rent stabilization program to slow the growth of rent.
The use of voluntary or mandated inclusionary zoning by developers will ensure that the sale price or rental income from market-rate housing will be leveraged to build a certain percentage of affordable units.
Linkage fees are sometimes charged to developers and the proceeds are used to support the construction of affordable housing units
Rent regulation can be implemented to set a minimum standard to which landlords can raise rents in specific units; without setting a cap, the raise in rent can be incremental, allowing for modest increases over time. Establishing which units will be rent regulated will safeguard against “tenant[s] who may not be in need of that de facto subsidy” by “limit[ing] the number of units that enter into stabilization”
Conduct a market analysis to determine whether or not there is a market for any new development being proposed.
According to the City of Portland Development Commission in their final report, added the use of “No-Net Loss” policies to measure the impact of creating or destroying affordable housing units in a neighborhood. If the development would create a net loss, the project cannot continue until the municipality makes up the net loss.
Hudson Valley Pattern for Progress | Page 11

WHAT’S NEXT
This report served as a preliminary analysis of gentrification in an effort to raise awareness for, and increase the understanding of, the advantages and disadvantages of this process, its meaning, public perception in the Hudson Valley, and how to encourage economic development while simultaneously mitigating displacement and preserving affordable housing. As Pattern continues to study this topic, future research endeavors may include:
Additional Community Forums and workshops
An analysis of existing research methodologies intended to measure gentrification
Continued research and examination of previous studies on gentrification
A survey of the quantity and quality of affordable housing units in Hudson Valley urban centers
Determine the efficacy of suggested policy recommendations to mitigate displacement and encourage affordable housing
An in-depth case-study approach to measuring gentrification in the Hudson Valley
Hudson Valley Pattern for Progress | Page 10
END NOTES 1 URBAN POLICY EFFORTS- LAND USE POLICIES, CITYLAB “THE CLOSEST LOOK AT GENTRIFICATION AND DISPLACEMENT 2 See: Gentrification and Neighborhood Decline in a Legacy City: Looking at Milwaukee 2000-2012; Gentrification: What’s in a Name?; Revitalization Without Gentrification; Measuring Gentrification in the Interstate Corridor Urban Renewal Area; The Closest Look Yet at Gentrification and Displacement; Gentrification in America Report; Contextual Diversity in Gentrification Research; An Exploration of the Importance of the Strategy Used to Identify Gentrification. 3 Aspects of Change (Ruth Glass) 4 Gentrification: What’s in a Name? 4 Gentrification and Neighborhood Decline in a Legacy City: Looking at Milwaukee 2000-2012 (5) 6 http://www.curbed.com/2014/11/5/10028070/tracing-the-history-of-a-word-as-gentrification-turns-50 7 See: https://www.washingtonpost.com/news/wonk/wp/2014/12/17/its-time-to-give-up-the-emptiest-word-in-urban-policy-gentrification/ or http://www.citylab.com/housing/2014/12/no-ones-very-good-at-correctly-identifying-gentrification/383724/ 8 Roschen, Taylor Wahe. “Residential Displacement in Gentrifying Urban Neighborhoods: A Statistical Analysis of New York City’s Housing Characteristics.” California Polytechnic State University. San Luis Obispo, CA 9 Pattern understands capacity in terms of overall condition of infrastructure, buildable space, population growth or decline, existing housing stock, and affordability. 10 http://www.registerstar.com/news/article_f4cd35ea-9bf8-11e6-93fb-27e4ac4c0e6a.html 11 http://ny.curbed.com/2014/11/5/10026804/tracing-the-history-of-an-idea-as-gentrification-turns-50 12 Gentrification and Displacement: An Agenda for addressing gentrification and preventing displacement 13 Based on data from the U.S. Department of Housing and Urban Development 26.4% of Beacon renters are in an unaffordable housing situation while 23.5% are severely cost burdened, and 19.2% of homeowners are in an unaffordable housing situation while 15.8% are severely cost burdened. 14 See http://www.loftsatbeacon.com/ for more information 15 See: http://www.dailyfreeman.com/article/DF/20151124/NEWS/151129830; http://rupco.org/rupco-debuts-greenline-center-at-kingston-planning-board-meeting/ 16 Gentrification and displacement: an agenda for addressing gentrification and preventing displacement
Pattern for Progress is the Hudson Valley’s public policy and planning
organization that creates regional solutions to quality-of-life issues by bringing together
business, nonprofit, academic and government leaders from across nine counties
to collaborate on regional approaches to affordable/workforce housing, municipal sharing and
local government efficiency, land use policy, transportation and other infrastructure issues
that most impact the growth and vitality of the regional economy.
Join Pattern and be part of the solution!
HUDSON VALLEY PATTERN FOR PROGRESS
The Center for Housing Solutions and Urban Initiatives at Pattern for Progress is supported by our investors:
MJJ Builders Corp. Rand Realty - Better Homes and Gardens Real Estate Kearney Realty Group
Covington Development Jacobowitz & Gubits, LLP RUPCO Wilder Balter Partners, Inc.
Cannon Heyman & Weiss, LLP Community Preservation Corporation

![Weekly - Nutrient Analysis€¦ · November/December Lunch W2D2, November/December Lunch W2D3, November/December Lunch W2D4 Result: Exceeded Meal Pattern: [USDA]Meal Pattern SY 2014](https://static.fdocuments.in/doc/165x107/5f5db319fea1715fa965c5ce/weekly-nutrient-analysis-novemberdecember-lunch-w2d2-novemberdecember-lunch.jpg)