December 2014 - api.ning.comapi.ning.com/files/KAR5IkyS4P*jewd69fBk4GsZd3vnB6p6CyL4b8VjY…Recently...
20
EXCO Resources, Inc. December 2014 Investor Presentation
Transcript of December 2014 - api.ning.comapi.ning.com/files/KAR5IkyS4P*jewd69fBk4GsZd3vnB6p6CyL4b8VjY…Recently...

EXCO Resources, Inc.
December 2014
Investor Presentation
Management Participants
Hal Hickey President & COO
Ricky Burnett VP, CFO & CAO

3
Recent Initiatives
EXCO is well positioned for the current commodity cycle – Reduced debt and increased liquidity – Completed rights offering – Termed portion of capital structure – Added hedges – Strong technical and operational expertise
Simplified corporate structure – Sold TGGT Midstream and non-core assets – Divested Compass interest
Plan to execute on extensive inventory of natural gas opportunities in East Texas / North
Louisiana – Identified ~1,200 operated locations with ~500 achieving a 20% or greater return at flat prices as low as
~$3.60 – Over ten years of economic inventory (+20% return) remaining at current development pace – Expect to continue to enhance project returns through technological innovation and proven operational
capabilities – Haynesville drilling and completion costs consistently 10-25% below peers
South Texas offer process starting in Q1 2015 provides an opportunity to purchase low-risk PDP
oil wells at attractive prices
Maintaining optionality in Appalachia with minimal cost of carry – Recent transactions validate the attractiveness of EXCO’s position
Evaluating acquisitions that meet EXCO’s strategic and financial objectives
– Pro forma liquidity of $855 million at September 30

4
Commodity Portfolio is Weighted Toward Natural Gas
Approximately 90% of production is natural gas
117,500 Mmbtu/d swapped in 2015 at $4.20
75,000 Mmbtu/d subject to three-way collars in 2015
– $3.33 short put X $3.83 long put X $4.47 short call
3,000 Bbl/d swapped in 2015 at $91.60
Diversified Eagle Ford development exposure with the Participation Agreement
Security CL1 COMB Comdty Start Date 12/2/2013
Hedge position helps protect cash flow and provides some exposure to commodity price increases

5
EXCO Q3 2014 average daily production ~242 Mmcfe/d net
– 466 EXCO operated wells flowing to sales (386 LA / 80 TX)
– 199 non-operated wells
Net shale acreage totals ~71,000 (99% HBP)
Four rigs currently drilling
Finished eight well 2014 East Texas Shelby program, testing new completion and flowback methodologies; results show potential for a significant increase in reserves and economics
– Applying new design to North Louisiana projects expected to improve economics and reserves, and drive lower break-even points
Recently drilled a Bossier shale test well in
North Louisiana
Recently completed our first refrac with encouraging results and have additional projects planned in Q4 2014
Exploiting cross-unit development opportunities drilling longer laterals and enhancing well economics
– Enables EXCO to capture additional resources and value from ten sections impacted by geological faults
East Texas / North Louisiana
Identified inventory of ~1,200 development locations; ~500 locations achieve a 20% or greater return at flat
prices as low as ~$3.60
Shale Play
EXCO Acreage

6
East Texas – 2014 Shelby Program Exceeding Expectations
Eight well 2014 program consisted of five wells targeting the Haynesville and three wells targeting the Bossier
– Wells strategically drilled across the acreage position to appraise the opportunity
Program incorporating EXCO’s latest
evolution in completion and flowback technology
– Longer laterals (up to 8,000 feet), 33% more pounds of proppant per lateral foot, and a more restricted flowback designed to minimize pressure drawdown
Initial results indicate materially higher
EURs than end of year 2013 proved reserves of 1.0 Bcf per 1,000 feet of lateral
– Offset operators have observed up to 1.9 Bcf per 1,000 feet of lateral EXCO’s first two wells are tracking similar
performance
Potential to capture incremental ~$400 million of value1 at 1.75 Bcf per 1,000 feet
– Inventory of 250+ locations based on average lateral lengths of approximately 6,500 feet
Expect additional investment in 2015 capital program
Shelby Area
1 Incremental value for 3P reserves based on pre-tax PV10 utilizing internal management type curves and a 9/26/14 forward price deck.
Thomas wells (Haynesville & Bossier)
York SU 2HB (Bossier)
Crenshaw SU 1H (Haynesville)
Jacob SU 1H (Haynesville)
Deen SU 1H (Haynesville)

7
North Louisiana – Bossier Shale Plans in Holly Area
Opportunity to transfer learnings from East Texas completion and flowback modifications to Bossier shale in North Louisiana
Potential to develop inventory at lower breakeven prices
– Leverage EXCO’s drilling and completion expertise and efficiencies to improve cost and productivity
– Advances in completion and flowback methodologies and changes in regulations (cross-unit laterals) improve economics
– Existing infrastructure in place – Demonstrated low cost operator
Potential 300+ Bossier well inventory
Drilled appraisal well with completion
scheduled in December
Q4 2014 test
Two existing wells
North Louisiana Bossier
Potential Bossier “Pay” Acreage

8
Focused on reducing declines and increasing returns on maturing assets
– Base initiatives offset PDP declines and reduce capital intensity Refrac opportunities Artificial lift Field compression Flow optimization
Additional refracs planned in Q4 2014
– Initial refrac (July 2014) very encouraging Gas rate increased 1,350 Mcf/d (550 to
1,900 Mcf/d) Pressure initially increased over 3,000 psi
(1,270 to ~4,300 psi) Pressure and rates are steady since the
refrac (~1,600 Mcf/d and ~2,600 psi) – Over 270 initial refrac candidates identified
Positive response from artificial lift projects
– Completed 170 projects year-to-date – Artificial lift response improves with
additional compression projects
Compression and flow optimization – 120 wells realizing the benefit of reduced
line pressure; observing gas uplift of up to 6%
– Working to further reduce line pressure through full field compression and well head compressors
North Louisiana – Base Optimization
IP: 1,900 Mcf/d Daily average
rate in November
~1,600 Mcf/d
After
Initial Refrac
Pipeline shut-in
550 Mcf/d
Before

9
South Texas
1 Production shown reflects Q3 2014 net average daily production.
Core Area Acreage
- Current Buda Drilling
EXCO Core
Buda Overview
Participating in Buda wells with partner starting in Q4 2014
Concentrated acreage position in oil window
– 49,000 net acres (11,700 net in Core)
– Optionality on farm-in acreage
Operated production of 5,839 BOE/d1 net from 170 producing wells
Initiating Buda testing
Competitor Buda Drilling
10
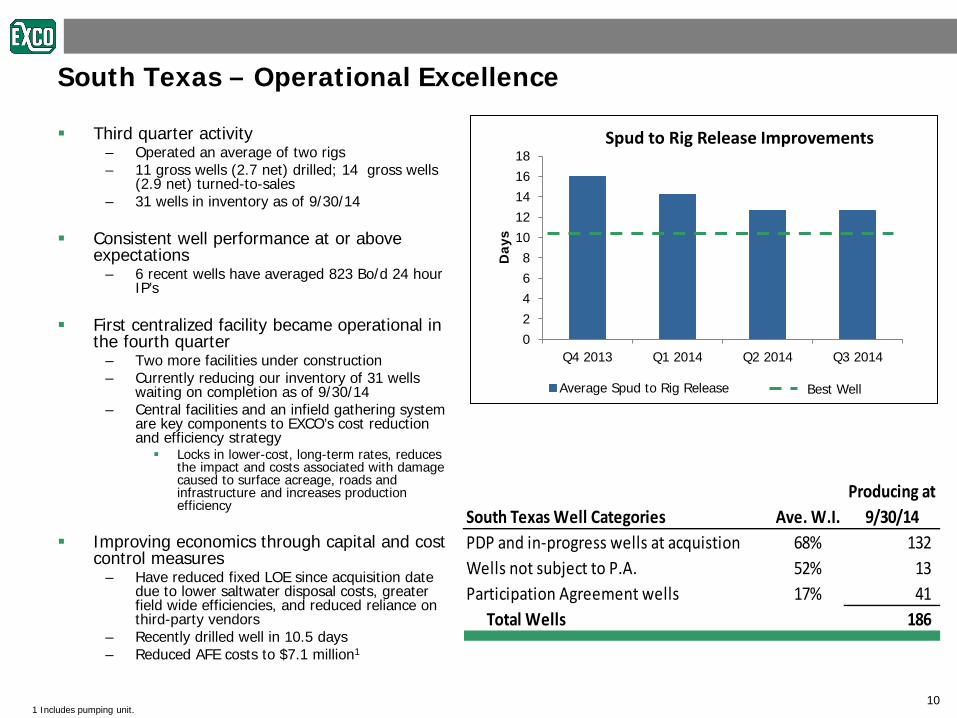
South Texas – Operational Excellence
Third quarter activity – Operated an average of two rigs – 11 gross wells (2.7 net) drilled; 14 gross wells
(2.9 net) turned-to-sales – 31 wells in inventory as of 9/30/14
Consistent well performance at or above
expectations – 6 recent wells have averaged 823 Bo/d 24 hour
IP’s
First centralized facility became operational in the fourth quarter
– Two more facilities under construction – Currently reducing our inventory of 31 wells
waiting on completion as of 9/30/14 – Central facilities and an infield gathering system
are key components to EXCO’s cost reduction and efficiency strategy Locks in lower-cost, long-term rates, reduces
the impact and costs associated with damage caused to surface acreage, roads and infrastructure and increases production efficiency
Improving economics through capital and cost
control measures – Have reduced fixed LOE since acquisition date
due to lower saltwater disposal costs, greater field wide efficiencies, and reduced reliance on third-party vendors
– Recently drilled well in 10.5 days – Reduced AFE costs to $7.1 million1
02468
1012141618
Q4 2013 Q1 2014 Q2 2014 Q3 2014
Day
s
Spud to Rig Release Improvements
Average Spud to Rig Release Best Well
South Texas Well Categories Ave. W.I.Producing at
9/30/14PDP and in-progress wells at acquistion 68% 132 Wells not subject to P.A. 52% 13 Participation Agreement wells 17% 41
Total Wells 186
1 Includes pumping unit.
11
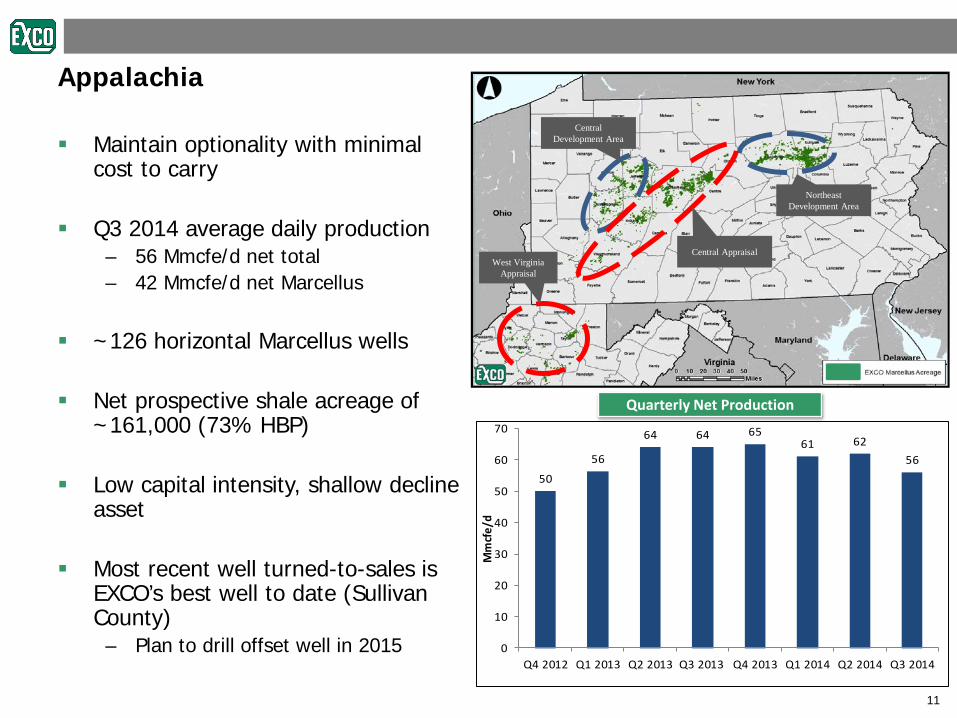
50
56
64 64 6561 62
56
0
10
20
30
40
50
60
70
Q4 2012 Q1 2013 Q2 2013 Q3 2013 Q4 2013 Q1 2014 Q2 2014 Q3 2014
Mm
cfe/
d
Appalachia
Maintain optionality with minimal cost to carry
Q3 2014 average daily production – 56 Mmcfe/d net total – 42 Mmcfe/d net Marcellus
~126 horizontal Marcellus wells
Net prospective shale acreage of
~161,000 (73% HBP)
Low capital intensity, shallow decline asset
Most recent well turned-to-sales is EXCO’s best well to date (Sullivan County)
– Plan to drill offset well in 2015
Northeast Development Area
Central Development Area
Central Appraisal West Virginia
Appraisal
Quarterly Net Production

12
2014 Actuals and Fourth Quarter Guidance1
Have been managing operating costs and G&A down Expect a sequential increase in production for Q4 2014 after adjusting for
the Compass divestiture
Mid-Point Guidance TotalQ1 2014 Q2 2014 Q3 2014 Q4 2014 2014
Oil (Mbbls) 593 579 537 535 2,244 Natural gas liquids (Mbbls) 59 65 62 45 231 Natural gas (Mmcf) 32,722 31,006 29,359 28,250 121,337 Total production (Mmcfe) 36,634 34,870 32,953 31,730 136,187 Average daily production (Mmcfe/d) 407 383 358 345 373
Costs and expenses ($000s):Oil and natural gas operating costs 18,787$ 15,827$ 14,099$ 13,000$ 61,713$ General and administrative² 15,831 17,759 12,941 13,500 60,031
Adjusted EBITDA ($000s)3 111,722$ 105,198$ 93,621$ 90,000$ 400,541$
Capital expenditures ($000s)⁴ 100,037$ 99,126$ 103,505$ 115,000$ 417,668$
Net Debt ($000s)5 1,318,827$ 1,379,026$ 1,288,599$
Actuals
Note: Q4 2014 estimates based on NYMEX prices of $3.91 and $80.00 for natural gas and oil. 1 Includes EXCO’s 25.5% interest in Compass Production Partners through close on 10/31/14. 2 General and administrative excludes non-cash stock based compensation. The company is guiding to $1.2 million for the fourth quarter 2014. 3 Adjusted EBITDA is a non-GAAP measure. Please see appendix for additional information. 4 Does not include EXCO’s share of Compass Production Partner’s capital; the partnership’s drilling and completion capital expenditures are self funded. 5 Excludes EXCO’s proportionate share of Compass Production Partners, unamortized discounts and Q3 2014 is pro forma for the sale of EXCO’s interest in Compass Production Partners.
Includes 1 month of Compass

13
South Texas 2015 Offer Wells
Currently seven wells are eligible for the first quarter 2015 offer process; EXCO is providing an estimate for these wells to give a sense of the size and impact of the transaction
Based on actual D&C costs, well performance, cash flow to date, and an $80 flat oil price deck, EXCO estimates the acquired PV10 value would range from $35 to $40 million and the offer amount would be in the $25 to $30 million range
This would result in EXCO purchasing the wells at approximately PV15 ($68,500 per flowing barrel), which is below the current market value for proved developed producing oil wells
– Transaction would add an incremental production wedge of 120,000 to 125,000 barrels of oil in 2015 and continue to diversify EXCO’s commodity mix
EXCO has ample liquidity ($855 million pro forma at 9/30/14) to execute on the offer
process – The acquisition of proved developed producing wells should add additional borrowing
capacity
41 Wells
Q4 12 Wells
Q3 11 Wells
Q2 11 Wells
Q1 7 Wells $25 to
$30 mm
2015 Offer
Wells1
Note: PV-10 and offer amount ranges as presented in the October 29, 2014 earnings presentation and based on a flat $80 oil price. Actual offer prices will be calculated using the forward strip at the time of the offer process. 1 Some of the offer wells may not be purchased based on criteria in the participation agreement.

14
$855 million of pro forma liquidity – $65 million cash – $790 million available on credit
agreement
September 30, 2014 leverage
ratio improves to 3.4x pro forma for Compass divestiture
Borrowing based increased to $900 million
No near term debt maturities – Senior Notes in 2018 and 2022
Debt and Liquidity
($ in thousands) Actual
PF Compass Divestiture and
BB IncreaseCash and restricted cash1 65,143$ 65,143$
Amount drawn on credit agreement 222,492$ 103,742$ 2018 Senior Notes2 750,000 750,000 2022 Senior Notes 500,000 500,000 Total debt1 1,472,492$ 1,353,742$
Bank borrowing base 875,000$ 900,000$ Amount drawn on credit agreement (222,492) (103,742) Letters of credit (6,573) (6,573) Available for borrowing 645,935$ 789,685$ Plus: Cash and restricted cash 65,143 65,143 Liquidity 711,078$ 854,828$
September 30, 2014
1 Excludes EXCO’s proportionate share of cash and debt from Compass Production Partners. 2 Excludes unamortized discounts.
Quarterly Net Debt

15
Natural Gas Remaining Q4 2014 2015 2016Swaps - HH (Mmbtu/d) 215,000 117,500 - Strike 4.23$ 4.20$ -$
Short Calls - HH (Mmbtu/d) 55,000 55,000 - Strike 4.29$ 4.29$ -$
Three Way Collars- HH (Mmbtu/d) - 75,000 30,000
Short Call - Strike -$ 4.47$ 4.80$
Long Put - Strike -$ 3.83$ 3.90$
Short Put - Strike -$ 3.33$ 3.40$
Oil Remaining Q4 2014 2015 2016Swaps - (Bbl/d)1 4,250 3,000 - Strike1 95.93$ 91.60$ -$
Calls - WTI (Bbl/d) 1,000 1,000 - Strike 100.00$ 100.00$ -$
EXCO Resources, Inc.
Current Hedge Position – Effective Date 12/1/14
Look to add multi-year term to hedge portfolio through utilization of swaps, costless three-way collars and unhedged volumes to provide some exposure to commodity price increases while protecting a component of future cash flows
1 Includes both WTI and LLS index based swaps.

EXCO Resources, Inc.
Appendix

17
EBITDA and Adjusted EBITDA Reconciliation
Three Months Ended Three Months Ended Three Months Ended Nine Months Ended(in thousands) March 31, 2014 June 30, 2014 September 30, 2014 September 30, 2014Net income (loss) (4,606)$ 2,293$ 41,569$ 39,256$
Interest expense 20,164 25,968 23,974 70,106 Income tax expense - - - - Depletion, depreciation and amortization 69,275 67,253 64,913 201,441
EBITDA 84,833$ 95,514$ 130,456$ 310,803$ Accretion of discount on asset retirement obligations 681 695 709 2,085 Impairment of oil and natural gas properties - - - - Other items impacting comparability 2,600 6,775 1,747 11,122 Equity (income) loss (1,111) 410 153 (548) Net (gains) losses on derivative financial instruments 43,022 14,718 (42,844) 14,896 Cash settlements (payments) on derivative financial instruments (19,810) (14,659) 2,282 (32,187) Share based compensation expense 1,507 1,745 1,118 4,370
Adjusted EBITDA 111,722$ 105,198$ 93,621$ 310,541$ Interest expense (20,164) (25,968) (23,974) (70,106) Income tax expense - - - - Amortization of deferred financing costs and discount 2,444 5,253 2,194 9,891 Other operating items impacting comparability (2,600) (6,775) (1,755) (11,130) Changes in working capital 108,932 (9,920) 20,157 119,169
Net cash provided by operating activities 200,334$ 67,788$ 90,243$ 358,365$
18
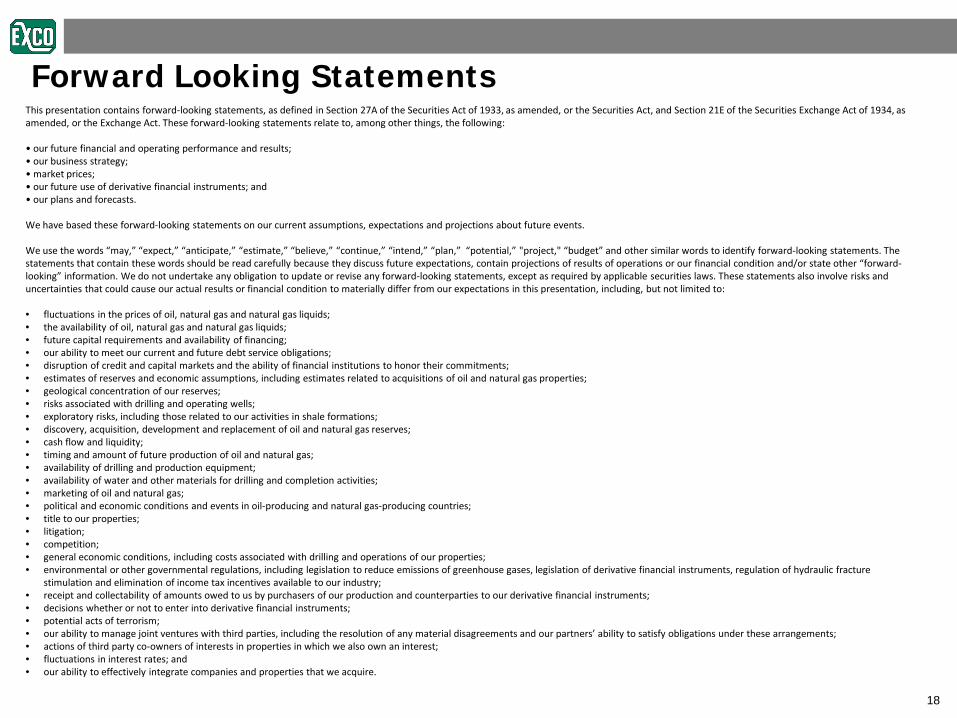
This presentation contains forward-looking statements, as defined in Section 27A of the Securities Act of 1933, as amended, or the Securities Act, and Section 21E of the Securities Exchange Act of 1934, as amended, or the Exchange Act. These forward-looking statements relate to, among other things, the following: • our future financial and operating performance and results; • our business strategy; • market prices; • our future use of derivative financial instruments; and • our plans and forecasts. We have based these forward-looking statements on our current assumptions, expectations and projections about future events. We use the words “may,” “expect,” “anticipate,” “estimate,” “believe,” “continue,” “intend,” “plan,” “potential,” "project," “budget” and other similar words to identify forward-looking statements. The statements that contain these words should be read carefully because they discuss future expectations, contain projections of results of operations or our financial condition and/or state other “forward-looking” information. We do not undertake any obligation to update or revise any forward-looking statements, except as required by applicable securities laws. These statements also involve risks and uncertainties that could cause our actual results or financial condition to materially differ from our expectations in this presentation, including, but not limited to: • fluctuations in the prices of oil, natural gas and natural gas liquids; • the availability of oil, natural gas and natural gas liquids; • future capital requirements and availability of financing; • our ability to meet our current and future debt service obligations; • disruption of credit and capital markets and the ability of financial institutions to honor their commitments; • estimates of reserves and economic assumptions, including estimates related to acquisitions of oil and natural gas properties; • geological concentration of our reserves; • risks associated with drilling and operating wells; • exploratory risks, including those related to our activities in shale formations; • discovery, acquisition, development and replacement of oil and natural gas reserves; • cash flow and liquidity; • timing and amount of future production of oil and natural gas; • availability of drilling and production equipment; • availability of water and other materials for drilling and completion activities; • marketing of oil and natural gas; • political and economic conditions and events in oil-producing and natural gas-producing countries; • title to our properties; • litigation; • competition; • general economic conditions, including costs associated with drilling and operations of our properties; • environmental or other governmental regulations, including legislation to reduce emissions of greenhouse gases, legislation of derivative financial instruments, regulation of hydraulic fracture
stimulation and elimination of income tax incentives available to our industry; • receipt and collectability of amounts owed to us by purchasers of our production and counterparties to our derivative financial instruments; • decisions whether or not to enter into derivative financial instruments; • potential acts of terrorism; • our ability to manage joint ventures with third parties, including the resolution of any material disagreements and our partners’ ability to satisfy obligations under these arrangements; • actions of third party co-owners of interests in properties in which we also own an interest; • fluctuations in interest rates; and • our ability to effectively integrate companies and properties that we acquire.
Forward Looking Statements

19
Forward Looking Statements (continued)
We believe that it is important to communicate our expectations of future performance to our investors. However, events may occur in the future that we are unable to accurately predict, or over which we have no control. We caution users of the financial statements not to place undue reliance on any forward-looking statements. When considering our forward-looking statements, keep in mind the cautionary statements in this presentation, and the risk factors included in our Annual Report on Form 10-K for the year ended December 31, 2013, filed with the Securities and Exchange Commission ("SEC") on February 26, 2014. Our revenues, operating results and financial condition depend substantially on prevailing prices for oil and natural gas and the availability of capital. Declines in oil or natural gas prices may have a material adverse effect on our financial condition, liquidity, results of operations, the amount of oil or natural gas that we can produce economically and the ability to fund our operations. Historically, oil and natural gas prices and markets have been volatile, with prices fluctuating widely, and they are likely to continue to be volatile.
20
EBITDA and Adjusted EBITDA
EBITDA and Adjusted EBITDA Earnings before interest, taxes, depreciation, depletion and amortization, or “EBITDA” represents net income adjusted to exclude interest expense, income taxes and depreciation, depletion and amortization. “Adjusted EBITDA” represents EBITDA adjusted to exclude other operating items impacting comparability, accretion of discount on asset retirement obligations, non-cash changes in the fair value of derivatives, non-cash write-downs of assets, stock-based compensation and income or losses from equity method investments. We have presented EBITDA and Adjusted EBITDA because they are a widely used measure by investors, analysts and rating agencies for valuations, peer comparisons and investment recommendations. In addition, similar measures are used in covenant calculations required under our credit agreement, the indenture governing our 7.5% senior notes due September 15, 2018, and the indenture governing our 8.5% senior notes due April 15, 2022. Compliance with the liquidity and debt incurrence covenants included in these agreements is considered material to us. Our computations of EBITDA and Adjusted EBITDA may differ from computations of similarly titled measures of other companies due to differences in the inclusion or exclusion of items in our computations as compared to those of others. EBITDA and Adjusted EBITDA are measures that are not prescribed by generally accepted accounting principles, or GAAP. EBITDA and Adjusted EBITDA specifically exclude changes in working capital, capital expenditures and other items that are set forth on a cash flow statement presentation of a company’s operating, investing and financing activities. As such, we encourage investors not to use these measures as substitutes for the determination of net income, net cash provided by operating activities or other similar GAAP measures. The calculation of EBITDA and Adjusted EBITDA as presented herein differ in certain respects from the calculation of comparable measures in the EXCO Resources Credit Agreement, the indenture governing our 2018 Notes and the indenture governing our 2022 Notes.