December 2013 Tracking Adaptation and Measuring ...pubs.iied.org/pdfs/10086IIED.pdf · Tracking...
65
December 2013 Tracking Adaptation and Measuring Development (TAMD) in Nepal D.C. Devkota, A. Shrestha, S. Fisher, P. Pokhrel, and N.B. Joshi Q3 Report - Feasibility Testing Phase
Transcript of December 2013 Tracking Adaptation and Measuring ...pubs.iied.org/pdfs/10086IIED.pdf · Tracking...

December 2013
Tracking Adaptation and Measuring Development (TAMD) in Nepal
D.C. Devkota, A. Shrestha, S. Fisher, P. Pokhrel, and N.B. Joshi
Q3 Report - Feasibility Testing Phase

I
www.iied.org www.idsnepal.org
TAMD PROJECT NEPAL-Q3 REPORT, DEC 2013
Acronyms
AP Adaptation Plan
CADP-N Climate change Adaptation Design and Pilot phase Nepal
CAPA Community Adaptation Plan of Action
CBO Community Based Organization
CBS Central Bureau of Statistics
CDO Chief District Officer
CFUG Community Forest User Group
CRM Climate Risk Management
CV Climate Vulnerability
CVP Climate Vulnerable People/Population
CVS Climate Vulnerable Settlements
DADO District Agriculture Development Office
DAG Disadvantaged Group
DCCC District Climate Coordination Committee
DDC District Development Committee
DDMU District Disaster Management Unit
DEECCCC District Energy Environment Climate Change Coordination Committee
DEEU District Energy and Environment Unit
DFCC District Forest Coordination Committee
DFID Department for International Development of UK government
DFO District Forest Office
DHM Department of Hydrology and Meteorology
DPMAS District Poverty Monitoring and Analysis System
DSCO District Soil Conservation Office
DTO District Technical Office
EFLG Environment Friendly Local Governance
EU European Union
FGD Focus Group Discussion
HH House Hold
I/NGO International Non-Government Organization
ICIMOD International Centre for Integrated Mountain Development
IDS-Nepal Integrated Development Society-Nepal
IIED International Institute for Environment and Development
ISET - N Institute for Social and Environmental Transition – Nepal
LAPA Local Adaptation Plan of Action
LFP Livelihoods and Forestry Programme
LGCDP Local Governance and Community Development Programme
MC Minimum Conditions
MLV Mountain-specific Livelihood Vulnerability
MoAD Ministry of Agricultural Development
MoFALD Ministry of Federal Affairs and Local Development
MoFSC Ministry of Forest and Soil Conservation
MoHA Ministry of Home Affairs
MoSTE Ministry of Science, Technology and Environment
MSFP Multi Stakeholder Forestry Project
NAPA National Adaptation Programme of Action
NCCSP National Climate Change Support Programme

TAMD PROJECT NEPAL-Q3 REPORT, DEC 2013
NGO Non Government Organization
NPC National Planning Commission
PLMG Public Land Management Group
PM Performance Measures
PPCR Pilot Program for Climate Resilience
PVAT Poverty and Vulnerability Assessment Tool
REDD Reduction of Emission from Deforestation and Forest Degradation
SPCR Strategic Program for Climate Resilience
TAMD Tracking Adaptation and Measuring Development
TCC TAMD Coordination Committee
TOC Theory of Change
UG Users’ Group
VDC Village Development Committee
VEECCCC Village Energy Environment Climate Change Coordination Committee
VFCC Village Forest Coordination Committee
WCF Ward Citizens Forum
WFP World Food Programme

TAMD PROJECT NEPAL-Q3 REPORT, DEC 2013
Contents
INTRODUCTION 1
Level of TAMD application- Scale and intervention (programme, national, project, etc.) 2
Planned activities for Q3 and progress since last quarter (Q2) 3
STAKEHOLDER ANALYSIS/KEY ENTRY POINTS 6
Existing stakeholders 6
Any new entry points/stakeholders 7
THEORY OF CHANGE ESTABLISHED 8
Local Theories of Change by Selected Interventions: at VDC Level 8
INDICATORS (TRACK 1 AND TRACK 2) AND METHODOLOGY 13
Indicators 13
Methodological approach 17
EMPIRICAL DATA COLLECTION (a) TRACK 1 (b) TRACK 2 21
Establishing baselines 21
CHALLENGES 27
CONCLUSIONS AND EMERGING LESSONS 28
ANNEXURES 29
Annex 1: DDC and VDC Score Card Templates used in Rukum District 29
Annex 2: List of District Interaction Workshop Participants in Rukum 32
Annex 3: Key Informants Interview (KII) Template used in Rukum 34
Annex 4: FGD Template used in Rukum 39
Annex 5: Household Survey (HHS) Template used in Rukum 42
Annex 6: Climatic Data of Rukum and Nawalparasi Districts 54
Annex 6: Photo Plates (Rukum District's Field Exercises) 60

1
www.iied.org www.idsnepal.org
TAMD PROJECT NEPAL-Q3 REPORT, DEC 2013
TAMD Feasibility Study in Nepal - Quarter Three Report
INTRODUCTION The TAMD feasibility study in Nepal is being undertaken for the Ministry of Science,
Technology and Environment (MoSTE) by the International Institute for Environment and
Development (IIED)-UK and Integrated Development Society (IDS)-Nepal, as the follow up
to the previous study on TAMD appraisal and design conducted on October 2012-
February 2013.
In order to track adaptation at the national level and to measure progress against national
development objectives, TAMD feasibility study in Nepal is aiming to develop a framework
and to make meaningful conclusions from different indicators and M&E frameworks for
different interventions in reference to vulnerabilities viz. landslide, flood and drought.
Indicators are being selected and developed from existing frameworks of selected
interventions, expert literatures relevant to Nepalese context and government data system,
as well as from the TAMD framework and contextualised with climate risk data. It will allow
assessing the contributions of a set of interventions to climate resilience and climate risk
management and combined to understand changes at the national level. Cross verification
will also be made through available secondary information on disaster and climate data at
a national, regional or district level. The selected intervention communities will be matched
and climate hazards - landslides, flooding and drought will be analysed.
In this Quarter, after the selection of the study interventions and districts based on the
methodological approach envisioned according to the country context during previous
quarters, TAMD study in Nepal has undergone further stage of development and
improvement with data and information collected from various secondary and primary

TAMD PROJECT NEPAL-Q3 REPORT, DEC 2013
sources. At the end of the quarter-3, field testing and data collection work in Rukum
district (out of 2 selected districts) has been completed. The data and information were
collected at District/VDC/Community/HHs level, using various research tools and methods
such as Field observations, District level stakeholders interaction workshops, DDC/VDC
Scorecards, Key Informants Survey (KIS), Focus Group Discussions (FGDs), Households
Survey Questionnaire (HHS) etc. The collected data and information are under the
process/stage of being fed in and analysis. These research tools and methods i.e.
DDC/VDC Scorecards (Annex 1), KIS (Annex 3), FGDs (Annex 4), HHS (Annex 5)
developed and tested are presented in the Annexes.
Level of TAMD application- Scale and intervention (programme, national, project, etc.)
As per the TAMD Coordination Committee's (TCC) advice/guidance and the TAMD study
team (a group of technical/expert consultants) technical recommendation, the TAMD
feasibility study in Nepal has selected and is being piloted in two districts (i.e. Nawalparasi
and Rukum) for three selected interventions (projects) viz. LGCDP, LFP and NCCSP
Start-up Phase based on the set of selection criteria. This study particularly focused on
climate vulnerability/hazard of flood risk in Nawalparasi district and landslide in Rukum
district.
In order to conduct study further down at the local level i.e. Village and Climate vulnerable
communities, TAMD team have recently had field exercises in Rukum district for making
VDC selection, conducting field tests and data and information collection at different levels
of the district. After the wider consultations and interaction with district level stakeholders
and relevant VDC representatives during the field visit, TAMD team have decided to select
two high vulnerable to landslide VDCs i.e. 1) Shyalapakha VDC with LGCDP and LFP
interventions and 2) Nuwakot VDC with only LGCDP interventions for VDC matching and
further research at VDC/community/HH level in line with the TAMD feasibility study
purpose. Similar approach will be adopted in Nawalparasi district as well. The detailed and
evolved methodological approaches are presented in the proceeding section of this report.
In addition, it has also become evident from the field exercises in Rukum that Drought
cannot be considered as climate change vulnerability/hazard in the district, however, it has
been affecting the local communities only as a slow-on-set-changes to climate. Hence, no
separate study was conducted for drought as separate climate vulnerability like landslide
and flood in Rukum and Nawalparasi district respectively as proposed in the previous
quarters, however issues related with slow-on-set-changes have been incorporated into
various research tools and techniques adopted for the study.
TAMD PROJECT NEPAL-Q3 REPORT, DEC 2013
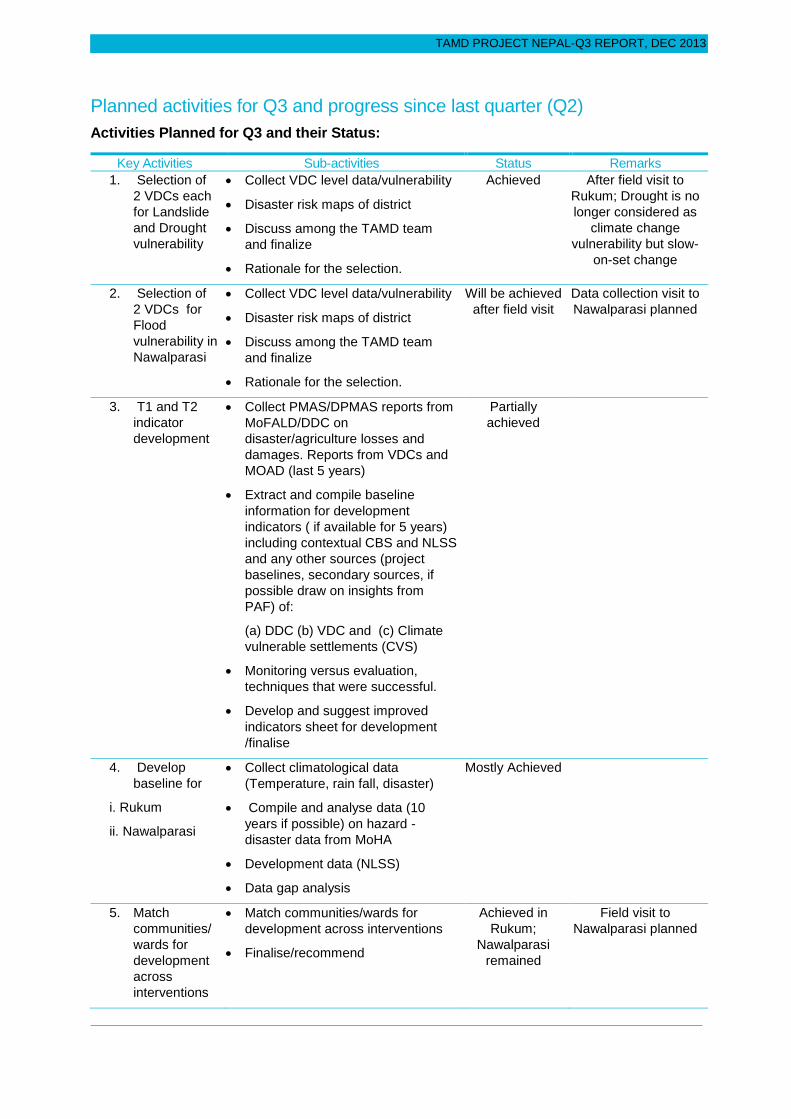
Planned activities for Q3 and progress since last quarter (Q2)
Activities Planned for Q3 and their Status:
Key Activities Sub-activities Status Remarks
1. Selection of
2 VDCs each
for Landslide
and Drought
vulnerability
Collect VDC level data/vulnerability
Disaster risk maps of district
Discuss among the TAMD team
and finalize
Rationale for the selection.
Achieved After field visit to
Rukum; Drought is no
longer considered as
climate change
vulnerability but slow-
on-set change
2. Selection of
2 VDCs for
Flood
vulnerability in
Nawalparasi
Collect VDC level data/vulnerability
Disaster risk maps of district
Discuss among the TAMD team
and finalize
Rationale for the selection.
Will be achieved
after field visit
Data collection visit to
Nawalparasi planned
3. T1 and T2
indicator
development
Collect PMAS/DPMAS reports from
MoFALD/DDC on
disaster/agriculture losses and
damages. Reports from VDCs and
MOAD (last 5 years)
Extract and compile baseline
information for development
indicators ( if available for 5 years)
including contextual CBS and NLSS
and any other sources (project
baselines, secondary sources, if
possible draw on insights from
PAF) of:
(a) DDC (b) VDC and (c) Climate
vulnerable settlements (CVS)
Monitoring versus evaluation,
techniques that were successful.
Develop and suggest improved
indicators sheet for development
/finalise
Partially
achieved
4. Develop
baseline for
i. Rukum
ii. Nawalparasi
Collect climatological data
(Temperature, rain fall, disaster)
Compile and analyse data (10
years if possible) on hazard -
disaster data from MoHA
Development data (NLSS)
Data gap analysis
Mostly Achieved
5. Match
communities/
wards for
development
across
interventions
Match communities/wards for
development across interventions
Finalise/recommend
Achieved in
Rukum;
Nawalparasi
remained
Field visit to
Nawalparasi planned

TAMD PROJECT NEPAL-Q3 REPORT, DEC 2013
6. Finalise
methodology,
sampling
methods,
survey tools
and other
community
techniques for
testing/resear
ch in
Nawalparasi
and Rukum
Sampling-consider options for
sampling i.e. several communities
vulnerable to flood/landslide,
stratified by project ? Sample whole
or standard sample size of
flood/landslide vulnerable VDCs
Modify VDC indicators for
development and learning/flexible
for discussion
Development tracking indicators -
finalise for testing
DDC model indicators for
discussion
Proxies/vulnerability develop for
discussion
Finalize methodology, sampling,
survey and community techniques
Finalise tools (HH survey
questionnaires, key informants
survey, FGDs etc)
Achieved for
Rukum
Needs slight
adaptation on tools
and techniques for
specific context to
flood
7. Technical
feedback/prog
ress sharing
meeting
Identify potential experts for
workshop
Prepare for workshop
Organize one day workshop
Differed TAMD Team has
agreed to share
progress in respective
districts only;
Workshop organised
in Rukum
8. TAMD
Coordination
Committee
meeting
Prepare/organize meeting Differed TAMD Team has
agreed to share
progress in respective
districts only;
Workshop organised
in Rukum
9. Conduct field
study in
Rukum
Travel to Rukum from Kathmandu
Meeting with district level
officials/arrange for workshop
District level workshop
Test tools (HH survey
questionnaires, key informants
survey, FGDs etc) in Rukum
Refine/adjust/print tools based on
testing
Hire local enumerators (as per
requirement based on sample size)
/ conduct orientation
Conduct study in Rukum
Achieved
10. Conduct field
study in
Nawalparasi
Travel to Nawalparasi
Meeting with district level
officials/arrange for workshop
Field visit to
Nawalparasi
planned

TAMD PROJECT NEPAL-Q3 REPORT, DEC 2013
District level workshop
Test tools (HH survey
questionnaires, key informants
survey, FGDs etc) in Nawalparasi
Refine/adjust/print tools based on
testing
Hire local enumerators (as per
requirement based on sample size)
/ conduct orientation
Conduct study in Nawalparasi
11. 3rd
Quarter
report
Initial work on Q3 report
Prepare draft report and share for
inputs
Send report
Achieved
12. Data analysis Data tabulation, entry and analysis Data entry
started for
Rukum

TAMD PROJECT NEPAL-Q3 REPORT, DEC 2013
STAKEHOLDER ANALYSIS/KEY ENTRY POINTS Stakeholders Map for TAMD Feasibility Study in Nepal:
Existing stakeholders
At the central level, Ministry of Science, Technology and Environment (MoSTE) has
chaired the TAMD Coordination Committee (TCC) comprising MoFALD, MoAD, MoFSC,
MoE, NPC, IIED-UK, IDS-Nepal and ISET-Nepal as key members of the TAMD feasibility
study project. Representatives of these ministries and stakeholder organizations are
participating actively in the formal and informal meetings and regular interactions. They
provide regular advice and guidance to the TAMD study team.
MoSTE/TCC
(MoSTE, MoFALD, MoAD, MoFSC, MoE, IIED-UK, IDS-Nepal, ISET-Nepal and NPC)
International Partner: IIED-UK
National Partner: IDS-Nepal
Climate Vulnerable People/
Beneficiary HHs of Selected
VDCs and Interventions
Rukum & Nawalparasi Districts
(DDCs, TAMD relevant District-based government
and non-government line offices including LGCDP,
LFP, NCCSP Start-up Phase etc.)
Climate Vulnerable VDCs of
Rukum & Nawalparasi Districts
(Selected VDCs and Interventions)
Guidance/Advisory
Recommendations/
Technical support
Climate Vulnerable Wards/
Communities of Selected VDCs
( LGCDP/WCF, LFP/CFUG,
NCCSP/VEECCCC groups etc.)

TAMD PROJECT NEPAL-Q3 REPORT, DEC 2013
Moreover, TCC had selected two pilot districts (i.e. Nawalparasi and Rukum) with three
interventions (i.e. LFP, LGCDP and NCCSP Start-up Phase) for TAMD feasibility study.
After the selection of pilot districts and interventions, exploratory visit was conducted in
Nawalparasi at the end of the previous quarter (Q2) and in this quarter (Q3), field
exercises have recently been conducted in Rukum. These activities at selected districts
have helped in identifying key stakeholders and to further test TAMD study tools and
methods as well as collect relevant data and information at District/VDC/Community/HH
level.
Any new entry points/stakeholders
While moving forward with the site selection and data and information collection processes
further at the local level on various aspects, climate vulnerability and VDCs selection
become crucial for making entry points and identifying local stakeholders. In the context of
Rukum district, considering landslide vulnerability as the entry point, district level
interaction workshop was organised in Rukum to share TAMD study objectives and to
discuss on VDCs selection and generate ideas for finalising research tools and methods
which will be used at different scale/levels. Moreover, key informant's surveys (KIS) were
also conducted with concerned district based organisations and stakeholders identified for
the district workshop.
In order to select relevant VDCs for TAMD study and testing, a set of criteria was
developed considering very similar contextual elements such as socio-economic status,
climate vulnerability, presence of selected project intervention and demographics so that
linkages between the selected project interventions can be ascertained between and
within selected VDCs. By matching VDCs/community based on these elements, any
differences between the unit-less scores generated can at least be partly attributed to the
project intervention itself. This matching process is one of the key determinant factors in
the process of VDC selection.
Having considered above mentioned elements and factors, TAMD team have visited three
VDCs viz. 1) Shyalapakha VDC (with LGCDP and LFP project interventions), 2) Arma
VDC (with LGCDP and NCCSP Start-up Phase) and 3) Nuwakot VDC (with only LGCDP
project) in Rukum district. After conducting field observation, Focus Group Discussions
(FGDs) and VDC Score-cards at the visited VDCs, TAMD team finally decided to select
only two VDCs 1) Shyalapakha VDC (with LGCDP and LFP project interventions) and 2)
Nuwakot VDC (with only LGCDP project) for HHs level study and data and information
collection and Arma VDC (LGCDP and NCCSP Start-up Phase) shall be covered up for
Track 1 indicators only.
A more or less similar techniques specifically adapted to flood vulnerability context in
Nawalparasi district, will be adopted during the next field exercises in Nawalparasi.

8
www.iied.org www.idsnepal.org
TAMD PROJECT NEPAL-Q3 REPORT, DEC 2013
THEORY OF CHANGE ESTABLISHED Hypothesis: Development projects either climate change focused or only development will have impacts on people’s livelihoods that will
increase their climate resilience. These changes in resilience can be measured and aggregated across different contexts.
Based on the above hypothesis, following local Theories of Change (ToC) specific to the selected interventions for TAMD feasibility study in
Nepal can be established/predicted.
Local Theories of Change by Selected Interventions: at VDC Level
Intervention/
Local Institution
Local Theory of Change (ToC) Remarks
LGCDP/WCF Reducing poverty through Inclusive, responsive and accountable local
governance and participatory community-led development by ensuring
increased involvement of Women, Dalits, Adibasi, Janajatis, Muslims,
Madhesis, disadvantaged groups in the local governance process and
improved access to locally and inclusively prioritised public goods and
services.
LFP/CFUG Reduced vulnerability and improved livelihoods of poor and excluded
rural people by enhancing assets of rural communities through more
equitable, efficient and sustainable use of forest/ natural resources.
NCCSP
VEECCCC
The development and implementation of locally inclusive and
responsive Local adaptation Plan of Action (LAPAs) that are integrated
into village, municipality, district and sectoral planning processes,
coupled with capacity building of these institutions, will result in the
delivery of adaptation services that improve the adaptive capacity of
the climate-vulnerable poor.
NCCSP Start-up Phase has just started the
formation of local bodies at Village level
(VEECCCC) and District level (DEECCCC)
after the accomplishment of its planning
phase for further implementation of planned
activities. No sufficient activities, outputs,
outcomes and impact level indicators could

TAMD PROJECT NEPAL-Q3 REPORT, DEC 2013
be found from further study at
Community/HH level for NCCSP
Community. Therefore, it has been realised
that local theory of change for NCCSP
cannot be established at this stage.

10
www.iied.org www.idsnepal.org
TAMD PROJECT NEPAL-Q3 REPORT, DEC 2013
Assumptions on causal mechanisms between activities and outcomes:
DDC/National
Considering Tracking and Aggregation possibilities – NAPA/MoFALD/NPC
/VDC monitoring/MCPM/EFLG
Community and HH resilience (T2):
1. Contextual: Climate indicator/normalisation
point
2. Outcome indicators specific to hazard
3. Feeds into no. of households with increased
resilience and links to assessment of effect on
core development systems identified by communities
4. Community: Proxies to vulnerability (hazard and
intervention specific) unit-less scores / rankings
Community: Extent and quality of
CRM/institutional measures
(specific to intervention: Ward Citizens
Forum, Community Forest User’s
Group, VEECCCC Community)
DDC/VDC Level Track-1 (T1) Indicators
1. Climate change mainstreaming/integration into
planning (T1)*
2. Institutional co-ordination
3. Budgeting and finance (T1)*
4. Institutional knowledge/capacity (T1)*
5. Use of climate information (T1)*
6. Participation (vertical and horizontal) (T1)*
7. Awareness among stakeholders (T1)*
8. Learning and flexibility
9. BAU functions (MCPM)
Local Theories of Change on hazard and
intervention
Targeting Identified CVP in intervention
CVP participation
CVP concerns reflected in plans
CVP access to decision making

11
www.iied.org www.idsnepal.org
TAMD PROJECT NEPAL-Q3 REPORT, DEC 2013
Identification and location of outputs, targeting and outcomes on the TAMD framework (by intervention)
After conducting field exercises in Rukum and the detailed study of M&E frameworks of
the three selected interventions for TAMD feasibility study in Nepal, following indicators
related to outputs, targeting and outcomes for each intervention have been identified and
can be located at VDC (local) level on the TAMD framework.
For LGCDP/ Ward Citizens Forum (WCF) at VDC Level:
Local CRM Indicators for LGCDP/WCF
Outputs
WCF established and meets regularly
Total number of citizens participating in meetings
Majority of marginalised groups feel their views are considered and incorporated
into WCF plans
% participants aware of risks of climate variability and disasters
% of VDC internal income spent on addressing extreme events and hazards
Targeting
% of participants at all ward level planning meetings per year who are Dalits &
Women
% of participants at meetings from areas ranked as highly climate sensitive
% of VDC internal income spent explicitly on women, children, DAGs, ethnic
groups, disabled and old people per fiscal year
Outcomes
% citizens that say that the services of VDCs are more accessible than they were
TWO years ago
% citizens who say that the infrastructure (roads, drinking water, electricity)
offered by the local governments better meet their needs than last year
% of citizens that think that they are now more involved in the decision-making
process of VDCs than two year ago
For LFP/ Community Forests Users Group (CFUGs) at VDC Level:
Local CRM Indicators for LFP/ Community Forests Users Group (CFUGs)
Outputs
CFUG established and meet regularly
Total number of citizens participating in meetings
Majority of marginalised groups feel their views are considered and incorporated
into CFUG plans
% of participants who have received climate change training

TAMD PROJECT NEPAL-Q3 REPORT, DEC 2013
% of CFUG internal income spent on addressing extreme events and hazards
Targeting
% of participants at all CFUG meetings per year who are Dalits & Women
% of participants at meetings from areas ranked as highly climate sensitive
% of CFUG internal income spent explicitly on women, children, DAGs, ethnic
groups, disabled and old people per fiscal year
Outcomes
% of citizens that think they get increased benefit from forest group and its
resources compared to two years ago
Increased assets for forest users groups
Increased livelihoods choices for forest users groups
For NCCSP/ Village Energy, Environment and Climate Change Coordination Committee (VEECCCC) at VDC Level:
Local CRM Indicators for NCCSP VEECCCC
Outputs
VEECCCC established and meeting regularly
Total number of citizens participating in meetings
Climate change risks considered and incorporated into VDC and local plans
% of participants who have received climate change training
% of VEECCCC internal income spent explicitly on communities in areas ranked
as highly sensitive
Targeting
% of participants at all VEECCCC planning meetings per year who are Dalits &
Women
% of participants at meetings from areas ranked as highly climate sensitive
% of VEECCCC internal income spent explicitly on women, children, DAGs,
ethnic groups, disabled and old people per fiscal year
Outcomes
NCCSP has just started the formation of local bodies at Village level (VEECCCC)
and District level (DEECCCC) after the accomplishment of its planning phase
(NCCSP Start-up Phase) for further implementation of planned activities. Therefore, it
has been realised that in order to monitor and evaluate in line with TAMD
feasibility study; no sufficient activities, outputs, outcomes and impact level
indicators could be found from further study at Community/HH level for NCCSP
Community.

TAMD PROJECT NEPAL-Q3 REPORT, DEC 2013
INDICATORS (TRACK 1 AND TRACK 2) AND METHODOLOGY
Indicators
In Quarter-3, the initial entry point for the TAMD feasibility study is the Village
Development Committee (VDC) where information regarding both climate change
interventions and other development interventions are planned, budgeted and
coordinated. Village Development Committees (VDCs) are the lowest local level
government institutions where local level development plan, budget and implementation
take place. However, there are other local forums such as the Ward Citizen Forums
(WCFs) established by LGCDP, the platform for the need identification and participatory
planning with the participation of local communities. Local groups/ user groups may also
have their own plans and budget to implement the adaptation and development activities
such as Community Forest User's Group (CFUGs) of LFP in Rukum district.
Track 1 (T1) and Track 2 (T2) indicators have been developed based on background work
and tested at DDC/VDC/Community/HH level in Rukum by the TAMD team. This currently
focuses at two levels: monitoring within government systems (i.e. VDCs/DPMAS etc) and
monitoring/evaluation at community level. The framework tries to see how these two might
be linked through sample data points allowing the government to track climate projects
and improvements in resilience at the local level. Red indicators (as depicted in the Figure
on Causal mechanism above) are specific to an intervention while black ones provide the
linkages between them. More indicators are being developed to test parts of the TAMD
methodology, however a simplified version will be suggested for government tracking.
Other indicators would be useful for evaluation through surveys or project M&E.
The framework takes as its starting point by placing the emphasis on community based
decentralised planning in Nepal and the NAPA priority of supporting community based
adaptation. All 3 selected interventions (LGCDP, LFP, NCCSP Start-up Phase) attempt to
work within this paradigm and many more will do so in the coming years (LGCDP II,
MSFP, NCCSP, PPCR etc). Therefore, TAMD framework specifically seeks to track how
different efforts contribute to community/ward/VDC resilience.
Development of Track 1 (T1) and Track 2 (T2) indicators of selected interventions
In Quarter-3, relevant T1 and T2 indicators have further been updatedand concretised for
the selected interventions and vulnerabilities (i.e. landslide, flood and drought) from
Rukum district. These indicators were developed and tested/refined further through
discussion, meetings and interactions with stakeholders and HH survey at different levels
in Rukum. Both T1 and T2 indicators require further detail work and refinement. Therefore,
similar testing will be done in Nawalparasi district considering flood vulnerability in
particular and these indicators will then be finalised.
TAMD PROJECT NEPAL-Q3 REPORT, DEC 2013
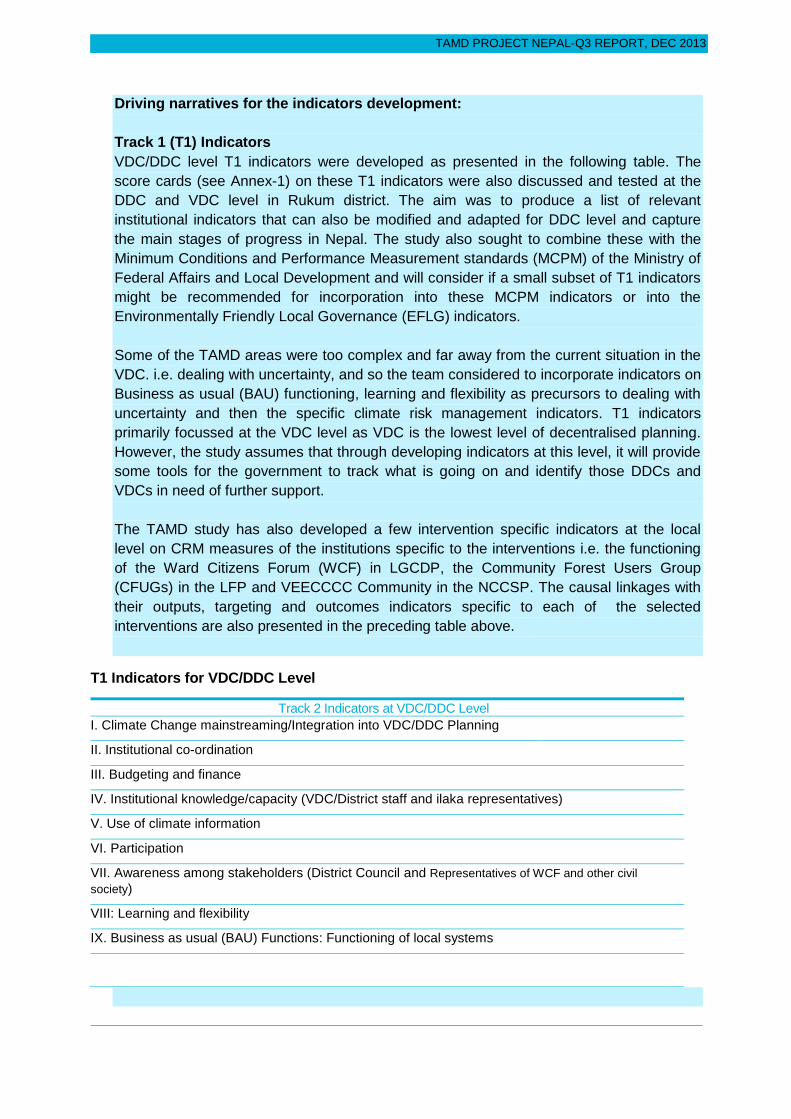
Driving narratives for the indicators development:
Track 1 (T1) Indicators
VDC/DDC level T1 indicators were developed as presented in the following table. The
score cards (see Annex-1) on these T1 indicators were also discussed and tested at the
DDC and VDC level in Rukum district. The aim was to produce a list of relevant
institutional indicators that can also be modified and adapted for DDC level and capture
the main stages of progress in Nepal. The study also sought to combine these with the
Minimum Conditions and Performance Measurement standards (MCPM) of the Ministry of
Federal Affairs and Local Development and will consider if a small subset of T1 indicators
might be recommended for incorporation into these MCPM indicators or into the
Environmentally Friendly Local Governance (EFLG) indicators.
Some of the TAMD areas were too complex and far away from the current situation in the
VDC. i.e. dealing with uncertainty, and so the team considered to incorporate indicators on
Business as usual (BAU) functioning, learning and flexibility as precursors to dealing with
uncertainty and then the specific climate risk management indicators. T1 indicators
primarily focussed at the VDC level as VDC is the lowest level of decentralised planning.
However, the study assumes that through developing indicators at this level, it will provide
some tools for the government to track what is going on and identify those DDCs and
VDCs in need of further support.
The TAMD study has also developed a few intervention specific indicators at the local
level on CRM measures of the institutions specific to the interventions i.e. the functioning
of the Ward Citizens Forum (WCF) in LGCDP, the Community Forest Users Group
(CFUGs) in the LFP and VEECCCC Community in the NCCSP. The causal linkages with
their outputs, targeting and outcomes indicators specific to each of the selected
interventions are also presented in the preceding table above.
T1 Indicators for VDC/DDC Level
Track 2 Indicators at VDC/DDC Level
I. Climate Change mainstreaming/Integration into VDC/DDC Planning
II. Institutional co-ordination
III. Budgeting and finance
IV. Institutional knowledge/capacity (VDC/District staff and ilaka representatives)
V. Use of climate information
VI. Participation
VII. Awareness among stakeholders (District Council and Representatives of WCF and other civil
society)
VIII: Learning and flexibility
IX. Business as usual (BAU) Functions: Functioning of local systems

TAMD PROJECT NEPAL-Q3 REPORT, DEC 2013
Development of Track 2 (T2) Indicators:
There are several levels of Track2 (T2) indicators.
DDC/National Level
At this stage, the study will not be developing a separate set of indicators at this level but
national priorities and indicators (e.g. NAPA/MoFALD/NPC/VDC monitoring/MCPM) are
specifically taken into consideration to determine what this study will look at different
levels. The initial aim is to gather data and information at VDC level which will then be
aggregated to inform these national indicators / priorities.
Community and VDC level Development Gateways
There are several areas of indicators at this local level, some of which are selected to
present a more simplified picture for monitoring at the VDC/DDC level and some of them
would be required for a full evaluation of contribution/attribution purposes. The study also
aims to prioritise a set of core indicators that are in the area of the intervention as well as
tracking core development indicators related to the gateway systems (the system used in
the LAPA to assess vulnerability) at community and VDC level.
In addition, some proxy indicators related to vulnerability (hazard and intervention specific)
and increased resilience at community/VDC level have also been identified and developed
based on relevant expert literatures and government M&E systems. Expert literature has
included assessment of Nepal specific literature such as ICIMOD's Mountain specific
Livelihood Vulnerability (MLV) Index and assessment of the indicators taken in the three
interventions' project documents and reports. Furthermore, perception of the community
on vulnerability was also discussed during Focus Group Discussions in Rukum. This
community data then feeds into a robust assessment of the number of households with
reduced vulnerability and links to assessment of effect on core development systems
identified. The Track 2 (T2) indicators along with the sources of information developed so
far have been presented in the table below.
Track 2 (T2) Indicators:
Track 2 (T2) Indicators Source
1. Education level Expert literature/Projects/NLSS/CBS/HHS(B1)
2. Access to solar/Electricity/improved stoves Expert literature/Projects/HHS (G3)
3. Access to safe drinking water Expert literature/Projects/HHS (G1)
4. Access to own land Expert literature/Projects/HHS (C1)
5. Access to irrigated land Expert literature/Projects/HHS (C2)
6. House type Expert literature/Projects/HHS (A10)
7. Food self-sufficiency from own production Expert literature/Projects/HHS (E1)
8. Annual income per HH Expert literature/Projects/HHS (F)
9. Number of sources of income Expert literature/Projects/HHS (F)

TAMD PROJECT NEPAL-Q3 REPORT, DEC 2013
10. Livelihood diversification HHS (F,E,B3)
11. Means of communication Expert literature/Projects/HHS (G1-10)
12. Agricultural/livestock Services Expert literature/Projects/HHS (G1.11)
13. Access to governmental services Local/HHS (F1.8)
14. Health services Expert literature/Projects/HHS(G1.8)
15. Access to support groups (Savings
group/credit services/others)
Expert literature/Projects/HHS (G1.12)
16. Social networks Expert literature/HHS (I1)
17. Livestock holding Expert literature/Projects/HHS (D1)
18. Access to roads / markets HHS (G1-2 &9)
19. Past exposure to local hazard last 5 years Local/HHS (H1)
20. Benefit from seasonal migration income or
remittances
Local/HHS (F-8)
21. Majority agricultural land on steep slopes Local/HHS (C6)
22. Reliance on fruit trees and vegetables Local/HHS (F-3)
23. Knowledge of climate change and risks Expert literature/HHS (I3)
24. Experienced change in agricultural
productivity last five years
Local/HHS (C4)
25. Exposed to socio-economic shock in last five
years
Expert literature/HHS (H1)
26. Ownership of an Ox Local/HHS (D1)
27. % citizens that say that the services of VDCs
are more accessible than they were TWO
years ago
LGCDP/HHS (I4)
28. % citizens who say that the infrastructure
(roads, drinking water, electricity) offered by
the local governments better meet their needs
than last year
LGCDP/HHS (I5)
29. % of citizens that think that they are now more
involved in the decision-making process of
VDCs than two year ago
LGCDP/HHS (I6)
30. % of citizens that think they get increased
benefit from forest group and its resources
compared to two years ago
LFP
31. Increased assets for forest users groups LFP
32. Increased livelihoods choices for forest users
groups
LFP
Climate data and contextual point:
To contextualize the development indicators into wider context, the study have sought to
create a climate data point or set of contextual information. Due to severe data shortages,
it is unlikely that this will be a time-series analysis or will have much historical data, but we

TAMD PROJECT NEPAL-Q3 REPORT, DEC 2013
are currently scoping how we might combine sources on a few areas such as rainfall, crop
yields, loss and damage payouts. The study would seek to use this to create an easily
assessable data point at the DDC/VDC level (i.e. through converting to a qualitative scale
on the state of the information and the change in climate) as well as using a wider set of
data for an evaluation context.
Methodological approach
Evolved TAMD Methodological Approach for TAMD Feasibility Study in Nepal-Quarter 3
Study Districts/DDCs
Study Villages/VDCs
Local InstitutionWard Citizen Forum /
Community Forest
Users GroupTheory of change
Targeting
Community resilience
as unit less score
- Generic resilience
indicators (expert
literature)
- Local hazard indicators
- Project indicators
Hazard outcomese.g. Agricultural
productivity per capita,
loss and damage from
flood/landslides
Development
outcomes
Contextual
indicators
Climate data
Socio-economic data
Methodology for Nepal TAMD feasibility test
The purpose of the Nepal TAMD feasibility test is to examine changes in community and
household resilience and how they might be measured and aggregated across different
interventions to enable the government to track progress and measure effectiveness. It
uses three interventions that are addressing specific hazards through community led
planning. It will empirically test the following elements of the TAMD methodology:
Contextual measurements of resilience through quintiles and unit less scores
Local theories of change
Contribution of local/VDC level institutions to community resilience
Use of hazard specific outcome measures and a climate contextual point
Use of the scorecards at the local level

TAMD PROJECT NEPAL-Q3 REPORT, DEC 2013
To tie into national systems and priorities TAMD feasibility study:
Proposes and tests a methodology for measuring and tracking changes in HH resilience (one of the 5 indicators chosen by MoSTE and PPCR to track (Monitoring and evaluation)
Identifies possible outcome indicators for hazard specific resilience (Evaluation)
Identifies potentially key national development indicators to track from community experiences of resilience (Monitoring)
Tests a method of monitoring institutional resilience at DDC/VDC level (Monitoring)
Suggests an evaluative methodology for comparing approaches to building resilience (Evaluation)
The steps of the methodology are as follows:
1. Identification/Selection of VDCs and community within those VDCs based on vulnerability to hazards and relevant project interventions. Communities matched within a VDC across gateway systems and hazard risk.
2. Testing of DDC/VDC scorecard and data collection
3. Community level FGD on hazard, who is vulnerable and why, role of the intervention, local theories of change and what factors show success. This data is used to construct contextual indicators for proxies to vulnerability and outcome level indicators specific to the hazard.
4. Local institutional T1 indicators on each intervention’s local institution and targeting
5. HH data collection on the proxies and some other core demographic data/contextual, and community outcome data
6. At VDC look for secondary sources of the identified outcome data at smallest scale available.
7. Climate (and other contextual data) translated into useful form and used to summarise trends with level of certainty and contextualise the outcome trends
8. Analysis includes differences of resilience changes between interventions and between hazards. Relevance of national development indicators to each hazard. Aggregation of changes in resilience if appropriate.
VDC and Community Selection:
In order to select relevant VDCs in Rukum district for TAMD study and testing further down
at the local level, a set of criteria (presented in Box-1) was developed considering very
similar contextual elements such as socio-economic status, climate vulnerability, presence
of selected project intervention and demographics so that linkages between the selected
project interventions can be ascertained between and within selected VDCs.
Box-1
VDC Selection Criteria:
1. Presence of at least one intervention out of three selected interventions;
2. Ranking of VDCs either very high or high vulnerability to landslide in Rukum and flood
in Nawalparasi.
3. Similar Socio-economic and demographic context.

TAMD PROJECT NEPAL-Q3 REPORT, DEC 2013
District level interaction workshop was organised in Rukum to share TAMD study
objectives and to discuss on VDCs selection and generate ideas for finalising research
tools and methods which will be used at different scale/levels. The list of district interaction
workshop participants at Rukum is presented in Annex 2. Moreover, key informant's
interviews (KII) were also conducted with concerned district based organisations and
stakeholders identified for the district workshop.
Having considered above mentioned elements/factors of VDC/Community matching and
District stakeholders' recommendations, TAMD team have accessed three VDCs viz. 1)
Shyalapakha VDC (with LGCDP and LFP project interventions), 2) Arma VDC (with
LGCDP and NCCSP LAPA project interventions) and 3) Nuwakot VDC (with only LGCDP
project intervention) in Rukum district. After conducting field observation, Focus Group
Discussions (FGDs) and DDC/VDC score-cards testing at the visited DDC/VDCs, TAMD
team finally decided to select only two VDCs 1) Shyalapakha (with LGCDP and LFP
interventions) and 2) Nuwakot (with only LGCDP intervention) for overall study but Arma
VDC has been accessed for T1 indicators only. Further testing and data/information
collection were also conducted at these two selected VDCs. Therefore, the selection of
VDCs in Rukum in Quarter-3 had differed from the proposed VDCs in the Quarter-2 (see
Boxes 2 & 3).
At the VDC level, the study has used LGCDP intervention as the control among three
selected interventions that needs to be matched for climate vulnerability and development
level in three accessed VDCs in Rukum. The LGCDP is an example of the development
intervention that focuses purely on institutional strengthening and community participation
without specific focus on climate change. It therefore gives us the opportunity to try to
understand what implications are there for the other two interventions that seek to address
climate change and how effective it is to focus purely on development or to include climate
change explicitly in the development interventions.
Box-3
VDCs selected in Rukum in Q-3:
1. Shyalapakha VDC:
Very high landslide vulnerability
Presence of LGCDP & LFP interventions
2. Nuwakot VDC:
High landslide vulnerability
Presence of LGCDP intervention only
Box-2
VDCs proposed in Rukum in Q-2:
1. Shyalapakha VDC:
Very high landslide vulnerability
Presence of LGCDP & LFP interventions
2. Arma VDC:
High landslide vulnerability
Presence of LGCDP & NCCSP Start-up
Phase interventions
3. Banfikot VDC:
Very high landslide vulnerability
Presence of LGCDP & LFP interventions

TAMD PROJECT NEPAL-Q3 REPORT, DEC 2013
Focus group discussions with community groups represented by selected interventions'
beneficiaries viz. LGCDP/WCF group, LFP/CFUG group, NCCSP/VEECCCC community
and representatives of disaster (Landslide) affected and most vulnerable people were
carried out at respective VDCs in Rukum for further validating VDC selection, identification
of most affected/vulnerable ward/community and to collect relevant data and information.
The semi-structured questions specifically devised for FGD is presented in Annex 4.
Similar approach will be adopted in Nawalparasi district as well.
After these exercises at Shyalapakha, Arma and Nuwakot VDC, the decision for not
conducting further testing and data/information collection at Arma VDC has been justified
by the current state of NCCSP implementation. NCCSP Start-up Phase has just started
the formation of local bodies at Village level (VEECCCC) and District level (DEECCCC)
after the accomplishment of planning phase for further implementation of its planned
activities. Therefore, it has been realised that in order to monitor and evaluate in line with
TAMD feasibility study; no sufficient activities, outputs, outcomes and impact level
indicators could be found from further study at Community/HH level in Arma.
Sampling Method:
The VDCs were stratified considering vulnerability as well as by intervention. All VDCs in
Rukum were stratified in three groups (LGCDP only, LGCDP plus LFP, LGCDP plus
NCCSP Start-up Phase), and further each strata was divided into four categories viz. 1)
Very High, 2) High, 3) Medium and 4) Low according to vulnerability Level. One VDC in
each stratum from either very high or high vulnerability level were selected. The VDCs
thus selected were verified in district consultative workshop.
The VDC Focus group discussion further selected three wards in each VDC as most
vulnerable wards (three topmost wards were taken in each VDC) where purposively 30
HHs were selected. Half of the selected sample HHs comprised highly impacted by the
intervention where as half were HHs highly impacted by the hazard. In Rukum, the
selected wards were:
1. Shyalapakha VDC (LFP and LGCDP): Ward no- 3, 6 and 8 & 9 (combined) (Total=90
HHs)
2. Nuwakot VDC (LGCDP only): Ward no- 2, 4 and 7 (Total=90 HHs)
3. Arma VDC (NCCSP & LGCDP): HHs survey was not conducted in this VDC as the
study found that the intervention was planned and budget has been received but actual
implementation has not started yet, therefore only the institutional analysis was conducted
for this VDC.
Therefore in Rukum, altogether 180 HHs were interviewed (surveyed) for HHs information.
In each selected VDCs; three FGDs Shyalapakha, two FGDs in Arma and one FGD in
Nuwakot at VDC level and eight KIIs with eight relevant stakeholders were conducted to
verify and articulate the collected information.
TAMD PROJECT NEPAL-Q3 REPORT, DEC 2013
EMPIRICAL DATA COLLECTION (a) TRACK 1 (b) TRACK 2
As a continuation to the efforts made in previous quarters, empirical data and information
collection have also been done in quarter-3. Status of development, selected interventions
and hazard/vulnerability specific indicators, government gateway systems, climatic data
from closest meteorological station, socio-economic and food/crop production situation in
the pilot districts/VDC etc. are taken into specific account while collecting data. In order to
empirically validate the TAMD feasibility study, data and information from various
secondary as well as primary sources at different scales from local to national level are
being collected as available with concerned stakeholders. For primary data/information
collection in Rukum, various standard research tools were used such as interaction
workshop/KII (Annex 3) at district level; FGDs at community/VDC level (Annex 4) and
Household Survey (HHS-Annex 5) at Household level. Household level data collection in
selected VDCs of Rukum has been accomplished during recent field exercises. Similarly,
these exercises will be conducted in Nawalparasi during next field visit.
Establishing baselines
For the TAMD feasibility study in Nepal, reduced vulnerability and increased
resilience/adaptive capacity at different scales from community to national level due to
climate change adaptations (related) interventions and development interventions and
correlation between them has to be established. Unfortunately, community level data sets
are not available. Therefore, secondary as well as primary data related to the development
and intervention specific indicators, gateway systems, climatic data from closest
meteorological station, socio-economic and food/crop production situation, vulnerability
and associated loss and damage have been explored and are being collected as available
for TAMD purpose to establish baseline from different sources as mentioned below:

22
www.iied.org www.idsnepal.org
TAMD PROJECT NEPAL-Q3 REPORT, DEC 2013
Climatic Data
Department of Hydrology and Meteorology (DHM) of Ministry of Science, Technology and Environment (MoSTE) in Nepal keeps the
weather record climatologically at national level through its numerous weather stations across Nepal throughout the year. The raw datasets
on monthly rainfall (precipitation) over the past 20 years (from 1992-2011) and monthly minimum and maximum temperature recorded over
the last 20 years (from 1993-2012) have been collected from the DHM. Those records of raw data sets contained many missing or data not
available (DNA) fields in the district records including selected districts of TAMD study. However, climatic data of Rukum and Nawalparasi
districts have been compiled, worked out and presented in the respective tables of Annex 6.
Disaster and its associated Loss and Damage data
The main disasters/hazards in the Rukum and Nawalparasi districts are landslide, flood, fire, storm, earthquake etc but lack the detailed and
reliable information on loss and damage due to these disasters/hazards. However, following data and information on losses and damages
in both the study districts during the last 10 years are extracted from the database (record) provided by the Disaster Management
Section/National Emergency Operation Centre of the Ministry of Home Affairs (MoHA). The disaster related records are kept for each
district according to the type of disaster by the Ministry, where flood and landslide are considered and recorded as one single disaster not
as a separate disaster.
Loss and Damage (Lives and Properties) in Rukum District: by Flood and Landslides over the past 10 years
Year 2060 BS. 2003/04 AD
2061 BS. 2004/05 AD
2062 BS. 2005/06 AD
2063 BS. 2006/07 AD
2064 BS. 2007/08 AD
2065 BS. 2008/09 AD
2066 BS. 2009/10 AD
2067 BS. 2010/11 AD
2068 BS. 2011/12 AD
2069 BS. 2012/13 AD
People
Death 1 - - - 3 5 - 2 15 -
Missing - - - - - - - - 3 -
Injured - - - - 2 - - 2 4 -
Affected Family 1 - - - 6 - - 235 - -
Animal Loss
- - - - 25 - - - - -

TAMD PROJECT NEPAL-Q3 REPORT, DEC 2013
House Destroyed
Completely - - - - 6 - - 9 32 -
Partly - - - - - - - - - -
Shed Destroyed
- - - - - - - - - -
Land Loss No. - - - - - - - - - -
Unit - - - - - - - - - -
Public Property Losses
- - - - - - - Rs.1400000 - -
Estimated Losses (in Rs.)
- - - - Rs.3539000 - - Rs.16494650 - -
Remarks
Source: Disaster Management Section, Ministry of Home Affairs, 2013
Loss and Damage (Lives and Properties) in Nawalparasi District: by Flood and Landslides over the past 10 years
Year 2060 BS.
2003/04 AD
2061 BS. 2004/05
AD
2062 BS.
2005/06 AD
2063 BS. 2006/07 AD
2064 BS. 2007/08 AD
2065 BS. 2008/09 AD
2066 BS. 2009/10
AD
2067 BS. 2010/11
AD
2068 BS. 2011/12
AD
2069 BS. 2012/13
AD
People
Death 5 - - 3 1 - 1 1 4 -
Missing 5 - - - 3 - - - 6 -
Injured 7 - - - - - - - - -
Affected Family
43 - - 2105 3319 - - 875 1 9
Animal Loss
6 - - 1 - - - - - -
House Destroyed
Completely
41 - - 223 827 - - 20 - 9

TAMD PROJECT NEPAL-Q3 REPORT, DEC 2013
Partly - - - 74 2692 - - - - -
Shed Destroyed
- - - - - - - - - -
Land Loss No. - - - 2144 - - - 50 - -
Unit - - - Bigha - - - Bigha - -
Public Property Losses
Khajura Dam 35M. Dhanewa Dam 125M.
Sugarcane farm
- - -
Flood on Dhanewa & Jharahi khola, 7, 8 & 9 ward affected
- - - -
Estimated Losses (in Rs.)
Rs.2000000 - - Rs.562900 Rs.28280310 - - - - -
Remarks
Source: Disaster Management Section, Ministry of Home Affairs, 2013
Crop/Food Situation:
The Crop Situation Update is issued by the Ministry of Agricultural Development (MoAD), World Food Programme (WFP), and Food and
Agriculture Organisation (FAO), which is published twice a year. While periodic updates on the crop performance and food security situation
are provided through Food Security Bulletins issued by MoAD and WFP on a quarterly basis. The Crop Situation Updates provide a
comprehensive overview on the crop production situation while Food Security Bulletins provide an overview of the Food Balance.
The Crop production situation over the last 10 years and the Food security situation over the last 5 years of the Rukum and Nawalparasi
districts for five major cereal crops have been compiled and presented in the tables below.

TAMD PROJECT NEPAL-Q3 REPORT, DEC 2013
Area, Production and Yield of Five Major Cereal Crops in Rukum: Area in Hectare (Ha.), Production in Metric Ton (MT.) and Yield in
Kilogram (Kg) per Hectare
PADDY MAIZE MILLET WHEAT BARLEY
YEAR AREA PROD. YIELD AREA PROD. YIELD AREA PROD. YIELD AREA PROD. YIELD AREA PROD. YIELD
2002/03 3570.00 8600.00 2409.00 18650.00 31520.00 1690.00 1140.00 1500.00 1316.00 11875.00 17100.00 1440.00 960.00 1238.00 1290.00
2003/04 3570.00 8600.00 2409.00 18650.00 31520.00 1690.00 1140.00 1500.00 1316.00 11800.00 18215.00 1544.00 925.00 1093.00 1182.00
2004/05 3570.00 8600.00 2409.00 18650.00 31520.00 1690.00 1140.00 1500.00 1316.00 11000.00 18000.00 1636.00 435.00 593.00 1363.00
2005/06 3570.00 8600.00 2409.00 18650.00 31520.00 1690.00 1140.00 1500.00 1316.00 9850.00 16050.00 1629.00 435.00 560.00 1287.00
2006/07 3544.00 8084.00 2281.00 18650.00 31520.00 1690.00 1140.00 1500.00 1316.00 11800.00 14050.00 1191.00 925.00 975.00 1054.00
2007/08 3544.00 8084.00 2281.00 18650.00 31520.00 1690.00 1140.00 1500.00 1316.00 11800.00 16520.00 1400.00 925.00 821.00 888.00
2008/09 3750.00 10100.00 2693.00 18650.00 31705.00 1700.00 925.00 860.00 929.00 11800.00 10894.00 923.00 900.00 950.00 1055.00
2009/10 3750.00 11175.00 2980.00 18650.00 35435.00 1900.00 960.00 861.00 1104.00 11800.00 10511.00 1152.00 960.00 1050.00 1093.00
2010/11 3750.00 11288.00 3010.13 18650.00 41030.00 2200.00 960.00 979.20 1020.00 11800.00 27140.00 2300.00 925.00 1203.00 1300.54
2011/12 3562.00 9617.00 2699.89 16785.00 30213.00 1800.00 960.00 912.00 1000.00 11800.00 26190.00 2219.49 925.00 1480.00 1600.00
Source: Ministry of Agricultural Development (MoAD) and World Food Programme (WFP)
Crop/Food Requirements and Balance for Five major Crops in Rukum District:
YEAR PADDY MAIZE MILLET WHEAT BARLEY TOTAL CEREAL NET-EDIBLE REQUIREMENT BALANCE*
2008/09 10,100.00 31,705.00 860.00 10,894.00 950.00 54,509.00 38,919.00 43,556.00 -4,637.00
2009/10 11,175.00 35,435.00 861.00 10,511.00 1,050.00 59,032.00 45,649.00 44,762.00 887.00
2010/11 11,288.00 41,030.00 979.00 27,140.00 1,203.00 81,640.00 62,135.00 42,386.00 19,749.00
2011/12 9,617.40 30,213.00 912.00 26,190.00 1,480.00 68,412.40 51,010.00 42,891.00 8,119.00
2012/13 10,330.00 16,013.00 922.00 26,550.00 1,156.00 54,971.00 39,673.19 43,402.00 -3,729.00
Source: Ministry of Agricultural Development (MoAD) and World Food Programme (WFP)
* This food balance is calculated with the preliminary population census data of the year 2010/11.

TAMD PROJECT NEPAL-Q3 REPORT, DEC 2013
Area, Production and Yield of Five Major Cereal Crops in Nawalparasi: Area in Hectare (Ha.), Production in Metric Ton (MT.) and Yield in
Kilogram (Kg) per Hectare
PADDY MAIZE MILLET WHEAT BARLEY
YEAR AREA PROD. YIELD AREA PROD. YIELD AREA PROD. YIELD AREA PROD. YIELD AREA PROD. YIELD
2002/03 46977.00 141505.00 3012.00 8080.00 16968.00 2100.00 500.00 500.00 1000.00 18745.00 39364.00 2100.00 105.00 120.00 1143.00
2003/04 46507.00 14505.00 3043.00 9245.00 19610.00 2121.00 500.00 550.00 1100.00 18735.00 43113.00 2300.00 105.00 120.00 1143.00
2004/05 46507.00 137260.00 3016.00 9500.00 21014.00 2212.00 550.00 550.00 1000.00 18745.00 43113.00 2300.00 105.00 120.00 1143.00
2005/06 45500.00 131574.00 2892.00 9345.00 23154.00 2478.00 500.00 550.00 1100.00 18745.00 40100.00 2139.00 105.00 120.00 1143.00
2006/07 45490.00 116383.00 2558.00 9695.00 24250.00 2501.00 500.00 500.00 1000.00 18830.00 45600.00 2422.00 120.00 132.00 1100.00
2007/08 46490.00 149233.00 3210.00 9695.00 24900.00 2568.00 500.00 500.00 1000.00 18850.00 46500.00 2467.00 120.00 130.00 1083.00
2008/09 46490.00 165425.00 3558.00 9700.00 24950.00 2572.00 500.00 500.00 1000.00 18850.00 44200.00 2344.00 90.00 75.00 833.00
2009/10 44590.00 138749.00 3111.00 9400.00 23520.00 2502.00 500.00 550.00 1100.00 18800.00 46360.00 2465.00 88.00 88.00 1000.00
2010/11 46690.00 180373.00 3863.20 10750.00 33680.00 3133.02 500.00 500.00 1000.00 18830.00 46140.00 2450.35 88.00 88.00 1000.00
2011/12 44890.00 191337.00 4262.35 8400.00 26000.00 3095.24 450.00 495.00 1100.00 18830.00 54140.00 2875.20 90.00 180.00 2000.00
Source: Ministry of Agricultural Development (MoAD) and World Food Programme (WFP)
Crop/Food Requirements and Balance for Five major Crops in Nawalparasi District:
YEAR PADDY MAIZE MILLET WHEAT BARLEY TOTAL CEREAL NET-EDIBLE REQUIREMENT BALANCE*
2008/09 165,425.00 24,950.00 500.00 44,200.00 75.00 235,150.00 162,660.00 122,976.00 19,684.00
2009/10 138,749.00 23,520.00 550.00 46,360.00 88.00 209,267.00 127,282.00 123,477.00 3,804.00
2010/11 180,373.00 33,680.00 500.00 46,140.00 88.00 260,781.00 157,512.00 115,079.00 42,433.00
2011/12 191,337.00 26,000.00 495.00 54,140.00 180.00 272,152.00 163,378.40 116,570.00 46,808.40
2012/13 179,110.00 16,013.00 495.00 50,269.00 100.00 245,987.00 160,753.00 118,081.00 42,672.00
Source: Ministry of Agricultural Development (MoAD) and World Food Programme (WFP)
* This food balance is calculated with the preliminary population census data of the year 2010/11.

TAMD PROJECT NEPAL-Q3 REPORT, DEC 2013
CHALLENGES Establishing ToC:
NCCSP Start-up Phase has just started the formation of local bodies at Village level (VEECCCC) and District level (DEECCCC) after the
accomplishment of its planning phase for further implementation of planned activities. No sufficient activities, outputs, outcomes and impact
level indicators could be found from further study at Community/HH level for NCCSP Community. Therefore, it has been realised that local
theory of change for NCCSP cannot be established at this stage.
Empirical data collection:
The TAMD feasibility study team in Nepal is facing many difficulties in getting data sets of the selected interventions and government
database systems. There is a big challenge to access the data-set of the selected interventions. However, baseline reports, monitoring
reports and final reports covering overall baseline and targets achieved at national or programmatic level of LFP, LGCDP and NCCSP
interventions are available but data as such with the baseline and targets achieved by these interventions relevant to TAMD study at
VDC/DDC level are not available from the concerned stakeholder. Consequently, making it further challenging to break down and establish
relevancy and reliability through such data and information extracted from the reports of respective programmes at the ground level. Some
of the crucial challenges and potential limitations of the TAMD feasibility study in Nepal are:
Unavailability of local level data-sets of LFP, CADP-N/LAPA pilot and LGCDP programme;
Reports with data compiled at DDC/VDC level are unavailable and seems unreliable to break down at VDC and community level;
Identification of particular adaptation practices at community level is difficult for tracking in absence of data set or community level
information;
Lack of robust and up-to-date spatial as well as temporal data with concerned government line ministries and departments such as
MoHA, MoSTE, MoFSC, MoAD, MoFALD, DHM, CBS/NLSS, concerned DDCs and VDCs.

TAMD PROJECT NEPAL-Q3 REPORT, DEC 2013
CONCLUSIONS AND EMERGING LESSONS As per the TAMD Coordination Committee (TCC) decision on the selection of three project interventions namely LFP, CADP-N/LAPA Pilot
or NCCSP start-up-phase and LGCDP and two pilot districts Nawalparasi for flood vulnerability and Rukum for landslide and drought
vulnerability for TAMD feasibility study. In Quarter-2, the TAMD team had an exploratory field visit in Nawalparasi district and had
preliminary meetings with various district officials including DDC and District Disaster Management Unit of the District Administration
Office/CDO. Organized a stakeholder meeting in the Sukrauli VDC and organized Focus Group Discussion on flood vulnerability and
adaptation measure adopted in Ghinaha and Nadiya tole community in Nawalparasi. In addition, the team visited the river training site and
observed real situation of the field and collected information. The available information, preliminary interaction with DDC, VDC and
community at that stage have helped the study to conceptualise T1 and T2 indicators framework.
In Quarter-3, TAMD team has further expedited the work by gathering additional information related with the selected interventions and
districts to identify potential VDCs within the selected district to conduct further study and real field testing of TAMD tools and methodology
at local level. TAMD study in Nepal has undergone further stage of development and improvement with data and information collected from
various secondary and primary sources. At the end of this quarter, field testing and data collection work in Rukum district (out of 2 selected
districts) has been completed. After wider consultations and interaction with district level stakeholders and relevant VDC representatives
during the field visit, TAMD team have selected three high vulnerable to landslide VDCs i.e. 1) Shyalapakha VDC with LGCDP and LFP
interventions and 2) Nuwakot VDC with only LGCDP interventions for VDC matching and further research at VDC/community/HH level but
3) Arma VDC has been accessed for T1 indicators only in line with the TAMD feasibility study purpose. The data and information were
collected at District/VDC/Community/HHs level, using various research tools and methods such as Field observations, District level
stakeholders interaction workshops, DDC/VDC Scorecards, Key Informants Survey (KIS), Focus Group Discussions (FGDs), Households
Survey Questionnaire (HHS) etc. The collected data and information are currently under the process/stage of being fed in. Analysis of all
the collected data and information will be done after accomplishment of the similar exercises in Nawalparasi district for Flood vulnerability.

TAMD PROJECT NEPAL-Q3 REPORT, DEC 2013
ANNEXURES
Annex 1: DDC and VDC Score Card Templates used in Rukum District
DDC Score Card: Planning Officer, Funding Officer, 0
N
1
25%
2
50%
3
75%
4
Y
Supporting evidence/narrative
I. Climate Change mainstreaming/
Integration into DDC Planning
1. Have specific measures to address climate change
(adaptation/mitigation) been identified and funded?
2. Is there a DDC Climate change plan?
3. Are climate-relevant initiatives in the district screened for
climate risks?
II. Institutional co-ordination 1. Is there a body for co-ordinating climate change actions at
the district level (unit etc)
2. Does the co-ordinating unit have authoritative persons
representation the sectoral offices?
3. Is there long term funding for this unit and co-ordination?
III. Budgeting and finance 1. Provision of specific budget allocation for CC
2. Mechanism of climate risk assessment and costing
3. Availability of fund for additional climate risk identified
IV. Institutional knowledge/capacity
(District staff and Ilaka representatives)
1. More than 25% of people involved in planning with climate
change awareness
2. Some people with formal climate change training involved in
planning
3. Capacity building plan on climate change for people
involved in planning process
V. Use of climate information 1. Annual planning affected by historical trends of climate
variability from informal observation/experience

TAMD PROJECT NEPAL-Q3 REPORT, DEC 2013
2. Availability and use of relevant climate information from
DHM station or other reliable sources
3. Consideration of future climate projections for the next
district plan
VI. Participation 1. Are those living in landslide, flood or drought affected areas
represented proportionately in DDC planning processes
around climate change measures
2. Are the poorest and most marginalised represented
proportionately in DDC planning processes around climate
change measures
3. Is the participation of these groups sustained throughout the
lifecycle of the climate change measures
VII. Awareness among Stakeholders
(District Council)
1. At least 50% of DDC Council members aware of potential or
available responses to climate change
2. DDC Council members have information on climate
sensitive sectors and district climate issues (Ag, Forest,
drought, landslide)
3. DDC has institutional mandate for awareness raising and
supporting access to CC info
VIII. Learning and flexibility 1.The DDC has incorporated information on past disasters into
future planning
2. The DDC has incorporated information on slow changes to
the climate into future planning
3. The DDC has mechanisms in place to monitor responses
and update plans after an unexpected change to the climate
IX. Business as usual (BAU) Functions:
Functioning of local systems
A selection of 3 of the MCPM indicators from the LGCDP on
DDC functions

TAMD PROJECT NEPAL-Q3 REPORT, DEC 2013
VDC Score Card: VDC Secretary, Technical Officer 0
N
1
25%
2
50%
3
75%
4
Y
Supporting evidence/narrative
I. Climate Change mainstreaming/
Integration into VDC Planning
1. Have specific measures to address climate change
(adaptation/mitigation) been identified and funded?
2. Is there a VDC climate change plan? (DRR = 50%)
II. Institutional co-ordination 1. Is there a body for co-ordinating climate change actions at
the village level (unit etc)
2. Is there long term funding for this unit and co-ordination?
III. Budgeting and finance 1. Provision of specific budget allocation for CC
2. Availability of fund for additional climate risk identified
(disaster fund – 50%)
IV. Institutional knowledge/capacity
(VDC)
1. Some people involved in planning with climate change
awareness
2. Some people with formal climate change training involved in
planning
V. Use of climate information 1. Annual planning affected by historical trends of climate
variability from informal observation/experience
2. Availability and use of relevant climate information from
DHM station or other reliable sources
VI. Participation 1. Are those living in landslide, flood or drought affected areas
represented proportionately in VDC planning processes
around climate change measures
2. Is the participation of these groups sustained throughout the
lifecycle of the climate change measures
VII. Awareness among Stakeholders
(Reps of WCF and other civil society)
1. At least 25% of stakeholders members aware of potential or
available responses to climate change
2. Stakeholders have specific information on village climate
issues (drought, landslide etc)

TAMD PROJECT NEPAL-Q3 REPORT, DEC 2013
VIII: Learning and flexibility 1. The VDC has incorporated information on past disasters
into future plans
2. The VDC has incorporated information on slow changes to
the climate into future planning
IX. Business as usual (BAU) Functions:
Functioning of local systems
A selection of 3 of the MCPM indicators from the LGCDP on
VDC functions
Annex 2: List of District Interaction Workshop Participants in Rukum
S.N. Name of the Participants Designation Organisation
1. Mr. Ram Bdr. Shahi Planning Officer DDC
2. Mr. Kul Prashad Adhikari Senior ADO DADO
3. Mr. Bhupendra Pandey Program Officer DDMU/DAO
4. Mr. Binod Pd. Kanu Acting DFO DFO
5. Mr. Sudhir Shrestha Chief of the office Sub-Tropical Vegetables & Seed Production Centre
6. Mr. Ram Govinda Maharjan District Coordinator MSFP/Rupantaran
7. Mr. Bam Bdr. Khadka District Coordinator Care /CSP
8. Mr. Dandi Karki Chairperson FECOFUN
9. Mr. Narendra Bista Accountant DSCO
10. Mr. Keshan Kr. Kshetreeyal Secretary RSDC
11. Mr. Niraj Kr. Shrestha Program Officer RSDC
12. Ms. Jun Tara Budha Program Officer UMN
13. Mr. Ram Babu Shah Organisational Development Officer UMN
14. Mr. Durga Pd. Upadhyaya Team Leader UMN
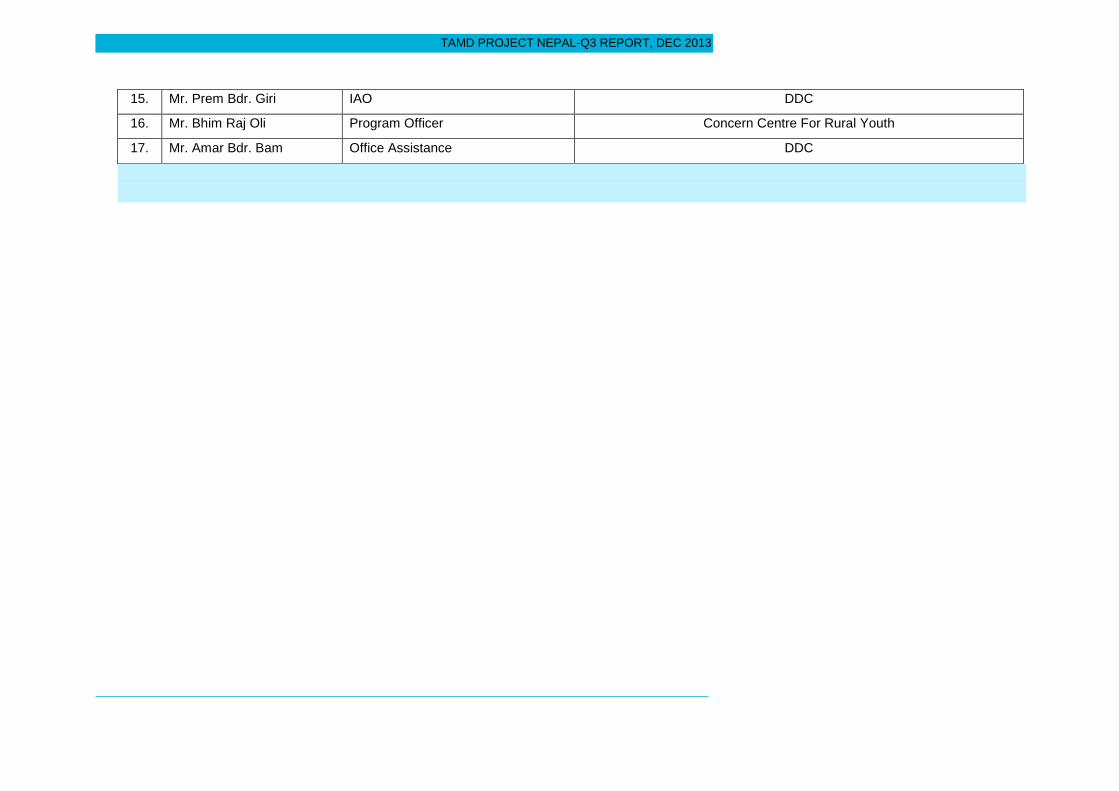
TAMD PROJECT NEPAL-Q3 REPORT, DEC 2013
15. Mr. Prem Bdr. Giri IAO DDC
16. Mr. Bhim Raj Oli Program Officer Concern Centre For Rural Youth
17. Mr. Amar Bdr. Bam Office Assistance DDC

TAMD PROJECT NEPAL-Q3 REPORT, DEC 2013
Annex 3: Key Informants Interview (KII) Template used in Rukum
Final Key Informants Interview (KII) Template for TAMD Nepal
(District Development Committee (DDC)/ District Offices)
Flood/Landslide √ /Drought
SN GUIDELINES/ QUESTIONS Responses
PART 1: CLIMATE INTERVENTIONS
1. Greetings and explain the purpose
of the visit
District:
VDC/Ward:
Respondent's Name:
Position:
Organisation:
Contact/Phone:
2. How long have you been in this
office?
3. What are the major climate related
interventions (LAPA/LFP/MSFP/
PPCR/Hariyo Ban etc) operating in
this district/VDC?
Name of Interventions/Projects
1
2
3
4
5
Duration:

TAMD PROJECT NEPAL-Q3 REPORT, DEC 2013
4. Where are they operating? Name of project
1
2
3
4
Sector
Name of VDCs
PART 2: EXTREME EVENTS
5. What is the impact of the
flood/landslide/drought over last 2
years?
Number of events
occurred
Casualties (human) Loss & Damage (Estimate of N Rupees and which
VDCs)
Landslide
Flood
Drought
6. Do you have any data regarding
losses/damage by
Flood/Landslide/Drought climate
related hazards?
If yes, in which sector/type/number
Source
7. Which wards/settlements of these
VDCs are particularly vulnerable to
landslides?
TAMD PROJECT NEPAL-Q3 REPORT, DEC 2013
Arma
Shyalpakha
Nuwakot
8. What parts of the District are at
risk of landslides in the future?
Why?
9. What makes people in these
communities particularly
vulnerable to landslide?
10. Can you tell us how people and
communities suffer from
landslides? What changes in their
livelihood?
11. What signs show when
communities/households have
recovered from landslides? (e.g.
income increases, food sufficiency,
crop yields, education, loss and
damage decreased, type of
housing construction, consumption
of goods)
PART 3: SLOW CHANGES TO THE CLIMATE
12. What are the major environmental
changes experienced/observed in
recent years in this DISTRICT?
Please explain the major types.
(prompts: changes in rainfall,
What changes? Effects Extent of the
change?
(rank 1-5)

TAMD PROJECT NEPAL-Q3 REPORT, DEC 2013
changing temperatures, changes
in growing seasons, changing crop
growth, changing number of dry
days)
13. From each change, can you tell us what evidence might show how people/communities have suffered? (e.g. income, food sufficiency, crop
yields, education, loss and damage decreased, type of housing construction, consumption of goods)
Change: Cause Who particularly affected? Why? (Prompts:
location of house/land? irrigation? income poverty,
types of crops? land ownership, etc)

TAMD PROJECT NEPAL-Q3 REPORT, DEC 2013
-----------------------------------------------------------------------------------------------Thank You----------------------------------------------------------------------------------------------------

TAMD PROJECT NEPAL-Q3 REPORT, DEC 2013
Annex 4: FGD Template used in Rukum
Focus Group Discussions (FGD) in Rukum
Landslide/slow changes
1) [For climate vulnerable group: are you involved in a ward citizen forum or the community forest users group? If no, do you know about
it?]
2) What has the [LGCDP/LFP/NCCSP] done in this VDC in the last 5 years? Who was involved?
3) How have people benefitted from it? (specific, this then x, then x) What benefits do you feel have been brought in? (KEY QUESTION)
Landslides
4) When there are landslides who is most vulnerable in the community? (Suggestions: Location of land (steep slope), location of housing?)
5) Who takes longer to recover after a landslide? Why?
(Suggestions: lack of diverse income sources, repeated exposure, lack of awareness, lack of money to replace losses, no access to services – water, electricity, communication)
6) How can you tell when those people/households have recovered after the landslide? What signs are there?
(New houses constructed? agricultural production resumed? replaced livestock? renewed access to electricity, water, education etc, income resumed)
7) What type of weather causes landslides?

TAMD PROJECT NEPAL-Q3 REPORT, DEC 2013
(specific – if rain, is it timing of rain, intensity, number of days, rain after a dry period?)
8) What wards are most vulnerable?
Changes in rainfall / dry periods
9) Has there been a change in the growing seasons for maize in the last five years? What? [seasonal calendar – maize/paddy]
10) What has been the cause?
11) Who is most affected by those changes? Why?
-Need to go beyond immediate causes to the things behind them. If poor people, why? What about their livelihoods makes them most affected?
(Suggestions: location/type of land, housing type, location/type of housing, no land ownership, use of livestock, types of crops (which?), no irrigation, income sources, just one source of
income, repeated exposure? livestock type, services – water, food sufficiency, education, health, sanitation, migration)
12) How can you tell when those people/households have recovered after the poor season? What signs are there?
-Agricultural production? crop yields? increases in income? new houses? livestock? access to education, health, sanitation, electricity, migration…)
13) Are there any interventions in the area that have helped people cope with landslides and changes in the seasonal calendar?
14) What would help people cope with:
- landslides
- changes in the seasonal calendar
15) Which wards are most vulnerable:

TAMD PROJECT NEPAL-Q3 REPORT, DEC 2013
- to landslide
- to changes in the seasonal calendar
---------------------------------------------------------------------------------------------The End---------------------------------------------------------------------------------------------------------

TAMD PROJECT NEPAL-Q3 REPORT, DEC 2013
Annex 5: Household Survey (HHS) Template used in Rukum
TAMD HH SURVEY QUESTIONNAIRE
I. Household Information
A. General Information
S.N. Question Answer SKIP
A1 Questionnaire Number
A2 Name of VDC/Municipality
A3 Ward Number
A4 Name of Village/Community
A5 Name of Household Head
A6 Caste/ Ethnicity
BCTS ........................................................... 1
Adibasi/Janajati ............................................. 2
Dalit ............................................................. 3
Religious Minority (Muslim etc) ................... 4
Others (_____________) ............................ 5
A7 Gender of Household Head
Male ............................................................. 1
Female ......................................................... 2

TAMD PROJECT NEPAL-Q3 REPORT, DEC 2013
S.N. Question Answer SKIP
A8 If the household is headed by female, give reason for being
household head
Husband is out of home ............................... 1
Widow .......................................................... 2
Separated ..................................................... 3
Male gave the role ....................................... 4
Social factor ................................................. 5
Other (_____________) ................................ 6
A9 Type of family Nuclear ......................................................... 1
Joint .............................................................. 2
A10 Type of house
Thatched roof/mudwall ......................……….1
Stonewall and corrugated iron roof/stone roof…...2
Cement building, RCC roof 1 floor………………3
Pillared house more than 2 floors………………...4
A11 Type of house 5 years ago
Thatched roof/mudwall ......................... …….1
Stonewall and corrugated iron roof/stone roof…...2
Cement building, RCC roof 1 floor……………….3
Pillared house more than 2 floors…………………4
A12 Is your house on a steep slope?
Yes / No
B. Family Description: Please specify, who are your family members?
B1. Education Status
Descriptions Male Female Total
Illiterate

TAMD PROJECT NEPAL-Q3 REPORT, DEC 2013
Literate only
0 - 5 (Primary)
6 - SLC (Secondary)
IA/+2 (Higher Secondary)
BA (Bachelor)
MA (Master)
PhD (Doctor)
B2. Age Group of Household Members
Descriptions Male Female Total
0-5 Years
6-15 Years
16-35 Years
36-59 Years
60 and above Years
B3. Occupation Status
Types Description *(Code) Remarks
Primary (Main) Write only one code
Secondary
Note: 1. Agriculture/ Livestock 2.Service 3.Business/ Trade 4. Wage Earning 5. Household Chores 6. Politics/ Social Service 7. Job
Hunting/Unemployed
8.Disabled 9. Old/ Ill Health 10. Others

TAMD PROJECT NEPAL-Q3 REPORT, DEC 2013
C. Agriculture and Livestock
C1. Do you have cultivated land? Yes No
C2. If Yes, please give following information.
C3. What are the cropping pattern /trend/types?
Fallow-rice ................ 1
Fallow-maize-rice .... 2
Wheat-rice-rice ........ 3
S.N Land Type Owned land, self cultivated Owned land, Rented-out Rented-in
Ropany/Bigh
a
Ana/
Kattha
Paisa /
Dhur
Ropany /
Bigha
Ana /
Kattha
Paisa/Dhu
r
Ropany/Bigh
a
Ana /
Kattha
Paisa/Dh
ur
1 Irrigated
2 Un-irrigated
3 Homestead
4 Fallow/Pastur
e
5 Land in
market centre

TAMD PROJECT NEPAL-Q3 REPORT, DEC 2013
Potato-maize ........... 4
Maize-finger millet .... 5
Maize-wheat ............. 6
Maize- vegetable ..... 7
Vegetable only ........ 8
Fruits ........................ 9
Others (specify) ……....10
C4. Crop Production:
Name of Crops Total Production (Now)
Total production (5 years ago) Reason for
changes
(insert code)
1. Rice 2. Maize 3. Wheat 4. Millet 5. Barley 6. Potato 7. Buck wheat 8. Vegetables 9. Fruit 10. Other cash crops
C5. How vulnerable are you to these changes compared to others in the Ward? (please rank 1- 5, 1 is least, 5 is most able to recover) 1 2 3 4
5
C6. Is the majority of your agricultural land on steep slopes? Yes No

TAMD PROJECT NEPAL-Q3 REPORT, DEC 2013
C7. What is the quality of the soil on the majority of your land? 1 Abbal 2 Doyam 3 Sim 4 Chahar
D. Livestock
S.N. Question Name of cattle Numbers (Now) Numbers (5 years ago)
D1. What livestock do you own?
He Buffalo
She Buffalo
Cow
Ox
Goat
Sheep
Pig
Poultry/Hen
Other
E. Food Sufficiency/Income
S.N. Question At present 5 years ago
E1
How many months your own
food production and regular
income is sufficient for
feeding your family?
0-3 months
4-6 months
7-9 months
10-12 months & above
E2
If not sufficient for whole
year, what are your HHs
coping mechanisms?
1. Seasonal migration 2. Wage labour 3. Sale of land 4. Sale of livestock 5. Loan and pawning 6. Remittances

TAMD PROJECT NEPAL-Q3 REPORT, DEC 2013
S.N. Question At present 5 years ago
7. Other……………………..
F. What was the source and level of your household income in the last 12 months?
List income source Last 12 months (Quantity in Rs.) 5 years ago
1.Major cereal crops
2. Cash crops
3. Fruit/vegetables
4. Livestock sale
5. Livestock products
6. Forest products/NTFP
7. Job/service
8. Remittances
9. Wage labour
10. Pension
11. Rent
12. Enterprise/ small business
13. Other

TAMD PROJECT NEPAL-Q3 REPORT, DEC 2013
G. Access to services
S.N
. Question
Answer Now 5 years ago (In 2065)
G1 Do you have access
to:
Type of services: Walking
Time
(Minutes)
Distance
(Km.)
Walking time
(Minutes)
Distance (Km)
All weather Road ……...1
Fair weather road...............2
Primary/Secondary School.3
Higher
Secondary/College...4
Drinking water………….. 5
Toilet………………………. 6
Communication Services...7
Hospital/health post…......8
Market Centre……….....….9
Agro/Vets..........................10
TAMD PROJECT NEPAL-Q3 REPORT, DEC 2013
Govt. Admin Services......11
Financial
services/Institutions...........12
Others ………......………..13
G2. Loan
Reason Source
Reason Source
G3. Energy
None
Improved cook stove
Biogas
Solar
Micro-hydro
Grid electricity
None
Improved cook stove
Biogas
Solar
Micro-hydro
Grid electricity
Source of Loan (Code): 1. Government banks 2. Public banks 3.Saving & Credit Cooperatives 4. Money lender 5. Friends/Relatives 6.Other
H. Social and climate related shocks
S.N Question Event
H1 Could you recall any socio-economic shocks occurred in last 5 years
affecting your household?
1 None
2 Health problems / Disease/ epidemics
3 Accident

TAMD PROJECT NEPAL-Q3 REPORT, DEC 2013
4 Death of bread earner
5 Uncertainty in market prices
6 Others………………………
H2 Have you had a landslide in the last 12 months?
Loss and damage (Quantity)
1. Quantity of land………….. 2. Crops……………………… 3. Housing…………………… 4. Livestock…………………. 5. Human loss……………….. 6. Others..…………………….
H3
What are the natural disasters occurred in last 5 years affecting your family?
(Landslide / flood / drought)
Type Year Loss and damage
1. Landslide 1. Quantity of land 2. Crops 3. Housing 4. Livestock Human
Loss 5. Others……………
…
2. Flood 1. Quantity of land 2. Crops 3. Housing 4. Livestock Human
Loss 5. Others……………
…
3. Drought
1. Quantity of land 2. Crops 3. Housing 4. Livestock Human
Loss 5. Others……………
…

TAMD PROJECT NEPAL-Q3 REPORT, DEC 2013
Other: Hailstorm / Earthquake / Snow / Windstorm
H4
Within your Ward, how would you rank your vulnerability to landslides
compared to others? (Rank 1 – 5, 1 will recover most slowly, 5 will recover
most quickly)
1 2 3 4 5
I. Participation:
S.N. Question Answer SKIP
I1 What CBOs are you a member of?
None………………………………………………………….. 1
Savings and credit group………………………………………2
Mothers group .................................................................. 3
Community Forestry users group..................................... 4
Agriculture and livestock production group ...................... 5
WCF………………………………………………….……….. 6
NGOs ............................................................................... 7
Other ............................................................................. 8
I2 How has being a member of such group benefited
you or your family members?
Increased access to loan .................................................... 1
Makes saving/deposit easy ............................................... 2
Agricultural inputs received (free of in low cost) ............... 3
Goat/ Piglets received ....................................................... 4
Purchases Agricultural/Livestock Produce ........................ 5
Acquire information ............................................................ 6
Access to fodder/firewood……………………………………..7
Access to NTFP…………………………………………………8

TAMD PROJECT NEPAL-Q3 REPORT, DEC 2013
--------------------------------------------------------------The End------------------------------------------------------------------------------------
Other (specify) …………………….…………………………....9
I3 Have you taken any training or orientation on climate
change?
Yes .................................................. 1
No .................................................. 2
I4 Do you think the services of the VDC are more
accessible than 5 years ago?
Yes……………………………………...1
No……………………………………....2
I5
Do you think the infrastructure offered by the local
government better meets your needs than 5 years
ago?
Yes……………………………………..1
No……………………………………...2
I6 Are you more involved in VDC decision making than
5 years ago?
Yes……………………………………..1
No……………………………………...2
I7
Do you feel you can access more livelihood choices
(such as education, health, credit) than five years
ago?
Yes……………………………………..1
No……………………………………...2
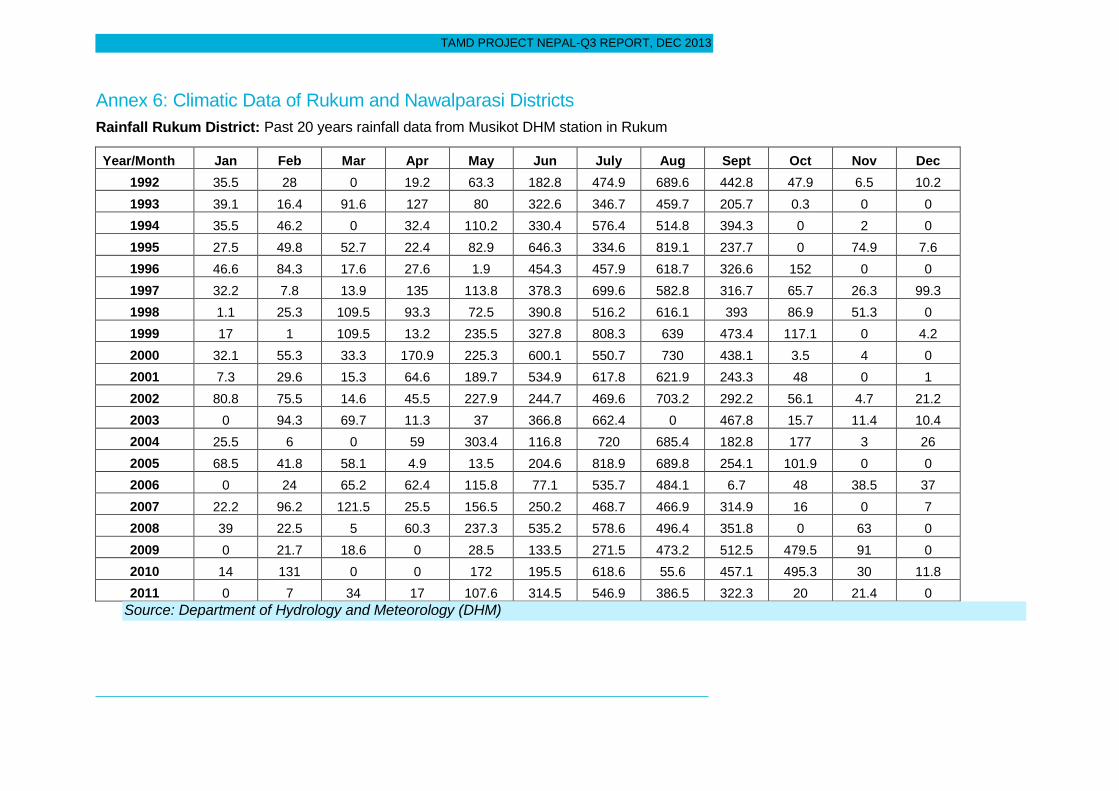
TAMD PROJECT NEPAL-Q3 REPORT, DEC 2013
Annex 6: Climatic Data of Rukum and Nawalparasi Districts
Rainfall Rukum District: Past 20 years rainfall data from Musikot DHM station in Rukum
Year/Month Jan Feb Mar Apr May Jun July Aug Sept Oct Nov Dec
1992 35.5 28 0 19.2 63.3 182.8 474.9 689.6 442.8 47.9 6.5 10.2
1993 39.1 16.4 91.6 127 80 322.6 346.7 459.7 205.7 0.3 0 0
1994 35.5 46.2 0 32.4 110.2 330.4 576.4 514.8 394.3 0 2 0
1995 27.5 49.8 52.7 22.4 82.9 646.3 334.6 819.1 237.7 0 74.9 7.6
1996 46.6 84.3 17.6 27.6 1.9 454.3 457.9 618.7 326.6 152 0 0
1997 32.2 7.8 13.9 135 113.8 378.3 699.6 582.8 316.7 65.7 26.3 99.3
1998 1.1 25.3 109.5 93.3 72.5 390.8 516.2 616.1 393 86.9 51.3 0
1999 17 1 109.5 13.2 235.5 327.8 808.3 639 473.4 117.1 0 4.2
2000 32.1 55.3 33.3 170.9 225.3 600.1 550.7 730 438.1 3.5 4 0
2001 7.3 29.6 15.3 64.6 189.7 534.9 617.8 621.9 243.3 48 0 1
2002 80.8 75.5 14.6 45.5 227.9 244.7 469.6 703.2 292.2 56.1 4.7 21.2
2003 0 94.3 69.7 11.3 37 366.8 662.4 0 467.8 15.7 11.4 10.4
2004 25.5 6 0 59 303.4 116.8 720 685.4 182.8 177 3 26
2005 68.5 41.8 58.1 4.9 13.5 204.6 818.9 689.8 254.1 101.9 0 0
2006 0 24 65.2 62.4 115.8 77.1 535.7 484.1 6.7 48 38.5 37
2007 22.2 96.2 121.5 25.5 156.5 250.2 468.7 466.9 314.9 16 0 7
2008 39 22.5 5 60.3 237.3 535.2 578.6 496.4 351.8 0 63 0
2009 0 21.7 18.6 0 28.5 133.5 271.5 473.2 512.5 479.5 91 0
2010 14 131 0 0 172 195.5 618.6 55.6 457.1 495.3 30 11.8
2011 0 7 34 17 107.6 314.5 546.9 386.5 322.3 20 21.4 0
Source: Department of Hydrology and Meteorology (DHM)

TAMD PROJECT NEPAL-Q3 REPORT, DEC 2013
Rainfall Nawalparasi District: Past 20 years rainfall data from Parasi DHM station in Nawalparasi
Year/Month Jan Feb Mar Apr May Jun Jul Aug Sep Oct Nov Dec
1992 2.1 10.2 0.5 0 142 139.7 405.6 383 150.8 202.3 9 0
1993 2.5 7.3 82 7.3 206.3 278 324.6 676.1 613.6 4.4 2 0
1994 15.2 0 50.8 0 25.3 166.5 197.3 435.9 382.1 0 0 37
1995 2.2 57 13.1 57 94.5 418.7 575.4 425.4 116.3 68.9 23.5 19.6
1996 41.5 76.9 0 76.9 16.1 566.5 736.6 278.7 246.2 85 0 0
1997 12.6 0 0 0 74.6 234.2 576.7 365.5 158.4 28.7 8.7 132.6
1998 9.2 19.8 56.2 19.8 32.3 184.1 538.2 765.4 171.4 150.5 3.6 0
1999 14.9 1 0 1 218.2 357.6 280.1 460.7 94.3 91.7 0 0
2000 6.3 23 43.6 23 173.1 917.8 364.4 303.3 139.7 0 0 0
2001 0 2.6 3.3 2.6 116.3 319.3 846.1 725.6 395.4 46.6 5.2 0
2002 34.8 25 1.6 25 233.2 441.3 578.6 285.9 217.9 0 9.3 0
2003 50.6 51.8 39.4 51.8 35.6 595.9 639.1 536 355.2 24.4 0 2.1
2004 59.6 0 0 0 136.5 257.3 420.6 203.9 334 61.9 11.9 2.7
2005 22.4 15.6 11.2 15.6 23.4 111 438.1 421.9 293.2 439.2 0 0
2006 0 0 40 0 1.8 469.1 392.6 432.5 158.1 56.6 0 57.4
2007 0 15 23 15 117.4 125.8 869.3 407.1 579.3 88.9 10.3 0
2008 7.4 4.4 3.8 4.4 69.1 290.3 356.2 271.6 131.2 66.2 0 0
2009 0 0 0 0 81.7 139.9 331.8 652.5 149.7 49.1 0 0
2010 0 20.7 20.7 20.7 222.9 320.8 555.8 517.4 0 36.6 0 0
2011 6.9 21.9 21.9 21.9 183.5 174.5 520.4 437.7 237 0 25.7 0
Source: Department of Hydrology and Meteorology (DHM)
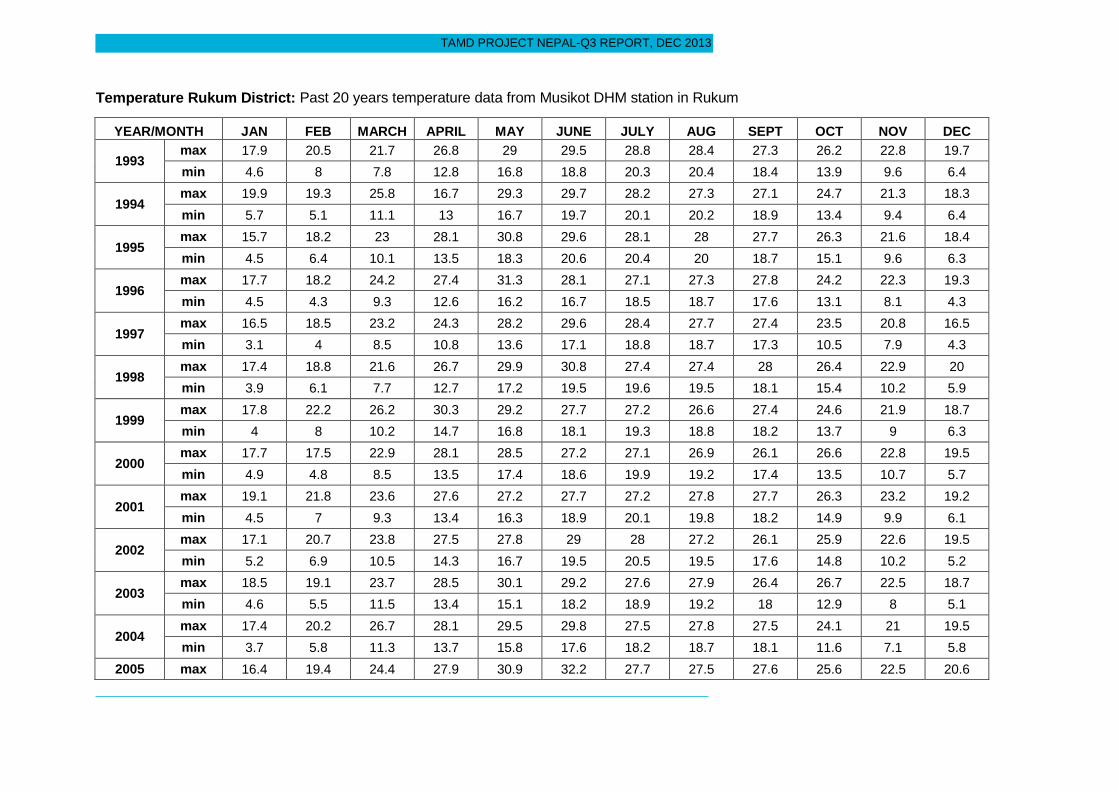
TAMD PROJECT NEPAL-Q3 REPORT, DEC 2013
Temperature Rukum District: Past 20 years temperature data from Musikot DHM station in Rukum
YEAR/MONTH JAN FEB MARCH APRIL MAY JUNE JULY AUG SEPT OCT NOV DEC
1993 max 17.9 20.5 21.7 26.8 29 29.5 28.8 28.4 27.3 26.2 22.8 19.7
min 4.6 8 7.8 12.8 16.8 18.8 20.3 20.4 18.4 13.9 9.6 6.4
1994 max 19.9 19.3 25.8 16.7 29.3 29.7 28.2 27.3 27.1 24.7 21.3 18.3
min 5.7 5.1 11.1 13 16.7 19.7 20.1 20.2 18.9 13.4 9.4 6.4
1995 max 15.7 18.2 23 28.1 30.8 29.6 28.1 28 27.7 26.3 21.6 18.4
min 4.5 6.4 10.1 13.5 18.3 20.6 20.4 20 18.7 15.1 9.6 6.3
1996 max 17.7 18.2 24.2 27.4 31.3 28.1 27.1 27.3 27.8 24.2 22.3 19.3
min 4.5 4.3 9.3 12.6 16.2 16.7 18.5 18.7 17.6 13.1 8.1 4.3
1997 max 16.5 18.5 23.2 24.3 28.2 29.6 28.4 27.7 27.4 23.5 20.8 16.5
min 3.1 4 8.5 10.8 13.6 17.1 18.8 18.7 17.3 10.5 7.9 4.3
1998 max 17.4 18.8 21.6 26.7 29.9 30.8 27.4 27.4 28 26.4 22.9 20
min 3.9 6.1 7.7 12.7 17.2 19.5 19.6 19.5 18.1 15.4 10.2 5.9
1999 max 17.8 22.2 26.2 30.3 29.2 27.7 27.2 26.6 27.4 24.6 21.9 18.7
min 4 8 10.2 14.7 16.8 18.1 19.3 18.8 18.2 13.7 9 6.3
2000 max 17.7 17.5 22.9 28.1 28.5 27.2 27.1 26.9 26.1 26.6 22.8 19.5
min 4.9 4.8 8.5 13.5 17.4 18.6 19.9 19.2 17.4 13.5 10.7 5.7
2001 max 19.1 21.8 23.6 27.6 27.2 27.7 27.2 27.8 27.7 26.3 23.2 19.2
min 4.5 7 9.3 13.4 16.3 18.9 20.1 19.8 18.2 14.9 9.9 6.1
2002 max 17.1 20.7 23.8 27.5 27.8 29 28 27.2 26.1 25.9 22.6 19.5
min 5.2 6.9 10.5 14.3 16.7 19.5 20.5 19.5 17.6 14.8 10.2 5.2
2003 max 18.5 19.1 23.7 28.5 30.1 29.2 27.6 27.9 26.4 26.7 22.5 18.7
min 4.6 5.5 11.5 13.4 15.1 18.2 18.9 19.2 18 12.9 8 5.1
2004 max 17.4 20.2 26.7 28.1 29.5 29.8 27.5 27.8 27.5 24.1 21 19.5
min 3.7 5.8 11.3 13.7 15.8 17.6 18.2 18.7 18.1 11.6 7.1 5.8
2005 max 16.4 19.4 24.4 27.9 30.9 32.2 27.7 27.5 27.6 25.6 22.5 20.6

TAMD PROJECT NEPAL-Q3 REPORT, DEC 2013
min 3.5 5.6 9.1 12 15 18.2 18.5 18.3 17.4 14.3 6.3 4.8
2006 max 22.5 25.7 25.3 28 29.4 29.4 28.4 27.4 26.1 26.3 23.4 21.5
min 6.2 10.5 10.4 14 18.1 15.8 19.5 19.7 13.9 14.9 9.5 6.5
2007 max 19.8 19.4 23.3 29.1 29.1 29.6 27.5 28.2 26.9 27.1 22.5 20.7
min 5.1 6.8 9.9 14.8 16.5 19.4 19.6 20 18.3 14.8 9.3 5.8
2008 max 18.8 19.7 26.1 28.1 29.4 28.2 27.2 27.4 28.7 25.1 26.6 22
min 5 5.6 11.3 13.5 15.1 18.5 19.5 19.1 16.8 9.6 13 6.7
2009 max 21.7 23.5 26.5 28.9 31.2 28.9 29.1 30.3 28.8 27.1 27.6 25.5
min 5.8 6.7 10.5 19.5 14.3 16.1 16.1 17.7 19.5 19.7 17.4 10.5
2010 max 19.8 20.6 27.8 31.3 30.6 31.9 28.8 29.2 27.2 27 26.4 20
min 5 6.2 11.3 14.2 16.4 18 19.7 19.5 18.3 18.2 14 6.1
2011 max 18.8 18.1 19.3 27.8 30 29.8 28.5 28.7 27.4 26.3 23.0 21.9
min 4 3.5 5.8 12.3 15.4 17.7 19.2 18.9 17.9 13.7 9.8 9.2
2012 max 19 16.3 16.5 27.4 29.5 29.4 28.2 28.2 27.1 25.8 22.1 20.5
min 4.7 5.8 3.9 8.1 12 15.2 19 19 17.9 11.3 6.3 3.7
Source: Department of Hydrology and Meteorology (DHM)
Temperature Nawalparasi District: Past 20 years temperature data from Parasi DHM station in Nawalparasi
YEAR/MONTH JAN FEB MARCH APRIL MAY JUNE JULY AUG SEPT OCT NOV DEC
1993 max 20.6 25.8 31.8 37.0 38.8 38.8 36.0 34.8 33.2 31.4 26.9 21.2
min 7.9 10.8 14.6 20.9 24.3 24.5 25.2 24.6 23.1 19.0 13.9 9.6
1994 max 21.1 25.9 32.4 38.5 38.5 37.8 36.9 35.5 34.4 33.7 29.5 22
min 8.7 10.1 15.7 18.6 22.9 26.3 25.7 26 23.7 18 13.2 10.4
1995 max 23.3 26.1 33 40.3 44.4 44.7 44.9 38.9 32.3 31.3 28.9 20.1
min 7.4 9.9 14.5 18.4 21.4 25.4 23.3 23.6 23.1 22.6 14.4 9.4
1996 max 23.5 27.1 31.8 39.1 42 38.4 36.9 38.3 34 32.2 29.3 24
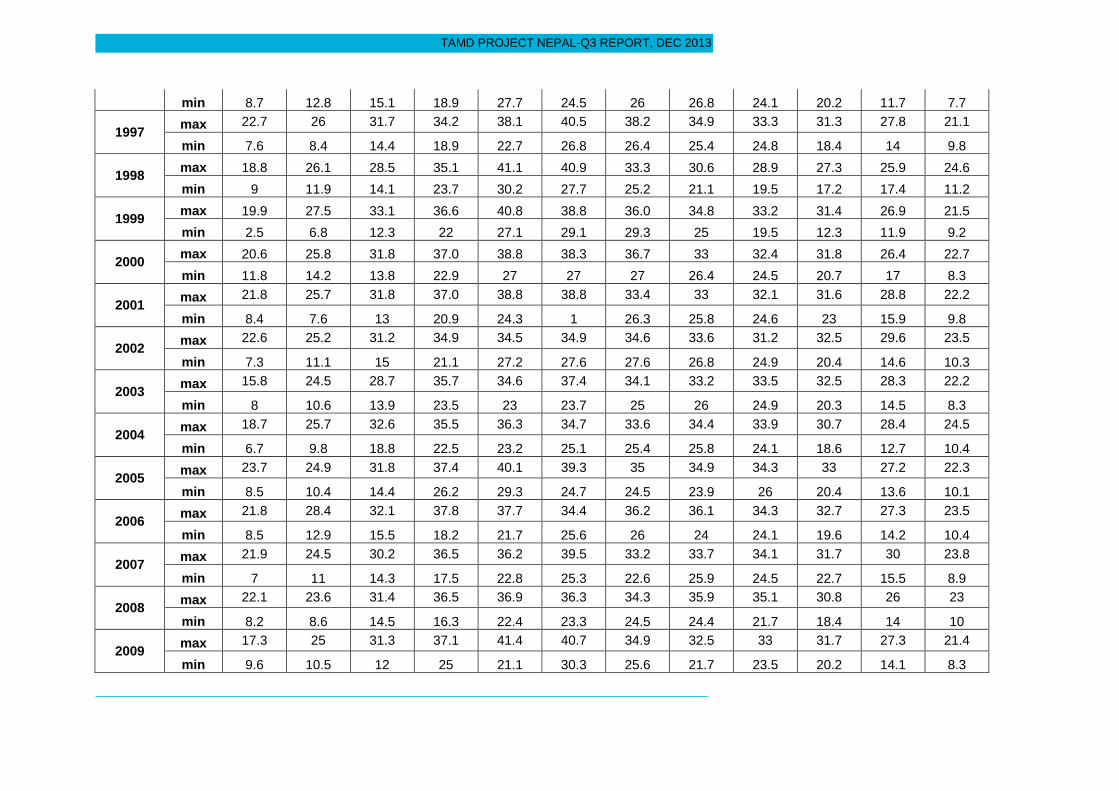
TAMD PROJECT NEPAL-Q3 REPORT, DEC 2013
min 8.7 12.8 15.1 18.9 27.7 24.5 26 26.8 24.1 20.2 11.7 7.7
1997 max 22.7 26 31.7 34.2 38.1 40.5 38.2 34.9 33.3 31.3 27.8 21.1
min 7.6 8.4 14.4 18.9 22.7 26.8 26.4 25.4 24.8 18.4 14 9.8
1998 max 18.8 26.1 28.5 35.1 41.1 40.9 33.3 30.6 28.9 27.3 25.9 24.6
min 9 11.9 14.1 23.7 30.2 27.7 25.2 21.1 19.5 17.2 17.4 11.2
1999 max 19.9 27.5 33.1 36.6 40.8 38.8 36.0 34.8 33.2 31.4 26.9 21.5
min 2.5 6.8 12.3 22 27.1 29.1 29.3 25 19.5 12.3 11.9 9.2
2000 max 20.6 25.8 31.8 37.0 38.8 38.3 36.7 33 32.4 31.8 26.4 22.7
min 11.8 14.2 13.8 22.9 27 27 27 26.4 24.5 20.7 17 8.3
2001 max 21.8 25.7 31.8 37.0 38.8 38.8 33.4 33 32.1 31.6 28.8 22.2
min 8.4 7.6 13 20.9 24.3 1 26.3 25.8 24.6 23 15.9 9.8
2002 max 22.6 25.2 31.2 34.9 34.5 34.9 34.6 33.6 31.2 32.5 29.6 23.5
min 7.3 11.1 15 21.1 27.2 27.6 27.6 26.8 24.9 20.4 14.6 10.3
2003 max 15.8 24.5 28.7 35.7 34.6 37.4 34.1 33.2 33.5 32.5 28.3 22.2
min 8 10.6 13.9 23.5 23 23.7 25 26 24.9 20.3 14.5 8.3
2004 max 18.7 25.7 32.6 35.5 36.3 34.7 33.6 34.4 33.9 30.7 28.4 24.5
min 6.7 9.8 18.8 22.5 23.2 25.1 25.4 25.8 24.1 18.6 12.7 10.4
2005 max 23.7 24.9 31.8 37.4 40.1 39.3 35 34.9 34.3 33 27.2 22.3
min 8.5 10.4 14.4 26.2 29.3 24.7 24.5 23.9 26 20.4 13.6 10.1
2006 max 21.8 28.4 32.1 37.8 37.7 34.4 36.2 36.1 34.3 32.7 27.3 23.5
min 8.5 12.9 15.5 18.2 21.7 25.6 26 24 24.1 19.6 14.2 10.4
2007 max 21.9 24.5 30.2 36.5 36.2 39.5 33.2 33.7 34.1 31.7 30 23.8
min 7 11 14.3 17.5 22.8 25.3 22.6 25.9 24.5 22.7 15.5 8.9
2008 max 22.1 23.6 31.4 36.5 36.9 36.3 34.3 35.9 35.1 30.8 26 23
min 8.2 8.6 14.5 16.3 22.4 23.3 24.5 24.4 21.7 18.4 14 10
2009 max 17.3 25 31.3 37.1 41.4 40.7 34.9 32.5 33 31.7 27.3 21.4
min 9.6 10.5 12 25 21.1 30.3 25.6 21.7 23.5 20.2 14.1 8.3

TAMD PROJECT NEPAL-Q3 REPORT, DEC 2013
2010 max 19.6 24.4 33 38.3 39.4 42 41 40 37.3 32 22.9 21.5
min 7.1 10.1 16.5 21.4 22.3 23.9 24.4 25.4 25.3 20.1 10.5 6
2011 max 15.7 29.2 37.7 39 37.8 38.6 35 33.9 31.1 27.4 20.7 13.5
min 8.4 20.9 17.3 20.6 21.2 22.4 18.4 20.2 18 15.8 15.2 11
2012 max 20 24.6 29.4 37.1 40.4 40.5 35.9 34.6 32.7 30.8 20.5 10.8
min 7.5 8 12.8 21 24.2 25.7 25.1 22.7 18.6 12.6 9.3 5.9
Source: Department of Hydrology and Meteorology (DHM)
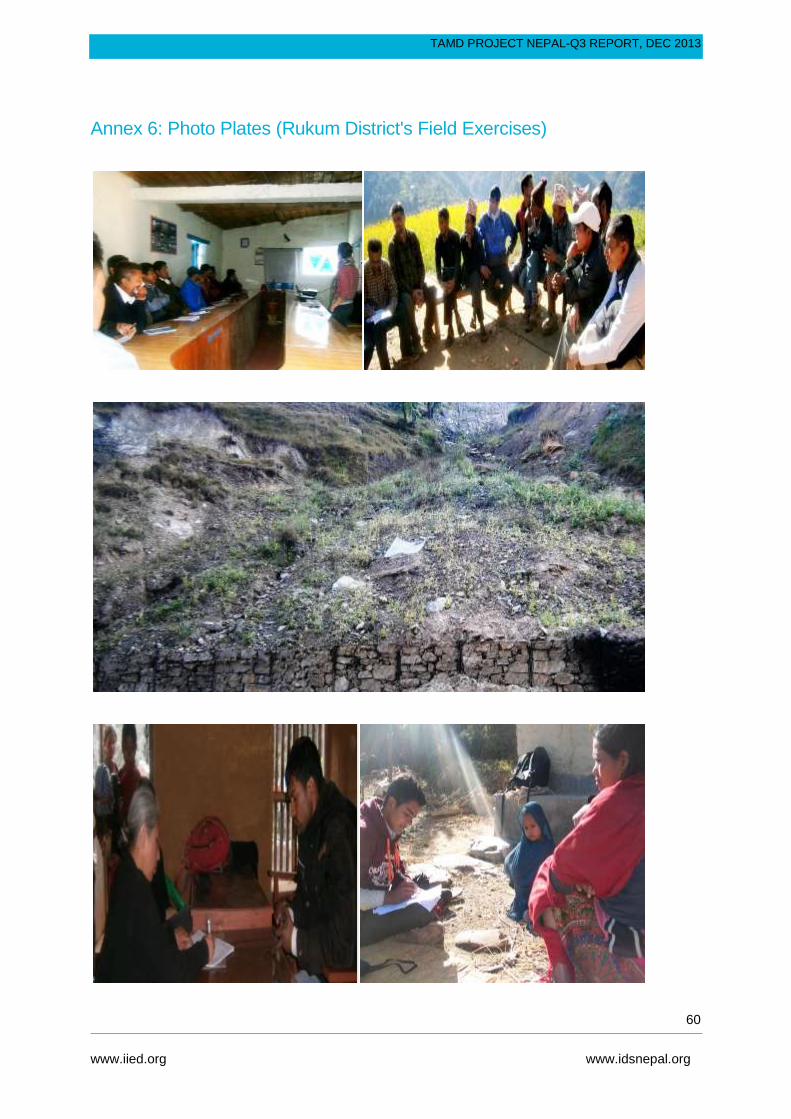
60
www.iied.org www.idsnepal.org
TAMD PROJECT NEPAL-Q3 REPORT, DEC 2013
Annex 6: Photo Plates (Rukum District's Field Exercises)

Project materials
Climate Change
Keywords: Monitoring and Evaluation (M&E), TAMD, Nepal
International Institute for Environment and Development80-86 Gray’s Inn Road, London WC1X 8NH, UKTel: +44 (0)20 3463 7399Fax: +44 (0)20 3514 9055email: [email protected] by:
This research was funded by UK aid from the UK Government,however the views expressed do not necessarily reflect the viewsof the UK Government.
International Institute for Environment and Development80-86 Gray’s Inn Road, London WC1X 8NH, UKTel: +44 (0)20 3463 7399Fax: +44 (0)20 3514 9055email: [email protected]


![Volvo Penta [Tamd 61,62,63_tamd 71,72]](https://static.fdocuments.in/doc/165x107/55cf9a76550346d033a1d777/volvo-penta-tamd-616263tamd-7172.jpg)
