December 2007 Smart Cities - NRDC · December 2007 Smart Cities: ... NRDC Marketing and Operations...
33
December 2007 Smart Cities: Solutions for China’s Rapid Urbanization Authors Bruce Appleyard Yeqing Zheng Rob Watson Laura Bruce Rachel Sohmer Xuanyi Li Jingjing Qian
Transcript of December 2007 Smart Cities - NRDC · December 2007 Smart Cities: ... NRDC Marketing and Operations...
December 2007 Smart Cities:
Solutions for China’s Rapid Urbanization
AuthorsBruce AppleyardYeqing ZhengRob Watson Laura BruceRachel SohmerXuanyi Li
Jingjing Qian
Smart Cities: Solutions for China’s Rapid Urbanization
ii
About NRDCNRDC (Natural Resources Defense Council) is a national nonprofit environmental organization with more than 1.2 million members and online activists. Since 1970, our lawyers, scientists, and other environmental specialists have worked to protect the world’s natural resources, public health, and the environment. NRDC has offices in New York City, Washington, D.C., Los Angeles, San Francisco, Chicago, and Beiijing. Visit us at www.nrdc.org.
Acknowledgments The authors would like to thank Kaid Benfield, Barbara Finamore, and David Goldstein of NRDC for their comments and suggestions regarding this report. Our thanks also go to the editors of this report, Shanti Menon, Elise Marton, and Ran Tao. We would also like to acknowledge the contributions of Clark Brockman of SERA and Portland State University students Aaron Abrams, Steve Faust, and Steve Hansen.
Authors Bruce Appleyard, SERA Architects, Inc., Portland, Oregon; Yeqing Zheng, Cameron Speth Fellow, NRDC, 2005; Rob Watson, former NRDC Senior Scientist currently with American SinoTech; Laura Bruce, former NRDC employee; Rachel Solmer, NRDC, Smart Growth Program; Xuanyi Li, Cameron Speth Fellow, NRDC, 2006; and Jingjing Qian, NRDC, China Program.
NRDC Director of Communications: Phil GutisNRDC Marketing and Operations Director: Alexandra KennaughNRDC Publications Manager: Lisa GoffrediNRDC Publications Editor: Anthony ClarkProduction: Tanja Bos, [email protected]
Copyright 2007 by the Natural Resources Defense Council.
For additional copies of this report, send $5.00 plus $3.95 shipping and handling to NRDC Publications Department, 40 West 20th Street, New York, NY 10011. California residents must add 7.5% sales tax. Please make checks payable to NRDC in U.S. dollars. The report is also available online at www.nrdc.org/policy
This report is printed on paper that is 100 percent post-consumer recycled fiber, processed chlorine free.
iii
Table of ContentsExecutive Summary iv
CHAPTER 1: Economic Growth Fuels Rural to Urban Migration 1 China’s Population Size and Distribution Urban Migration Construction Boom and Low-Density DevelopmentCase Study: Beijing's Dormitory Satellite Cities
CHAPTER 2: More Cars, More Roads, and a Shift to an Auto-Dependent Society 5China’s Growing Vehicle Fleet Rapid Road Expansion Decrease in Bicycle Use Policies and Market Forces Creating a Car Ownership Society
CHAPTER 3: Car Dependency and Sprawling Development Can Hurt Health, 8 the Economy, and the Environment Air Pollution Greenhouse Gas Emissions and Global WarmingWater Pollution and Scarcity Traffic Congestion Community Livability Loss of Farmland and Food Security Oil Consumption and Security
CHAPTER 4: The Solution: Smart Growth Combines Economic Progress and 14 Environmental Protection What Is Smart Growth? Environmental and Fiscal Benefits of Smart Growth The Three Dimensions of Smart Growth: Density, Diversity, and Design
CHAPTER 5: Recommended Smart Growth Policies 18 Vehicle Registration Congestion Pricing Parking Management Investing in Public Transit Promoting Walking and Cycling Urban Redevelopment Case Study: Xintiandi—The Private Sector in Urban Redevelopment Regional Planning and Public Involvement Integrating Smart Growth and Green Building
Conclusion 24
Endnotes 25
iv
Executive Summary
The official government view is that urbanization is a stage of modernization and will mostly benefit China’s economy, which has been expanding at an average of 9 percent per year for more than two decades. However, China’s leaders now realize that this transition, if not properly guided, may lead to serious environmental problems. Parts of the country are already facing serious environmental challenges, including expanding deserts, falling water tables, increasing water pollution, and declining air quality. Some predict that if the current trend continues, 25 percent of China’s arable land will disappear, water needs will increase by 40 percent, and sulfur dioxide emissions will be up 150 percent by 2020.3
As China industrializes, it is also becoming a more car-dependent society. China’s vehicle fleet—virtually nonexistent in the 1970s—numbered more than 36 million cars and trucks in 2003 and is one of the fastest-growing vehicle fleets in the world. The pace of road building in China has also accelerated sharply in recent years. In 2003 alone, China built 2,858 miles (4,600
kilometers) of expressways, bringing the total length to more than 18,645 miles (30,000 kilometers), second only to the United States. China is potentially moving toward a damaging, sprawling, auto-dependent settlement pattern in which jobs, shops, and public services are placed out of reach of people without cars.
The experience of the United States demonstrates that unrestrained development can result in runaway urban sprawl, which undermines the environment, the economy, and the social fabric of neighborhoods. By contrast, development in post-World War II Europe and Japan shows that it’s possible to attain high standards of economic development without excessive automobile usage as in the United States. Given China’s limited land and natural resources, a U.S. model of auto-oriented development is an inappropriate, unsustainable, and pernicious course to follow. Indeed, many fast-expanding cities have already run into trouble. Unplanned or poorly managed expansion, together with the surging popularity of private vehicles, has led to a plague of “city diseases,”
In the past two decades, China has undergone one of the most dynamic economic,
urban, and industrial transformations in human history, a process that has lifted
hundreds of millions out of poverty. Economic opportunities in China’s cities
are fueling rural to urban migration on a massive scale. The resettlement is thought
to be one of the largest sustained migrations the world has ever seen, involving the
relocation of more than 15 million people from rural to urban areas each year—an
average of 40,000 people every day. By the end of 2006, 43.9 percent of China’s
population lived in cities and towns, up from 26 percent in 1990.1 In the next two
decades, another 20 percent, or 300 million residents, will become city dwellers. This
is roughly equivalent to relocating the entire population of the United States.2
Smart Cities: Solutions for China’s Rapid Urbanization
v
such as traffic congestion, air pollution, and water pollution. Collectively, the unchecked development of hundreds of cities and towns has raised national and global concerns about China’s food security, energy security, and greenhouse gas emissions.
The effects of the vast and rapid changes taking place in China, from increasing demands for oil and other resources to pollution, are being felt around the globe. Supporting China in planning growth that minimizes the impact on the global environment and world resources is in the collective interest of all nations.
Chinese policymakers are aware of the need to manage migration and urbanization in a way that will ensure sustainable development. By carefully guiding urbanization patterns now, China can maintain dynamic development while mitigating harm to the environment and the economy. This paper presents a set of principles and policies collectively referred to as “smart growth.” In contrast with development goals that focus solely on economic enhancement, smart growth policies aim to balance the needs of the economy, the environment, and the community. They promote more efficient use of land, services, and resources; put higher priority on building ecologically within existing communities; and encourage fewer and shorter automobile trips by promoting more attractive and effective transit alternatives. By integrating transportation and land-use development, smart growth policies have been effective in curbing urban sprawl while delivering tangible environmental and financial benefits.China can enhance its economy, protect its environment, and improve the lives of its urban residents by:
• continuing to invest in public transit, such as Beijing’s Bus Rapid Transit and subway expansion projects;
• maintaining high density and redeveloping urban areas, such as the Xintiandi Project in Shanghai;
• promoting walking and cycling, as is done in many European cities;
• enacting policies to discourage car use and car ownership, such as the car license bidding system being utilized in Shanghai;
• internalizing the social and environmental costs of driving by implementing congestion pricing and parking management, as is done in London;
• planning regionally and involving the public in planning decisions, as Portland, Oregon, has successfully done; and
• ensuring that Smart Growth development is accompanied by energy- and water-efficient green buildings.
In order that they learn from each other’s experience, the authors hope that this report will spur cross-cultural dialogue on integrated transportation and land-use planning between American and Chinese policy makers and urban planners. We are optimistic that these recommendations can help Chinese cities grow smarter and improve the lives of their citizens.
Smart Cities: Solutions for China’s Rapid Urbanization
1
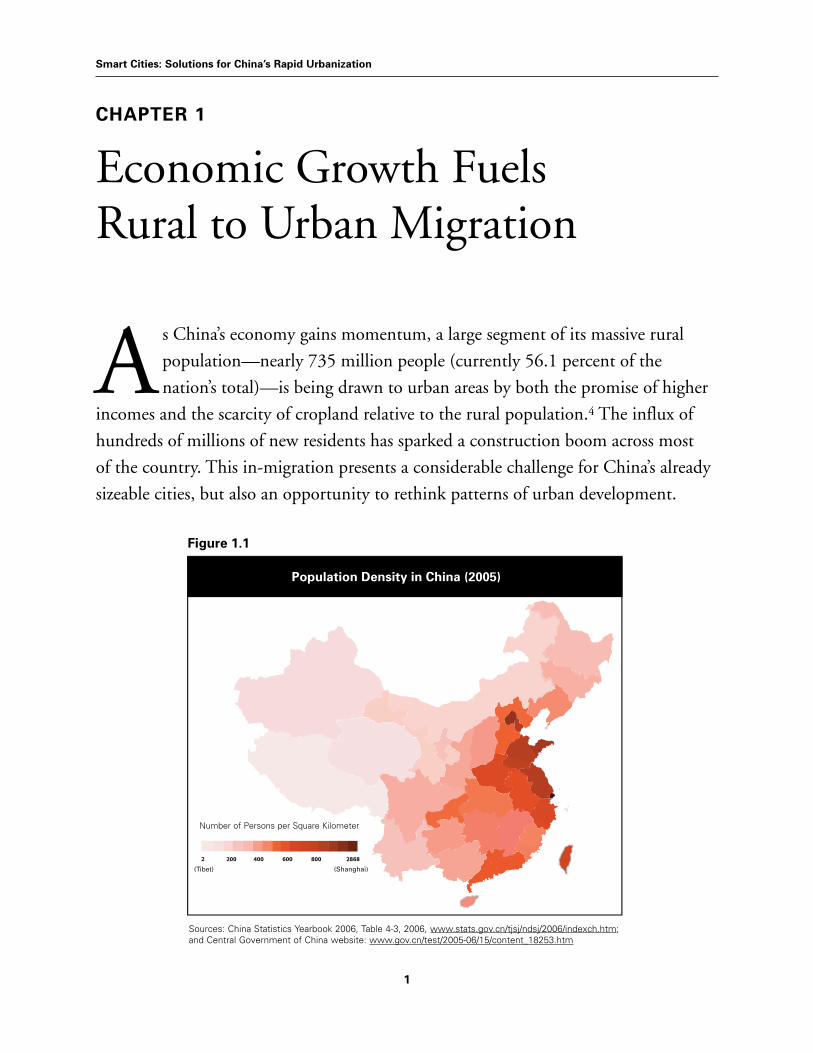
Population Density in China (2005)
(Tibet) (Shanghai)
CHAPTER 1
Economic Growth Fuels Rural to Urban Migration
As China’s economy gains momentum, a large segment of its massive rural
population—nearly 735 million people (currently 56.1 percent of the
nation’s total)—is being drawn to urban areas by both the promise of higher
incomes and the scarcity of cropland relative to the rural population.4 The influx of
hundreds of millions of new residents has sparked a construction boom across most
of the country. This in-migration presents a considerable challenge for China’s already
sizeable cities, but also an opportunity to rethink patterns of urban development.
Figure 1.1
Sources: China Statistics Yearbook 2006, Table 4-3, 2006, www.stats.gov.cn/tjsj/ndsj/2006/indexch.htm; and Central Government of China website: www.gov.cn/test/2005-06/15/content_18253.htm
Number of Persons per Square Kilometer
2
China’s Population Size and DistributionChina’s population currently numbers more than 1.31 billion, making it the world’s most populous nation.5 Large population size coupled with rapid economic growth presents a serious challenge to maintaining or improving environmental quality in China, with impacts that will likely reach far beyond China’s own borders.
Population pressures in China are aggravated by the strikingly uneven distribution of its people. At approximately 3.6 million square miles (9.3 million square kilometers), China’s land area is about the same size as that of the United States.6 However, the overwhelming majority of China’s population lives within the eastern third of the country, where climate and physical environment have historically favored human settlement. The western two-thirds of the country—including the Gobi Desert, the steep slopes of the Himalayas, and the vast, dry grasslands of the north-central region—support less than 30 percent of the total population (see Figure 1.1).7
Urban MigrationChina’s per capita arable land figure is merely one-tenth that of the United States and less than 43 percent of the world’s average.8 As a result, there are about 150 to 200 million rural surplus laborers who do not have enough farmland to support their livelihoods and who need to find other bread-earning opportunities. Absorbing this huge labor surplus has been a constant challenge to all levels of the Chinese government, which has adopted polices to accelerate urbanization so as to lessen this pressure. These policies have largely been successful in creating greater economic and employment opportunities in and around China’s cities, which in turn have drawn a massive influx of workers from rural areas.9 From 2002 to 2003 alone, China’s urban population grew by nearly 22 million people, bringing the nation’s total urban population to approximately 523 million.10
To boost economic growth, lessen unemployment pressure, and reduce the income disparity between urban and rural residents, the Chinese government hopes to increase the urban population from 40 to 60 percent of the national total by 2020, effectively reversing the current urban-rural population split.11 The resettlement is thought to be one of the largest sustained migrations the world has ever seen, involving the relocation of more than 15 million people from rural to urban areas each year—an average of
40,000 people every day.12 Urban infrastructure in Chinese cities must be able to support an additional 300 to 500 million residents over the next 20 years.13 This is roughly equivalent to relocating the entire population of the United States into newly built cities.
The influx of hundreds of millions of new residents represents a considerable challenge for China’s already sizeable cities. In 2003, 11 Chinese cities had populations greater than 4 million, and 33 others had between 2 million and 4 million residents.14 Some experts predict that by the year 2050, China will have 50 ultra-large cities (more than 2 million people), 150 large cities (500,000 to 1 million), 500 medium-size cities (200,000 to 500,000), and 1,500 small cities (60,000 to 200,000), bringing the total urban population to approximately 1.12 billion people.15
Construction Boom and Low-Density Development Trends To accommodate new residents, Chinese cities are constructing buildings at a rapid rate. Almost 86 billion square feet (8 billion square meters) of new housing was constructed in urban areas between 1980 and 2000, and the pace has accelerated in recent years.16 On a national scale, the number of residential units built annually in China during this period was approximately three times the number built in the United States in 2004.17
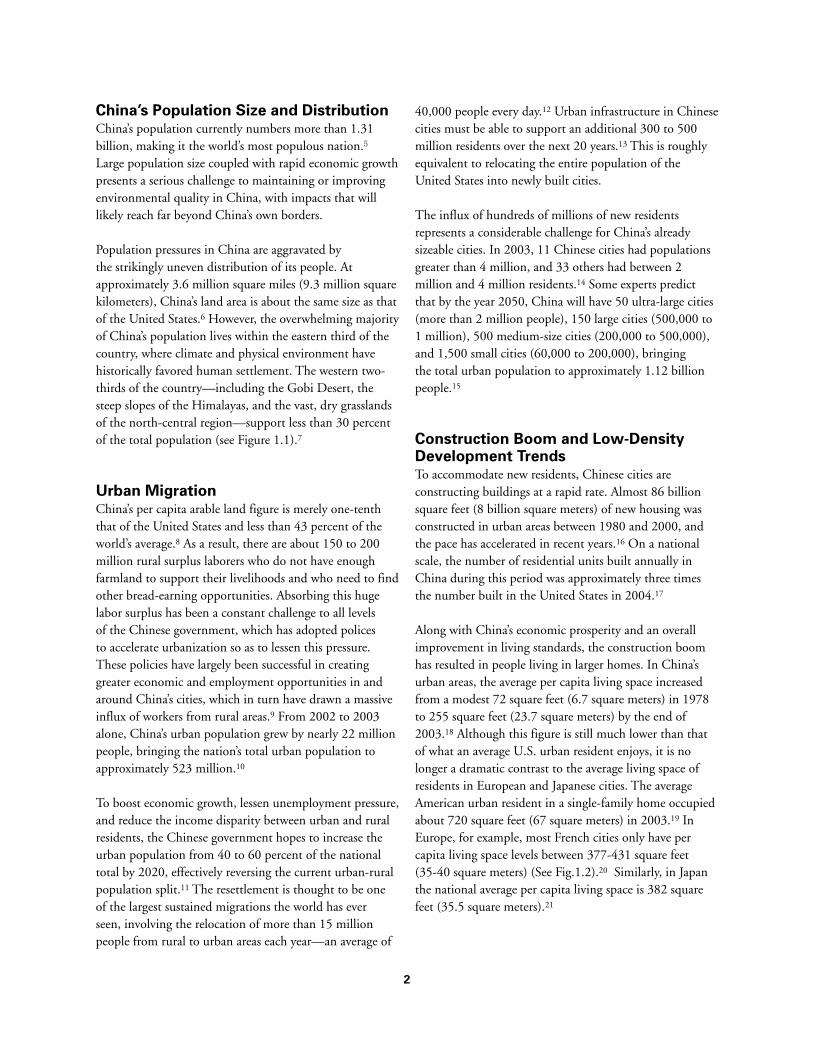
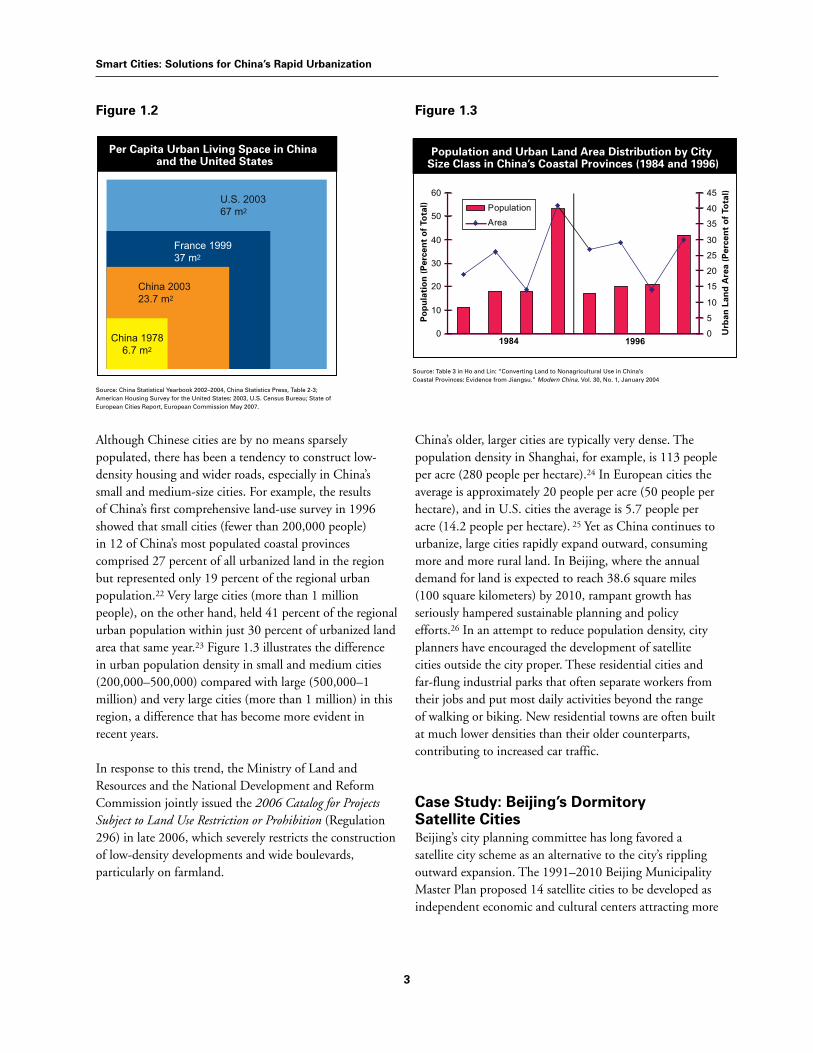
Along with China’s economic prosperity and an overall improvement in living standards, the construction boom has resulted in people living in larger homes. In China’s urban areas, the average per capita living space increased from a modest 72 square feet (6.7 square meters) in 1978 to 255 square feet (23.7 square meters) by the end of 2003.18 Although this figure is still much lower than that of what an average U.S. urban resident enjoys, it is no longer a dramatic contrast to the average living space of residents in European and Japanese cities. The average American urban resident in a single-family home occupied about 720 square feet (67 square meters) in 2003.19 In Europe, for example, most French cities only have per capita living space levels between 377-431 square feet (35-40 square meters) (See Fig.1.2).20 Similarly, in Japan the national average per capita living space is 382 square feet (35.5 square meters).21
Smart Cities: Solutions for China’s Rapid Urbanization
3
Figure 1.2
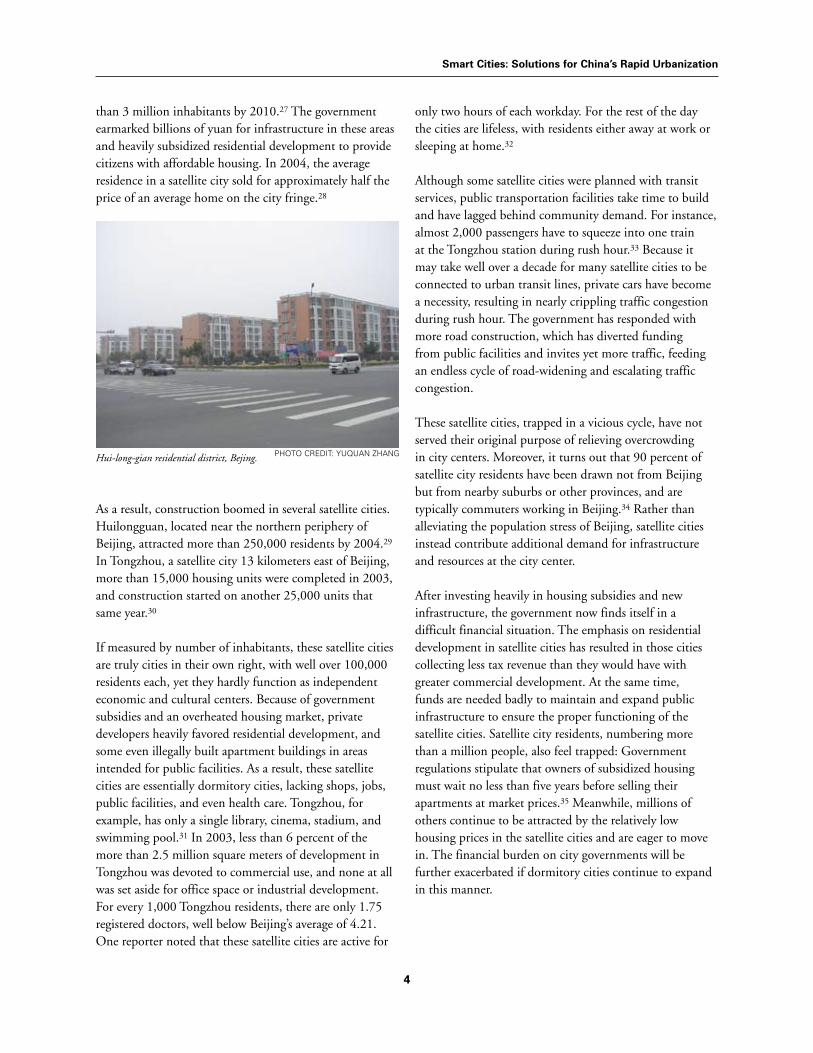
Although Chinese cities are by no means sparsely populated, there has been a tendency to construct low-density housing and wider roads, especially in China’s small and medium-size cities. For example, the results of China’s first comprehensive land-use survey in 1996 showed that small cities (fewer than 200,000 people) in 12 of China’s most populated coastal provinces comprised 27 percent of all urbanized land in the region but represented only 19 percent of the regional urban population.22 Very large cities (more than 1 million people), on the other hand, held 41 percent of the regional urban population within just 30 percent of urbanized land area that same year.23 Figure 1.3 illustrates the difference in urban population density in small and medium cities (200,000–500,000) compared with large (500,000–1 million) and very large cities (more than 1 million) in this region, a difference that has become more evident in recent years.
In response to this trend, the Ministry of Land and Resources and the National Development and Reform Commission jointly issued the 2006 Catalog for Projects Subject to Land Use Restriction or Prohibition (Regulation 296) in late 2006, which severely restricts the construction of low-density developments and wide boulevards, particularly on farmland.
Figure 1.3
China’s older, larger cities are typically very dense. The population density in Shanghai, for example, is 113 people per acre (280 people per hectare).24 In European cities the average is approximately 20 people per acre (50 people per hectare), and in U.S. cities the average is 5.7 people per acre (14.2 people per hectare). 25 Yet as China continues to urbanize, large cities rapidly expand outward, consuming more and more rural land. In Beijing, where the annual demand for land is expected to reach 38.6 square miles (100 square kilometers) by 2010, rampant growth has seriously hampered sustainable planning and policy efforts.26 In an attempt to reduce population density, city planners have encouraged the development of satellite cities outside the city proper. These residential cities and far-flung industrial parks that often separate workers from their jobs and put most daily activities beyond the range of walking or biking. New residential towns are often built at much lower densities than their older counterparts, contributing to increased car traffic.
Case Study: Beijing’s Dormitory Satellite CitiesBeijing’s city planning committee has long favored a satellite city scheme as an alternative to the city’s rippling outward expansion. The 1991–2010 Beijing Municipality Master Plan proposed 14 satellite cities to be developed as independent economic and cultural centers attracting more
Per Capita Urban Living Space in China and the United States
Source: China Statistical Yearbook 2002–2004, China Statistics Press, Table 2-3;American Housing Survey for the United States: 2003, U.S. Census Bureau; State of European Cities Report, European Commission May 2007.
China 19786.7 m2
China 200323.7 m2
France 199937 m2
U.S. 200367 m2
Population and Urban Land Area Distribution by City Size Class in China’s Coastal Provinces (1984 and 1996)
Source: Table 3 in Ho and Lin: “Converting Land to Nonagricultural Use in China’s Coastal Provinces: Evidence from Jiangsu.” Modern China. Vol. 30, No. 1, January 2004
0
10
20
30
40
50
60
Po
pu
lati
on
(P
erce
nt
of
Tota
l)
Urb
an L
and
Are
a (P
erce
nt
of
Tota
l)
0
5
10
15
20
25
30
35
40
45
Population
Area
1984 1996
Smart Cities: Solutions for China’s Rapid Urbanization
4
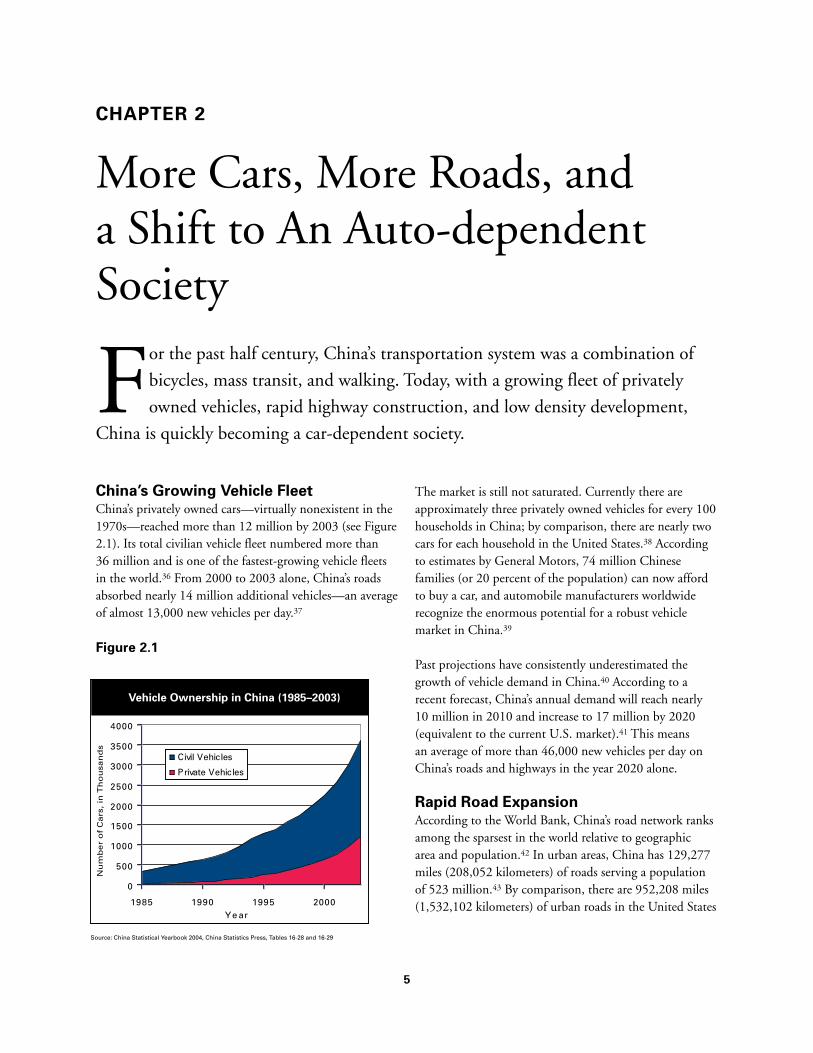
than 3 million inhabitants by 2010.27 The government earmarked billions of yuan for infrastructure in these areas and heavily subsidized residential development to provide citizens with affordable housing. In 2004, the average residence in a satellite city sold for approximately half the price of an average home on the city fringe.28
Hui-long-gian residential district, Bejing.
As a result, construction boomed in several satellite cities. Huilongguan, located near the northern periphery of Beijing, attracted more than 250,000 residents by 2004.29 In Tongzhou, a satellite city 13 kilometers east of Beijing, more than 15,000 housing units were completed in 2003, and construction started on another 25,000 units that same year.30
If measured by number of inhabitants, these satellite cities are truly cities in their own right, with well over 100,000 residents each, yet they hardly function as independent economic and cultural centers. Because of government subsidies and an overheated housing market, private developers heavily favored residential development, and some even illegally built apartment buildings in areas intended for public facilities. As a result, these satellite cities are essentially dormitory cities, lacking shops, jobs, public facilities, and even health care. Tongzhou, for example, has only a single library, cinema, stadium, and swimming pool.31 In 2003, less than 6 percent of the more than 2.5 million square meters of development in Tongzhou was devoted to commercial use, and none at all was set aside for office space or industrial development. For every 1,000 Tongzhou residents, there are only 1.75 registered doctors, well below Beijing’s average of 4.21. One reporter noted that these satellite cities are active for
only two hours of each workday. For the rest of the day the cities are lifeless, with residents either away at work or sleeping at home.32
Although some satellite cities were planned with transit services, public transportation facilities take time to build and have lagged behind community demand. For instance, almost 2,000 passengers have to squeeze into one train at the Tongzhou station during rush hour.33 Because it may take well over a decade for many satellite cities to be connected to urban transit lines, private cars have become a necessity, resulting in nearly crippling traffic congestion during rush hour. The government has responded with more road construction, which has diverted funding from public facilities and invites yet more traffic, feeding an endless cycle of road-widening and escalating traffic congestion.
These satellite cities, trapped in a vicious cycle, have not served their original purpose of relieving overcrowding in city centers. Moreover, it turns out that 90 percent of satellite city residents have been drawn not from Beijing but from nearby suburbs or other provinces, and are typically commuters working in Beijing.34 Rather than alleviating the population stress of Beijing, satellite cities instead contribute additional demand for infrastructure and resources at the city center.
After investing heavily in housing subsidies and new infrastructure, the government now finds itself in a difficult financial situation. The emphasis on residential development in satellite cities has resulted in those cities collecting less tax revenue than they would have with greater commercial development. At the same time, funds are needed badly to maintain and expand public infrastructure to ensure the proper functioning of the satellite cities. Satellite city residents, numbering more than a million people, also feel trapped: Government regulations stipulate that owners of subsidized housing must wait no less than five years before selling their apartments at market prices.35 Meanwhile, millions of others continue to be attracted by the relatively low housing prices in the satellite cities and are eager to move in. The financial burden on city governments will be further exacerbated if dormitory cities continue to expand in this manner.
PhoTo CrediT: YuquaN ZhaNG
5
CHAPTER 2
More Cars, More Roads, and a Shift to An Auto-dependent Society
For the past half century, China’s transportation system was a combination of
bicycles, mass transit, and walking. Today, with a growing fleet of privately
owned vehicles, rapid highway construction, and low density development,
China is quickly becoming a car-dependent society.
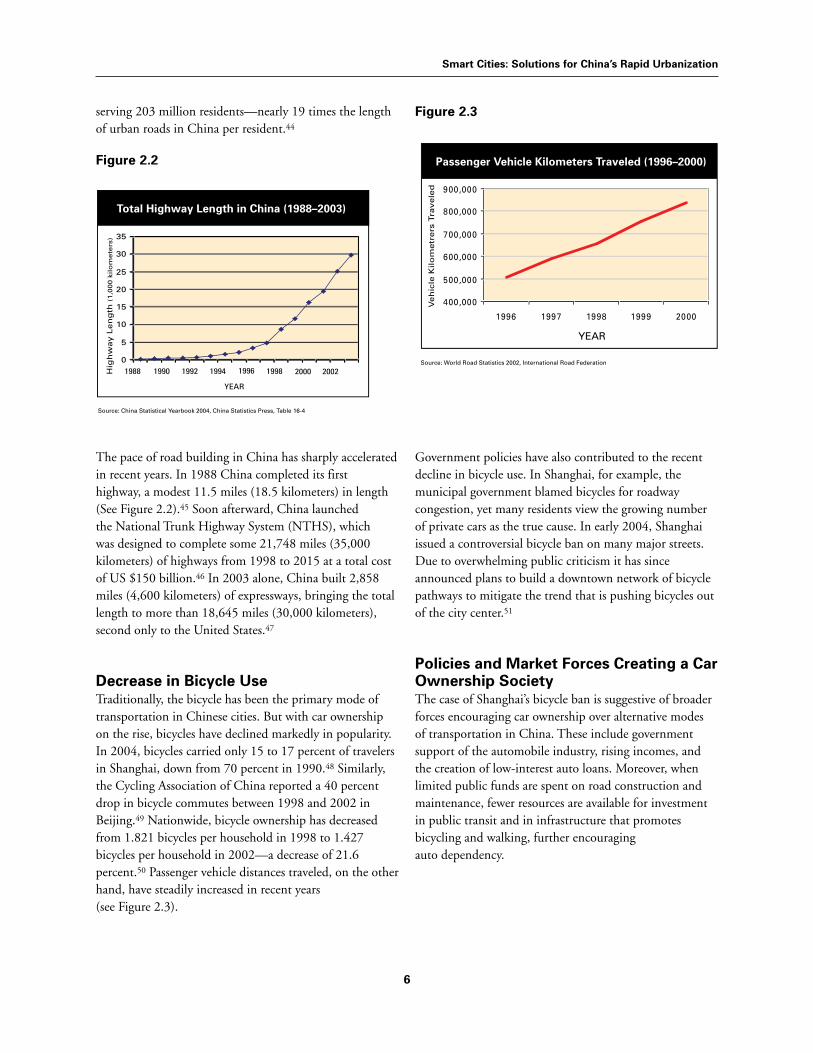
China’s Growing Vehicle Fleet China’s privately owned cars—virtually nonexistent in the 1970s—reached more than 12 million by 2003 (see Figure 2.1). Its total civilian vehicle fleet numbered more than 36 million and is one of the fastest-growing vehicle fleets in the world.36 From 2000 to 2003 alone, China’s roads absorbed nearly 14 million additional vehicles—an average of almost 13,000 new vehicles per day.37
Figure 2.1
The market is still not saturated. Currently there are approximately three privately owned vehicles for every 100 households in China; by comparison, there are nearly two cars for each household in the United States.38 According to estimates by General Motors, 74 million Chinese families (or 20 percent of the population) can now afford to buy a car, and automobile manufacturers worldwide recognize the enormous potential for a robust vehicle market in China.39
Past projections have consistently underestimated the growth of vehicle demand in China.40 According to a recent forecast, China’s annual demand will reach nearly 10 million in 2010 and increase to 17 million by 2020 (equivalent to the current U.S. market).41 This means an average of more than 46,000 new vehicles per day on China’s roads and highways in the year 2020 alone.
Rapid Road ExpansionAccording to the World Bank, China’s road network ranks among the sparsest in the world relative to geographic area and population.42 In urban areas, China has 129,277 miles (208,052 kilometers) of roads serving a population of 523 million.43 By comparison, there are 952,208 miles (1,532,102 kilometers) of urban roads in the United States
Vehicle Ownership in China (1985–2003)
Source: China Statistical Yearbook 2004, China Statistics Press, Tables 16-28 and 16-29
China2003
23.7 m2
0
500
1000
1500
2000
2500
3000
3500
4000
1985 1990 1995 2000Ye ar
Civil Vehicles
Private Vehicles
Nu
mb
er
of
Cars
, in
Th
ou
san
ds
Smart Cities: Solutions for China’s Rapid Urbanization
6
serving 203 million residents—nearly 19 times the length of urban roads in China per resident.44
Figure 2.2
The pace of road building in China has sharply accelerated in recent years. In 1988 China completed its first highway, a modest 11.5 miles (18.5 kilometers) in length (See Figure 2.2).45 Soon afterward, China launched the National Trunk Highway System (NTHS), which was designed to complete some 21,748 miles (35,000 kilometers) of highways from 1998 to 2015 at a total cost of US $150 billion.46 In 2003 alone, China built 2,858 miles (4,600 kilometers) of expressways, bringing the total length to more than 18,645 miles (30,000 kilometers), second only to the United States.47
Decrease in Bicycle Use Traditionally, the bicycle has been the primary mode of transportation in Chinese cities. But with car ownership on the rise, bicycles have declined markedly in popularity. In 2004, bicycles carried only 15 to 17 percent of travelers in Shanghai, down from 70 percent in 1990.48 Similarly, the Cycling Association of China reported a 40 percent drop in bicycle commutes between 1998 and 2002 in Beijing.49 Nationwide, bicycle ownership has decreased from 1.821 bicycles per household in 1998 to 1.427 bicycles per household in 2002—a decrease of 21.6 percent.50 Passenger vehicle distances traveled, on the other hand, have steadily increased in recent years (see Figure 2.3).
Figure 2.3
Government policies have also contributed to the recent decline in bicycle use. In Shanghai, for example, the municipal government blamed bicycles for roadway congestion, yet many residents view the growing number of private cars as the true cause. In early 2004, Shanghai issued a controversial bicycle ban on many major streets. Due to overwhelming public criticism it has since announced plans to build a downtown network of bicycle pathways to mitigate the trend that is pushing bicycles out of the city center.51
Policies and Market Forces Creating a Car Ownership SocietyThe case of Shanghai’s bicycle ban is suggestive of broader forces encouraging car ownership over alternative modes of transportation in China. These include government support of the automobile industry, rising incomes, and the creation of low-interest auto loans. Moreover, when limited public funds are spent on road construction and maintenance, fewer resources are available for investment in public transit and in infrastructure that promotes bicycling and walking, further encouraging auto dependency.
Total Highway Length in China (1988–2003)
Source: China Statistical Yearbook 2004, China Statistics Press, Table 16-4
0
5
10
15
20
25
30
35
1988 1990 1992 1994
YEAR
1996 1998 2000 2002Hig
hw
ay L
en
gth
(1
,00
0 k
ilo
me
ters
)
Passenger Vehicle Kilometers Traveled (1996–2000)
Source: World Road Statistics 2002, International Road Federation
400,000
500,000
600,000
700,000
800,000
900,000
1996 1997 1998 1999 2000
YEAR
Veh
icle
Kilo
metr
ers
Tra
vele
d
Smart Cities: Solutions for China’s Rapid Urbanization
7
Government policyIn recent years, the central government has given strong support to the development of China’s auto industry, and has encouraged personal car ownership as a means to stimulate consumer spending, reduce unemployment, and strengthen China’s manufacturing capacity. In the national Five-Year Economic and Social Development Plan for 2000–2005, specific measures were introduced to shift the focus of the Chinese auto industry from manufacturing trucks to producing affordable family cars.52 The effects of this policy are evident in cities with auto manufacturers such as Shanghai, where the automobile industry’s share in the city’s total industrial revenue jumped from 5.4 percent in 1999 to 12 percent by 2003.53 While the rate of automobile sales in China slowed considerably in 2004, analysts at the time estimated robust vehicle production and sales for years to come, a prediction that was borne out with record sales of 7 million autos in 2006.54
The domestic market for family cars is heightened by poor land-use planning. By separating residential areas from employment, shopping centers, and schools, sprawling development increases automobile travel by virtue of the longer distances in people’s daily routines.
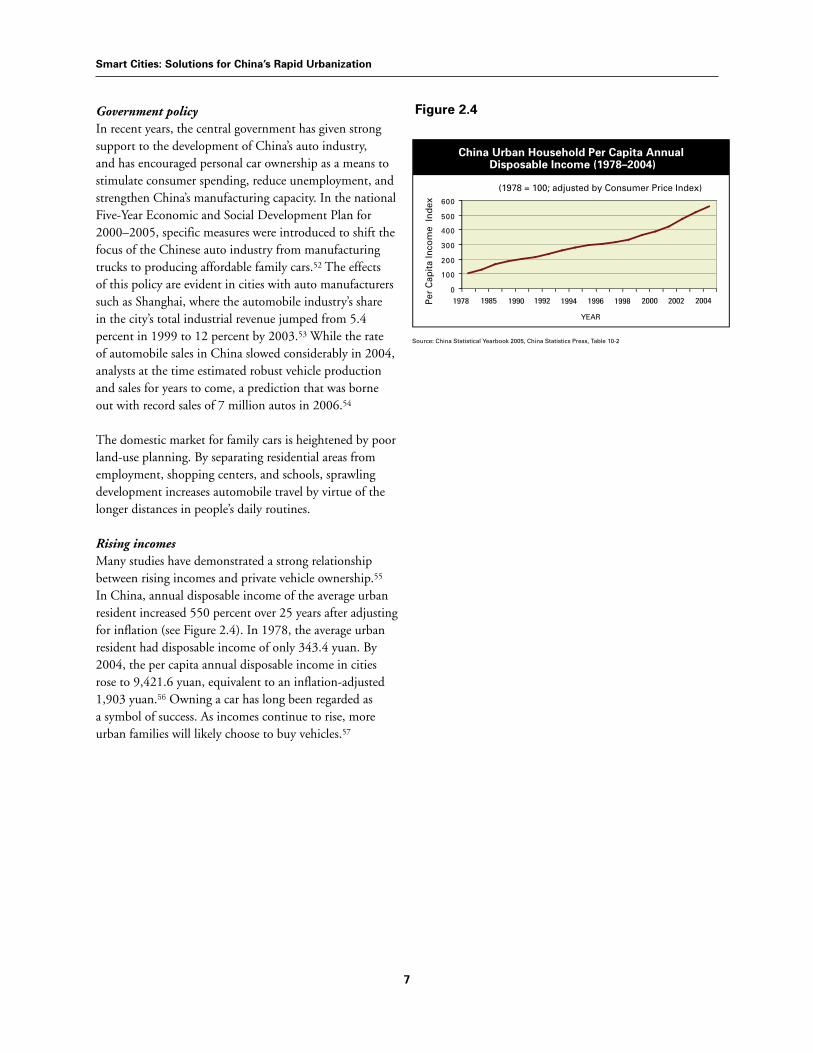
Rising incomesMany studies have demonstrated a strong relationship between rising incomes and private vehicle ownership.55 In China, annual disposable income of the average urban resident increased 550 percent over 25 years after adjusting for inflation (see Figure 2.4). In 1978, the average urban resident had disposable income of only 343.4 yuan. By 2004, the per capita annual disposable income in cities rose to 9,421.6 yuan, equivalent to an inflation-adjusted 1,903 yuan.56 Owning a car has long been regarded as a symbol of success. As incomes continue to rise, more urban families will likely choose to buy vehicles.57
Figure 2.4
China Urban Household Per Capita Annual Disposable Income (1978–2004)
Source: China Statistical Yearbook 2005, China Statistics Press, Table 10-2
(1978 = 100; adjusted by Consumer Price Index)
Per
Cap
ita
Inco
me
Ind
ex
0
100
200
300
400
500
600
YEAR
1978 1985 1990 1992 1994 1996 1998 2000 2002 2004
Smart Cities: Solutions for China’s Rapid Urbanization
8
Air PollutionAccording to the World Bank, 16 of the 20 most polluted cities in the world are in China.58 Only about one-third of 340 monitored Chinese cities meet national air quality standards, which are more lenient than the standards set by the World Health Organization (WHO). According to a 2006 report by the State Environmental Protection Administration of China, air pollution contributed to nearly 358,000 premature deaths and about 640,000 hospitalizations for respiratory and circulatory diseases in 2004. That year also saw 256,000 new cases of chronic bronchitis. The economic cost of air pollution in 2004 was estimated to be 152.74 billion yuan (US $19 billion).59 An earlier study by the Chinese Academy for Environmental Planning estimated China’s healthcare costs from air pollution to be around 2 to 3 percent of the country’s GDP and projected that figure to reach 13 percent, or $390 billion, by 2020.60
A significant cause of this public health crisis is a result of China’s overwhelming reliance on coal. In the context of
urban development, it is important to note that buildings consume a large share of China’s coal-based energy. In 2006, approximately 20 percent of China’s total energy use was for the operation of buildings, 15 percent spent on the production of building materials, and additional 10 percent was indirect associated with buildings.61
While nationally coal has been the main source of air pollution, automobile exhaust is quickly becoming another significant source of pollution in Chinese cities.62 In 2003, carbon monoxide (CO), hydrocarbons (HC), nitrogen oxides (NOx), and fine particles from vehicles accounted for 80 percent, 75 percent, 68 percent, and 50 percent, respectively, of the air pollution in major cities such as Beijing, Shanghai, and Guangzhou.63 Poor emissions controls in Chinese vehicles also contribute to the problem. For example, Beijing produces as much carbon monoxide as Los Angeles and Tokyo combined, though it has only one-tenth the number of cars.64 Between 1991 and 1995, the ozone concentration in Beijing’s suburbs exceeded public health standards an average of 53 days
CHAPTER 3
Car Dependency and Sprawling Development Can Hurt Health, the Economy, and the Environment
W hile the growth of China’s economy has lifted millions out of poverty,
swelling city populations, increased housing floor area, and the
trend toward automobile dependency have contributed to a host
of environmental, health, and security concerns. Urban air and water quality are
deteriorating, and greenhouse gas emissions are increasing rapidly. Cars flood city
roads, causing severe traffic congestion and jeopardizing community livability. Auto-
centric development consumes farmland and oil, posing a threat to China’s food and
oil security.
Smart Cities: Solutions for China’s Rapid Urbanization
9
per year (in 1998 and 1999, the pollution levels exceeded standards on 101 days and 119 days, respectively).65 The total emissions of CO, HC, and NOx in China have grown by factors of 2, 2.5, and 3, respectively, since 1995.66
In response, the government has taken a series of actions aimed at curbing vehicle pollution. These include phasing out leaded gasoline, promoting the use of alternative fuels such as compressed natural gas and liquefied petroleum gas through a national Clean Air Program, and adopt-ing more stringent vehicle fuel economy and emission standards leading to the retirement of old vehicles. The Government enacted the equivalent of Euro III vehicle emissions standards across China for new model cars on July 1, 2007, even though oil refiners are unable to sup-ply enough low-sulfur gasoline at the moment.67 The adoption of Euro IV standards is planned for 2010.
Greenhouse Gas Emissions and Global Warming Another environmental concern attributed to the urbanization process is increased greenhouse gas (GHG) emissions from sprawl-related traffic. So far, China’s transportation sector has not been a large source of GHG. Estimates show that only about 7 percent of China’s carbon dioxide (CO2) emissions come from the transportation sector. Even in cities like Shanghai the percentage is low, due to the relatively low level of vehicle ownership. China’s CO2 emissions from the transportation sector are only about 269 pounds (122 kilograms) per capita, about 3 percent that of the United States.68
However, the increasing popularity of private cars in cities will push CO2 emissions from China’s transportation sector to a much higher level. The question is, how high will that level be? Using Shanghai as an example, Zhou and Sperling projected two GHG emissions scenarios for China’s transportation sector.69 They estimated that even under circumstances in which the government actively engages the automobile market and strictly controls the registration of personal vehicles, there will be a fourfold increase in emissions by 2020. In the high-level scenario, in which market forces play a larger role, GHG emissions will increase by as much as sevenfold.
A sizable share of the increase can come from sprawl-related traffic. A recent study shows that in an average
US office building, 30 percent more energy use can be attributed to the commute of employees rather than what the building itself consumes.70 “Transportation energy intensity” of buildings is clearly influenced by building location and various land-use features, such as density, mixed uses, and transit accessibility.
Global warming is a major concern for China. Estimates of agricultural damage show that if GHG emissions are not controlled, China’s three major crops—wheat, rice, and corn—will be diminished by as much as 10 percent between 2030 and 2050, which translates to a 0.5 percent loss of national GDP.71 A warmer climate would also accelerate the loss of glacier cover in western China, which may pose a challenge to China’s water resource management.72 Sea level rise associated with global warming will also have adverse impacts on coastal ecosystems, especially coastal wetlands. One study estimates that by 2050, sea levels will have risen by 1 to 9 inches (3 to 23 cm) and by 12 to 25 inches (31 to 65 cm) by 2100.73 China’s prosperous coastal area, which contributes the most to increasing GHG emissions, will bear the brunt of the damage.
Water Pollution and ScarcityWhile city dwellers tend to have better access to water and improved sanitation than their rural counterparts, water quality and quantity in Chinese cities is still unreliable. Two-thirds of major cities have inadequate water supply, and 110 cities are critically short of clean water. Meanwhile, the demand for water is growing at a rate of about 10 percent a year in cities.74 As many as 300 million people drink water contaminated with chemicals and wastes at levels exceeding the government’s minimum standards, which are less stringent than those set by the WHO.75 In 2004, more than half of the 48.2 billion tons of raw sewage produced in cities was dumped straight into rivers and lakes.76 Chinese scientists have found links between the lack of sewage treatment systems and higher rates of liver, stomach, and esophageal cancers in urban areas.77
Development itself also contributes to water pollution. The hard surfaces of parking lots, roads, and rooftops do not absorb rainfall. Instead, runoff in urban landscapes picks up substances such as motor oil, pesticides, and silts and carries them into waterways, causing pollution. A study found that from 1998 to 2003, the initial runoff
Smart Cities: Solutions for China’s Rapid Urbanization
10
from rooftops and roads in Beijing was generally more polluted than municipal sewage.78 In addition, runoff may physically damage rivers and streams because it enters at high volume and speed, causing erosion and other problems for aquatic ecosystems.
Wastewater from buildings contributed nearly 40 percent of the 63 billion cubic meters discharged into China’s waterways in 2002.79 Although the rate of coverage is improving annually, municipal sewage treatment plants handle only about 40 percent of all sewage.80 This means that roughly 15 billion tons of untreated building sewage is dumped into China’s waterways each year, contributing to degraded oxygen levels, algae blooms, and elevated bacterial and viral counts. Buildings use more than 80 percent of the municipally treated water in China, further straining the water supply.
Traffic CongestionOne of the major impacts of rising automobile dependency in China will be the space requirements for roads, highways, and parking, a confounding problem for Chinese urban planners. In the United States, urban areas developed with at least some space for personal vehicles (horses and carriages, then autos). Chinese cities, for the most part, have observed a different course of grown. Ancient cities like Beijing were based upon relatively independent neighborhoods threaded by narrow pedestrian alleyways. In the 1950s to 1970s, the emergence of self-sufficient, enclosed work/living compounds made large road networks unnecessary.
Incorporating ancient city design into recent development has resulted in the Chinese phenomenon of the “superblock”—long stretches of six- to eight-lane mega-boulevards that cross one another infrequently, and create intersections the size of a football field. The sheer volume of traffic and lack of alternative routes, as pedestrians, bicycles, cars, buses, and trucks all try to negotiate the same crossings, create massive choke points. The inconvenience that wide streets create for pedestrians effectively encourages vehicle use.
New roads, paradoxically, can also encourage more congestion instead of relieving it—a phenomenon known as induced demand.81 In the short term, traffic can increase as existing drivers switch to a new route, and
as people who once used other means of transit take to driving instead. In the long run, new road capacity can cause people to change the location of where they work and/or live, often leading to sprawling development that can be accessed only by car.
Even though private car ownership in China is well below Western levels, congestion has become a serious problem in major cities like Beijing, Shanghai, and Guangzhou. Indeed, despite the widening of many main thoroughfares and the increasing use of signals and signs to guide traffic, the average speed of vehicles on main downtown streets in Beijing fell from 28 miles per hour (45 kilometers per hour) in 1994 to 7 miles per hour (12 kilometers per hour) in October 2003, with the lowest speed being less than 4 miles per hour (7 kilometers per hour) at some intersections—slightly faster than a walking pace.82
Community LivabilityStreets often serve as important spaces for building social connections, conducting commerce, and contributing to the general health, safety, and welfare of the community. The increasing presence of cars may negatively impact community livability and quality of life.83 In cities, super-blocks encourage excessive vehicle speeds. At the same time, a lack of pedestrian crossways forces people to make unsafe road crossings. The combination of high speeds and unsafe crossings is one of the principal causes of pedestrian deaths in China.84 The World Health Organization estimates that every day more than 600 people are killed and 45,000 injured on China’s roads, an average of more than 31 vehicle-pedestrian accidents per minute.85 Pedestrians are most frequently the victims.86 It is predicted that road traffic fatalities in China will increase to almost half a million per year by 2020 unless urgent action is taken to make China’s streets more livable and safe.87

11
Increased traffic also drives people indoors, impeding social activities and community cohesion and augmenting the probability of street crimes. In the late 1960s, Appleyard compared three residential streets in San Francisco, similar in many aspects (street and neighborhood design, demographics, etc.) but completely different in their traffic volume. Heavy traffic on a given street correlates with less interaction among the residents of that street. The light traffic street, on the other hand, was a tightly knit community. Front steps were used for sitting and socializing, sidewalks for children to play and for adults to discuss the issues of the day. The street acted as a seam that united the community, unlike streets with heavy traffic, where residents kept to themselves and community solidarity was virtually absent. The study indicated that as traffic volume increased, factors that lead to healthy and strong communities—from social interface and comfort to neighborhood pride and property value—were negatively affected. Children and the elderly were found to be particularly vulnerable to these negative effects.88
Loss of Farmland and Food Security The conversion of land to nonagricultural use (urban, industrial, and transportation) in China has occurred at an unprecedented rate since the mid-1980s. From 1996 to 2003, the area of farmland consumed by construction totaled 22.4 million Chinese mu (1.5 million hectares).89 This is approximately equivalent in size to the state of Connecticut. An auto-centric transportation system requires much more land than does a more balanced system. Assuming that a midsize bus seats approximately 40 people—most of the time, Chinese public buses are crowded with many people standing—and that the average distance between vehicles on the streets is 20 meters, we can estimate that a bus of 40 people occupies approximately 98 square meters of road. Similarly, we can estimate the road areas required by private cars, taxis, and bikes, assuming 1.73 people per private car, 2 riders per taxi, and 1 person per bicycle.90 The results of the estimate are plotted in Figure 3.1, showing that for every 40 passengers, the required road area is 1,872.5 square meters by car, 1,610 square meters by taxi, 164.5 square meters by bike, and only 98 square meters by bus.
Figure 3.1
Auto-centric development in many parts of the country has contributed to the rapid conversion of land into road area. As illustrated in Figure 3.2, from 2000 to 2005, the total paved road area in Chinese cities increased by 85 percent, from 1,904 square kilometers (735 square miles) in 2000 to 3,920 square kilometers (1,514 square miles) in 2005.
Figure 3.2
How much land would an auto-centric transportation system require on a national level in China? According to Lester Brown, founder and president of the Earth Policy Institute based in Washington, D.C., densely populated, auto-centric industrial societies such as Germany, the United Kingdom, and Japan have paved an average of about 0.05 acre (0.02 hectare) for every car. In the United States, in contrast, there is about 0.17 acre (0.07 hectare)
Road Area Required by Different Transportation Modes for Every 40 Passengers
Source: Nanfang Daily, November 5, 2005
0 (m2)500 1000 1500
1872.5
1610
164.5
98Bus
Bike
Taxi
Private car
2000
Road Pavement in China
Source: Annual Urban Construction Reports, 2000-2005, Ministry of Construction of China, available at www.cin.gov.cn/statis/gb/
4000
Roa
d A
rea
(km
2 )
YEAR
3500
3000
25002000
2000 2001 2002 2003 2004 2005
1500
1000
5000
Smart Cities: Solutions for China’s Rapid Urbanization
12
of paved surface for every car. That translates to a paved area about the size of a football field for every five cars in the United States. Some projections of car ownership suggest that China would need about 16 million hectares of roads and parking lots to support its vehicle fleet. This is half the land area currently used to produce rice. In short, China does not have enough land to feed itself and create roads, parking lots, and highways to the extent found in the United States.91
Similarly, China cannot afford to waste land for low-density luxury housing. By 2002, three cities—Beijing, Shanghai, and Shenzhen—had developed nearly 5,000 acres (2,024 hectares) of villas and townhouses.92 Some villa compounds in Shanghai are so big that they contain thousands of units. While it is important to provide housing for China’s urbanizing population, these single-use, oversized, low-density, auto-centric communities have led to wasteful land use. The recent Ministry of Land and Resources’ land-use restriction catalog takes an important step toward mitigating this negative impact.
Even as China paves over its farmland, the nation’s food demand is constantly growing and changing. As people move to cities and earn higher wages, their food preferences shift from grain toward higher-priced fruits, vegetables, and animal proteins. The land area in China used to grow fruits and vegetables increased from approximately 3.2 million acres (1.3 million hectares) in 1991 to 64.2 million acres (26 million hectares) in 2003.93 Cattle, sheep, and goat populations in China have tripled since 1950, contributing to desertification and the degradation of pastureland.94 The combined result is a reduction in the production of grain, rice, and corn.
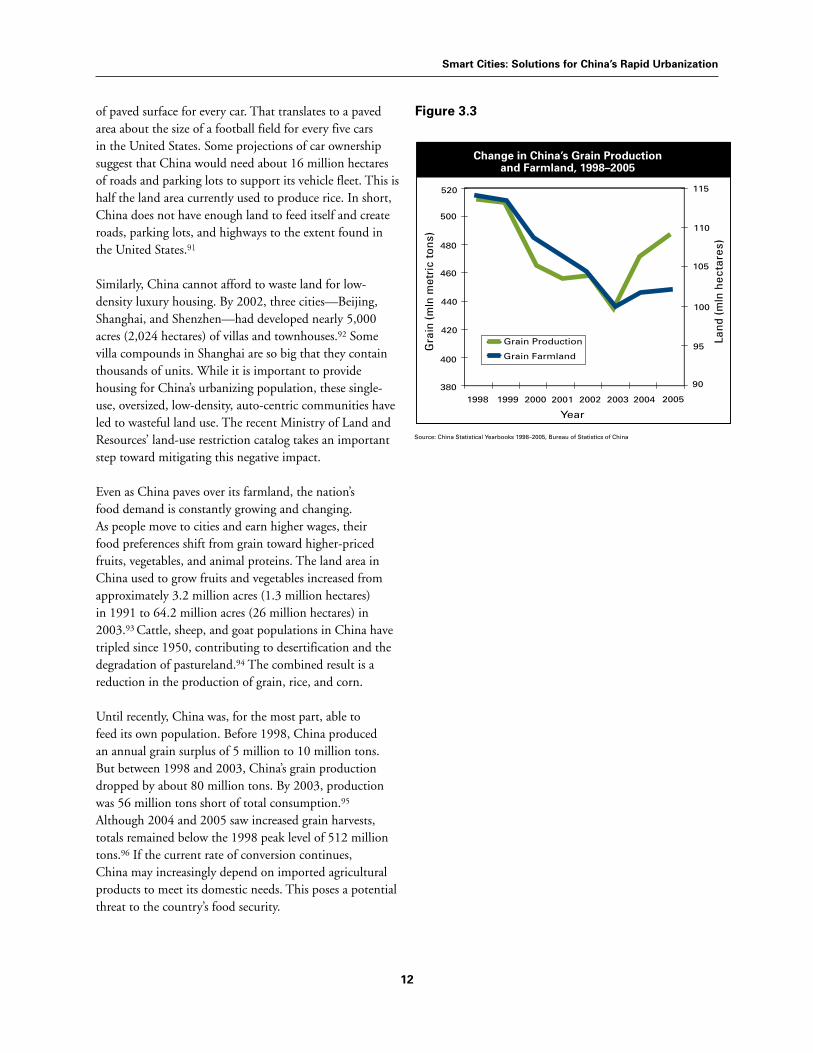
Until recently, China was, for the most part, able to feed its own population. Before 1998, China produced an annual grain surplus of 5 million to 10 million tons. But between 1998 and 2003, China’s grain production dropped by about 80 million tons. By 2003, production was 56 million tons short of total consumption.95 Although 2004 and 2005 saw increased grain harvests, totals remained below the 1998 peak level of 512 million tons.96 If the current rate of conversion continues, China may increasingly depend on imported agricultural products to meet its domestic needs. This poses a potential threat to the country’s food security.
Figure 3.3
Change in China’s Grain Production and Farmland, 1998–2005
Source: China Statistical Yearbooks 1998–2005, Bureau of Statistics of China
520
500
480
460
440
420
400
3801998
Grain Production
Grain Farmland
110
115
105
100
95
90
Gra
in (m
ln m
etri
c to
ns)
Land
(mln
hec
tare
s)
Year
1999 2000 2001 2002 2003 2004 2005
Smart Cities: Solutions for China’s Rapid Urbanization
13
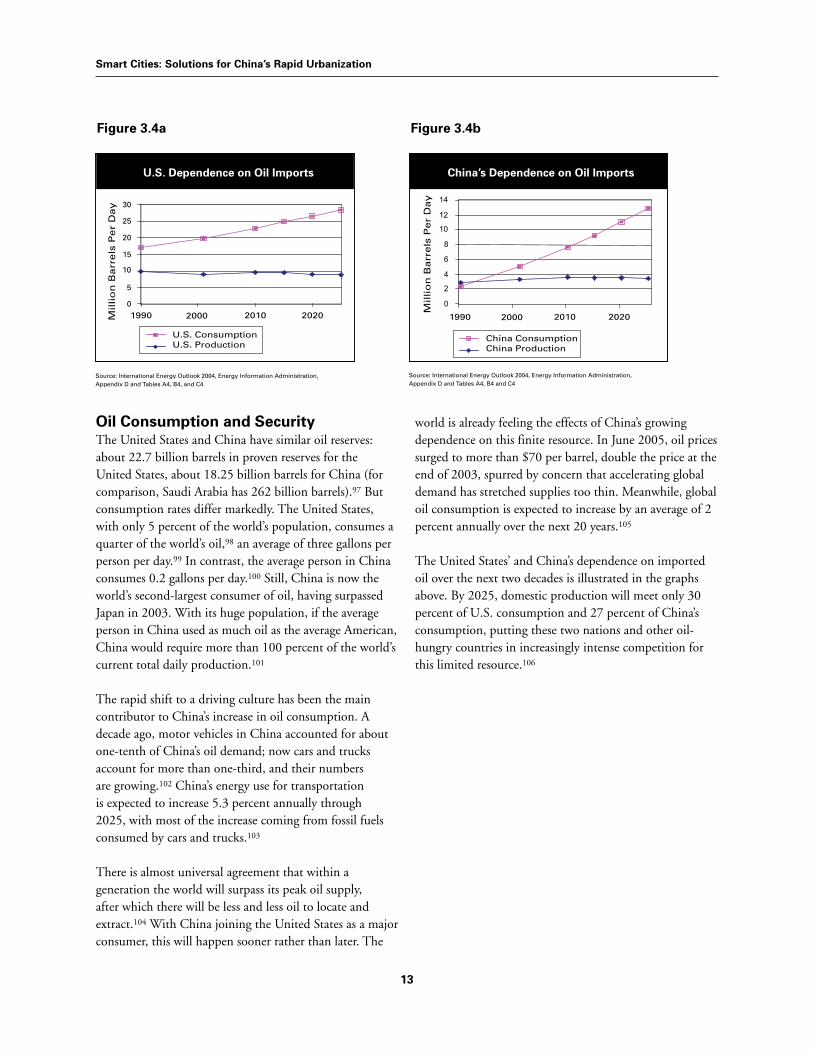
Oil Consumption and SecurityThe United States and China have similar oil reserves: about 22.7 billion barrels in proven reserves for the United States, about 18.25 billion barrels for China (for comparison, Saudi Arabia has 262 billion barrels).97 But consumption rates differ markedly. The United States, with only 5 percent of the world’s population, consumes a quarter of the world’s oil,98 an average of three gallons per person per day.99 In contrast, the average person in China consumes 0.2 gallons per day.100 Still, China is now the world’s second-largest consumer of oil, having surpassed Japan in 2003. With its huge population, if the average person in China used as much oil as the average American, China would require more than 100 percent of the world’s current total daily production.101
The rapid shift to a driving culture has been the main contributor to China’s increase in oil consumption. A decade ago, motor vehicles in China accounted for about one-tenth of China’s oil demand; now cars and trucks account for more than one-third, and their numbers are growing.102 China’s energy use for transportation is expected to increase 5.3 percent annually through 2025, with most of the increase coming from fossil fuels consumed by cars and trucks.103
There is almost universal agreement that within a generation the world will surpass its peak oil supply, after which there will be less and less oil to locate and extract.104 With China joining the United States as a major consumer, this will happen sooner rather than later. The
world is already feeling the effects of China’s growing dependence on this finite resource. In June 2005, oil prices surged to more than $70 per barrel, double the price at the end of 2003, spurred by concern that accelerating global demand has stretched supplies too thin. Meanwhile, global oil consumption is expected to increase by an average of 2 percent annually over the next 20 years.105
The United States’ and China’s dependence on imported oil over the next two decades is illustrated in the graphs above. By 2025, domestic production will meet only 30 percent of U.S. consumption and 27 percent of China’s consumption, putting these two nations and other oil-hungry countries in increasingly intense competition for this limited resource.106
China’s Dependence on Oil Imports
Source: International Energy Outlook 2004, Energy Information Administration, Appendix D and Tables A4, B4 and C4
0 2 4 6 8
10 12 14
China ConsumptionChina Production
1990 2000 2010 2020
Millio
n B
arr
els
Per
Day
U.S. Dependence on Oil Imports
Source: International Energy Outlook 2004, Energy Information Administration, Appendix D and Tables A4, B4, and C4
U.S. ConsumptionU.S. Production
1990 2000 2010 2020Millio
n B
arr
els
Per
Day
0 5
15 10
20 25 30
Figure 3.4a Figure 3.4b
Smart Cities: Solutions for China’s Rapid Urbanization
14
CHAPTER 4
The Solution: Smart Growth Combines Economic Progress and Environmental Protection
How China’s cities manage the massive influx of new residents in the next
two decades will set the framework for growth over the next 100 years and
beyond. The current urbanization pattern of sprawling, auto-dependent
development poses a threat to public health, quality of life, the economy, and national
security, and also strains natural and social resources. China can correct its inefficient
use of resources and avoid environmental deterioration by pursuing a “smart growth”
pathway, which offers an integrated approach to development.
What Is Smart Growth? Smart growth is an urban development strategy that has its roots in an ecological movement of city planners, political leaders, environmentalists, real estate developers, and economists that has grown in response to auto-dependent sprawl in the United States. Smart growth promotes more efficient use of land, services, and resources with policies that enhance and bring reinvestment into existing communities. Smart growth promotes more attractive and effective alternatives to driving—such as walking, biking, and using public transit—resulting in fewer and shorter automobile trips.107 Smart growth serves the economy, the community, and the environment.108 If the 10 principles described below were adapted to the circumstances in China, smart growth may provide a powerful means to redress unsustainable development patterns occurring in many Chinese cities.
The following 10 principles, adapted from the Smart Growth America Coalition, summarize the essence of this new development approach.109
1. Mix land uses. New, clustered development works best if it includes a mix of stores, jobs, and homes. Single-use districts make life less convenient and require more driving.
2. Take advantage of existing community assets. Public investments should focus on getting the most out of what we’ve already built, from local parks to neighborhood schools to transit systems.
3. Create a range of housing opportunities and choices. Providing quality housing across all income levels at a reasonable density can help ensure community vitality and access to public transportation and other services.
4. Foster “walkable,” close-knit neighborhoods. These places offer not just the opportunity to walk—
Smart Cities: Solutions for China’s Rapid Urbanization
15
sidewalks are a necessity—but something to walk to, whether it’s the corner store, a transit stop, or a school. A compact, walkable neighborhood contributes to people’s sense of community. Neighbors get to know one another, not just one another’s cars.
5. Promote distinctive, attractive communities with a strong sense of place, through such measures as the rehabilitation and use of historic buildings. Every community has assets that make it special, from train stations to local businesses. These should be protected and celebrated.
6. Preserve open space, farmland, natural beauty, and critical environmental areas. People want to stay connected to nature and are willing to take action to protect farms, waterways, ecosystems, and wildlife.
7. Strengthen and encourage growth in existing communities. Before we plow up more forests and farms, we should look for opportunities to grow in already built-up areas.
8. Provide a variety of transportation choices. People won’t get out of their cars unless they have another way to get where they’re going. More communities need safe and reliable public transportation, sidewalks, and bike paths.
9. Make development decisions predictable, fair, and cost-effective. Investors, developers, and builders wishing to implement smart growth need to earn a profit and should face fewer obstacles than those contributing to sprawl. Governments and communities should consider providing incentives and regulations for smarter development.
10. Encourage citizen and stakeholder participation in development decisions. Plans developed without strong citizen involvement have little staying power. When people feel left out of important decisions, they are less cooperative when tough measures must be taken.
The principles of smart growth are still evolving. In the last few years, for example, smart growth advocates have paid more attention to the effect of buildings on the environment and our well-being. If housing units or other buildings in a neighborhood are substandard, people
will not want to stay, regardless of how well the area is laid out. How buildings are constructed directly affects the consumption of energy and other resources, as well as the quality of water and air. Likewise, there has been a growing recognition within the green building field that sustainability is not just about how buildings are constructed, but also about where they are constructed. These lines of thinking culminated in a partnership among the U.S. Green Building Council, the Natural Resources Defense Council, the EPA, and the Congress for the New Urbanism to formulate Leadership in Energy & Environmental Design for Neighborhood Development (LEED—ND) standards, which can define and evaluate smart growth communities. A pilot phase was launched in late 2006.110
Environmental and Fiscal Benefits of Smart GrowthSmart growth practices have been proven to cut down auto use and to create tangible environmental benefits. A 2005 Seattle study found that residents of neighborhoods where land uses were mixed and streets were better connected traveled 26 percent fewer vehicle miles than residents of neighborhoods that were more dispersed and less connected.111 Likewise, a New Jersey study found that, compared with dispersed development patterns, compact development would reduce water pollution by 40 percent.112 In addition, a 2002 study in Chicago, Los Angeles, and San Francisco demonstrated that families living in sprawl own three times as many cars and drive four times as much as families of the same size and income living in location-efficient neighborhoods.113 Similar research concluded that in a compact city, every additional passenger-kilometer traveled on public transit translates into an 8- to 10-kilometer reduction in citywide driving.114
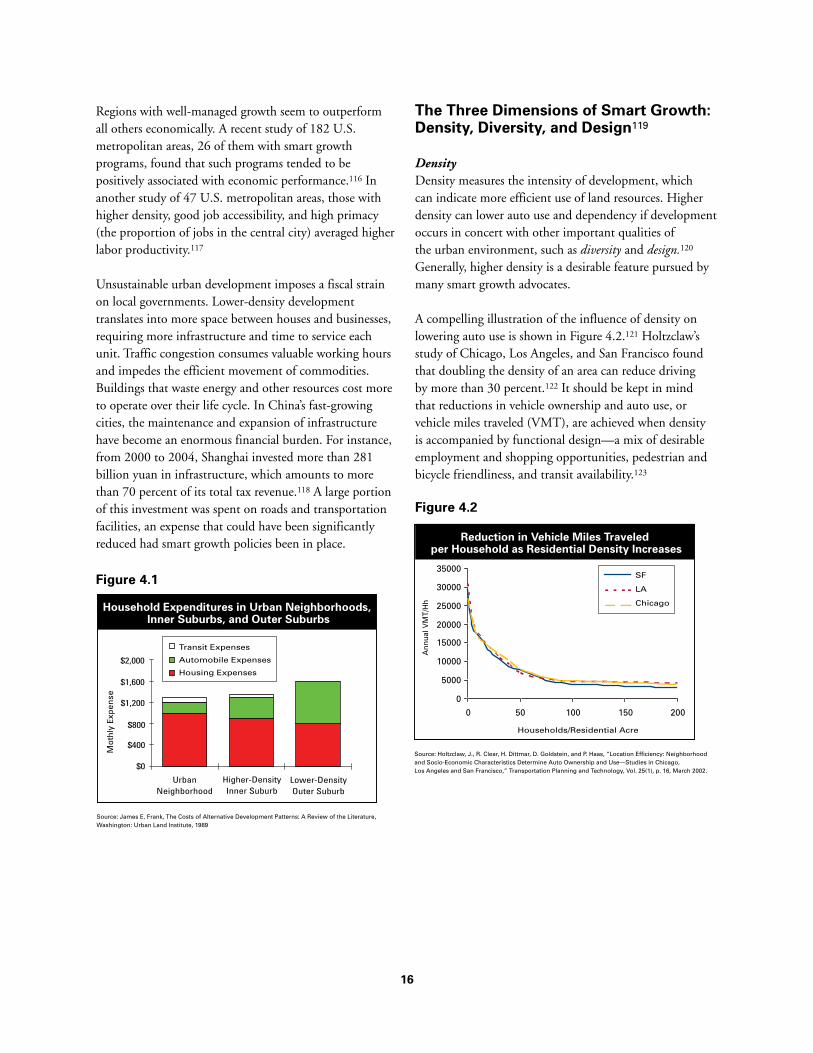
Studies have shown that by locating development closer to existing urban centers, the costs of building streets and installing and operating water, sewer, and other public services can be reduced by about 80 percent, compared with providing streets and services to far-flung, sprawling development.115 Furthermore, as depicted in Figure 4.1, studies have found that per-household transportation expenditures tend to be lower for residents in compact communities than for those in sprawling, auto-dependent ones.
16
Regions with well-managed growth seem to outperform all others economically. A recent study of 182 U.S. metropolitan areas, 26 of them with smart growth programs, found that such programs tended to be positively associated with economic performance.116 In another study of 47 U.S. metropolitan areas, those with higher density, good job accessibility, and high primacy (the proportion of jobs in the central city) averaged higher labor productivity.117
Unsustainable urban development imposes a fiscal strain on local governments. Lower-density development translates into more space between houses and businesses, requiring more infrastructure and time to service each unit. Traffic congestion consumes valuable working hours and impedes the efficient movement of commodities. Buildings that waste energy and other resources cost more to operate over their life cycle. In China’s fast-growing cities, the maintenance and expansion of infrastructure have become an enormous financial burden. For instance, from 2000 to 2004, Shanghai invested more than 281 billion yuan in infrastructure, which amounts to more than 70 percent of its total tax revenue.118 A large portion of this investment was spent on roads and transportation facilities, an expense that could have been significantly reduced had smart growth policies been in place.
Figure 4.1
The Three Dimensions of Smart Growth: Density, Diversity, and Design119
DensityDensity measures the intensity of development, which can indicate more efficient use of land resources. Higher density can lower auto use and dependency if development occurs in concert with other important qualities of the urban environment, such as diversity and design.120 Generally, higher density is a desirable feature pursued by many smart growth advocates.
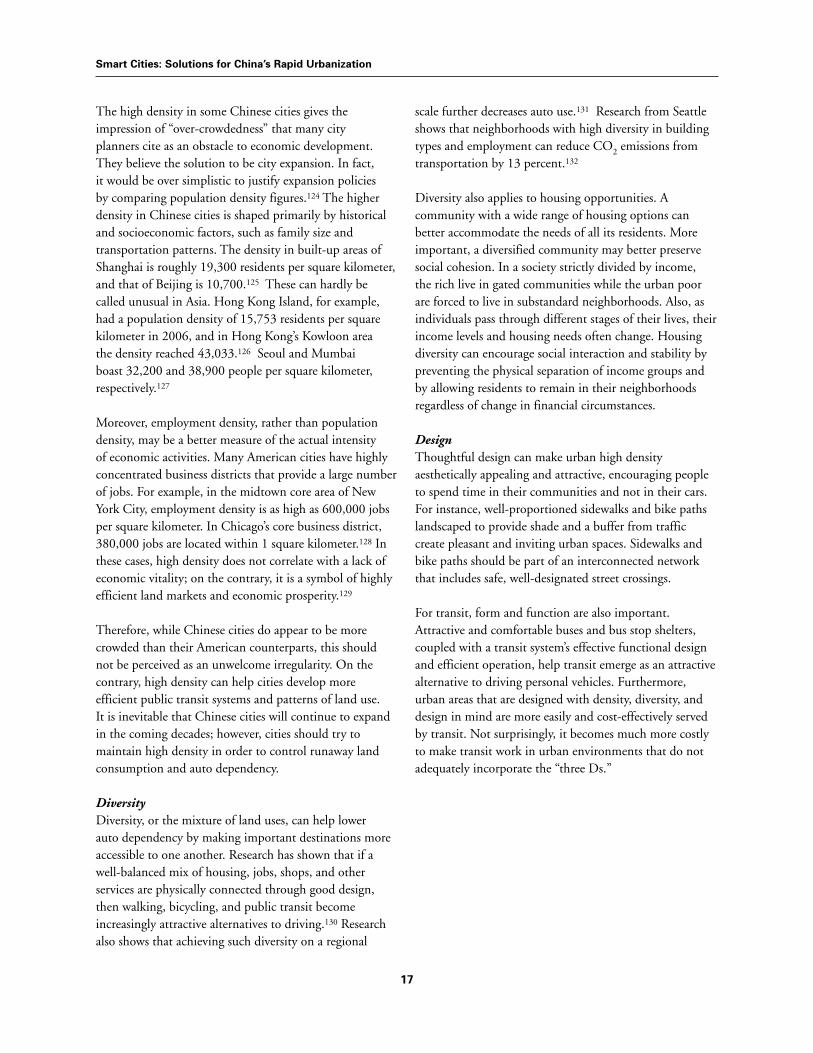
A compelling illustration of the influence of density on lowering auto use is shown in Figure 4.2.121 Holtzclaw’s study of Chicago, Los Angeles, and San Francisco found that doubling the density of an area can reduce driving by more than 30 percent.122 It should be kept in mind that reductions in vehicle ownership and auto use, or vehicle miles traveled (VMT), are achieved when density is accompanied by functional design—a mix of desirable employment and shopping opportunities, pedestrian and bicycle friendliness, and transit availability.123
Figure 4.2
Household Expenditures in Urban Neighborhoods, Inner Suburbs, and Outer Suburbs
Source: James E. Frank, The Costs of Alternative Development Patterns: A Review of the Literature, Washington: Urban Land Institute, 1989
$2,000
$1,600
$1,200
$800
$400
$0
UrbanNeighborhood
Mot
hly
Expe
nse
Higher-DensityInner Suburb
Lower-DensityOuter Suburb
Transit Expenses
Automobile Expenses
Housing Expenses
Reduction in Vehicle Miles Traveled per Household as Residential Density Increases
Source: Holtzclaw, J., R. Clear, H. Dittmar, D. Goldstein, and P. Haas, “Location Efficiency: Neighborhood and Socio-Economic Characteristics Determine Auto Ownership and Use—Studies in Chicago, Los Angeles and San Francisco,” Transportation Planning and Technology, Vol. 25(1), p. 16, March 2002.
Ann
ual V
MT/
Hh
Households/Residential Acre
SF
LA
Chicago
0
5000
10000
15000
20000
25000
30000
35000
0 50 100 150 200
Smart Cities: Solutions for China’s Rapid Urbanization
17
The high density in some Chinese cities gives the impression of “over-crowdedness” that many city planners cite as an obstacle to economic development. They believe the solution to be city expansion. In fact, it would be over simplistic to justify expansion policies by comparing population density figures.124 The higher density in Chinese cities is shaped primarily by historical and socioeconomic factors, such as family size and transportation patterns. The density in built-up areas of Shanghai is roughly 19,300 residents per square kilometer, and that of Beijing is 10,700.125 These can hardly be called unusual in Asia. Hong Kong Island, for example, had a population density of 15,753 residents per square kilometer in 2006, and in Hong Kong’s Kowloon area the density reached 43,033.126 Seoul and Mumbai boast 32,200 and 38,900 people per square kilometer, respectively.127
Moreover, employment density, rather than population density, may be a better measure of the actual intensity of economic activities. Many American cities have highly concentrated business districts that provide a large number of jobs. For example, in the midtown core area of New York City, employment density is as high as 600,000 jobs per square kilometer. In Chicago’s core business district, 380,000 jobs are located within 1 square kilometer.128 In these cases, high density does not correlate with a lack of economic vitality; on the contrary, it is a symbol of highly efficient land markets and economic prosperity.129
Therefore, while Chinese cities do appear to be more crowded than their American counterparts, this should not be perceived as an unwelcome irregularity. On the contrary, high density can help cities develop more efficient public transit systems and patterns of land use. It is inevitable that Chinese cities will continue to expand in the coming decades; however, cities should try to maintain high density in order to control runaway land consumption and auto dependency.
DiversityDiversity, or the mixture of land uses, can help lower auto dependency by making important destinations more accessible to one another. Research has shown that if a well-balanced mix of housing, jobs, shops, and other services are physically connected through good design, then walking, bicycling, and public transit become increasingly attractive alternatives to driving.130 Research also shows that achieving such diversity on a regional
scale further decreases auto use.131 Research from Seattle shows that neighborhoods with high diversity in building types and employment can reduce CO2 emissions from transportation by 13 percent.132
Diversity also applies to housing opportunities. A community with a wide range of housing options can better accommodate the needs of all its residents. More important, a diversified community may better preserve social cohesion. In a society strictly divided by income, the rich live in gated communities while the urban poor are forced to live in substandard neighborhoods. Also, as individuals pass through different stages of their lives, their income levels and housing needs often change. Housing diversity can encourage social interaction and stability by preventing the physical separation of income groups and by allowing residents to remain in their neighborhoods regardless of change in financial circumstances.
DesignThoughtful design can make urban high density aesthetically appealing and attractive, encouraging people to spend time in their communities and not in their cars. For instance, well-proportioned sidewalks and bike paths landscaped to provide shade and a buffer from traffic create pleasant and inviting urban spaces. Sidewalks and bike paths should be part of an interconnected network that includes safe, well-designated street crossings.
For transit, form and function are also important. Attractive and comfortable buses and bus stop shelters, coupled with a transit system’s effective functional design and efficient operation, help transit emerge as an attractive alternative to driving personal vehicles. Furthermore, urban areas that are designed with density, diversity, and design in mind are more easily and cost-effectively served by transit. Not surprisingly, it becomes much more costly to make transit work in urban environments that do not adequately incorporate the “three Ds.”
Smart Cities: Solutions for China’s Rapid Urbanization
18
CHAPTER 5
Recommended Smart Growth Policies
Vehicle RegistrationAuto ownership is one of the strongest determinants of auto use. Research shows that auto ownership and use is principally correlated with income.133 But it can also be strongly influenced by government policies, including private-vehicle registration and financing programs. As Chinese urban income reaches a critical level, it may be necessary for certain cities to institute policies to curb the explosion of auto ownership.
Shanghai uses high registration fees and a public bidding process to limit the number of cars on the road. The average price of registration in Shanghai in early 2005 was more than 37,000 yuan ($4,500).134 However, this price is based on the Shanghai market, and drivers can register in surrounding cities for one-tenth the cost.135 Increased enforcement to ensure registration in a given city is granted only to that city’s residents alongside local parking restrictions on vehicles registered outside of that locality can help assure that the registration system works as is intended.
Congestion Pricing One of the most effective ways to moderate the use of private automobiles is to properly price the social and
environmental costs of driving. Government investments in road construction and parking spaces constitute implicit subsidies to drivers, yet drivers are not paying for the air pollution, congestion, and noise they produce. Schemes such as congestion pricing can help to recoup these costs. In addition, congestion pricing programs can help ensure that new roads are not overrun by personal vehicles and that extra capacity can be preserved for freight, commerce and mass transit.
Congestion pricing has been implemented in Singapore and London, where fees are charged as cars enter the downtown area. These fees are easy to pay online or in advance and are strictly enforced. The scheme aims to alleviate congestion and pollution and to raise funds for the transportation system.
London’s experience has been a huge success. Since 2003, officials say, traffic has decreased by 15 percent and now moves an average of 37 percent faster.136 Bus schedules have become far more reliable, and there has been a measured increase in cycling.137 This is not surprising; queuing theory and the effects of network capacity under conditions of extreme congestion are well known. Once network traffic approaches 90 percent of capacity,
In order for smart growth principles to successfully help China achieve sustainable
urban development, they must be applicable to Chinese cities and Chinese laws
and policies governing urban development. Based on the analysis of the previous
chapters, we recommend the following specific smart growth strategies for urban
development in China.
Smart Cities: Solutions for China’s Rapid Urbanization
19
delays skyrocket and travel speeds decline exponentially. Conversely, relatively small reductions in total network loading result in significant improvements in traffic flow and average speeds.
At least one Chinese city, Shanghai, is considering a congestion pricing regime. During his visit to London in 2003, Shanghai Mayor Han Zheng was reported to be “inspired by the congestion charge system,” deeming it a possible solution to Shanghai’s ever-growing congestion problem.138
Parking ManagementThe availability and cost of parking are among the most significant factors influencing a person’s decision to drive to a given destination.139 Providing generous amounts of free or low-cost parking encourages people to choose driving over mass transit or other more socially and environmentally beneficial modes of travel. Furthermore, requiring new development to provide large amounts of parking pushes new growth out to the edges of the city.
Managing parking for smart growth represents a paradigm shift in which motorists’ interests are no longer the highest priority. Parking should be properly priced for more efficient use, and where land resources are scarce, the availability of parking spaces should be limited so as to encourage walking, bicycling, and using public transit.
Shared parking facilities are one example of smart parking management; for instance, a restaurant can share parking with an office complex because peak parking demand occurs at different times for these uses. Higher parking fees are yet another option. A U.S. Department of Transportation study found that most vehicle parking in the United States is free or significantly subsidized. Of the 95 percent of U.S. employees who commute by automobile, only 5 percent pay full parking costs, 9 percent pay a subsidized rate, and parking is free at more than 98 percent of non-commute trip destinations.140 Charging the real cost of parking would provide significant revenue and pass on some of the true cost of using cars to drivers.
Some Chinese cities, such as Guangzhou and Beijing, are using parking fees to manage car use. Beijing plans to restrict the availability of parking spaces and charge higher parking fees. Beijing has also constructed large parking
facilities in key areas where drivers can transfer easily to public transportation.141
Investing in Public TransitWhile it is important to impose the real costs of auto use on drivers, providing efficient alternatives may prove to be more crucial in encouraging people to seek other modes of transportation. Many cities in China have been investing heavily in public transit. In Beijing, construction of four new subway lines is under way, and three of them will be completed before the 2008 Olympics, tripling the total light rail mileage of Beijing to 186 miles (300 km).142
Shanghai has also formulated an ambitious metro plan. By the 2010 World Exposition, Shanghai plans to increase its current 53 miles (85 km) of metro lines nearly fivefold, to more than 248 miles (400 km).143 Currently, six cities in mainland China have subway systems in operation. By 2010, it is expected that another eight cities will have them as well.144
So far, subways and light rail are the two preferred modes of public transit. It is estimated that city governments around China have invested more than 120 billion yuan ($15 billion) in subway and light rail construction. While it is an encouraging sign of commitment to public transit, the huge investment has become a financial burden. A less expensive alternative could be a Bus Rapid Transit (BRT) system, such as the one established in Curitiba, Brazil (see “Curitiba, Brazil: Designing Transportation to Grow Alongside Population,” sidebar).
By using articulated and biarticulated buses on separate lanes, a BRT system can significantly enhance the capacity of traditional buses while costing only a fraction of the investment required for subways or light rail. In 2004, Shenyang, the capital city of northeast China’s Liaoning Province, decided to abandon its 10 billion yuan ($1.2 billion) subway project, which had been stalled for financial reasons for 10 years, and turn to a BRT system instead.145 Beijing has successfully operated a BRT system since December 2004 and has overcome early operational challenges. Kunming has a similar BRT system that has faced challenges in integrating with the existing transit network. Approximately a dozen Chinese cities are implementing or incorporating elements of Bus Rapid Transit (e.g., signal preference and passenger information systems).146
20
Given the context of an existing development pattern in China that emphasizes super-blocks and mega-boulevards, perhaps one option is to reclaim lanes in existing roadways from private vehicles and dedicate them to public transportation.
Curitiba, Brazil: Designing Transportation to Grow
Alongside Population
In 1964, the Brazilian city of Curitiba began an effort to integrate traffic management, transportation, and land-use planning to meet the needs of its growing population. The effort resulted in the creation of high-density population corridors able to sustain public transit, which in turn was made more accessible, affordable, sustainable, and cleaner in order to encourage ridership. Simultaneously, the city center was closed to cars.
In the 1980s, Curitiba invested in express bus lanes along five axes and bumped up the capacity of its fleet to include articulated and biarticulated buses that carry approximately one million passengers per day. Curitiba has found that the bus- only lanes are able to carry twice as many passengers as buses in regular traffic. As part of its bus rapid transit (BRT) system, the city improved bus stops, elevating platforms and placing turnstiles and ticket handlers at the stations rather than on the buses. This way, the stops are made in one-fourth the time of conventional bus stops and can accommodate up to 70 people getting on and off.
As a result of this flexible transit system, Curitiba’s transportation sector consumes 20 percent less energy than other cities of similar size, (approximately 2.7 million people). Seventy percent of daily commutes are made by public transportation.
Source: Beatley, Timothy, “Green Urbanism: Learning from European Cities” (Washington, DC, Island Press, 2000)
Promoting Walking and CyclingCities can promote sustainable modes of transportation by investing in space and amenities for bicyclists and pedestrians. Road lanes can be designated for cyclists; streets can be closed to traffic to provide pleasant spaces for pedestrians and bikes; pedestrian paths and sidewalks can be built as a complete network to ensure access to all areas of a region; and crosswalks and overpasses can make it easier to cross busy roads.
Another strategy is to build “green connectors”—networks of pedestrian- and bicycle-friendly avenues that feed into major transit routes—as replacements for asphalt jungles that take up valuable space. Green connectors have had enormous success in European and Latin American cities, including Stockholm and Bogota.147
Most Chinese city planners have shown a preference for 12-lane highways over human-scale sidewalks. These monumental highways were promoted for their perceived function of alleviating traffic congestion, yet studies have shown that expanding roads does not automatically solve traffic problems. “Induced traffic,” additional traffic attracted by the new lanes, will eventually clog the roads again, and the total capacity of the network will not be enhanced if measures are not taken to alleviate bottlenecks elsewhere.148
Urban RedevelopmentIn order to maintain high density, abandoned or underused lots in urban areas should be redeveloped before cities spread beyond their existing limits.
One example of urban redevelopment is in Beijing’s Dashanzi area, where abandoned industrial facilities have been transformed into artists’ residences, performance spaces, galleries, and restaurants. One facility, Factory 798 (www.798space.com), is a former electronic production site that was shut down in the 1980s and reopened in 2002 as an artists’ community.149 Dashanzi demonstrates how areas in urban centers can be reused, thereby preserving historic landmarks, avoiding expansion into undeveloped areas, maintaining high density, and making use of existing public transit.
Another recent example of urban redevelopment is the Xintiandi Project in Shanghai. As the following case study illustrates, adopting smart growth principles for market-driven redevelopment can be highly profitable.
Smart Cities: Solutions for China’s Rapid Urbanization
21
Case Study: Xintiandi—The Private Sector in Urban Redevelopment The Xintiandi Project is a model of private investment in an urban redevelopment project, in which a shrewd developer chose to preserve historical buildings in order to maximize his profits.
Traditional Shanghai architecture, a mix of Western and Chinese elements, is called Shikumeng. In the early 20th century, the red tiles of Shikumeng blocks dominated Shanghai’s skyline. Today, after decades of construction, only patches of Shikumeng survive, and most of the remaining buildings are deteriorating, sparking fears that Shanghai’s unique architectural style is becoming lost in the modernization process.
In 2001, a Hong Kong developer bought several blocks of Shikumeng in downtown Shanghai and decided to selectively rehabilitate existing buildings instead of tearing them down. Former residences of ordinary Shanghai citizens now house some of Shanghai’s trendiest restaurants, art galleries, and high-end retailers, in two car-free blocks.
The cost of preservation can be extremely high. The developer in this case invested more than $75 million to rebuild just two small blocks, a cost of well over $200 per square foot.150 Many critics doubted the profitability of the project, and in the beginning it did indeed lose money.151
Yet the developer’s decision would later payoff, because he also owned several adjacent neighborhoods and planned to develop them as high-density residential projects. By creating the hottest spot in the city, he boosted the local real estate market. The district now commands Shanghai’s highest commercial rents and residential housing prices.152
Despite its commercial success, the Xintiandi Project is not immune to controversy. Critics argue that the original residential function of the buildings was sacrificed for new commercial goals.153 Longtime residents, driven out by inflated housing prices, are not likely to come back and enjoy the revitalized area, and with them the neighborhood’s traditional lifestyle and sense of community are lost. On the other hand, proponents suggest that commercially oriented development at least provides some funding and incentives for the preservation of historic architecture.154 Otherwise, in all likelihood these buildings would have most likely been demolished by the government or other real estate developers. Moreover, as the city evolves, it is difficult and inefficient to maintain the historic functions of every urban district. If Shikumeng's residential functions have gradually eroded, it would be natural to replace them with other functions more likely to succeed.
The Xintiandi Project exemplifies several smart growth principles. Its rehabilitation and reuse of historic buildings help preserve Shanghai’s unique architectural style. Its car-free, individualist commercial development fosters an attractive and walkable atmosphere. Its high-density, mixed land-use pattern not only reduces transportation costs but also makes urban revitalization profitable. Though its influence on the traditional lifestyle and culture is more debatable, the redevelopment project provides an interesting example of how market influences may steer development toward smart growth.
Regional Planning and Public InvolvementPlanning on a regional scale enables cities to take into account the broad environmental, social, and economic impacts of transportation and land-use decisions. To achieve smart, sustainable growth, the appropriate planning bureaus need to coordinate land-use and transportation planning, infrastructure investments, and revenue-sharing efforts at the regional level.155 It is helpful to coordinate these efforts through the creation of a strong and compelling regional vision.156
Regional planning is the best way to envision, comprehend, and manage the growth of cities and the
Redeveloped Xin-tian-di commercial district, Shanghai
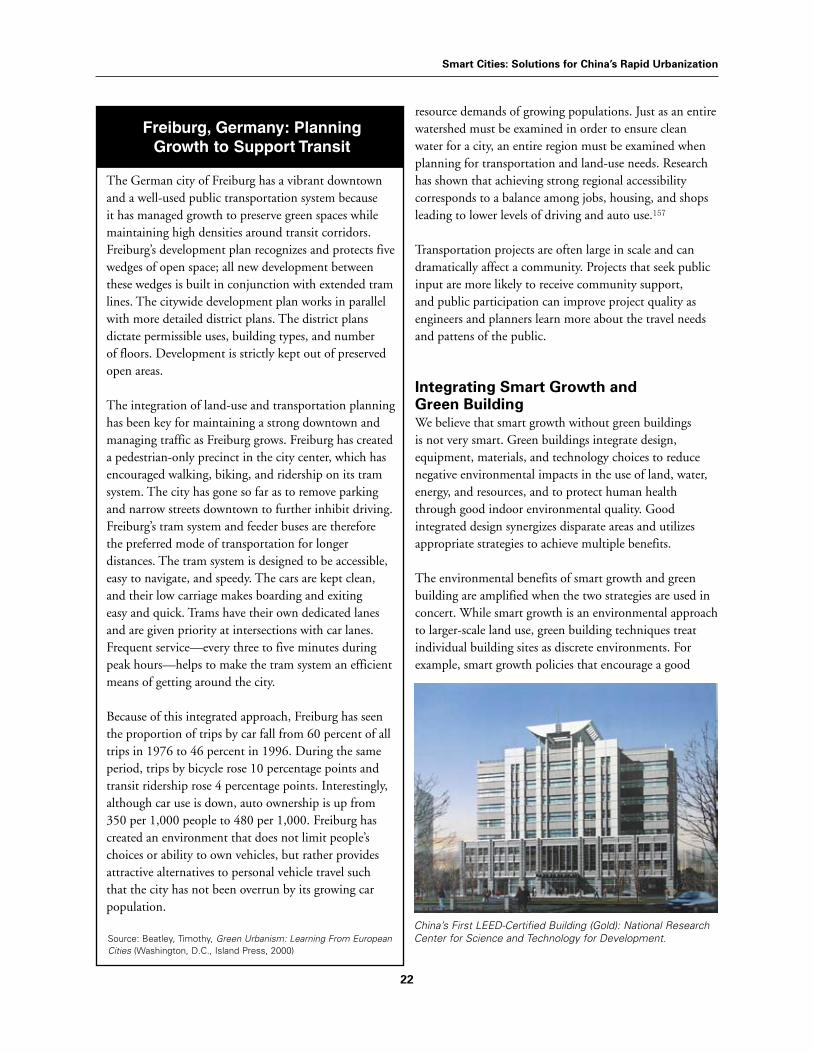
Smart Cities: Solutions for China’s Rapid Urbanization
22
Freiburg, Germany: Planning
Growth to Support Transit
The German city of Freiburg has a vibrant downtown and a well-used public transportation system because it has managed growth to preserve green spaces while maintaining high densities around transit corridors. Freiburg’s development plan recognizes and protects five wedges of open space; all new development between these wedges is built in conjunction with extended tram lines. The citywide development plan works in parallel with more detailed district plans. The district plans dictate permissible uses, building types, and number of floors. Development is strictly kept out of preserved open areas.
The integration of land-use and transportation planning has been key for maintaining a strong downtown and managing traffic as Freiburg grows. Freiburg has created a pedestrian-only precinct in the city center, which has encouraged walking, biking, and ridership on its tram system. The city has gone so far as to remove parking and narrow streets downtown to further inhibit driving. Freiburg’s tram system and feeder buses are therefore the preferred mode of transportation for longer distances. The tram system is designed to be accessible, easy to navigate, and speedy. The cars are kept clean, and their low carriage makes boarding and exiting easy and quick. Trams have their own dedicated lanes and are given priority at intersections with car lanes. Frequent service—every three to five minutes during peak hours—helps to make the tram system an efficient means of getting around the city.
Because of this integrated approach, Freiburg has seen the proportion of trips by car fall from 60 percent of all trips in 1976 to 46 percent in 1996. During the same period, trips by bicycle rose 10 percentage points and transit ridership rose 4 percentage points. Interestingly, although car use is down, auto ownership is up from 350 per 1,000 people to 480 per 1,000. Freiburg has created an environment that does not limit people’s choices or ability to own vehicles, but rather provides attractive alternatives to personal vehicle travel such that the city has not been overrun by its growing car population.
Source: Beatley, Timothy, Green Urbanism: Learning From European Cities (Washington, d.C., island Press, 2000)
resource demands of growing populations. Just as an entire watershed must be examined in order to ensure clean water for a city, an entire region must be examined when planning for transportation and land-use needs. Research has shown that achieving strong regional accessibility corresponds to a balance among jobs, housing, and shops leading to lower levels of driving and auto use.157
Transportation projects are often large in scale and can dramatically affect a community. Projects that seek public input are more likely to receive community support, and public participation can improve project quality as engineers and planners learn more about the travel needs and pattens of the public.
Integrating Smart Growth and Green Building We believe that smart growth without green buildings is not very smart. Green buildings integrate design, equipment, materials, and technology choices to reduce negative environmental impacts in the use of land, water, energy, and resources, and to protect human health through good indoor environmental quality. Good integrated design synergizes disparate areas and utilizes appropriate strategies to achieve multiple benefits.
The environmental benefits of smart growth and green building are amplified when the two strategies are used in concert. While smart growth is an environmental approach to larger-scale land use, green building techniques treat individual building sites as discrete environments. For example, smart growth policies that encourage a good
China’s First LEED-Certified Building (Gold): National Research Center for Science and Technology for Development.
Smart Cities: Solutions for China’s Rapid Urbanization
23
balance of jobs and housing are complemented by building architecture that makes the relation of the building to the street and sidewalk inviting and attractive. In addition, the proximity of the building to public transportation decreases the use of cars by the workers and visitors to the building.
Neighborhood-scale protection of watersheds can be enhanced by site-level treatments. Street and public landscaping strategies that allow percolation and filtration of stormwater are enhanced by building site techniques that reduce erosion, capture stormwater, and treat it before discharge or onsite reuse.
Neighborhood amenities such as street trees and shading of public parking also reduce urban heat islands that drive significant air-conditioning and thus energy use in buildings. Building techniques such as green roofs also reduce urban heat islands, making neighborhoods more comfortable. The location and design of parking is another way that building architecture complements smart growth in neighborhoods.
Techniques that policymakers can use to promote synergies between green buildings and smart growth include giving green building developers higher density allowances around transportation hubs and providing incentives for mixed-use development that combines residential and commercial uses in the same structure along transit corridors. Large-scale developments should also be given incentives to promote the construction of green buildings.
With support from local government, utility companies should also be engaged in providing incentives for smart growth and green building development. Smart growth neighborhoods that are more compact require much less investment in local infrastructure—transformers and cabling for electricity, water pumping, sewer, and stormwater piping for water utilities. Fees to connect to the main networks for such projects and buildings are also lower. Advanced green buildings equipped with solar photovoltaic cells and other efficiency measures can at times operate “grid neutral” — i.e. depending on the weather and electricity demand, a building can take or give back to the grid.
Smart Cities: Solutions for China’s Rapid Urbanization
24
Chinese municipal authorities should:
Continue investing in public transit. Governmental resources should be diverted from highways to public transportation. While subways and light rail are popular forms of public transit and can form the backbone of an integrated transport network, BRT may be the most cost-effective alternative for many cities.
Maintain high density and redevelop urban areas. High density and economic strength can go hand in hand. The mixed land-use pattern and high densities already present in many Chinese cities are desirable characteristics of smart growth.
Promote walking and cycling. Walking and cycling should be encouraged as attractive, effective forms of transportation. Bicycle lanes and sidewalks should be constructed to ensure accessibility while minimizing conflicts with other modes of transportation.
Discourage car use. While discouraging car ownership through policies of limiting car registration can help reduce congestion and pollution, the fundamental objective should be to restrain actual car use through a combination of carrots and sticks.
Internalize the social and environmental costs of driving and parking. Proper pricing schemes (such as congestion fees) and better parking management can limit excessive vehicle use.
Plan regionally and involve the public. Planning on a regional scale enables cities to account for the broad impacts of transportation and land-use decisions. Public participation can help planners better understand the needs of the community and avoid possible misjudgments and potential conflicts.
Develop and promote energy- and water-efficient green buildings. Governments should give green builders higher density allowances around transportation hubs. Developers should be given incentives for mixed-use projects that combine residential and commercial uses in the same structure along transit corridors.
We sincerely hope that the policies and visions outlined in this paper will help planners better manage the rapid development of Chinese cities. We are optimistic that by following these recommendations, Chinese cities will grow “smart” and improve the lives of urban dwellers by meshing economic growth with environmental protection.
China’s rapid urbanization has set off a boom in construction across the
nation. Cities are constructing buildings and roads at an unprecedented
rate, consuming farm land in hundreds of thousands of acres per year. Low-
density development can be seen in many places, which, coupled with a growing fleet
of privately owned cars, has the potential to lock China in car and oil dependency. To
realize sustainable development in China, it is of utmost importance to learn from the
adverse effects of urban sprawl in the United States, and to conversely implement a
smart growth policy. We believe the following recommendations, drawn up from the
principles of smart growth, are the most applicable and effective for Chinese cities.
CONCLUSION
Smart Cities: Solutions for China’s Rapid Urbanization
25
Endnotes
1 The Fourth National Population Census, National Bureau of Statistics of China, 1990; 2006 Annual Report of Statistics on China’s Social and Economic Development, National Bureau of Statistics of China, Beijing, February 28, 2007.
2 At least 15 million farmers and other rural residents are expected to migrate into Chinese cities every year from now until 2020. “China Land Policy Program—Land Issues in China,” National Center for Smart Growth Research & Education, www.smartgrowth.umd.edu/chinalandpolicyprogram/landissuesinchina-whychinawhynow.htm [accessed June 13, 2005].
3 Economy, Elizabeth, The River Runs Black: The Environmental Challenge to China’s Future, Ithaca: Cornell University Press, 2004.
4 China Statistical Yearbook 2004, National Bureau of Statistics of China, China Statistics Press, Table 4-1, 2004.
5 The World Factbook: China, Central Intelligence Agency, www.cia.gov/cia/publications/factbook/geos/ch.html [accessed June 8, 2005].
6 Ibid.
7 Population Statistics, China Population Net, www.chinapop.gov.cn/rkzh/zgrk/tjgb/t20040326_2828.htm [accessed June 27, 2005].
8 Bruce, L., J. Qian, and R. Watson, “Chinese Cities at a Crossroads: The Need for Smart Growth,” Natural Resources Defense Council, December 2004, www.chinacleanenergy.org [accessed June 27, 2005].
9 Gifford, Rob. “Reforms Urged to Ease Chinese Urban-Rural Income Gap,” National Public Radio, February 13, 2004.
10 China Statistical Yearbook 2004, See supra note 4 at Table 4-1.
11 Ding, Chengri. “Effects of Land Acquisition on China’s Economic Future,” Land Lines Newsletter, January 2004, www.lincolninst.edu/pubs/pub-detail.asp?id=872 [accessed September 19, 2004].
12 Ibid.
13 Ibid.
14 China Statistical Yearbook 2004, See supra note 4 at Table 11-1.
15 “Experts: China’s Urbanization Rate Tipped to Rise,” Guangming Daily, July 19, 2002.
16 Calculated from data on population and per capita living space given in China Statistical Yearbook 2004.
17 “New Residential Construction in September 2004,” U.S. Department of Commerce and U.S. Department of Housing and Urban Development, U.S. Census Bureau Joint Release CB04-182October 19, 2004, www.census.gov/const/newresconst_0409.pdf [accessed October 14, 2005].
18 China Statistical Yearbook 2004, See supra note 4 at Table 2-3.
19 American Housing Survey for the United States, U.S. Census Bureau, 2003.
20 ECOTEC Research and Consulting, Ltd., State of European Cities Report, contracted by the European Commission, p. 94, May 2007, http://ec.europa.eu/regional_policy/sources/docgener/studies/pdf/urban/stateofcities_2007.pdf [accessed September 17, 2007]
21 Calculated from the statistics provided by the Statistics Bureau of the Ministry of Internal Affairs and Communications of Japan,
www.stat.go.jp/english/data/figures/index.htm [accessed September 20, 2007]
22 Ho, Samuel P. S., and George C. S. Lin, “Converting Land to Nonagricultural Use in China’s Coastal Provinces: Evidence From Jiangsu,” Modern China, Vol. 30, No. 1, January 2004, pp. 81–112.
23 Ibid.
24 Huang, Yan, “Urban Spatial Patterns and Infrastructure in Beijing,” Lincoln Institute of Land Policy, October 2004, www.lincolninst.edu/pubs/pub-detail.asp?id=969 [accessed July 23, 2005]
25 Newman, Peter, and Jeffrey Kenworth, Sustainability and Cities: Overcoming Automobile Dependence, Washington, D.C.: Island Press, 1999, p. 91.
26 Huang, 2004. See supra note 24.
27 “1991–2010 Beijing Municipality Master Plan,” Beijing Planning Committee, March 15, 2004, www.beijing.gov.cn/zw/ghxx/qtgh/t20040315_115265.htm [accessed June 2, 2005].
28 “Special Attention: Dormitory Town Tiantongyuan Under Siege,” Legal Evening News (China) cited by Xinhuanet.com, October 12, 2004, http://news.xinhuanet.com/house/2004-10/12/content_2079656.htm [accessed July 12, 2005].
29 Ding, Zhaowen, and Wenya Ding, “Thousands of Huilongguan Residents Are Trapped in the Dormitory Town,” Beijing News, July 5, 2004.
30 “Tongzhou: The Next Dormitory Town?”, World Commercial Review (China), September 22, 2004.
31 Ibid.
32 Ibid.
33 Ibid.
34 “Where to Move? How to Move?”, China News Weekly, March 28, 2005.
35 Regulation on the Selling and Purchasing of Public Housing, Ministry of Construction, Beijing Department of Land and Housing Management, 2004, No. 486.
36 China Statistical Yearbook 2004, See supra note 4 at Tables 16-28 and 16-29.
37 Ibid.
38 Estimates are based on data from China Statistical Yearbook 2004, Table 16-29, and the U.S. Bureau of Transportation Statistics, “Household, Individual, and Vehicle Characteristics,” Highlights of the 2001 National Household Travel Survey, www.bts.gov/publications/national_household_travel_survey/highlights_of_the_2001_national_household_travel_survey/ [accessed November 5, 2004].
39 Lienert, Dan. “The Rising Chinese Car Market,” Forbes.com, December 15, 2003, www.forbes.com/2003/12/15/cx_dl_1215feat.html [accessed November 5, 2004]
40 He, K., H. Huo, F. Q. Zhang, D. He, F. An, M. Wang, H. Gao, and M. P. Walsh, “Study on Energy Policies in China’s Road Transport I: Current Status and Future Trend of Oil Consumption and CO2 Emissions,” draft manuscript, 2003.
Smart Cities: Solutions for China’s Rapid Urbanization
26
41 “China Has More Than 12 Million Private Vehicles,” Asia Times Online, August 24, 2004, www.atimes.com.
42 “Staff Appraisal Report: China 3rd National Highway Project,” The World Bank, Transport Sector Unit, East Asia and Pacific Regional Office, April 15, 1998.
43 China Statistical Yearbook 2004, See supra note 4 at Table 11-10.
44 Highway Statistics 2003, Department of Transportation, Table HM-12.
45 “Department of Transportation: Chinese Highways Surpassed 30,000 Kilometers, No. 2 in the World,” Xinhuanet.com, http://news.xinhuanet.com/zhengfu/2004-10/27/content_2145160.htm [accessed July 11, 2005].
46 “Staff Appraisal Report: China 3rd National Highway Project,” April 15, 1998. See supra note 42.
47 China Statistical Yearbook 2004, See supra note 4 at Table 16-4.
48 Bradsher, Keith, “Banished Bicycles: China’s Car Culture Hits Some Potholes,” The New York Times, January 11, 2004.
49 “Bicycles Sill Rule but Less Popular in China,” People’s Daily, December 22, 2004.
50 Ibid.
51 Bodeen, Christopher, “Shanghai May Relent on Bicycle Ban,” Associated Press, February 24, 2004, http://www.enn.com/news/2004-02-24/s_13402.asp [accessed March 13, 2004].
52 Walsh, Michael, “Motor Vehicle Pollution and Fuel Consumption in China: The Long-Term Challenges,” Energy for Sustainable Development, Vol. 7, No. 4, pp. 28–38, December 2003.
53 Shanghai Statistical Yearbook 2000 and Shanghai Statistical Yearbook 2004, Shanghai Bureau of Statistics, www.stats-sh.gov.cn/2004shtj/tjnj/tjnj2003.htm [accessed June 30, 2007].
54 Szczensny, Joseph, “Chinese Auto Industry Slowed in ’04,” The Car Connection. January 24, 2005. Wang, Weiwei, “Domestic Auto-Buying Embracing New Trend,” China Economic Net, March 8, 2007, http://en.ce.cn/Insight/200703/08/t20070308_10621539.shtml [accessed March 30, 2007]
55 Liu, Zhi, and Gregory K. Ingram, “Vehicles, Roads, and Road Use: Alternative Empirical Specifications,” World Bank Policy Research Working Paper No. 2036, December 1998, http://ssrn.com/abstract=620551 [accessed July 18, 2005].
56 China Statistical Yearbook 2005, China Statistics Press, Table 10-2.
57 “Bank Loans Push Car Sales,” China Daily, January 2, 2004, www.china.org.cn/english/2004/Jan/83812.htm [accessed July 18, 2005].
58 “China’s Environment: A Great Wall of Waste,” The Economist, August 14, 2004.
59 “Results of Green GDP Accounting Research,” State Environmental Protection Administration of China and National Statistics Bureau of China, September 2006.
60 Kynge, James, “China Is the Workshop of the World. But It Is Becoming the Rubbish Tip Too,” Financial Times, July 27, 2004.
61 Li, Zhaojian and Jiang, Yi, “Pondering over the Situation of Domestic Generalized Building Energy Consumption”, Architectural Journal (Jianzhu Xuebao), Issue 7, 2006.
62 “Living on Earth,” National Public Radio, April 9, 2004, www.loe.org/shows/shows.htm?programID=04-P13-00015 [accessed June 17, 2005].
63 Li, Xinmin, “Pollution from Motor Vehicles in China and Control Strategies,” State Environmental Protection Administration of China, www.vecc-sepa.gov.cn [accessed December 2004].
64 “No Economic Fire Without Smoke?” The Economist, July 8, 2004.
65 Walsh, Michael, “Motor Vehicle Pollution and Fuel Consumption in China: The Long-term Challenges,” Energy for Sustainable Development, Vol. 7, pp. 28–38, December 2003.
66 See supra note 63.
67 State Environmental Protection Administration of China announced the entering into effect of China’s third stage emission standards for light duty vehicles on June 30, 2007. www.sepa.gov.cn/xcjy/zwhb/200706/t20070629_105911.htm [accessed September 18, 2007]
68 Zhou, Hongchang, and Daniel Sperling, “Transportation in Developing Countries: Greenhouse Gas Scenarios for Shanghai, China,” Pew Center on Global Climate Change, 2001.
69 Ibid.
70 “Driving to Green Buildings: The Transportation Energy Intensity of Buildings”, Environmental Building News, Vol. 16, No.9, September 2007. www.buildinggreen.com/articles/IssueTOC.cfm?Volume=16&Issue=9 [accessed September 24, 2007]
71 Initial National Communication on Climate Change, China Planning Press, 2004, Beijing, China.
72 Ibid.
73 Ibid.
74 Living on Earth, April 9, 2004. See supra note 62.
75 “Over 300 Million Chinese Drink Unreliable Water,” China News Agency, www.china.org.cn/chinese/kuaixun/736144.htm [accessed June 17, 2005].
76 “2004 National Environmental Statistics Report,” State Environmental Protection Administration of China, www.sepa.gov.cn/eic/649371571659472896/20050610/8632.shtml [accessed June 17, 2005].
77 Becker, Jasper, “China’s Growing Pains.” National Geographic, March 2004.
78 Li, Junqi, “Urban Run-off Problems and Sustainable Solutions,” China Water Network, www.h2o-china.com/report/rainwater/paper-li-1.htm [accessed June 17, 2005].
79 “Water Supply and Wastewater Treatment in China,” U.S. Department of Commerce, International Trade Administration, 2005.
80 Ibid.
81 Cervero, Robert, “Road Expansion, Urban Growth, and Induced Travel: A Path Analysis,” Journal of the American Planning Association, Spring 2003.
82 Ibid.
83 Appleyard, Donald. Livable Streets. Berkeley, CA: University of California Press, 1981.
Smart Cities: Solutions for China’s Rapid Urbanization
27
84 “WHO Report Calls for Better Traffic Safety,” China Network, October 13, 2004, http://english.china.com/zh_cn/health/living_healthy/11020778/20041013/11913081.html [accessed January 20, 2005].
85 Feng, Zhang, “WHO Report Highlights Traffic Safety in China,” China Daily, October 12, 2004, http://www2.chinadaily.com.cn/english/doc/2004-10/12/content_381445.htm [accessed January 20, 2005].
86 “WHO Report Calls for Better Traffic Safety,” China Network, October 13, 2004, http://english.china.com/zh_cn/health/living_healthy/11020778/20041013/11913081.html [accessed January 20, 2005].
87 Ibid.
88 Appleyard, 1981. See supra note 83.
89 Zhao, W., “Total area of China’s agricultural land should not go below 1.5 Billion mu in future,” Xinhuanet.com, Beijing, 2005, www.creva.org.cn/show.aspx?id=1305&cid=8. One hectare equals 15 Chinese mu.
90 “Should Cities Forbid Motorcycles?” Nanfang Daily, www.nanfangdaily.com.cn/southnews/dd/nfrb/a11/200511050084.asp, November 5, 2005.
91 Brown, Lester R., Eco-Economy, Earth Policy Institute, 2001, www.earth-policy.org/Books/Eco_contents.htm.
92 “Villa Era Faces Cold Weather,” China Real Estate Newspaper, December 6, 2002.
93 Brown, 141. See supra note 91.
94 Brown, 136. See supra note 91.
95 Brown, 147. See supra note 91.
96 China Statistical Yearbook, various years, China Statistics Press.
97 “World Proved Reserves of Oil and Natural Gas—Most Recent Estimates,” Energy Information Administration, November 9, 2004, www.eia.doe.gov/emeu/international/reserves.html [accessed December 15, 2004].
98 International Energy Outlook 2004, Table A4, B4, and C4, Energy Information Administration.
99 Goodman, Peter S. “Car Culture Captivates China: Sales Boom Along With Potential Problems,” Washington Post, p, A01, March 8, 2004.
100 “China,” Country Analysis Briefs, Energy Information Administration, July 1, 2004, www.eia.doe.gov/emeu/cabs/china.html [accessed December 16, 2004].
101 International Petroleum Monthly, Table 1.4: “Total World Oil Supply, 1990–Present,” Energy Information Administration, November 19, 2004, www.eia.doe.gov/emeu/ipsr/t14.xls [accessed December 16, 2004].
102 Goodman, Peter S., “Car Culture Captivates China: Sales Boom Along With Potential Problems,” Washington Post, March 8, 2004, p. A01.
103 International Energy Outlook 2004, Energy Information Administration, April 2004, www.eia.doe.gov/oiaf/ieo/oil.html [accessed December 16, 2004].
104 There is a current debate about when exactly we will reach this point. Some say it could come by about 2009, others say by 2034.
105 International Energy Outlook 2004, Appendix A, International Energy Agency, April 2004, www.eia.doe.gov/oiaf/ieo/oil.html [accessed December 16, 2004].
106 Calculations based on International Energy Outlook 2004, Energy Information Administration, Appendix D and Tables A4, B4, and C4.
107 Ewing, R., and R. Cervero, “Travel and the Built Environment: A Synthesis,” Transportation Research Record, 1780, pp. 87–114, 2001.
108 U.S. Environmental Protection Agency, “About Smart Growth,” www.epa.gov/smartgrowth/about_sg.htm [accessed June 22, 2005].
109 “How Is Smart Growth Achieved?” Smart Growth America, www.smartgrowthamerica.com/sghowto.html [accessed June 28, 2005].
110 “LEED for Neighborhood Development Backgrounder,” U.S. Green Building Council, www.usgbc.org/Docs/LEEDdocs/LEED-ND%20Backgrounder.pdf [accessed July 12, 2005].
111 “What Are the Environmental Benefits of Smart Growth?” U.S. EPA, www.epa.gov/livability/topics/eb.htm#2 [accessed July 1, 2007].
112 Ibid.
113 Holtzclaw, J., R. Clear, H. Dittmar, D. Goldstein, and P. Haas, “Location Efficiency: Neighborhood and Socio-Economic Characteristics Determine Auto Ownership and Use—Studies in Chicago, Los Angeles and San Francisco,” Transportation Planning and Technology, Vol. 25(1), pp. 1–27, 2002.
114 Holtzclaw, J., “Does a Mile in a Car Equal a Mile on a Train? Exploring Public Transit’s Effectiveness in Reducing Driving,” Sierra Club, http://sierraclub.org/sprawl/articles/reducedriving.asp.
115 Frank, James E., The Costs of Alternative Development Patterns: A Review of the Literature, Washington, D.C.: Urban Land Institute, 1989.
116 Nelson, A., and D. Peterman, “Does Growth Management Matter? The Effect of Growth Management on Economic Performance,” Journal of Planning Education and Research, Vol. 19, pp. 277–185, 2000.
117 Cervero, R., “Efficient Urbanization: Economic Performance and the Shape of the Metropolis,” Lincoln Institute of Land Policy, Working Paper, 2000.
118 Tao, Dong, “Urban Construction, the Growing Burden,” New Fortune (China), April 15, 2005.
119 Much of this discussion is informed by the work of Robert Cervero, Reid Ewing, and Kara Kockelman, in particular, Ewing, R., and R. Cervero, “Travel and the Built Environment: A Synthesis,” Transportation Research Record, 1780, pp. 87–114, 2001.
120 In a study of density and auto use in Chicago, Los Angeles, and San Francisco, each doubling of residential density reduced household auto ownership by 33 percent (Chicago), 35 percent (Los Angeles), and 40 percent (San Francisco), and reduced vehicle miles traveled by 32 percent (Chicago), 35 percent (Los Angeles), and 43 percent (San Francisco). Holtzclaw, et al. “Location Efficiency: Neighborhood and Socio-Economic Characteristics Determine Auto Use—Studies in Chicago, Los Angeles and San Francisco,” Transportation Planning and Technology, Vol. 25, p. 14, 2002.
121 For a more complete discussion of studies that have shown how the built environment and the “three Ds” have influenced travel behavior in the United States, see Ewing, R., and R. Cervero,
Smart Cities: Solutions for China’s Rapid Urbanization
28
“Travel and the Built Environment: A Synthesis,” Transportation Research Record, 1780, pp. 87–114, 2001.
122 Holtzclaw, et al., “Location Efficiency: Neighborhood and Socio-Economic Characteristics Determine Auto Use—Studies in Chicago, Los Angeles and San Francisco”, Transportation Planning and Technology Vol. 25, p. 14, 2002.
123 Ibid.
124 Niu, Wenyuan, “2002–2003 Chinese City Development Report,” China Academy of Science, 2004.
125 Calculated from 2005 data by dividing urban population over built urban areas. China Statistical Yearbook 2006, National Bureau of Statistics of China, www.stats.gov.cn/tjsj/ndsj/2006/indexch.htm
126 Calculated from 2006 data provided by the Census and Statistics Department of the Hong Kong Government, www.censtatd.gov.hk/hong_kong_statistics/index.jsp [accessed September 18, 2007].
127 Bertaud, Alain, “Order Without Design,” Unpublished Paper, 2003.
128 “Employment Density in International Central Business Districts,” Demographia, www.demographia.com/db-intlcbddensa.htm [accessed June 11, 2005].
129 Ding, Chengri, “Do Chinese Cities Really Have Higher Density?” Unpublished Paper, 2005.
130 Ewing, R., and R. Cervero, “Travel and the Built Environment: A Synthesis,” Transportation Research Record, 1780, pp. 87-114, 2001.
131 Ibid.
132 Lawrence Frank et al., “The Urban Form and Climate Change Gamble”, Planning, Special Issue on Global Warming, August/September 2007.
133 Ingram, G. K., and Z. Liu, “Determinants of Motorization and Road Provision,” in Essays in Transportation Economics and Policy, Washington, D.C.: Brookings Institution Press, 1999.
134 Ding, Po, “Private Vehicles License Bidding Price Reached 37,355 Yuan,” Jiefang Daily, April 18, 2005.
135 “Out-of-town Auto Registration by Shanghai Buyers Arouses Government Concern,” Xinhuanet.com, February 25, 2004, www.chinaview.cn [accessed November 15, 2004].
136 “Radical Remedy Improves Traffic in London,” National Public Radio, 2005, www.npr.org/templates/story/story.php?storyId=4565140 [accessed March 30, 2005].
137 “Road Pricing Must Be on the Agenda, Says LTUC,” A2MediaGroup, www.a2mediagroup.com/?c=156&a=3356&sid=309be30a764e8f57188eebbb13a03437 [accessed March 27, 2005].
138 Watts, Jonathan, “Shanghai’s Mayor Inspired by Ken,” The Guardian, November 12, 2004, www.guardian.co.uk/congestion/story/0,12768,1349443,00.html [accessed July 6, 2005].
139 Shoup, Donald, The High Cost of Free Parking, APA Planners Press, Washington D.C., 2005. For more information on various management strategies that result in more efficient use of parking resources, see “Parking Management—Strategies for More Efficient Use of Parking Resources,” Online TDM Encyclopedia, www.vtpi.org/tdm/tdm28.htm
140 “Summary of Travel Trends: 1990 National Personal Transportation Survey,” Bureau of Transportation Statistics, USDOT, www.fhwa.dot.gov/ohim/nptspage.htm [accessed July 17, 2005].
141 “Beijing to Raise Downtown Car Parking Fees,” Xinhuanet.com, June 16, 2004, www.chinaview.cn [accessed November 1, 2004].
142 “Beijing Subway Lines Set for 2008 Completions,” China Daily, August 23, 2004, www.chinadaily.com.cn/english/doc/2004-08/23/content_367865.htm [accessed July 13, 2005].
143 Zhang, Yi, “Shanghai Hastens Rail Transit Construction,” Jiefang Daily, November 6, 2004, http://news.sh.soufun.com/2004-11-06/340438.htm [accessed July 13, 2005].
144 The six cities with subways currently in operation are Beijing, Shanghai, Tianjing, Guangzhou, Shenzhen, and Nanjing. Cities including Wuhan, Hangzhou, Qingdao, Shenyang, Chongqing, Chengdu, Xi’an, and Dalian also have plans for subways.
145 “Rapid Transit Beats Shenyang Metro,” China Daily, July 27, 2004, www.chinadaily.com.cn/english/doc/2004-07/27/content_351834.htm [accessed July13, 2005].
146 Darido, Georges, “Bus Rapid Transit Developments in China,” Federal Transit Administration, U.S. Department of Transportation, July 2006.
147 Cervero, Robert, “Road Expansion, Urban Growth, and Induced Travel”, Journal of the American Planning Association, Vol.69, No.2, Spring 2003, www.planning.org/newsreleases/pdf/Cervero.pdf [ accessed July 1, 2007].
148 For more discussions and research findings on induced traffic, see Darin Burleigh compiled online literature “Induced Traffic,” at http://userpages.chorus.net/burleigh/issues/traffic_bib.html [accessed July 13, 2005].
149 Yuankai, Tang, “798: Beijing’s Art Community,” www.bjreview.com.cn/200423/Nation-200423(C).htm [accessed January 31, 2005].
150 “The Reconstruction of Xintiandi,”, Xintiandi website, www.xintiandi.com/site/ibeCCtpSctDspRte.jsp?section=11160 [accessed June 6, 2005].
151 Hao, Hong,“Xintiandi: The Window to the City,” People’s Daily, East China News, September 21, 2001.
152 Ibid.
153 Ibid.
154 Ibid.
155 In the United States, land-use planning occurs at the local government level, while transportation planning occurs on a regional scale. Smart growth requires institutions to work on land-use and transportation issues on a regional scale. This can be in the form of regional master planning, tax-base sharing, or environmental regulations, for instance.
156 Cervero, Robert, Speech before the Australian Planning Association, 2001, www.uctc.net/papers/436.pdf [accessed June 22, 2005].
157 Ewing, R., and R. Cervero, 2001. See supra note 107.