Decarburization and Melting Behavior of Direct-reduced Iron · PDF file ·...
104
Decarburization and Melting Behavior of Direct-reduced Iron Pellets in Steelmaking Slag By Erfan Sharifi Kiasaraei A thesis submitted in conformity with the requirements for the degree of Master of Applied Science Materials Science and Engineering University of Toronto © Copyright by Erfan Sharifi 2010
Transcript of Decarburization and Melting Behavior of Direct-reduced Iron · PDF file ·...

Decarburization and Melting Behavior of Direct-reduced Iron Pellets in Steelmaking Slag
By
Erfan Sharifi Kiasaraei
A thesis submitted in conformity with the requirements for the degree of Master of Applied Science
Materials Science and Engineering University of Toronto
© Copyright by Erfan Sharifi 2010
ii
Decarburization and Melting Behavior of Direct-reduced Iron
Pellets in Steelmaking Slag
Erfan Sharifi Kiasaraei
Master of Applied Science
Department of Materials Science and Engineering
University of Toronto
2010
Abstract
An experimental study was undertaken to quantify the rate of DRI decarburization in a
steelmaking slag using the constant–volume pressure increase technique. Experiments were
conducted by dropping DRI pellets into molten slag at temperatures from 1500°C to 1600°C.
Further experiments were carried out in which the DRI pellets were preheated while the slag
temperature remained constant. The effect of initial carbon content and preheating temperature
of the DRI on the reaction rate was investigated. The decarburization of DRI appears to comprise
of two stages; reaction with the FeO of DRI, followed by further decarburization through the iron
oxide of slag. Carbon has a significant effect on the kinetics of both stages while the preheating
temperature mainly influences the rate of the reaction between FeO and carbon inside the pellet.

iii
Acknowledgments
I am heartily thankful to my supervisor, Prof. Mansoor Barati, whose encouragement, guidance
and support from the initial to the final level enabled me to develop an understanding of the
subject.
Also, I am indebted to many of my colleagues in our research group to support me both in
technical and experimental aspects of this work. In particular, I would like to thank Dr. Murray
D. Johnston for his remarkable support during the experimental period.
Lastly, I offer my regards and blessings to all of those who supported me in any respect during
the completion of the project.
Erfan Sharifi

iv
Table of Contents
Table of Contents ........................................................................................................................... iv
List of Figures ............................................................................................................................... vii
List of Tables ................................................................................................................................. xi
Chapter 1 Introduction.................................................................................................................1
Chapter 2 DRI-based Steelmaking ..............................................................................................3
2.1 Steel......................................................................................................................................3
2.2 Steelmaking Methods...........................................................................................................3
2.2.1 Blast Furnace (BF) ...................................................................................................4
2.2.2 Basic Oxygen Furnace .............................................................................................6
2.2.3 Electric Arc Furnace ................................................................................................8
2.3 DRI and Its Significance ....................................................................................................10
2.4 Continuous Steelmaking Using DRI ..................................................................................14
2.4.1 Plant Layout ...........................................................................................................15
2.4.2 CRISP Process .......................................................................................................16
2.4.2.1 Carbon Control...........................................................................................17
2.4.2.2 Carbon – FeO Relationship ........................................................................18
2.4.2.3 Refractory Profile.......................................................................................19
2.4.3 Benefits of CRISP Technology ..............................................................................21
2.5 Summary ............................................................................................................................24
Chapter 3 Kinetics of Metal/Slag Interactions .........................................................................25
3.1 Overview ............................................................................................................................25
3.2 Metal - Slag Reaction.........................................................................................................25
v
3.3 Visual Observations ...........................................................................................................26
3.4 Rate of Reaction between DRI/Fe-C and Slag ..................................................................30
3.4.1 Measurement Methods ...........................................................................................30
3.4.2 Gas Evolution Curves ............................................................................................31
3.4.3 Effect of Temperature ............................................................................................34
3.4.4 Effect of Drop Size ................................................................................................35
3.4.5 Effect of Carbon Content .......................................................................................36
3.4.6 Effect of Slag FeO Content ....................................................................................37
3.5 Reaction Mechanism ..........................................................................................................38
3.5.1 Heat transfer ...........................................................................................................39
3.5.1.1 Conduction .................................................................................................39
3.5.1.2 Convection .................................................................................................40
3.5.1.3 Heat Transfer-based Models for Metal-slag Reactions .............................40
3.5.2 Mass transfer ..........................................................................................................41
3.5.3 Reaction Control ....................................................................................................42
3.5.4 Mixed Mechanism .................................................................................................42
3.6 Summary ............................................................................................................................43
Chapter 4 Experiments...............................................................................................................44
4.1 Experimental Approach .....................................................................................................44
4.2 Materials ............................................................................................................................44
4.3 Experimental Variables ......................................................................................................46
4.4 Apparatus ...........................................................................................................................46
4.5 Experimental Procedure .....................................................................................................48
vi
4.6 Preheating Experiments .....................................................................................................49
4.7 Slag-free Experiments ........................................................................................................52
4.8 Pressure Calibration ...........................................................................................................53
4.9 Carbon Test and XRF ........................................................................................................54
Chapter 5 Results and Discussion ..............................................................................................59
5.1 Gas Evolution Behavior .....................................................................................................59
5.2 Slag-free Experiments ........................................................................................................62
5.2.1 Specific Heat ..........................................................................................................64
5.2.2 Heat Transfer Coefficient ......................................................................................65
5.2.2.1 Natural Convection ....................................................................................65
5.2.2.2 Radiation ....................................................................................................66
5.2.3 Thermal Conductivity ............................................................................................67
5.2.4 A Kinetics Model for FeO/C Reaction ..................................................................70
5.3 Kinetics of DRI-slag Reaction ...........................................................................................75
5.3.1 Rate Calculation .....................................................................................................75
5.3.2 Effect of Carbon .....................................................................................................78
5.3.3 Effect of Slag Temperature ....................................................................................80
5.3.4 Effect of Preheating Temperature ..........................................................................81
5.3.4.1 Effect of Preheating Temperature on the Reaction Time ..........................84
Chapter 6 Conclusions ................................................................................................................86
Future Works .................................................................................................................................87
References ......................................................................................................................................88
Appendices .....................................................................................................................................93

vii
List of Figures
Fig 2.1 Steelamking flowline [12] .................................................................................................. 4
Fig 2. 2 – Schematic diagram of blast furnace................................................................................ 6
Fig 2.3 – Schematic of BOF ........................................................................................................... 7
Fig 2.4 – Schematic diagram of EAF.............................................................................................. 9
Fig 2.5 – Steel production by different processes [15] ................................................................. 10
Fig 2.6 – Chemical reactions during DRI production ................................................................... 12
Fig 2.7 - DRI production and its percentage as EAF charge [1]................................................... 13
Fig 2.8 - Expected range of some impurities in steel produced in EAF vs. %DRI in EAF charge
[19] ................................................................................................................................................ 14
Fig 2.9 Flow diagram of a CRISP plant [2] .................................................................................. 15
Fig 2.10 – Schematic diagram of CRISP furnace [2] ................................................................... 16
Fig 2.11-Variation of carbon and FeO content in different phases [4] ......................................... 18
Fig 2.12 – Relationship between carbon and FeO in different processes [4] ............................... 19
Fig 2.13 – Refractory profiles before and after the two trials [4] ................................................. 20
Fig 2.14 – Energy distribution in the three steelmaking technologies [5] .................................... 22
Fig 3.1 – Schematic diagram of the behavior of a Fe-C drop in a slag containing 20 % FeO [25]
....................................................................................................................................................... 27
viii
Fig 3.2 – Visual observations: (a) scenario 1 (B=2, FeO=18 wt%), (b) scenario 2 (B=2, FeO=25
wt%) and (c) scenario 3 (B=2, FeO=10 wt%) [6] ......................................................................... 28
Fig 3.3 – Schematic diagram of gas halo formation ..................................................................... 30
Fig 3.4 – Decarburization of three Fe-C drops in the slag: gas flow rate (a) and carbon content
change (b), as a function of time [31] ........................................................................................... 32
Fig 3.5 - Evolution of gas from a Midrex pellet with 1.78% C [23] ............................................ 33
Fig 3.6 - Effect of Temperature on the Rate of Reduction of FeO (8.1%) in Slag [34] ............... 34
Fig 3.7 – The volume of CO formed as a function of time for various size iron carbon drops
initially containing 4.2 wt% carbon in a slag containing 7.5 wt% FeO at 1400°C [8] ................. 36
Fig 3.8 – Decarburization rate vs. initial slag FeO for the second stage of decarburization [6] ... 38
Fig 4.1 – Schematic diagram of experimental setup ..................................................................... 47
Fig 4.2 – Temperature profile of vertical furnace as a function of distance from the bottom cap 48
Fig 4.3 – Schematic diagram of setup used in preheating experiment ......................................... 50
Fig 4.4 – Variation of DRI temperature vs. time, in 25 cm from top cap ..................................... 51
Fig 4.5 – Effect of the copper on the composition of slag ............................................................ 52
Fig 4.6 – Relationship between injected gas and ∆P at T=1500 º C ............................................. 54
Fig 4.7 - Variations of carbon content in the DRI pellets ............................................................. 56
Fig 5.1 – Gas vs. time curve for two DRI pellets at T=1600ºC and T=1500ºC ............................ 60
ix
Fig 5.2 - Gas vs. Time Curve for a DRI Pellet with 1.42% C at T=1550 º C ............................... 62
Fig 5.3 – Temperature – gas evolution –time curve for a DRI pellet (furnace
temperature=1550ºC) .................................................................................................................... 63
Fig 5.4 – Thermal conductivity of the DRI shown in Fig 5.3 as a function of core temperature . 67
Fig 5.5 - Thermal conductivity of a DRI pellet with 4.2 g weight as a function of core
temperature ................................................................................................................................... 68
Fig 5.6 – Thermal conductivity of iron oxide pellets reduced to iron by carbon monoxide and
hydrogen measured by Akiyama et al. ......................................................................................... 70
Fig 5.7 – Distribution of carbon in HYL DRI pellet..................................................................... 71
Fig 5.8 – Estimated surface temperature of DRI pellet for the measured core temperatures ....... 72
Fig 5.9 – Predictive model vs. measured gas evolution data for a pellet with 4.5 g weight as a
function of time after the beginning of reaction ........................................................................... 74
Fig 5.10 - Predictive model vs. measured gas evolution data for a pellet with 4.2 g weight as a
function of time after the beginning of reaction ........................................................................... 75
Fig 5.11 – Gaussian single-peak fitting for a pellet with one-stage behavior ............................... 77
Fig 5.12 – Gaussian multi-peak fitting for a pellet with two-stage behavior ............................... 77
Fig 5.13 – Rate of reaction vs. carbon content in the first stage for various slag temperatures ... 79
Fig 5.14 - Rate of reaction vs. carbon content in the second stage for various slag temperatures 80
Fig 5.15 - Rate of gas evolution vs. wt pct C in the first stage for four preheating temperatures
(slag temperature = 1550ºC) ......................................................................................................... 82

x
Fig 5.16 - Rate of gas evolution vs. wt pct C in the second stage for four preheating temperatures
(slag temperature = 1550ºC) ......................................................................................................... 83
Fig 5.17 – Reaction time vs. various preheating temperatures ..................................................... 84

xi
List of Tables
Table 2.1 - Composition of hot metal (wt%) .................................................................................. 5
Table 2.2 - Average Composition of DRI pellet (Wt pct) ............................................................ 12
Table 2.3 – Typical operating parameters of three DRI-based steelmaking approaches [5] ........ 23
Table 4.1 – Chemical composition of slag (% wt)........................................................................ 44
Table 4.2 – The purity and particle size of slag forming materials .............................................. 45
Table 4.3 – Average Chemical Composition of DRI (%Wt) ........................................................ 45
Table 4.4 – Experimental conditions ............................................................................................ 46
Table 4.5 – Pressure calibration data at T=1500 º C ..................................................................... 53
Table 4.6 – Calculated FeO and Carbon Contents of Each Pellet (wt %) .................................... 57
Table 4.7 – XRF results of slag samples after the experiments .................................................... 58

1
Chapter 1
Introduction
Direct Reduced Iron (DRI) is a prime quality feedstock of today's Electric Arc Furnace (EAF)
steelmaking. Driven by the increasing price of steel scrap and the undesired contaminants of
scrap, the consumption of DRI as a source of virgin iron in EAFs has been steadily increasing
[1]. In recent years, charging hot DRI to the EAF in order to reduce the energy intensity of the
process has been practiced successfully. Furthermore, a novel steelmaking process has been
introduced that promises continuous melting and refining of steel by using DRI, preferably
charged at high temperature, as the main feed [2].
Despite the attractive benefits of charging DRI into the EAF, the maximum energy saving and
productivity increase potentials may not be achieved using the conventional EAFs due to the
different operation mode of DR furnace and EAF. While the former continuously produces hot
DRI, the latter is a batch process and can only receive the feed for certain duration of the
operation time. In order to overcome the operation mode mismatch problem, a continuous
steelmaking technology (CRISP) was introduced. The main feature of CRISP is continuous
operation, allowing uninterrupted charging of DRI. The benefits and also economical and
technical details of CRISP have been described in several publications [2-5]. In particular, a
recent study [5] indicates that significant improvements in terms of energy consumption and
reduction in greenhouse gas emissions may be realized by close-linking a DR plant and CRISP
EAF.
One of the important process features of CRISP is that the decarburization of DRI is
accomplished through the oxidation by slag with no gaseous oxygen [6]. The oxygen required for
decarburization is supplied to the slag by addition of iron oxide as ore lump, pellet or mill scale.
One possible implication of relying on slag–DRI interactions for decarburization is that if the
reactions are not fast enough, the refining (primarily decarburization) may not proceed to meet
the product specifications. The current study was undertaken to study the kinetics of the
interactions between slag and DRI, aiming to suggest conditions under which melting and

2
refining of DRI take place within the allowed time frame. Although a general knowledge of
interactions between DRI and slag has been achieved through the previous investigations, the
role of several critical variables on the reaction kinetics and mechanism have not been
understood. For example, based on the findings in Fe-C/slag interactions [7-9] it is anticipated
that carbon content of DRI may have a significant impact on its behavior in slags. However, the
effect of carbon on DRI–slag reaction has not been studied previously. Therefore, in an attempt
to achieve a comprehensive understanding of DRI-slag interactions, the effects of DRI carbon
level, slag temperature, and DRI preheating temperature on the kinetics of reaction are
investigated in the present study. This thesis contains six chapters. In Chapter 2, DRI–based
steelmaking technologies are reviewed. Chapter 3 summarizes the previous investigations on the
interactions between DRI/Fe–C metal drop and slag. The experimental work of this study is
discussed in Chapter 4. Results are presented and discussed in Chapter 5. Finally, the major
conclusions of the research are drawn and provided in Chapter 6.
3
Chapter 2
DRI-based Steelmaking
2.1 Steel
Steel is an alloy of iron and carbon and several other elements in which the carbon content varies
from 0.02% to 2% depending on the grade and type of steel. The presence of other elements such
as Mn, Cr, V and Si depends on the desired properties including hardness, ductility and corrosion
resistance.
The application area of steel includes the construction, automotive, machinery and numerous
other products. Looking at statistics published by the governments or private institutes shows the
significance of steel. For example, in Canada, the steel production in 2007 was 15.6 million
metric tons, and its sales value was around $13 billion while the capital investment was around
$560 million. Steel industry created 35000 direct jobs and $6 billion was earned by steel export
[10]. All these figures show the impact of steel on both the manufacturing industry and the
societies.
2.2 Steelmaking Methods
There are two major industrial routes to produce steel: conventional integrated process and
recycling used scrap [11]. Producing virgin steel in integrated plants is based on two approaches,
as shown in Fig 2.1. In one method, iron ore is reduced by coke and coal in the blast furnace, and
then transferred to the basic oxygen furnace (BOF) to remove the excess carbon by blowing
oxygen. The next step is ladle furnace (LF) and involves the refining of steel followed by
casting. In the DRI based process, DRI is produced in a reduction furnace (DR), mixed with
recycled scrap, and then transferred to an electric arc furnace (EAF) to melt and clean the charge
materials. From this stage, the remaining processes are similar to the conventional integrated
process including LF and casting. Although conventional steelmaking process is still a dominant
steelmaking route, DRI-based processes have been gaining a larger share in industry, due to the

4
shortage in scrap supply, fluctuation in the scrap price, and the low impurity content of DRI that
improves the steel quality.
Fig 2.1 Steelamking flowline [12]
The details of each method including important furnaces and processes will be discussed in the
following sub-sections.
2.2.1 Blast Furnace (BF)
An early blast furnace used wood (charcoal) as a heating source but since wood price began to
rise and the availability became limited, an alternative fuel was required. In the 18th century, the
first blast furnace using coke was emerged.
BF is a tall shaft reactor. The charge is introduced to the furnace at the top and consists of iron
ore, scrap, flux (limestone) and coke. Coke has different roles in BF. First, it is a heating source
for the furnace due to its reaction with air and second, it acts as a reductant to reduce the iron ore.

5
Since there are different regions inside the furnace in terms of temperature and gas composition,
various reactions may occur in blast furnace depending on the position within the furnace [13].
By assuming these regions, carbon may reduce iron oxide in the two forms:
FeO + C = Fe + CO (g) (2.1)
FeO + CO = Fe + CO2 (g) (2.2)
Reaction (2.1) presents the direct reduction of iron by carbon, whereas (2.2) shows the indirect
reduction of iron by CO gas [13] . Reaction (2.1) occurs at elevated temperatures and lower parts
of blast furnace.
Unlike steelmaking slag, blast furnace slag does not contain iron oxide or phosphorus. Instead, it
consists of CaO, SiO2 and Al2O3. The melting point of the slag in absence of adequate CaO can
be relatively high (2000°C), therefore the composition of slag must be controlled to keep it fluid
[13, 14].
As the iron melts, it descends and accumulates at the bottom of furnace. At different tapping
times, slag and carbon saturated iron, known as hot metal or pig iron are drained through tapping
holes. Hot gases produced from the coke burning exit through top of the furnace after they
participated in the reactions. The average composition of pig iron is shown in Table 2.1 [11].
Table 2.1 - Composition of hot metal (wt%)
Iron Carbon Sulphur Phosphorus Manganese Silicon
94 4.5 – 4.7 0.02 – 0.06 0.08 0.3 – 0.8 0.3 – 0.8

6
Fig 2. 2 – Schematic diagram of blast furnace
Although blast furnace is still the dominant process for making iron, it is accompanied with some
disadvantages. Blast furnace utilizes metallurgical grade coke to heat up and reduce iron oxide.
However, coke is expensive and causes significant CO2 emissions. Moreover, blast furnace
projects carry a high capital cost; hence minimum capacity constraint is inherent to the process.
Consequently, other processes may be employed including mini blast furnace, smelting reduction
and direct reduction [15].
2.2.2 Basic Oxygen Furnace
This steelmaking method involves selective oxidation of C and Si in the hot metal by blowing
oxygen to the convertor. The process was first developed in 1947 at Linz and Donawitz (two
7
towns in Austria) [14], [16].
In different geographical areas it may be known as basic oxygen
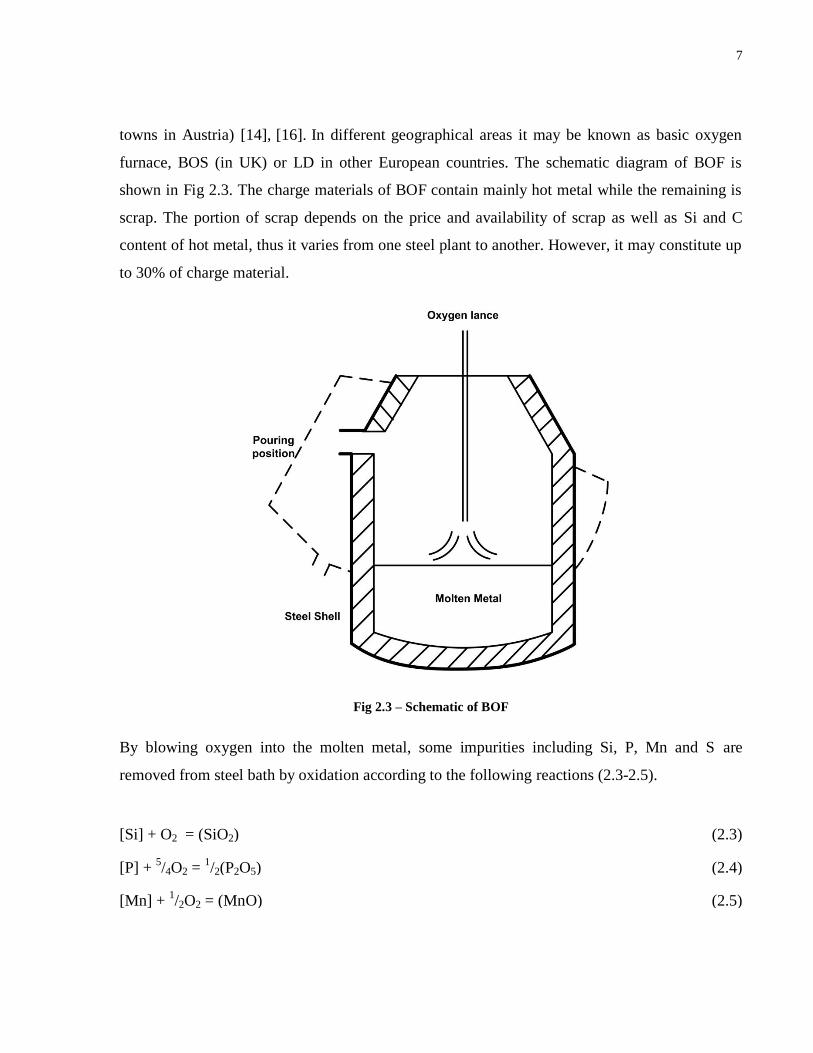
furnace, BOS (in UK) or LD in other European countries. The schematic diagram of BOF is
shown in Fig 2.3. The charge materials of BOF contain mainly hot metal while the remaining is
scrap. The portion of scrap depends on the price and availability of scrap as well as Si and C
content of hot metal, thus it varies from one steel plant to another. However, it may constitute up
to 30% of charge material.
Fig 2.3 – Schematic of BOF
By blowing oxygen into the molten metal, some impurities including Si, P, Mn and S are
removed from steel bath by oxidation according to the following reactions (2.3-2.5).
[Si] + O2 = (SiO2) (2.3)
[P] + 5/4O2 =
1/2(P2O5) (2.4)
[Mn] + 1/2O2 = (MnO) (2.5)

8
Meanwhile, steel is decarburized through Reaction 2.6.
[C] + 1/2O2 = CO (gas) (2.6)
The oxygen required to the above reactions may be partially supplied indirectly through FeO of
slag where FeO itself is formed by oxidation of iron. Before each run depending on the carbon
target, calculations should be carried out to estimate the charge and oxygen ratio in order to meet
the final quality of steel. These calculations are based on the mass and heat transfer inside the
furnace [16].
2.2.3 Electric Arc Furnace
Electric Arc Furnace (EAF) converts the electrical energy to heat that melts the scrap or other
metallic charges. A schematic diagram of this furnace is shown in Fig 2.5. As seen, it utilizes
several graphite electrodes to heat up the charge through the generation of electric arc between
electrodes. The number of electrodes depends on the size and volume of furnace [17].
In brief there are several steps in the electric arc furnace steelmaking process as following:
1- Charging
2- Melting
3- Refining
4- De-slagging
5- Tapping
6- Furnace turn around
9
Graphite
Electrodes
Slag
Steel
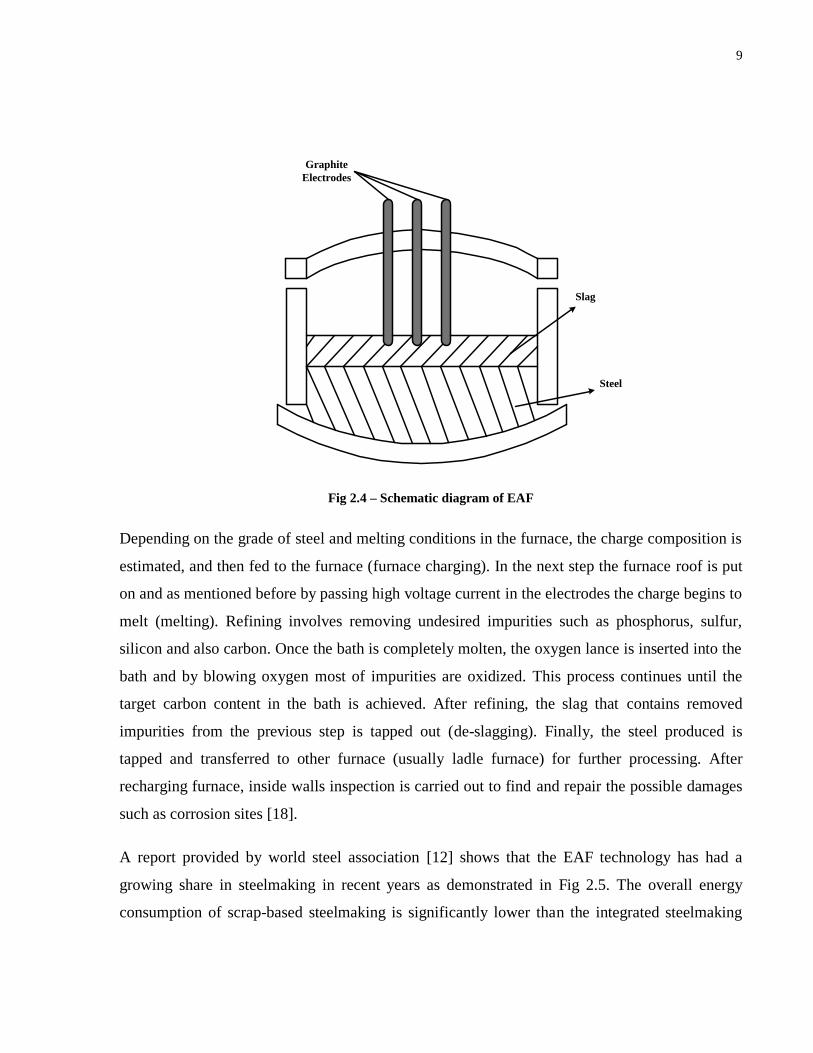
Fig 2.4 – Schematic diagram of EAF
Depending on the grade of steel and melting conditions in the furnace, the charge composition is
estimated, and then fed to the furnace (furnace charging). In the next step the furnace roof is put
on and as mentioned before by passing high voltage current in the electrodes the charge begins to
melt (melting). Refining involves removing undesired impurities such as phosphorus, sulfur,
silicon and also carbon. Once the bath is completely molten, the oxygen lance is inserted into the
bath and by blowing oxygen most of impurities are oxidized. This process continues until the
target carbon content in the bath is achieved. After refining, the slag that contains removed
impurities from the previous step is tapped out (de-slagging). Finally, the steel produced is
tapped and transferred to other furnace (usually ladle furnace) for further processing. After
recharging furnace, inside walls inspection is carried out to find and repair the possible damages
such as corrosion sites [18].
A report provided by world steel association [12] shows that the EAF technology has had a
growing share in steelmaking in recent years as demonstrated in Fig 2.5. The overall energy
consumption of scrap-based steelmaking is significantly lower than the integrated steelmaking

10
routes, as no iron oxide reduction occurs in this process; subsequently, the CO2 emission is
significantly lower compared to the BF-BOF and blast furnace. Furthermore, simplicity of EAF
enables controlling and monitoring the energy consumption much easier than before. However,
an extensive work is still required to improve the efficiency and lower the energy consumption
and CO2 emissions of EAF.
2.3 DRI and Its Significance
Directly Reduced Iron (DRI) is produced by direct reduction of iron ore in the form of fine or
lumps or pellets using reducing gas generated by reforming of natural gas or gasification of coal.
In general, DRI production methods can be divided to two categories: Natural gas-based direct
reduction and coal-based direct reduction. As it can be realized from their designations, the
difference between these two processes is the reducing agent source. Hence, the reactions and
chemical procedures are almost consistent in both categories. Fig 2.6 presents the chemical
reactions which occur during the production process [15].
Fig 2.5 – Steel production by different processes [15]

11
Depending on the reducing agent (gas or coal) different furnaces are utilized in the DRI
production. In gas based processes vertical shaft furnace, retort (batch) furnace and fluidized bed
reactors are employed. In the coal based direct reduction, vertical shaft, multiple hearth, rotary
hearth furnaces, rotary kiln and fluidized bed reactors are utilized. The principles and procedures
of these furnaces have been reviewed by Anameric and Kawatra [15].
The typical composition of DRI pellet is shown in Table 2.2. Large variations can be observed
among various processes due to the fact that the conditions of each process are different.
However, DRI contains mostly metalized iron and also some amount of carbon and other
components. Depending on the manufacture process and type of DRI it may contain some
wustite (FeO), as well.

12
Fig 2.6 – Chemical reactions during DRI production
Table 2.2 - Average composition of DRI pellet (wt pct) [Arcelor Mittal, Quebec]
Total Fe C S SiO2 Al2O3 CaO MgO
92 2.2 0.006 2.15 0.5 0.6 0.5

13
The DRI application is mainly in the steelmaking industry as a charge material for EAF. Fig 2.7
shows the production and percentage of DRI in EAF charge from 1970 to 2005.As demonstrated
in this figure, the DRI percentage in EAF charge has increased from 0% in 1970 to 14% in 2005.
Correspondingly, there has been a significant increase in the DRI production for the same period
of time [1].
Fig 2.7 - DRI production and its percentage as EAF charge [1]
The growing demand of DRI in steel industry arises from two key factors. The first is the scrap
price and availability. Scrap is one of the major feed materials in EAF; therefore, its price affects
the cost of steelmaking directly. Growing price of scrap and insufficient supply in the last few
decades has resulted in higher cost of steelmaking and therefore higher price of steel.
Consequently, steel industry tended to find an alternative feed material for EAF. On the other
hand, the DRI is produced from iron ore and since the iron ore price has been relatively stable
through the time, using DRI in EAF charge can lower the cost of steelmaking.
The other advantage of DRI over scrap is the higher quality of steel produced from DRI. Fig 2.8
[19] shows the range of some impurities including Cu, Cr and Ni in the final product of EAF as a

14
function of DRI percentage in the EAF charge. As seen, by increasing the DRI percentage in
EAF charge, the impurity content of steel can be lowered. Therefore, in addition to cost
advantage of DRI, it improves the quality of steel produced in EAF, making it a suitable feed for
production of high quality steel such as that for the flat products.
Fig 2.8 - Expected range of some impurities in steel produced in EAF vs. %DRI in EAF charge [19]
2.4 Continuous Steelmaking Using DRI
CRISP or Continuous Reduced Iron Steelmaking Process is a novel steelmaking technology
introduced by Hatch in 2005 [20] with the objective of lowering the energy consumption and
CO2 footprint of DRI-based steelmaking. The main feature of CRISP is the continuous operation
whereas the conventional steelmaking routes are all batch processes. As will be discussed later,
this feature will result in a considerable improvement in the energy consumption and green-
house gas emissions [2].

15
2.4.1 Plant Layout
The flowsheet of CRISP is shown in Fig 2.9. As depicted, DRI is produced in the DR or
reduction furnace and fed to the furnace, along with scrap and iron oxide. The charge materials
are fed continuously into the CRISP furnace that is essentially a six in-line electrode stationary
EAF. Continuously operated CRISP EAF close links two processes: DRI production in the
reduction furnace and continuous casting [2].
Fig 2.9 Flow diagram of a CRISP plant [2]
The decarburization of DRI is accomplished with zero gaseous oxygen and through the oxidation
by slag; that is supplied with iron oxide as ore lump, pellet or mill scale. Since the charge is
introduced into the furnace continuously, it is critical to adjust the specific rate of material
feeding in order to meet the requirements for sufficient decarburization inside the furnace. Steel
Steel to LF & Casting
Reduction Furnace
Hot Link Bin
DRI Cooler
Scrap & Iron Ore
Slag
Melting Furnace

16
and slag are periodically tapped out through slag and metal top-holes in a similar approach to BF.
After steel is tapped out, the remainder of the process is similar to the conventional steelmaking
including ladle refining and casting.
2.4.2 CRISP Process
While the CRISP furnace (Fig 2.10) is novel to the mainstream of steel industry, it is well
established in non-ferrous industries. Basically, the furnace receives DRI with ~ 1-3 wt % carbon
and converts it to steel with about 0.05-0.1 wt% carbon, on a continuous basis. The most
important feature of this furnace is that all decarburization is accomplished through the slag, so
no gaseous oxygen is required. To provide the proper conditions for this reaction the slag
composition must be controlled accurately. Optimization of slag composition also reduces the
corrosion of inside walls [3].
Fig 2.10 – Schematic diagram of CRISP furnace [2]
Slag conditions should satisfy the requirements of CRISP such as extended refractory life and
sufficient decarburization. In the following subsections, the slag engineering aspects of CRISP
are briefly discussed.

17
2.4.2.1 Carbon Control
Achieving a large extent of decarburization requires a high FeO content in the CRISP slag. On
the other hand, FeO-rich slags are more aggressive towards the furnace refractory and hence,
reduce the refractory life. Therefore, a minimum FeO content required to achieve the desired
carbon level is of the critical importance in CRISP. A series of trials in a pilot-scale, eight-ton
EAF were performed for 115 hours in a five-day campaign to obtain the requirements of
decarburization condition at each carbon level [4]. Fig 2.11 shows the carbon and FeO level
measured during the operation in four phases. In the first phase, DRI was fed into the furnace
continuously until a steady state carbon level reached. Then, oxygen was introduced to the bath
in the form of iron oxide to adjust the carbon content. As seen, carbon reached a steady state
value of 0.5 – 0.6 wt% in 14 hours while it took 15 hours to decrease the carbon content to the
desired level by the gradual addition of iron oxide to the feed. In the second phase, while the iron
oxide was kept around 17 wt% it was observed that the carbon content remained around 0.1 wt
% for 36 hours. This stage well represents the ability to control the carbon level as well as
stability of the process. In the third stage further decarburization (0.04 wt% C) was achieved by
increasing the FeO content of slag to 25 wt%.
Eventually, in the last phase, a carbon level of 0.06 wt% was maintained by reducing the amount
of oxidizers in the feed, and keeping FeO of slag around 20 wt%. It is evident that, the
adjustment of carbon level in the CRISP is possible through controlling the iron oxide in the feed
material [4]. Decarburization through iron oxide addition rather than oxygen injection has the
advantage that the reactions take place under less intense conditions, thus FeO–C relationship is
closer to equilibrium as explained below.

18
Fig 2.11-Variation of carbon and FeO content in different phases [4]
2.4.2.2 Carbon – FeO Relationship
An inverse relation exists between the slag FeO and the carbon content of steel based on the
thermodynamic equilibrium between the two phases. Fig 2.12 presents the FeO-C correlation in
different processes as well as that in the equilibrium state.
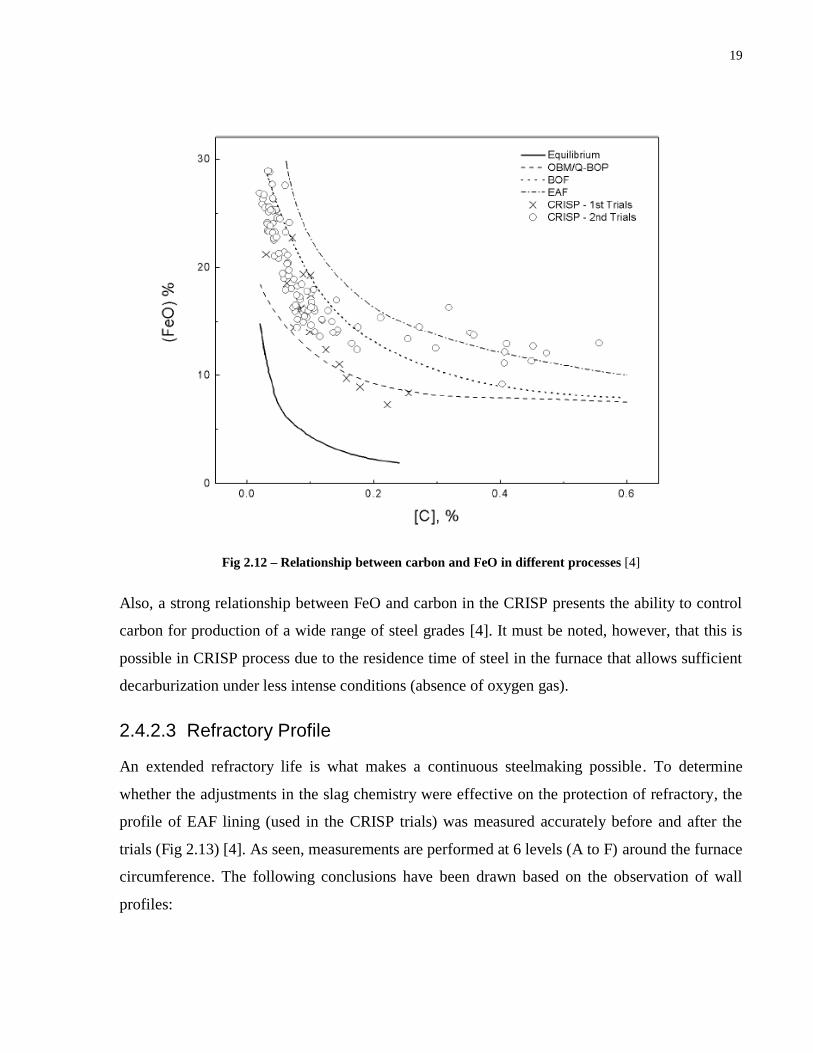
As seen, the FeO-C curve of CRISP lies below that of EAF and Q-BOP while it is above the
equilibrium and BOF. This indicates that in CRISP process, sufficient decarburization is
achieved with less FeO compared to the conventional EAF operations. Also, this will result in
lower refractory corrosion and a reduction in the slag volume. The latter can reduce the energy
consumption of process and also the issues inherent to the slag handling. Therefore, using iron
oxide as an oxidizing agent and under the rather slow regime of reactions in CRISP, the reaction
between carbon and iron oxide is much closer to the equilibrium state, bringing about several
improvements over conventional EAF. These include higher iron yield (less FeO of slag), lower
slag volume (thus smaller energy and materials loss), and reduced refractory corrosion.
0.06
19
Fig 2.12 – Relationship between carbon and FeO in different processes [4]
Also, a strong relationship between FeO and carbon in the CRISP presents the ability to control
carbon for production of a wide range of steel grades [4]. It must be noted, however, that this is
possible in CRISP process due to the residence time of steel in the furnace that allows sufficient
decarburization under less intense conditions (absence of oxygen gas).
2.4.2.3 Refractory Profile
An extended refractory life is what makes a continuous steelmaking possible. To determine
whether the adjustments in the slag chemistry were effective on the protection of refractory, the
profile of EAF lining (used in the CRISP trials) was measured accurately before and after the
trials (Fig 2.13) [4]. As seen, measurements are performed at 6 levels (A to F) around the furnace
circumference. The following conclusions have been drawn based on the observation of wall
profiles:

20
- No significant damage in the inside walls is found after the first trial except a minor
erosion sites in sections E and F pertaining to those heats with higher FeO content.
Nevertheless, it was observed that for the heats with lower FeO content the refractory can
repair the previous damages, thus eliminating the need to suspend the process.
- After the second trial, a net deposition of 63 mm on the refractory thickness was
observed. Only one section (B) was found to have a wear site which corresponded to a
hot area created by arc deflection. However, the trials were carried out in a conventional
EAFs where arc deflection is common. In a CRSIP furnace that has a different design,
typically the six-in-line electrodes, the formation of hot spots by arc deflection and the
associated damage to the refractory will be eliminated.
Fig 2.13 – Refractory profiles before and after the two trials [4]

21
Consequently, an excellent refractory condition was observed after two trials and about 200
hours of operation. Even in some sections the thickness was increased by a deposition. All these
observations indicate the capability of CRISP to achieve a remarkable refractory life [4].
2.4.3 Benefits of CRISP Technology
CRISP utilizes DRI as the main feed material and as mentioned earlier DRI share in EAF charge
has been increasing over the past several decades due to the fact that using DRI leads to a
decrease in the cost of steelmaking and an improvement in the quality of steel. Therefore, from
this point of view, CRISP is a step toward a clean and economical steelmaking process [3].
Moreover, CRISP has other features, enabling it to be introduced as a key technology to play an
important role in today’s steelmaking industry.
A recent analysis of the energy and environmental impact of CRISP in comparison with typical
EAFs has been presented in [5]. Fig 2.14 shows the energy distribution in CRISP process as well
as conventional EAFs. In this figure, HDRI stands for hot DRI feed, where CDRI indicates the
cold DRI charge.
As shown, the total input energy of the CRISP is 2690 MJ/t LS which is 10% lower than that of
competing EAFs. This has been attributed to the lower off-gas and slag contents compared to the
EAF and also reduced energy loss. Higher values of energy loss for EAFs correspond to the
larger area to volume ratio and also the considerable losses when the furnace is opened for
charging the materials between different runs. Meanwhile, looking at Fig 2.14 (b and c) indicates
that the total energy required for the EAF is independent of initial temperature of charge
materials. However, using hot DRI leads to about 8 % saving in the electrical energy
consumption in EAF.

22
Fig 2.14 – Energy distribution in the three steelmaking technologies [5]
As indicated in Fig 2.14, the electrical energy required to melt the charge materials in the CRISP
furnace is higher compared to the standard EAFs due to the absence of chemical energy resulted
from the coal and natural gas which are not utilized in the CRISP process.
Table 2.3 shows the typical operating parameters of three DRI-based steelmaking approaches:
HDRI-CRISP, HDRI-EAF and CDRI-EAF. As demonstrated in the table, the major differences
between CRISP and EAFs are in (1) carbon injection, (2) source of oxygen, (3) CO/CO2 ratio in
the off-gas and (4) slag chemistry. In EAF, carbon is injected to provide appropriate conditions
for slag foaming, however; in the CRISP technology slag foaming is achieved by the reaction
between carbon in DRI and FeO in both DRI and slag. Therefore, the need for carbon injection is
eliminated in CRISP.
(a) HDRI-CRISP
2690 MJ/t LS 3036 MJ/t LS
(b) HDRI-EAF
3043 MJ/t LS
(c) CDRI-EAF
Electricity
67.6%
Steel
50.8% 45.1%
Steel
45.0%
Steel
51.6%
Electricity
62.0%
Electricity
DRI (Chemical)17.5%
DRI (Thermal)12.8%
Electrode carbon2.1%
Losses & cooling10.2%
Reactions11.1%
Slag12.4%
Off-gas15.5%
16.4% DRI (Chemical)16.4% DRI (Chemical)DRI (Thermal)10.8%
2.3% Electrode carbon 2.3% Electrode carbon
10.1% Coal
7.0%Natural gas
2.3% Reactions
Coal10.1%
Natural gas7.0%
Reactions2.3%
Losses & cooling21.0% Losses & cooling20.9%
Slag15.9% Slag15.8%
Off-gas18.1% Off-gas18.3%

23
Table 2.3 – Typical operating parameters of three DRI-based steelmaking approaches [5]
Parameter Unit HDRI–CRISP HDRI–EAF CDRI–EAF
Electrode consumption kg/ t. Ls 1.7 1.7 2.1
Refractory consumption kg/ t. Ls 1.8 3.6 3.6
Carbon injection kg/ t. Ls 0 9 9
Oxygen source – Iron Oxide O2 O2
Natural gas Nm3/t. Ls 0 6 6
DRI/Scrap ratio – 9 9 9
Off–gas CO/CO2 – 9 1 1
Hot DRI Temp °C 600 600 25
Off–gas Temp °C 1625 1625 1625
Steel Temp °C 1630 1630 1630
Slag Temp °C 1650 1650 1650
% Hot DRI 100 90 0
% Cold DRI 0 10 100
Slag parameters
FeO wt% 22 30 30
MgO wt% 12 8 8
Basicity (V ratio) – 1.75 2.5 2.5
* V ratio = (CaO + MgO)/ (SiO2 + Al2O3)
Due to the oxygen-free atmosphere of CRISP furnace, the off-gas contains mostly CO while in
the EAF the CO2 content is significantly higher. Also, as discussed earlier, the carbon target can
be achieved by lower FeO content inside the slag which results in a difference in the slag
composition between CRISP and EAF technology. Lower FeO together with higher MgO
enhance the refractory life. Further comparisons and details of the CRISP benefits can be found
in [5]. Overall, these improvements in CRISP process offer a reduction in the energy
consumption and CO2 footprint, per ton of product.

24
2.5 Summary
A review of steelmaking methods, improvements and new approaches demonstrates the essence
of further research on different aspects of steelmaking particularly on DRI application in the
EAF and CRISP due to the cost and energy benefits associated with the DRI usage as feedstock.

25
Chapter 3
Kinetics of Metal/DRI-Slag Interactions
3.1 Overview
Although the number of studies which have focused on the melting behavior of DRI pellets in
steelmaking slag is very limited [6, 21-23], an extensive work has been carried out on the
kinetics and controlling mechanisms of reaction between the Fe-C drops and the slag in oxygen
steelmaking. Because of some similarities in the two systems, a comprehensive discussion of the
reactions kinetics and mechanisms are reviewed in the following sub-sections.
3.2 Metal - Slag Reactions
Depending on the DRI composition, several reactions may occur between DRI and slag.
Assuming that DRI contains a considerable quantity of magnetite (Fe3O4), Sadrnezhad and
Elliott [23] concluded that this reaction involves two steps. In the first step, magnetite is reduced
to wustite (FeO) and then, in the next step, wustite is reduced to iron according to the following
reactions:
Fe3O4 + C= 3FeO + CO(g) [3.1]
FeO + C= Fe + CO(g) [3.2]
Goldstein et al. [22] considered Reaction 3.2 as the dominant reaction, since the content of
magnetite in the DRI was negligible in their experiments. A similar assumption was made by Li
and Barati [6] and Anghelina et al. [21] based on the fact that the DRI used in the experiments
did not contain a significant amount of magnetite.
The reaction between Fe-C drop generated in oxygen steelmaking, and slag also includes the
reduction of FeO (inside the slag) by carbon (inside the metal) at one stage. However, in both

26
DRI and Fe-C cases, the overall reduction reaction is more complex and consists of several
elementary steps according to the various studies including visual observations of the reactions.
3.3 Visual Observations
Direct observations of the Fe-C or DRI behavior in slag have provided a reasonable insight into
the reaction path. Several investigations [6-9, 22, 24-26] have used an x-ray fluoroscopy
technique to visualize the reaction. The imaging setup consists of an x-ray source to emit a
continuous x-ray beam that passes through the crucible and slag, and a receiver in the other side
to admit the transmitted beams. It can produce a continuous series of images with a maximum
rate of 25 – 30 images per second.
Mulholland et al. [9] used the X-ray technique to observe the reaction between iron-carbon drops
and the oxygen steelmaking slag. The observations showed that after releasing the Fe-C drop
into the slag, floating of drop followed by slag foaming occurs. Then the drop begins to sink and
the foamy slag layer disappears. They also found that it was not possible to determine a distinct
velocity of drop’s movement to the bottom of crucible which varied between 1 and 36 cm/s. For
a droplet containing 3.71 wt pct carbon, Chen and Coley [24] observed a fast gas evolution at
around 4 s after the release of drop. Similar to observations by Mulholland et al. [9], the drop
floated on the surface of slag, while the slag was foamed up.
In another study, Molloseau and Fruehan [25] observed the behavior of Fe-C-S pellet with 2.9 wt
pct carbon when it reacts with slags containing 10 to 20 wt% FeO. Their observation was similar
to those found in [24] and [9], as demonstrated in Fig 3.1. During the first 6 s, the pellet was
expanded up to 2 times its original diameter while it remained buoyant in the slag. After this
period, the foamed slag collapsed and the pellet started to sink into the slag. However, the
reaction continued until the carbon content of iron dropped to the steady state value, typically
below 0.2 wt%.
Gare and Hazeldean [7] obtained similar results in their experiments. Five periods were detected
in their observations including initial period followed by a fast decarburization rate. In another
study, Min and Fruehan [8] found a range of 20 to 200 s for the fast reaction period which is

27
rather long compared to the findings in other studies. Although no clear explanation was
mentioned, longer reaction times may correspond to the experiments with lower FeO content.
For example, in one of the experiments, a slag with 3.2 wt % FeO content was used.
Fig 3.1 – Schematic diagram of the behavior of a Fe-C drop in a slag containing 20 % FeO [25]
Goldstein and Fruehan [22] performed a study on the behavior of DRI pellets in slag-metal
systems. In their experiments, the reaction site was observed using x-ray fluoroscopy. An initial
incubation period of 8-10 s was found followed by a 20-30 s rapid gas evolution. However, the
most comprehensive observation of DRI and slag reaction was carried out by Li and Barati [6].
From the results, the authors postulated three scenarios for decarburization, each different in
terms of the DRI movement inside the slag and the gas halo formation around the pellet; and
dependent on the FeO content and viscosity of the slag. Generally, DRI pellets started to sink
into the slag after 16 to 26 s of rapid reaction. Fig 3.2 (a), (b) and (c) show the X-ray results for
the slags with the FeO contents of 18 wt%, 25 wt% and 10 wt%, respectively [6]. In the first

28
scenario, the DRI pellet sinks into the bottom of crucible from the beginning of reaction. A thin
layer of gas is also formed around the pellet (Fig 3.2 a).
Fig 3.2 – Visual observations: (a) scenario 1 (B=2, FeO=18 wt%), (b) scenario 2 (B=2, FeO=25 wt%) and (c)
scenario 3 (B=2, FeO=10 wt%) [6]
In the second scenario, the DRI pellet remains on the surface of slag during the fast period of
decarburization. Then, it starts to sink into the slag when it completely melts. Dislike the first
scenario, a thick gas halo was observed around the pellet. The second scenario is similar to that
found in [25]. Finally, in the third scenario, the DRI pellet sinks into the slag to some extent but
not completely due to the high viscosity of slag (either low FeO content or high basicity).
Therefore, it was seen that the DRI pellet is rather immobile inside the slag.
a b
c

29
From the visual observations of reaction between DRI or Fe-C alloy and the slag, it is known that
a gas halo containing the gaseous products of the reaction is formed around the pellet during the
gas evolution. For the first time, Mulholland et al. [9] observed a gas layer in the experiments
around the Fe-C drops. They found that this layer disappears when the slag foaming ends.
Furthermore, it was concluded that the size of gas halo depends on the rate of reaction: higher
rate of gas evolutions results in larger gas halo formation around the pellet. A similar behavior
was observed by Gare and Hazeldean [7]. In other studies by Min and Fruehan [8], Wei et al.
[26] and Bandyopadhyay et al. [27], a mechanism was proposed for the reaction between Fe-C
drops and FeO in the slag based on the observation of gas halo, in which the gaseous CO reduces
FeO as demonstrated by Reaction [3.3] followed by the Reaction [3.4] (Boudouard reaction).
CO(g) + FeO = Fe + CO2(g) [3.3]
CO2 + C= 2CO(g) [3.4]
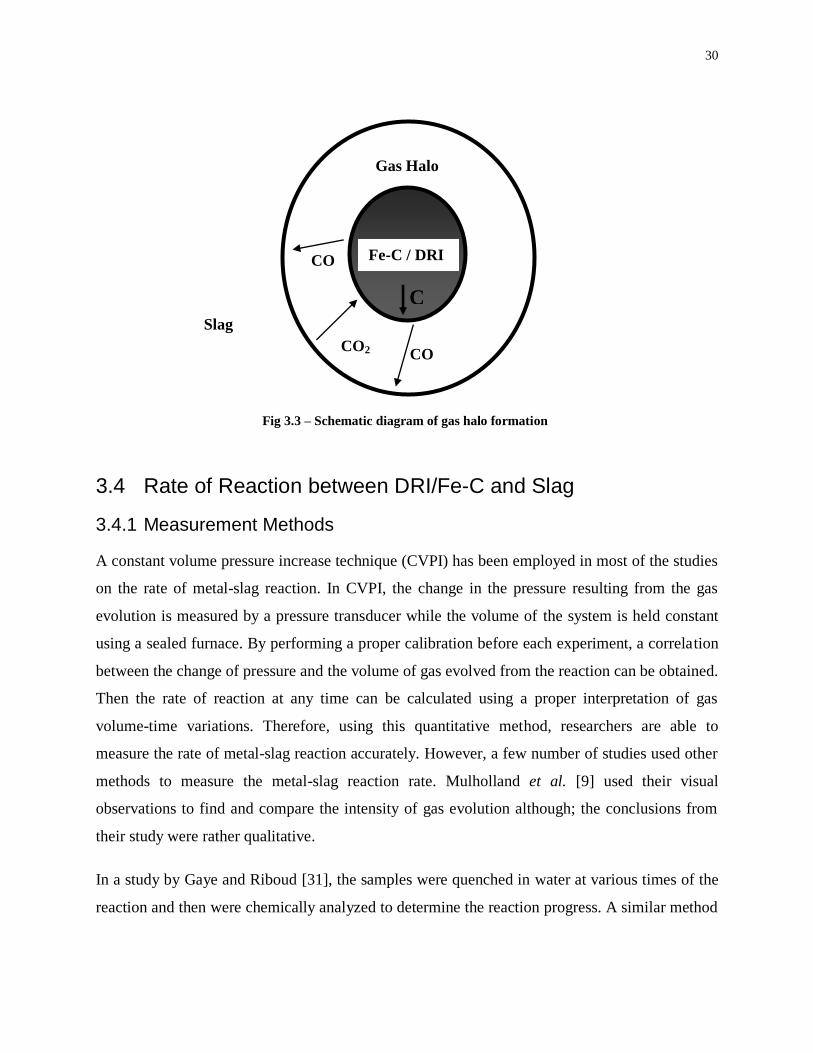
Min and Fruehan [8] also sketched a diagram for the formation of gas halo (Fig 3.3) and it was
confirmed by other studies [6, 8, 22, 25, 28-30] later that this sketch is similar to the mechanism
which was observed during the reaction. As seen in Fig 3.3, FeO reacts with the carbon
monoxide in the gas-slag interface (Eq.3). Then the CO2 resulted from the previous reaction
reacts with the carbon inside DRI or Fe-C.
30
3.4 Rate of Reaction between DRI/Fe-C and Slag
3.4.1 Measurement Methods
A constant volume pressure increase technique (CVPI) has been employed in most of the studies
on the rate of metal-slag reaction. In CVPI, the change in the pressure resulting from the gas
evolution is measured by a pressure transducer while the volume of the system is held constant
using a sealed furnace. By performing a proper calibration before each experiment, a correlation
between the change of pressure and the volume of gas evolved from the reaction can be obtained.
Then the rate of reaction at any time can be calculated using a proper interpretation of gas
volume-time variations. Therefore, using this quantitative method, researchers are able to
measure the rate of metal-slag reaction accurately. However, a few number of studies used other
methods to measure the metal-slag reaction rate. Mulholland et al. [9] used their visual
observations to find and compare the intensity of gas evolution although; the conclusions from
their study were rather qualitative.
In a study by Gaye and Riboud [31], the samples were quenched in water at various times of the
reaction and then were chemically analyzed to determine the reaction progress. A similar method
Fig 3.3 – Schematic diagram of gas halo formation
Fe-C / DRI
Gas Halo
CO
CO2 CO
C
Slag
phase

31
was also employed in [26, 32]. Sadrnezhad and Elliott [23] measured the gas evolution rate
based on the visual observation of the number of gas bubble sites on the molten slag surface
which is obviously less accurate than CVPI. Finally, in some studies [21, 27, 33], a
thermogravimetry technique (TG) was utilized to measure the weight loss of crucible caused by
the gas evolution from the reaction between the metal drop and the slag.
3.4.2 Gas Evolution Curves
Regardless of what method is used in the experiments to measure the rate of reaction, a typical
gas evolution curve has been obtained in the nearly all studies. A variation can be seen in the
trend and the number of peaks detected in these curves depending on the experimental conditions
which were varied from one study to another.
Gaye and Riboud [31] found that in the decarburization of Fe-C-P alloys in the slag, the carbon
content of metal decreased from 2.5 wt% to 0.6 wt% within the first 30 s of reaction and after 2
minutes it became 0.02 wt % (Fig 3.4). Also, in the flow-rate of gas evolution diagrams, two
peaks were observed: a preliminary peak was occurred during the first 5 to 10 s followed by a
decreasing decarburization rate and the second peak in the range of 40-60 s. A similar trend was
reported in [8, 25, 30, 32, 34, 35].

32
Fig 3.4 – Decarburization of three Fe-C drops in the slag: gas flow rate (a) and carbon content change (b), as
a function of time [31]
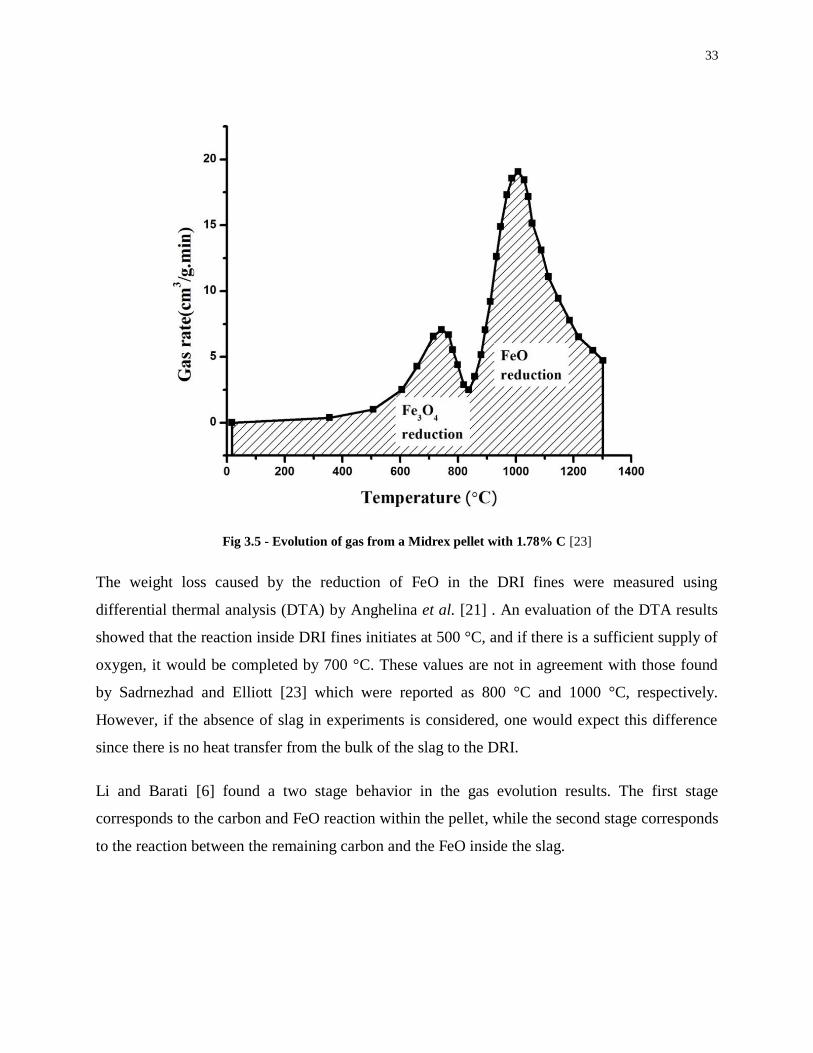
Two peaks were detected in the gas evolution versus temperature curves of DRI-slag reaction by
Sadrnezhad and Elliott [23]. As seen in Fig 3.5, it was concluded that these peaks corresponded
to the reduction of magnetite to wustite and the reduction of wustite to iron, respectively.
However, this conclusion was made by assuming that DRI pellets contain a considerable quantity
of magnetite; which is not the case for all commercial pellets.
33
Fig 3.5 - Evolution of gas from a Midrex pellet with 1.78% C [23]
The weight loss caused by the reduction of FeO in the DRI fines were measured using
differential thermal analysis (DTA) by Anghelina et al. [21] . An evaluation of the DTA results
showed that the reaction inside DRI fines initiates at 500 °C, and if there is a sufficient supply of
oxygen, it would be completed by 700 °C. These values are not in agreement with those found
by Sadrnezhad and Elliott [23] which were reported as 800 °C and 1000 °C, respectively.
However, if the absence of slag in experiments is considered, one would expect this difference
since there is no heat transfer from the bulk of the slag to the DRI.
Li and Barati [6] found a two stage behavior in the gas evolution results. The first stage
corresponds to the carbon and FeO reaction within the pellet, while the second stage corresponds
to the reaction between the remaining carbon and the FeO inside the slag.

34
3.4.3 Effect of Temperature
Since a minimum temperature is required to melt steelmaking slags (~ 1450 ºC) and also rising
the temperature of experiments is difficult due to the instrumental restrictions, most studies have
preferred a relatively small range of temperature in their experiments. The few studies that
examined the effect of temperature found that increasing temperature increases the rate of
reaction. Mulholland et al. [9] detected a significant increase in the rate of reaction when the
temperature was changed from 1450 ºC to 1600 ºC. The increase was found in another study [8]
to be a factor of 2 for a 50 ºC rise in temperature. Murthy et al. [34] measured an activation
energy of 240 kJ.[mol O]-1
, suggesting that chemical reaction is the rate limiting step (Fig 3.6).
Molloseau and Fruehan [25] found a critical temperature of at which the rate of reaction
increased significantly depending on the FeO level of slag. For example, for the slag containing
10 pct FeO, the rate increased by an order of magnitude when the temperature was raised from
1440ºC to 1465ºC.
Fig 3.6 - Effect of Temperature on the Rate of Reduction of FeO (8.1%) in Slag [34]

35
Generally, increasing temperature increases the rate of reaction. On the other hand, the
dependence of the rate on the temperature may be predicted only if the underlying reaction
mechanism is understood. A modeling approach that incorporates fundamental data (such as
activation energy, etc) of the controlling steps may be used for developing a predictive model.
3.4.4 Effect of Drop Size
Sadrnezhad and Elliott [23] concluded that the rate of reaction between DRI and slag is
independent of the pellet size. They found however that rate depends only on the chemical
composition of DRI pellet. Their results may be explained by the fact that the rate of reaction
was expressed per unit mass of the pellet (cm3/g.min), while most of other studies did not
consider the mass of the pellet in the rate calculations. In Fe-C/slag reaction, Murthy et al. [34]
also showed the drop size does not affect the initial rate of reaction but it was demonstrated that
the final carbon content decreases when the drop size is reduced. Inconsistent with these studies,
Min and Fruehan [8] found that the rate of reaction is higher for the larger Fe-C pellets. Fig 3.7
presents the volume of gas evolution for various Fe-C sizes while the initial carbon content and
also, FeO content of slag were kept constant. As seen, increasing the size of Fe-C drop leads to
larger gas evolution rate. This conclusion was in a good agreement with the model developed
later in their study. In another study by Chen and Coley [24], rate of reaction of Fe-C alloys
increased linearly with the drop size. A similar behavior was observed by Goldstein et al. [22]
for DRI pellets with different sizes.

36
Fig 3.7 – The volume of CO formed as a function of time for various size iron carbon drops initially
containing 4.2 wt% carbon in a slag containing 7.5 wt% FeO at 1400°C [8]
3.4.5 Effect of Carbon Content
Nearly all studies on the behavior of Fe-C or DRI pellets have paid a significant attention to the
effect of carbon on the reaction rate since it is of practical importance. However, unlike the effect
of temperature, it seems that there is no general agreement between various studies on
relationship between carbon content and the rate of decarburization. While Mulholland et al. [9]
observed an increase in the rate of decarburization of Fe-C drops with higher carbon contents,
Upadhya et al. [32] concluded that carbon content may not affect the rate of decarburization
significantly. Gare and Hazeldean [7] considered carbon content as a major factor in determining
the rate of decarburization. In another study [8], the rate of reaction increased significantly with
increasing the carbon content, but the authors’ model showed that it is independent of carbon
content. A similar increasing effect was found in [34] and [35].

37
In DRI-slag studies, to simulate the actual conditions of the DRI and slag interactions in the
EAF, commercial DRI pellets are utilized more often than lab-made pellets. Direct reduction
technologies are capable of manipulating the product average carbon. However, there is a wide
variation between carbon content of individual pellets. Therefore, controlling the carbon content
of single DRI pellets in commercial scale is not possible. Also, measuring the carbon content of
each pellet in a non-destructive manner is not possible. Thus, studying the effect of carbon
content using commercial pellets has been a challenge. Goldstein and Fruehan [22] tried to
control the carbon content of DRI samples by crushing, mixing, and re-pressing commercial
pellets into homogenized compacts. Although this approach yields pellets of similar
composition, it introduces a large mismatch in simulating the actual pellet-slag interactions. The
re-processed pellets will have neither the physical properties (such as porosity, density,
roughness and sphericity), nor compositional variations comparable to commercial pellets. For
example, majority of FeO in commercial pellets is in the pellet core, while in the processed
compacts, FeO and C are distributed evenly within the bulk.
Sadrnezhad and Elliott [23] used commercial pellets and showed that neither pellet size nor rate
of heating affects the volume of gas evolved from the reaction: gas evolution depends directly on
the chemical composition of the slag. Nevertheless, they compared the rate of decarburization
corresponding to three carbon levels which was a rather small range of carbon to evaluate its
effect. Besides, no correlation between carbon and rate of reaction was given by the authors.
3.4.6 Effect of Slag FeO Content
The effect of FeO content of slag on the reaction rate has been well established due to the
extensive works which have been performed on the reaction between Fe-C and slag. In one of
these works by Min and Fruehan [8], several Fe-C drops containing 4.2 wt% carbon were
released into the slag containing various FeO levels. It was found that as the FeO increases, the
overall rate of reaction between Fe-C and slag increases. Meanwhile, it was observed that the
final carbon content of drop decreases by increasing the FeO content of slag. Murthy et al. [34]
and Min et al. [29] found a linear relation between the FeO % in slag and the rate of Fe-C
decarburization. A similar behavior was reported by Sarma et al. [30]. Molloseau and Fruehan

38
[25] tried to quantify this increase by introducing a model based on Reaction (4). However, their
model predicted a less increase in the rate of decarburization compared to the experimental data.
They justified this difference based on the fact that an emulsification occurs as a result of the
internal reaction between carbon and excess oxygen (in FeO) and consequently, it enhances the
rate of decarburization. In DRI-slag studies, Li and Barati [6] found that FeO content of slag
strongly affects the rate of decarburization (Fig. 3.8). It was also concluded that if the gas
evolution is high, the FeO content of slag must be taken in account as a secondary rate
controlling factor. In other words, in the DRI pellets with higher carbon contents, the effect of
FeO content of slag is less pronounced compared to the gas agitation effect.
Fig 3.8 – Decarburization rate vs. initial slag FeO for the second stage of decarburization [6]
3.5 Reaction Mechanism
An extensive work has been carried out to determine the rate determining steps for the reaction
between DRI or Fe-C and the slag by a significant number of studies [6, 8, 22, 23, 25, 27, 29, 30,

39
34-37]. However, due to the difficulties, inherent to the nature of high temperature experiments
such as determination of slag and drop properties, unexpected variations and many more
complexities, no general agreement can be found among these researches regarding the reaction
mechanisms. In general, the phenomena that contribute to the reaction between Fe-C/DRI and
slag are heat and mass transfer as well as the chemical reactions. These are discussed in the
following sub-sections.
3.5.1 Heat transfer
Heat transfer from the slag to the DRI and within the DRI may be a rate controlling mechanism,
since the reaction between FeO and C is endothermic. Also, both reaction kinetics and mass
transfer are highly dependent on the temperature distributions that are controlled by heat transfer.
To demonstrate the role of heat transfer in the Fe-C/DRI and slag reactions, a brief introduction
of relevant heat transfer mechanisms and their contribution to the reaction is provided. Also, the
heat transfer-based models proposed for the reaction by various authors are summarized in this
section.
3.5.1.1 Conduction
Simply heat conduction is described based on the temperature gradient in the bulk of object(s).
Eq.5 shows the magnitude of heat transfer by conduction [38]:
[5]
where is the thermal conductivity and T is the temperature. In DRI-slag reactions, conduction
occurs inside the pellet and depends directly on the thermal conductivity of DRI pellet. To
estimate the heat conduction inside the pellet, thermal conductivity of DRI and the temperature
gradient inside the pellet are required. The former can be measured experimentally while the
latter requires developing an appropriate model to predict the temperature profile inside the
pellet.
40
3.5.1.2 Convection
Heat convection is the transfer of thermal energy between a solid phase and a fluid which can be
gas or liquid. Convection is quantified by Newton’s law:
[6]
where is the overall convective heat transfer coefficient, A is the surface area of heat transfer
and and are temperatures of surface and fluid in the bulk, respectively [39]. In DRI-slag
reaction, convection exists in the form of a flow of heat from the bulk of slag to the surface of
pellet. In this case, heat transfer coefficient depends on the slag viscosity, pellet size, relative
movement of pellet and slag, and the temperature difference between slag and the DRI pellet.
There is also another type of heat transfer and that is radiation which is defined as the emitted
thermal energy from the surface of an object. Since the heat transfer in the form of radiation
associated with DRI-slag reactions is not significant, it can be neglected.
3.5.1.3 Heat Transfer-based Models for Metal-slag Reactions
The first heat transfer model for the reaction between DRI and steelmaking slag was introduced
by Sadrnezhad and Elliott [23]. From this model, which was numerically solved, it was possible
to estimate the melting time of DRI pellets for various slag compositions. However, the authors
confirmed that this model did not take into consideration the agitation caused by gas evolution
inside the molten slag.
In another study by Goldstein and Fruehan [22], a heat transfer model for the DRI-slag reaction
was developed and solved numerically. The model is similar to the one introduced by
Sadrnezhad and Elliot [23]. Several possible mechanisms were assumed to be responsible for
controlling the rate of reaction: mass transfer, reaction control, and heat transfer. The results
indicated that neither mass transfer nor reaction control is the rate controlling factor: rather, heat

41
transfer controls the DRI-slag reaction rate. A comparison of the experimental data and the heat
transfer model supported this conclusion.
3.5.2 Mass transfer
Mass transfer is a flow of the mass provoked by a concentration gradient in a bulk containing
several constituents. Generally, it is expressed in terms of Fick’s law:
[7]
where N is the mass flux (mol/s.m2), D is the mass diffusion coefficient and
is the
concentration gradient [40].
The reaction between slag and DRI involves several mass transfer processes:
- Slag bulk mass transfer of FeO
- C diffusion within DRI or Fe-C
- Gas phase mass transfer of CO/CO2
Min and Fruehan [8] calculated the rate of carbon diffusion in Fe-C drops and found that it is
higher than the measured reaction rate. Therefore, the carbon diffusion step was not considered
as a controlling mechanism. They also found that FeO content of slag does not affect the rate of
decarburization. However, they considered mass transfer (FeO and C) as a controlling step at
lower sulfur content of metal based on the fact that sulfur affects the rate of reaction
substantially. A similar behavior was observed by Murthy and Elliott [35] while Sarma et al.
[30] discussed that mass transfer of FeO inside the slag is less likely to control the reaction rate.
They justified this conclusion based on the high rate of mass transfer induced by intense
agitation of bath during gas evolution. In contradiction to the above studies, Min et al. [29]
showed that at lower activity of FeO in the slag (<0.5), mass transfer of FeO is a controlling step
of reaction between Fe-C and the slag. Similarly, Paul et al. [41] discussed that under low FeO
conditions (below 15 wt pct); mass transfer of FeO in the slag phase is the controlling step.

42
3.5.3 Reaction Control
Gas-slag and gas-metal reactions represented by Reaction [3.3] and [3.4] can act as controlling
steps in the decarburization of DRI or Fe-C alloys [8]. Rate of Reaction [3.2], can be expressed
as:
[8]
where and are the concentrations of FeO in the slag and carbon in the drop, respectively.
K is the rate constant for the Reaction [3.2] and depends on the temperature by an Arrhenius-
type relationship:
[9]
where is a constant, is the activation energy, and is the universal gas constant.
Srinivasan and Lahiri [37] introduced a model based on the kinetics of reactions (3.1-3.4).
However, no evidence was given to check whether their model was in accordance with the
experimental data. Min and Fruehan [8] considered reactions [3.3] and [3.4] as rate determining
steps at higher sulfur contents of metal. The gasification represented by Reaction [3.4] was
considered as the rate controlling step in several other studies [27, 36].
3.5.4 Mixed Mechanism
Reviewing several works on the mechanism of reaction between DRI or Fe-C and slag shows an
inconsistency between various studies. As mentioned previously, each mechanism was
introduced under specific conditions of experiments. In other words, each mechanism can be
considered for the reaction of DRI and slag depending on the reaction conditions such as
chemical composition of metal and slag and different periods of reaction time. Based on this fact,
some studies suggested a mixed mechanism for modeling the reaction [6, 22, 25].
43
Min and Fruehan [8] presented a mixed mechanism model for the Fe-C/slag reaction. However,
their model is independent of carbon content and cannot predict the effect of carbon on the rate
of decarburization.
3.6 Summary
Although a significant number of researches have been carried out on the reaction between Fe-C
alloys and the slag, only a few have focused on the DRI-slag reaction. Furthermore, some aspects
of reaction between DRI and slag are still unclear. The effect of carbon has not been quantified
and no general agreement has been found for the controlling mechanism of reaction. Also, while
introducing the hot DRI into EAF is becoming widespread, no investigation has been performed
about the effect of DRI temperature on the kinetics of DRI-slag reaction.
Also, optimization of the process conditions for the CRISP steelmaking technology– that relies
on the slag-DRI interactions for refining the steel – requires a profound understanding of such
interactions and the underlying mechanisms. For example, the viability of the process depends
on the extent of carbon removal, only through the slag and during the time that steel is remained
in the furnace. Also, the melting rate of pellet is determined by both the power input and the
heat/mass transfer between DRI and slag. Heat transfer on the other hand is significantly affected
by the rate of gas evolution, that in turn is governed by the reaction rate. Insufficient heat transfer
can result in slow melting and formation of unmelted “pellet-bergs” that can eventually halt the
process.
Therefore, it is evident that in both conventional EAFs and CRISP, DRI-slag reaction kinetics
plays the most important role in the melting rate and refining extent of the steel. This work was
undertaken to study the mechanisms and kinetics of DRI-slag reactions, aiming to obtain an
understanding of the principle mechanisms, also to quantify the reaction kinetics. In particular,
the interest was to quantify the effect of those parameters that have not been paid much attention
before such as DRI carbon content and preheating temperature.

44
Chapter 4
Experimental Work
4.1 Experimental Approach
The experimental work included studying the kinetics of slag-DRI reactions by measuring the
rate of gas evolution caused by the reaction between FeO and carbon. Briefly, in each
experiment a single commercial DRI pellet was released into the molten slag at the desired
temperature. Then, the amount of gas evolved was measured continuously for a certain period of
time. The results were then processed to yield rate of the reaction. In this chapter, the details of
the experimental procedures and conditions are presented.
4.2 Materials
The previous works on DRI-slag reaction have examined the effect of slag composition on the
decarburization rate [6]. As discussed in the previous chapter, the objective of this work is to
study the effect of carbon, slag temperature and DRI preheating temperature on the reaction
kinetics. Therefore, the slag composition remained constant for all experiments. As shown in
Table 4.1 the target slag composition is 22 FeO, 42 CaO, 22 SiO2, 4 Al2O3, 10 MgO (wt %).
Table 4.1 – Chemical composition of slag (% wt)
FeO CaO SiO2 Al2O3 MgO
22 42 22 4 10
The composition was chosen to achieve the bacisity of 2.0 in the slag ( bacisity is defined as the
V ratio: B= (MgO+CaO)/ (SiO2+Al2O3)). The slag composition including basicity, FeO and
MgO contents were set to the above values to simulate the optimum slag composition for the
CRISP technology, for producing a low carbon steel.
The purity and particle size of the slag forming materials are provided in Table 4.2.

45
Table 4.2 – The purity and particle size of slag forming materials
Material Purity (wt%) Particle Size (mm)
Mill scale 94 FeO 0.149
CaO* Reagent grade 0.044
SiO2* 99.5 0.063
Al2O3* 99.5 0.063
MgO* 96 0.037
* Supplied by Alfa Aesar
DRI pellets from Arcelormittal (Quebec, Canada) were used in this study with the average
composition given in Table 4.3. Also, a high purity high density MgO crucible (99.9%) was used
to hold the slag in the experiments.
Table 4.3 – Average Chemical Composition of DRI (%Wt)
Total Fe Metallization C S SiO2 Al2O3 CaO MgO
92 95 2.2 0.006 2.15 0.5 0.6 0.5
As shown in Table 4.3, the average carbon content of DRI pellets is 2.2 % wt. However, as
discussed earlier, each pellet will have a different carbon content, that cannot be determined prior
to the experiment, due to the destructive nature of the C analysis tests. Consequently, the carbon
content of the pellets was determined after the experiments by performing carbon balance. The
details of this method will be discussed in Section 4.9.
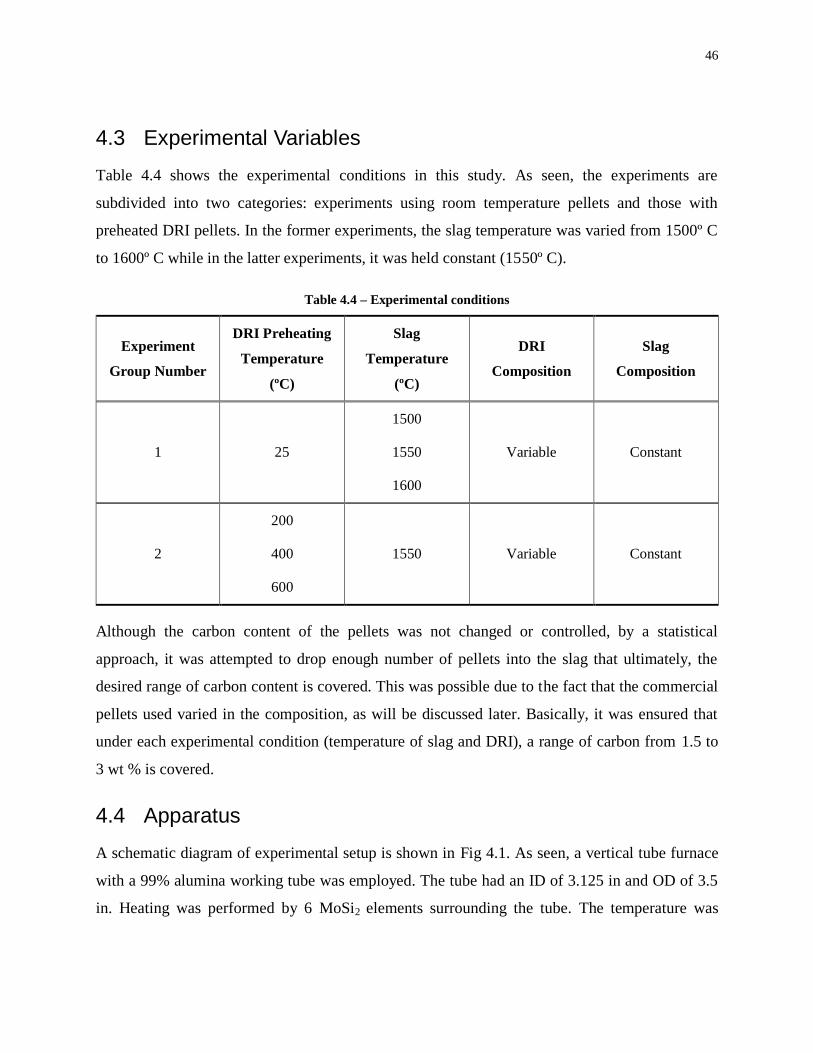
46
4.3 Experimental Variables
Table 4.4 shows the experimental conditions in this study. As seen, the experiments are
subdivided into two categories: experiments using room temperature pellets and those with
preheated DRI pellets. In the former experiments, the slag temperature was varied from 1500º C
to 1600º C while in the latter experiments, it was held constant (1550º C).
Table 4.4 – Experimental conditions
Experiment
Group Number
DRI Preheating
Temperature
(ºC)
Slag
Temperature
(ºC)
DRI
Composition
Slag
Composition
1 25
1500
1550
1600
Variable Constant
2
200
400
600
1550 Variable Constant
Although the carbon content of the pellets was not changed or controlled, by a statistical
approach, it was attempted to drop enough number of pellets into the slag that ultimately, the
desired range of carbon content is covered. This was possible due to the fact that the commercial
pellets used varied in the composition, as will be discussed later. Basically, it was ensured that
under each experimental condition (temperature of slag and DRI), a range of carbon from 1.5 to
3 wt % is covered.
4.4 Apparatus
A schematic diagram of experimental setup is shown in Fig 4.1. As seen, a vertical tube furnace
with a 99% alumina working tube was employed. The tube had an ID of 3.125 in and OD of 3.5
in. Heating was performed by 6 MoSi2 elements surrounding the tube. The temperature was

47
monitored continuously by a Eurotherm furnace power control system. Temperature
measurement was carried out by a type-B thermocouple positioned underneath the crucible. It
was ensured that the crucible was placed in the uniform temperature zone of the furnace. As
shown in Fig 4.1, the working alumina tube was completely sealed by two water-cooled stainless
steel caps in the top and bottom of furnace. An inert atmosphere was maintained inside the tube
by passing high purity argon (with less than 5 ppm oxygen) to avoid the oxidation of slag and
pellet.
Fig 4.1 – Schematic diagram of experimental setup
Argon
Syringe
Thermocouple
Bottom Cap
(Water-Cooled)
Top Cap
(Water- Cooled)
Pressure
Transducer
Pressure Indicator
Gas Outlet
Slag MgO
Crucible
Alumina Tube
DRI Pellet
Magnet
Furnace

48
As shown in Fig 4.2, the temperature variation in the height of 6 cm (from 50 to 56 cm) was
1498 2 º C.
Fig 4.2 – Temperature profile of vertical furnace as a function of distance from the bottom cap
4.5 Experimental Procedure
Before running each experiment, 100 g of slag materials were premixed and then pressed into
several discs. The disc was loaded into a high density, high purity (99.9%) magnesia crucible 50
mm in diameter and 152 mm in height. The crucible was then placed on an alumina dish located
in the middle of the furnace supported by an alumina pedestal. Afterwards, it was heated very
slowly (1.7 ºC.min-1
) until the desired slag temperature was reached. The slag temperature was
measured by a B-type (Pt-13%Rh) thermocouple located at the bottom of crucible during the
experiments. Meanwhile, the DRI pellet was suspended inside the working tube by a magnet
located outside the furnace, as shown in Fig 4.1. After holding the temperature for 60 minutes,
the pellet was released into the slag by removing the magnet. Since the distance between the DRI
position and the slag surface is relatively large (approximately 800 mm), another alumina tube

49
was used to direct the dropping and avoid wandering movement of the pellet after removing the
magnet. The temperature of DRI pellet was expected to be 70 ºC as measured by Li and Barati
[6] in the same experimental setup. Once the DRI entered the molten slag, reaction began and a
gas (presumably rich in CO) resulting from the reaction between DRI and slag was evolved. The
pressure rise caused by this gas evolution, was measured using the CVPI technique. A high
accuracy pressure transducer (model# GP50) was employed to measure the pressure increase. It
was adjusted for monitoring the pressure range of 0-10 psi based on the fact that a maximum
pressure detected during experiments was approximately 4 psi. The pressure values were
recorded at the time intervals of 1 s and then transferred to a computer through a RS232 data
port. Each experimental data was saved in a separate text file for future evaluation.
4.6 Preheating Experiments
For several experiments, it was intended that the DRI pellet be preheated before being released
into the slag. Preheating of the pellets outside the furnace was ruled out as an option, as (a) it
would require an external heating source, (b) oxidation of DRI during the transfer to the furnace
may occur, and (c) any temperature drop during the transfer may not be measured, (d) sealing the
furnace immediately after the transfer would be very difficult. Therefore, in the experiments, a
minor change was made in the setup in order to preheat DRI pellets inside the same furnace. Fig
4.3 demonstrates the schematic diagram of the setup used in these experiments. Since all parts of
experimental apparatus remained the same, only the part which was changed is shown in this
figure. As seen, instead of magnet, the DRI pellet was suspended by a copper wire inside the
furnace. The Copper wire was passed through the needle of a syringe. When the pellet reached
the desired temperature, it was dropped into the slag by cutting the copper wire. In this approach,
the temperature of the pellet could be accurately controlled by adjusting the length of the wire so
that pellet is positioned in a proper distance from the furnace hot zone and reaches a certain
temperature, maintained by the characteristic temperature profile of the furnace.
The holding time and the distance of pellet from top of the furnace required for preheating, were
determined based on the calibration data using a type-K thermocouple inserted into a pellet
before each experiment. In the experiments with a “dummy” pellet, the temperature of the pellet
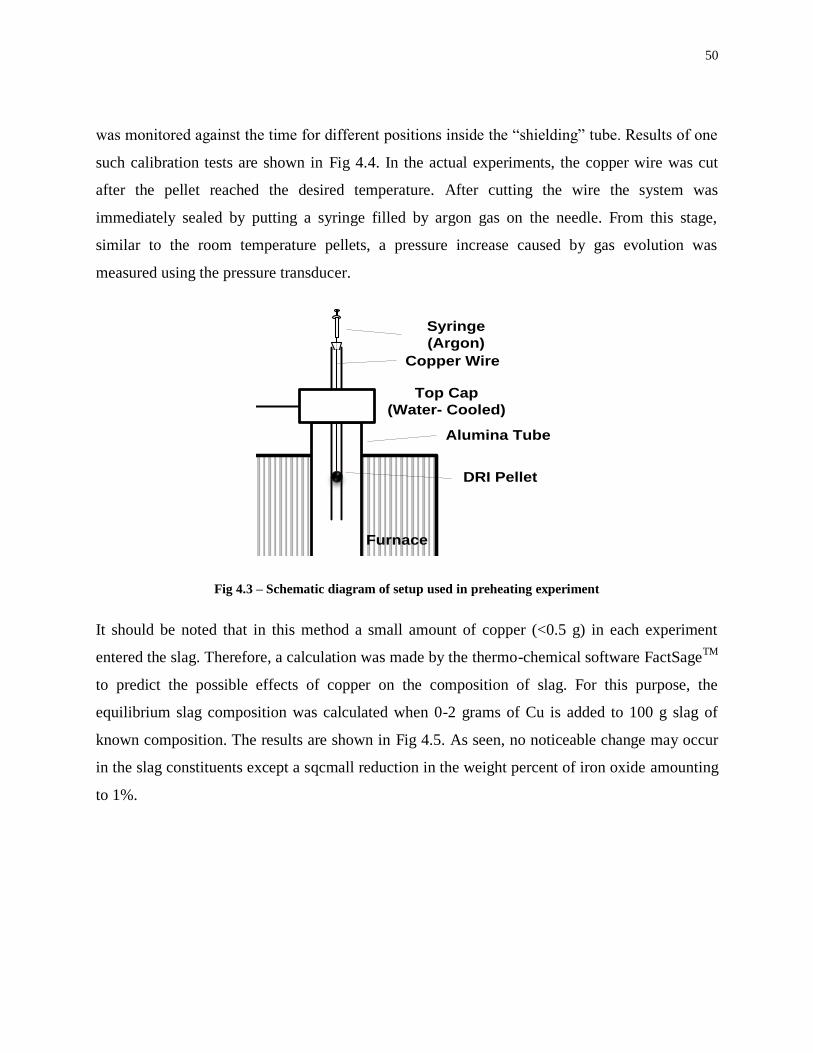
50
was monitored against the time for different positions inside the “shielding” tube. Results of one
such calibration tests are shown in Fig 4.4. In the actual experiments, the copper wire was cut
after the pellet reached the desired temperature. After cutting the wire the system was
immediately sealed by putting a syringe filled by argon gas on the needle. From this stage,
similar to the room temperature pellets, a pressure increase caused by gas evolution was
measured using the pressure transducer.
Fig 4.3 – Schematic diagram of setup used in preheating experiment
It should be noted that in this method a small amount of copper (<0.5 g) in each experiment
entered the slag. Therefore, a calculation was made by the thermo-chemical software FactSageTM
to predict the possible effects of copper on the composition of slag. For this purpose, the
equilibrium slag composition was calculated when 0-2 grams of Cu is added to 100 g slag of
known composition. The results are shown in Fig 4.5. As seen, no noticeable change may occur
in the slag constituents except a sqcmall reduction in the weight percent of iron oxide amounting
to 1%.
Argon
Syringe
Thermocouple
Bottom Cap
(Water- Cooled)
Top Cap
(Water- Cooled)
Pressure
Transducer
Pressure Indicator
Gas Outlet
Slag MgO
Crucible
Alumina Tube
DRI Pellet
Syringe
(Argon)
Furnace
Copper Wire
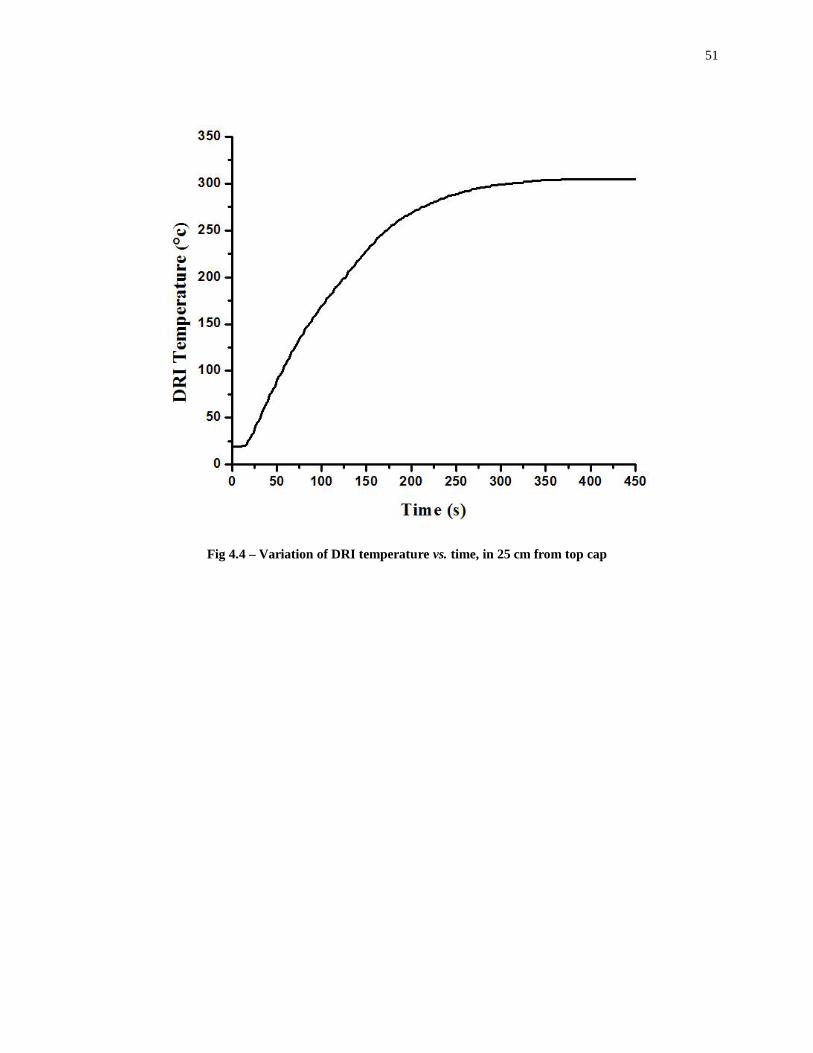
51
Fig 4.4 – Variation of DRI temperature vs. time, in 25 cm from top cap

52
Fig 4.5 – Effect of the copper on the composition of slag
4.7 Slag-free Experiments
In order to determine the thermal conductivity of DRI pellets utilized in this study and also, to
find the rate of reaction between carbon and iron oxide within the pellet, some experiments were
conducted in the absence of slag. In these experiments, a type-K thermocouple was inserted into
the DRI pellets of almost identical size. The thermocouple was passed through a rubber plug that
sealed the furnace from top. After entering the thermocouple and pellet into the furnace, the
pressure rise resulted by the reaction between carbon and FeO inside the pellet was monitored by
the pressure transducer. At the same time the temperature data obtained by the type-K
thermocouple connected to a thermometer were recorded and transferred to a PC. Once the
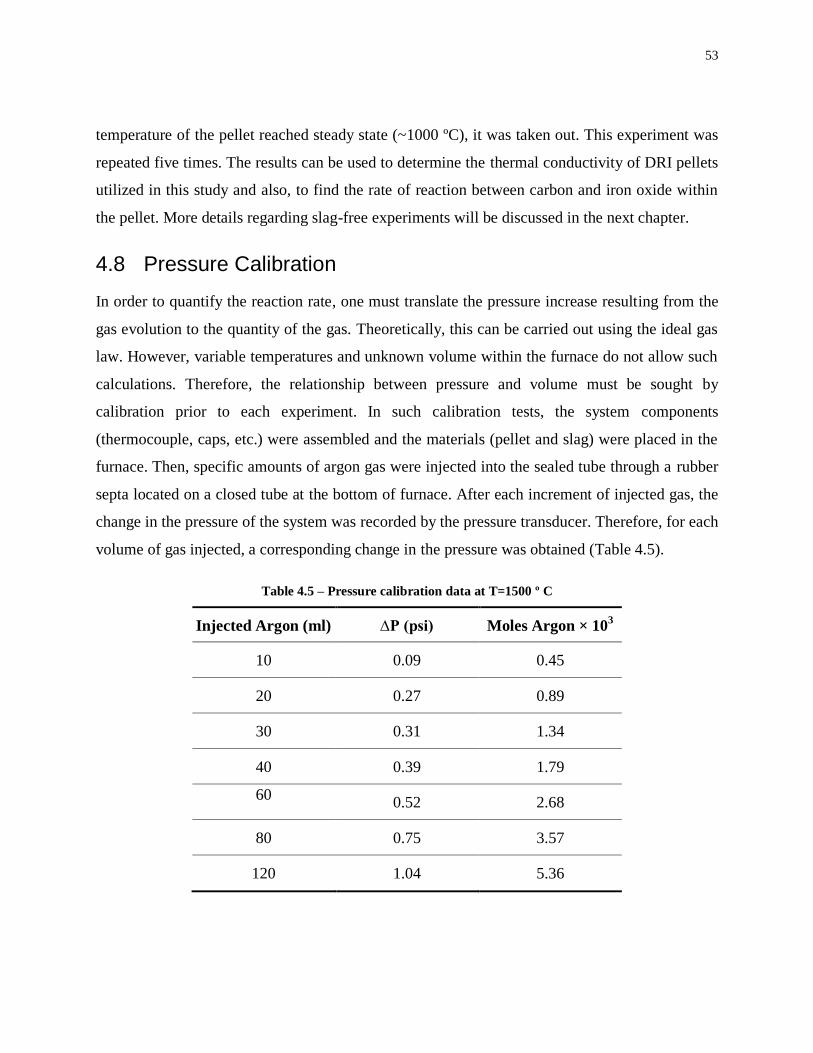
53
temperature of the pellet reached steady state (~1000 ºC), it was taken out. This experiment was
repeated five times. The results can be used to determine the thermal conductivity of DRI pellets
utilized in this study and also, to find the rate of reaction between carbon and iron oxide within
the pellet. More details regarding slag-free experiments will be discussed in the next chapter.
4.8 Pressure Calibration
In order to quantify the reaction rate, one must translate the pressure increase resulting from the
gas evolution to the quantity of the gas. Theoretically, this can be carried out using the ideal gas
law. However, variable temperatures and unknown volume within the furnace do not allow such
calculations. Therefore, the relationship between pressure and volume must be sought by
calibration prior to each experiment. In such calibration tests, the system components
(thermocouple, caps, etc.) were assembled and the materials (pellet and slag) were placed in the
furnace. Then, specific amounts of argon gas were injected into the sealed tube through a rubber
septa located on a closed tube at the bottom of furnace. After each increment of injected gas, the
change in the pressure of the system was recorded by the pressure transducer. Therefore, for each
volume of gas injected, a corresponding change in the pressure was obtained (Table 4.5).
Table 4.5 – Pressure calibration data at T=1500 º C
Injected Argon (ml) ∆P (psi) Moles Argon × 103
10 0.09 0.45
20 0.27 0.89
30 0.31 1.34
40 0.39 1.79
60
0.52 2.68
80 0.75 3.57
120 1.04 5.36

54
The calibration chart is obtained by plotting the mole of gas injected versus the change in
pressure (∆P), as seen in Fig 4.6. This correlation was used later to convert pressure values to the
gas amounts after each experiment. A similar procedure was performed for each experimental
temperature.
Fig 4.6 – Relationship between injected gas and ∆P at T=1500 º C
4.9 Carbon Test and XRF
After each experiment the crucible including slag powder and the metal droplet was taken out.
The metal droplet was recovered by a magnet, then weighed and analysed for carbon and sulphur
by LECO combustion. The accuracy of the technique for the detection of carbon is up to 1 ppm.
The carbon analysis obtained from LECO test was used to calculate the initial carbon content of
each pellet using the mass balance presented in Eq.9. It should be noticed that the volume of
CO(g) was obtained after each experiment using the pressure calibration data.

55
Initial Carbon = Carbon[CO(g)] + Carbon [droplet] [9]
As previously shown in Table 4.3, the average carbon content of the commercial DRI was 2.2%.
However, the above analysis performed on the C content of individual pellets indicates that the
variations in the carbon content is very wide, ranging from 1.42 to 4.59 wt%. Table 4.6 provides
the results of the C calculations. Also, shows the variations in the range of carbon, pointing to an
average carbon of 2.46 wt% with a standard deviation of 0.71.
In this table, also is provided the estimated FeO content of the slag. This calculation is based on
an interpretation and analysis of the CO evolution curves. Generally, each curve consisted of two
parts, as shown in Fig 5.1 (in the next chapter); our analysis indicates that the first domain of gas
evolution is related to the reaction between the FeO and carbon within the DRI pellet. This step
ends when the FeO content becomes virtually zero. Therefore, the amount of FeO may be
estimated by knowing the total carbon reacted with the FeO and assuming that the gas is purely
CO. As seen in Table 4.6, FeO ranges from 4.4 to 14.3 wt% that matches the typical FeO content
of commercial DRIs.
The slag powder was also sieved to remove the large particles and was sent to the XRF test to
determine the approximate composition indicating whether the slag conditions remained same
during the experiment.

56
Fig 4.7 - Variations of carbon content in the DRI pellets
Table 4.7 shows the XRF results of slag samples after the experiments. As seen, the average
composition of slag is presented. Since the XRF test is unable to determine the type of iron oxide
inside the samples, the total iron content of slag is denoted by pure iron in the final results.
However, the results indicate a good agreement between the target and final slag composition.
Considering that the slag used for XRF analysis (1 g) might not be well representative of the
entire slag composition, the differences seen are considered acceptable.
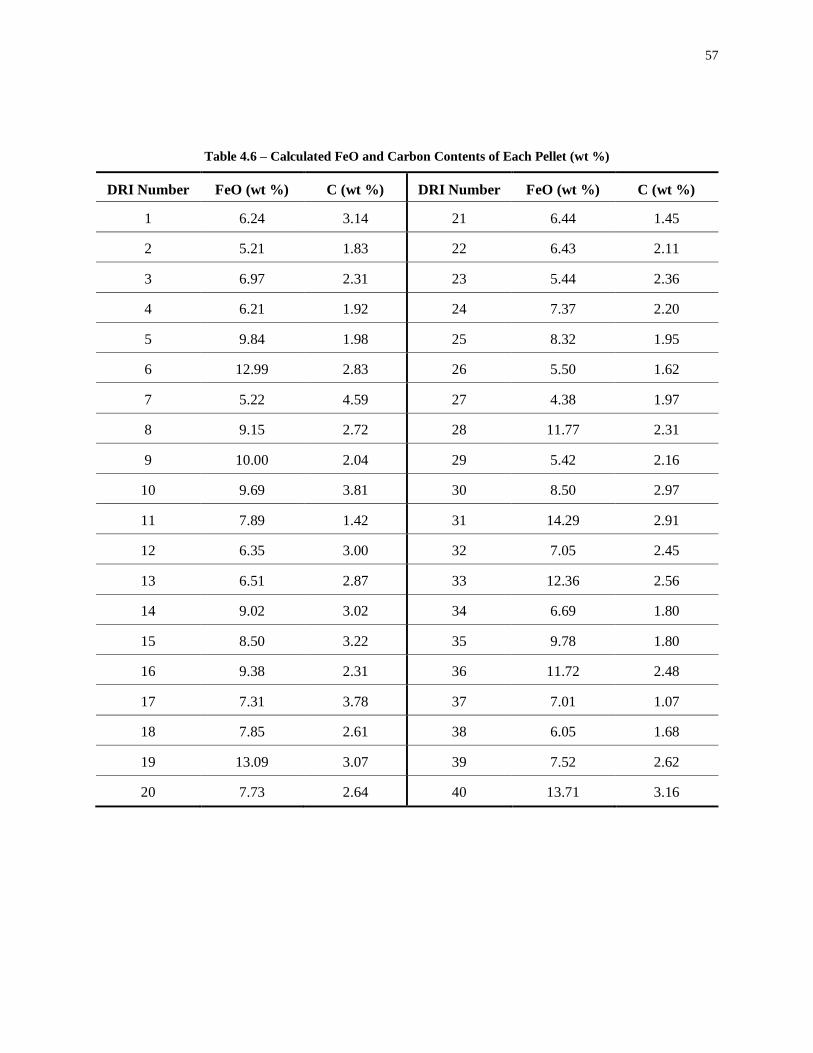
57
Table 4.6 – Calculated FeO and Carbon Contents of Each Pellet (wt %)
DRI Number
FeO (wt %) C (wt %) DRI Number
FeO (wt %) C (wt %)
1 6.24 3.14 21 6.44 1.45
2
5.21 1.83 22 6.43 2.11
3 6.97 2.31 23 5.44 2.36
4 6.21 1.92 24 7.37 2.20
5 9.84 1.98 25 8.32 1.95
6 12.99 2.83 26 5.50 1.62
7 5.22 4.59 27 4.38 1.97
8 9.15 2.72 28 11.77 2.31
9 10.00 2.04 29 5.42 2.16
10 9.69 3.81 30 8.50 2.97
11 7.89 1.42 31 14.29 2.91
12 6.35 3.00 32 7.05 2.45
13 6.51 2.87 33 12.36 2.56
14 9.02 3.02 34 6.69 1.80
15 8.50 3.22 35 9.78 1.80
16 9.38 2.31 36 11.72 2.48
17 7.31 3.78 37 7.01 1.07
18 7.85 2.61 38 6.05 1.68
19 13.09 3.07 39 7.52 2.62
20 7.73 2.64 40 13.71 3.16

58
Table 4.7 – XRF results of slag samples after the experiments
Component Average wt pct Standard Deviation (wt pct)
MgO 8.2 1.8
Al2O3 3.4 1.5
SiO2 27.6 2.2
CaO 41.6 5.5
Fe 19.8 4.8
59
Chapter 5 Results and Discussion
5.1 Gas Evolution Behavior
Fig 5.1 shows the gas evolution curves corresponding to slag temperatures of 1500 and 1600ºC.
As seen, depending on the reaction conditions such as slag temperature and carbon content, a
different behavior may be observed. In Fig 5.1, for the pellet containing 3.18 wt pct carbon and
dropped into slag at 1600 °C, a two stage behavior was identified: a rapid gas evolution period
(identified as region 1), followed by a stage where the rate of gas evolution is substantially
reduced (region 2). A similar trend was obtained in majority of the experiments. This conforms
to the behavior previously observed in the other studies [6, 7, 7, 9, 25]. It is accepted that the first
stage corresponds to the reaction between the carbon and FeO within the pellet. After FeO of the
pellet is consumed completely, the remaining carbon reacts with the FeO of slag (second stage).
However, in several experiments, a different behavior with three distinctive stages of gas
evolution was noted. As an example of these cases, the gas evolution of a pellet with 3.14 wt pct
carbon released into slag at 1500ºC is shown in Fig 5.1. In a somewhat similar observation, Gare
and Hazeldean [7] found a lull period in the carbon against time curves after the first rapid
decarburization. They suggested that at the end of first period as the carbon content drops, the
rate of decarburization decreases and consequently, the gas halo around the pellet begins to
collapse. Subsequently, the oxygen required to reacts with the remaining carbon is supplied by
the iron oxide from the slag bulk. Therefore, the diffusion of oxygen from the slag phase to the
metal-slag interface may take a finite time, after which the reaction proceeds, but at a slower
rate. Accordingly, a complete picture of the DRI–slag interactions that supports the three–stage
feature of these experiments may be explained as following.

60
Fig 5.1 – Gas vs. time curve for two DRI pellets at T=1600ºC and T=1500ºC
In the reaction between DRI and slag, decarburization first takes place through the FeO present
within the pellet, once proper local temperature is reached (Stage 1). The reaction continues until
FeO of pellet is consumed. Provided that DRI contains additional carbon, the reaction will
proceed through the consumption of slag FeO (Stage 2). However, the reaction is first slowed or
practically stopped (transitional stage) because of four possible reasons; (a) when pellet is still
partially solid, decarburization by slag involves diffusion of carbon from within the pellet to the
slag–pellet interface (b) melting of pellet that would accelerate the reactions requires a finite time
for the heat transfer to pellet, this time is extended because of the decrease in the gas evolution
rate that in turn hinders movement of pellet and reduces the rate of heat transfer, (c)
decarburization by slag requires mass transfer of FeO in the slag phase, that is slowed
substantially when gas release of the first stage is stopped, and (d) similar to the decarburization
of liquid Fe–C drops [24], oxygen must diffuse through the liquid metal and super–saturate the
61
drop before CO bubbles are formed and released. Consequently, it is reasonable that the third
step of the reaction takes over after some period of inactivity or slow interactions. It is believed
that the same mechanism holds for all pellets. However, the duration of the transitional stage is
not long enough to be distinctly seen in all experiments. For example, higher temperatures of
slag may contribute to the shortening of this stage by increasing the rates of both heat transfer
and FeO mass transport, as well as accelerating the rates of diffusion of carbon to the pellet
surface and oxygen to the liquid metal.
In some experiments only the first stage of gas release was observed. Fig 5.2 shows the gas-time
curve for a DRI pellet with 1.4 wt% carbon content at 1550 ºC. As can be seen, one region
indicating that only one reaction is occurring, is identified. Later analysis of the results showed
that for all cases where the second stage was absent, the carbon content of DRI was relatively
low, typically below 1.8 wt%. This one–stage decarburization behavior is thus justified as
follows; in DRIs with low carbon, essentially all of carbon reacts with FeO within the DRI, so
that no excess carbon remains in the DRI to react with slag. Therefore, the second gas release
domain that was indicative of the reaction between the remaining carbon and FeO inside the slag
does not occur, or has too small contribution to the overall reaction rate, to be distinguished.
Also, it is suggested that for the pellets with low carbon content, the behavior of DRI in the slag
is independent of slag composition due to the fact that no reaction takes place between carbon
and FeO inside the slag. Consequently, the carbon content of DRI plays an important role in the
DRI-slag interactions.

62
Fig 5.2 - Gas vs. Time Curve for a DRI Pellet with 1.42% C at T=1550 º C
5.2 Slag-free Experiments
As mentioned in the previous section, in a separate set of experiments, the DRI pellets were
heated up to 1000ºC to observe the behavior of internal reaction between carbon and FeO. This
reaction represents the first stage of DRI decarburization in the slag. Therefore, it also gives an
insight to the rapid stage of gas evolution in DRI-slag interactions. Also, in these experiments, a
thermocouple was inserted in the pellets in order to measure the temperature of pellet,
simultaneously.
Fig 5.3 presents a temperature-gas-time curve obtained from a DRI pellet weighing 4.33 g. As
seen, the internal reaction between FeO and C starts at certain temperature (~880ºC) and
continued until the temperature reaches 1000 ºC. The experiment was repeated for several other
pellets and it was found that regardless of DRI weight and composition, the reaction commences
at a similar point which was found earlier. It must be noted however that the above temperature
is the temperature at the DRI core, where thermocouple tip is. Therefore the surface temperature

63
of DRI is certainly higher. The difference between the core and surface temperature depends on
the thermal conductivity of pellet.
Fig 5.3 – Temperature – gas evolution –time curve for a DRI pellet (furnace temperature=1550ºC)
A limited amount of experimental data has been reported for the thermal conductivity of DRI.
Gudenau et al. [42] found the thermal conductivity for pressed powder of DRI at temperatures
between 200 and 1400 ºC which is certainly different from the heat conductivity of commercial
DRIs. Another method to determine the heat conductivity of porous metals is using the
predictive models. One of these techniques was introduced by Koh and Fortini [43] using the
porosity, composition and structure as the variables. However, these models are subject to
considerable error. Therefore, the value of thermal conductivity at various temperatures was
estimated using the temperature-time data obtained from slag-free experiments.

64
It is known that for a sphere with initially uniform temperature which experiences a variation in
the temperature, a one-term approximation may be applied to determine the temperature
distribution inside the sphere [44]:
[5.1]
where and are the constants which are dependent on the Biot number, is the Fourier
number, is the radius of sphere and T is the temperature at a distance of from the DRI
centre.
Since in the slag-free experiments, the core temperature of DRI pellets was measured, the above
equation can be written for the temperature at the centre of the pellet:
[5.2]
where is the temperature at the centre of pellet.
The natural convection and also radiation from the hot zone of furnace were considered as the
heat transfer phenomena in the experiments. Subsequently, the heat transfer coefficient
corresponding to the heat flux from the surrounding air to the DRI pellet was estimated using the
general relationships for sphere. Values of thermal conductivity were calculated by fitting
theoretical temperature profiles (Eq. 5.2) to experimentally obtained temperature profiles, using
the thermal conductivity as the fitting parameter.
5.2.1 Specific Heat
The specific heat of DRI was calculated using Kopp’s rule:
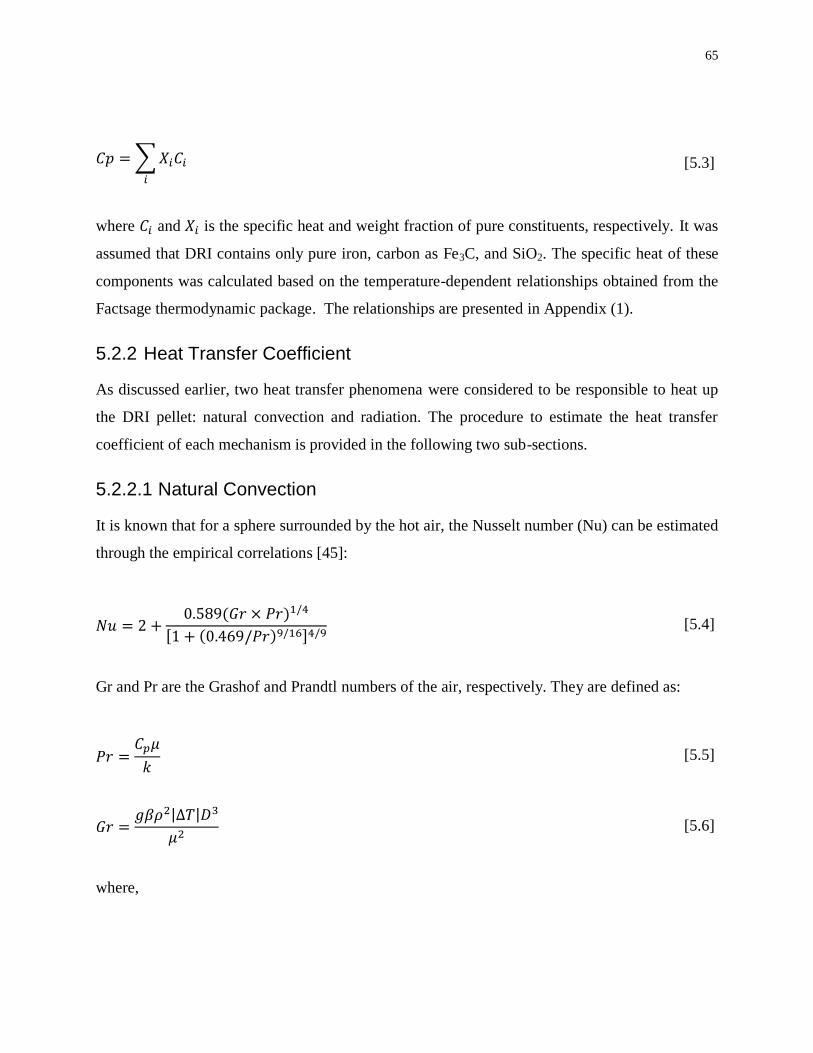
65
[5.3]
where and is the specific heat and weight fraction of pure constituents, respectively. It was
assumed that DRI contains only pure iron, carbon as Fe3C, and SiO2. The specific heat of these
components was calculated based on the temperature-dependent relationships obtained from the
Factsage thermodynamic package. The relationships are presented in Appendix (1).
5.2.2 Heat Transfer Coefficient
As discussed earlier, two heat transfer phenomena were considered to be responsible to heat up
the DRI pellet: natural convection and radiation. The procedure to estimate the heat transfer
coefficient of each mechanism is provided in the following two sub-sections.
5.2.2.1 Natural Convection
It is known that for a sphere surrounded by the hot air, the Nusselt number (Nu) can be estimated
through the empirical correlations [45]:
[5.4]
Gr and Pr are the Grashof and Prandtl numbers of the air, respectively. They are defined as:
[5.5]
[5.6]
where,

66
is the specific heat,
is the viscosity,
is the thermal conductivity,
is the gravity coefficient,
is the volumetric thermal expansion coefficient,
is the temperature deference,
and is the diameter of pellet.
It must be noted that all properties of air were calculated at the film temperature of .
The only exception was which was estimated at [45]. Thermophysical properties of air
were obtained from the ASHRAE handbook [45] at atmospheric pressure. Also, can be
expressed in the following approximate form:
[5.7]
Finally, the heat transfer coefficient of natural convention (h) was estimated through the
following relationship between h and Nu number:
[5.8]
5.2.2.2 Radiation
Thermal radiation is emitted from the hot zone of furnace. The heat transfer associated with this
type of heat transfer is expressed in the following form:
[5.9]

67
where is the Stefan-Boltzmann constant (5.6 × 10⁻⁸
W.m-2
.K-4
) and is the emissivity which is
a radiative property of the surface. The emissivity of DRI pellet was assumed 0.85 based on the
data available for the porous materials [44].
5.2.3 Thermal Conductivity
As mentioned earlier, by using an iteration method the thermal conductivity of DRI pellet as a
function of measured core temperature. Fig 5.4 presents the thermal conductivity of DRI pellet
versus the core temperature of pellet obtained from the above procedure. The same method was
repeated for another pellet with 4.2 g weight and the same behavior observed (Fig 5.5).
Fig 5.4 – Thermal conductivity of the DRI shown in Fig 5.3 as a function of core temperature
Gudenau et al. [42] found an increasing trend at above 1200°C as the temperature increased.
They believed that it may attribute to the sintering of pressed samples due to the fact that
sintering leads to the formation of “bridges” between the grains of DRI. However in the present

68
study, although the range of thermal conductivities is similar to those found by Gudenau et al.
[42], as seen, the conductivity decreases with increasing the temperature of the pellet.
Fig 5.5 - Thermal conductivity of a DRI pellet with 4.2 g weight as a function of core temperature
It must be noticed that in the slag-free experiments the temperatures did not exceed 1000°C.
Furthermore, it is known that thermal conductivity is a strong function of porosity, and due to the
fact that they measured the thermal conductivity for the pressed DRI powder (not commercial
DRI), it was expected that sintering the pellets during the heating above 1200°C can strongly
influence the thermal conductivity of DRI. On the other hand, in another study by Akiyama et al.
[46] thermal conductivity of dense iron oxide and porous iron ore agglomerates in the reduction
process was measured experimentally using the flash laser method. In particular, they measured
the thermal conductivity of pellets reduced to iron by carbon monoxide and hydrogen (Fig 5.6).
The calculated values in the present study are in good agreement with those measured by

69
Akiyama et al. [46] particularly in the temperature range of 200-800°C. The higher amounts at
lower temperatures (below 200°C) may contribute to the calculation method used to estimate the
thermal conductivity. It seems that at lower temperatures this method is accompanied with a
considerable error. One possible reason is the temperature used to calculate the radiative heat
transfer coefficient. Since the surface temperature of DRI pellets was not available, and also the
estimation of surface temperature was not possible unless the conductivity was achieved, the
core temperatures were used to calculate the heat transfer coefficient. This results in the lower
heat transfer coefficient values due to the fact that more than 90 % of heat transfer is resulted by
the radiation. On the other hand, according to the Eq. 5.2 the conductivity increases with
decreasing the heat transfer coefficient. Therefore, overestimated heat conductivity values at the
lower temperatures may be attributed to the initial assumption for the calculation of heat transfer
coefficient. Nevertheless, since the reaction between FeO and C starts at higher temperatures
(~800°C), these values were not involved in the model that will be presented later.
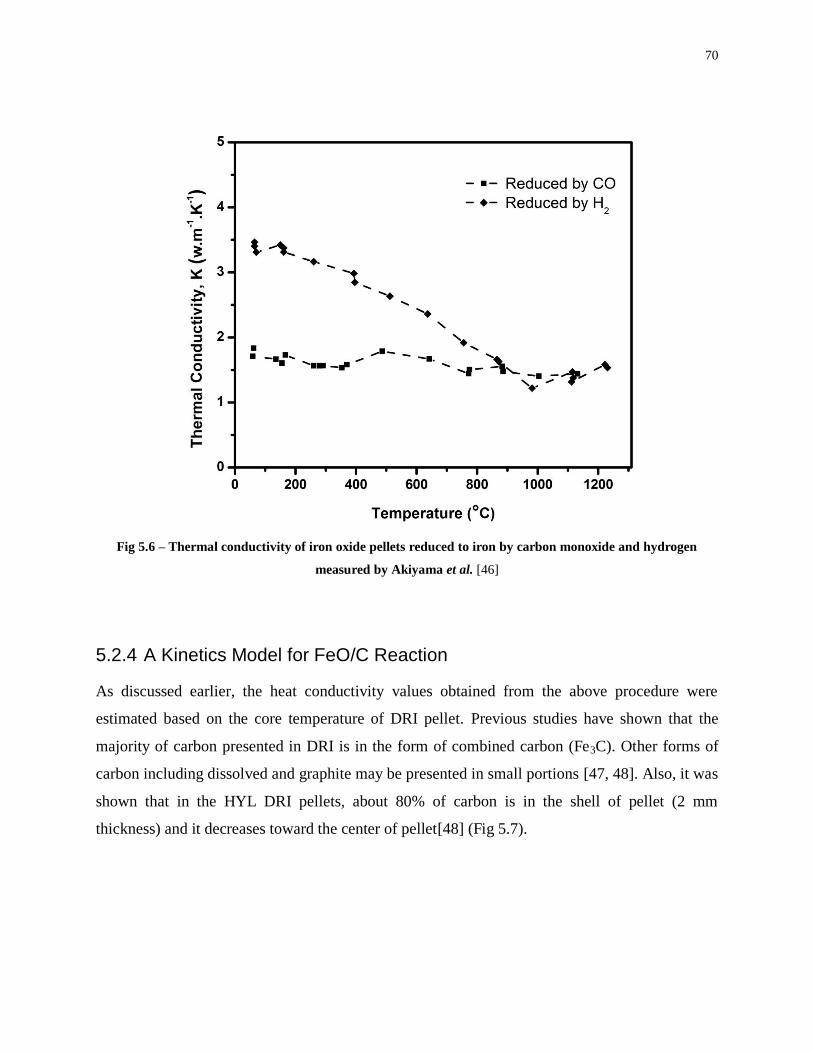
70
Fig 5.6 – Thermal conductivity of iron oxide pellets reduced to iron by carbon monoxide and hydrogen
measured by Akiyama et al. [46]
5.2.4 A Kinetics Model for FeO/C Reaction
As discussed earlier, the heat conductivity values obtained from the above procedure were
estimated based on the core temperature of DRI pellet. Previous studies have shown that the
majority of carbon presented in DRI is in the form of combined carbon (Fe3C). Other forms of
carbon including dissolved and graphite may be presented in small portions [47, 48]. Also, it was
shown that in the HYL DRI pellets, about 80% of carbon is in the shell of pellet (2 mm
thickness) and it decreases toward the center of pellet[48] (Fig 5.7).
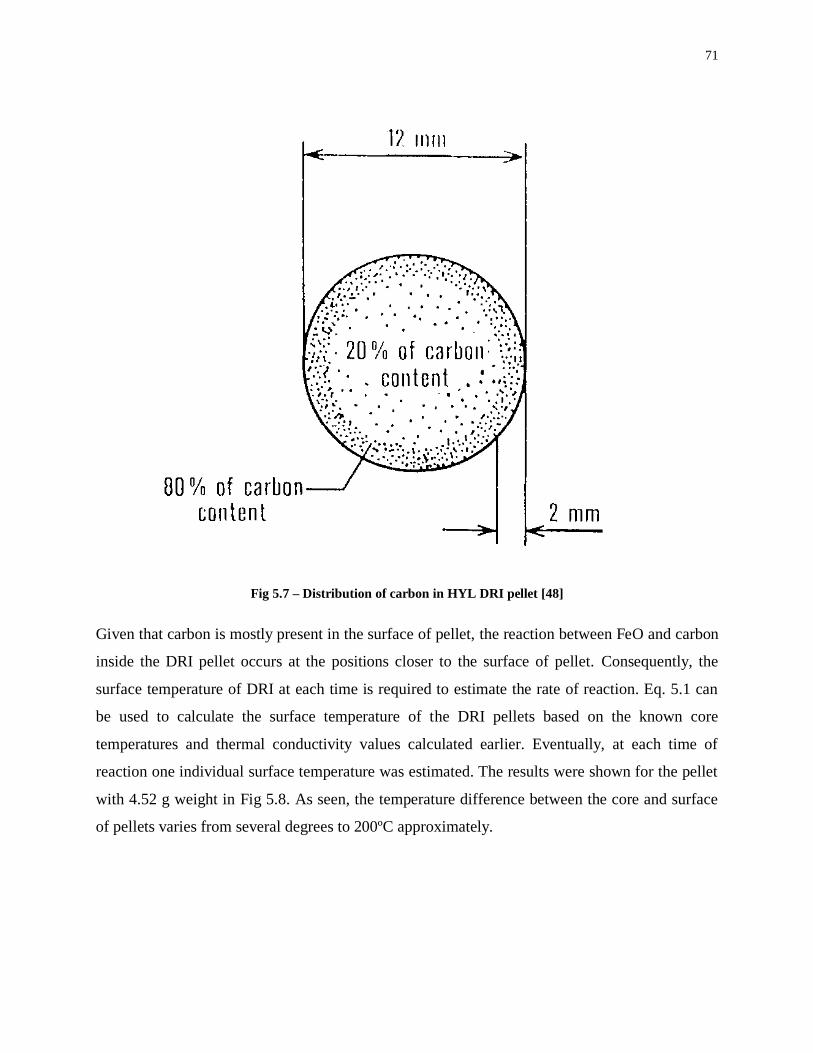
71
Fig 5.7 – Distribution of carbon in HYL DRI pellet [48]
Given that carbon is mostly present in the surface of pellet, the reaction between FeO and carbon
inside the DRI pellet occurs at the positions closer to the surface of pellet. Consequently, the
surface temperature of DRI at each time is required to estimate the rate of reaction. Eq. 5.1 can
be used to calculate the surface temperature of the DRI pellets based on the known core
temperatures and thermal conductivity values calculated earlier. Eventually, at each time of
reaction one individual surface temperature was estimated. The results were shown for the pellet
with 4.52 g weight in Fig 5.8. As seen, the temperature difference between the core and surface
of pellets varies from several degrees to 200ºC approximately.

72
Fig 5.8 – Estimated surface temperature of DRI pellet for the measured core temperatures
If a reaction mechanism (Reaction [3.2]) is assumed to control the rate of reaction between FeO
and C, the heat required to evolve 1 mole of gas is expressed by the H of Reaction [3.2]. Since
the reaction between FeO and C is endothermic the heat flux from the surrounding air is
considered as the source of energy for the above reaction. Therefore the energy balance at the
surface of the pellet can be written as following:
[5.9]
where,
A is the surface,
is the heat transfer coefficient (radiation),

73
is the heat transfer coefficient (natural convection),
is the final temperature of air,
is the temperature of the pellet at the surface,
is the rate of CO gas evolution in mole per second, and
is the enthalpy of the reaction between FeO and carbon per mole of CO gas
evolved.
It must be noted that A is the effective surface of the pellet for the heat flux caused both by
radiation and natural convection. In the experiments, the DRI pellet was held inside an inner tube
with approximately a same diameter as the diameter of the pellet. The hot zone of the furnace
was located in the middle of the furnace, below the DRI position. Considering that the pellet
received more radiation from the hot zone of the furnace, only one side of DRI pellet was
exposed to the this radiation. Therefore, to apply this in the calculations the effective area was
assumed to be equal to half of that for the DRI pellet.
Fig 5.9 presents a comparison between the model obtained from the above procedure and the
experimental data for a DRI pellet with 4.5 g weight. It shows the gas evolutions for the rapid
period of FeO-C reaction. In other words, the time shown in the figure is the time after the
commencement of reaction between FeO and carbon. As seen, there is a good agreement
between predicted gas evolution values by the model and experimental data.

74
Fig 5.9 – Predictive model vs. measured gas evolution data for a 4.5 g pellet as a function of time after the
beginning of reaction
Also, to find out the consistency of the model, it was repeated for another pellet and the results
are shown in Fig 5.10. Again, it indicates a good agreement between the experimental values and
those predicted by the model. Therefore, it can be realized that a heat transfer mechanism likely
control the rate of reaction between carbon and iron oxide inside the DRI pellet. On the other
hand, it was discussed in section 5.1 that the first stage of DRI decarburization is the reaction
between carbon and FeO within the DRI pellet. Although in the current experiments slag was
absent and the interactions with the slag was not considered, it can be concluded that the heat
transfer mechanism could be one of the rate-determining factors in the first stage of DRI/slag
interactions. This will be discussed further in Section 5.3.2 as more evidences were observed in
the effect of carbon on the decarburization rate of DRI.

75
Fig 5.10 - Predictive model vs. measured gas evolution data for a 4.2 g pellet as a function of time after the
beginning of reaction
5.3 Kinetics of DRI-slag Reaction
5.3.1 Rate Calculation
The rate of reaction in each stage is estimated by measuring the slope of the curve in that region.
However, some treatment of the data was required, since the short–period scatter of the data
makes it difficult to isolate each region. The treatment involved taking the derivatives of gas
volume with respect to time. Derivatives can easily be computed by using the finite difference
approximation, given two points in the gas-time curve: (T1, M1) and (T2, M2), the first derivative
is defined as:
76
[5.3]
which was plotted at the point between T1 and T2 or Tmid= (T1+T2)/2.
Fig 5.11 and Fig 5.12 show the derivatives of gas-time curves corresponding respectively to
pellets with one and two–stage behaviors. As seen, the number of peaks in each graph indicates
the type of behavior in the corresponding pellet. Considering the scatter of the data in 1 s time
intervals, a 15 s time interval was used to calculate of the derivatives, for achieving proper
resolution in the graph. Also the Gaussian single-peak fitting for the graphs with the one-stage
behavior and Gaussian multi-peaks fitting for those with the two-stage behavior were employed
to find the duration of each stage, the exact time when second stage takes over, and also to
quantify the maximum rate of reaction in each step.
After finding the first and second stage boundaries, the average slope was computed in mol.s-1
.
However, this value does not express the specific rate of reaction, since the size of pellet and the
interaction surface must be included in the calculations. Therefore, the volume of each pellet was
calculated based on the size and density data of DRI pellets. As a result, for each individual
experiment, the rates of decarburization for the first and second stage (if applicable) were
obtained. It must be noted that the rate of second stage was described in the mole per unit of area
per unit of time (mol.cm2.s
–1) due to the fact that as the reaction proceeds, the pellet melts and
transforms to a droplet, therefore, the interaction site changes from volume of pellet to the
surface of droplet. Li and Barati [6] used the mean value of initial area of pellet and area of
droplet as the reaction surface. The same method was used in this study.

77
Fig 5.11 – Gaussian single-peak fitting for a pellet with one-stage behavior
Fig 5.12 – Gaussian multi-peak fitting for a pellet with two-stage behavior

78
5.3.2 Effect of Carbon
Fig 5.13 shows the rate of reaction between DRI and slag in the first stage as a function of
carbon content for the three slag temperatures examined. As seen, increasing the carbon content
of DRI leads to a slight increase in the rate of reaction. A limited number of studies [7-9] had
observed this behavior even though their findings were rather qualitative. For example,
Mulholland et al. [9] found larger rates of decarburization for Fe-C drops containing higher
carbon in their visual observations.
Fig 5.14 presents the rate of DRI decarburization in the second stage as a function of carbon
content. Similar to the first stage, carbon has an increasing effect on the rate of reaction but the
relationship is stronger in this case. Also, increasing the slag temperature appears to increase the
rate, particularly at higher carbon levels.
Previous researchers [22, 23] have discussed that the first stage of reaction between DRI and slag
is controlled by heat transfer from slag to pellet. It is thus expected that the chemical
composition of DRI including its carbon content does not affect the rate, unless heat transfer is
limited by thermal conduction within the pellet and conductivity of the pellet is significantly
affected by its carbon content. The results presented in Fig 5.13 do not support a reaction rate
that is controlled by heat transfer. This is based on the fact that the role of carbon in heat transfer
could be decreasing thermal conductivity of pellet by forming more iron carbide at the expense
of consuming more iron. Therefore, carbon should in fact decrease the rate, if its role was solely
on the heat transfer rate.

79
Fig 5.13 – Rate of reaction vs. carbon content in the first stage for various slag temperatures
Role of carbon in increasing the reaction rate may be justified by a process that at least in part is
controlled by a chemical reaction. Increasing the carbon content of pellet may result in higher
rates, if FeO–C reaction, alone or in combination with heat transfer, is the rate determining step.
Larger gas evolution rate results in more intense agitation of slag that in turn increases the rate of
heat transfer. Therefore the carbon–FeO reaction indirectly, and through an enhanced heat
transfer self–accelerates itself.
In the second stage, as shown earlier (Fig 5.14), the increasing effect of carbon is more
pronounced than the first stage. Li and Barati [6] found that FeO content of slag strongly affects
the rate of decarburization in the second stage. They proposed that the rate of reaction is
controlled by the rate of FeO mass transport from the bulk of slag to the DRI-slag interface. This
mechanism can also justify the role of carbon here. Since for the pellets with higher carbon the
rate is higher at the end of the first stage, it is reasonable to suppose that mass transfer of FeO is

80
faster under those conditions. Thus, the second reaction takes over under more flux of FeO to the
pellet and proceeds with a higher rate.
Fig 5.14 - Rate of reaction vs. carbon content in the second stage for various slag temperatures
5.3.3 Effect of Slag Temperature
Effect of slag temperature on the DRI reaction kinetics has not been studied in details previously.
However, it is known that increasing temperature will result in faster reactions [9]. In the present
research, the slag temperature varied from 1500ºC to 1600ºC. As seen in Fig 5.13 and Fig 5.14,
in both reaction stages, raising the slag temperature accelerates the rate of reaction. Min and
Fruehan [8] have reported that for a 50 ºC increase in temperature, the rate of reaction is doubled.
Assuming that chemical reaction is the rate limiting step, Murthy et al. [34] showed that the
magnitude of the increase depends on the activation energy of the corresponding reaction.

81
Considering an Arrhenius type of relationship between rate constant and the temperature, the rate
constant can be written as:
Where is a frequency factor, E is the activation energy and R is the universal gas constant.
Therefore, assuming a linear relationship between the rate and FeO content of slag they
postulated that:
where is the rate and is the constant relating %FeO to its concentration CFeO.
The correlation holds when the controlling mechanism is reaction control. Otherwise, predicting
the effect of temperature is rather difficult due to the large number of physicochemical properties
and chemical reaction steps that are affected by temperature.
Form Fig 5.14, it is also apparent that in the second stage, the slag temperature not only increases
the rate of reaction but also, strengthens the dependence of the reaction rate on carbon . As
discussed earlier, it was suggested that the second stage is influenced by the mass transfer of FeO
inside the slag. Also, Min and Fruehan [8] proposed that the reaction is controlled by a mixed
mechanism comprising of CO2 diffusion in the gas halo and FeO transport through the slag and
metal-slag interface. Clearly, increasing the slag temperature gives rise to higher rates through
promoting the rate of mass transfer as a result of a more fluid slag.
5.3.4 Effect of Preheating Temperature
The first-stage rates of DRI pellets preheated to 200, 400, and 600°C are provided in Fig 5.15 as
a function of the pellets’ carbon content. Also, shown in this figure are the rates for pellets
dropped at 70°C. It is evident that regardless of the initial temperature of the pellet, the rate is a
strong function of C wt%. However, the effect of carbon is more pronounced on those pellets
with higher preheating temperature. It is apparent that at low carbon levels, the initial rate was

82
similar, while increasing the carbon content has a stronger effect on the rate for the pellets
preheated to the higher temperature.
Fig 5.15 - Rate of gas evolution vs. wt pct C in the first stage for four preheating temperatures (slag
temperature = 1550ºC)
Previous studies [22, 23] have suggested that the first stage of reaction between DRI and slag is
controlled by heat transfer. Thus, the effect of preheating on promoting the rate may be
explained by the fact that the pellet reaches the reaction temperature more rapidly, due to the
stored thermal energy. On the other hand, when heat transfer is enhanced by the preheating
temperature, it is no longer the only rate-limiting step. Instead, the chemical composition of DRI
including the availability of carbon inside the pellet can be considered as the alternative or
contributing rate-determining factor. The increasing effect of carbon on the rate of reaction by
increasing the preheating temperature is an evidence for this mechanism.
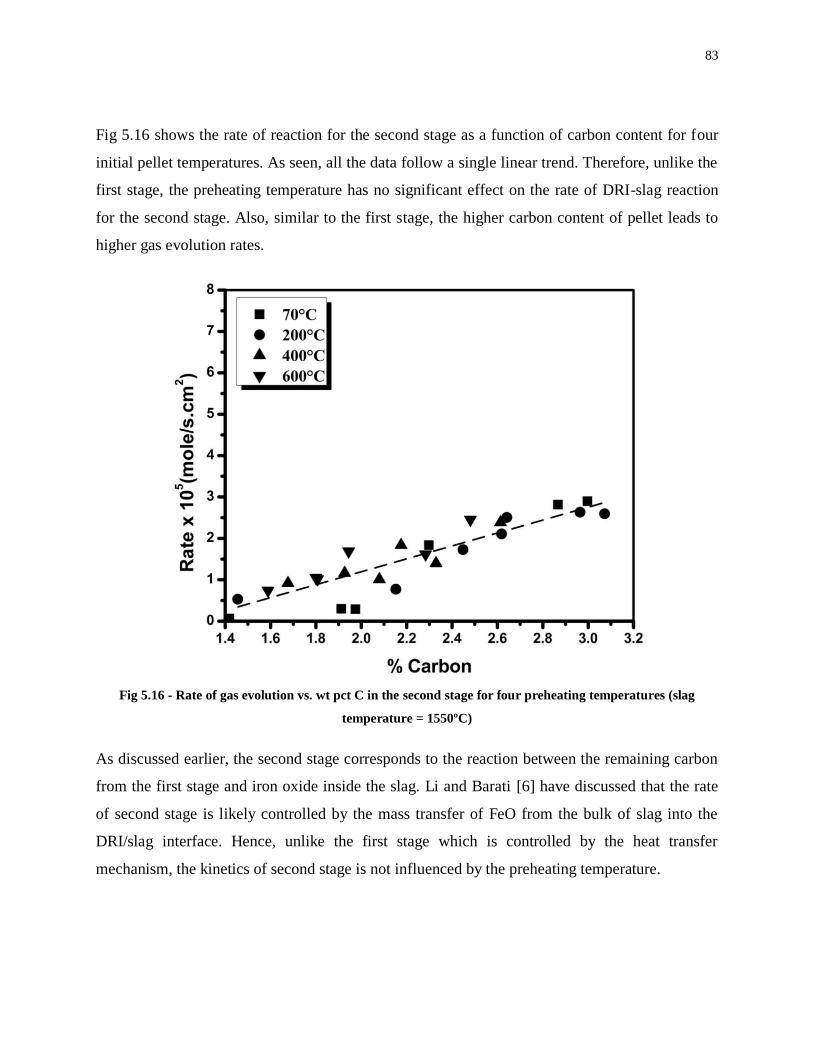
83
Fig 5.16 shows the rate of reaction for the second stage as a function of carbon content for four
initial pellet temperatures. As seen, all the data follow a single linear trend. Therefore, unlike the
first stage, the preheating temperature has no significant effect on the rate of DRI-slag reaction
for the second stage. Also, similar to the first stage, the higher carbon content of pellet leads to
higher gas evolution rates.
Fig 5.16 - Rate of gas evolution vs. wt pct C in the second stage for four preheating temperatures (slag
temperature = 1550ºC)
As discussed earlier, the second stage corresponds to the reaction between the remaining carbon
from the first stage and iron oxide inside the slag. Li and Barati [6] have discussed that the rate
of second stage is likely controlled by the mass transfer of FeO from the bulk of slag into the
DRI/slag interface. Hence, unlike the first stage which is controlled by the heat transfer
mechanism, the kinetics of second stage is not influenced by the preheating temperature.

84
5.3.4.1 Effect of Preheating Temperature on the Reaction Time
Previous studies have shown that the total reaction time strongly depends on the FeO content of
slag. Min and Fruehan [8], found a range of 20 to 200 s for the reaction time while the longer
reaction times corresponded to the experiments with lower FeO content of slag. Also, Li and
Barati [6] found that the reaction time decreases with an increase in the FeO content of slag.
However, under the conditions that the slag composition is kept constant, preheating temperature
may affect the overall reaction time. The average reaction time for the DRI pellets as a function
of preheating temperature (70°C to 600°C) at the slag temperature of 1550°C is presented in Fig
5.17. It is clear that the variations in the reaction times are relatively large (±18s) due to the
different carbon content and size of these pellets.
Fig 5.17 – Reaction time vs. various preheating temperatures

85
However, it is evident that as the preheating temperature increases from 70 ºC to 600 ºC, the
average reaction time is reduced from 62 s to 47 s. This is expected as preheating the DRI pellets
decreases the time needed to initiate the reaction between the carbon and FeO thereby reduces
the overall reaction time. This introduces a potential to increase the productivity of DRI-based
steelmaking by preheating the DRI. This is an additional advantage to the energy savings
associated with charging hot DRI to steelmaking electric furnaces.

86
Chapter 6
Conclusions
An experimental study of DRI reaction with a steelmaking slag (FeO-CaO-MgO-Al2O3-SiO2)
was undertaken. Effects of several variables including carbon content of DRI, slag temperature
and preheating temperature of DRI on the reaction kinetics were studied. The major findings
include:
1. The decarburization of DRI pellets takes place in two stages; reaction between FeO and C
inside the pellet, followed by reaction of the remaining carbon with the FeO inside the slag.
A transitional stage that is sometimes too short to be measured separates these two steps.
2. It was found that a heat transfer mechanism controls the rate of reaction in the first stage or at
least is one of the determining factors due to the good agreement between the heat transfer
model and experimental data obtained in the present work.
3. Depending on the carbon and FeO level of DRI, the duration of each reaction stage varies. In
extreme cases when carbon level is low the second stage is essentially eliminated.
4. Carbon content of DRI has a significant effect on its decarburization rate. Increasing carbon
increases the reaction rate for both stages. However, this effect is more pronounced in the
second stage.
5. Increasing the slag temperature promotes the rate of reaction in both stages. It also increases
the degree of dependence of the second stage rate to the carbon.
6. Preheating of DRI pellets increases the rate of decarburization for the first stage while it has
no significant effect on the second stage. Also, an increase in the preheating temperature
from 70 to 600ºC leads to a reduction of 23% in the overall decarburization time.
87
Future Works
The effect of carbon level, slag temperature and preheating temperature of DRI pellets on the
DRI/slag interactions was investigated in the present study. Although a model was introduced to
simulate the internal reaction between carbon and iron oxide, developing a comprehensive model
involving all stages of DRI/slag reaction requires an extensive understanding of all determining
factors and also performing a large number of calculations.
It is suggested that the results in the present work can be used in developing various models
including heat transfer, mass transfer and chemical reaction. Finally, the validation of model
could be examined by fitting the predicted values to the experimental ones obtained from this
study.
88
References
[1] J. Kopfle and R. Hunter, "Direct reduction's role in the world steel industry," Ironmaking and
Steelmaking, vol. 35, pp. 254-259, May, 2008.
[2] F. Wheeler, S. Broek and G. Traquair, "The Hatch continuous steelmaking process, CRISP,
reaches a major milestone," Steel Times International, vol. 32, pp. 19, Nov.-Dec., 2008.
[3] G. Traquair, F. M. Wheeler and Y. M. Gordon, "Economic and operating benefits of the
hatch CRISP process - a logical innovation in electric steelmaking," in AISTech 2007 - Iron and
Steel Technology Conference, 2007, pp. 529-536.
[4] M. Barati, J. Li, F. Wheeler, G. Yakov, F. Atkinson and S. Broek, "Slag engineering aspects
of the CRISP steelmaking technology," in VIII International Conference on Molten Slags, Fluxes
and Salts, pp. 94, 2009.
[5] M. Barati, "Energy Intensity and Greenhouse Gas Footprint of Metallurgical Processes: a
Continuous Steelmaking Case Study," Energy, in press.
[6] J. Li and M. Barati, "Kinetics and Mechanism of Decarburization and Melting of Direct-
Reduced Iron Pellets in Slag," Metallurgical and Materials Transactions B, vol. 40, pp. 17-24,
Feb., 2009.
[7] T. Gare and G. S. F. Hazeldean, "Basic Oxygen Steelmaking: Decarburization of Binary Fe-
C Droplets and Ternary Fe-C-X Droplets in Ferruginous Slags," Ironmaking and Steelmaking,
vol. 8, pp. 169-181, 1981.
[8] D. J. Min and R. J. Fruehan, "Rate of Reduction of FeO in Slag by Fe--C Drops,"
Metallurgical Transactions B (USA), vol. 23B, pp. 29-37, Feb., 1992.
[9] E. W. Mulholland, G. S. F. Hazeldean and M. W. Davies, "Visualization of Slag-Metal
Reactions by X-RAY Fluoroscopy: Dcarburization in Basic Oxygen Steelmaking," Journal of
the Iron and Steel Institute (London), vol. 211, pp. 632-639, 1973.
89
[10] Canadian Steel Producers Association. Available: www.cftpa.ca.
[11] R. J. Fruehan, "Future steelmaking technologies and the role of basic research," Metall Mat
Trans A Phys Metall Mat Sci, vol. 28 A, pp. 1963-1973, 1997.
[12] World steel association. Available: http://www.worldsteel.org.
[13] T. Rosenqvist, Principles of Extractive Metallurgy. New York: McGraw-Hill, 1983.
[14] Blast Furnace - Theory and Practice.: Editor: Julius H. Strassburger. Co-Editors: Dwight
C. Brown, Terence E. Dancy [and] Robert L. Stephenson. New York|bGordon and Breach
Science Publishers|c[1969]: Gordon and Breach Science Publishers|c[1969], 1969.
[15] B. Anameric and S. Komar Kawatra, "Properties and features of direct reduced iron," Miner
Process Extr Metal Rev, vol. 28, pp. 59-116, Jan.-Mar., 2007.
[16] E. T. Turkdogan, Fundamentals of Steelmaking. London: Institute of Materials, 1996.
[17] M. Jellinghaus, Electric Steelmaking. Düsseldorf: Stahleisen, 1989.
[18] Jeremy A. T. Jones. Electric arc furnace steelmaking. 2008.
[19] Emile Blondelot, EAF Technology : State of the Art & Future Trends. Brussels, Belgium:
International Iron and Steel Institute, 2000.
[20] Y. Gordon and F. Wheeler, U.S. Patent No. 6,875,251, 2005.
[21] D. Anghelina, G. Brooks and G. A. Irons, "High Temperature Behaviour of Directly
Reduced Iron Fines," Can. Metall. Q., vol. 46, pp. 373-378, Oct., 2007.
[22] D. A. Goldstein, R. J. Fruehan and B. Ozturk, "The behavior of DRI in slag-metal systems
and its effect on the nitrogen content of steel," Iron and Steelmaker (USA), vol. 26, pp. 49-61,
Feb., 1999.

90
[23] K. Sadrnezhad and J. F. Elliott, "The Melting Rate of DRI (Direct Reduced Iron) Pellets in
SteelMaking Slags," Iron Steel Int, vol. 53, pp. 337-339, Dec., 1980.
[24] E. Chen and K. Coley, "Kinetics study of droplet swelling in BOF steelmaking," in VIII
International Conference on Molten Slags, Fluxes and Salts, pp. 803-813, 2009.
[25] C. L. Molloseau and R. J. Fruehan, "The reaction behavior of Fe-C-S droplets in CaO-SiO
sub 2 -MgO-FeO slags," Metallurgical and Materials Transactions B (USA), vol. 33B, pp. 335-
344B, 2002.
[26] W. Pan, M. Sano, M. Hirasawa and K. Mori, "Kinetics of carbon oxidation reaction between
molten iron of high carbon concentration and iron oxide containing slag," ISIJ Int, vol. 31, pp.
358-365, 1991.
[27] D. Bandyopadhyay, N. Chakraborti and A. Ghosh, "Study on the kinetics of iron oxide
reduction by solid carbon," Steel Res, vol. 64, pp. 340-345, 1993.
[28] F. Ji, M. Barati, K. Coley and G. A. Irons, "Kinetics of coal injection into iron oxide
containing slags," Can. Metall. Q., vol. 44, pp. 85-94, 2005.
[29] D. J. Min, J. W. Han and W. S. Chung, "Study of the reduction rate of FeO in slag by solid
carbon," Metall Mat Trans B Process Metall Mat Process Sci, vol. 30, pp. 215-221, 1999.
[30] B. Sarma, A. W. Cramb and R. J. Fruehan, "Reduction of FeO in smelting slags by solid
carbon: experimental results," Metall Mat Trans B Process Metall Mat Process Sci, vol. 27, pp.
717-730, 1996.
[31] H. Gaye and P. V. Riboud, "Oxidation kinetics of iron alloy drops in oxidizing slags,"
Metallurgical Transactions B (Process Metallurgy), vol. 8B, pp. 409-15, 1977.
[32] K. Upadhya, I. D. Sommerville and P. Grieveson, "Kinetics of Reduction of Iron Oxide In
Slag by Carbon in Iron: Part 2 Effect of Carbon Content of Iron and Silica Content of Slag,"
Ironmaking and Steelmaking, vol. 7, pp. 33-36, 1980.
91
[33] I. Moon and S. Jung, "Reduction of solid iron oxide by carbon," Steel Research
International, vol. 79, pp. 667-670, 2008.
[34] G. G. K. Murthy, Y. Sawada and J. F. Elliott, "Reduction of FeO dissolved in CaO-SiO2-
Al2O3 slags by Fe - C droplets," Ironmaking and Steelmaking, vol. 20, pp. 179-190, 1993.
[35] G. G. Krishna Murthy and J. F. Elliott, "Kinetics of iron oxide reactions in bath smelting
process," Ironmaking and Steelmaking, vol. 22, pp. 405-415, 1995.
[36] Il-Joon Moon and Sung-Mo Jung, "Reduction of solid iron oxide by carbon," Steel Res, vol.
79, pp. 667-70, 2008.
[37] N. S. Srinivasan and A. K. Lahiri, "On the Mechanism of Iron Oxide Reduction by Carbon,"
Metallurgical Transactions B (Process Metallurgy), vol. 6 B, pp. 269-274, 1975.
[38] J. H. Lienhard, A Heat Transfer Textbook. Englewood Cliffs, N.J.: Prentice-Hall, 1981.
[39] A. Bejan and A. D. Kraus, Heat Transfer Handbook. [S.l.]|bWiley Interscience - John Wiley
& Sons: Wiley Interscience - John Wiley & Sons, 2003.
[40] D. Basmadjian, Mass Transfer : Principles and Applications. Boca Raton: CRC Press, 2004.
[41] A. Paul, "Kinetic model for reduction of iron oxide in molten slags by iron-carbon melt,"
Steel Res, vol. 65, pp. 414, 1994.
[42] H. W. Gudenau, H. A. Freidrichs and P. K. Rademacher, "The determination of the thermal
conductivity of sponge iron," Archiv Fur Das Eisenhuettenwesen, vol. 52, pp. 261-4, 07, 1981.
[43] J. C. Y. Koh and A. Fortini, "Prediction of Thermal Conductivity and Electrical Resistivity
of Porous Metallic Materials," Int. J. Heat Mass Transfer, vol. 16, pp. 2013-2022, 1973.
[44] F. P. Incropera, Fundamentals of Heat and Mass Transfer. New York: Wiley, 2001.
[45] " ASHRAE handbook : heating, ventilating, and air-conditioning applications," 2003.

92
[46] T. Akiyama, "Measurement and modeling of thermal conductivity for dense iron oxide and
porous iron ore agglomerates in stepwise reduction," ISIJ Int, vol. 32, pp. 829-837, 1992.
[47] L. Giguere, "Carbon in DRI friend or foe?" Direct from Midrex, pp. 4-5, 2000.
[48] A. Bandopadhyay, A. Ganguly, K. N. Gupta and H. S. Ray, "Investigations on the
anomalous oxidation behaviour of high-carbon gas-based direct reduced iron (DRI),"
Thermochimica Acta, vol. 276, pp. 199-207, 4/25, 1996.

93
Appendices
Appendix 1 - Specific Heat Relations For DRI
Using the thermodynamic package (FactSageTM
), the following relationships were employed to
calculate the specific heat of DRI pellets.